
Improving Best Management Practice Decisions in Mixed Land Use and/or Municipal Watersheds: Should Approaches Be Standardized?


1
Division of Forestry and Natural Resources, Davis College of Agriculture, Natural Resources and Design, West Virginia University, Agricultural Sciences Building, Morgantown, WV 26506, USA
2
Division of Plant and Soil Sciences, Davis College of Agriculture, Natural Resources and Design, West Virginia University, Agricultural Sciences Building, Morgantown, WV 26506, USA
Land 2021, 10(12), 1402; https://0-doi-org.brum.beds.ac.uk/10.3390/land10121402
Submission received: 17 November 2021
/
Revised: 11 December 2021
/
Accepted: 15 December 2021
/
Published: 18 December 2021
(This article belongs to the Special Issue Land Use Change from Non-urban to Urban Areas: Problems, Challenges and Opportunities)
Abstract
:Best management practices (BMP) are defined in the United States Clean Water Act (CWA) as practices or measures that have been demonstrated to be successful in protecting a given water resource from nonpoint source pollution. Unfortunately, the greatest majority of BMPs remain unvalidated in terms of demonstrations of success. Further, there is not a broadly accepted or standardized process of BMP implementation and monitoring methods. Conceivably, if standardized BMP validations were a possibility, practices would be much more transferrable, comparable, and prescriptive. The purpose of this brief communication is to present a generalized yet integrated and customizable BMP decision-making process to encourage decision makers to more deliberately work towards the establishment of standardized approaches to BMP monitoring and validation in mixed-use and/or municipal watersheds. Decision-making processes and challenges to BMP implementation and monitoring are presented that should be considered to advance the practice(s) of BMP implementation. Acceptance of standard approaches may result in more organized and transferrable BMP implementation policies and increased confidence in the responsible use of taxpayer dollars through broad acceptance of methods that yield predictable and replicable results.
1. Introduction
Pollution from diffuse sources is most often driven by meteorological events (i.e., precipitation) and alterations to stormwater runoff processes [1,2]. The latter, termed hydrologic modification can increase or decrease diffuse pollution loads, the extents of which are poorly understood and difficult to mitigate based on research from other locations. The challenge of transferability necessitates the need to monitor and subsequently quantify stormwater runoff processes, pollutant transporting mechanism(s), and the various pathways contaminants may travel from source areas to receiving water bodies in most if not all contemporary municipal and/or mixed land use watersheds. This is important because with limited information for local watersheds, stormwater managers struggle to predict the effect of local ordinances on local receiving water bodies water quality. Given the challenges of predicting climate and landscape interactions, it is not surprising that meeting water quality goals such as Total Maximum Daily loads (TMDLs) is a challenge, particularly in rapidly urbanizing watersheds. Certainly, estimating a TMDL for water quality is laudable goal. However, translating pollutant loading to specific land uses, and subsequent development-related mitigation strategies, is a difficult task without understanding water and pollutant transport at multiple locations in a watershed [3,4,5].
There is thus an ongoing need for cost-sensitive and effective methods of monitoring best management practices (BMPs) in contemporary watersheds that are transferrable and adaptable to local watershed needs. This includes the need for standardized methods to make BMP decisions in the most effective locations using accepted methods of monitoring that thereby meaningfully advance BMP decision making, efficacy and cost reductions. For example, the experimental watershed study design (EWSD) provides an overarching and customizable monitoring structure that has been shown to successfully quantitatively characterize the effects of land use practices on receiving waters in mixed land use settings for well over a century [6,7,8,9,10]. Nested EWSDs divide a larger watershed into a series of sub-catchments to investigate the influence of land use practices on environmental variables of interest [4,8,11]. This monitoring design is important because sub-catchment delineation isolates varying land use practices, BMPs, and hydrologic characteristics [4]. The monitoring design enables the identification of the cumulative effects of land use practices on response variables of interest. It does this through the quantification of the influencing processes observed at the sub-catchment scale thereby improving BMP decision-making efficacy based on validation. The purpose of this communication is to present a process, and by implication the need, for more deliberate integration of BMP decision implementation and validation processes and to encourage consideration of a standardized approach that may significantly advance validation and transferability of BMPs in complex mixed-use municipal watersheds. The reader is referred to the many supporting citations (and citations therein) for further understanding of the state of the science.
2. The BMP Decision-Making Process and the Critical Source Area
BMPs are generally categorized based on the intended pollutant or pollutants a given practice will mitigate. For example, stormwater management BMPs are control measures that are intended to mitigate changes to both the quantity and quality of urban runoff caused by land use impacts [11]. Stormwater BMPs are typically designed to reduce stormwater volume, peak flows, and/or nonpoint source pollution through independent or combined evapotranspiration, infiltration, detention, and filtration or biological and chemical processes [12]. BMPs can improve receiving-water quality by extending the duration of outflows in comparison to inflow duration (known as hydrograph extension), which dilutes the stormwater discharged into a larger volume of upstream flow [13]. To at least in part address this challenge, the United States Environmental Protection Agency (USEPA) recommends that effective application of agricultural, urban, and other nonpoint source (NPS) BMPs should include the identification of critical source areas (CSAs), or areas that are particularly susceptible to flow and pollutant sink and source processes, and that are therefore important to the BMP implementation planning processes and short and long-term BMP efficacy [14]. BMP implementation in tandem with other practices in CSAs is important to achieve the goals often delineated in Watershed Management Plans (WMPs) or Total Maximum Daily Loads (TMDLs). The outcomes of these are intended to result in achieving water quality and quantity goals and objectives, including (but not limited to) the restoration and protection of the designated beneficial uses of source waters [14]. The USEPA approach to identifying CSAs is a results-based methodology designed for selecting both appropriate BMPs and BMP systems and identifying the necessary management strategies to support or promote BMP implementation in critical locations. The methodology includes (in brief) (a) determining restoration/protection priorities, (b) identifying the connections between potential source and transport pathways, (c) estimating the relative contribution from source and transport pathways, (d) describing the expectation of CSAs and BMP performance including implementation opportunities, (e) focusing CSAs and associated BMPs and BMP systems where they will be most effective, and (f) monitoring progress and adjusting as needed through an adaptive management approach [14]. The USEPA further recommends a multi-disciplinary ecosystem approach for identifying CSAs and selecting BMPs, BMP systems, or other management measures to take advantage of the knowledge, data, and expertise of all stakeholders [14]. The importance of stakeholder engagement (and stakeholder engagement theory) is particularly relevant given that fairness and reciprocity of decision making should be among the primary objectives to encourage greater value in outcomes [15,16]. It is therefore important to encourage a process that includes many different actors including (but not limited to) government authorities, local communities, environmentalists, consumer defense organizations, competitors, special interest groups, and the media [17].
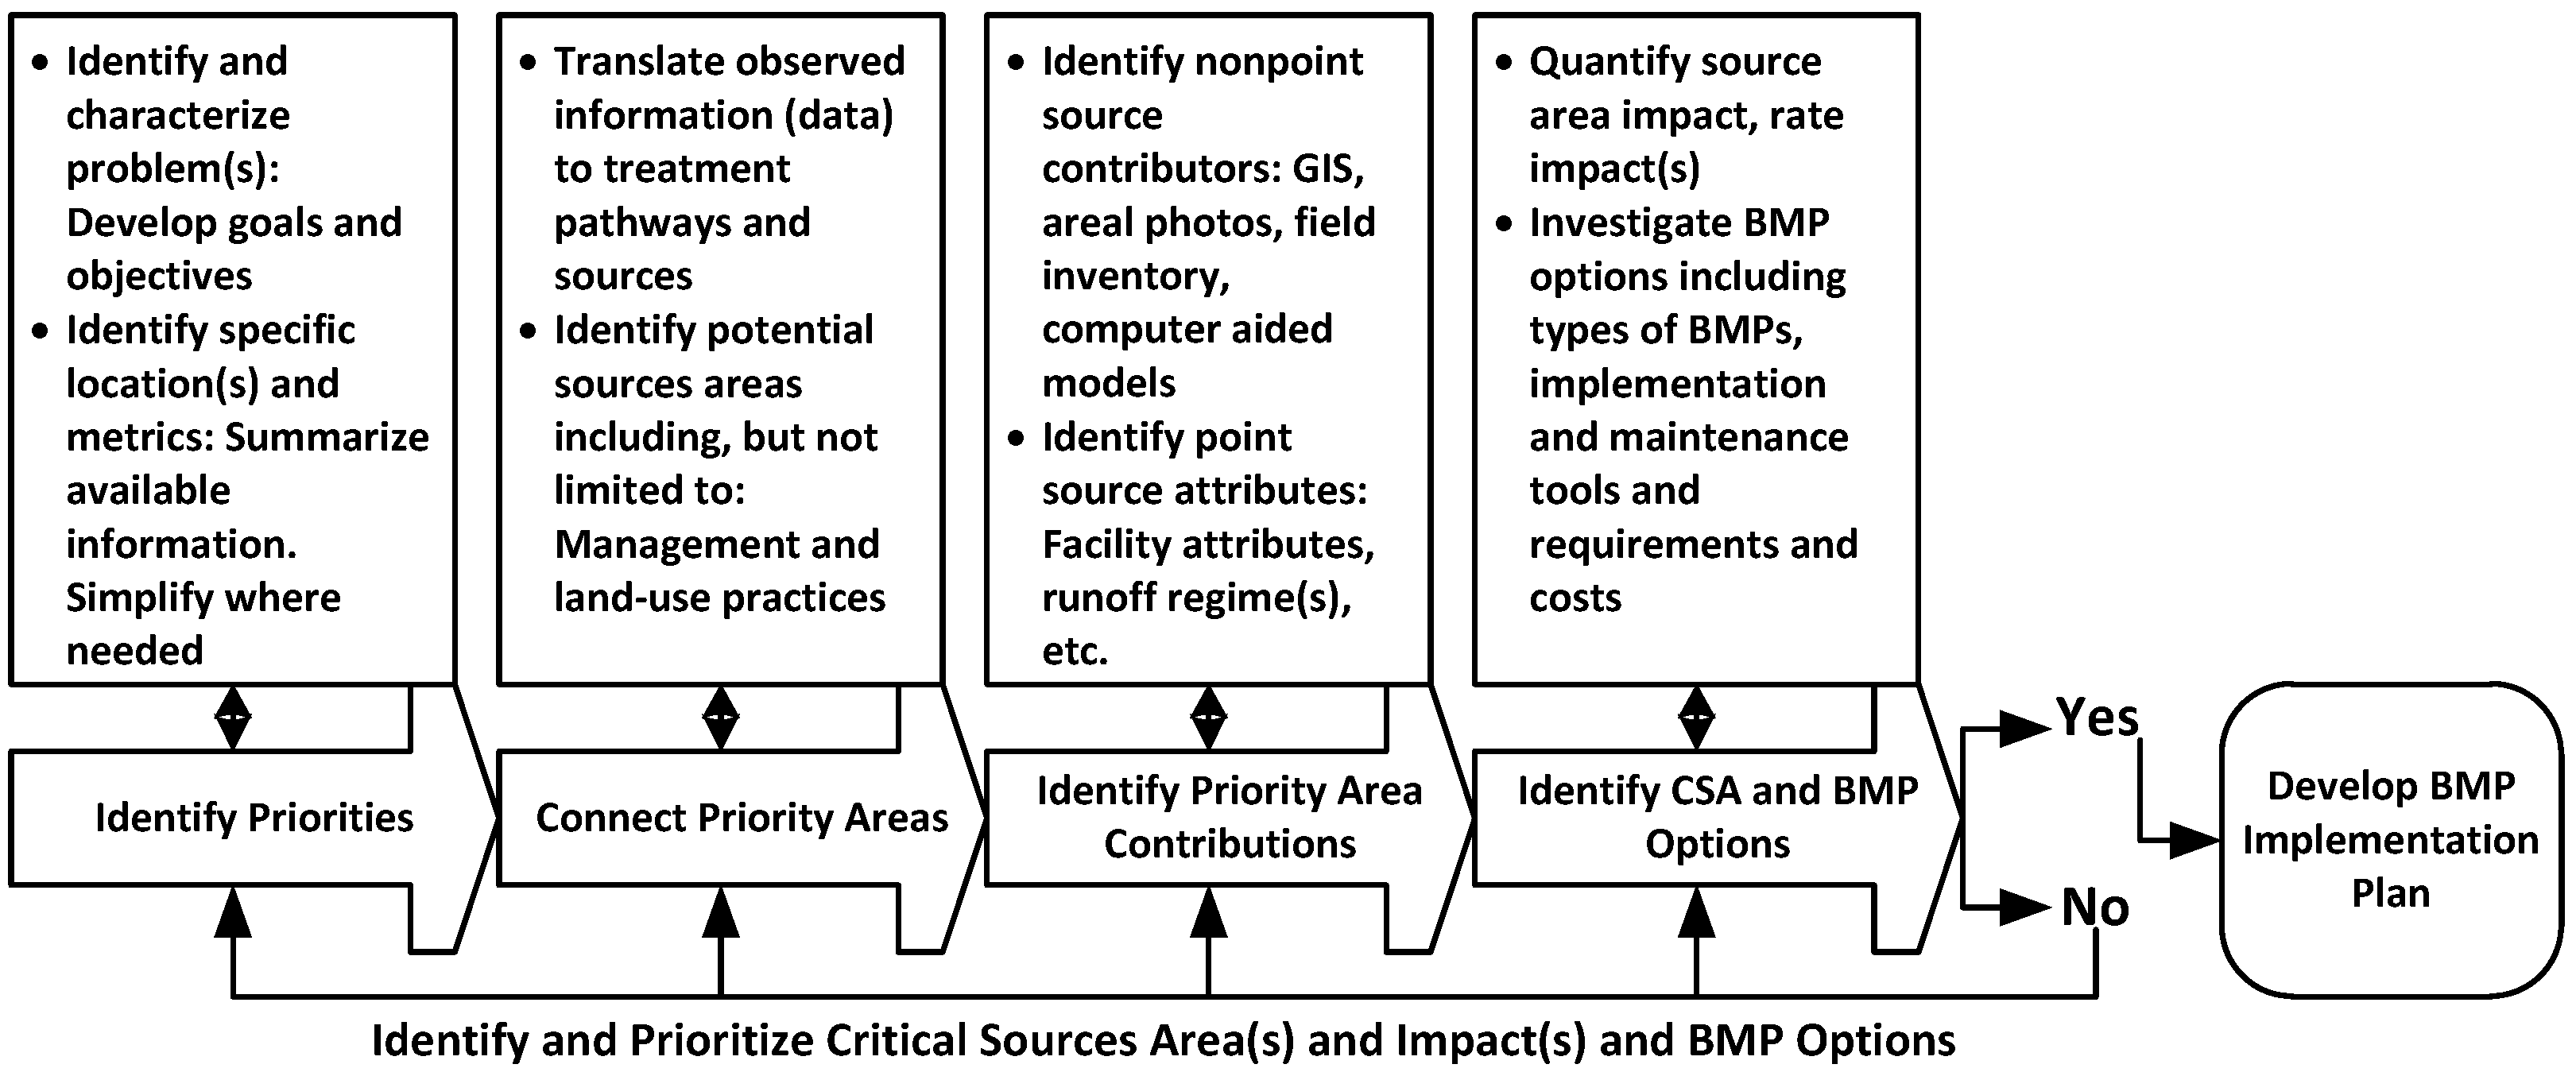
The process of ecosystem restoration planning and implementation can be aided by the use of conceptual frameworks, which typically include a conceptual diagram illustrating relationships between key drivers, stressors, ecological impacts, and management responses [18,19]. In addition to visualizing relationships between known or suspected stressors and ecological impacts, such diagrams can help ensure appropriate management actions are being taken to address key problems, reduce impacts, and subsequently lead to restoration. An important component regarding the identification of CSAs is determining priorities that will address recognized problems/concerns relative to water quality management plan goals and objectives (Figure 1). Information used to target priority areas of the greatest concern includes water quality data, flow data, biological assessments, and habitat evaluations [14]. Following priority determination, the methodology helps identify connections linking problems to potential sources. This approach facilitates delineation of potential source areas through the utilization of mapping tools designed to aid in the assessment of key factors such as land use information, management measures and practices (e.g., livestock rearing or urbanization).
The goal of the process presented in Figure 1 is to reduce the number of potential source areas to those locations where BMP implementation will be most effective in achieving water quality goals. Ideally, this would be a standardized practice for all BMP implementation decision processes. The estimates used in this step can vary from narrative descriptors (e.g., high, medium, low) resulting from aerial photo analysis or field inventories to quantitative values developed from desktop screening tools or models. Following estimation of relative contributions, CSAs and BMP opportunities are targeted with the goal of ensuring that implementation resources are utilized on suitable management practices and are directed to areas that contribute disproportionally to problems and concerns [14]. Source areas are rated based on detailed survey data analysis. The process may be iterative given that choices and decisions are not always apparent, often requiring additional data collection, compiling or reexamining information used in preceding steps [14]. Finally, monitoring implemented BMPs for efficacy will produce the information required to make improvements to an adaptive management framework.
3. BMP Monitoring
Many observational studies and modeled scenarios have been utilized to evaluate BMP efficacy, particularly BMPs aimed at improving water quality [1,20,21,22,23,24,25]. For example, studies assessing the impacts of agricultural BMPs on physiochemical conditions in streams have produced a wide range of values for reductions in nutrients and sediments [24,26,27,28,29]. Other study parameters have included physical habitat, geomorphic characteristics, chemical metrics, temperature, and other variables [30]. Habitat (e.g., substrate, bank, and riparian condition) and stream geomorphology (e.g., channel shape and width) have also been shown to be intermediate-term response indicators of incremental change during the time lag between improvement in chemistry and improvement in biological health [31,32,33]. It must be acknowledged that the improvement of aquatic ecosystems following BMP implementation is subject to the response of other functional processes as well, including (but not limited to) hydrology, hydraulic processes, geomorphology, and physiochemistry [34,35].
Biological community assessments can be used to monitor the long-term and large-scale outcomes of BMPs [30]. Many organisms are typically present in streams over longer periods of time relative to physiochemical components and can therefore be used to determine the stability of the ecosystem response to BMPs [36,37]. Additionally, the simultaneous assessment of integrated biological communities (e.g., algae, fish, and macroinvertebrates) can provide a more complete assessment of stressors and impacts on several temporal and spatial scales [38,39]. For example, diatoms (Bacillariophyta) can be exceptional indicators of BMP effectiveness as they are sensitive to specific levels of nutrient concentrations, conductivity, and pH [30]. Diatoms also exhibit rapid response times to BMPs, making them well-suited to indicate short-term changes, at a scale of weeks or months [40,41,42]. Macroinvertebrates are less susceptible to nutrient enrichment than diatoms [43]; however, they can be utilized to study watershed-scale eutrophication, the impacts of land use change, and monitor local-scale habitat health, temperature, streamflow, and oxygen levels over the medium- to long-term (5–20+ years) [30]. Consequently, monitoring macroinvertebrates over numerous years, accounting for interannual variation, can be useful for determining the stability of the ecosystem response to BMP implementation [44,45].
Model development using data gathered from observational studies of water chemistry or biotic communities and the professional consensus of experts facilitate the ability to predict the potential or expected effects of BMPs [30]. Indeed, models are often used for the development of decision-making tools to help managers and landowners implement BMPs that have the greatest possible benefit to water quality [46,47,48,49]. These tools commonly include assumptions regarding BMP efficacy in reducing constituent concentrations (e.g., sediment and nutrients) [30]. For example, efficiency estimates, ranges of percentages in nutrient and sediment reduction expected from different BMPs, are commonly developed for model inputs from a range of observational water quality studies and best professional judgement [25,31,50]. Efficiency estimates have been implemented in conservation practices utilized in numerous models implemented in the US Mid-Atlantic region including the Chesapeake Bay Model [24,51,52,53], MapSheds and PRedICT [30]. For example, in the Chesapeake Bay Watershed it is anticipated that total phosphorus (TP) reductions would be roughly equivalent to 75% of total suspended sediment (TSS) reductions, given the assumption that 75% of TP is bound to sediment and not dissolved [24,54].
4. Measuring Effects of BMPs
A review of 94 investigations indicated that only 60% of management practices showed clear evidence of reductions in nutrient concentrations [55]. The authors noted a lack of consistency regarding the study designs, BMP type, or treatment area. Modeling-based studies more consistently predicted water quality improvement following BMP implementation. However, that was presumably due to controlled model routines [55]. The inherent subjectivity of modeling can therefore create problems regarding data comparison, given observational and modeled results are often not interchangeable [30]. The lack of consistent sampling and indicators used in different BMPs also complicates the comparison of results and the ability to draw conclusions [30].
Implemented BMPs have also resulted in inconsistent validation results, with both study design and spatial and temporal scale of monitoring influencing inconclusive outcomes and resultant lack of transferability [30], a problem that could be addressed with standardized monitoring protocols [4]. Generally, positive water quality outcomes were reported for larger scales in watersheds comprising an aggregation of combinations of various BMPs [26,56,57,58,59,60,61]. Evidence of the success of BMPs includes reduced eutrophication and algal growth, and hypoxic or anoxic conditions decreasing in area and duration in large receiving waters [30,61,62]. The success of BMPs may also be localized; for example, the effects of BMPs for livestock grazing and activities within streams on small scales can be difficult to detect farther downstream [62,63]. For example, Thomas (2002) showed improved Index of Biological Integrity (IBI) scores at the site of BMP implementation, although not downstream, in a 140 ha watershed in the Altamaha River basin. Conversely, BMP impacts may only be detectable on larger scales. For example, Line et al. (2000) did not observe total suspended solid (TSS) reductions at the site level but observed a cumulative reduction at the watershed scale in North Carolina. Notably, the results of BMPs are also impacted by the period over which they are studied. Studies that take place over long periods (5–20 years), including both small and large spatial extents, are typically more representative of the effects of BMPs [20,64].
Several factors can contribute to the lack of consistency in the measurable effects of BMPs. For example, detecting changes in streams can be complicated by the intended scale of impact, the lag time for ecosystem response, weather events, and local conditions [30]. A review of farm BMPs in 2019 showed that BMP implementation is often opportunistic, involving widely dispersed implementations throughout large geographic regions focusing on reaching desired effects at the local scale [30]. However, other recent studies demonstrated that merely increasing the number of implementation sites for BMPs may not optimize investment towards improved water quality at local or watershed scales; rather, targeting specific geographic locations and preferentially investing in specific BMPs is expected to result in greater overall impact [15,48,65,66,67,68]. This is of particular relevance given that planning BMPs should occur at a watershed level to ensure upstream impacts that place stress on lower reaches can be fully accounted for and addressed [14,47].
5. Monitoring Mixed-Use and Municipal Watersheds: A Standardized Approach
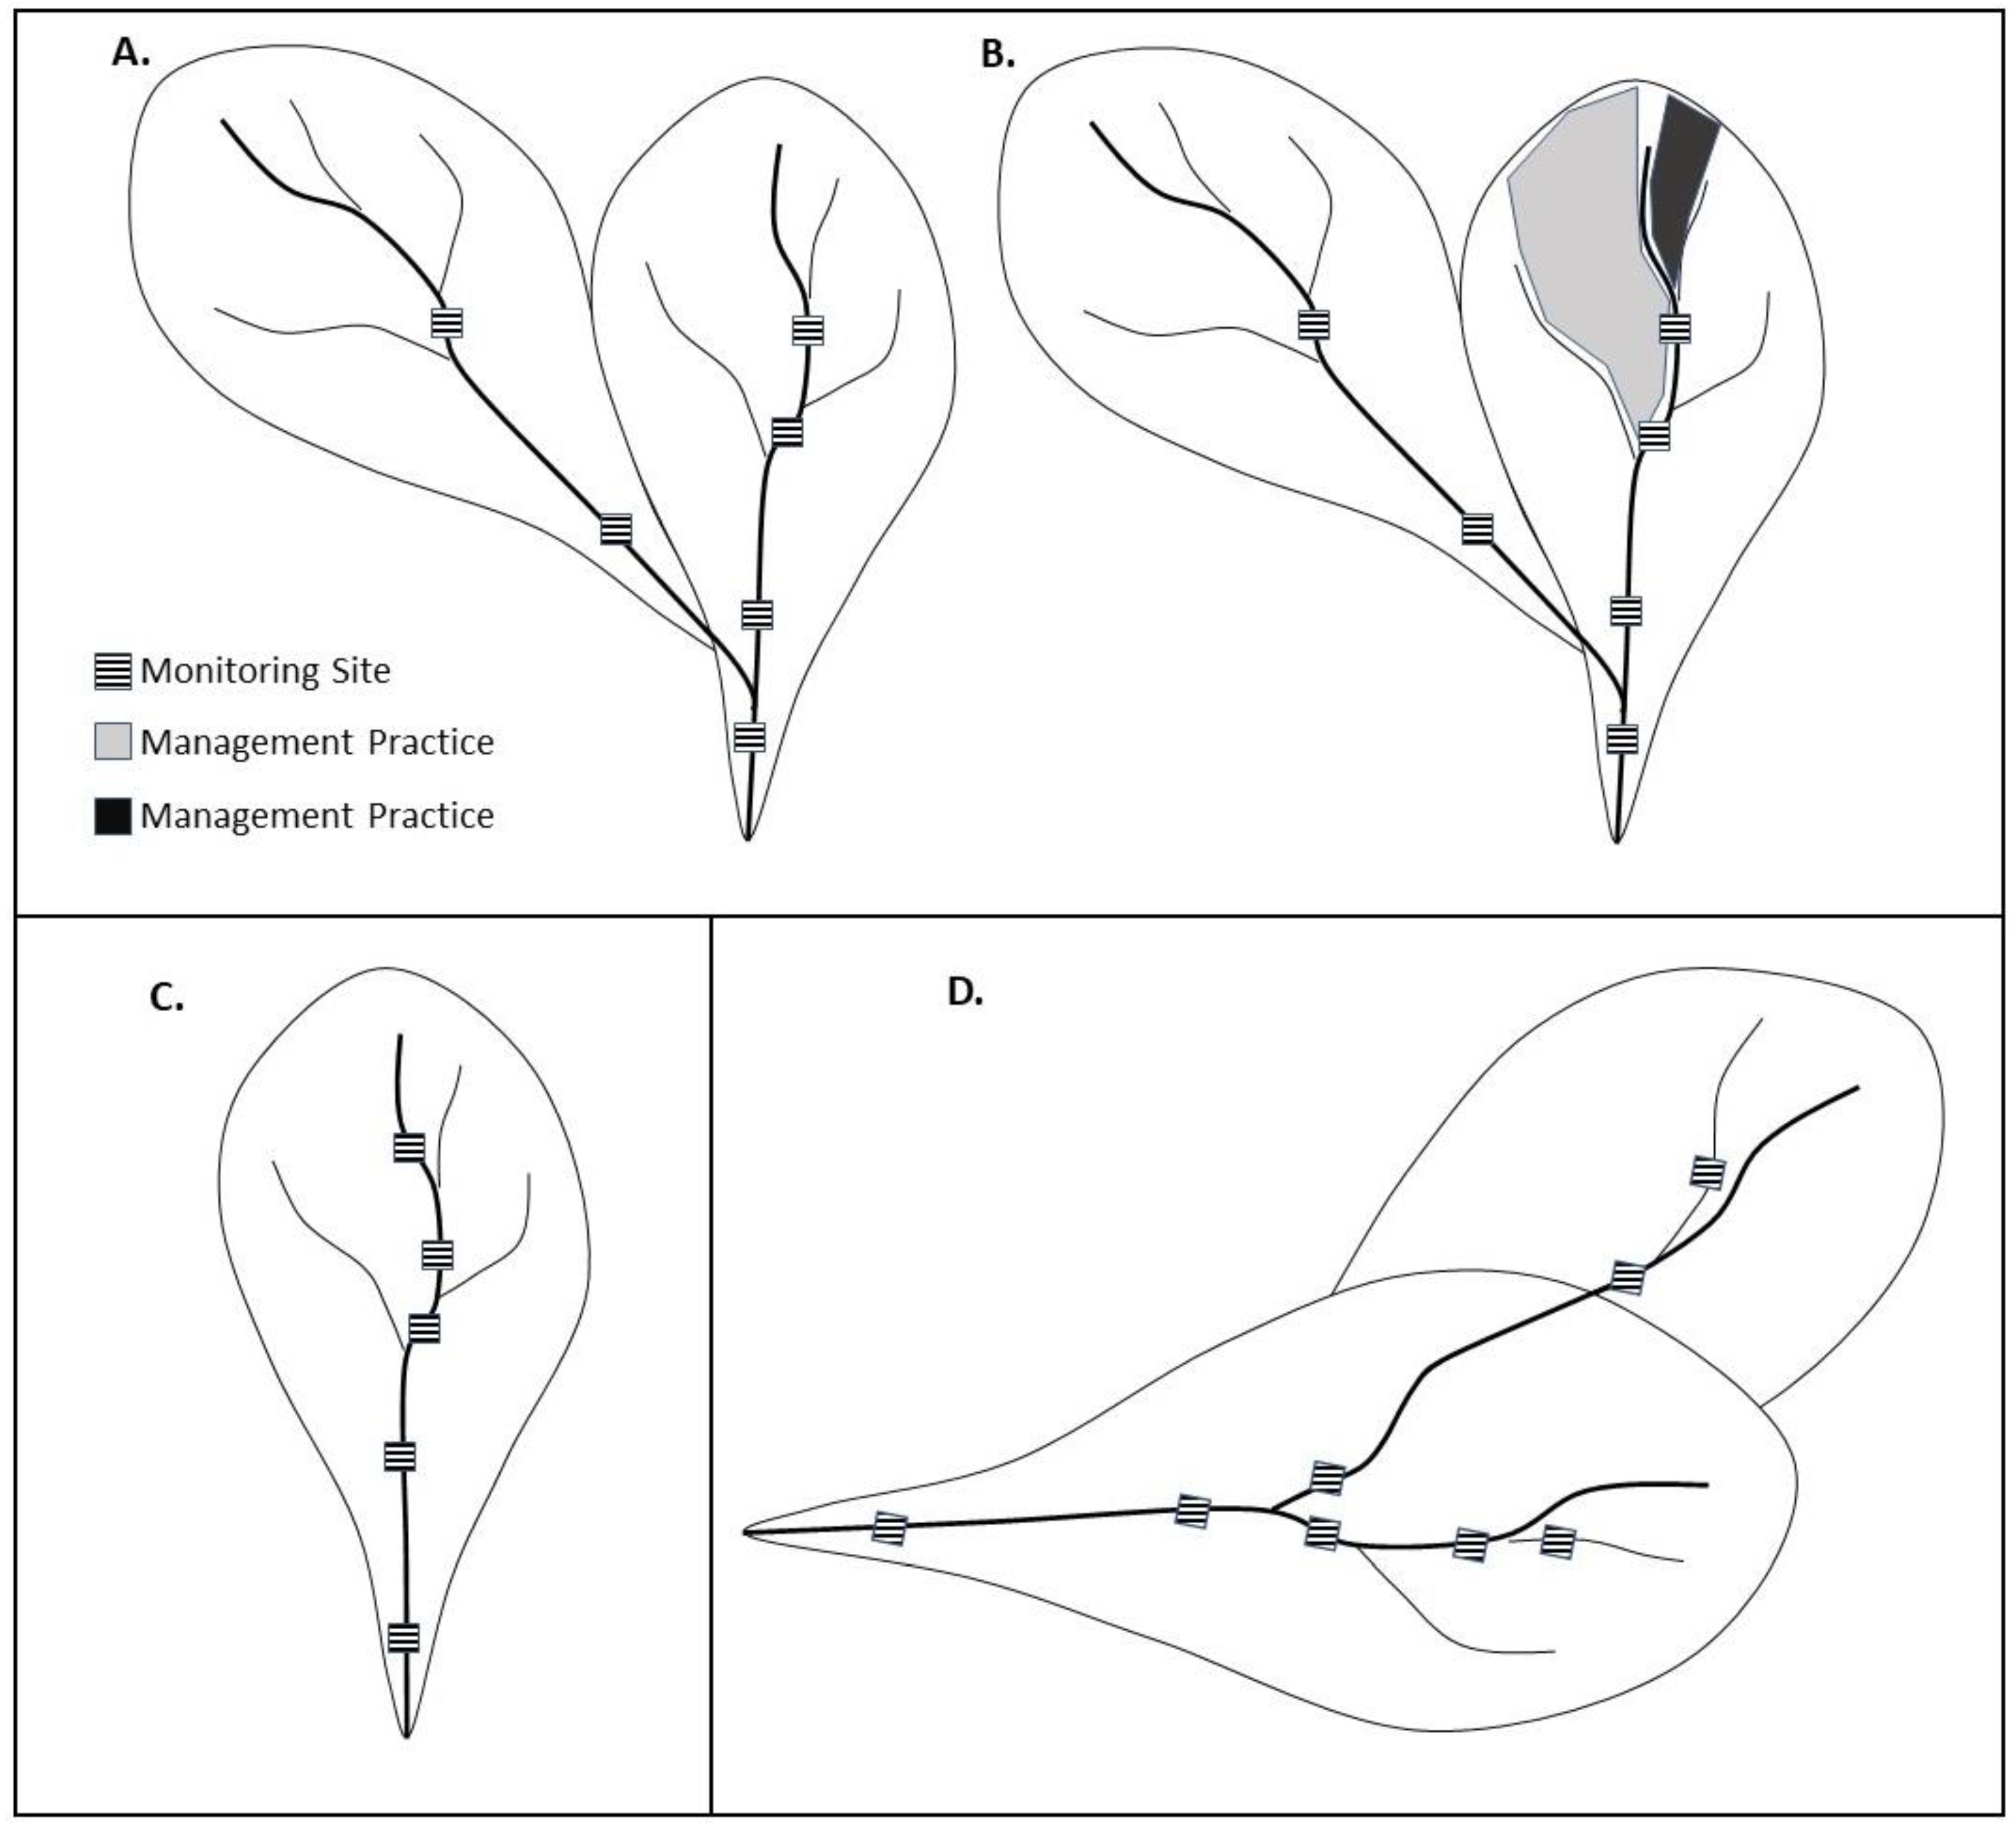
The above challenges can be contended with using targeted monitoring programs at the reach to the watershed scale [30]. The experimental watershed study design (EWSD) can serve this purpose [4]. The EWSD includes multiple sites monitoring the same indices at the same time. This in-situ monitoring approach has the potential to enhance understanding of when BMPs are having their intended effect, and alternatively when they are not achieving a significant or measurable reduction in inputs at stream reach or watershed scales [45,69,70]. A review in 2019 of 277 studies showed that baseline (prior to implementation) data should be collected (when possible) to understand pretreatment conditions and better predict BMP success [30]. The long-term multi-spatial resolution sampling characteristic of the EWSD study design is ideal to monitor water quality metrics both prior to and following the implementation of BMPs and can greatly increase the confidence landowners and water quality managers have in the efficacy of implemented BMPs. Figure 2 shows examples of typical EWSDs including paired and nested (Figure 2A,B), modelled after [71], the nested-scale design, modelled after [4], and the nested-scale and paired design, modelled after [72]. These designs are useful for municipal and/or mixed land use watersheds because they can be applied to watersheds that are currently in a dynamic multiple-use state. The designs can therefore be considered in-situ designs that can be used at any time, at any stage of design and BMP implementation. What is important is to simply start monitoring, and continue monitoring so that before and after periods are captured pre- and post-BMP implementation [4]. Notably, these designs also increase monitoring efficacy due to multiple monitoring sites and can also ensure that limited taxpayer funds spent on BMPs are used effectively. This is important given that in the United States alone, funding invested in BMPs can constitute substantial sums. For example in the period of approximately 2005 to 2015, an estimated USD 30 billion was invested to fund federal conservation programs and protect public health and the environment [73].
The EWSD monitoring approach is an increasingly used, globally accepted, method to monitor hydrologic and water quality processes, identify CSAs and most impactful locations for BMPs in municipal watersheds. The EWSD has been shown to quantitatively characterize hydrologic and water quality conditions and changes effectively. It also is effective at addressing both site-specific management questions, BMP efficacy, and assisting model development, validation, and calibration [4,69,70,71,72,74,75,76,77,78]. Historically, the method may have been infeasible for many municipalities due to funding constraints and the historic high costs of instrumentation, labor, the often time-consuming process of data collection, as well as the expertise required for data analyses and interpretation of results [4,6,8,75]. While these perceptions may persist, recent reduced-cost technologies and the inherent long-term fiscal advantages of the experimental watershed study design far outweigh the potential disadvantages. Importantly, if preemptive, the design can be used to collect pre-treatment information (Figure 2). This is important given that pre-existing (antecedent) conditions prior to BMP implementation are most often infeasible and completely missing, but critical for BMP efficacy assessments. Unfortunately, without this information it is nearly impossible to justify changes in approach(es) for future implementations.
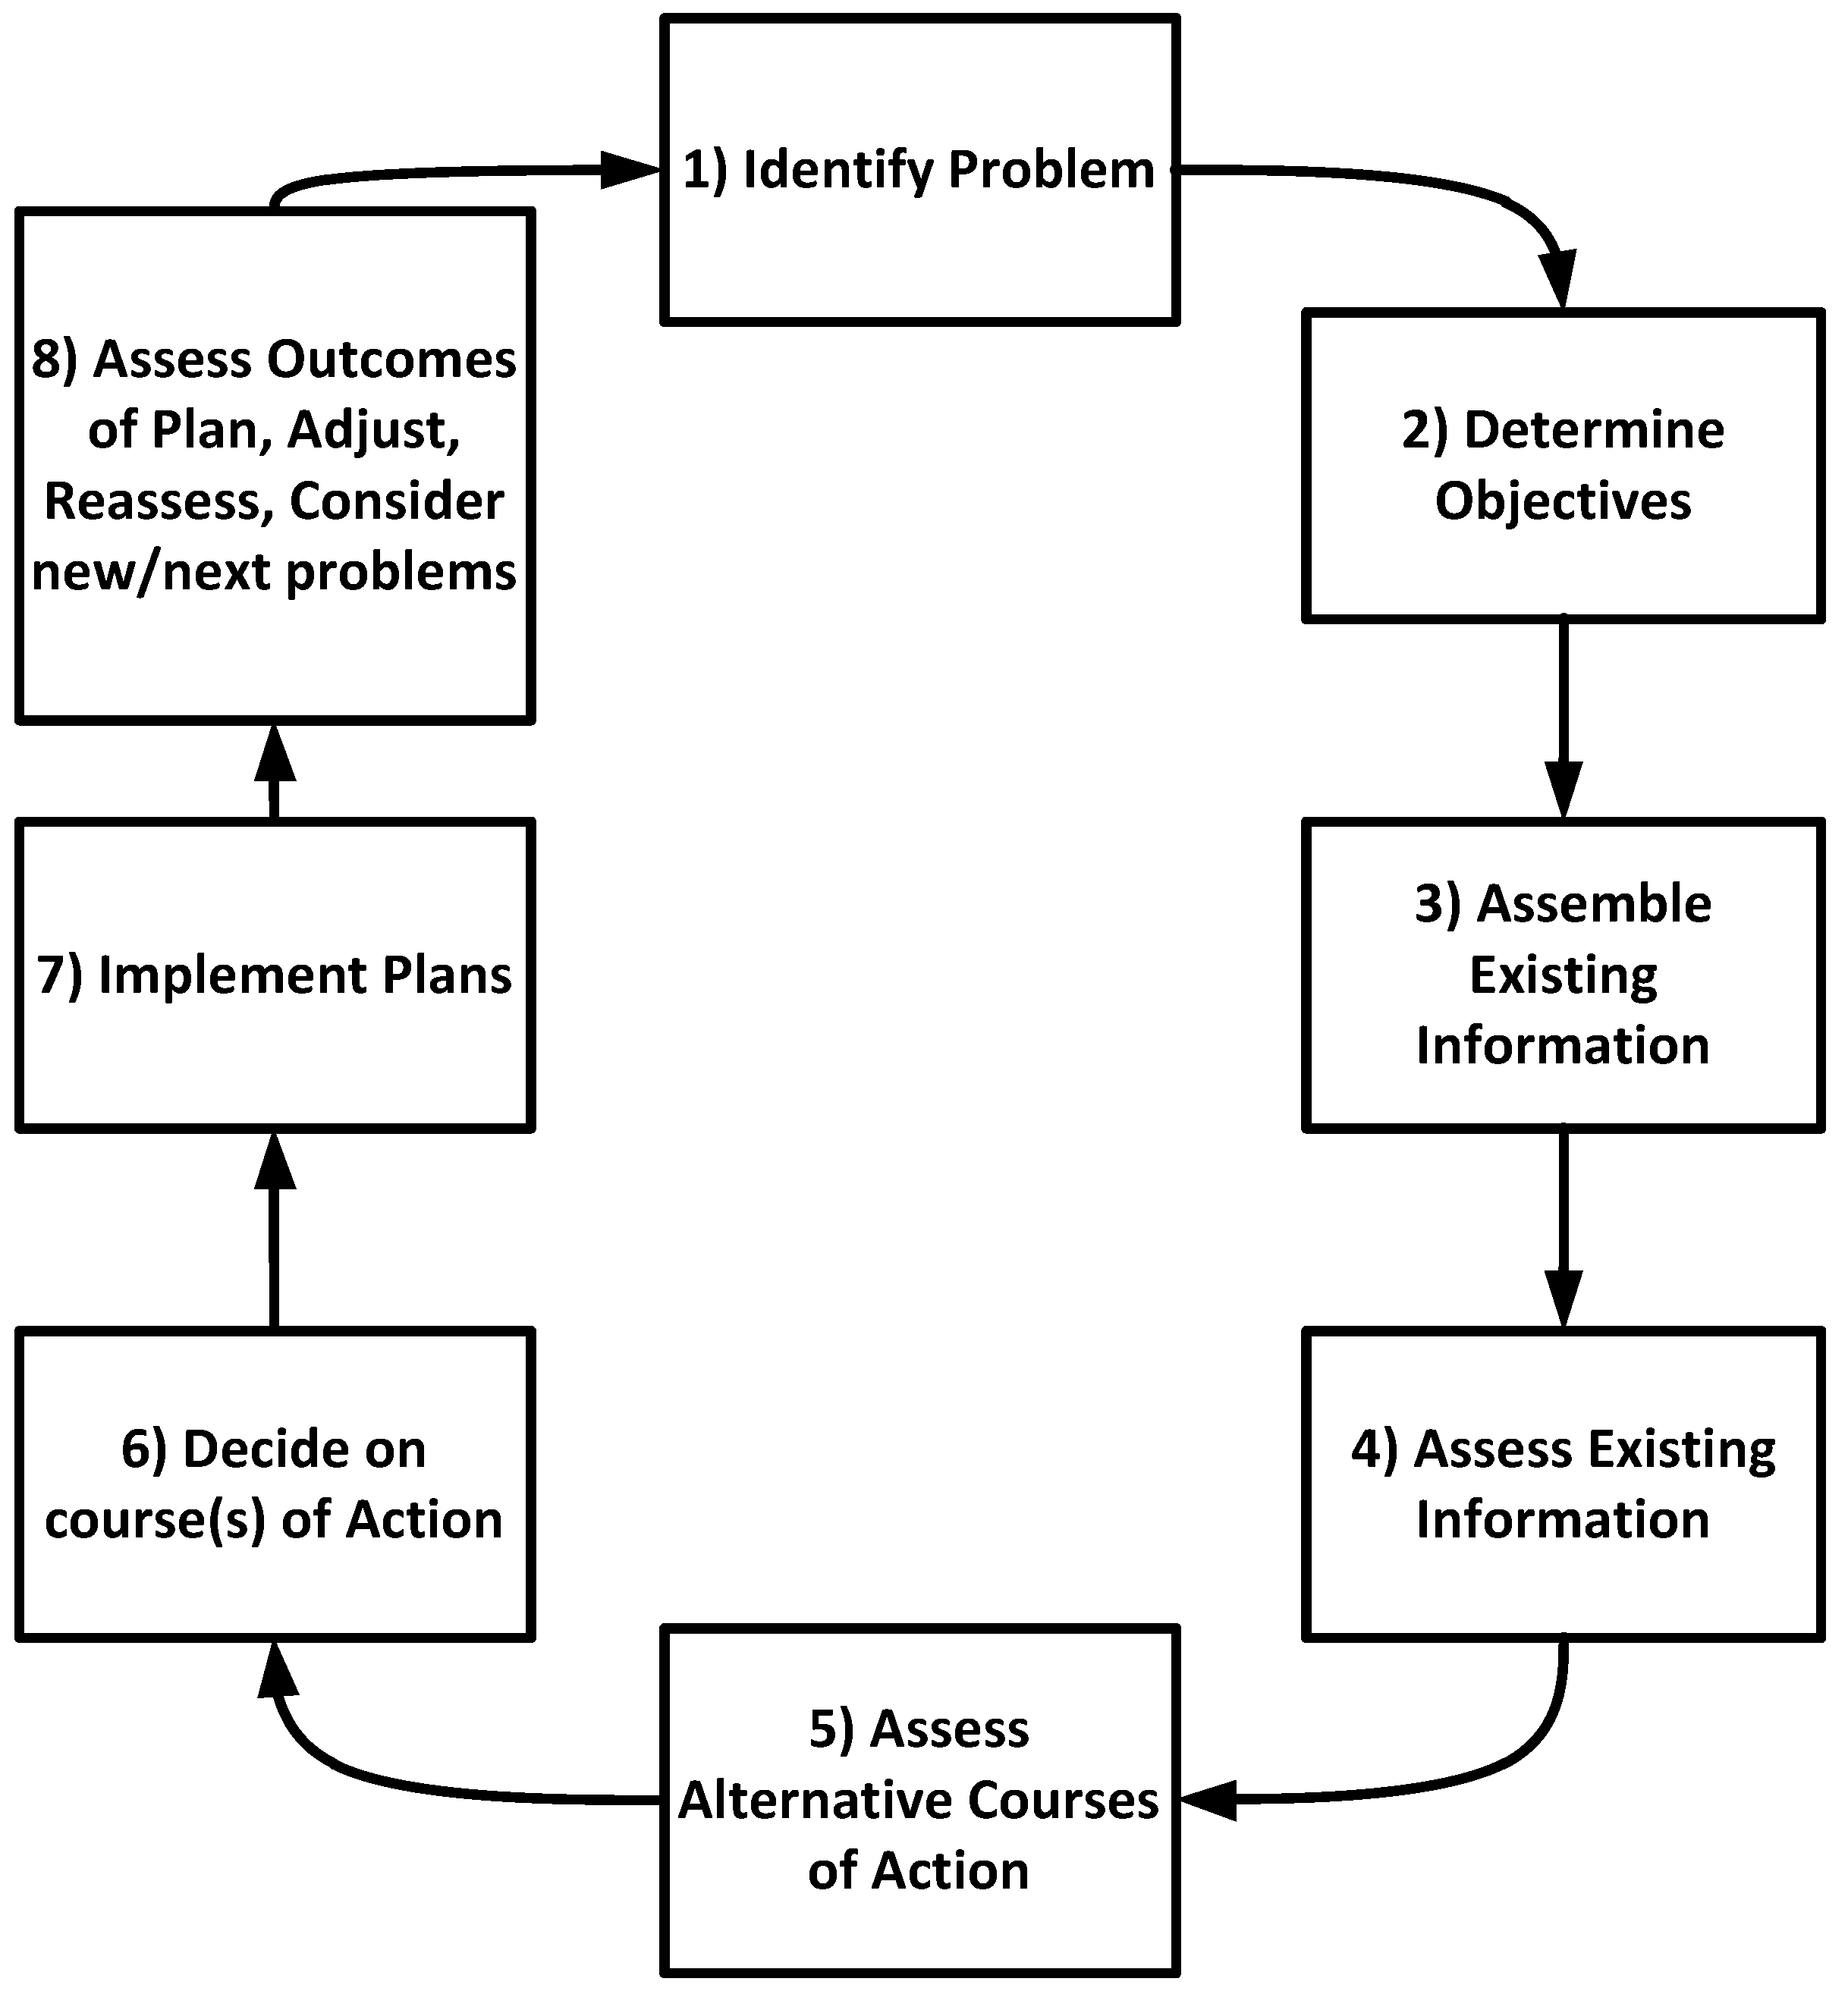
To advance and/or consider standardization of the BMP process, there may be a need to couple the EWSD with a process that includes a logical sequence of steps to satisfy project objectives before, during, and after implementation. There are many such plans adapted by managers and policy makers including that used by the Natural Resource Conservation Service (NRCS) [79], recreated and simplified in Figure 3. Planning steps are not always linear but may be cycled through iteratively to develop the best set of alternative solutions to a given problem, and ultimately select and implement a certain set of practices. For this example (Figure 3), the steps generally include the following. (1) Identify problems and opportunities: What characteristics should be changed? Is the noted condition actually a problem? (2) Determine overall goals and specific objectives: What are the desired physical, chemical, and biological outcomes? (3) Inventory resources: Understand the dominant physical processes, and impact variables of interest. (4) Assess assembled information and decide what processes most influence the desired condition. (5) Determine which processes can be changed (if any). (6) Assess alternatives. (7) Decide on courses of action. (8) Implement the plan. (9) Evaluate outcomes to assess performance and revise practices. Other methods include the integrated watershed management (IWM) approach that includes management planning to improve areas of concern including (but not limited to) water availability, increased food production, improved livelihoods, and sustainability of mixed land use watersheds [80]. In many locations (globally), the IWM approach has also been used to address gender issues and the generation of social capital and economic benefits for rural populations [80,81]. This approach, therefore, facilitates the protection of critical water resources while simultaneously addressing issues such as the current and future impacts of population and/or population and land use growth and climate change [4]. Finally, outcomes of these efforts can be improved in the long-term through effective collaborative adaptive management (CAM; or derivative) efforts [4,16,17,18].
6. Synthesis and Conclusions
The processes described and diagrammed above imply an iterative approach. The properly prioritized identification of CSA and BMP implementation will help prioritize the most sensitive CSAs and the most effective locations for BMPs. The in-tandem EWSD approach can facilitate the pre-implementation assessment, monitoring following implementation, and provide critical information necessary to determine the short- and long-term quantitative efficacy of implemented BMPs [4,67,68,69,70,71,74,75]. The coupled EWSD and logical flowpath (steps) approach, from identifying the problem to BMP implementation and validation, can lead to greater confidence and stakeholder buy-in regarding BMP efficacy.
The integration of approaches outlined herein facilitates the identification and quantification of factors contributing to impairment, and provides information needed to target mechanistic drivers, both natural and anthropogenic, of hydrologic and/or water quality alteration. Efficiency in planning and monitoring pre- and post- BMP implementation can quantitatively chronicle the compounding impacts of land use practices, hydroclimatic variability, and physical watershed characteristics on water quantity and quality regimes. There is a need for studies focused on the lifecycle of these processes, including the econometric benefits (or detriments). Ultimately, the ability to supply more scientific and socioeconomic information to stakeholders ensures buy-in and support for watershed best practices leading to improved long-term watershed management decision-making.
Funding
This work was supported by the National Science Foundation under Award Number OIA-1458952, National Science Foundation United States and National Science Foundation China Joint Research on Environmental Sustainability Grant CBET-1903543, United States Environmental Protection Agency, Wetland Program Development Grant, Project Number: EPA-R3-WPDG-18-19, the USDA National Institute of Food and Agriculture, Hatch project accession number 1011536, and the West Virginia Agricultural and Forestry Experiment Station. Additional funding was provided by the USDA Natural Resources Conservation Service, Soil and Water conservation, Environmental Quality Incentives Program No: 68-3D47-18-005. Results presented may not reflect the views of the sponsors and no official endorsement should be inferred. The funders had no role in study design, data collection and analysis, decision to publish, or preparation of the manuscript.
Data Availability Statement
There are no data presented and thus supporting reported results in the current study.
Acknowledgments
The author appreciates the support of many scientists of the Interdisciplinary Hydrology Laboratory (https://www.researchgate.net/lab/The-Interdisciplinary-Hydrology-Laboratory-Jason-A-Hubbart accessed on 26 October 2021). The author also appreciates the feedback of anonymous reviewers whose constructive comments improved the article.
Conflicts of Interest
The author declares no conflict of interest. The funders had no role in the design of the study; in the collection, analyses, or interpretation of data; in the writing of the manuscript, or in the decision to publish the results.
References
- Novotny, V. Water Quality: Prevention, Identification and Management of Diffuse Pollution; Van Nostrand-Reinhold Publishers: New York, NY, USA, 1994. [Google Scholar]
- Dingman, S.L. Physical Hydrology; Waveland Press: Long Grove, IL, USA, 2008. [Google Scholar]
- Tim, U.S.; Jolly, R. Evaluating Agricultural Nonpoint-Source Pollution Using Integrated Geographic Information Systems and Hydrologic/Water Quality Model. J. Environ. Qual. 1994, 23, 25–35. [Google Scholar] [CrossRef]
- Hubbart, J.A.; Kellner, E.; Zeiger, S.J. A Case-Study Application of the Experimental Watershed Study Design to Advance Adaptive Management of Contemporary Watersheds. Water 2019, 11, 2355. [Google Scholar] [CrossRef] [Green Version]
- Frankenberger, J.R.; Brooks, E.S.; Walter, M.T.; Steenhuis, T.S. A GIS-based variable source area hydrology model. Hydrol. Process. 1999, 13, 805–822. [Google Scholar] [CrossRef]
- Tetzlaff, D.; Carey, S.K.; McNamara, J.P.; Laudon, H.; Soulsby, C. The essential value of long-term experimental data for hydrology and water management. Water Resour. Res. 2017, 53, 2598–2604. [Google Scholar] [CrossRef] [Green Version]
- Leopold, L.B. Hydrologic Research on Instrumented Watersheds; International Association of Scientific Hydrology: Wallingford, UK, 1970; pp. 135–150. [Google Scholar]
- Hewlett, J.D.; Lull, H.W.; Reinhart, K.G. In Defense of Experimental Watersheds. Water Resour. Res. 1969, 5, 306–316. [Google Scholar] [CrossRef]
- Bosch, J.M.; Hewlett, J.D. A review of catchment experiments to determine the effect of vegetation changes on water yield and evapotranspiration. J. Hydrol. 1982, 55, 3–23. [Google Scholar] [CrossRef]
- Zeiger, S.; Hubbart, J.A.; Anderson, S.H.; Stambaugh, M.C. Quantifying and modelling urban stream temperature: A central US watershed study. Hydrol. Process. 2015, 30, 503–514. [Google Scholar] [CrossRef]
- Kellner, E.; Hubbart, J.A. Advancing Understanding of the Surface Water Quality Regime of Contemporary Mixed-Land-Use Watersheds: An Application of the Experimental Watershed Method. Hydrology 2017, 4, 31. [Google Scholar] [CrossRef] [Green Version]
- National Research Council. Urban Stormwater Management in the United States; The National Academies Press: Washington, DC, USA, 2009. [Google Scholar]
- Debo, T.N.; Reese, A. Municipal Stormwater Management, 2nd ed.; CRC Press: Boca Raton, FL, USA, 2002. [Google Scholar]
- Granato, G. Statistics for Stochastic Modeling of Volume Reduction, Hydrograph Extension, and Water-Quality Treatment by Structural Stormwater Runoff Best Management Practices (BMPs); United States Geological Survey: Reston, VA, USA, 2014.
- Dressing, S.A. Critical Source Area Identification and BMP Selection: Supplement to Watershed Planning Handbook; USEPA: Washington, DC, USA, 2018.
- Dmytriyev, S.D.; Freeman, R.E.; Hörisch, J. The Relationship between Stakeholder Theory and Corporate Social Responsibility: Differences, Similarities, and Implications for Social Issues in Management. J. Manag. Stud. 2021, 58, 1441–1470. [Google Scholar] [CrossRef]
- McGahan, A.M. Integrating Insights From the Resource-Based View of the Firm Into the New Stakeholder Theory. J. Manag. 2021, 47, 1734–1756. [Google Scholar] [CrossRef]
- Vashchenko, M. An external perspective on CSR: What matters and what does not? Bus. Ethic Eur. Rev. 2017, 26, 396–412. [Google Scholar] [CrossRef]
- Fischenich, J.C. The Application of Conceptual Models to Ecosystem Restoration; Engineer Research and Development Center: Vicksburg, MS, USA, 2008; p. 23. [Google Scholar]
- Murray, M.; Allan, J.D.; Bratton, J.; Ciborowski, J.; Steinman, A.; Stow, C. Conceptual Frameworks and Great Lakes Restoration and Protection. Available online: https://www.nwf.org/Home/Educational-Resources/Reports/2019/08-01-19-Great-Lakes-Conceptual-Frameworks (accessed on 26 October 2021).
- Bracmort, K.S.; Arabi, M.; Frankenberger, J.R.; Engel, B.A.; Arnold, J.G. Modeling long-term water quality impact of structural BMPs. Trans. ASABE 2006, 49, 367–374. [Google Scholar] [CrossRef] [Green Version]
- Chesapeake Bay Program. Strengthening Verification of Best Management Practices Implemented in the Chesapeake Bay Watershed: A Basinwide Framework; Chesapeake Bay Program: Annapolis, MD, USA, 2014. [Google Scholar]
- Mulla, D.J.; Birr, A.S. Evaluating the Effectiveness of Agricultural Management Practices at Reducing Nutrient Losses to Surface Waters. 2005. Available online: https://www.epa.gov/sites/default/files/2015-07/documents/2006_8_25_msbasin_symposia_ia_session14.pdf (accessed on 26 October 2021).
- Rao, N.S.; Easton, Z.M.; Schneiderman, E.M.; Zion, M.S.; Lee, D.R.; Steenhuis, T.S. Modeling watershed-scale effectiveness of agricultural best management practices to reduce phosphorus loading. J. Environ. Manag. 2009, 90, 1385–1395. [Google Scholar] [CrossRef]
- Simpson, T.; Weammert, S. Developing Best Management Practice Definitions and Effectiveness Estimates for Nitrogen, Phosphorus and Sediment. In The Chesapeake Bay Watershed; University of Maryland Mid-Atlantic: College Park, MD, USA, 2009. [Google Scholar]
- Smith, A.J.; Thomas, R.L.; Nolan, J.K.; Velinsky, D.J.; Klein, S.; Duffy, B.T. Regional nutrient thresholds in wadeable streams of New York State protective of aquatic life. Ecol. Indic. 2013, 29, 455–467. [Google Scholar] [CrossRef]
- Brueggen-Boman, T.R.; Choi, S.-E.; Bouldin, J.L. Response of Water-Quality Indicators to the Implementation of Best-Management Practices in the Upper Strawberry River Watershed, Arkansas. Southeast. Nat. 2015, 14, 697–713. [Google Scholar] [CrossRef]
- Chun, J.A.; Cooke, R.A.; Kang, M.S.; Choi, M.; Timlin, D.; Park, S.W. Runoff Losses of Suspended Sediment, Nitrogen, and Phosphorus from a Small Watershed in Korea. J. Environ. Qual. 2010, 39, 981–990. [Google Scholar] [CrossRef] [PubMed] [Green Version]
- Gitau, M.W.; Gburek, W.J.; Bishop, P.L. Use of the SWAT Model to Quantify Water Quality Effects of Agricultural BMPs at the Farm-Scale Level. Trans. ASABE 2008, 51, 1925–1936. [Google Scholar] [CrossRef]
- Tomer, M.D.; Locke, M.A. The challenge of documenting water quality benefits of conservation practices: A review of USDA-ARS’s conservation effects assessment project watershed studies. Water Sci. Technol. 2011, 64, 300–310. [Google Scholar] [CrossRef] [PubMed]
- Kroll, S.A.; Oakland, H.C. A Review of Studies Documenting the Effects of Agricultural Best Management Practices on Physiochemical and Biological Measures of Stream Ecosystem Integrity. Nat. Areas J. 2019, 39, 58. [Google Scholar] [CrossRef]
- Wang, J.; Goff, W.A. Application and Effectiveness of Forestry Best Management Practices in West Virginia. North. J. Appl. For. 2008, 25, 32–37. [Google Scholar] [CrossRef] [Green Version]
- Weigel, B.M.; Lyons, J.; Paine, L.K.; Dodson, S.I.; Undersander, D.J. Using Stream Macroinvertebrates to Compare Riparian Land Use Practices on Cattle Farms in Southwestern Wisconsin. J. Freshw. Ecol. 2000, 15, 93–106. [Google Scholar] [CrossRef]
- Yates, A.G.; Bailey, R.C.; Schwindt, J.A. Effectiveness of best management practices in improving stream ecosystem quality. Hydrobiologia 2007, 583, 331–344. [Google Scholar] [CrossRef]
- Harman, W.; Starr, M.; Carter, K.; Tweedy, M.; Clemmons, K.; Suggs, K.; Miller, C. A Function-Based Framework for Stream Assessment & Restoration Projects; US Environmental Protection Agency: Washington, DC, USA, 2012.
- Nichols, J.; Hubbart, J.A.; Poulton, B.C. Using macroinvertebrate assemblages and multiple stressors to infer urban stream system condition: A case study in the central US. Urban Ecosyst. 2016, 19, 679–704. [Google Scholar] [CrossRef]
- Doughty, C.R. Freshwater biomonitoring and benthic macroinvertebrates, edited by D. M. Rosenberg and V. H. Resh, Chapman and Hall, New York, 1993. ix + 488pp. Price: £39.95. ISBN 0412 02251 6. Aquat. Conserv. Mar. Freshw. Ecosyst. 1994, 4, 92. [Google Scholar] [CrossRef]
- Sowa, S.P.; Herbert, M.; Mysorekar, S.; Annis, G.M.; Hall, K.; Nejadhashemi, A.P.; Woznicki, S.A.; Wang, L.; Doran, P.J. How much conservation is enough? Defining implementation goals for healthy fish communities in agricultural rivers. J. Great Lakes Res. 2016, 42, 1302–1321. [Google Scholar] [CrossRef]
- Furse, M.; Hering, D.; Moog, O.; Verdonschot, P.; Johnson, R.K.; Brabec, K.; Gritzalis, K.; Buffagni, A.; Pinto, P.; Friberg, N.; et al. The STAR project: Context, objectives and approaches. Hydrobiologia 2006, 566, 3–29. [Google Scholar] [CrossRef]
- Hering, D.; Johnson, R.K.; Kramm, S.; Schmutz, S.; Szoszkiewicz, K.; Verdonschot, P.F.M. Assessment of European streams with diatoms, macrophytes, macroinvertebrates and fish: A comparative metric-based analysis of organism response to stress. Freshw. Biol. 2006, 51, 1757–1785. [Google Scholar] [CrossRef]
- Potapova, M.; Charles, D. Distribution of benthic diatoms in U.S. rivers in relation to conductivity and ionic composition. Freshw. Biol. 2003, 48, 1311–1328. [Google Scholar] [CrossRef] [Green Version]
- Stevenson, R.J.; Peterson, C.G.; Kirschtel, D.B.; King, C.C.; Tuchman, N.C. Density-dependent growth, ecological strategies, and effects of nutrients and shading on benthic diatom succession in streams1. J. Phycol. 1991, 27, 59–69. [Google Scholar] [CrossRef]
- Yagow, G.; Wilson, B.; Srivastava, P.; Obropta, C.C. Use of biological indicators in TMDL assessment and implementation. Trans. ASABE 2006, 49, 1023–1032. [Google Scholar] [CrossRef] [Green Version]
- Waite, I.R. Agricultural disturbance response models for invertebrate and algal metrics from streams at two spatial scales within the U.S. Hydrobiologia 2014, 726, 285–303. [Google Scholar] [CrossRef]
- Roni, P. Monitoring Stream and Watershed Restoration in SearchWorks Catalog; American Fisheries Society: Bethesda, MD, USA, 2005. [Google Scholar]
- Woolsey, S.; Capelli, F.; Gonser, T.; Hoehn, E.; Hostmann, M.; Junker, B.; Paetzold, A.; Roulier, C.; Schweizer, S.; Tiegs, S.D.; et al. A strategy to assess river restoration success. Freshw. Biol. 2007, 52, 752–769. [Google Scholar] [CrossRef]
- Diebel, M.; Maxted, J.T.; Robertson, D.; Han, S.; Zanden, J.V. Landscape Planning for Agricultural Nonpoint Source Pollution Reduction III: Assessing Phosphorus and Sediment Reduction Potential. Environ. Manag. 2009, 43, 69–83. [Google Scholar] [CrossRef] [PubMed]
- Diebel, M.; Maxted, J.T.; Nowak, P.J.; Zanden, J.V. Landscape Planning for Agricultural Nonpoint Source Pollution Reduction I: A Geographical Allocation Framework. Environ. Manag. 2008, 42, 789–802. [Google Scholar] [CrossRef]
- Easton, Z.M.; Walter, M.T.; Steenhuis, T.S. Combined Monitoring and Modeling Indicate the Most Effective Agricultural Best Management Practices. J. Environ. Qual. 2008, 37, 1798–1809. [Google Scholar] [CrossRef]
- Chesapeake Bay Program Office. Chesapeake Assessment and Scenario Tool (CAST); Version 2017b; Chesapeake Bay Program Office: Annapolis, MD, USA, 2017. [Google Scholar]
- Maxted, J.T.; Diebel, M.; Zanden, J.V. Landscape Planning for Agricultural Non–Point Source Pollution Reduction. II. Balancing Watershed Size, Number of Watersheds, and Implementation Effort. Environ. Manag. 2008, 43, 60–68. [Google Scholar] [CrossRef] [PubMed] [Green Version]
- Belt, K.; Groffman, P.; Newbold, D.; Hession, C.; Noe, G.; Okay, J.; Southerland, M.; Speiran, G.; Staver, K.; Hairston-Strang, A.; et al. Recommendations of the Expert Panel to Reassess Removal Rates for Riparian Forest and Grass Buffers Best Management Practices; Chesapeake Bay Program: Annapolis, MD, USA, 2014. [Google Scholar]
- Staver, K.; White, C.; Meisinger, J.; Salon, P.; Thomason, W. Cover Crops Practices for Use in Phase 6.0 of the Chesapeake Bay Program. Watershed Model; Chesapeake Bay Program: Annapolis, MD, USA, 2017. [Google Scholar]
- Thomason, W.; Duiker, S.; Ganoe, K.; Gates, D.; McCollum, B.; Reiter, M. Conservation Tillage Practices for Use in Phase 6.0 of the Chesapeake Bay Program. Watershed Model; Chesapeake Bay Program: Annapolis, MD, USA, 2016. [Google Scholar]
- Sharpley, A.N.; Daniel, T.C.; Edwards, D.R. Phosphorus Movement in the Landscape. J. Prod. Agric. 1993, 6, 492–500. [Google Scholar] [CrossRef]
- Lintern, A.; McPhillips, L.; Winfrey, B.; Duncan, J.; Grady, C. Best Management Practices for Diffuse Nutrient Pollution: Wicked Problems Across Urban and Agricultural Watersheds. Environ. Sci. Technol. 2020, 54, 9159–9174. [Google Scholar] [CrossRef] [PubMed]
- Davis, A.P.; Shokouhian, M.; Sharma, H.; Minami, C. Water Quality Improvement through Bioretention Media: Nitrogen and Phosphorus Removal. Water Environ. Res. 2006, 78, 284–293. [Google Scholar] [CrossRef]
- He, S.; Xu, Y.J. Three Decadal Inputs of Nitrogen and Phosphorus from Four Major Coastal Rivers to the Summer Hypoxic Zone of the Northern Gulf of Mexico. Water Air Soil Pollut. 2015, 226, 1–18. [Google Scholar] [CrossRef]
- Line, D.E.; Harman, W.A.; Jennings, G.D.; Thompson, E.J.; Osmond, D.L. Nonpoint-Source Pollutant Load Reductions Associated with Livestock Exclusion. J. Environ. Qual. 2000, 29, 1882–1890. [Google Scholar] [CrossRef] [Green Version]
- Miltner, R.J. Measuring the Contribution of Agricultural Conservation Practices to Observed Trends and Recent Condition in Water Quality Indicators in Ohio, USA. J. Environ. Qual. 2015, 44, 1821–1831. [Google Scholar] [CrossRef] [Green Version]
- Santhi, C.; Arnold, J.G.; White, M.; Di Luzio, M.; Kannan, N.; Norfleet, L.; Atwood, J.; Kellogg, R.; Wang, X.; Williams, J.R.; et al. Effects of Agricultural Conservation Practices on N Loads in the Mississippi-Atchafalaya River Basin. J. Environ. Qual. 2014, 43, 1903–1915. [Google Scholar] [CrossRef] [Green Version]
- Kleinman, P.J.A.; Sharpley, A.N.; Withers, P.J.A.; Bergström, L.; Johnson, L.T.; Doody, D.G. Implementing agricultural phosphorus science and management to combat eutrophication. AMBIO 2015, 44, 297–310. [Google Scholar] [CrossRef] [Green Version]
- Sharpley, A.; Jarvie, H.P.; Buda, A.; May, L.; Spears, B.; Kleinman, P. Phosphorus Legacy: Overcoming the Effects of Past Management Practices to Mitigate Future Water Quality Impairment. J. Environ. Qual. 2013, 42, 1308–1326. [Google Scholar] [CrossRef] [PubMed] [Green Version]
- Lam, Q.D.; Schmalz, B.; Fohrer, N. The impact of agricultural Best Management Practices on water quality in a North German lowland catchment. Environ. Monit. Assess. 2011, 183, 351–379. [Google Scholar] [CrossRef] [PubMed]
- Thomas, Z.P. The Effects on Water Quality of Restricting Cattle Access to a Georgia Piedmont Stream. Master’s Thesis, University of Georgia, Athens, GA, USA, 2002. [Google Scholar]
- Beegle, D.B.; Carton, O.T.; Bailey, J.S. Nutrient Management Planning: Justification, Theory, Practice. J. Environ. Qual. 2000, 29, 72–79. [Google Scholar] [CrossRef]
- Artita, K.S.; Kaini, P.; Nicklow, J.W. Examining the Possibilities: Generating Alternative Watershed-Scale BMP Designs with Evolutionary Algorithms. Water Resour. Manag. 2013, 27, 3849–3863. [Google Scholar] [CrossRef]
- Strauss, P.; Leone, A.; Ripa, M.N.; Turpin, N.; Lescot, J.-M.; Laplana, R. Using critical source areas for targeting cost-effective best management practices to mitigate phosphorus and sediment transfer at the watershed scale. Soil Use Manag. 2007, 23, 144–153. [Google Scholar] [CrossRef] [Green Version]
- Hassett, B.; Palmer, M.; Bernhardt, E.; Smith, S.; Carr, J.; Hart, D. Restoring Watersheds Project by Project: Trends in Chesapeake Bay Tributary Restoration. Front. Ecol. Environ. 2005, 3, 259–267. [Google Scholar] [CrossRef]
- Smiley, P.C.; Shields, F.D.; Knight, S.S. Designing Impact Assessments for Evaluating Ecological Effects of Agricultural Conservation Practices on Streams1. JAWRA J. Am. Water Resour. Assoc. 2009, 45, 867–878. [Google Scholar] [CrossRef]
- Hubbart, J.A.; Link, T.E.; Gravelle, J.A.; Elliot, W.J. Timber Harvest Impacts on Water Yield in the Continental/Maritime Hydroclimatic Region of the United States. For. Sci. 2007, 53, 169–180. [Google Scholar]
- Horne, J.P.; Hubbart, J.A. A Spatially Distributed Investigation of Stream Water Temperature in a Contemporary Mixed-Land-Use Watershed. Water 2020, 12, 1756. [Google Scholar] [CrossRef]
- EWG New EWG Database Details $30 Billion Spent on U.S. Farm Conservation Programs. Available online: https://www.ewg.org/release/new-ewg-database-details-30-billion-spent-us-farm-conservation-programs (accessed on 25 February 2021).
- Petersen, F.; Hubbart, J.A. Advancing Understanding of Land Use and Physicochemical Impacts on Fecal Contamination in Mixed-Land-Use Watersheds. Water 2020, 12, 1094. [Google Scholar] [CrossRef]
- Kellner, E.; Hubbart, J.A. Application of the Experimental Watershed Approach to Advance Urban Watershed Precipitation/Discharge Understanding. Urban Ecosyst. 2017, 20, 799–810. [Google Scholar] [CrossRef]
- Sunde, M.; He, H.S.; Hubbart, J.A.; Scroggins, C. Forecasting streamflow response to increased imperviousness in an urbanizing Midwestern watershed using a coupled modeling approach. Appl. Geogr. 2016, 72, 14–25. [Google Scholar] [CrossRef]
- Zeiger, S.J.; Hubbart, J.A. Nested-Scale Nutrient Flux in a Mixed-Land-Use Urbanizing Watershed: Nested-Scale Nutrient Flux in a Mixed-Land-Use Urbanizing Watershed. Hydrol. Process. 2016, 30, 1475–1490. [Google Scholar] [CrossRef]
- Zeiger, S.J.; Hubbart, J.A. Quantifying Flow Interval–Pollutant Loading Relationships in a Rapidly Urbanizing Mixed-Land-Use Watershed of the Central USA. Environ. Earth Sci. 2017, 76, 484. [Google Scholar] [CrossRef]
- NRCS Nine Step Conservation Planning Process|NRCS. Available online: https://www.nrcs.usda.gov/wps/portal/nrcs/detail/national/programs/financial/eqip/?cid=nrcs144p2_015695 (accessed on 29 October 2021).
- Wang, G.; Mang, S.; Cai, H.; Liu, S.; Zhang, Z.; Wang, L.; Innes, J.L. Integrated Watershed Management: Evolution, Development and Emerging Trends. J. For. Res. 2016, 27, 967–994. [Google Scholar] [CrossRef] [Green Version]
- Hubbart, J.A.; Stephan, K.; Petersen, F.; Heck, Z.; Horne, J.; Meade, B.J. Challenges for the Island of Barbuda: A Distinct Cultural and Ecological Island Ecosystem at the Precipice of Change. Challenges 2020, 11, 12. [Google Scholar] [CrossRef]
Figure 1.
Process for integrating necessary information to develop critical source area (CSA) assessments and prioritize best management practice (BMP) implementation. Simplified after [14].
Figure 1.
Process for integrating necessary information to develop critical source area (CSA) assessments and prioritize best management practice (BMP) implementation. Simplified after [14].

Figure 2.
Nested figures include idealized catchments with examples of (A,B) paired and nested EWSD with (A), control (left) and treatment (right) catchments, and monitoring during a calibration period, (B) control (left) and treatment (right) catchments, and monitoring after changes (arbitrary) in management practices (shaded area in B), modelled after [71], (C) the nested scale design, modelled after [4], and (D), the scale-nested and paired design, modelled after [72,74]. These can be considered in-situ designs as there may be land use practices occurring (pre-existing) before, during and after subsequent BMP implementation. Monitoring site locations shown are arbitrary and must be user-defined.

Figure 3.
Example of a nine-step planning process to develop and implement plans that protect, conserve, and enhance natural resources within a social and economic construct, recreated from [79].
Figure 3.
Example of a nine-step planning process to develop and implement plans that protect, conserve, and enhance natural resources within a social and economic construct, recreated from [79].

Publisher’s Note: MDPI stays neutral with regard to jurisdictional claims in published maps and institutional affiliations. |
© 2021 by the author. Licensee MDPI, Basel, Switzerland. This article is an open access article distributed under the terms and conditions of the Creative Commons Attribution (CC BY) license (https://creativecommons.org/licenses/by/4.0/).
Share and Cite
MDPI and ACS Style
Hubbart, J.A. Improving Best Management Practice Decisions in Mixed Land Use and/or Municipal Watersheds: Should Approaches Be Standardized? Land 2021, 10, 1402. https://0-doi-org.brum.beds.ac.uk/10.3390/land10121402
AMA Style
Hubbart JA. Improving Best Management Practice Decisions in Mixed Land Use and/or Municipal Watersheds: Should Approaches Be Standardized? Land. 2021; 10(12):1402. https://0-doi-org.brum.beds.ac.uk/10.3390/land10121402
Chicago/Turabian StyleHubbart, Jason A. 2021. "Improving Best Management Practice Decisions in Mixed Land Use and/or Municipal Watersheds: Should Approaches Be Standardized?" Land 10, no. 12: 1402. https://0-doi-org.brum.beds.ac.uk/10.3390/land10121402
Note that from the first issue of 2016, this journal uses article numbers instead of page numbers. See further details here.