Article

Quantitatively Determining the Priorities of Regional Ecological Compensation for Cultivated Land in Different Main Functional Areas: A Case Study of Hubei Province, China

School of Resource and Environmental Sciences, Wuhan University, Wuhan 430079, China
*
Author to whom correspondence should be addressed.
Submission received: 25 December 2020 / Revised: 21 February 2021 / Accepted: 23 February 2021 / Published: 1 March 2021

Abstract

:
With the rapid economic growth and urbanisation process, a large amount of cultivated land has been permanently transformed into urban land. The protection of cultivated land has received widespread attention, and ecological compensation has been an effective means of restraining the decrease in cultivated land. Different from previous approaches to and methods of studying cultivated land’s ecological compensation, this study proposes a new behavioural perspective. Reasonably determining the priority of ecological compensation and the amount of compensation constitutes the core of building a regional ecological compensation mechanism. On the basis of the main functional area, this paper defines the area of ecological compensation and payment for cultivated land and determines the corresponding order and level by measuring the ecosystem’s service value in Hubei Province. The results show that the order and quantity of ecological compensation for cultivated land are spatially heterogeneous, and that the order and quantity of compensation (payment) in different main functional areas have a certain correlation. That is, when the order of compensation (payment) is higher, the quantity is larger. The results have a certain reference value for the reform of cultivated land’s ecological compensation and the innovation of financial payment mechanisms, particularly in the context of developing countries.

1. Introduction

In human society, cultivated land not only provides economic value for human beings through activities, such as food and material production, but also ecological service value in terms of biodiversity and wildlife habitat conservation, flood protection and fresh air and open space conservation, among other uses [1,2,3,4]. As the primary resource for human survival and development, cultivated land has multi-functionality [5]. It has the functions of ensuring national food security, stabilising the social and economic order and meeting the basic needs of people, and it acts as an important ecological resource and has ecological service functions such as regulating the regional climate, purifying the air, conserving water and maintaining biodiversity. Cultivated land can guarantee national food security and is also an important ecological resource. Therefore, cultivated land protection policies that aim to reduce cultivated land loss are enforced in many parts of the world. For example, to protect the quality and quantity of cultivated land, the United States divides cultivated land into non-agricultural white land and restricted development green land [6]. Germany also implemented spatial planning to regulate the Nichtbaugebiet (restricted development areas) and Baugebiet (non-restricted development areas) [7]. In the Netherlands, cultivated land is classified by zoning into red function areas and green function areas through provincial and municipal spatial planning [8]. Unlike Western Europe and North America, East Asia is a rapidly growing and densely populated region, where economic development and food self-sufficiency are two important goals of governments. In China, land-use planning and main function planning are common forms of government-led spatial planning that aim to identify development areas and restricted areas [9].
Cultivated land protection policies have aimed to divide territories into implementation-free development and limited-development zones [10]. Under these policies, the conversion of arable land into urban land has decreased. However, there are several problems associated with achieving sustainable economic development and an ecological balance with a large amount of agricultural land [11,12]. Due to the spatial externalities or spillovers of cultivated land’s ecological services [13], an economic incentive program should be established from the perspective of a market-based policy to make the external costs internalised and prompt cropland protection. Quantifying the environmental nonmarket goods and services produced by cultivated land in monetary form is urgently needed to compensate local governments for openly providing cultivated land’s ecological services [14,15]. Previous studies on cultivated land protection policy and compensation mechanisms have focused on the protection and compensation of the cultivated land’s quantity and production function but ignored the ecological function of cultivated land [3]. In addition, the current research on cultivated land’s ecological compensation has focused mainly on compensation mechanisms and principles [16,17]. It can be seen from the existing compensation practice that the current ecological compensation standards for cultivated land have not effectively solved the problems of the continuous deterioration of cultivated land quality, the abandonment of cultivated land and the decrease in land quantity [18]. Therefore, research on cultivated land ecological compensation based on the value of ecosystem services will help clarify the standards of cultivated land ecological compensation, improve the ecological compensation policy system and promote the construction of an agricultural ecological civilization society.
Ecological compensation refers to the practice in which the beneficiaries of ecological protection pay money or other material benefits to conservationists to make up for the cost as well as other related losses of behaviour, considering the ecological protection development cost, opportunity cost and value of ecological services, on the basis of fiscal transfer payment or market trading [7,19]. Ecological compensation is an economic means of resource environmental protection and an effective means by which to resolve the contradiction between regional administrative division and ecological environment integration. Its purpose is to mobilize enthusiasm for ecological construction [20] so that ecological protection will be transformed from a public welfare undertaking by social citizens into an economic behaviour of symmetric investment and income. The early research on ecological compensation mainly focused on a compensation mechanism [21], compensation time, space allocation [22], etc. In recent years, it has focused on the ecological compensation willingness [23], biological diversity compensation [24], and other humanistic and economic aspects. In theory, the connotation of ecological compensation has developed from the field of ecology to the field of social economy and law. At the research scale, it has involved the countries [18], provinces [25], cities [4], key ecological functional areas [26] and concentrated contiguous key poverty areas [27]. The research objects have included watersheds [28,29], forests [30], cultivated land [31], grasslands [32], wetlands [33] and many other subjects. The research content has covered the conception of ecological compensation [34], policy legislation [35], methods [36], the payment order [37] and compensation standards [38]. From the perspective of research methods, the ecological footprint method, market price method, opportunity cost method, conditional value method, environmental preference display method and alternative cost method have been the most often used approaches to calculate ecological compensation amounts [39,40,41]. The pricing standard of ecological compensation is the core issue of regional ecological compensation, that is, how to achieve the goal of sustainable development through a fair and reasonable system design. Many scholars have actively explored regional ecological compensation standards; however, a complete ecological compensation research system has not yet been formed, and it still needs to be explored.
Economic compensation for cultivated land protection is an economic incentive measure that effectively coordinates the contradiction between cultivated land protection and economic development. The essence of compensation is a process of the internalisation of externalities. The value and significance of cultivated land’s ecological compensation has also become a research hotspot [17]. Academic research on the economic compensation mechanism of cultivated land protection mainly focuses on the theoretical basis of the compensation mechanism [42], the division of compensation areas [39], the calculation of compensation standards [38] and the analysis of compensation’s effects [15]. The calculation methods used for cultivated land’s ecological compensation standards mainly include the three aspects of value theory (ecosystem service value and the eigenvalue method), market theory (the food security method and ecological footprint) and semi-market theory (the Contingent Valuation Method (CVM) method, cost usage, opportunity cost method, etc.) [43]. Regarding the division of compensation areas, currently, the most widely used method is the division of cultivated land surplus/deficit areas based on the food security method [44]. However, economic value is often obtained through food security [45,46], and little attention is paid to the nonmarket value of cultivated land. In addition, some researchers calculate the ecological footprint of cultivated land and study the economic compensation zoning of cultivated land protection based on the supply–demand relationship of the cultivated land’s ecological carrying capacity [39]. However, there have still been few studies on the quantitative ecological compensation standard model of the main functional areas, and comprehensive research of the application of multidisciplinary methods and technology cross-integration is urgently needed. At present, problems, such as low compensation standards and a lack of differentiation, exist, and the spatial difference mechanism of ecological compensation has not yet been formed.
Research on ecological compensation in the main functional areas is also mainly conducted at the theoretical level such as studying the connotations and characteristics of the main functional areas’ ecological compensation, the associated theoretical basis and basic principles, compensation models [47], etc. For example, Zhang et al. [48] demonstrated the legitimacy of ecological compensation in key ecological function areas, and Meng et al. [49] constructed the framework of the environmental policy system of the main functional zone at the three levels of environmental policy objectives, policy means and policy guarantees. Regarding the research on ecological compensation in the main functional areas in Hubei Province, Sun et al. [50] proposed a priority model for the payment order of ecological compensation in the main functional areas from the perspective of ecological gains and losses, but this research did not consider the issue of ecological compensation in the main agricultural production areas. Based on these findings, this research is based on the principle of “the-beneficiaries-pay”, starting from the perspective of main functional areas and comprehensively considering key ecological functional areas, main agricultural production areas and key development zones. Based on the calculation of the ecosystem service value in Hubei Province, this paper defined the ecological compensating areas and compensated areas and determined the level and order of ecological compensation and payment.
With the rapid economic growth and urbanisation process in China, a large amount of cultivated land has been perpetually transformed into urban land [51,52]. In addition, farmers also abuse many chemical fertilisers and toxic pesticides in grain production [18]. This approach could lead to harmful agricultural products and serious environmental problems that may pose a serious threat to the sustainable development of society [53,54]. Against this background, how to protect cultivated land and solve the problem of the non-agriculturalization of cultivated land has become a new question for coordinating China’s food security and social and economic development [55,56]. Fiscal transfer payments have been implemented in Portugal, Brazil and Germany [24,57,58] and still need to be popularised in China. Current research has included related studies on transregional fiscal payments for the nation [24,59] and for the autonomous regions and municipalities [60] directly under the government. There have been few studies of provinces at the county and district scale [39].
Under China’s socialist land system, fiscal transfer payments play an important role in guiding the land supply and demand imbalance. In this study, the 103 regions of Hubei Province in China are taken as research objects to investigate the operational characteristics and compensation mechanism of cultivated land (Figure 1). The specific objectives of this study were the following: (1) to analyse the ecological status of the cultivated land with a three-dimensional ecological footprint model and construct a cultivated land ecological overload index with the cultivated land ecological footprint and cultivated land biological capacity values; (2) to quantify the cultivated land ecosystem service market value and nonmarket value using the equivalence factor method; (3) to divide the 103 administrative areas into compensating areas and compensated areas against the background of the main functional zoning of Hubei Province; (4) to construct cultivated land ecological compensation priorities based on ecosystem services and socioeconomic development; and (5) to introduce compensation coefficients, such as the ecological overload index, social development stage index and local government affordability index, to revise the nonmarket value of ecosystem services and ensure that the established ecological compensation standards for cultivated land are practical and feasible. This paper establishes a Hubei county-level ecological compensation model based on the main functional area planning perspective, which provides a new idea for the practice of ecological compensation and a reference for the formulation and improvement of ecological compensation policies.

2. Materials and Methods

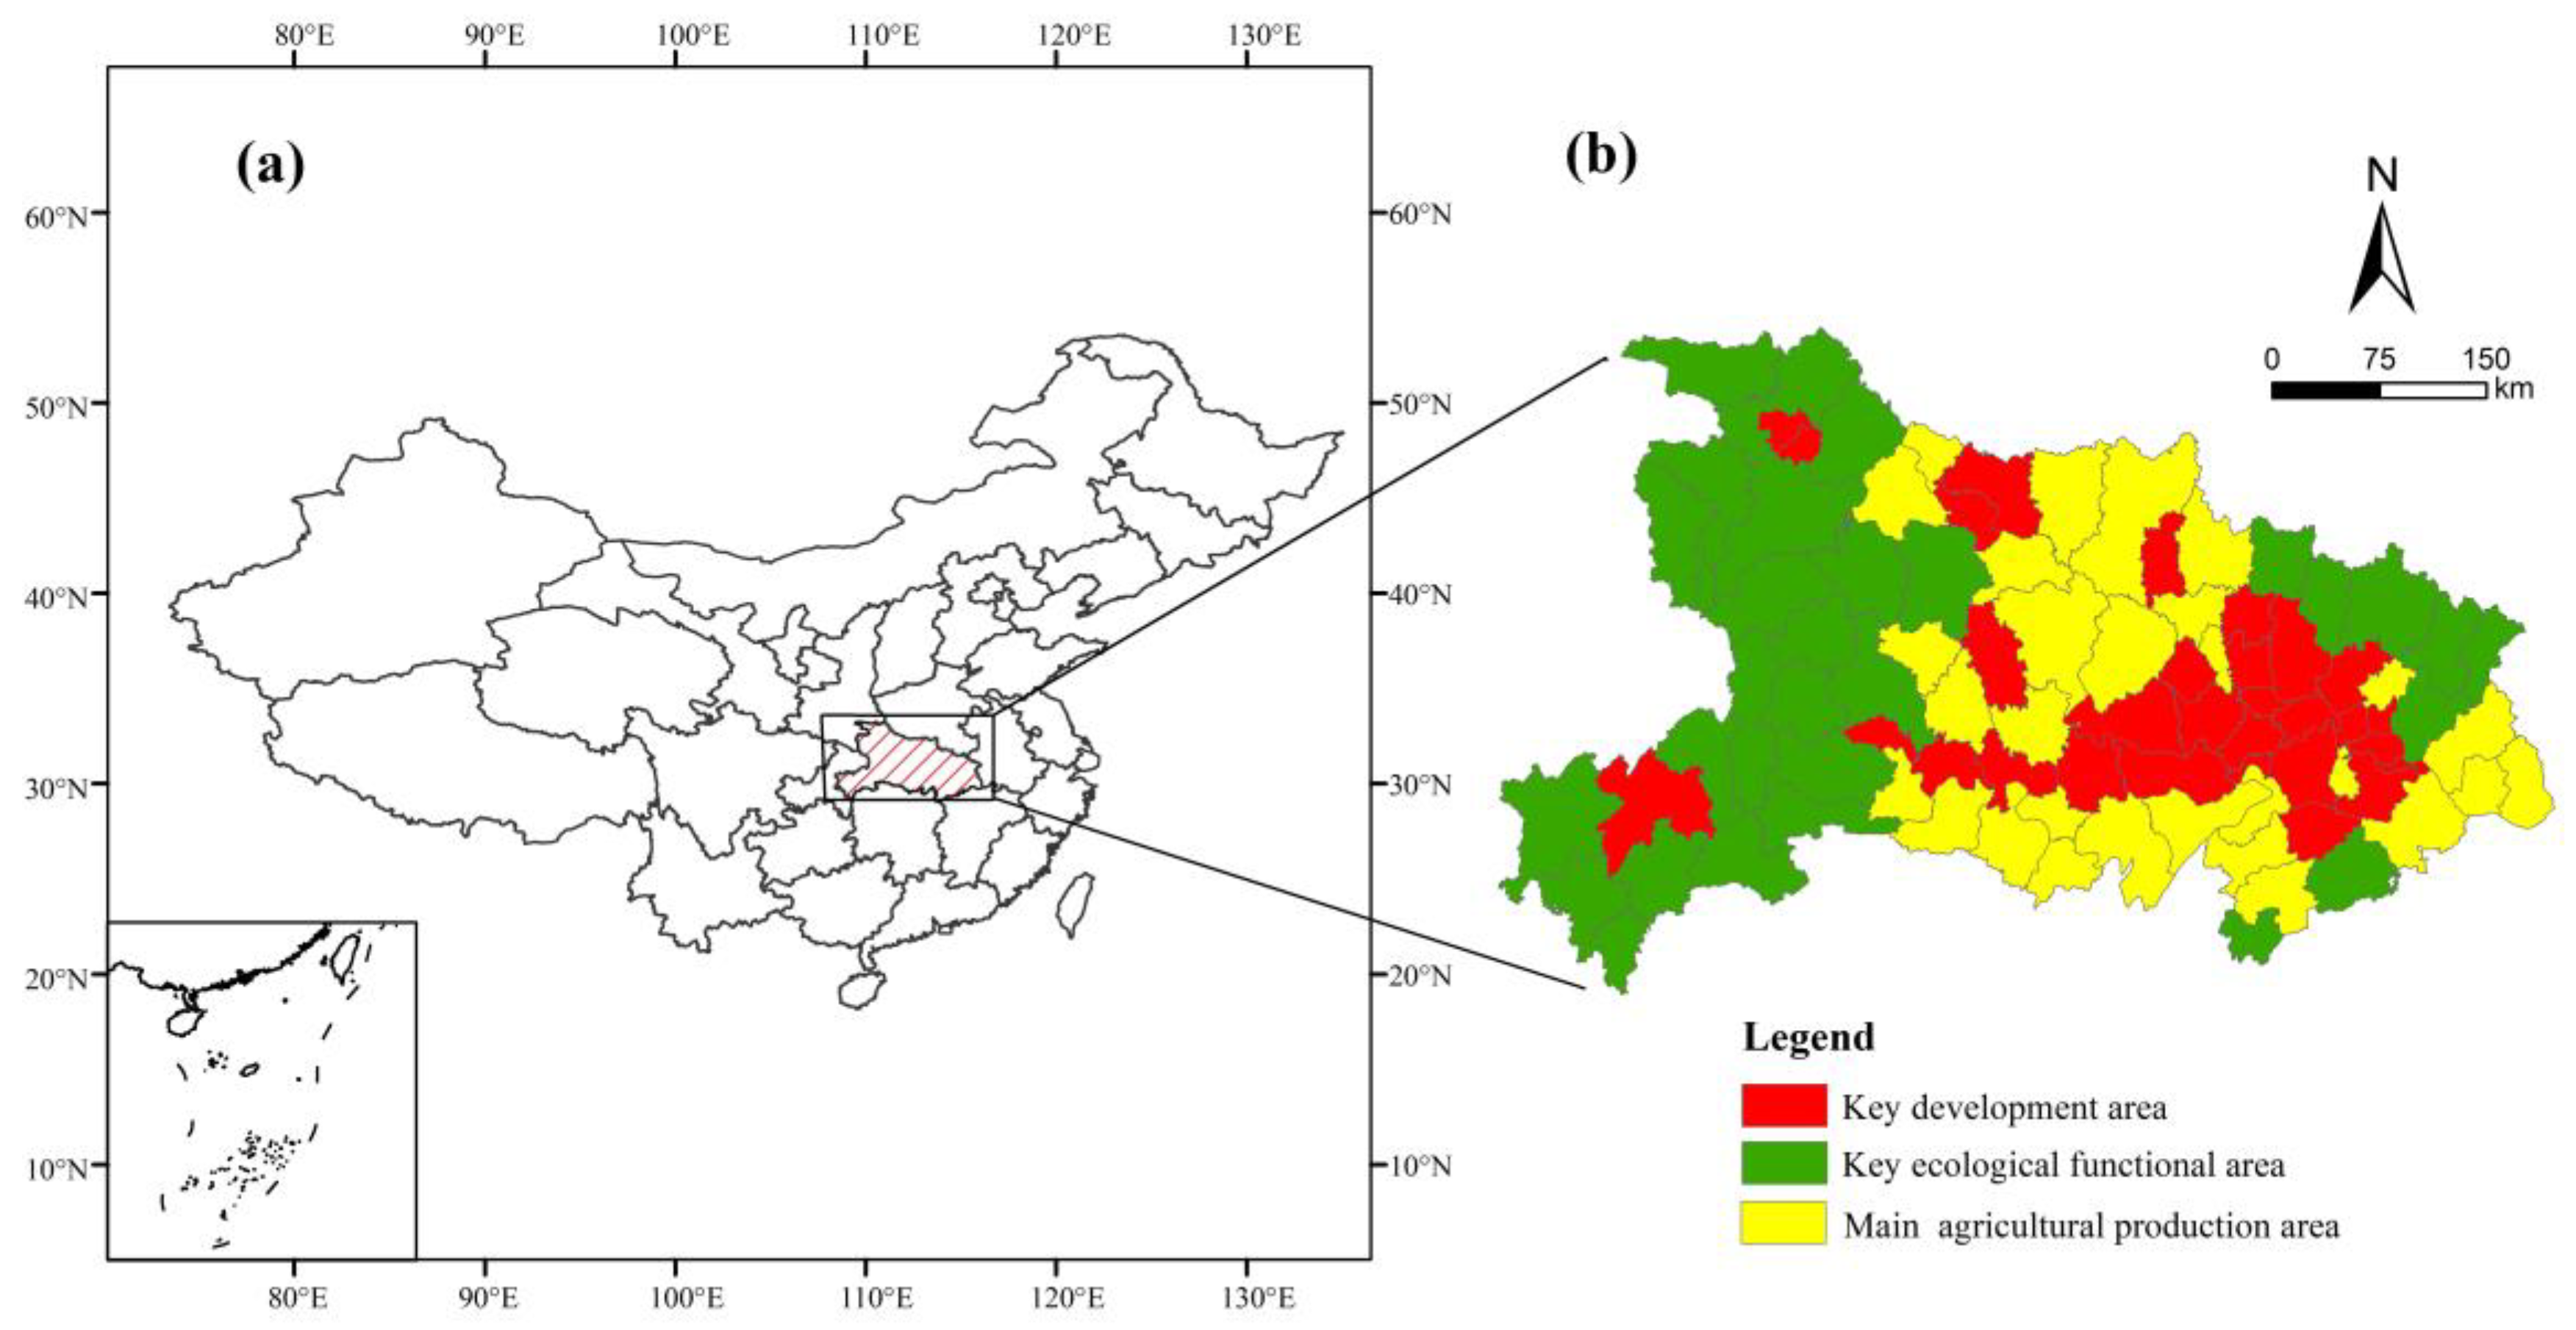
2.1. Study Area and Data Sources

Hubei Province, China, was selected as the study area for this research (Figure 2). This province is located in the central part of China (longitude of 108°21′42″–116°07′50″ E and latitude of 29°01′53″–33°6′47″ N), where the middle reaches of the Yangtze River are surrounded by Hunan, Jiangxi, Anhui, Henan, Shanxi and Chongqing. Hubei Province has a total area of 185,900 square kilometres with 24 cities, 39 counties and 40 districts. In 2017, the total population of Hubei Province was 59,020,000, of which the agricultural population accounted for 40.7%, while the regional GDP was approximately CNY 3,652,295 million with only 10.29% coming from agriculture. Hubei Province is the leading military area of the “rising of central China” strategy and is also an important food production area in China. Due to the rapid economic development in recent years, many environmental problems and serious losses of cultivated land have appeared in Hubei Province, which makes Hubei Province a good example to study the ecological compensation zoning of cultivated land and the interregional financial payment mechanism of cultivated land.
The population data, GDP data and other economic and social development data used in this study, such as the urbanisation rate and Engel coefficient, were obtained from the Hubei Statistical Yearbook 2018. The cultivated land production and consumption data were sourced from the Hubei Rural Statistical Yearbook 2018, including the planted crop area and the output and consumption of grain, oil, cotton, hemp, sugar, vegetables, fruits. The global average food production data were from the World Food and Agriculture Organization’s online database (http://www.fao.org/ last retrieved on 8 October 2020), and the relevant biological equivalence factor and yield factor were collected from the Working Guidebook to the National Footprint and Biocapacity Accounts (2018) published by the Global Footprint Network (http://www.footprintnetwork.org/ last retrieved on 5 November 2020). All the indicators in Equations (1)–(12) are listed in Table 1.

2.2. Methods

2.2.1. Modified Ecological Footprint Model of Cultivated Land

The cultivated land ecological footprint model included the cultivated land ecological footprint and the cultivated land ecological capacity that reflect the consumption and supply of cultivated land in the study area. Considering the difference in each biologically productive land area, there is a parameter called the equilibrium factor. Based on the equilibrium factor, the area of these types of biologically productive land can then be converted into an area of ecologically productive land, which is comparable worldwide [61]. In addition, the difference in the production capacities of the same biologically productive land among different regions cannot be ignored [62]. Therefore, a parameter named the yield factor was used to convert the same biologically productive land in different regions into a comparable area. The traditional ecological footprint is a commonly used indicator that quantifies human stress on the environment and is widely applied in sustainability assessments. It includes six types of accounts, namely, arable land, pasture, woodland, fishery, built-up land and fossil energy land. In this paper, the traditional ecological footprint model was modified by focusing on cultivated land, and the revised model was called the cultivated land ecological footprint model. The cultivated land ecological footprint was the total area of cultivated land required to maintain the consumption of economic or population resources and to absorb the man-made waste related to cultivated land [63]. The cultivated land ecological capacity is defined as the ability of available cultivated land resources to sustain human activities [64], and it can be calculated by multiplying the biologically productive cultivated land areas in the zone by the yield factor and equilibrium factor, which represents the natural capital flow of the area. The calculation method is shown as follows:
E F c = N × e f c = N × r j × i = 1 n ( a a i ) = N × r j × i = 1 n ( c i / p i ) ,
E C c = N × e c c = N × b j × r j × y j ,
Here, E F c represents the total amount of cultivated land’s ecological footprint in the target area, E C c represents the total cultivated land ecological carrying capacity of a region, the calculation unit is global hectare, expressed as gha, e f c is the ecological footprint generated by the per capita cultivated land, e c c is the per capita cultivated land carrying capacity, where c indicates cultivated land. N is the population size, i is the type of consumer commodities, j is the type of biologically productive land and stands for cultivated land in this study, a a i is the area of agricultural productive land converted from the i-th consumer commodity, c i is the mean agricultural production required when the per capita consumption is i, p i is the world average production capacity of the i-th consumer commodity (the values and units of c i and p i for all districts are listed in Table 2), b j is the per capita area of cultivated land, r j is the equilibrium factor and y j is the yield factor.
The following data were from the working guidebook to the national footprint and biocapacity accounts (2018) (http://www.footprintnetwork.org/). When j represents cultivated land, r j is 2.52, and y j is 1.28. According to “Our Common Future” of the World Commission on Environment and Development, it is suggested that 12% of the productive land area must be conserved to protect biodiversity in the ecological carrying calculation [64,65]. Based on the Hubei Provincial Statistical Yearbook, the area of cultivated land in Hubei Province accounts for approximately 30% of the total land area. Because this paper studies the ecosystem of cultivated land, the data (12%) were revised to 3.5% [4,66].

2.2.2. Measuring Model of the Ecological Service Value for Cultivated Land

In 1997, Costanza [67] conducted a quantitative estimation to divide ecosystems into different types. According to the actual situation in China, Xie et al. [68] revised the equivalent value per unit area of ecosystem services provided by cultivated land in China (Table 3). We used Xie’s definition in setting the equivalent coefficient of the ecosystem service value per unit area to be equal to the value of natural food production per hectare per year, i.e., one-seventh of the value of actual food production. Combined with the latest chart of ecosystem service value proposed by Xie in 2008 and the economic value per unit of cultivated land in each county in Hubei Province, the equivalent value of the cultivated land ecosystem was calculated, and the ecosystem service value per unit area of cultivated land was revised. The market part of ecosystem service value refers to the exchange price of a certain ecosystem service under the market mechanism, such as the provision of food and raw materials; the nonmarket part of ecosystem service value refers to value that is extremely important to humans but that cannot be reflected under the market mechanism such as regulating service value, supporting service value and cultural service value. The market part of ecosystem service value refers to the exchange price of a certain ecosystem service under the market mechanism, such as the provision of food and raw materials; the nonmarket part of ecosystem service value refers to value that is extremely important to humans but that cannot be reflected under the market mechanism such as regulating service value, supporting service value and cultural service value. The specific equation is as follows:
ESV = F × Ea × S ,
E a = 1 7 i = 1 n m i × v i × q i M ,
Here, ESV means the ecosystem value (CNY), Ea is the ecosystem service value per unit area (CNY/ha) and F is the equivalent coefficients of the ecosystem service value units for cultivated land. According to existing studies [25,69], the market part and nonmarket part of ecosystem service value were divided as follows, as shown in Table 3, and for the total ecological service value, the market value and nonmarket value, F was 7.9, 1.39 and 6.51, respectively. S is the cultivated land area of the county (ha), 1/7 is one-seventh of the nonhuman labour inputs, which indicates that the value of natural ecosystem services was one-seventh of the food production and economic value provided by existing cultivated land [70,71], n is the number of food crops, i is the specific type of each food crop that mainly includes wheat, corn, rice, beans, etc., mi is the i-th food crop planting area of food crops (ha), vi is the national average price of the i-th food crop (CNY/kg), qi is the unit area yield of the i-th food crop (kg/ha) and M is the total planting area of the n food crop (ha).

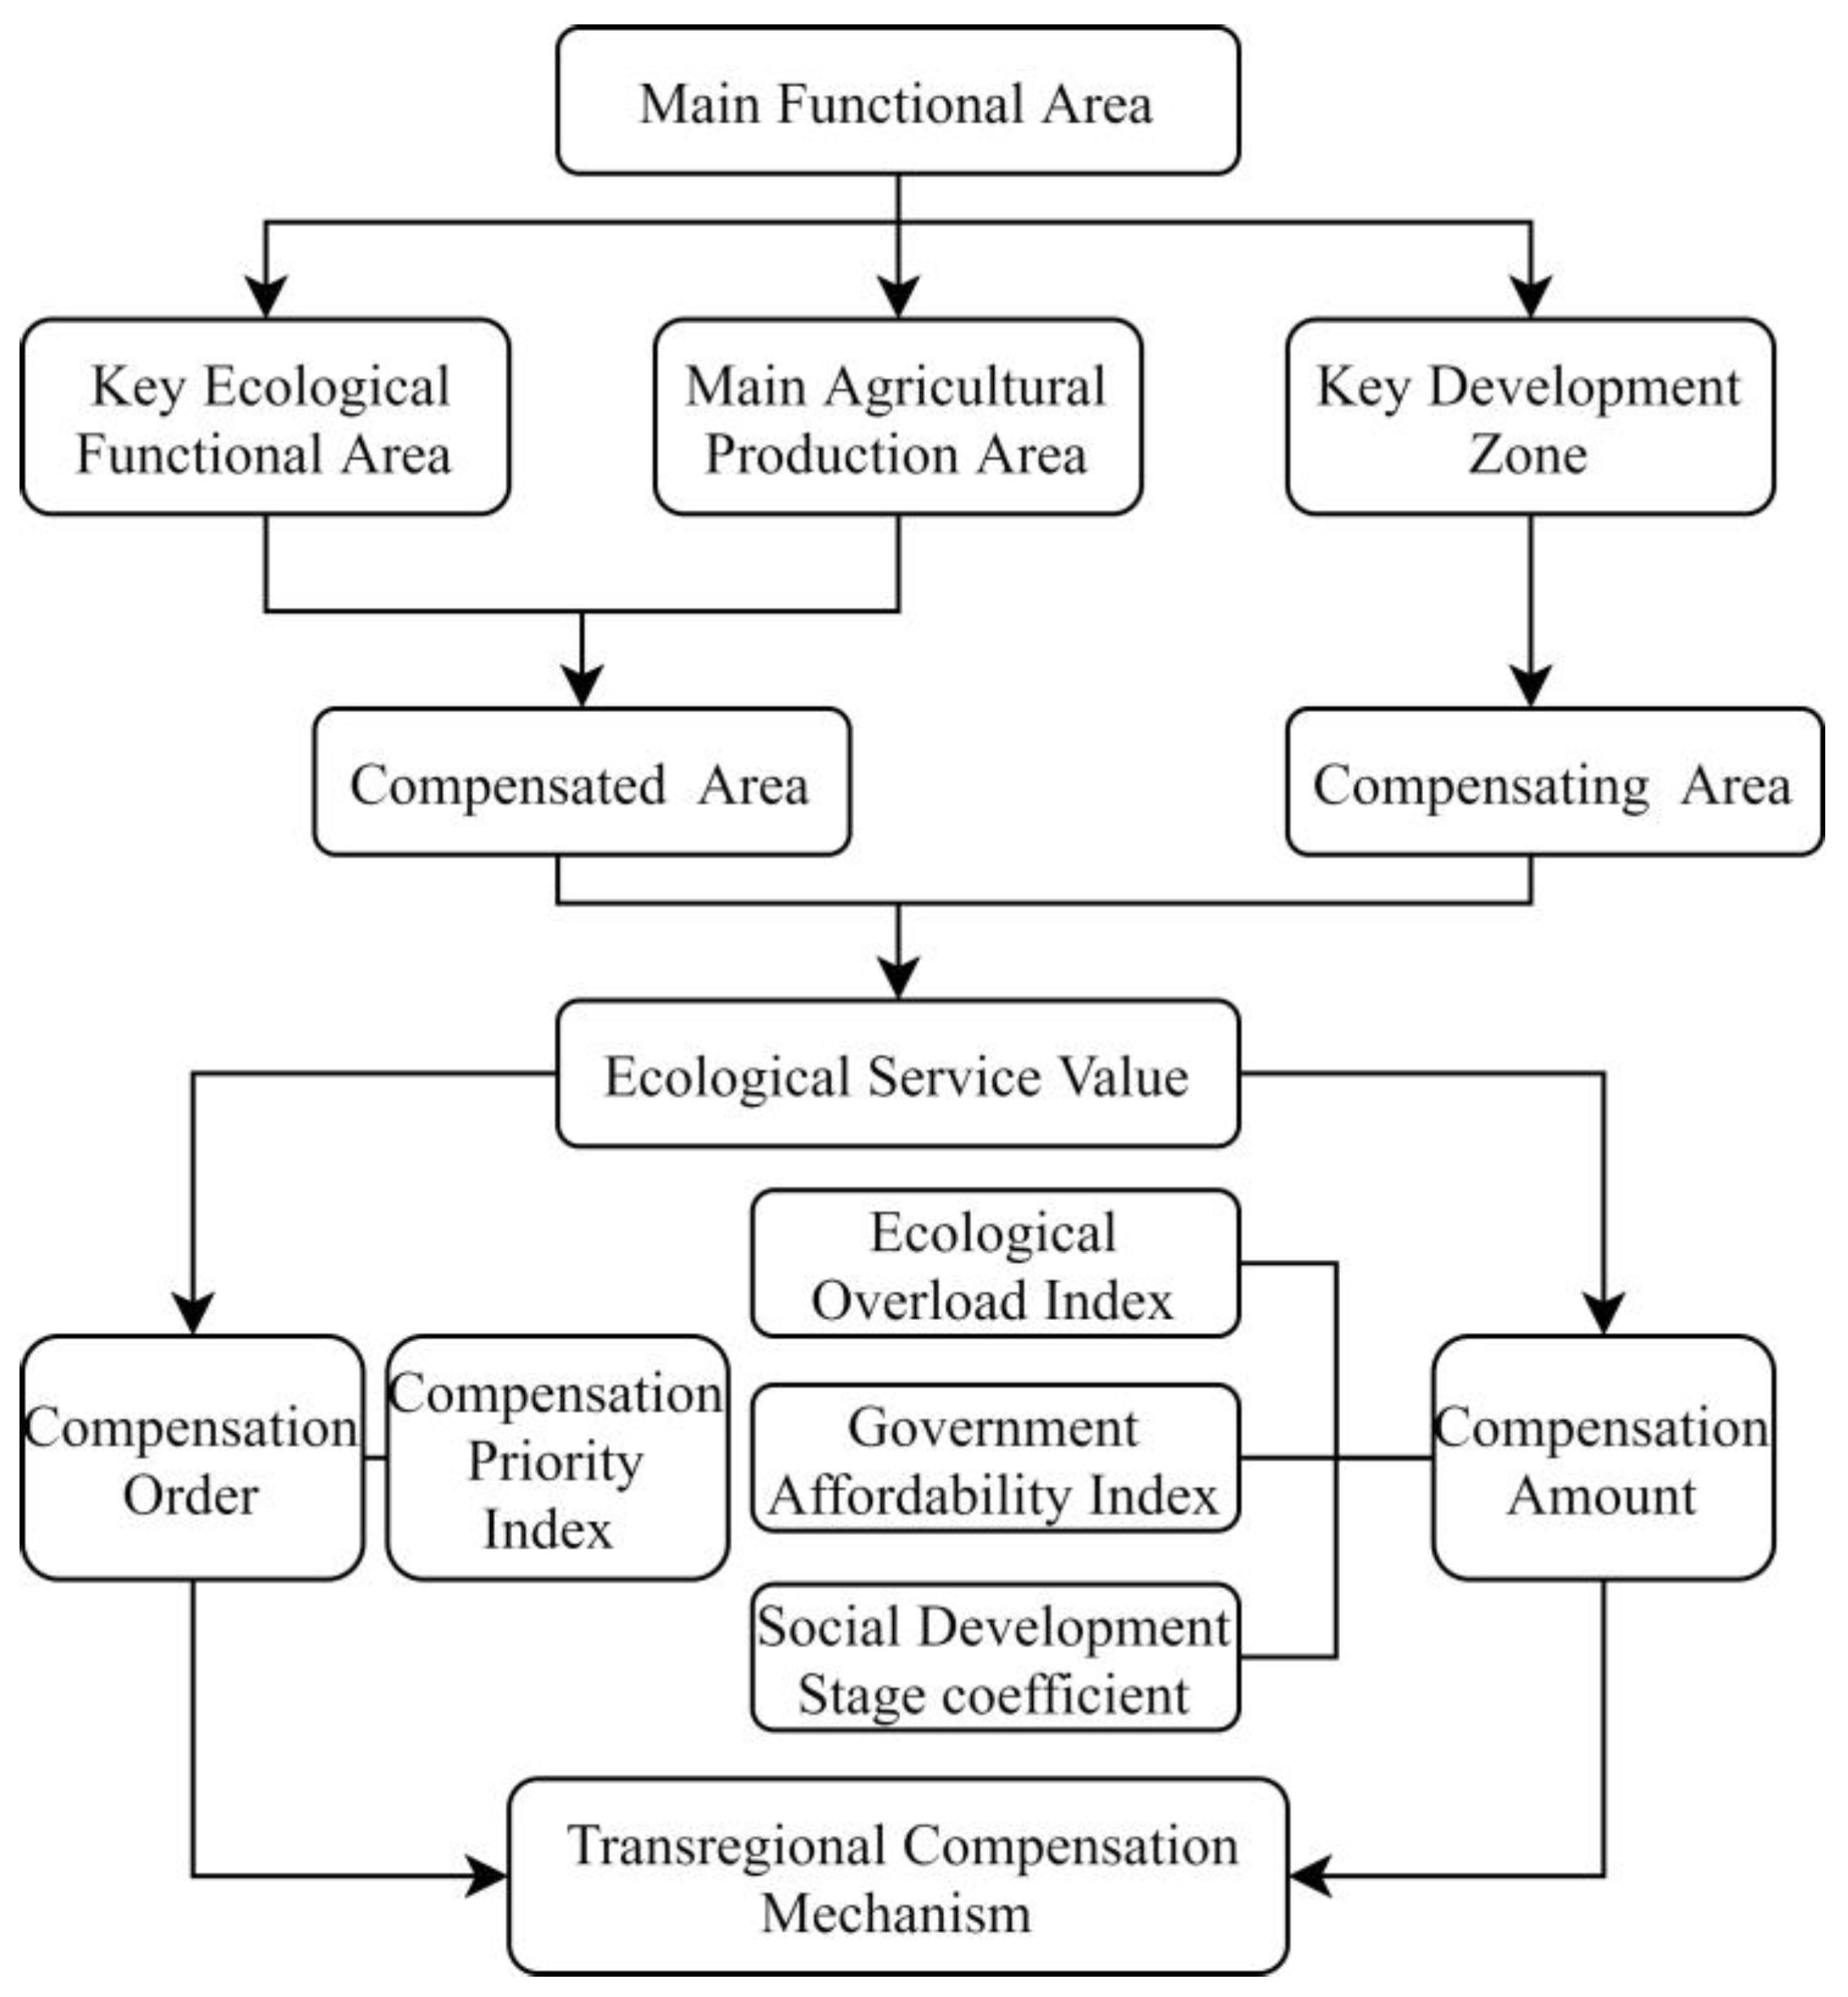
2.2.3. Determining Ecological Compensation Prioritization and Zoning for Cultivated Land

A compensated area indicates that a region in a state of ecological surplus. It produces more cultivated land’s ecological services than it consumes, it provides cultivated land services to other territories, and suffers economic losses from the farmland protection policy. Therefore, it should receive horizontal cultivated land’s ecological payment. By contrast, a compensating area indicates that a region that is in a state of ecological deficit, and that the region consumes more cultivated land services than it can produce from its cultivated land resource base. Therefore, it should transfer the cultivated land ecological payment to other areas [39]. According to the theory of special sacrifice in legal compensation theory, a compensation problem arises only when a special sacrifice is made [72]. Due to the different levels of regional economic development, the most intuitive idea is to arrange the sequence of ecological compensation based on the GDP of different regions. It is less urgently necessary for regions with a high level of development to obtain ecological compensation compared to those with a low level of development. The market value of ecosystem services has been converted into money through market mechanisms, contributing to regional production. Therefore, in determining the amount of ecological compensation, the ecosystem service value of this part should be abandoned, and only the nonmarket value part should be taken into account. Taking this factor into full consideration, this paper delineates the priority of ecological compensation. The ratio of the nonmarket value of ecosystem services per unit area and GDP per unit area in a certain region is used to represent the priority of ecological compensation in different regions [69].
Based on the plan for the main functional areas of Hubei Province (Figure 1) (http://www.hubei.gov.cn/ last retrieved on 20 November 2020), key ecological functional areas and main agricultural production areas are restricted development areas. The main function of a key ecological functional area is the ecological environment value, in which the area’s own development rights are largely sacrificed to ensure the quantity and quality of ecological products and services provided to areas outside this area. The main function of the main production area of agricultural products is the value of food security. To ensure the security of the national food supply, large-scale, high-intensity industrialisation and urbanisation development in main agricultural production areas are restricted. Therefore, compensation should be received for key ecological functional areas and main agricultural production areas. The main function of a key development zone is to develop the economy and agglomerate the population, towns and industries. It is the main input area for ecological services. As an area that prioritizes economic development and rapid economic growth, it is responsible for helping key ecological functional areas and main agricultural production areas. Therefore, a key development zone has the duty to pay compensation. Thus, this study set 30 key ecological function areas and 29 major agricultural production areas in Hubei Province as ecological compensated areas and set 30 key development zones as compensating areas.
On the basis of the main functional regionalization of Hubei Province, this paper puts forward a compensation priority index of cultivated land protection to measure the compensation order of the key ecological functional zones and the main production areas of agricultural products and the payment order of the counties in the key development area. The specific equation is as follows:
I N D d = E S V d n m G D P d ,
where I N D d is the priority index of cultivated land compensation in county d. When its value is larger, the demand is more urgent for economic compensation, and this compensation should be given priority. E S V d n m is the nonmarket value of the cultivated land in county d, E S V d m is the market value of the cultivated land in county d, and G D P d is the gross domestic product of region d.

2.2.4. Ecological Compensation Model of Cultivated Land

The methods used to determine the amount of cross-regional financial payment for cultivated land mainly included the following three indicators: (i) the cultivated land’s ecological service value at the county district scale; (ii) an indicator that reflected the degree of stress imposed on the regional cultivated land ecosystem caused by socioeconomic activities; and (iii) the economic and social development level and local government affordability. Among them, the market part of the ecosystem’s service value was directly converted into currency in the operation of the market mechanism, which contributed to regional economic and social development. Therefore, only the nonmarket part was considered when determining the priority of ecological compensation and the compensation payment. Therefore, for each district, the cultivated land’s transregional fiscal payment can be written as follows:
P d = E S V d n m × R d × G d × Q d ,
R d = 1 1 + e t d ,
t d = E n d = E a d × θ d + E b d × ( 1 θ d ) ,
G d = G D P d G D P ,
Q d = E F d E C d E C d ,
Here, P d is the amount of the cultivated land’s transregional fiscal payment in county d, E S V d n m is the cultivated land’s ecological service nonmarket value of county d, E S V d m is the cultivated land’s ecological service market value of county d, and the adjustment indicators are Q d , R d and G d , which refer to the ecological overload index, social development stage coefficient and local government affordability index, respectively. When Q d = 0, this indicates that the district brings the demand and supply of cultivated land ecological services into balance. When Q d < 0, this indicates that the region is in a state of serious ecological overload and needs to occupy more value for ecological services in other areas. When Q d > 0, the area is in a state of ecological surplus, which can provide more ecological service value to other areas. R d ∈ (0,1), and one is the maximum value, which indicates that the ecological compensation payment capacity is in the extremely rich stage. In Equation (8), θ is the urbanisation level, Ea and Eb are the Engel coefficients of urban and rural residents in the study area, respectively, and En is the comprehensive Engel coefficient. G D P d represents the local per capita GDP (CNY), and GDP represents the national per capita GDP (CNY).

3. Results

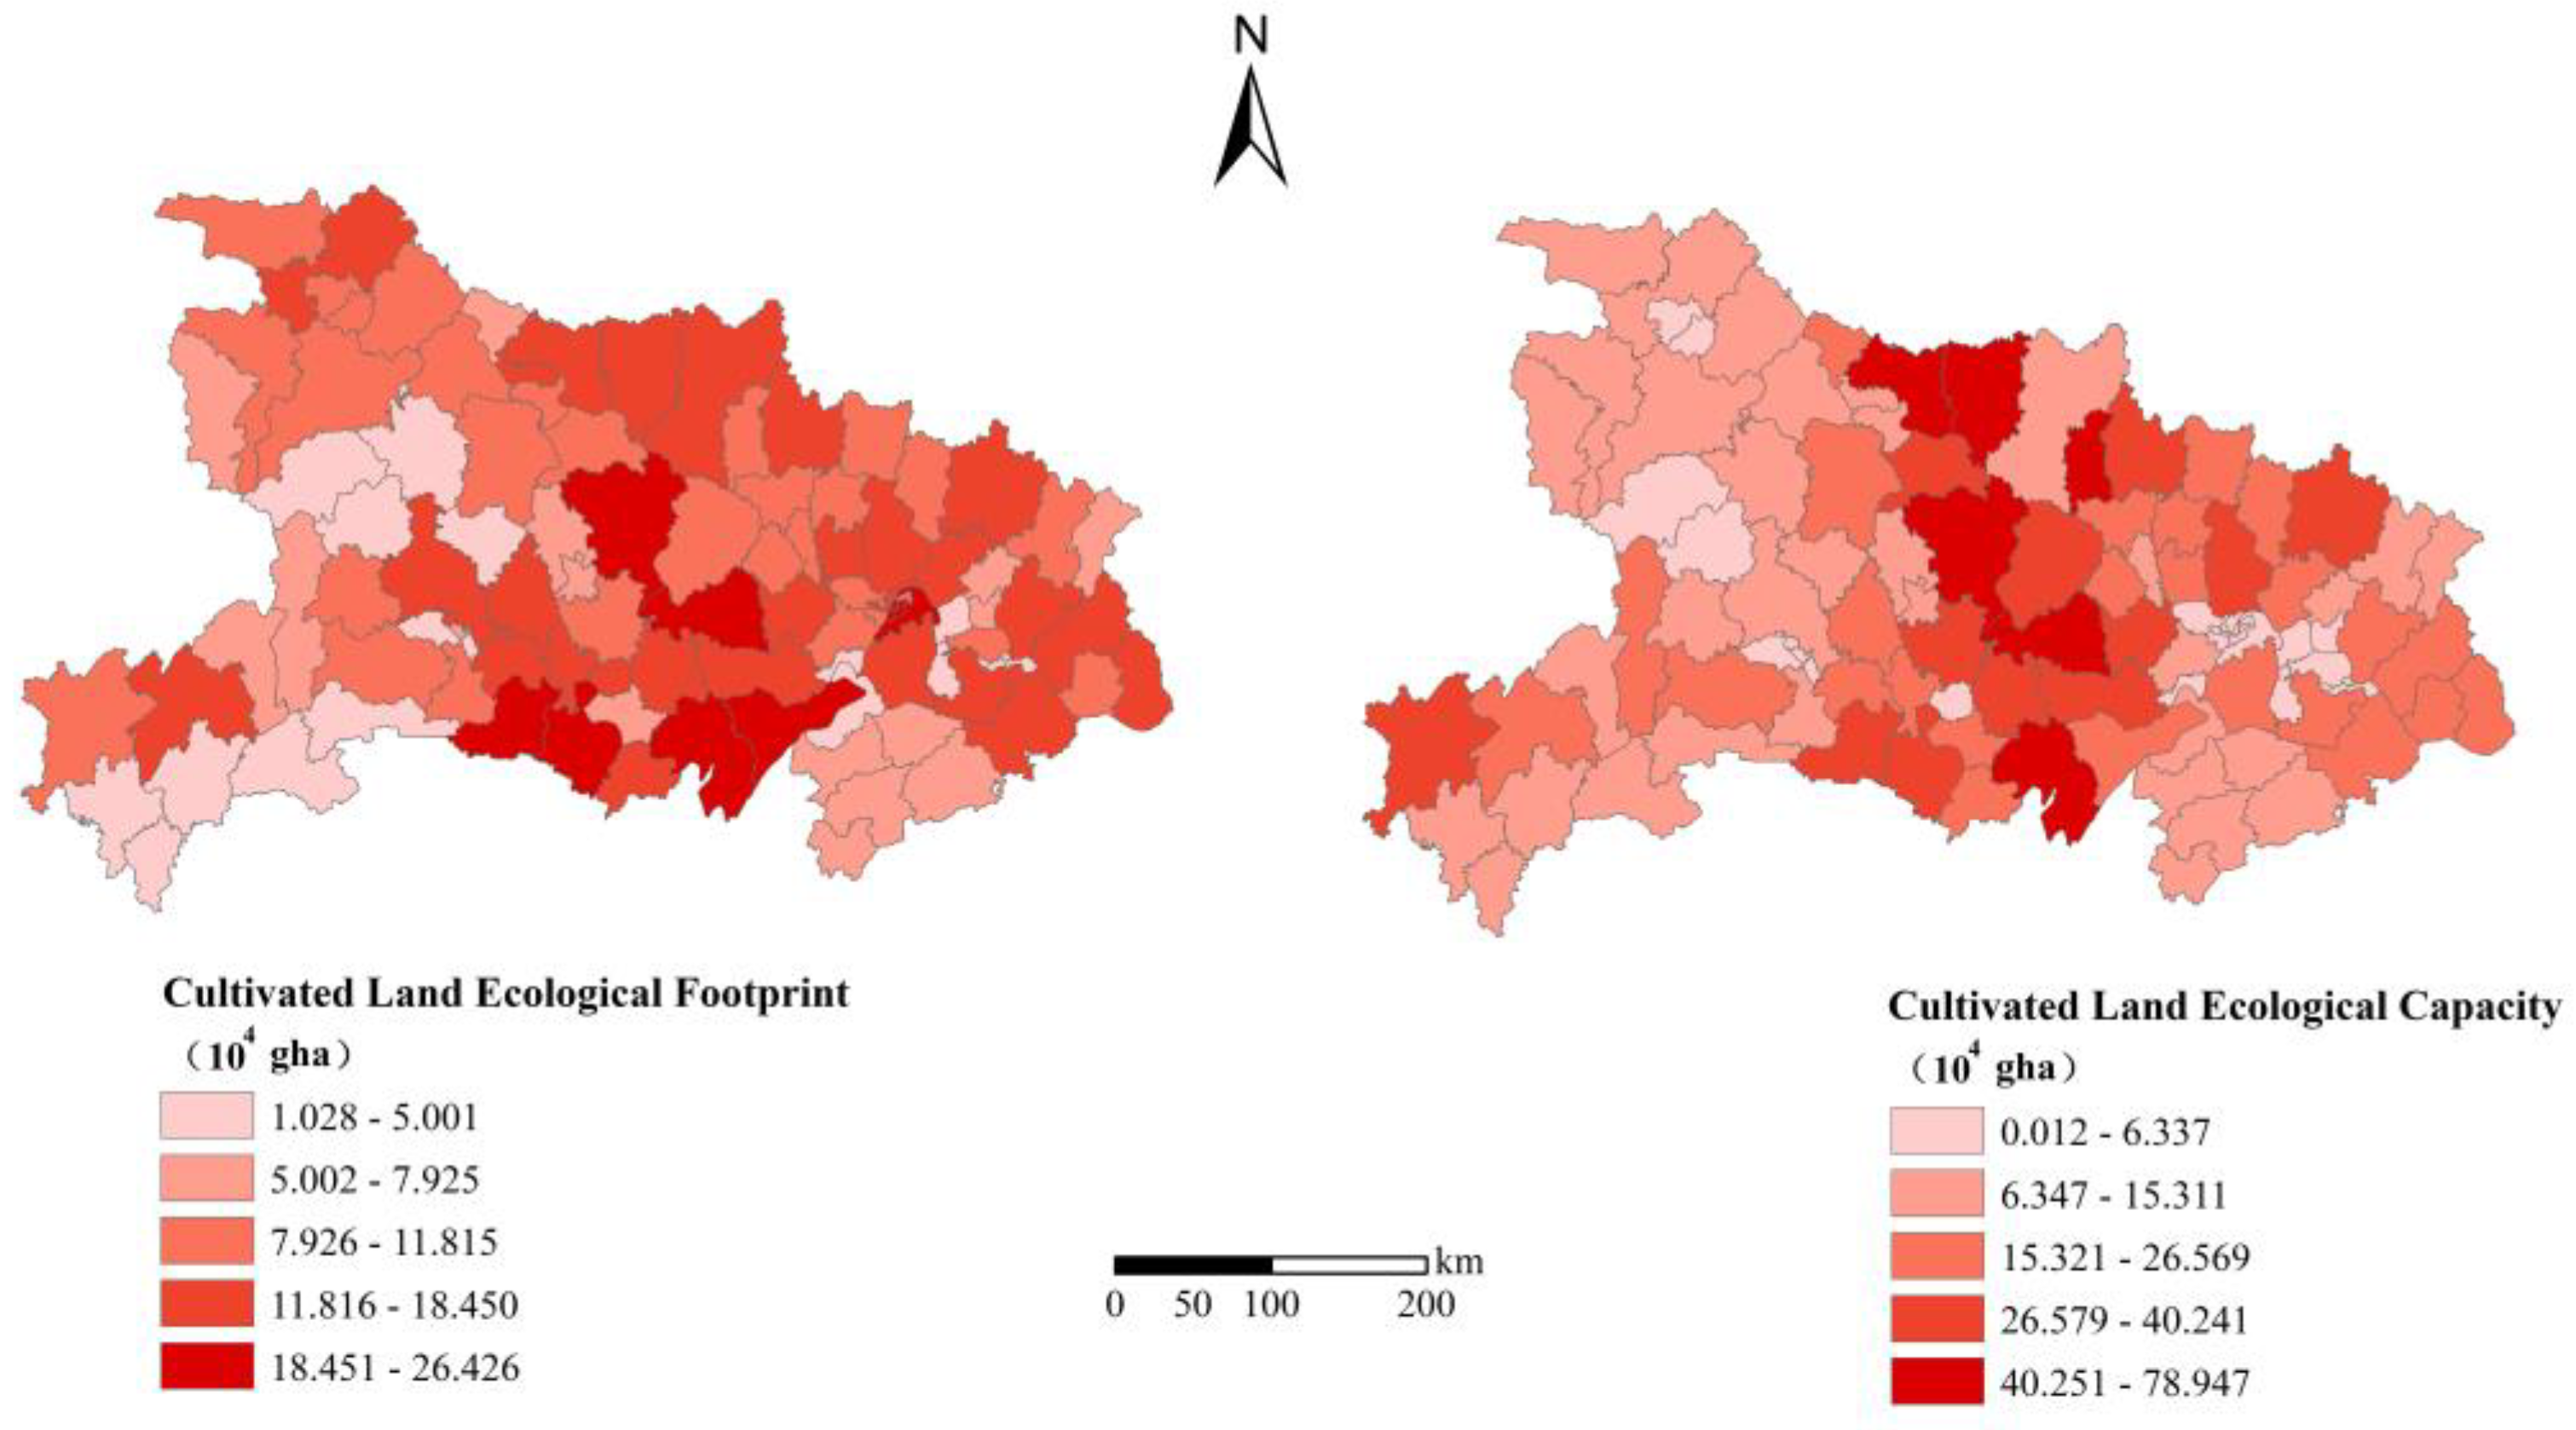
3.1. Ecological Footprint and Ecological Capacity of Cultivated Land in Hubei Province

A disparity of economic development among regions will lead to differences in ecological status. The cultivated land ecological footprints and cultivated land ecological capacities of the 103 districts in Hubei Province were calculated using Formulas (1) and (2), and there were significant spatial differences in the sizes of the cultivated land ecological footprints and ecological capacities among the 103 regions (Figure 3). The total cultivated land’s ecological footprint was 1078.73 × 104 gha in 2017. The highest cultivated land’s ecological footprint was observed in Hongshan with a value of 26.43 × 10⁴ gha, and the lowest cultivated land’s ecological footprint was observed in Tieshan with a value of 1.02 × 10⁴ gha. Overall, the ecological footprint of the eastern counties of Hubei Province was obviously higher than the ecological footprint of the western counties. This result was mainly influenced by two factors. On the one hand, the eastern part of Hubei Province is mainly composed of the Wuhan urban agglomeration. Its GDP in 2017 was CNY 2260.8 billion, which accounted for 63.7% of the total GDP of Hubei Province, and it is the core area of Hubei Province’s economic development. On the other hand, the permanent resident population of the Wuhan urban agglomeration was 31.62 million persons, which accounts for 53.6% of the total permanent resident population of Hubei Province. The distribution of the ecological footprint was positively correlated with the population scale and economic scale.
There were also spatial differences in the cultivated land ecological capacity values in Hubei Province. The total cultivated land ecological capacity was 1684.41 × 104 gha in 2017; Zengdu had the highest cultivated land’s ecological capacity value (78.95 × 10⁴ gha), and Huangshigang had the lowest cultivated land’s ecological capacity value (124 ha). The ecological carrying capacity of the central areas in Wuhan and Yichang were very small or even 0; therefore, the districts in the city centre were merged into Wuhan centre and Yichang centre. Moreover, the cultivated land’s ecological capacity ratios that accounted for >2%, 1–2% and <1% were 13, 25 and 65 districts, respectively. The cultivated land’s ecological capacity was shown to be higher in the central region of Hubei Province and lower in the eastern and western regions. According to the main functional area planning, the central region of Hubei was the main production area of agricultural products. Therefore, the cultivated land’s ecological carrying capacity in central Hubei Province was relatively high. With the development of the social economy, the demand for cultivated land resources in Hubei Province has exceeded the carrying capacity of cultivated land, and the insecure state of cultivated land utilisation has become more significant every year. The cultivated land ecological deficit of Hubei Province was relatively significant and was mainly distributed in the central areas with good economic development in each city. The total cultivated land ecological deficit of Hubei Province was 171.50 × 10⁴ gha, and Hongshan had the largest cultivated land ecological deficit, which was 23.67 × 10⁴ gha. The lowest cultivated land ecological deficit was observed in Tieshan with a value of 1.02 × 10⁴ gha. Thus, it can be seen that the ecological environment and regional economic development in Hubei Province are not balanced, and the implementation of an ecological compensation policy in Hubei Province is an effective way to alleviate the ecological pressure.

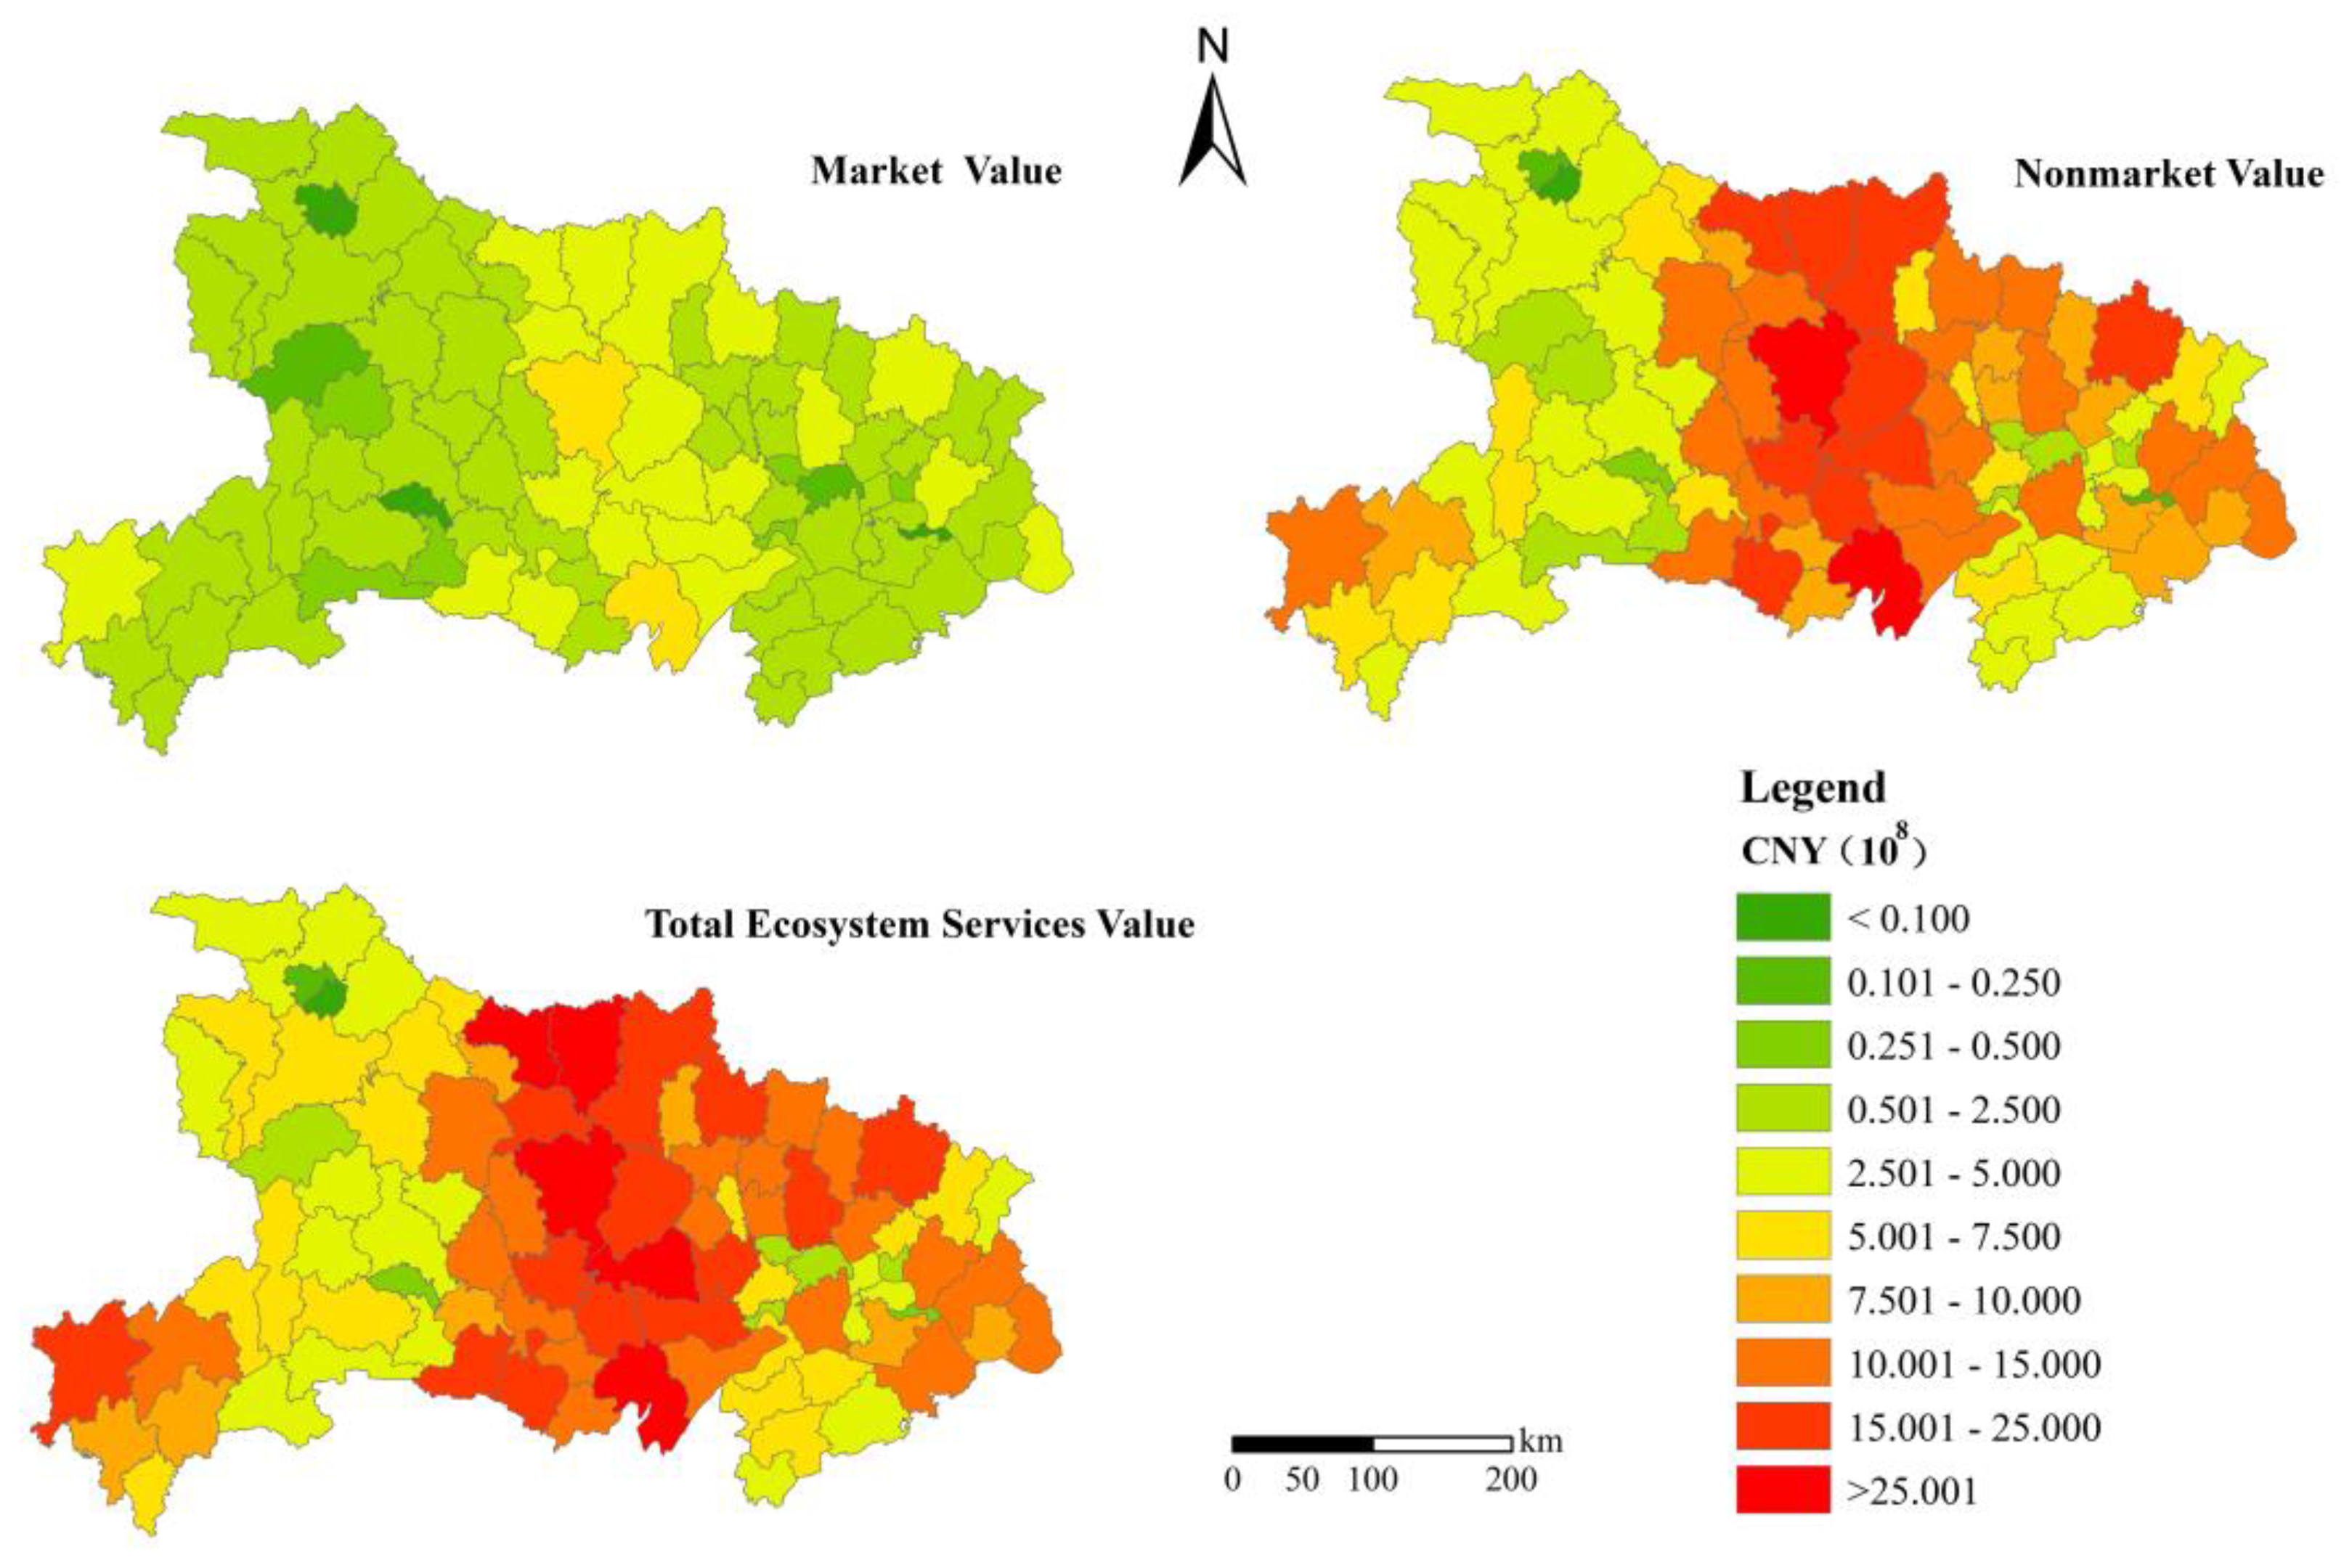
3.2. Regional Differentiation in the Ecological Service Value of Cultivated Land in Hubei Province

This study divided the main crops of the 103 counties in Hubei Province into rice, wheat, corn, soybean, oil, cotton, tobacco and sugar. First, according to Equation (3), the sown area, unit price, yield and output value of the main crops in each county were used to calculate the ecosystem service value (Ea) per unit area of cultivated land in each county. Second, we obtained the cultivated land ecological service total value, market value and nonmarket value of the 103 districts in Hubei Province using Equations (3) and (4). The natural breakpoint classification method of the ArcGIS software was used to conduct a cluster analysis on the ecosystem service value of 103 counties (cities and districts), and the specific results are shown in Figure 4. The total values of ecosystem services, market value and nonmarket value of Hubei Province were similar in their spatial distribution. The central region of Hubei Province had a higher cultivated land ecological service value, while the western and eastern regions had a lower cultivated land ecological service value. The total cultivated land ecological service value (CESV) of Hubei Province was CNY 728.68 × 10⁸ in 2017, in which Jianli had the highest CESV value (CNY 32.85 × 10⁸), and Maojian had the lowest CESV value (CNY 0.06 × 10⁸). The high-value areas of CESV were mostly concentrated in the main agricultural production areas of Hubei Province such as Jianli, Zhongxiang, Xiangzhou, Zaoyang and Suixian. These counties were typically high-“ecological export” areas. The low-value areas of CESV were mostly concentrated in the key development zones and the key ecological functional areas of Hubei Province such as the central area of Wuhan, the central area of Huangshi City, the central area of Yichang, Maojian District, Zhangwan District and Huangzhou District. The western part of Hubei Province was the key ecological function area, and the value of cultivated land’s ecological services was relatively low due to the lack of cultivated land resources. The key development zone was mainly the core area of the Wuhan urban agglomeration, which has a dense population and economy. This area is important for resource development and heavy industrial production in Hubei Province, and it was a typical high-“ecological consumption” area.

3.3. Priorities and Amounts of Ecological Compensation Payments for Cultivated Land in Different Main Functional Areas

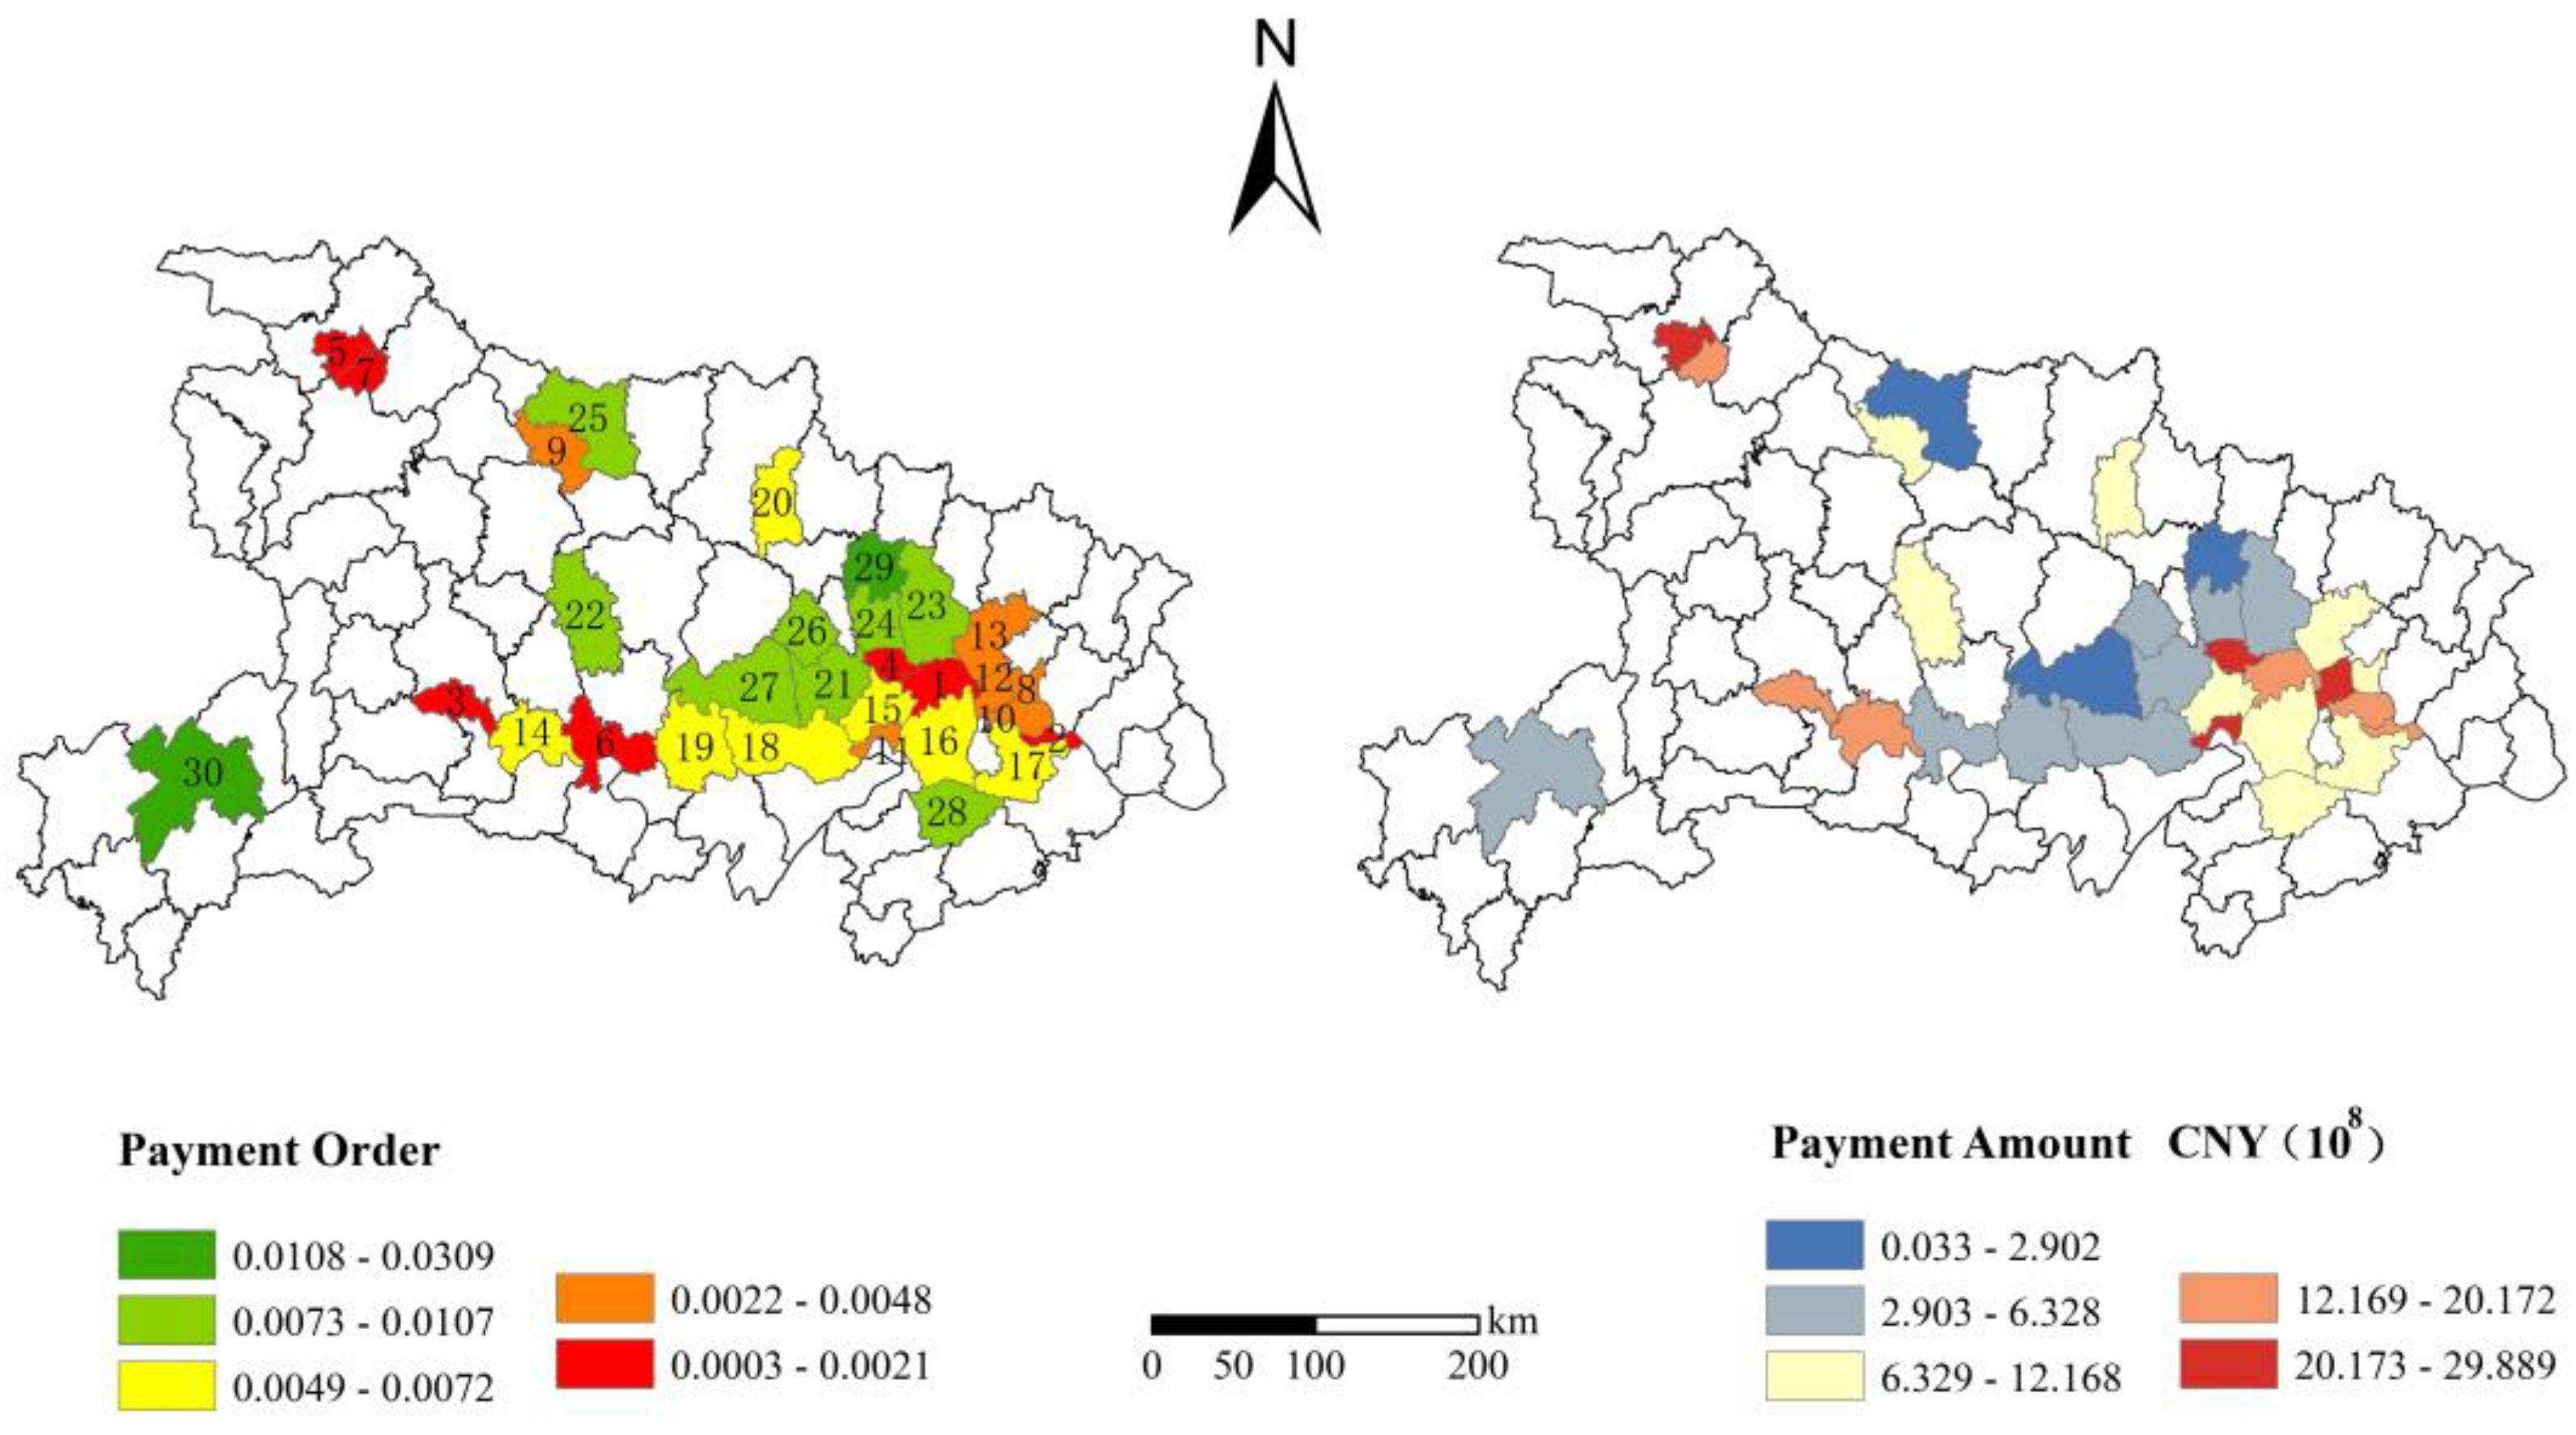
  • (1) Key development area
According to Formulas (5) and (6), the cultivated land’s ecological payment order and amount of the key development zones in Hubei Province were calculated, and the spatial distribution is shown in Figure 5. According to Figure 5, it can be seen that the payment priorities of the 30 key development zones are generally divided into five levels. The top five counties for the payment amount were Zhangwan (CNY 29.89 × 10⁸), Dongxihu (CNY 26.14 × 10⁸), the main urban area of Wuhan (CNY 20.17 × 10⁸), the main urban area of Yichang (CNY 20.06 × 10⁸) and the main urban area of Huangshi (CNY 19.60 × 10⁸), and the bottom five counties were Qianjiang (CNY 3.99 × 10⁸), Enshi (CNY 3.89 × 10⁸), Xiaochang (CNY 2.90 × 10⁸), Tianmen (CNY 0.78 × 10⁸) and Xiangzhou (CNY 0.03 × 10⁸).
It can be seen that the key development zones at the national level (such as the main urban area of Wuhan) should pay more than the key development zones at the provincial level (such as Enshi). This is closely related to the social and economic development of the key development zones. The Wuhan urban agglomeration in eastern Hubei Province is a key development zone at the national level and an important comprehensive transportation hub. With the rapid economic development, it has become a priority ecological compensating area. The cultivated land in the western part of the Jianghan Plain and its northern area have a higher value of ecosystem services, and the order of ecological payment is after the eastern region. Enshi, in Western Hubei, is an important green industry base and a cultural ecotourism base in the province. Since its economic development is lower in the 30 key development zones, the order of ecological payment is also later.
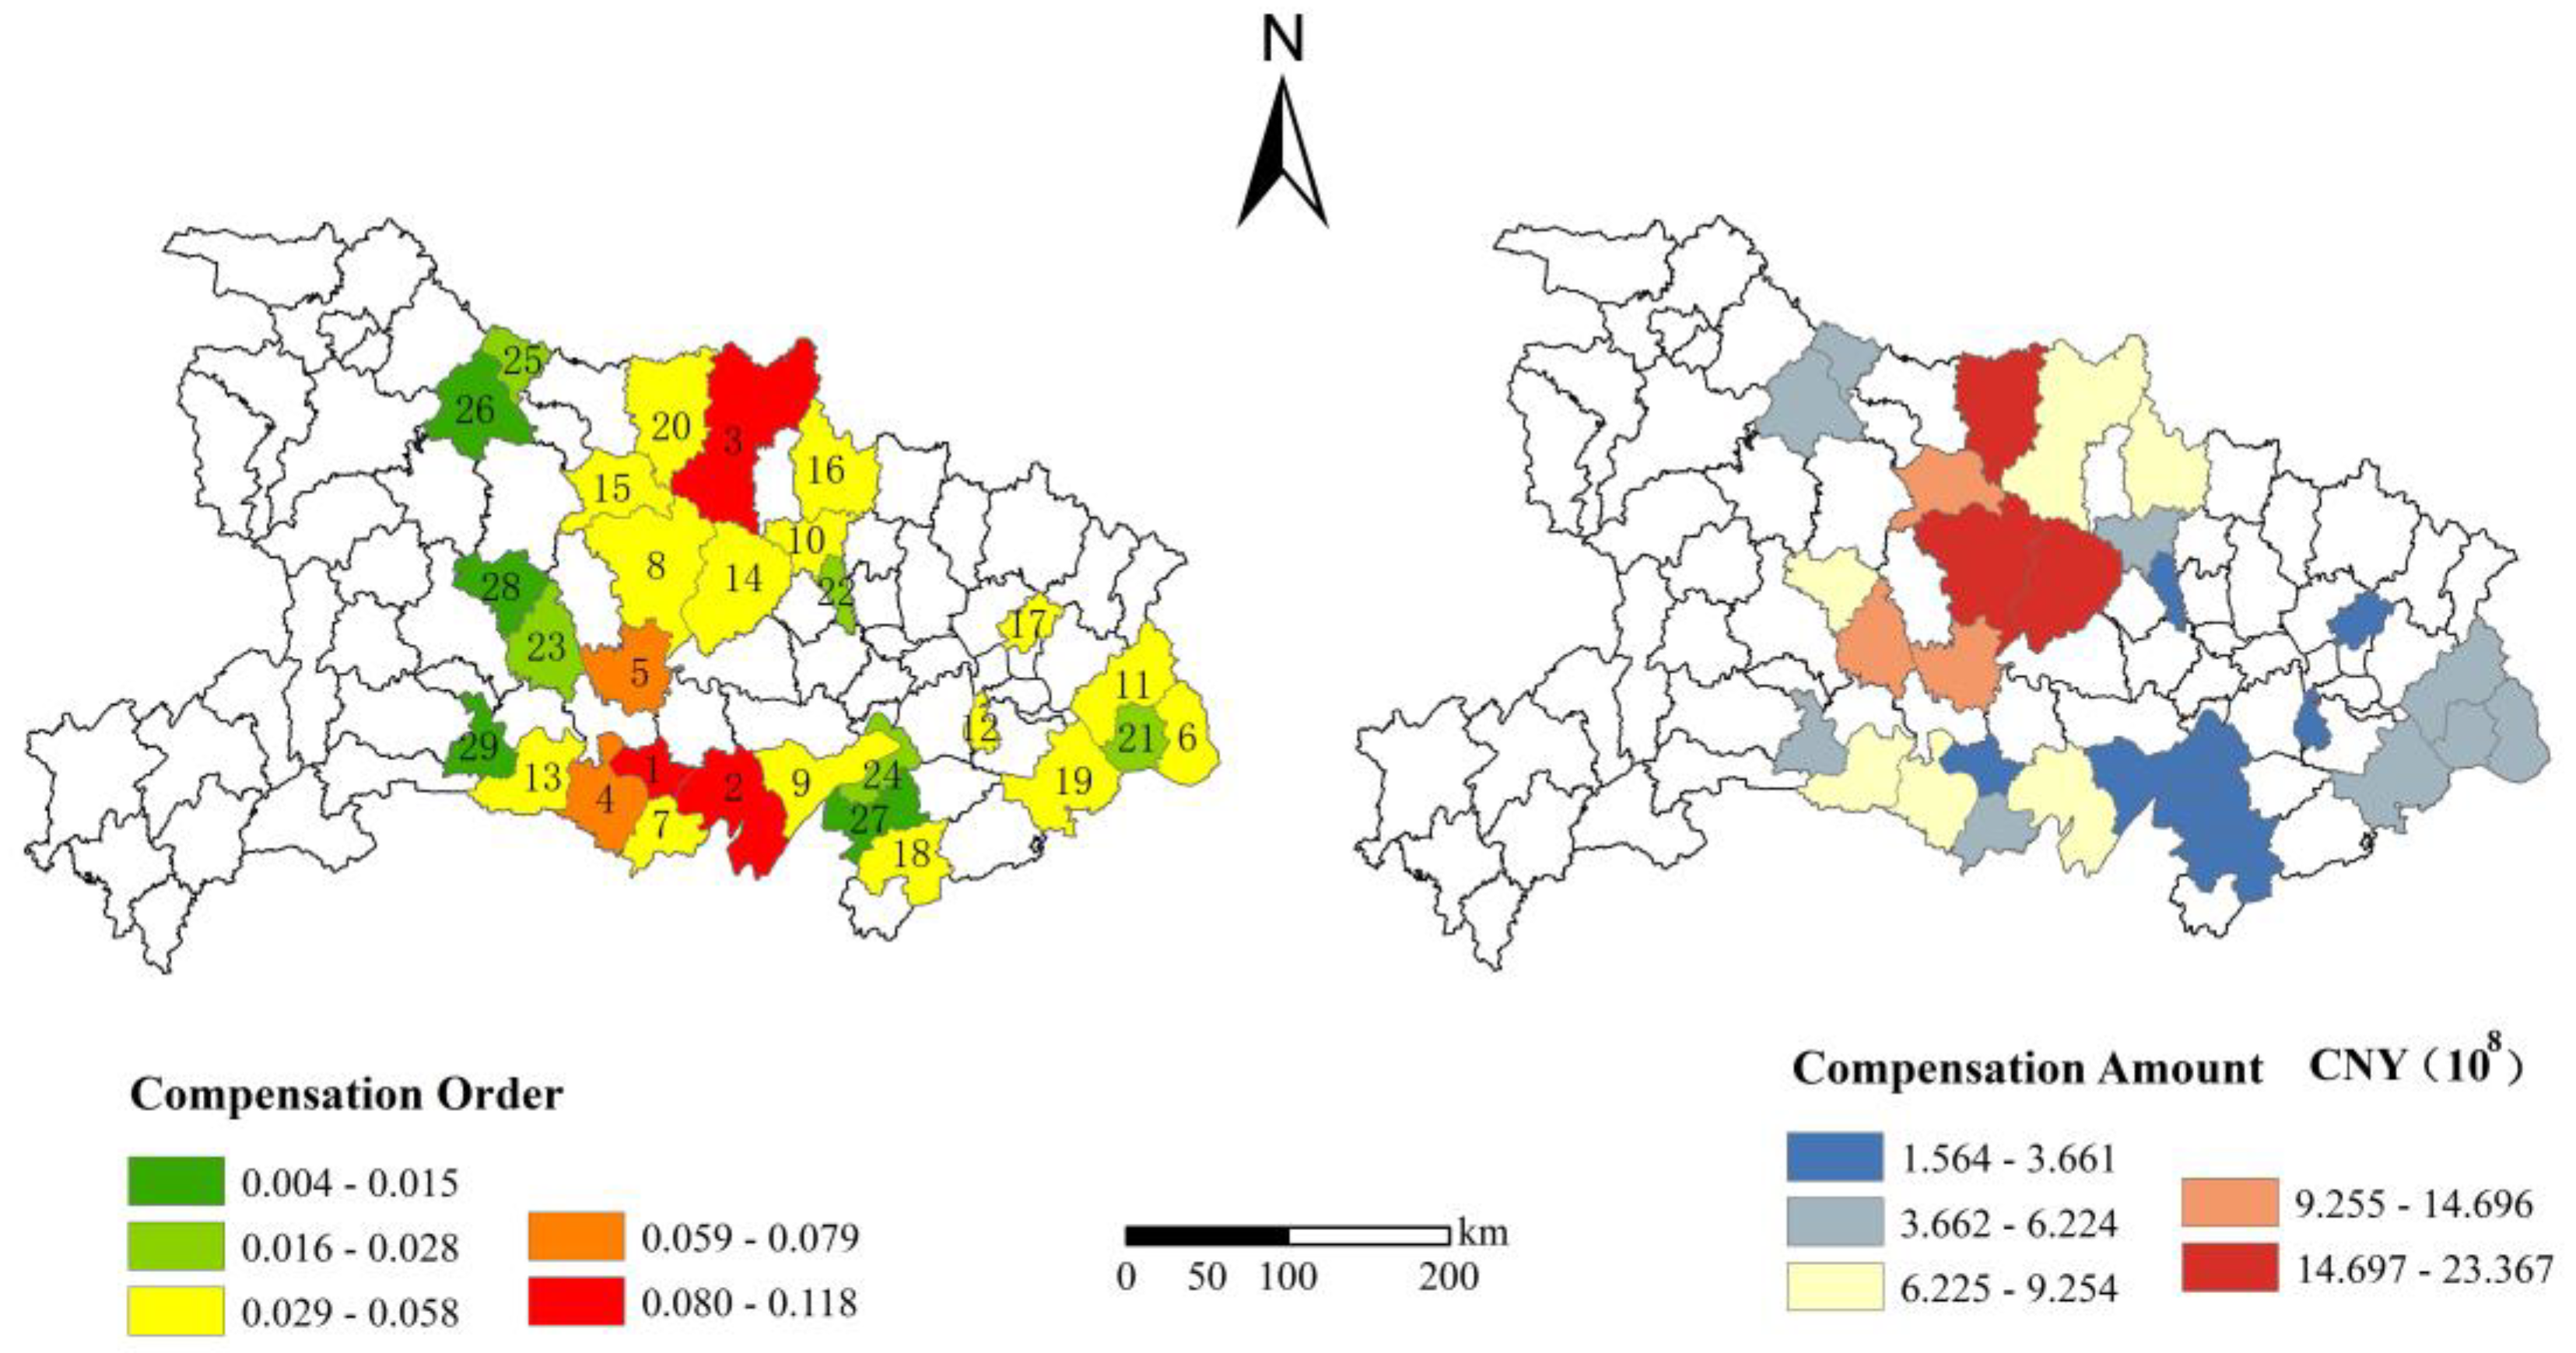
  • (2) Main agricultural production area
According to Formulas (5) and (6), the cultivated land compensation order and amount of the major production regions in Hubei Province were calculated, and the spatial distribution is shown in Figure 6. According to Figure 6, it can be seen that the priority of ecological compensation in the 29 main agricultural production areas is divided into five levels. The top five counties for the compensation amount were Zhongxiang (CNY 23.37 × 10⁸), Zaoyang (CNY 17.17 × 10⁸), Jingshan (CNY 16.95 × 10⁸), Dangyang (CNY 14.30 × 10⁸) and Yicheng (CNY 12.70 × 10⁸), and the bottom five counties were Liangzihu (CNY 2.84 × 10⁸), Chongyang (CNY 2.02 × 10⁸), Honghu (CNY 2.90 × 10⁸), Yunmeng (CNY 0.78 × 10⁸) and Jiayu (CNY 0.03 × 10⁸).
Jiangling, Jianli and Sui counties belong to areas with higher nonmarket values of ecosystem services per unit area and have lower GDP values; thus, their ecological compensation priority is the highest. Most of the 29 major agricultural production areas are old revolutionary base areas, and Yangxin and Qichun counties are national-level poor counties. To ensure the security of the national food supply and restrict large-scale, high-intensity industrialisation and urbanisation development, these counties have lost opportunities for rapid economic development. In the practice of ecological compensation, sufficient attention should be paid and reasonable compensation should be given to them to protect cultivated land, stabilise grain production and supply, vigorously develop modern agriculture, help in targeted poverty alleviation and promote rural revitalisation.
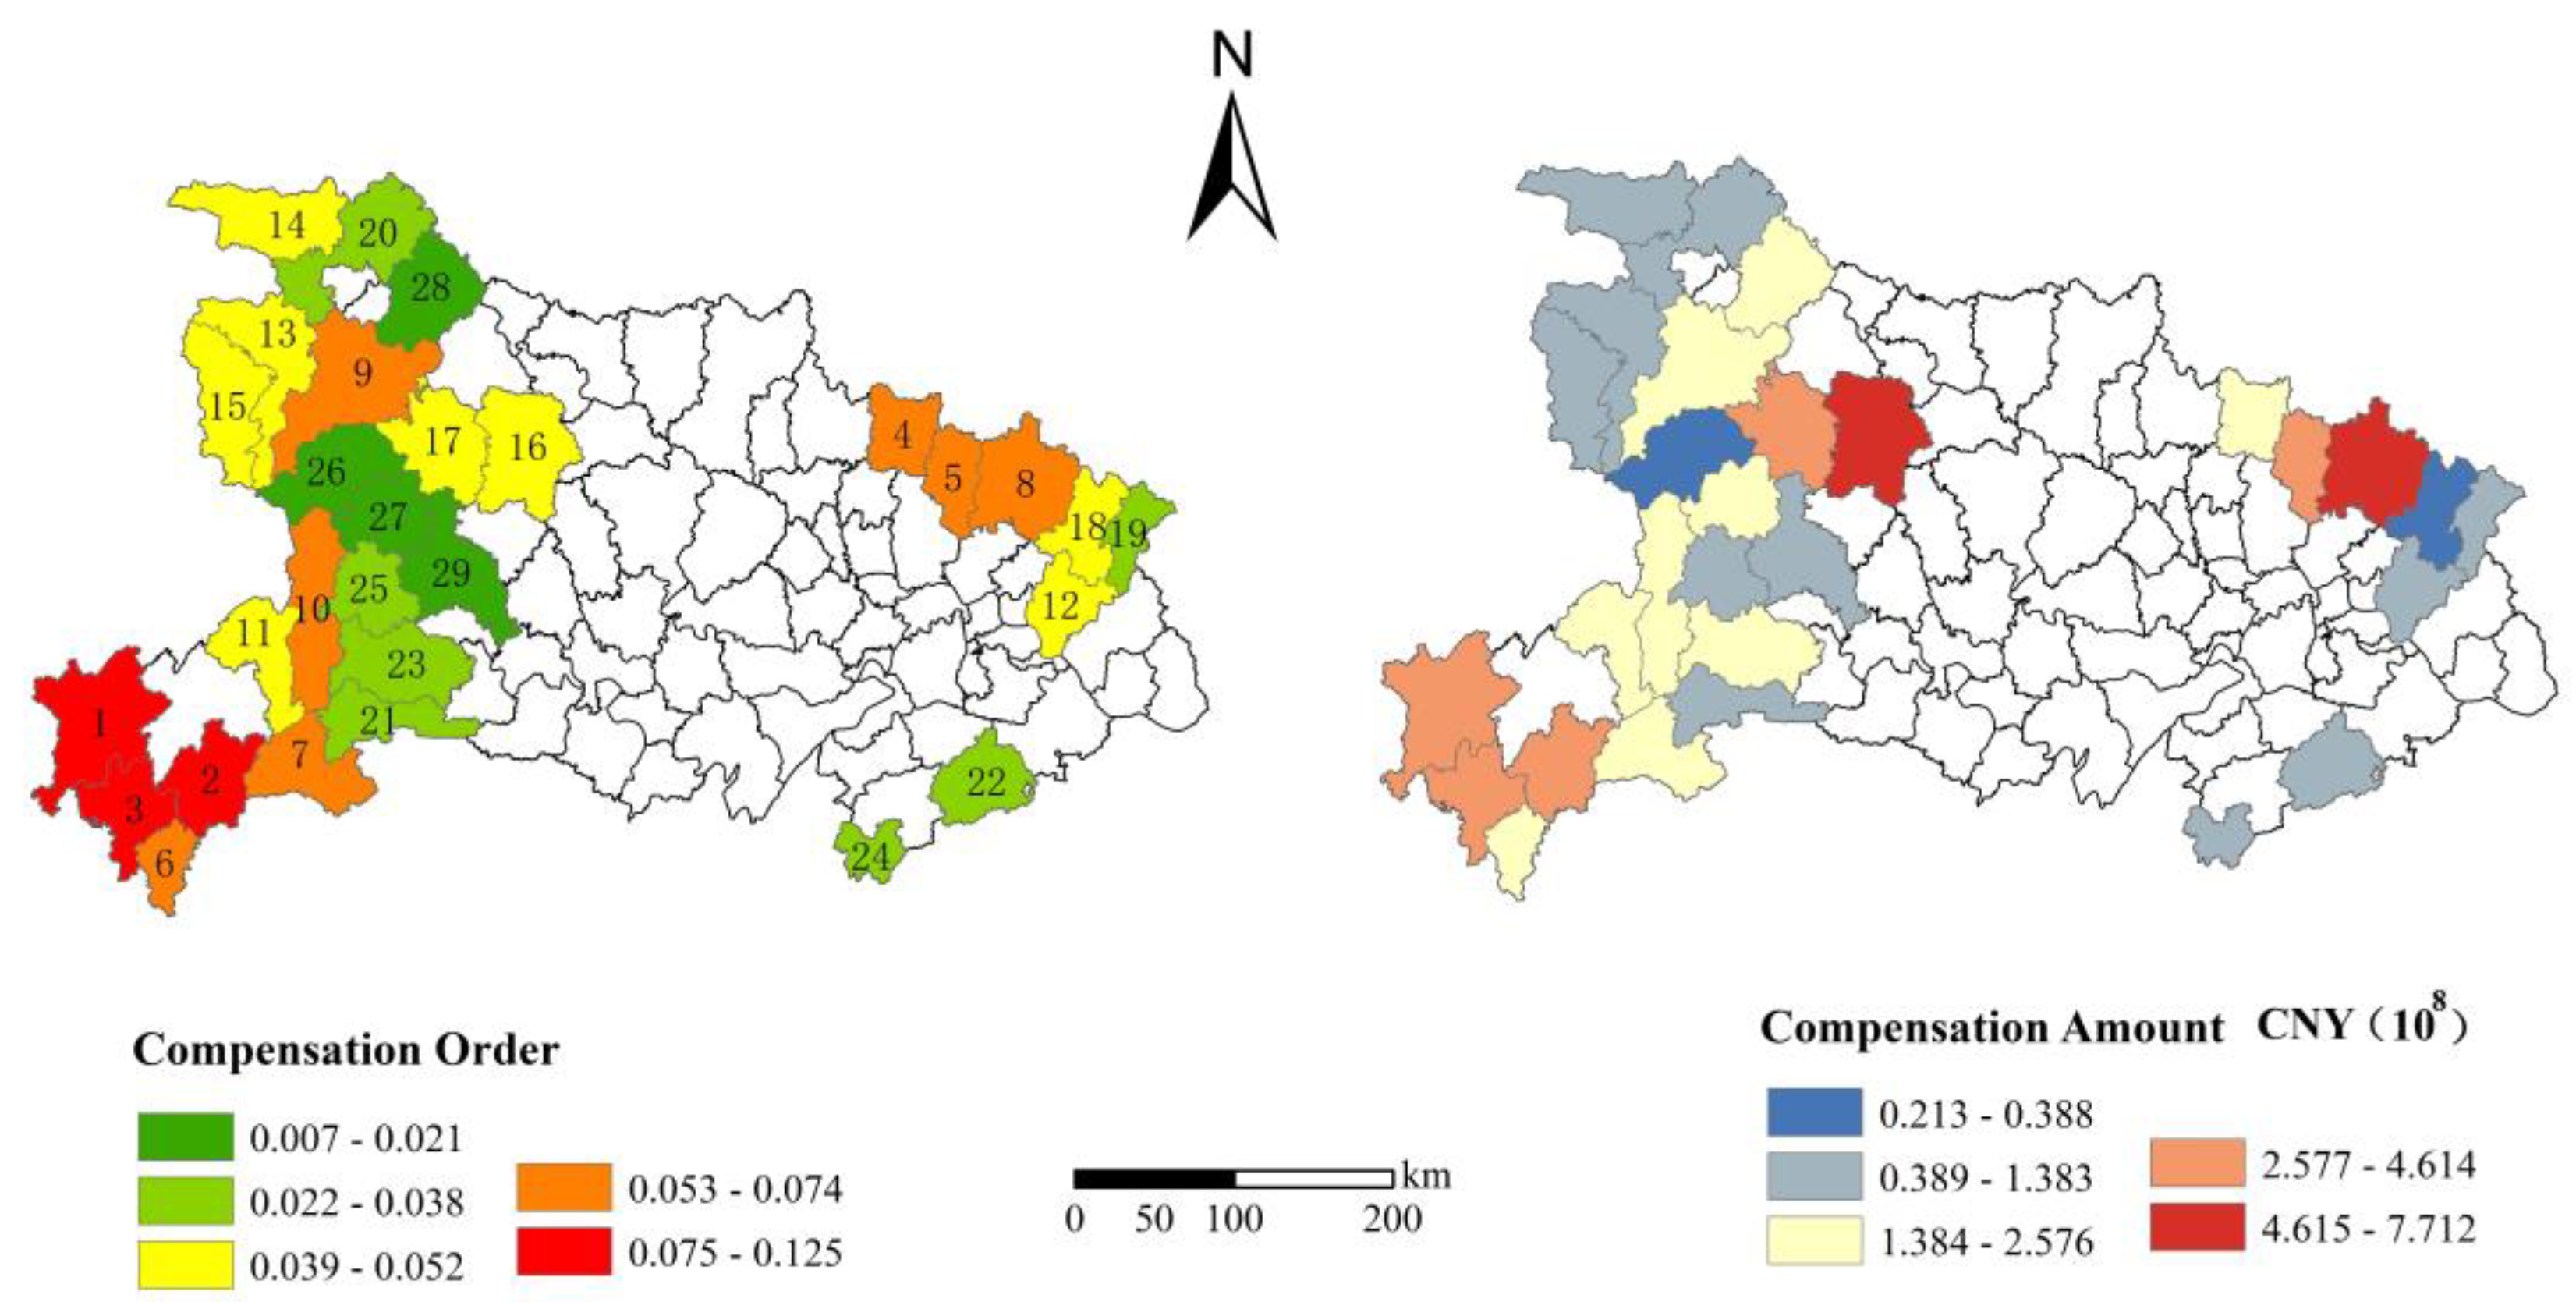
  • (3) Key ecological functional area
According to Formulas (5) and (6), the cultivated land compensation order and amounts of the key ecological function areas in Hubei Province were calculated, and the spatial distribution is shown in Figure 7. According to Figure 7, it can be seen that the ecological compensation priority of 29 key ecological function areas was divided into five levels. The top five counties for the compensation amount were Macheng (CNY 7.71 × 10⁸), Nanzhang (CNY 5.94 × 10⁸), Lichuan (CNY 4.61 × 10⁸), Baokang (CNY 3.70 × 10⁸) and Hongan (CNY 3.06 × 10⁸), and the bottom five counties were Tongcheng (CNY 0.98 × 10⁸), Yunyang (CNY 0.97 × 10⁸), Yiling (CNY 0.81 × 10⁸), Shennongjia (CNY 0.39 × 10⁸) and Luotian (CNY 0.21 × 10⁸).
On the one hand, the forest area in these areas is vast, the cultivated land resources are slightly lower than those in central Hubei and the ecosystem’s service value of the cultivated land is at the middle level. On the other hand, most of these areas are located in concentrated contiguous poverty areas in China (Qinba and the Wuling Mountain area). Economic development is slow in these areas, and poverty is serious. Therefore, the amount of compensation of key ecological function areas is lower than the main agricultural production areas. Additionally, their ecological service value of cultivated land is higher than that of key development areas, and the economic development of these areas is lagging; therefore, it is necessary to provide ecological compensation to them.

4. Discussion

4.1. Discussion

Against the background of the main functional zoning of Hubei Province, this article comprehensively considered the value of ecosystem services and the social and economic development status of the counties in different main functional areas to determine the priority order and amount of ecological compensation and payment. The compensation priority is the relative value of the compensation order of each county in an area, and the compensation amount is the specific value of compensation that each county in an area needs in compensation and payment for cultivated land. There is a certain relationship among them. Studying the priority of regional ecological compensation can lead to allocating limited ecological compensation funds more reasonably. This study confirmed that the priority of ecological compensation is inversely proportional to the regional GDP. Areas with rapid economic development generally have a lower priority for ecological compensation. This is consistent with the original intention of ecological compensation, which is that areas with faster economic development should use ecological compensation funds to feed back into areas with backward economic development.
(1) Research shows that among the key development zones, the main urban area of Wuhan, the main urban area of Huangshi and the main urban area of Yichang are within the top five in terms of ecological payment order and payment amount. The Wuhan urban agglomeration in the eastern part of Hubei Province provides the first and largest amount of payment, the western part of the Jianghan Plain and the north of Hubei Province are paid the second highest amount, and the western part of Hubei Province is relatively backward with its payment ranking last. The results of the payment order are basically consistent with the overall distribution law of Sun’s [50] research, but the specific order is slightly different, mainly because the payment order in this article considers the value of ecosystem services and socioeconomic conditions, while the payment order of Sun considers the amount of ecological benefit and damage. Another difference is that in calculating the compensation (payment) order of each main functional area, we also calculated the ecological compensation (payment) amount to make the compensation process more complete;
(2) The main production areas of agricultural products not only guarantee the country’s food security but also have a certain ecological value. However, research on the main production areas of agricultural products has often been neglected in previous studies on ecological compensation [50,73]. Although the research by Sun et al. [74] considered the main production areas of agricultural products, it did not consider the priority of ecological compensation. This article comprehensively considered the priority of ecological compensation for cultivated land and the amount of compensation in the main agricultural production areas, and it improved the previous ecological compensation mechanism. The payment priorities of the 30 key development zones are divided into five levels. Jiangling, Jianli, and Sui counties belong to areas with higher nonmarket values of ecosystem services per unit area and lower GDP values; thus, their ecological compensation priority is the highest.
(3) The priority of compensation in the 30 key ecological function areas in Hubei Province is divided into five levels overall and the western area of key ecological function areas should be compensated first than the eastern area. The compensation priority of the key ecological function areas in Wang’s research showed a different result, and Shennongjia was the first to receive compensation [75]. The main reason for the difference is that this article mainly focused on the priority and amount of ecological compensation for cultivated land. Therefore, in Shennongjia and surrounding areas with abundant forestland, the total ecological service value was high, but the ecological service value of cultivated land was low; thus, the priority of compensation was later. Within the different main functional areas, our results suggest that the order of ecological compensation or payment for cultivated land was different. The main agricultural production areas and key ecological function areas with higher ecological compensation levels can provide higher quality and high value-added ecological products. Therefore, it is necessary to increase investment and focus on strengthening these areas, building regional ecological production capacity, enhancing environmental competitiveness, promoting regional economic development, and reducing the dependence on fiscal transfer payments.
The research results of the ecological footprint model show that the distribution of the ecological footprint was positively correlated with the population size and economic scale, which is consistent with the results of some previous research [76]. Economically developed and densely populated areas show ecological deficits, while areas with relatively backward economic development show ecological surpluses. Hubei Province can rely only on the consumption of natural capital stock to maintain development, and it relies heavily on the stock capital, which is in a state of unsustainable development. Therefore, it is very necessary to use ecological compensation mechanisms to alleviate regional ecological environment and economic imbalances. The market part of the ecosystem service value is directly converted into currency in the operation of the market mechanism and contributes to regional economic and social development. Accordingly, the priority of ecological compensation and payment only considers the nonmarket value [18]. Our results suggest that the total value of ecosystem services, market value and nonmarket value of Hubei Province are similar in terms of spatial distribution. The central region of Hubei Province had a higher cultivated land ecological service value, while the western and eastern regions had a lower cultivated land ecological service value. The high-value areas of cultivated land ecological service value are mostly concentrated in the main agricultural production areas of Hubei Province. The area of forestland and water area in western Hubei were relatively large, the amount of cultivated land was small, the ecological carrying capacity of cultivated land was low, and the ecological service value of cultivated land was lower than that of the main agricultural areas. The key development zones were mainly the core areas of the Wuhan urban agglomeration with dense populations, developed economies and relatively high ecological footprints of cultivated land. These areas are important for resource development and heavy industrial production in Hubei Province and are typical high “ecological consumption” areas. Previously, Geng et al. [77] also confirmed that economic factors have the strongest explaining effect on the ecological service value through the geographic detector method, followed by social and natural factors. It can be seen that areas with higher ecological footprints of cultivated land had lower ecological service values of cultivated land, and areas with higher ecological carrying capacities of cultivated land had higher ecological service values of cultivated land. Within different main functional areas, our results suggest that the order of ecological compensation or payment for cultivated land was different. For the compensation areas, when the value of ecological services is higher, the level of economic development is lower, the priority of compensation is higher, and the compensation amount is higher. For compensating areas, when the value of ecological services is lower, the level of economic development is higher, the priority of payment is higher, and the payment amount is higher. In this study, we set key ecological function areas and major agricultural production areas in Hubei Province as ecological compensation areas, and we set key development zones as compensating areas.
In the past, many studies have explored ecological compensation in provincial and municipal regions [25], but the problem of unbalanced ecological profit and loss among counties could not be solved. Therefore, our analysis was conducted in a smaller region. Most research on ecological compensation has been conducted according to the situation of ecological deficits and surpluses that distinguish the area of ecological compensation [3,7,18,31,55], but few studies have been conducted from the perspective of development priority zone planning that consider the ecological compensating (compensated) area. At the same time, in different main-body functional regions, the exploration of prioritizing ecological compensation and the amount of compensation in ecological compensation practice provides a new way of thinking. Moreover, we constructed a cultivated land ecological overload index with the cultivated land ecological footprint and cultivated land ecological capacity values, and the compensation coefficients such as the social development stage index and local government affordability index were introduced to ensure that the established ecological compensation standards for cultivated land are practical and feasible. Finally, this paper established a Hubei county-level ecological compensation model based on the main functional area planning perspective, which provides a new idea for the practice of ecological compensation and a reference for the formulation and improvement of ecological compensation policies.
However, this study has the following limitations. First, its lacked consideration of the ecological services generated by forests, wetlands and pastures that may underestimate the biological capacity of urbanised areas and agricultural areas. The main focus of this study was cultivated land’s ecological service value, cultivated land’s ecological surplus and ecological compensation. Future studies should give attention to the ecological service value generated by multiple types of land use. Second, the static rather than dynamic nature of cultivated land was considered. However, the value of cultivated land’s ecological services changes over time. The ecological footprint and ecological carrying capacity of cultivated land also have temporal attributes. Therefore, the spatiotemporal changes in cultivated land’s ecosystems need to be considered to lay the foundation for a spatiotemporal analysis of cultivated land ecological compensation. Third, many constant values were adopted in the methodology, which may cause a slight difference between the research results and the actual situation. Additionally, because the implicit assumption is spatial homogeneity across the county, fine-grained results of cultivated land’s ecological compensation could not be obtained. In future research, small-scale grid data can be used to improve the accuracy of the experimental results. The determination of cultivated land’s ecological compensation standards needs further comparison and selection. In a follow-up study, the method of compensation standard estimation should be optimised and strengthened.

4.2. Policy Implications

First, in this study, the county was used as the unit, and the currently mature and widely used equivalent factor method was used to calculate the service value of the cultivated land ecosystem in the counties of Hubei Province. This paper defined the compensating area (compensated area) of ecological compensation from the perspective of the main functional area and determined the level and order of ecological compensating areas and compensated areas. Based on this, it was its scientific objective to formulate ecological compensation standards for the cultivated land in each county. Through the revision of the compensation coefficient, the established ecological compensation standards have practical operability that cannot only reflect the true value of cultivated land resources but also place the established compensation standards within the acceptable range of the local government. The research results provide a theoretical basis and technical support for the government to introduce ecological compensation policies for cultivated land, but in the specific practical operation of these policies, the feasibility and rigor of the research need to be further improved. Second, it is necessary to build a scientific and reasonable ecological compensation mechanism for cultivated land and establish a vertical cultivated land ecological compensation fund committee that is responsible for establishing ecological compensation methods for cultivated land and collecting, managing and supervising compensation funds. The method of compensation can be a combination of funds, physical objects, technology and policies. Special economic development policies are given as compensation to areas with better ecological protection. For example, areas with rapid economic development should be targeted to help ecological environment protection areas with relatively backward economy.

5. Conclusions

In the survival and development of human society, cultivated land plays an important role, as it not only ensures food security but also provides environmental public services. Under the conditions of rapid urbanisation, how to protect cultivated land and ensure food security is a global issue. Due to the comprehensive consideration of economic development and cultivated land protection, cultivated land ecological compensation has attracted widespread attention. Compared with traditional cultivated land compensation methods, the cultivated land ecological financial payment mechanism can greatly slow the loss of cultivated land and protect the cultivated land culture. On the basis of the value of ecological services, the ecological footprint and the ecological capacity, a theoretical framework for the transregional financial payment of cultivated land is established. This paper defines the compensating area (compensated area) of ecological compensation and determines the level and order of ecological compensating areas and compensated areas from the perspective of the main functional areas by measuring the value of ecosystem services in Hubei Province. The economic development and ecological environment of each region are comprehensively considered to formulate the compensation order and compensation standards. As a result, compensation becomes more comprehensive and complete, and it is more easily accepted by the parties involved.
Current research on ecological compensation for cultivated land is mainly based on theoretical research. In this study, we took China as a case study and carried out exploratory research based on spatial planning. In future research, based on the spatial planning of different countries, our research group will gradually conduct relevant research in other countries. At the same time, the latest research has shown that the size of the cultivated land has a certain impact on cultivated land biodiversity and ecosystem services. Cultivated land biodiversity is usually low in large areas of cultivated land with high concentration, and small-scale cultivated land plays a vital role in preventing the decline of regional biodiversity. In addition, the nonmarket values of cultivated land are not related to the cultivating mode or intensity. There is no need to set aside cultivated land for separate protection. Future research can consider the trade-off between farmers’ incomes and biodiversity and use the field size as a medium to internalise the ecological impact of landscape-scale cultivated land scale changes into the design of land consolidation plans, thereby ensuring that agricultural policies reward farmers who maintain and rebuild fine landscapes. In addition, stimulating research and innovation in such fine-terrain agriculture and carrying out cost-effective but biodiversity-friendly agriculture in fine landscapes can reduce the trade-off between economic and ecological benefits.
Even though the valuation of cultivated land’s ecological compensation criteria and cultivated land’s ecological compensation patterns have been well documented, cultivated land’s ecological compensation across regions, that is, horizontal ecological fiscal payment for cultivated land, is not well known. It needs to be popularised in China, and the order of cultivated land ecological compensation is one of the most fundamental aspects. The results of this study have a certain reference value for reforming cultivated land ecological compensation and developing innovative financial payment mechanisms, particularly in similar areas of developing countries.

Author Contributions

Conceptualization, X.C. and J.W.; methodology, X.C.; software, X.C.; validation, X.C. and J.W.; Writing—review and editing, X.C. and J.W. Both authors have read and agreed to the published version of the manuscript.

Funding

This research was funded by the National Natural Science Foundation of China (41871203).

Acknowledgments

All authors gratefully acknowledge the support from the National Natural Science Foundation of China (41871203). Additionally, all authors are very grateful to Department of Natural Resources of Hubei Province in China who provides the data.

Conflicts of Interest

All authors declare no conflict of interest.

References

  1. Costanza, R.; d’Arge, R.; de Groot, R.; Farber, S.; Grasso, M.; Hannon, B.; Limburg, K.; Naeem, S.; O’Neill, R.V.; Paruelo, J.; et al. The value of the world’s ecosystem services and natural capital (Reprinted from Nature, vol 387, pg 253, 1997). Ecol. Econ. 1998, 25, 3–15. [Google Scholar] [CrossRef]
  2. Jin, J.; Jiang, C.; Li, L. The economic valuation of cultivated land protection: A contingent valuation study in Wen ling City, China. Landsc. Urban Plan. 2013, 119, 158–164. [Google Scholar] [CrossRef]
  3. Liu, L.; Liu, Z.; Gong, J.; Wang, L.; Hu, Y. Quantifying the amount, heterogeneity, and pattern of farmland: Implications for China’s requisition-compensation balance of farmland policy. Land Use Policy 2019, 81, 256–266. [Google Scholar] [CrossRef]
  4. Yang, X.; Burton, M.; Cai, Y.; Zhang, A. Exploring Heterogeneous Preference for Farmland Non-market Values in Wuhan, Central China. Sustainability 2016, 8, 12. [Google Scholar] [CrossRef] [Green Version]
  5. Chen, T.T.; Peng, L.; Wang, Q. From multifunctionality to sustainable cultivated land development? A three-dimensional trade-off model tested in Panxi region of southwestern China. Nat. Resour. Model. 2020, 33, 16. [Google Scholar] [CrossRef]
  6. Wolch, J.R.; Byrne, J.; Newell, J.P. Urban green space, public health, and environmental justice: The challenge of making cities ‘just green enough’. Landsc. Urban Plan. 2014, 125, 234–244. [Google Scholar] [CrossRef] [Green Version]
  7. Cao, R.-F.; Zhang, A.-L.; Wen, L.-J. Trans-regional compensation mechanism under imbalanced land development: From the local government economic welfare perspective. Habitat Int. 2018, 77, 56–63. [Google Scholar] [CrossRef]
  8. Van Uum, E. Spatial planning scenarios for the Netherlands. Tijdschr. Voor Econ. Soc. Geogr. 1998, 89, 106–116. [Google Scholar] [CrossRef]
  9. Xiaofei, X.U.; Jian, Z.; Youhai, L.I.; Chao, Y. Multidimensional analysis of China’s urbanization from the perspective of main function. J. Arid Land Resour. Environ. 2009, 23, 79–83. [Google Scholar]
  10. Ren, Y.; Zhang, A.; Zou, X. Estimating Compensation Standards for Farmland Development Rights over Restricted Development Areas: A Case Studyof Some Areas in Yichang and Xiantao Cities, Hubei Province. Resour. Sci. 2010, 32, 743–751. [Google Scholar]
  11. Aragao, A.; Jacobs, S.; Cliquet, A. What’s law got to do with it? Why environmental justice is essential to ecosystem service valuation. Ecosyst. Serv. 2016, 22, 221–227. [Google Scholar] [CrossRef]
  12. Wang, J.; Zhai, T.; Lin, Y.; Kong, X.; He, T. Spatial imbalance and changes in supply and demand of ecosystem services in China. Sci. Total Environ. 2019, 657, 781–791. [Google Scholar] [CrossRef] [PubMed]
  13. Han, R.; Feng, C.-C.; Xu, N.; Guo, L. Spatial heterogeneous relationship between ecosystem services and human disturbances: A case study in Chuandong, China. Sci. Total Environ. 2020, 721. [Google Scholar] [CrossRef] [PubMed]
  14. Kumar, S.; Managi, S. Compensation for environmental services and intergovernmental fiscal transfers: The case of India. Ecol. Econ. 2009, 68, 3052–3059. [Google Scholar] [CrossRef]
  15. Zhang, J.; Zhang, A.; Song, M. Ecological Benefit Spillover and Ecological Financial Transfer of Cultivated Land Protection in River Basins: A Case Study of the Yangtze River Economic Belt, China. Sustainability 2020, 12, 7085. [Google Scholar] [CrossRef]
  16. Liu, C.L.; Liu, W.D.; Lu, D.D.; Chen, M.X.; Dunford, M.; Xu, M. Eco-compensation and Harmonious Regional Development in China. Chin. Geogr. Sci. 2016, 26, 283–294. [Google Scholar] [CrossRef] [Green Version]
  17. Wang, K.; Ou, M.; Wolde, Z. Regional Differences in Ecological Compensation for Cultivated Land Protection: An Analysis of Chengdu, Sichuan Province, China. Int. J. Environ. Res. Public Health 2020, 17, 8242. [Google Scholar] [CrossRef]
  18. Liu, L.; Yang, B. Research on ecological compensation of provincial cultivated land in China. China Popul. Resour. Environ. 2019, 29, 52–62. [Google Scholar]
  19. Yang, Y.; Yao, C.; Xu, D. Ecological compensation standards of national scenic spots in western China: A case study of Taibai Mountain. Tour. Manag. 2020, 76. [Google Scholar] [CrossRef]
  20. Zhang, P.; Liu, Y.; Wang, P.; Li, S. Research on County Ecological Compensation Mechanism in the Process of Beijing-Tianjin-Hebei Integration:A Case Study of Dingxing County in Baoding City. J. Ecol. Rural Environ. 2019, 35, 747–755. [Google Scholar]
  21. Liu, G.H.; Zhang, H.Y.; Wan, J.; Wang, J.N. Drainage Area’s Ecological Compensation Mechanism Discussion on in the North of Beijing-Tianjin-Hebei Province. China Popul. Resour. Environ. 2006, 16, 120–124. [Google Scholar]
  22. Johst, K.; Drechsler, M.; Watzold, F. An ecological-economic modelling procedure to design compensation payments for the efficient spatio-temporal allocation of species protection measures. Ecol. Econ. 2002, 41, 37–49. [Google Scholar] [CrossRef]
  23. Xie, X.; Xie, H.; Shu, C.; Wu, Q.; Lu, H. Estimation of Ecological Compensation Standards for Fallow Heavy Metal-Polluted Farmland in China Based on Farmer Willingness to Accept. Sustainability 2017, 9, 1859. [Google Scholar] [CrossRef] [Green Version]
  24. Santos, R.; Ring, I.; Antunes, P.; Clemente, P. Fiscal transfers for biodiversity conservation: The Portuguese Local Finances Law. Land Use Policy 2012, 29, 261–273. [Google Scholar] [CrossRef] [Green Version]
  25. Pan, J. Regional eco-compensation standard in Gansu Province. Chin. J. Ecol. 2014, 33, 3286–3294. [Google Scholar]
  26. Liu, J.; Kong, D.; Jin, L. Research on spatial selection of Ecological Compensation Areas: Using the transfer payment of national key ecological function areas of Qinghai Province as an example. Acta Ecol. Sin. 2019, 39, 53–62. [Google Scholar]
  27. Xu, L.; Li, B.; Yuan, Y.; Gao, X.; Tao, Z. A Study on Eco-compensation Based on Eco-Service Assessment in 14 Contiguous Destitute Areas of China. J. Geo-Inf. Sci. 2016, 18, 286–297. [Google Scholar]
  28. Xu, J.; Xiao, Y.; Xie, G.; Jiang, Y. Ecosystem Service Flow Insights into Horizontal Ecological Compensation Standards for Water Resource: A Case Study in Dongjiang Lake Basin, China. Chin. Geogr. Sci. 2019, 29, 214–230. [Google Scholar] [CrossRef] [Green Version]
  29. Shu, L. Games between stakeholders and the payment for ecological services: Evidence from the Wuxijiang River reservoir area in China. PeerJ 2018, 6. [Google Scholar] [CrossRef]
  30. Wen, Q.; Yin, N.; Lv, M.; Zhang, H.; Wang, Y. Farm Householdswillingness to Pay (Wtp) for Ecological Compensation: Influential Factors and Discrepancies in the Case of Forestry Ecological Function Areas In Yunnan Province. Resour. Environ. Yangtze Basin 2017, 26, 1260–1273. [Google Scholar]
  31. Cao, R.; Zhang, A. Effect of transregional fiscal payment system for cultivated land protection: Taking new construction land compensation fees as an example. Resour. Sci. 2019, 41, 1714–1723. [Google Scholar]
  32. Hu, Y.N.; Huang, J.K.; Hou, L.L. Impacts of the Grassland Ecological Compensation Policy on Household Livestock Production in China: An Empirical Study in Inner Mongolia. Ecol. Econ. 2019, 161, 248–256. [Google Scholar] [CrossRef]
  33. Zhu, H.; Zhang, S.; Tong, S.; Ren, X.; Han, L.; Qi, Q.; Zhang, D. Ecological Compensation Strategy forWetlands in Northeast China. Wetl. Sci. 2018, 16, 651–657. [Google Scholar]
  34. He, K.; Zhang, J.B.; Wang, X.T.; Zeng, Y.M.; Zhang, L. A scientometric review of emerging trends and new developments in agricultural ecological compensation. Environ. Sci. Pollut. Res. 2018, 25, 16522–16532. [Google Scholar] [CrossRef] [PubMed]
  35. Ainian, L.I.; Xufang, L.I.U. Legislative idea to the ecological compensation in China. Ecol. Environ. 2006, 15, 194–197. [Google Scholar]
  36. Li, W.; Liu, M. Several Strategic Thoughts on China’s Eco-compensation Mechanism. Resour. Sci. 2010, 32, 791–796. [Google Scholar]
  37. Cao, R.; Zhang, A.; Wan, K. Provincial Differences in Priority of Cultivated Land Protection and Mechanism of Transregional Fiscal Transfer Payment: An Empirical Analysis Based on Ecological Footprint and Service Value. China Popul. Resour. Environ. 2015, 25, 34–42. [Google Scholar]
  38. Ding, Z.; Yao, S. Model and measurement of payment for ecosystem services at small scale. Resour. Sci. 2019, 41, 2182–2192. [Google Scholar] [CrossRef]
  39. Yang, X.; Zhang, F.; Luo, C.; Zhang, A. Farmland Ecological Compensation Zoning and Horizontal Fiscal Payment Mechanism in Wuhan Agglomeration, China, From the Perspective of Ecological Footprint. Sustainability 2019, 11, 2326. [Google Scholar] [CrossRef] [Green Version]
  40. Zhou, Y.; Zhou, Q.; Zhou, X.; Gan, S.; Yang, X. Research progress of contingent valuation method for application to agricultural ecological compensation. Acta Ecol. Sin. 2015, 35, 7955–7964. [Google Scholar]
  41. Zhang, L.; Rong, H. Application of Contingent Vale Method and Opportunity-cost Method to Determining Ecological Compensation StandardsA Case Study of Qiupuhe River. Bull. Soil Water Conserv. 2012, 32, 158–163. [Google Scholar]
  42. Zhou, X.; Chai, D.; Lu, Y.; Song, L. Economic Interpretation on the Compensation for Farmland Preselrvation. China Land Sci. 2010, 24, 30–35. [Google Scholar]
  43. Yang, B.; Li, Q. Research on Compensation Standard of Cultivated Land Protection—A Case Study of Gansu Province. J. China Agric. Resour. Reg. Plan. 2018, 39, 77–83. [Google Scholar]
  44. Guo, J.; Zhu, T.Q.; Ou, M.H.; Pei, F.S.; Gan, X.Y.; Ou, W.X.; Tao, Y. A Framework of Payment for Ecosystem Services to Protect Cropland: A Case Study of the Yangtze River Delta in China. Sustainability 2018, 10, 178. [Google Scholar] [CrossRef] [Green Version]
  45. Li, W.; Wang, D.; Liu, S.; Zhu, Y.; Yan, Z. Reclamation of Cultivated Land Reserves in Northeast China: Indigenous Ecological Insecurity Underlying National Food Security. Int. J. Environ. Res. Public Health 2020, 17, 1211. [Google Scholar] [CrossRef] [PubMed] [Green Version]
  46. Tan, Y.; He, J.; Yu, Z.; Tan, Y. Can Arable Land Alone Ensure Food Security? The Concept of Arable Land Equivalent Unit and Its Implications in Zhoushan City, China. Sustainability 2018, 10, 1024. [Google Scholar] [CrossRef] [Green Version]
  47. Xu, M.; Chen, J.; Gao, J.; Ye, Q. Study on ecological compensation model for Major Function Oriented Zones. Chin. J. Eco-Agric. 2012, 20, 1404–1408. [Google Scholar] [CrossRef]
  48. Zhang, H.; Jie, Y.; Ge, Y. Research on the Mechanism of Ecological Compensation for Poverty Alleviation in the National Key Ecological Function Areas. J. China Agric. Resour. Reg. Plan. 2018, 39, 26–33. [Google Scholar]
  49. Meng, Z.Y.; Zhu, C.G.; Qu, A.X.; Du, Y. Ecological Compensation of the Major Function Oriented Zoning of China. China Popul. Resour. Environ. 2008, 18, 139–144. [Google Scholar]
  50. Sun, X.; Zeng, J.; Chen, S.; Yang, Z.; Luo, J. Ecological Compensation Payment Order with Considering the Ecological Profit and LossThe Case of Hubei Province. Econ. Geogr. 2018, 38, 170–178. [Google Scholar]
  51. Chen, W.; Zhao, H.; Li, J.; Zhu, L.; Wang, Z.; Zeng, J. Land use transitions and the associated impacts on ecosystem services in the Middle Reaches of the Yangtze River Economic Belt in China based on the geo-informatic Tupu method. Sci. Total Environ. 2020, 701. [Google Scholar] [CrossRef]
  52. Lichtenberg, E.; Ding, C. Local officials as land developers: Urban spatial expansion in China. J. Urban Econ. 2009, 66, 57–64. [Google Scholar] [CrossRef] [Green Version]
  53. Herzog, F.; Dreier, S.; Hofer, G.; Marfurt, C.; Schupbach, B.; Spiess, M.; Walter, T. Effect of ecological compensation areas on floristic and breeding bird diversity in Swiss agricultural landscapes. Agric. Ecosyst. Environ. 2005, 108, 189–204. [Google Scholar] [CrossRef]
  54. Horowitz, J.K.; Lynch, L.; Stocking, A. Competition-Based Environmental Policy: An Analysis of Farmland Preservation in Maryland. Land Econ. 2009, 85, 555–576. [Google Scholar] [CrossRef]
  55. Cai, Y.; Yu, L. Rural household participation in and satisfaction with compensation programs targeting farmland preservation in China. J. Clean. Prod. 2018, 205, 1148–1161. [Google Scholar] [CrossRef]
  56. Yu, D.; Hu, S.; Tong, L.; Xia, C. Spatiotemporal Dynamics of Cultivated Land and Its Influences on Grain Production Potential in Hunan Province, China. Land 2020, 9, 510. [Google Scholar] [CrossRef]
  57. Ring, I. Compensating municipalities for protected areas—Fiscal transfers for biodiversity conservation in Saxony, Germany. Gaia-Ecol. Perspect. Sci. Soc. 2008, 17, 143–151. [Google Scholar] [CrossRef]
  58. Ring, I. Integrating local ecological services into intergovernmental fiscal transfers: The case of the ecological ICMS in Brazil. Land Use Policy 2008, 25, 485–497. [Google Scholar] [CrossRef]
  59. Busch, J.; Mukherjee, A. Encouraging State Governments to Protect and Restore Forests Using Ecological Fiscal Transfers: India’s Tax Revenue Distribution Reform. Conserv. Lett. 2018, 11. [Google Scholar] [CrossRef]
  60. Liang, L.; Gao, P.; Liu, L. The “Two Horizon” inter-regional agro-ecological compensation standard and crossregional financial transfer mechanism: A study based on virtual cultivated land. Acta Ecol. Sin. 2019, 39, 9281–9294. [Google Scholar]
  61. Jin, X.; Li, X.; Feng, Z.; Wu, J.; Wu, K. Linking ecological efficiency and the economic agglomeration of China based on the ecological footprint and nighttime light data. Ecol. Indic. 2020, 111. [Google Scholar] [CrossRef]
  62. Wang, H.; Huang, J.; Zhou, H.; Deng, C.; Fang, C. Analysis of sustainable utilization of water resources based on the improved water resources ecological footprint model: A case study of Hubei Province, China. J. Environ. Manag. 2020, 262. [Google Scholar] [CrossRef] [PubMed]
  63. Wang, Q.; Yi, G.; Zhang, T.; Bie, X.; Liu, D.; He, D.; Xu, J. Evaluation of Cultivated Land Resource in Sichuan Province Based on Ecological Footprint Model. Resour. Environ. Yangtze Basin 2018, 27, 80–87. [Google Scholar]
  64. Wackernagel, M.; Onisto, L.; Bello, P.; Linares, A.C.; Falfan, I.S.L.; Garcia, J.M.; Guerrero, A.I.S.; Guerrero, C.S. National natural capital accounting with the ecological footprint concept. Ecol. Econ. 1999, 29, 375–390. [Google Scholar] [CrossRef]
  65. Burton, I. Our Common Future-the World-Commission-on-Environment-And-Development. Environment 1987, 29, 25–29. [Google Scholar] [CrossRef]
  66. Shi, K.; Diao, C.; Sun, X.; Zuo, T. Ecological balance between supply and demand in Chongqing City based on cultivated land ecological footprint method. Acta Ecol. Sin. 2013, 33, 1872–1880. [Google Scholar]
  67. Costanza, R.; de Groot, R.; Sutton, P.; van der Ploeg, S.; Anderson, S.J.; Kubiszewski, I.; Farber, S.; Turner, R.K. Changes in the global value of ecosystem services. Glob. Environ. Chang. Hum. Policy Dimens. 2014, 26, 152–158. [Google Scholar] [CrossRef]
  68. Xie, G.D.; Zhen, L.; Lu, C.X.; Xiao, Y.; Chen, C. Expert Knowledge Based Valuation Method of Ecosystem Services in China. J. Nat. Resour. 2008, 23, 911–919. [Google Scholar]
  69. Wang, N.; Liu, J.; Wu, D.; Gao, S.; Wang, R. Regional eco-compensation based on ecosystem service assessment:a case study of Shandong Provi nce. Acta Ecol. Sin. 2010, 30, 6646–6653. [Google Scholar]
  70. Xie, G.; Lu, C.; Leng, Y.; Zheng, D.; Li, S. Ecological assets valuation of the Tibetan Plateau. J. Nat. Resour. 2003, 18, 189–196. [Google Scholar]
  71. Xie, G.; Xiao, Y.; Zhen, L.; Lu, C. Study on ecosystem services value of food production in China. Chin. J. Eco-Agric. 2005, 13, 10–13. [Google Scholar]
  72. Che, D. The legal sources and institutional reconstruction of ecological compensation under the dual dimensions of policy and law. China Popul. Resour. Environ. 2020, 30, 148–157. [Google Scholar]
  73. Pan, H.; Liu, H. The evolutionary game analysis of cross-regional forest ecological compensationbased on the perspective of the main functional area. Acta Ecol. Sin. 2019, 39, 4560–4569. [Google Scholar]
  74. Sun, X.; Sun, L.; Wang, S.; Li, G.; Zhang, X. Construction and application of an ecological compensation model based on GIS for cross-basin areas A case study of the Dabie Mountain areas in Anhui Province. Chin. J. Eco-Agric. 2020, 28, 458–466. [Google Scholar]
  75. Wang, W.; Ye, J.; Zhang, G.; Wei, C.; Zhang, H.; Liu, H. Research on ecological compensation from the perspective of main functional areas: A case study of Hubei Province. Acta Ecol. Sin. 2020, 40. [Google Scholar]
  76. Wu, D.C. Spatially and temporally varying relationships between ecological footprint and influencing factors in China’s provinces Using Geographically Weighted Regression (GWR). J. Clean. Prod. 2020, 261, 14. [Google Scholar] [CrossRef]
  77. Geng, T.; Chen, H.; Zhang, H.; Shi, Q.; Liu, D. Spatiotemporal evolution of land ecosystem service value and its influencing factors in Shaanxi province based on GWR. J. Nat. Resour. 2020, 35, 1714–1727. [Google Scholar]
Figure 1. The analytical framework of the transregional compensation mechanism.
Land 10 00247 g001
Figure 2. Overview of Hubei Province: (a) relative location of Hubei; (b) spatial distribution of the main functional areas in Hubei Province.
Land 10 00247 g002
Figure 3. Spatial distribution of the cultivated land ecological footprints and ecological capacities of the counties in Hubei Province.
Land 10 00247 g003
Figure 4. Distribution of the cultivated land ecological service values of the counties in Hubei Province.
Land 10 00247 g004
Figure 5. Schematic diagram of the priority and amounts of ecological compensation payments in key development areas in Hubei Province.
Land 10 00247 g005
Figure 6. Schematic diagram of the priority and amounts of ecological compensation in the main agricultural production areas in Hubei Province.
Land 10 00247 g006
Figure 7. Schematic diagram of the priority and amounts of ecological compensation in key ecological functional areas in Hubei Province.
Land 10 00247 g007
Table 1. Indicators, data description and data sources.
IndicatorsData DescriptionData Sources
ipaddy, wheat, bean, oil, vegetables, fruits… (I = 1, …, n)Hubei Rural Statistical Yearbook 2018 (https://data.cnki.net/area/yearbook/single)
jthe type of biologically productive land (j = 1) (j refers only to cultivated land in this study
deach district in Hubei Province (d = 1, …103)
ciper capita consumption of the i-th commodity (kg/cap)
miplanting area of the i-th food crop (ha)
vinational average price of the i-th food crop (CNY)
qiunit area yield of the i-th food crop (ha)
Mtotal planting area of n food crops (ha)
Ea, Eburban Engel coefficient and rural Engel coefficient (%)
θurbanisation level (%)
piworld average productivity amount of the i-th type of commodity (kg/ha)World Food and Agriculture Organization (FAO)
(http://www.fao.org/)
bjper capita biological production (cultivated land) area (ha)Department of Natural Resources of Hubei Province
requivalence factorWorking Guidebook to the National Footprint and Biocapacity Accounts (2018)
(http://www.footprintnetwork.org/)
yyield factor
Npermanent resident population (person)Hubei Statistical Yearbook 2018
(http://tjj.hubei.gov.cn/)
GDPeconomic development (CNY)
Table 2. The relevant coefficients of the main agricultural consumer goods.
ItemWheatPaddyBeanOilVegetablesFruits
ci (kg/capita)15.70106.547.7014.10113.0128.68
pi (kg/ha)274427441856185618,00018,000
Table 3. Ecosystem service equivalent value per unit area of cultivated land in Hubei Province.
Ecosystem ServicesFirst CategorySecond CategoryEquivalent Factor
Market segmentProvisioning serviceFood production1.00
Raw material production0.39
Nonmarket segmentRegulating serviceGas regulation0.72
Climate regulation0.97
Water conservation0.77
Waste treatment1.39
Supporting serviceSoil formation and protection1.47
Biodiversity maintenance1.02
Cultural serviceAesthetic landscape0.17
Publisher’s Note: MDPI stays neutral with regard to jurisdictional claims in published maps and institutional affiliations.

