Article

Vulnerability of the Permafrost Landscapes in the Eastern Chukotka Coastal Plains to Human Impact and Climate Change

1
Faculty of Geography, Lomonosov Moscow State University, 119991 Moscow, Russia
2
Faculty of Geography and Geoinformatics, HSE University, 109028 Moscow, Russia
3
Center for Ecology and Productivity of Forests, Russian Academy of Sciences, 119991 Moscow, Russia
4
Non-Profit Partnership “Chukotka Science Support Group”, 689300 Lavrentiya, Russia
*
Author to whom correspondence should be addressed.
Submission received: 3 April 2021 / Revised: 19 April 2021 / Accepted: 20 April 2021 / Published: 22 April 2021
(This article belongs to the Special Issue Feature Papers for Land–Climate Interactions Section)

Abstract

:
Permafrost landscapes are particularly susceptible to the observed climate change due to the presence of ice in the ground. This paper presents the results of the mapping and assessment of landscapes and their vulnerability to potential human impact and further climate change in the remote region of Eastern Chukotka. The combination of field studies and remote sensing data analysis allowed us to identify the distribution of landscapes within the study polygon, reveal the factors determining their stability, and classify them by vulnerability to the external impacts using a hazard index, H. In total, 33 landscapes characterized by unique combinations of vegetation cover, soil type, relief, and ground composition were detected within the 172 km2 study polygon. The most stable landscapes of the study polygon occupy 31.7% of the polygon area; they are the slopes and tops of mountains covered with stony-lichen tundra, alpine meadows, and the leveled summit areas of the fourth glacial-marine terrace. The most unstable areas cover 19.2% of the study area and are represented by depressions, drainage hollows, waterlogged areas, and places of caterpillar vehicle passage within the terraces and water-glacial plain. The methods of assessment and mapping of the landscape vulnerability presented in this study are quite flexible and can be adapted to other permafrost regions.

1. Introduction

In recent years, climate change has had a significant impact on the state of natural geosystems through an increase in the frequency of natural disasters [1] and shifts in weather characteristics. The Arctic territories are experiencing an air temperature increase twice as high as the global average [2]. The transformation of northern landscapes under the influence of climate change is complicated by the fact that their lithogenic base is represented by permafrost rocks susceptible to air temperature fluctuations. From 2007 to 2017, the mean annual ground temperature (MAGT) in the Arctic increased by 0.5 °C [3]. These changes are accompanied by active layer thickening [4] and intensive degradation of the ice complex [5], along with thermokarst and thaw slumps development [6,7,8]. Changes in the permafrost conditions provoke rapid activation of exogenous cryogenic processes and lead to changes in the hydrological regime [9,10,11]. Predicting the future state of the Arctic geosystems is complicated by the formation of positive and negative feedbacks [12,13,14] caused by climatic and environmental changes.
Geosystem stability is one of the fundamental concepts in physical geography and geoecology [15] and is defined as a geosystem’s ability to resist natural or anthropogenic influence and maintain internal balance [16]. The intensity of exogenous cryogenic processes is the key indicator of a permafrost landscape’s response to external impacts [17], as landscape disturbance may lead to activation of cryogenic processes provoking environmental deterioration and deformation of engineering structures. The typical anthropogenic influence in the northern territories intensifies the development of thermokarst, thermal erosion, and solifluction [18,19,20].
In Russia, the most significant results of regional, local, and regime studies on landscape-based permafrost mapping using landscape classification and geoinformation mapping were obtained by the Earth Cryosphere Institute, Tumen, Moscow (ECI SB RAS) [21,22,23,24], Melnikov Permafrost Institute SB RAS, Yakutsk [25,26,27,28], and Lomonosov Moscow State University, Faculty of Geography [15,16,20,29,30].
Vulnerability is a function of climate change and its impacts on the geosystem, its sensitivity, and its adaptive capacity [1]. The susceptibility of permafrost geosystems to climate change and anthropogenic impact has regional features [17]. Unlike the other permafrost regions [14,17,21,31,32,33,34,35], the geosystems of NE Russia and their susceptibility to external impacts have been relatively poorly studied. The aim of this paper was to study the distribution of permafrost geosystems of the Eastern Chukotka coastal plains and assess their vulnerability to climate change and potential anthropogenic impact.
In our work, landscapes, or geosystems, are considered as territories that react differently to external (natural or anthropogenic) impacts. The subject of the study was the assessment of their potential reaction to changed conditions, which is expressed in the activation or attenuation of exogenous (mostly cryogenic) processes, changing soil properties, and changing plant formations. In our study, we highlighted the main factors that determine the sustainability of landscapes of the Eastern Chukotka coastal plains. The greater the degree of influence of these factors, the less resistant is the landscape to external impacts, i.e., the ability of the natural geosystem to resist the activation of cryogenic processes reduces, which can lead to irreversible deterioration of the environmental conditions and unacceptable deformations of engineering structures [15,20,29].

2. Materials and Methods
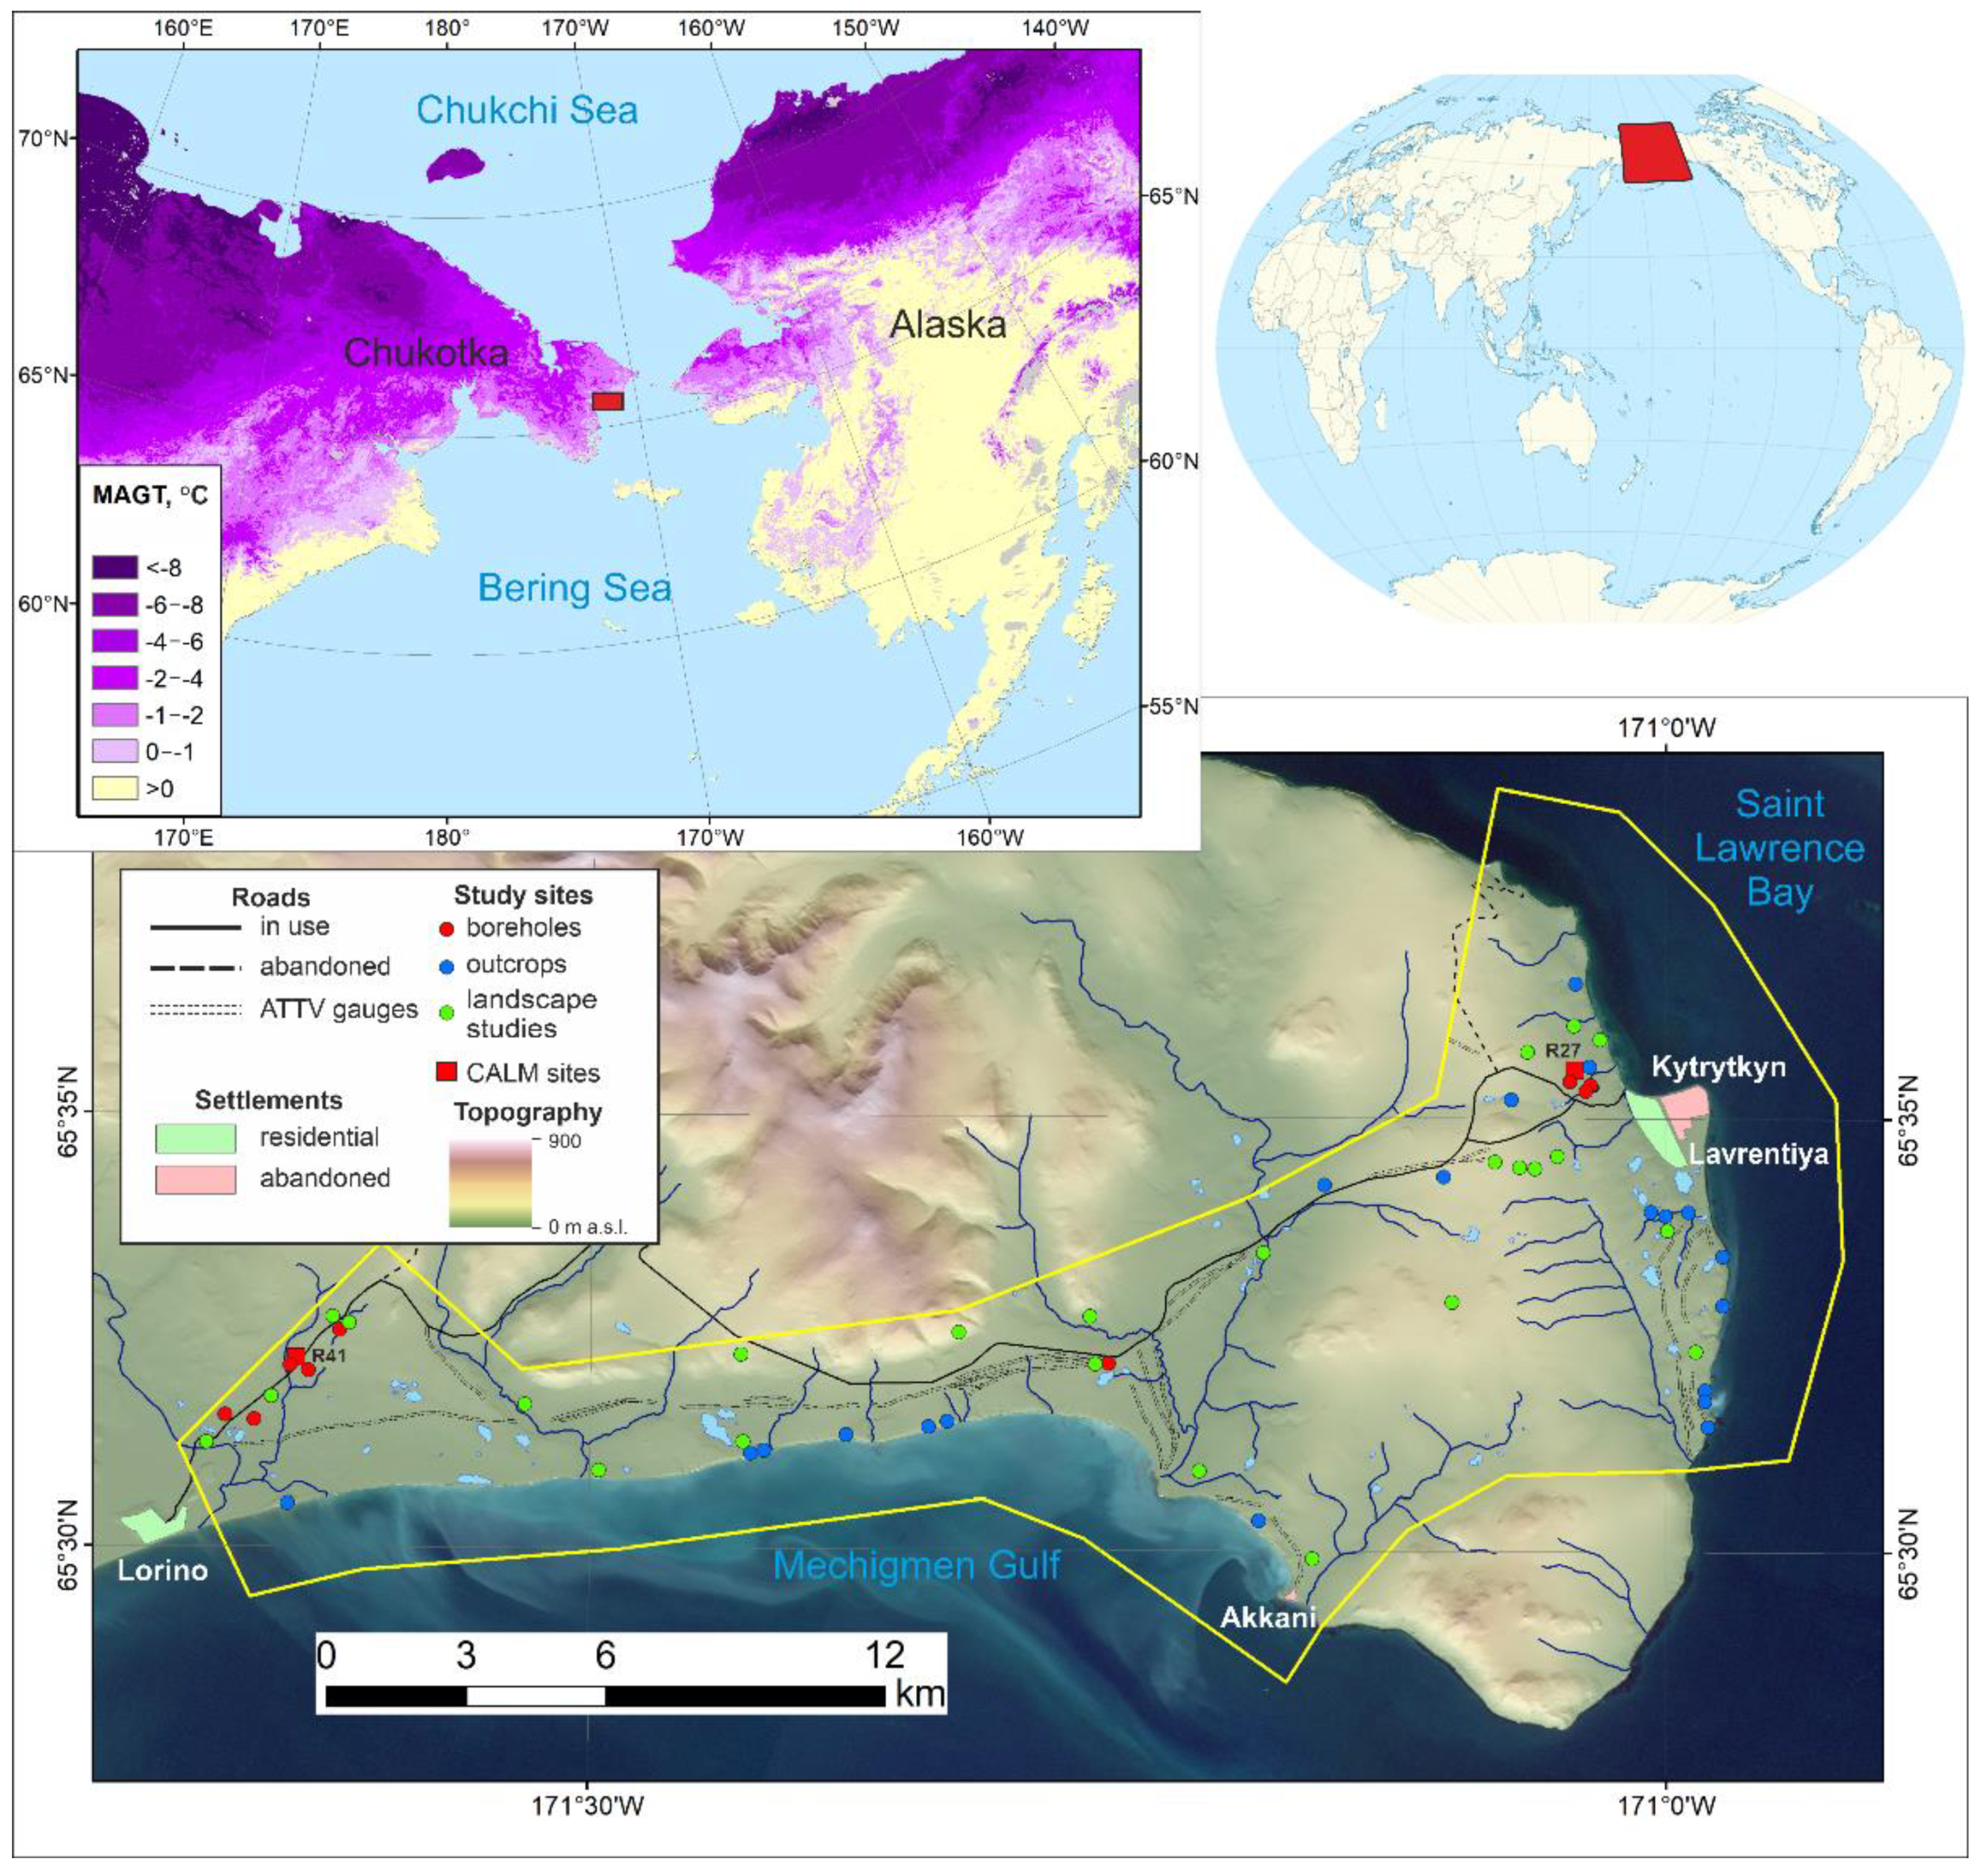
2.1. Study Area

Eastern Chukotka is located in the extreme north-east of Russia. It is marked by a flattened low-mountain range of the Mesozoic folding, framed by a narrow strip of coastal plains of various genesis and age. The territory is located on the Chukchi Peninsula, it strongly protrudes into the sea, which determines the prevalence of the marine arctic and subarctic types of climate. Summers there are cool, cloudy, with frequent fogs, while winter are long and moderately cold. The average air temperature for 1990–2020 at the nearest weather station in Uelen was +7.1 °C in July and −19.7 °C in January, with an annual average value of −6.0 °C [36]. Annual precipitation varies widely depending on the year, ranging from 350 to 690 mm. Over the past 30 years, a noticeable increase in air temperature at a rate of 0.14 °C/decade has been observed in the study area [37]. At the same time, there is no noticeable trend in the precipitation amount. Within the plains, the permafrost thickness is 100–200 m, the MAGT is −2–−4 °C [38]; however, regular ground temperature observations were not conducted. The plain territories are covered with grass-shrub tundra vegetation, and the mountain slopes are covered with lichen tundra and barrens. The study area is characterized by a typical polar tundra (ET) climate type according to the Köppen–Geiger updated classification system [39].
The study site is located on the Bering Sea coast, between St. Lawrence Bay and Mechigmen Gulf, and covers an area of 172 km2 (Figure 1). It is occupied by coastal plains and the adjacent foothills and slopes of the Genkanyi (Tenianyi) ridge, composed of Precambrian rocks and Lower Devonian schists, broken by Lower Cretaceous granite intrusions. The area includes two sites for monitoring the active layer within the framework of the CALM program [40,41,42], one residential settlement (Lavrentiya, population 1208, 2019; [43]), one abandoned (Kytrytkyn) settlement, and one seasonal (Akkani) settlement. During the period from 2015 to 2020, field studies of permafrost, massive ice beds, and ice wedges in natural outcrops [44,45,46] along with permafrost core drilling [47] and landscape investigations were conducted here by the authors.

2.2. Field Data Collection

Core drilling of the seasonal thaw layer and the upper layers of permafrost was carried out in the summer periods of 2019–2020 and was confined mainly to the CALM monitoring areas (red circles in Figure 1). The drilling was carried out using an ADA GroundDrill 15 motor-drill. The depth of the boreholes ranged from 1.4 to 2.7 m. Visual assessment of ice content in the extracted cores was carried out along with a description of cryogenic structures and sampling for gravimetric water content.
In the 2015–2020 summer seasons, the studies of natural outcrops of dispersed frozen soils within coastal cliffs or thermal erosion ravines were carried out (blue circles in Figure 1). Field observations revealed a wide distribution of massive ice bodies [50,51] and ice wedges [45]. The results of these studies were used in this work.
Landscape studies were carried out within the study area in 2019–2020. At the selected locations (green circles in Figure 1) we described and measured the following parameters: relief, vegetation composition and projective cover, soil profile, depth of the seasonally thawed layer, drainage regime, groundwater level, and manifestation of exogenous processes.

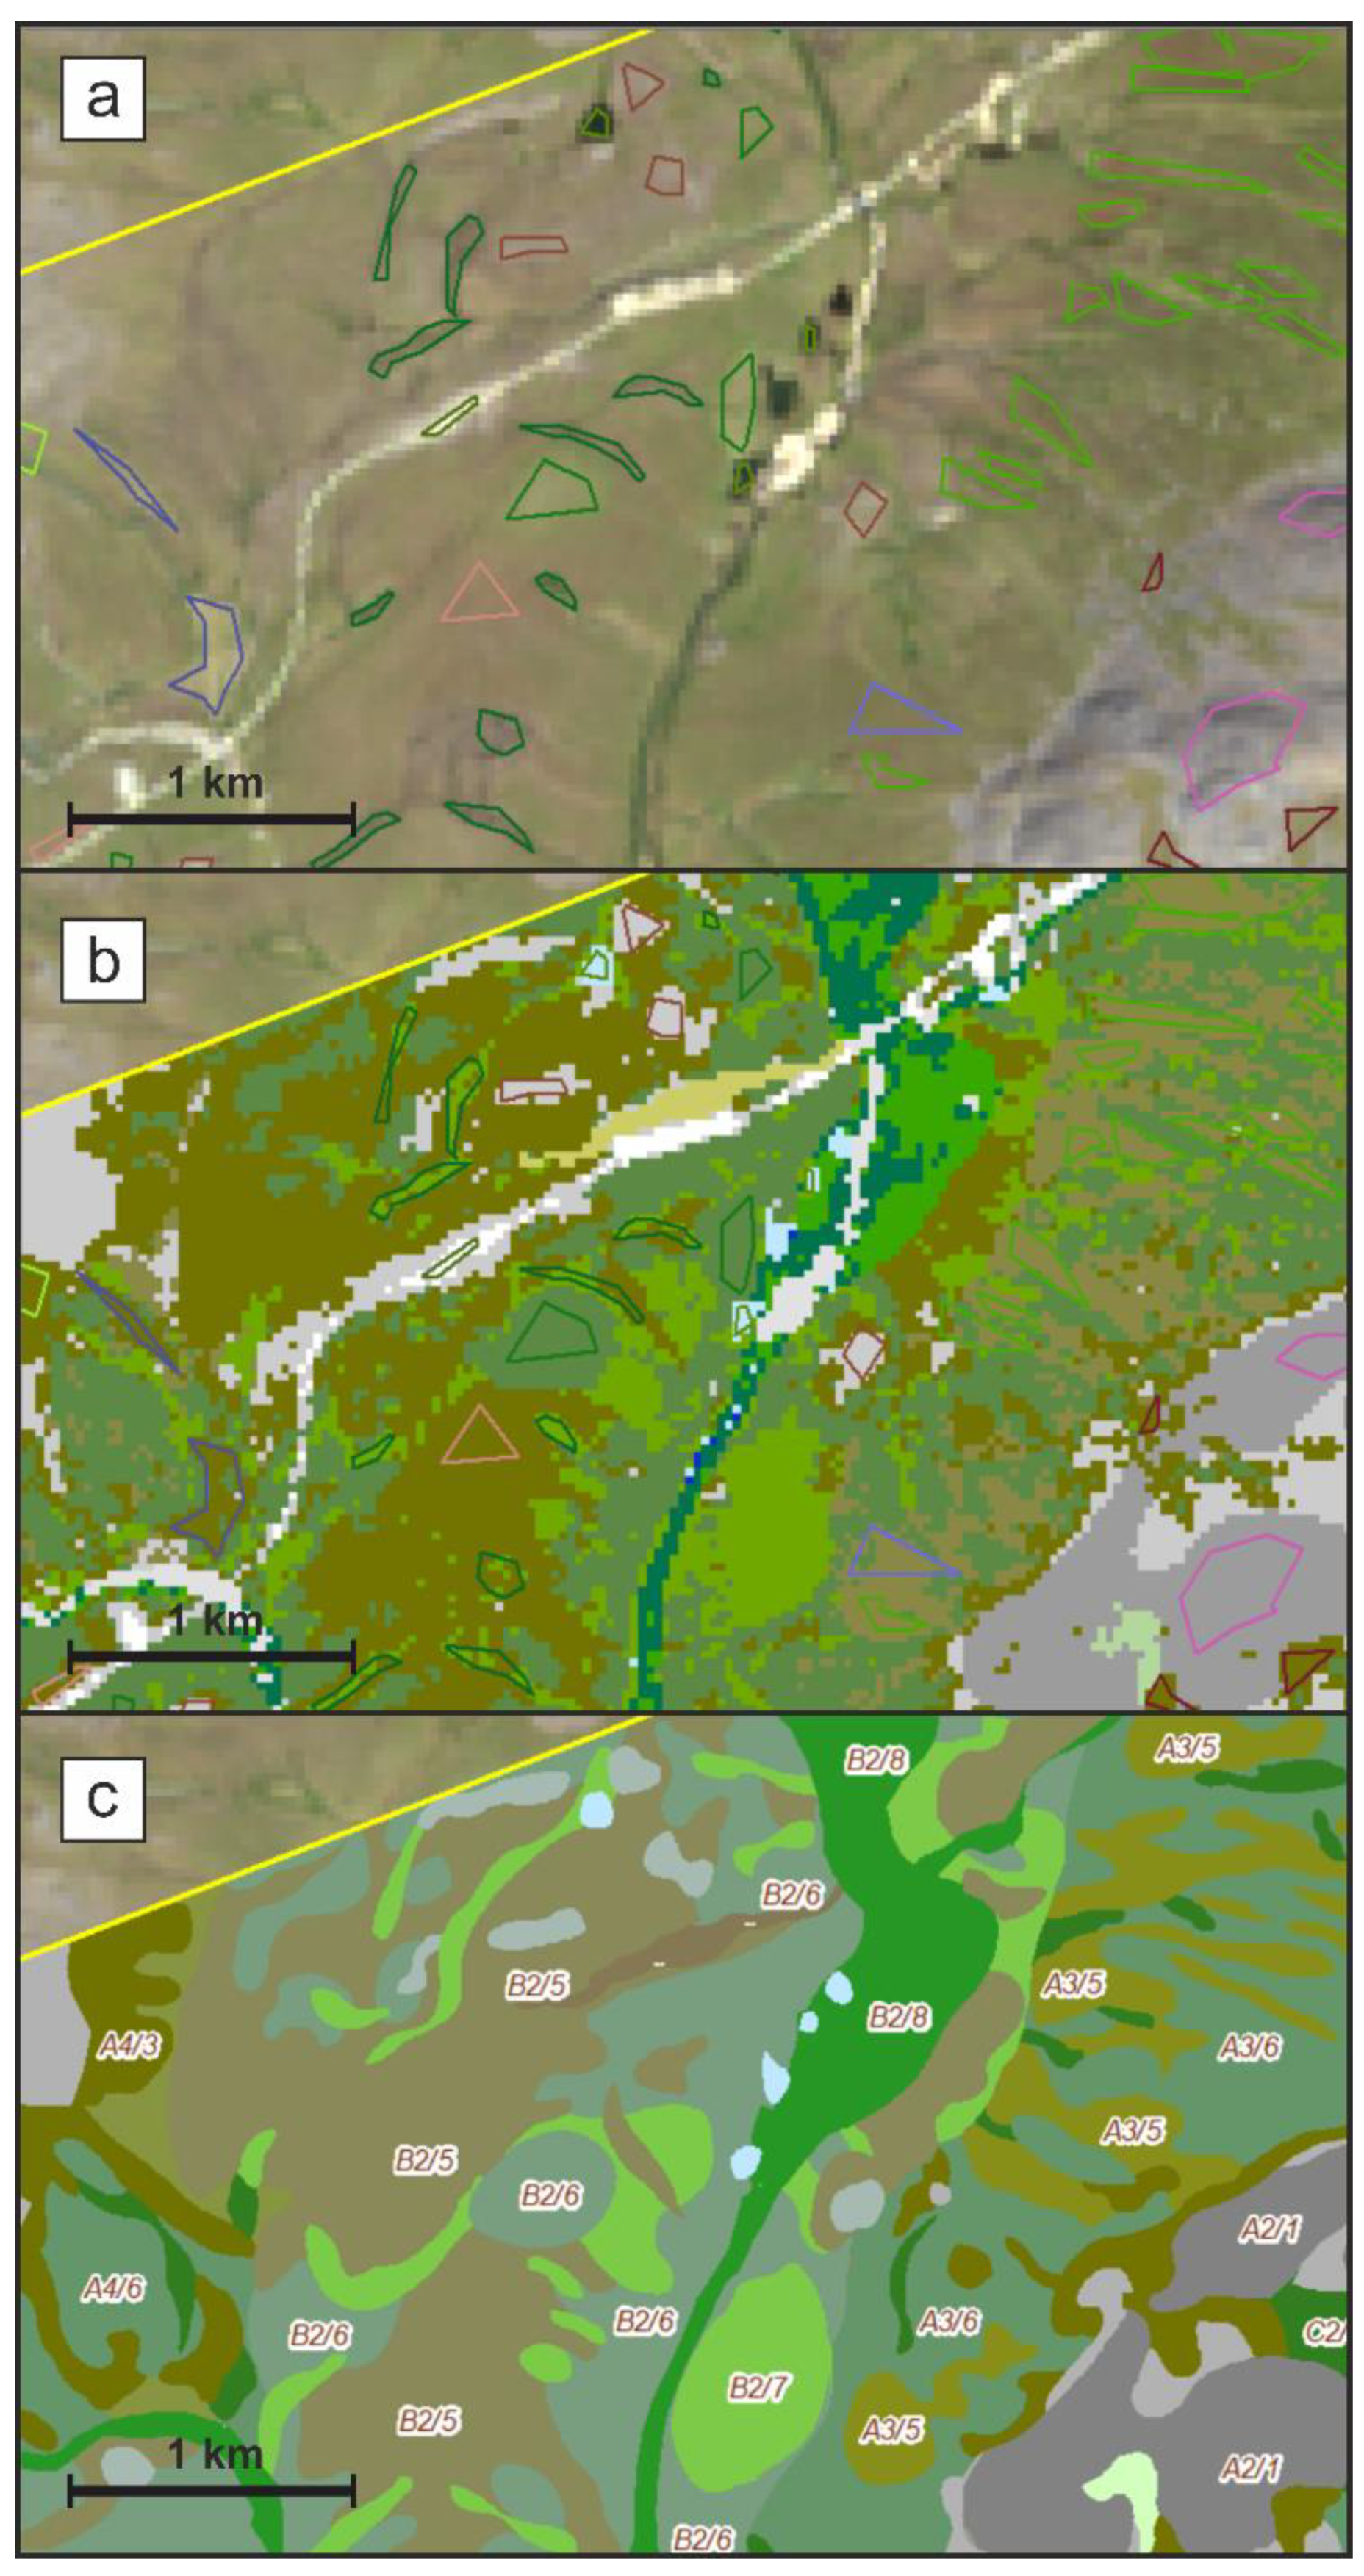
2.3. Landscape Mapping

The landscape map and the legend were compiled according to the A.G. Isachenko [52] approach, which is based on the typification of each natural complex according to the principle of similarity (homogeneity). In this work, a natural complex, or landscape, is defined as a genetically unified territory, homogeneous in zonal and azonal characteristics, within which all the main components (relief, soils, climate, surface and ground water, vegetation, and fauna) form a complex interaction and a homogeneous single indissoluble system [29,52]. In other words, the natural landscapes are areas of the Earth’s surface where rocks, relief, climate, soils, vegetation, and fauna form an integral system [53]. In order to obtain this information within the selected polygon, we used different data sources.
The study of Quaternary sediments and relief within the polygon was carried out by analyzing previously published works [54,55] and reports on engineering surveys of previous years along the road “Lavrentiya-Lorino” (black solid line on Figure 1) [56] and by using a digital elevation model Arctic DEM with a resolution of 10 m [49] and the State Geological Map at a scale of 1:200,000 (sheets Q-2-XXI, XXII, XXIII). These materials were compared with the studied outcrops, drilled cores, and the results of landscape studies.
The value of space imagery as a source of geographic information is difficult to overestimate; therefore, a multi-zone satellite image of the OLI imaging system operating on the Landsat 8 satellite was used as the main material for compiling the map. The image was registered on 15 August 2020. This corresponds to the middle of the growing season, which made it possible to conduct a precise estimation of the spatial differentiation of the vegetation cover. The image was decoded using controlled maximum likelihood classification as the most efficient and well-proven method (Figure 2). The blue, green, red, and near-infrared channels of the optical range were used. The following standards (key areas) were visually identified from the image: (a) low bushes with grass; (b) tundra with creeping shrubs; (c) stony-lichen cover; (d) hummocks; (e) swampy meadows; (f) water objects; and (g) barrens (hilltops, riverbeds, beaches, and marine spits). Within the framework of the interpretation of the controlled classification results, manual vectorization and the subsequent generalization of the obtained contours were carried out. Generalization was performed based on field landscape studies and drilling data (See Figure 1). The scale of the final map is 1:100,000 and the color scheme of the map is based on the generally accepted methods of landscape maps design [57].
The map legend includes a set of natural landscapes of the polygon and is presented in the form of a matrix. The matrix contains two main classification features of the landscape: geological and geomorphological characteristics and soil–plant complexes (Table S1). Geological and geomorphological characteristics are differentiated by the matrix columns. The topmost line shows the genesis of the relief: denudation-erosion (A), accumulative (B), fluvial-erosion (C), and fluvial-accumulative (D). Below the morphology, type, age of the surface, elevation range, and composition of the surface deposits down to 2 m depth are indicated. Thus, the columns correspond to the genetic types of relief with a certain composition of soils. The rows of the matrix reflect the zonal types of soil–plant complexes, which are grouped according to the degree of moisture (drainage). The cells of the matrix correspond to land types [29,52]. The land type name is formed from the characteristics of the rows and columns corresponding to the cell [29]. For example, land type No. B1/6 has the following characteristic: “a grass-sedge hummocky tundra on tundra gley peaty-muck soils, occupying the hilltops of a water-glacial plain, relatively drained, composed from the surface of sandy-loamy deposits with pebbles and boulders”. The numerator of the index (B1) denotes geological and geomorphological conditions, while the denominator (6) represents the number of the soil–plant complex from the legend.

2.4. Assessing and Mapping Landscape Vulnerability

The vulnerability assessment of permafrost landscapes is performed on a landscape basis [58]. The methodical approach is based on identifying factors that may influence the lithologic and permafrost state of the landscapes’ base and reduce its stability, which is expressed in the activation of cryogenic processes [15,16,17,29,59].
We selected the four main factors that influence a landscape’s resistance to cryogenic processes activation:
(1)
The ice content of the transient layer, W. The transient layer of the ground beneath the active layer, which may turn into a thaw state due to extreme climatic fluctuations [60]. Potential disturbance and thawing of this layer trigger such cryogenic processes as thermokarst, ground collapse, thermal erosion, thaw slumps formation, and solifluction. Gravimetric ice (water) content values were obtained during core drilling in 2019 and 2020 and from the engineering surveys data. The ice content of the transient layer within the missing landscapes was assessed by experts and using previously published data [6,9,12,16,24].
(2)
The active layer lithological composition, L. Ground composition defines the stability of a landscape base after disturbance. Boulder deposits are more stable than clayey and peaty sediments with the same natural conditions. Active layer ground composition was obtained during field studies of 2015–2020 and from the quaternary sediments map.
(3)
Vegetation protective properties, or heat-insulating properties of vegetation, P. The heat-insulating properties of the topsoil cover (including grass, shrubs, moss-lichenous layer, and the organic soil horizon) define the ability of heat waves to penetrate deeper parts of the active layer and permafrost and, thus, activate ground ice melting. This parameter was qualitatively assessed from field landscape observations.
(4)
The rate of vegetation self-recovery after disturbance, S. The lower the vegetation recovery rate and its projective cover growth after the mechanical disturbance, the higher is the risk of exogenous processes activation. Self-recovery rates for different vegetation covers were taken from the work of N. Moskalenko [33].
The natural factors used in the assessment react differently to the same type of impact; therefore, a change in their values affects the activation of exogenous processes in different ways. In order to take into account the significance (contribution) of each factor in the overall assessment, they were assigned weights by the method of expert assessment [61]. A small number of factors allowed us to use the direct placement method when assigning individual weights, where the sum of all weights is 1 [58]. When assigning the factors weights, the experience of cryogenic processes assessment in other regions, mainly in the north of Western Siberia, was taken into account [29,62], in which the greatest significance was the ice content (W) (and the maximum weight was 0.45). In second most significant factor is the protective vegetation properties (P) with a weight of 0.30. Lithology of the active layer (L) and vegetation self-recovery rate (S) have minimum weights—0.15 and 0.10, respectively. Then, a matrix table on a 4-point scale (Table 1) was made to assign numerical scores to each landscape by the arithmetic mean values (1).
H = ( W × k 1 + L × k 2 + P × k 3 + S × k 4 ) 4
where H is the hazard index and k1...k4 are weighted coefficients.
As a result, we ranked all the landscapes based on these calculated factors using hazard index H, which defines the landscape vulnerability to climate warming or human impact. The smaller the value of this index the more stable is the landscape.

3. Results and Discussion

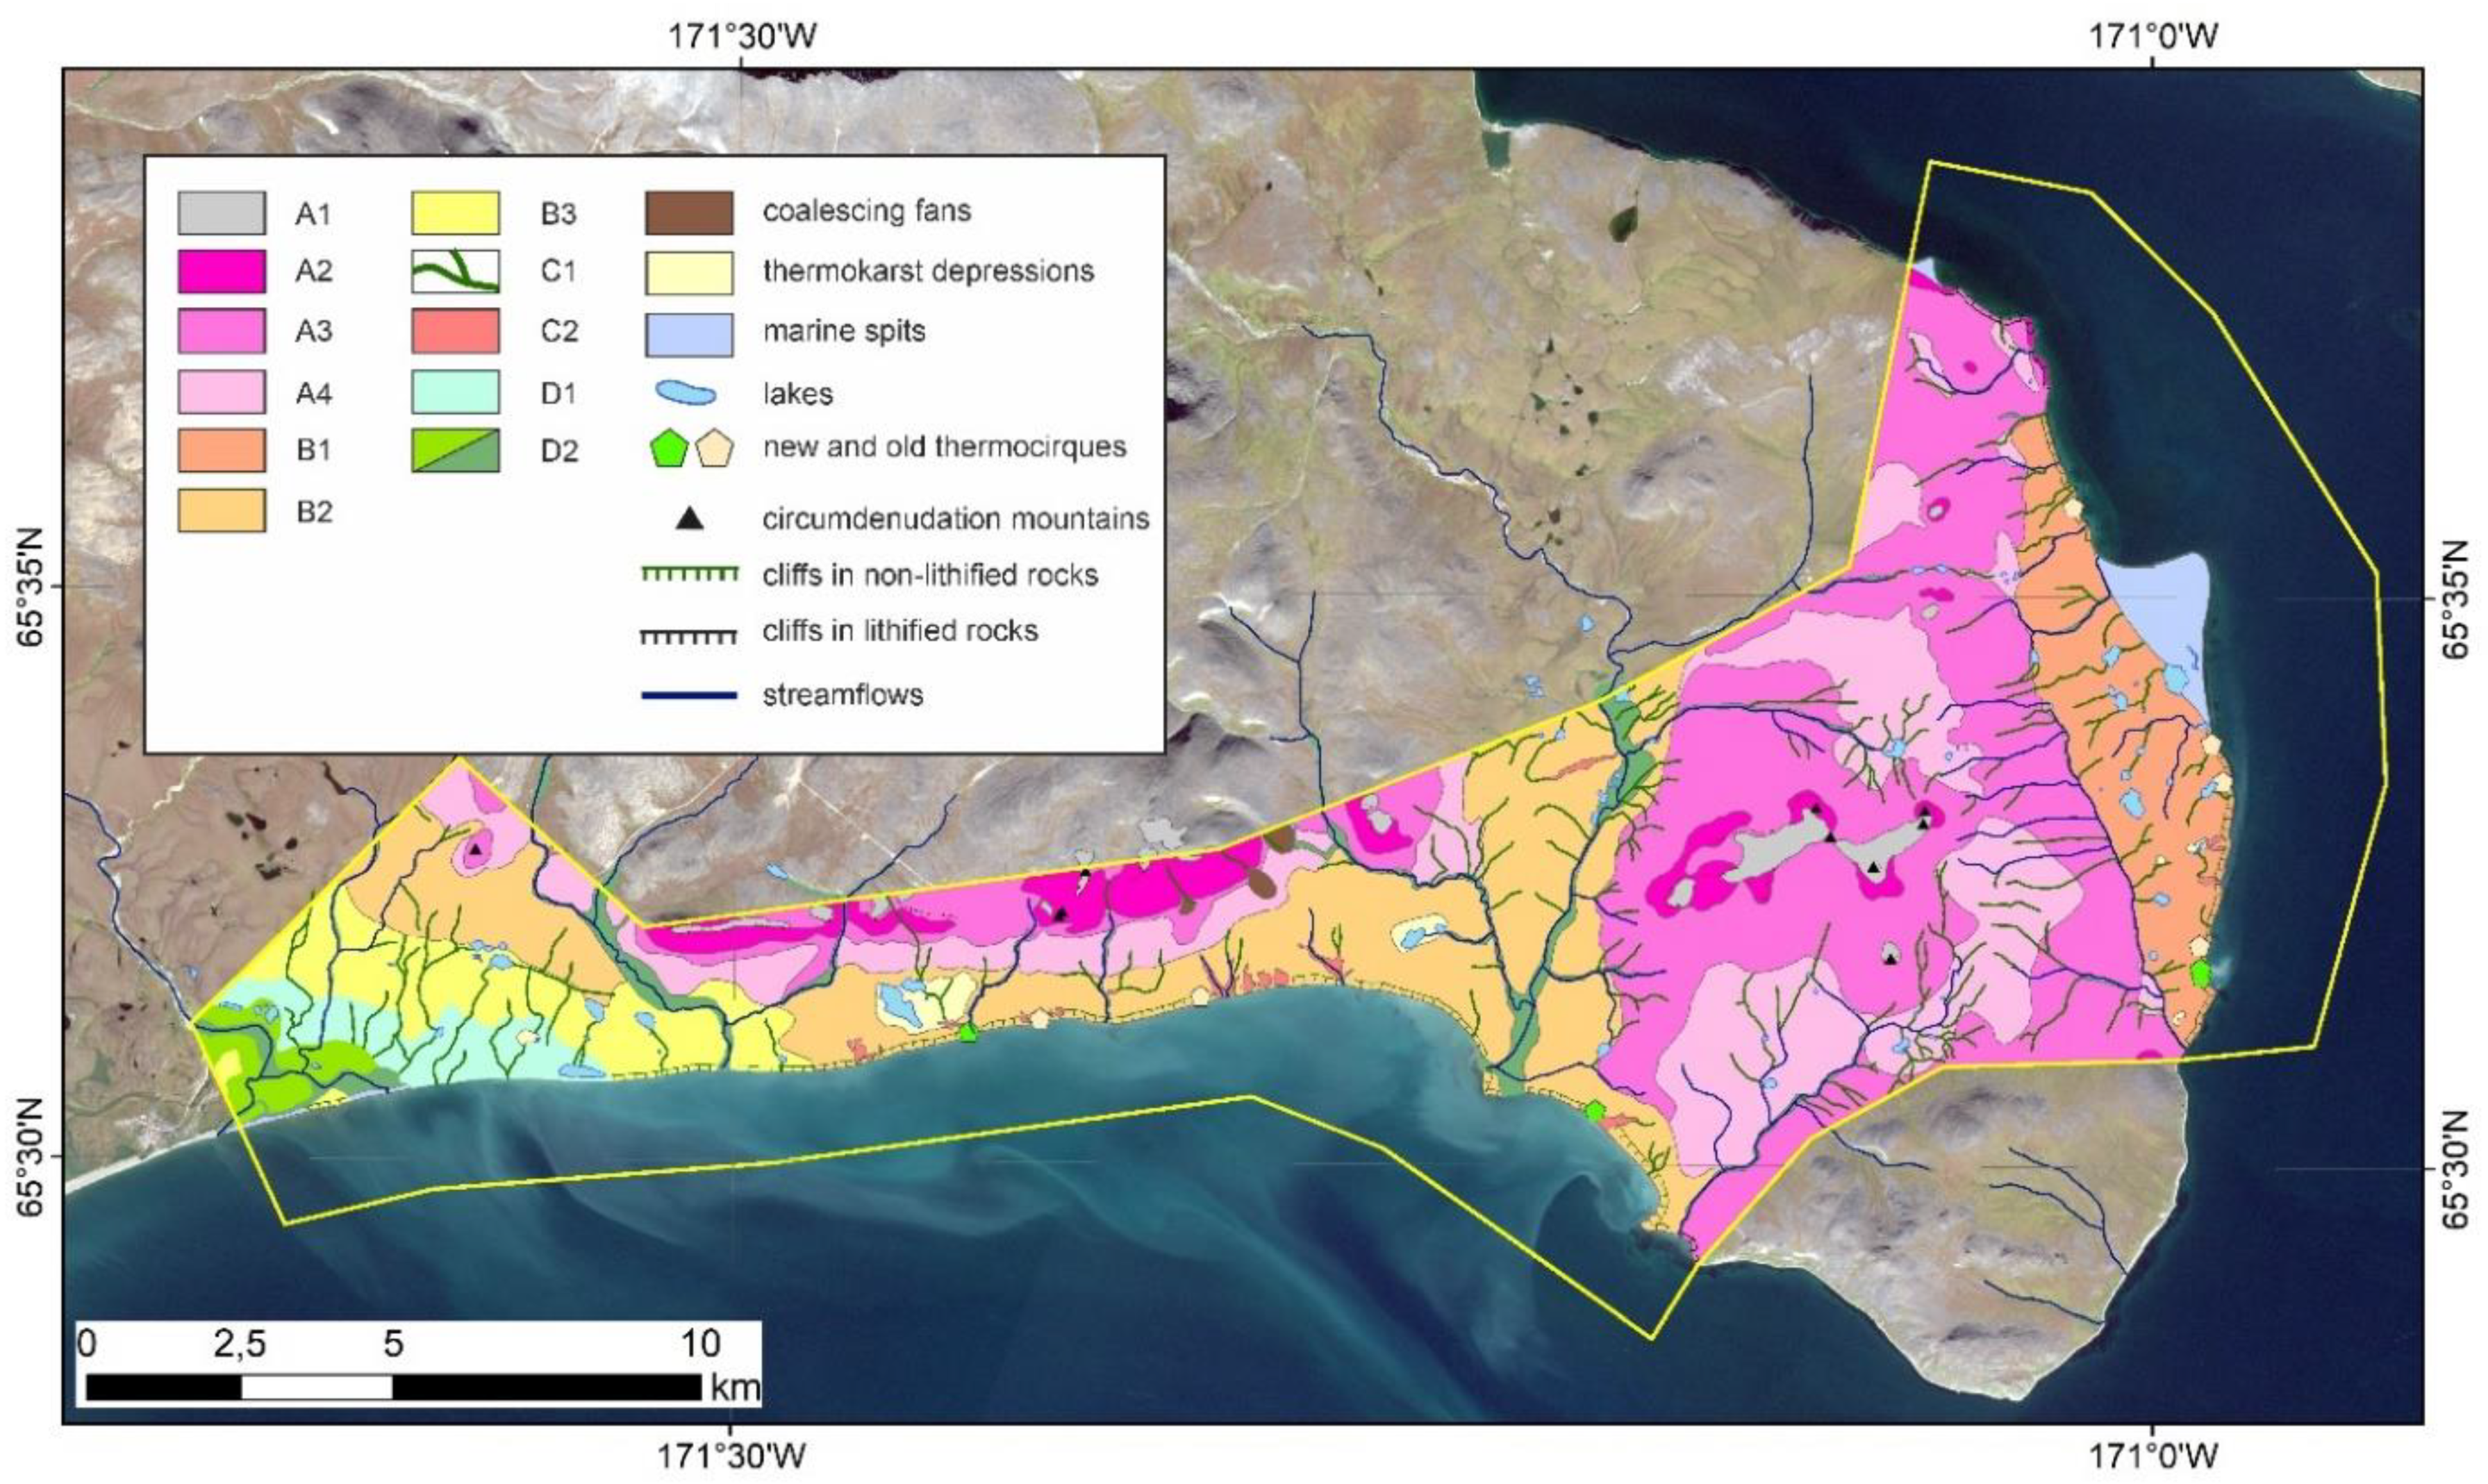
3.1. Geomorphology of the Study Polygon

In total, 11 geomorphological types of surfaces were identified and mapped (Figure 3): A1—summit plains; A2 and A3—steep (>15°) and medium (5–15°) mountain slopes, respectively; A4—mountain foothills (<5°); B1—plains of glacial and water-glacial genesis; B2—the fourth terrace of the coastal plains of marine and glacial-marine genesis; B3—the third marine terrace; C1—upper elements of the hydrographic network (runoff troughs and dells), C2—ravines; D1—the first floodplain terrace of the Lorinka River; and D2—deltas and floodplains of small rivers. All the surfaces are differentiated by the lithological composition of the rocks.
The foothills, rocky slopes, and summits of the mountains (A1–A4) are framed by a system of horizontal surfaces of various ages and geneses, which determines the geomorphological diversity of the Eastern Chukotka coastal plains.
There is a water-glacial plain (B1) in the eastern part of the polygon, on the southern coast of St. Lawrence Bay. It is composed of moraine deposits of the Early Pleistocene (probably, the Olyayon suite [55]) and reaches the altitude of 60–80 m a.s.l. The surface of the terrace is ridged and slightly sloping (slopes reach 10°). The surface boundary near the coast of St. Lawrence Bay has numerous thermocirques and marine erosion bluffs of up to 40 m high. Sediments from the surface are represented by gray and dove-colored loam, with the inclusion of unsorted weakly rounded debris of up to 2 m in diameter. Moraine deposits are fragmentarily overlain by Holocene peatlands containing ice wedges [44,45].
The central and western parts of the polygon are represented by the fourth marine and glacial-marine terrace 40–80 m above sea level (B2), and they are composed of Olyayon gray loams with the inclusion of boulders and gray and yellow inequigranular sands with the inclusion of pebbles (probably of the Mechigmen suite) [54]. The surface of the terrace is flat and slightly inclined towards the sea. The coastal boundary is complicated by ravines and gullies (C2).
The third marine terrace (B3) is located at 15–30 m a.s.l. and is composed of sands with the inclusion of pebbles of the Mechigmen and Krest suites [54]. The terrace is located in the western part of the polygon and forms erosional remnants in the valley of the Lorinka River. The surface relief is flat, sometimes complicated by drainage hollows.
In the east, the polygon is represented by the valley complex of the Lorinka River. The floodplain terrace of the river (D1) has an elevation of 10–15 m and is composed of sands, sandy loams, and loams of the Holocene age. Peat bogs with ice wedges are found within the terrace. The floodplain of the river (D2), like other rivers within the polygon, is narrow, composed of loams and sandy loams, the riverbeds are paved with alluvium from pebbles and rounded boulders.
The Holocene marine spit is located on the eastern edge of the polygon and is composed of pebbles. This is an area of intensive economic development: the communities Lavrentiya and Kytrytkyn occupy this site. The spit elevation is 0–5 m a.s.l., and it has sparse associations of ruderal vegetation.

3.2. Landscapes of the Study Area

The landscape map of the study polygon is presented in Figure S1. The color indicates the types of soil and vegetation complexes that are described in the legend (Table S1) in horizontal lines. In total, there are 33 land types on the map, where each one is marked with a color and an index.
There is a good relationship between geological and geomorphological conditions and soil and plant complexes within the polygon. Primitive soils are common for rocky summits and slopes, barrens, stone deserts, and curtain tundra of various grasses. In the most favorable places, alpine sedge-grass meadows appear.
Typical tundra soil–plant associations are found on gentle foothills starting from an altitude of 150–200 m a.s.l. and in the terrace complexes. These are small-shrub, grass-moss, and hummocky tundra in combination with sedge-hipnum swamps and meadows on tundra gley, peaty boggy, and tundra gley peaty-muck soils. The thickness of the organic horizon here ranges from 0.1 to 3 m (in peatlands).
Intrazonal types of soil and plant communities are confined to floodplains and river deltas that have a moisture regime characterized by periodic change. These areas are occupied by sedge-moss meadows, sometimes with creeping willows on alluvial gley, peat, and peat-gley soils.
Stony riverbeds, sea pebble beaches, and spit areas without any vegetation are distinguished separately within the polygon.

3.3. Expected Climate Changes and Vegetation Reactions

Along with the other Arctic regions, Chukotka is experiencing a pronounced climate warming. Since the 1970s the mean annual air temperature in Chukotka has been increasing by 0.4–0.5 °C/decade [36]. The thaw index (It, a sum of daily average air temperatures above 0 °C), characterizing the amount of heat coming to the soil surface, has increased from 615°∙days in 1977–1999 to 700°∙days in 2000–2017. The active layer monitoring in the framework of the CALM project revealed a correspondent increase in seasonal thaw depths of 0.5–1.5 cm∙a−1 for the period 2000–2019 at CALM sites R27 Lavrentiya and R41 Lorino (See Figure 1). At the same time, field measurements of seasonal thaw subsidence and frost heave demonstrated irreversible lowering of the soil surface within the Lavrentiya CALM site with a rate of 2.6 cm∙a−1 for 2012–2018 [32]. According to CMIP5 climate models adapted to the Chukotka region, we expect an increase of the thaw index by 1000–1750 °C∙days by 2099 depending on the climatic scenario. In this case, the climate conditions in the Eastern Chukotka region will be close to the current climate characteristics of Kamchatka or even Kuril Islands [32]. Such changes will lead to widespread thermokarst, proliferation of thermoerosion landforms, and permafrost degradation from the top.
We do not have any durable observations of vegetation cover change due to climate warming in Chukotka. However, according to 30 years of monitoring observations of N. Moskalenko [63,64] in the north of Western Siberia (Kharasavey, Bovanenkovo, and Nadym sites), with an air temperature increase and active layer thickening, an increase in vegetation biodiversity is predicted. As a result, new invasive species of plants appear, the height of shrubs increases, and projective vegetation cover grows. This is especially true for polygonal tundra. All species numbers will not increase in spotted well-drained tundra; the number of lichen species and their coverage of the soil surface may even decrease.
In this way, we expect a controversial reaction of the permafrost landscapes to climate warming: on one hand, there will be active layer thickening and permafrost degradation, on the other hand, more lush vegetation will moderate deep penetration of the heat waves into the ground. The expert assessment may clarify the significance of these factors of future landscape transformations.

3.4. Assessment of Landscape Vulnerability to External Impacts

We present an original method for comparing natural factors that affect the activation of hazardous exogenous processes by considering the calculated index of their impact and intensity. To rank landscapes according to their resistance to external impacts, the hazard coefficient H was calculated. After determining the values of the factors (see Table 1) using formula (1) for each of the landscapes, it turned out that H varies from 0.3 (the most stable) to 0.95 (the most unstable). The scale of stability is divided into four categories: (1) stable (H < 0.35); (2) semi-stable (H = 0.35–0.50); (3) relatively unstable (H = 0.51–0.75); and (4) unstable (H > 0.75). The results of the assessment are presented in Table S2, where a characteristic list of dominating exogenous processes of a certain spectrum and intensity is identified for each land type.
Stable landscapes occupy 31.7% of the polygon area, or 54.4 km2 (Figure S2). These are summit surfaces and mountain slopes, as well as sections of the glacial-marine terrace (B2) occupied by stony tundra on mountain primitive soils. In addition, the stone riverbeds, sea pebble spits, and beaches are also considered to be stable landscapes. These areas are characterized by rocky and coarse-grained soils of the active layer, which determine the stability of these territories. Among the exogenous processes, a complex of slope processes (permafrost creep, slope crumbling, solifluction), frost cracking of rock fragments, and cryogenic soil sorting prevail here. In the case of economic activity in these areas, the development of exogenous processes will be minimal.
There are only two semi-stable landscapes. The first one corresponds to the middle slopes of the mountains, covered with hummocky cotton grass-sedge tundra, where solifluction development is possible. The second landscape is sedge-moss meadows with the creeping willow associations within the river floodplains, where new ice wedges formation is observed. In case of disturbances, thermokarst may appear here. The share of semi-stable landscapes is 13.3% (22.9 km2).
Relatively unstable landscapes occupy a third (34.5%) of the polygon (59.3 km2) and are represented by flat areas. These are gentle foothills and slopes or tops of hills of the glacial plain and terraces, occupied by small shrub, grass-moss, and hummocky cotton grass-sedge tundra vegetation. In case of anthropogenic impact or continuing climate warming for these territories, the following exogenous processes may develop: thermoerosion, thermokarst, and thermodenudation. For slopes, activation of solifluction is possible. It is not recommended to carry out economic activities in these areas.
Unstable landscapes occupy 19.2% of the territory, or 33 km2. They are characterized by extremely high susceptibility to disturbances due to both high ice content of the transient layer, dispersed soil composition, and weak protective properties along with low recoverability of vegetation covers. Typically, these are cotton grass hummocky tundra, meadows and swamps, as well as drainage hollows and places of caterpillar vehicle passage. In case of any disturbances, the processes of thermokarst, thermal erosion, waterlogging of the territory, and the formation of cryogenic landslides will actively develop in these areas.
The vulnerability classification was not carried for the lakes, which occupy 1.1% of the territory, or 1.92 km2.
Thus, the landscapes, most stable to external impacts for the Eastern Chukotka region are the slopes and tops of mountains covered with stony-lichen tundra and alpine meadows, as well as the leveled summit areas of the fourth glacial-marine terrace. Their stability is mainly determined by the rocky and coarse-clastic composition of the ground. The most unstable landscapes are depressions and swampy areas of the glacial-marine plain, the fourth glacial-marine terrace, the third marine terrace, as well as the floodplain terrace of the Lorinka River. These areas are characterized by a loamy-sandy and loamy composition of soils, presence of peat in the active layer, high ice content of the underlying transient layer, and presence of massive (ice wedge, bed) ice bodies. The processes of thermokarst and thermal erosion are widespread here, as well as traces of tracked vehicles, clearly marked on satellite images. It is highly discouraged to carry out economic activities within the specified territories.

3.5. Reliability of the Results Obtained and Their Applicability to Other Territories

The results of this study are representative for the high-latitude eastern Russian territories with a harsh cold climate, permafrost soils, and sparse tundra vegetation without woody vegetation.
Unlike low-latitude regions, in the high-latitude regions vulnerability is considered as possible intensification of exogenous processes due to climate warming, which are a threat for the functioning of engineering objects and infrastructure. At the same time, dramatic changes are not expected. The projected increase in bioproductivity and biodiversity along with an increase in peat thickness will slow down hazardous processes.
Our results are not applicable for low-latitude territories with frequent droughts, floods, and landslides, although we used a methodological approach to the assessment consistent with other works [1].
In this study we used a proven method of compiling forecast geocryological maps on a landscape basis. To evaluate landscapes vulnerability, we used the method of factorial assessment of the activation of exogenous processes taking into account the calculated indicators of their cumulative influence. A relatively short list of 33 land types was predetermined by the use of two simple techniques: assigning weight coefficients to each factor and calculating the integral hazard index using the arithmetic mean. The obtained results are reasonable for classification of the entire spectrum of landscapes into four categories and generation of the assessment map at a scale of 1:100,000. The method of automated controlled classification of vegetation in the tundra zone based on high-resolution images does not always work due to the low diversity of plant, especially woody, communities. At the same time, it is widely used in hard-to-reach areas of the Arctic, where field data is sparse or absent.
A more accurate, differential assessment can be obtained with a larger number of landscapes and a larger number of factors with specific values. In this case, the multiple regression method was used to calculate the hazard indices. This technique is used in works of a larger scale based on detailed long-term monitoring [29,62].

4. Conclusions

Estimation of cryogenic landscape vulnerability using an integrated multi qualitative-quantitative technique was conducted for the Eastern Chukotka coastal plains and foothills. The expert method of the assessment of landscape vulnerability consisted of a number of procedures, including the selection of factors that influence landscape resistance, establishment of interrelations between factors, and assessment of these factors’ influence using weights. The landscape approach for assessing and mapping hazardous permafrost processes in the region of the Eastern Chukotka coastal plains is presented for the first time. The paper presents three digital maps: the geomorphological map, the landscape map, and the map of landscape vulnerability.
Analysis of the permafrost landscapes’ distribution and vulnerability within the selected polygon made it possible to conclude the following:
  • A wide spectrum of geomorphological surfaces of different genesis, ground composition, and age has been revealed within a relatively compact study site (172 km2). This variety defines the presence of 33 land types characterized by a unique combination of vegetation cover, soil type, relief, and ground composition. The selected site may be considered representative of the rest of the Eastern Chukotka coastal plains. The ratio of stable and unstable landscapes of this test site is typical for tundra landscapes of the Eastern Chukotka coastal plains.
  • The most stable areas within the study site are the slopes, foothills, and summit surfaces of the mountains as well as pebble marine spits and beaches, which are characterized by an almost complete absence of vegetation and rocky and coarse-grained soils. The economic development of such territories (construction, mining, etc.) will not cause a sharp activation of exogenous processes.
  • The most unstable land types correspond to depressions, drainage hollows, waterlogged areas, and places of caterpillar vehicle passage within the terraces and water-glacial plain. As a result of anthropogenic impact or continuing climate warming, the manifestation of dangerous exogenous processes is predicted here, including thermokarst, thermal erosion, and formation of thaw slumps, which can turn these territories into rugged badlands.
The landscape approach used in this paper allows for the estimation of landscape vulnerability to external impacts for remote and poorly studied regions. This method may be applied to the pre-construction stage of economic development, engineering investigations, and environmental monitoring.

Supplementary Materials

The following are available online at https://0-www-mdpi-com.brum.beds.ac.uk/article/10.3390/land10050445/s1, Figure S1: Landscape map of the study polygon (map legend is provided in Table S1), Table S1: Matrix legend of the landscape map, Figure S2: Map of the landscape stability and potential activation of dominating exogenous processes, Table S2: Summary table of the calculation of integral stability indices with a list of exogenous processes.

Author Contributions

Conceptualization, A.M. and L.Z.; methodology, A.M., L.Z., and M.G.; software, N.K. and M.G.; validation, A.M., N.K., and G.Z.; formal analysis, A.M. and N.K.; investigation, A.M.; resources, A.M. and G.Z.; data curation, A.M.; writing—original draft preparation, A.M. and L.Z.; writing—review and editing, A.M. and L.Z.; visualization, N.K. and M.G.; supervision, A.M. and D.Z.; project administration, A.M. and G.Z.; funding acquisition, A.M. and D.Z. All authors have read and agreed to the published version of the manuscript.

Funding

The study was supported by the Russian Science Foundation grant No. 19-77-00045 “Permafrost sensibility to climate change in Eastern Chukotka coastal plains”. The contribution of L.Z. was supported by the Russian Foundation for Basic Research No. 18-05-60080 and State Assignment “The cryosphere evolution under climate change and anthropogenic impact”. Drilling equipment was provided by the U.S. National Science Foundation award OPP-1304555.

Institutional Review Board Statement

The study was conducted according to the guidelines of the Declaration of Helsinki, and approved by the Lomonosov Moscow State University Review Board.

Informed Consent Statement

Not applicable.

Conflicts of Interest

The authors declare no conflict of interest. The funders had no role in the design of the study; in the collection, analyses, or interpretation of data; in the writing of the manuscript, or in the decision to publish the results.

References

  1. De Silva, R.P.; Dayawansa, N.D.K. Climate Change Vulnerability in Agriculture Sector: An Assessment and Mapping at Divisional Secretariat Level in Sri Lanka. Earth Syst. Environ. 2021, 1–14. [Google Scholar] [CrossRef]
  2. Pachauri, R.K.; Allen, M.R.; Barros, V.R.; Broome, J.; Cramer, W.; Christ, R.; Church, J.A.; Clarke, L.; Dahe, Q.D.; Dasqupta, P.; et al. Climate Change 2014: Synthesis Report. Contribution of Working Groups I, II and III to the Fifth Assessment Report of the Intergovernmental Panel on Climate Change; Pachauri, R., Meyer, L., Eds.; IPCC: Geneva, Switzerland, 2014; 151p. [Google Scholar]
  3. Romanovsky, V.; Isaksen, K.; Drozdov, D.; Anisimov, O.; Instanes, A.; Leibman, M.; McGuire, A.D.; Shiklomanov, N.; Smith, S.; Walker, D. Changing permafrost and its impacts. In Snow, Water, Ice and Permafrost in the Arctic (SWIPA); AMAP: Tromsø, Norway, 2017; pp. 65–102. [Google Scholar]
  4. Biskaborn, B.K.; Smith, S.L.; Noetzli, J.; Matthes, H.; Vieira, G.; Streletskiy, D.A.; Schoeneich, P.; Romanovsky, V.E.; Lewkowicz, A.G.; Abramov, A.; et al. Permafrost is warming at a global scale. Nat. Commun. 2019, 10, 1–11. [Google Scholar] [CrossRef] [Green Version]
  5. Farquharson, L.M.; Romanovsky, V.E.; Cable, W.L.; Walker, D.A.; Kokelj, S.V.; Nicolsky, D. Climate change drives widespread and rapid thermokarst development in very cold permafrost in the Canadian High Arctic. Geophys. Res. Lett. 2019, 46, 6681–6689. [Google Scholar] [CrossRef] [Green Version]
  6. Babkina, E.A.; Leibman, M.O.; Dvornikov, Y.A.; Fakashchuk, N.Y.; Khairullin, R.R.; Khomutov, A.V. Activation of cryogenic processes in the territory of Central Yamal as a result of regional and local changes in climate and thermal state of rocks. Meteorol. Climatol. 2019, 4, 99–109, (In Russian with English Summary). [Google Scholar]
  7. Luo, J.; Niu, F.; Lin, Z.; Liu, M.; Yin, G. Recent acceleration of thaw slumping in permafrost terrain of Qinghai-Tibet Plateau: An example from the Beiluhe Region. Geomorphology 2019, 341, 79–85. [Google Scholar] [CrossRef]
  8. Nitze, I.; Grosse, G.; Jones, B.M.; Romanovsky, V.E.; Boike, J. Remote sensing quantifies widespread abundance of permafrost region disturbances across the Arctic and Subarctic. Nat. Commun. 2018, 9, 1–11. [Google Scholar] [CrossRef] [PubMed]
  9. Jones, B.M.; Arp, C.D. Observing a catastrophic thermokarst lake drainage in northern Alaska. Permafr. Periglac. Process. 2015, 26, 119–128. [Google Scholar] [CrossRef]
  10. Lafrenière, M.J.; Lamoureux, S.F. Effects of changing permafrost conditions on hydrological processes and fluvial fluxes. Earth-Sci. Rev. 2019, 191, 212–223. [Google Scholar] [CrossRef]
  11. Streletskiy, D.A.; Tananaev, N.I.; Opel, T.; Shiklomanov, N.I.; Nyland, K.E.; Streletskaya, I.D.; Shiklomanov, A.I. Permafrost hydrology in changing climatic conditions: Seasonal variability of stable isotope composition in rivers in discontinuous permafrost. Environ. Res. Lett. 2015, 10, 095003. [Google Scholar] [CrossRef]
  12. Jorgenson, M.T.; Romanovsky, V.; Harden, J.; Shur, Y.; O’Donnell, J.; Schuur, E.A.; Kanevskiy, M.; Marchenko, S. Resilience and vulnerability of permafrost to climate change. Can. J. For. Res. 2010, 40, 1219–1236. [Google Scholar] [CrossRef] [Green Version]
  13. Pearson, R.G.; Phillips, S.J.; Loranty, M.M.; Beck, P.S.; Damoulas, T.; Knight, S.J.; Goetz, S.J. Shifts in Arctic vegetation and associated feedbacks under climate change. Nat. Clim. Chang. 2013, 3, 673–677. [Google Scholar] [CrossRef]
  14. Vincent, W.F.; Lemay, M.; Allard, M. Arctic permafrost landscapes in transition: Towards an integrated Earth system approach. Arct. Sci. 2017, 3, 39–64. [Google Scholar] [CrossRef] [Green Version]
  15. Tumel, N.V.; Koroleva, N.A. Permafrost-landscape differentiation Russian permafrost zone as the basis of ecological and geological studies. Eng. Geol. 2008, 2, 11–14. (In Russian) [Google Scholar]
  16. Shpolyanskaya, N.A.; Zotova, L.I. Map of Potential Landscapes Stability of Western Siberia Cryolithozone. Mosc. Univ. Bull. Ser. 5 Geogr. 1994, 56–65. (In Russian). Available online: https://istina.msu.ru/publications/article/1068198/ (accessed on 21 April 2021).
  17. Tumel, N.V.; Zotova, L.I. Cryolithozone Geosystems Response on Anthropogenic Impacts. In Arctic, Subarctic: Mosaic, Contrast, Variability of the Cryosphere: Proceeding of the International Conference; Melnikov, V.P., Drozdov, D.S., Eds.; Epoha Publishing House: Tyumen, Russia, 2015; pp. 379–382. [Google Scholar]
  18. Grebenets, V.I.; Tolmanov, V.A.; Streletskiy, D.A. Influence of dangerous cryogenic processes on linear technogenic systems of the Arctic. In AGU Fall Meeting Abstracts, San Francisco, USA, 2018; GC33E-1405; American Geophysical Union: Washington, DC, USA, 2018. [Google Scholar]
  19. Shatz, M.M.; Cherepanova, A.M. Modern assessment of technogenic geocryological consequences of natural resource management in Russian North. Earth Life 2019, 41, 387–397. [Google Scholar] [CrossRef]
  20. Zotova, L.I.; Koroleva, N.A.; Dedyusova, S.Y. Evaluation and Mapping of Crisis Ecological Situations in the Territories of Gas-Field Development in the Cryolithozone. Mosc. Univ. Bull. Ser. 5 Geogr. 2007, 3, 54–59, (In Russian with English Summary). [Google Scholar]
  21. Melnikov, E.S. Landscapes of the Permafrost Zone of West-Siberian Gas-Bearing Province; Nauka: Novosibirsk, Russia, 1983; p. 165. (In Russian) [Google Scholar]
  22. Melnikov, E.S.; Moskalenko, N.G.; Voitsekhovskaya, I.V.; Kritsuk, L.N.; Chekrygina, S.N. Map of the Natural Complexes of the North of Western Siberia; Gosgeodezia USSR: Moscow, Russia, 1991. [Google Scholar]
  23. Drozdov, D.S.; Malkova, G.V.; Korostelev, Y.V. Landscape Map of the Russian Arctic Coastal Zone. In Arctic Coastal Dynamics. Report of the 3rd International Workshop; ACD: Oslo, Norway, 2003; Volume 1, pp. 30–31. [Google Scholar]
  24. Drozdov, D.S.; Malkova, G.V.; Romanovsky, V.E.; Vasiliev, A.A.; Leibman, M.O.; Sadurtdinov, M.R.; Ponomareva, O.E.; Pendin, V.V.; Gorobtsov, D.N.; Ustinova, E.V.; et al. Digital maps of the cryolithozone and assessment of modern trends of changes in the cryosphere. In Materials of the XI International Symposium on Problems of Engineering Permafrost; Melnikov Permafrost Institute: Magadan, Russia, 2017; pp. 233–234. (In Russian) [Google Scholar]
  25. Fedorov, A.N. Permafrost Landscapes of Yakutia. Classification and Mapping Issues; Permafrost Institute: Yakutsk, Russia, 1991. (In Russian) [Google Scholar]
  26. Fedorov, A.; Vasilyev, N.F.; Torgovkin, Y.I.; Shestakova, A.A.; Varlamov, S.P.; Zheleznyak, M.; Shepelev, V.V.; Konstantinov, P.Y.; Kalinicheva, S.S.; Basharin, N.I.; et al. Permafrost-Landscape Map of the Republic of Sakha (Yakutia) on a Scale 1:1,500,000. Geosciences 2018, 8, 465. [Google Scholar] [CrossRef] [Green Version]
  27. Shestakova, A.A. Mapping of the Permafrost Landscapes Taking into Account Vegetation Succession (for Example of the Prilensky Plateau). Ph.D. Thesis, Melnikov Permafrost Institute, Yakutsk, Russia, 2011. (In Russian). [Google Scholar]
  28. Torgovkin, Y.I. Landscape Indication and Mapping Permafrost Conditions of the Lena River Basin. Ph.D. Thesis, Melnikov Permafrost Institute, Yakutsk, Russia, 2005. (In Russian). [Google Scholar]
  29. Tumel, N.V. Permafrost Geoecology: Textbook for Bachelors and Masters, 2nd ed.; Tumel, N.V., Zotova, L.I., Eds.; Yurait: Moscow, Russia, 2017; p. 220. (In Russian) [Google Scholar]
  30. Solomatin, V.I.; Ushakov, G.B.; Golubchikov, Y.N.; Zaytsev, V.A.; Chigir, V.G.; Grigorieva, N.N.; Panfilova, V.N.; Konyakhin, M.A.; Sovershaev, M.A.; Zhigarev, L.A.; et al. Geoecology of the North; Solomatin, V.I., Ed.; MSU: Moscow, Russia, 1992; (In Russian). Available online: https://elibrary.ru/item.asp?id=25369655 (accessed on 21 April 2021).
  31. Fedorov, A.N.; Konstantinov, P.Y. Response of permafrost landscapes of Central Yakutia to current changes of climate, and anthropogenic impacts. Geogr. Nat. Resour. 2009, 30, 146–150. [Google Scholar] [CrossRef]
  32. Drozdov, D.S. Mapping and remote sensing of natural and technogenic geosystems in West Siberia. In Proceedings of the Yamal Land-Cover Land-Use Change Workshop, Moscow, Russia, 28–30 January 2008; Project NNG6GE00A Funded by NASA Land-Cover Land-Use Change (LCLUC) Program. NASA: Washington, DC, USA, 2008; pp. 36–37. [Google Scholar]
  33. Moskalenko, N.G. Changes of vegetation in the North of Western Siberia in conditions of changing climate and technogenic damage. Izv. Russ. Geogr. Soc. 2012, 1, 63–72, (In Russian with English Summary). [Google Scholar]
  34. Tishkov, A.A.; Belonovskaya, E.A.; Glazov, P.M.; Krenke, A.N.; Titova, S.V.; Tsarevskaya, N.G.; Shmatova, A.G. Anthropogenic transformation of the Russian Arctic ecosystems: Approaches, methods, and assessments. Arct. Ecol. Econ. 2019, 4, 38–51, (In Russian with English Summary). [Google Scholar] [CrossRef]
  35. Tumel, N.V. Activation of Dangerous Cryogenic Processes. In Geography, Society, Environment. Volume 1: Structure, Dynamics and Evolution of Natural Systems; Kasimov, N.S., Ed.; Gorodets Publising House: Moscow, Russia, 2004; pp. 344–357. (In Russian) [Google Scholar]
  36. Bulygina, O.N.; Razuvayev, V.N.; Trofimenko, L.T.; Shvets, N.V. Automated Information System for Processing Regime Information (AISPRI). Available online: http://aisori.meteo.ru/ClimateR (accessed on 4 February 2021).
  37. Maslakov, A.A.; Nyland, K.E.; Komova, N.N.; Yurov, F.D.; Yoshikawa, K.; Kraev, G.N. Community Ice Cellars In Eastern Chukotka: Climatic And Anthropogenic Influences On Structural Stability. Geogr. Environ. Sustain. 2020, 13, 49–56. [Google Scholar] [CrossRef]
  38. Kolesnikov, S.F.; Plakht, I.R. Chukchi region. In Regional Cryolithology; Popov, A.I., Ed.; MSU: Moscow, Russia, 1989; pp. 201–217. (In Russian) [Google Scholar]
  39. Kottek, M.; Grieser, J.; Beck, C.; Rudolf, B.; Rubel, F. World Map of the Köppen-Geiger Climate Classification Updated. Meteorol. Z. 2006, 15, 259–263. [Google Scholar] [CrossRef]
  40. Abramov, A.; Davydov, S.; Ivashchenko, A.; Karelin, D.; Kholodov, A.; Kraev, G.; Lupachev, A.; Maslakov, A.; Ostroumov, V.; Rivkina, E.; et al. Two decades of active layer thickness monitoring in northeastern Asia. Polar Geogr. 2019, 1–17. [Google Scholar] [CrossRef]
  41. Brown, J.; Hinkel, K.M.; Nelson, F.E. The circumpolar active layer monitoring (CALM) program: Research designs and initial results. Polar Geogr. 2000, 24, 166–258. [Google Scholar] [CrossRef]
  42. Zamolodchikov, D.G.; Kotov, A.N.; Karelin, D.V.; Razzhivin, V.Y. Active-Layer Monitoring in Northeast Russia: Spatial, Seasonal, and Interannual Variability. Polar Geogr. 2004, 28, 286–307. [Google Scholar] [CrossRef]
  43. Federal State Statistics Service. Population of Chukotsky Autonomous District for 2019. Available online: http://habstat.gks.ru/wps/wcm/connect/rosstat_ts/habstat/resources/ (accessed on 4 February 2021).
  44. Vasil’chuk, Y.K.; Budantseva, N.A.; Farquharson, L.; Maslakov, A.A.; Vasil’chuk, A.C.; Chizhova, J.N. Isotopic evidence for Holocene January air temperature variability on the East Chukotka Peninsula. Permafr. Periglac. Process. 2018, 4, 283–297. [Google Scholar] [CrossRef]
  45. Vasil’chuk, Y.K.; Budantseva, N.A.; Vasil’chuk, A.C.; Maslakov, A.A.; Chizhova, J.N. Oxygen isotope composition of Holocene ice wedges of Eastern Chukotka. Dokl. Earth Sci. 2018, 2, 758–762. [Google Scholar] [CrossRef]
  46. Vasilchuk, Y.K.; Chizhova, Y.N.; Maslakov, A.A.; Budantseva, N.A.; Vasilchuk, A.K. Oxygen and hydrogen isotope variations in a recently formed massive ice at the mouth of the Akkani River, Eastern Chukotka. Led Sneg 2018, 1, 78–93, (In Russian with English Summary). [Google Scholar] [CrossRef]
  47. Maslakov, A.; Vasil’chuk, Y.; Komova, N.; Budantseva, N.; Zamolodchikov, D. Diagnostics of the transient layer in upper permafrost of the Eastern Chukotka coastal plains using oxygen isotope ratio. In Proceedings of the 20th International Multidisciplinary Scientific GeoConference SGEM 2020, Albena, Bulgaria, 16–25 August 2020; SGEM: Sofia, Bulgaria, 2020; Volume 20, pp. 83–88. [Google Scholar] [CrossRef]
  48. Obu, J.; Westermann, S.; Bartsch, A.; Berdnikov, N.; Christiansen, H.H.; Dashtseren, A.; Delaloye, R.; Elberling, B.; Etzelmüller, B.; Kholodovh, A.; et al. Northern Hemisphere Permafrost Map Based on TTOP Modelling for 2000–2016 at 1 km2 Scale. Earth-Sci. Rev. 2019, 193, 299–316. [Google Scholar] [CrossRef]
  49. Porter, C.; Morin, P.; Howat, I.; Noh, M.-J.; Bates, B.; Peterman, K.; Keesey, S.; Schlenk, M.; Gardiner, J.; Tomko, K.; et al. ArcticDEM. Available online: https://0-doi-org.brum.beds.ac.uk/10.7910/DVN/OHHUKH (accessed on 4 February 2021).
  50. Vasil’chuk, Y.K.; Maslakov, A.A.; Budantseva, N.A.; Vasil’chuk, A.C. Isotope signature of the massive ice bodies on the northeast coast of Chukotka Peninsula. Geogr. Environ. Sustain. 2021. [Google Scholar] [CrossRef]
  51. Maslakov, A.A.; Belova, N.G.; Baranskaya, A.V.; Romanenko, F.A. Massive ice beds on the eastern coast of the Chukotka Peninsula under climate warming: Some results of the 2014–2018 expeditions. Arct. Antarct. 2018, 4, 30–43, (In Russian with English Summary). [Google Scholar] [CrossRef]
  52. Isachenko, A.G. Landscape Science and Physical-Geographical Zoning; Higher School Publishing: Moscow, Russia, 1991; 366p. (In Russian) [Google Scholar]
  53. Reimers, N.F. Nature Management. Glossary; Mysl: Moscow, Russia, 1990; 638p. (In Russian) [Google Scholar]
  54. Gasanov, S. Structure and Formation History of Permafrost of Eastern Chukotka; Nauka: Moscow, Russia, 1969; p. 168. (In Russian) [Google Scholar]
  55. Ivanov, V.F. Quaternary Sediments of Eastern Chukotka Coastal Area; DVNTS AN SSSR: Vladivostok, Russia, 1986; p. 140. (In Russian) [Google Scholar]
  56. Kraev, G.N.; Maslakov, A.A.; Grebenets, V.I.; Kalyanto, N.L. Engineering and geocryological problems in the Territories of Settlements of the Indigenous peoples of Eastern Chukotka. Eng. Geol. 2011, 3, 52–57, (In Russian with English Summary). [Google Scholar]
  57. Vostokova, A.V.; Koshel, S.M.; Ushakova, L.A. Design of Maps. Computer Design; Textbook; Aspect Press: Moscow, Russia, 2002; 288p. (In Russian) [Google Scholar]
  58. Korobov, V.B. Expert Methods in Geography and Geoecology; Pomorsky State University: Arkhangelsk, Russia, 2008; 244p. (In Russian) [Google Scholar]
  59. Tumel, N.; Zotova, L. Diagnostics and Mapping of Geoecological Situations in the Permafrost Zone of Russia. Geosciences 2019, 9, 353. [Google Scholar] [CrossRef] [Green Version]
  60. Shur, Y.; Hinkel, K.M.; Nelson, F.E. The transient layer: Implications for geocryology and climate-change science. Permafr. Periglac. Process. 2005, 16, 5–17. [Google Scholar] [CrossRef]
  61. Bolysov, S.; Bredikhin, A.; Borsuk, O. Environmental Geomorphology: New Directions; MSU: Moscow, Russia, 2015; 220p. (In Russian) [Google Scholar]
  62. Donetskov, A.; Zotova, L. Cryogenic Landscapes Stability to the Exogenous Processes Activation on the Example of the Medvezhye Field (West Siberia). In Proceedings of the Pushchino Permafrost Conference: Solving the Puzzles from Cryosphere, Pushchino, Russia, 15–18 April 2019; “OneBook.ru” Publishing House: Moscow, Russia, 2018; pp. 151–153. [Google Scholar]
  63. Maslakov, A.; Shabanova, N.; Zamolodchikov, D.; Volobuev, V.; Kraev, G. Permafrost degradation within Eastern Chukotka CALM sites in the 21st century based on CMIP5 climate models. Geosciences 2019, 9, 232. [Google Scholar] [CrossRef] [Green Version]
  64. Moskalenko, N.G.; Jorgenson, T.; Kanevsky, M.Z.; Nosov, D.; Shur, Y.L. Interrelationships of vegetation and seasonal thawing of permafrost in the Arctic tundra of Yamal and Alaska. Izv. Russ. Geogr. Soc. 2014, 3, 64–79, (In Russian with English Summary). [Google Scholar]
Figure 1. Study area. Mean annual ground temperature (MAGT) from [48] and elevation data from ArcticDEM v.7 [49].
Land 10 00445 g001
Figure 2. Stages of drawing up the landscape map: (a) identifying standards (key plots) on a satellite image; (b) conducting a controlled classification of covers; (c) generalizing of landscape contours. The legend is given in Table S1.
Land 10 00445 g002
Figure 3. Geomorphology of the study area. Descriptions of the indices are given in the text.
Land 10 00445 g003
Table 1. Factors affecting exogenous processes activation for the Eastern Chukotka coastal plains.
Assessment FactorsImpact Assessment (Scores)Weight
1
(Weak Impact)
2
(Moderate Impact)
3
(Significant Impact)
4
(Strong Impact)
WIce/water content of the transient layer (%)0–5050–100100–200>200, presence of ground ice bodies0.45
LLithology of the active layerboulders, pebbles, and gravelsands with pebbles and gravelclays, loams, and sandy loamspeat0.15
PDecreasing of vegetation protective propertiesMinimal
(sparse grass and shrub cover)
Medium (grass-moss cover,
hpeat < 0.1 m)
Strong (cotton grass-sedge hummocks, hpeat 0.1–0.2 m)Maximal (sedge-moss wet meadows and swamps, hpeat > 0.2 m)0.30
SVegetation self-recovery rate (years)Fast
1–3
Moderate
4–6
Slow
7–9
Slow and incomplete
>10
0.10
Publisher’s Note: MDPI stays neutral with regard to jurisdictional claims in published maps and institutional affiliations.

