
Relative Contribution of the Xiaolangdi Dam to Runoff Changes in the Lower Yellow River
by
 ,
,
Qinghe Zhao
1,2 ,
,
Shengyan Ding
1,2,*,
Xiaoyu Ji
1,2,
Zhendong Hong
1,2,
Mengwen Lu
1,2 and
Peng Wang
3 1
College of Environment and Planning, Henan University, Kaifeng 475004, China
2
Key Laboratory of Geospatial Technology for the Middle and Lower Yellow River Regions, Henan University, Ministry of Education, Kaifeng 475004, China
3
Yellow River Engineering Consulting Co., Ltd., Zhengzhou 450016, China
*
Author to whom correspondence should be addressed.
Land 2021, 10(5), 521; https://0-doi-org.brum.beds.ac.uk/10.3390/land10050521
Submission received: 2 April 2021
/
Revised: 8 May 2021
/
Accepted: 11 May 2021
/
Published: 13 May 2021
(This article belongs to the Special Issue The Role of Water Management: Feedback between Water and Land Degradation)
Abstract
:Human activities are increasingly recognized as having a critical influence on hydrological processes under the warming of the climate, particularly for dam-regulated rivers. To ensure the sustainable management of water resources, it is important to evaluate how dam construction may affect surface runoff. In this study, using Mann–Kendall tests, the double mass curve method, and the Budyko-based elasticity method, the effects of climate change and human activities on annual and seasonal runoff were quantified for the Yellow River basin from 1961–2018; additionally, effects on runoff were assessed after the construction of the Xiaolangdi Dam (XLD, started operation in 2001) on the Yellow River. Both annual and seasonal runoff decreased over time (p < 0.01), due to the combined effects of climate change and human activities. Abrupt changes in annual, flood season, and non-flood season runoff occurred in 1986, 1989, and 1986, respectively. However, no abrupt changes were seen after the construction of the XLD. Human activities accounted for much of the reduction in runoff, approximately 75–72% annually, 81–86% for the flood season, and 86–90% for the non-flood season. Climate change approximately accounted for the remainder: 18–25% (annually), 14–19% (flood season), and 10–14% (non-flood season). The XLD construction mitigated runoff increases induced by heightened precipitation and reduced potential evapotranspiration during the post-dam period; the XLD accounted for approximately 52% of the runoff reduction both annually and in the non-flood season, and accounted for approximately −32% of the runoff increase in the flood season. In conclusion, this study provides a basic understanding of how dam construction contributes to runoff changes in the context of climate change; this information will be beneficial for the sustainable management of water resources in regulated rivers.
1. Introduction
Water resources are of great significance to all organisms on Earth. Sustainable socioeconomic development across regional, national, and global scales also depends on adequate water resources [1], but in recent decades the world has faced new challenges in this regard. Existing water resources are proving insufficient to meet booming demands due to population expansion and ecosystem degeneration [2,3]. Surface runoff, an important component of the water cycle, influences river ecosystem functioning and the health of human beings. Runoff is critical to understanding alterations in the global water system, particularly water-energy balances in the hydrological cycle, where water moves between the atmosphere and underlying surfaces [4]. Numerous studies to date have assessed how surface runoff changes in response to disturbance in different regions worldwide [5,6,7], in particular examining the interaction between climate change and human activities [8]. These studies serve as a reference for how to assess current surface runoff variation and project future changes [9]. This approach will help address urgent challenges with water scarcity in domestic, industrial, and agricultural contexts [10].
The impacts of climate change and human activities on surface runoff appear in all aspects of the hydrological cycle [2,11]. Climate change is the primary determinant of the hydrological cycle [9], which in turn alters the quantity, quality, and spatiotemporal distribution of surface runoff [4]. Changes in air temperature (T), as a result of global warming, can change the rate of evapotranspiration (ET) and the form of precipitation (P), resulting in significant reductions in surface runoff [12]. For example, in Southern France roughly one third of watersheds experienced a decrease in surface runoff as a result of higher spring and summer temperatures [13]. Alterations in the amount, intensity, and/or distribution of precipitation can directly affect runoff volume and the availability of water resources [14]. Any changes in precipitation tend to be amplified in the resultant effects on surface runoff [15]. For instance, a 10% decrease in precipitation in the Middle Yellow River basin led to a 15–25% decrease in surface runoff [16], while a 20% decrease in precipitation in another study [17] produced a 29–32% decrease in surface runoff. Though the relationship between precipitation and surface runoff is most often positive, negative relationships have also been found. For example, Liu et al. [18] found that increased precipitation led to reduced surface runoff in river basins around the world. This discrepancy indicates that changes in surface runoff are likely affected by the interaction of multiple factors, including not only climatic changes, but also human activities.
Human activities, such as industrial, domestic, and agricultural water extraction [19], dam and reservoir construction [20,21], water and soil conservation measures [22,23], land use changes [24], and ecological restoration projects [25], can directly and indirectly affect the hydrological cycle via infiltration, interception, and evapotranspiration [24]; as a result, surface runoff may also be affected [3]. For instance, a hypothetical decrease of approximately 3500 km3/year in terrestrial evapotranspiration, induced by changes to land cover, would lead to a 7.6% increase in surface runoff [26], the effects of land cover changes on annual global runoff are similar in magnitude (if not greater) than those of other major drivers. Globally, the long-term average discharge has decreased by 2.7% due to water withdrawals for irrigation [27]. Meanwhile, the combined effects of reservoir operation and irrigation extraction have also altered discharge timing, as shown by a study that found a 2.1% reduction in the global discharge from 1981–2000 [28].
Given the importance of climate change and human activities for surface runoff, quantitative assessments of their effects have become increasingly common, providing a foundation for the sustainable management of water resources [5,9]. Numerous studies have been conducted to distinguish the impacts of climate change and human activities on alterations in surface runoff. These studies typically utilize physical hydrological models, empirical statistics, and/or sensitivity- or elasticity-based methods [29]. Physical hydrological models, such as the Soil and Water Assessment Tool (SWAT), the variable infiltration capacity hydrological model (VIC), the Xinanjiang model, the topography-based hydrological model (TOPMODEL), and the Precipitation Runoff Modeling System (PRMS) [2], are used to simulate natural runoff (prior to disturbance by climate change or human activities) based on meteorological, topographical, and geomorphic data [30,31,32]. By comparing the observed and simulated surface runoff, the relative effects of climate change and human activities can be distinguished [2,8]. Physically-based models explicitly consider the role of driving factors in the formation of surface runoff and have been widely used to address the relative effects of climate change and human activities on runoff change [2]. However, several factors have limited the wider application of these models [31], such as the requirement for detailed input data [3,33] and uncertainty in model parameters and structural sensitivity [1,8]. Empirical statistics, such as multivariate regressive [34] and the double mass curve method [32], put more emphasis on the relationships between runoff and various climate variables [3,35]. These methods usually require long-term historical hydrometeorology data [32,33]. For example, the double mass curve method is widely used to evaluate long-term trends in precipitation and discharge, as well as their relationship. However, its reliance on the precipitation-discharge relationship can result in uncertainties in interpreting the evaluation results [33]. The sensitivity- or elasticity-based methods, which include the hydrological sensitivity method [3], the water balance method [18], climate elasticity [1,32], and the Budyko-based approaches [30], are simple and effective tools that consider both water and energy constraints in the long-term hydrological processes of a given area [31,35]. These methods generally separate the total variation in surface runoff into that induced by climate variables (e.g., precipitation, temperature, and potential evapotranspiration [PET]) versus non-climate variables, which are always attributed to human activities [3]. In comparison with the physical hydrological models, the sensitivity- or elasticity-based methods require relatively few data and can reduce parameter and structural uncertainty; thus, these methods have been used to effectively address surface runoff responses to climate change and human activities.
Even with the methods described above, it remains very difficult to accurately separate and quantify the effects of climate change and human activities on runoff, as all methods are subject to uncertainty and may draw inconsistent conclusions [3,32]. Moreover, with regard to specific human activities (e.g., land use change, water extraction, urbanization, and dam construction), few studies have quantitatively assessed the individual effects of such activities on surface runoff [33]. In particular, few studies have examined the effects of dam construction, which may directly alter the magnitude, duration, timing, and rate of runoff [20]; it is therefore important to disentangle the effects of dam construction specifically from those of climate change and other human activities.
Dams are essential for managing water resources and may be constructed for diverse purposes, including hydropower generation, seasonal flood control, to supply irrigation and drinking water, recreation, and navigation [36,37]. However, dams can be a double-edged sword. While addressing human needs, dams are often cited as significantly modifying river ecosystems [38]. They may alter the hydrological connectivity (or continuity) of river networks in four dimensions: by affecting flow regulation (i.e., longitudinal connectivity along the river channel), lateral connectivity between the main channel, floodplain, and riparian areas; vertical connectivity between the groundwater, surface water, and atmosphere; and also, temporal connectivity across seasons [39]. Such alterations not only threaten diverse fundamental processes in river ecosystems, but also reduce functioning and essential services supported by river ecosystems [20,38]. A large number of studies have evaluated runoff indicators post-dam construction using three approaches: the monitoring station approach (comparison of the same monitoring stations before and after dam construction) [37,40], the control station approach (comparison between up- and down-stream of the dam) [36,41], and simulation analysis (comparison of observed and simulated data) [21]. These studies have provided crucial insights into runoff changes due to ongoing dam construction worldwide. However, due to complex interactions between climate change and human activities, how dams specifically affect runoff is not yet thoroughly understood. Consequently, distinguishing the effects of dam construction from those of concurrent climate change and human activities is desirable for sustainable water resource management [42].
The Yellow River is the second largest river in China and is the most important water source for Northwestern and Northern China [19]. The Yellow River basin is a core region for grain production and plays an irreplaceable role in the development of China’s agricultural economy. However, it is characterized by considerable water shortages and environmental fragility [23]. Under the impact of climate change and human activities, significant changes in runoff, mostly in the form of reductions, have taken place since 1986 [19,43]. Such changes critically aggravate water shortages in the Yellow River basin, especially in the lower reaches, which have high sediment loads [4,23]. To address channel siltation and water shortages in the lower Yellow River, a series of water conservation projects have been implemented. The Xiaolangdi Dam (XLD), located at the exit of the last gorge in the middle reaches of the Yellow River, is one of these projects. It is the second largest such project in China after the Three Gorges Dam, and it controls 92.3% of the total area, 91.5% of the total water discharge, and 98% of the total sediment discharge in the Yellow River. Since becoming operational in 2001, the XLD has played an important role in flood control, siltation reduction, power generation, the storage and discharge of sediment, and irrigation, among other roles [44,45]. Several studies have examined the effects of climate change and human activities on runoff changes in the Yellow River [46]; however, few have examined the role of the XLD in mediating runoff changes in this context of climate change and human activities.
Therefore, the objectives of this study were to: (1) investigate long-term trends and abrupt changes in annual and seasonal runoff in the lower Yellow River from 1961–2018; (2) separate the effects of climate change and human activities on changes in runoff using both the double mass curve method and the Budyko-based elasticity method; and (3) quantify the relative contribution of the XLD to changes in annual and seasonal runoff in the lower Yellow River. The findings of this study should provide critical guidance for the future sustainable management of water resources in regulated rivers.
2. Materials and Methods
2.1. Study Area
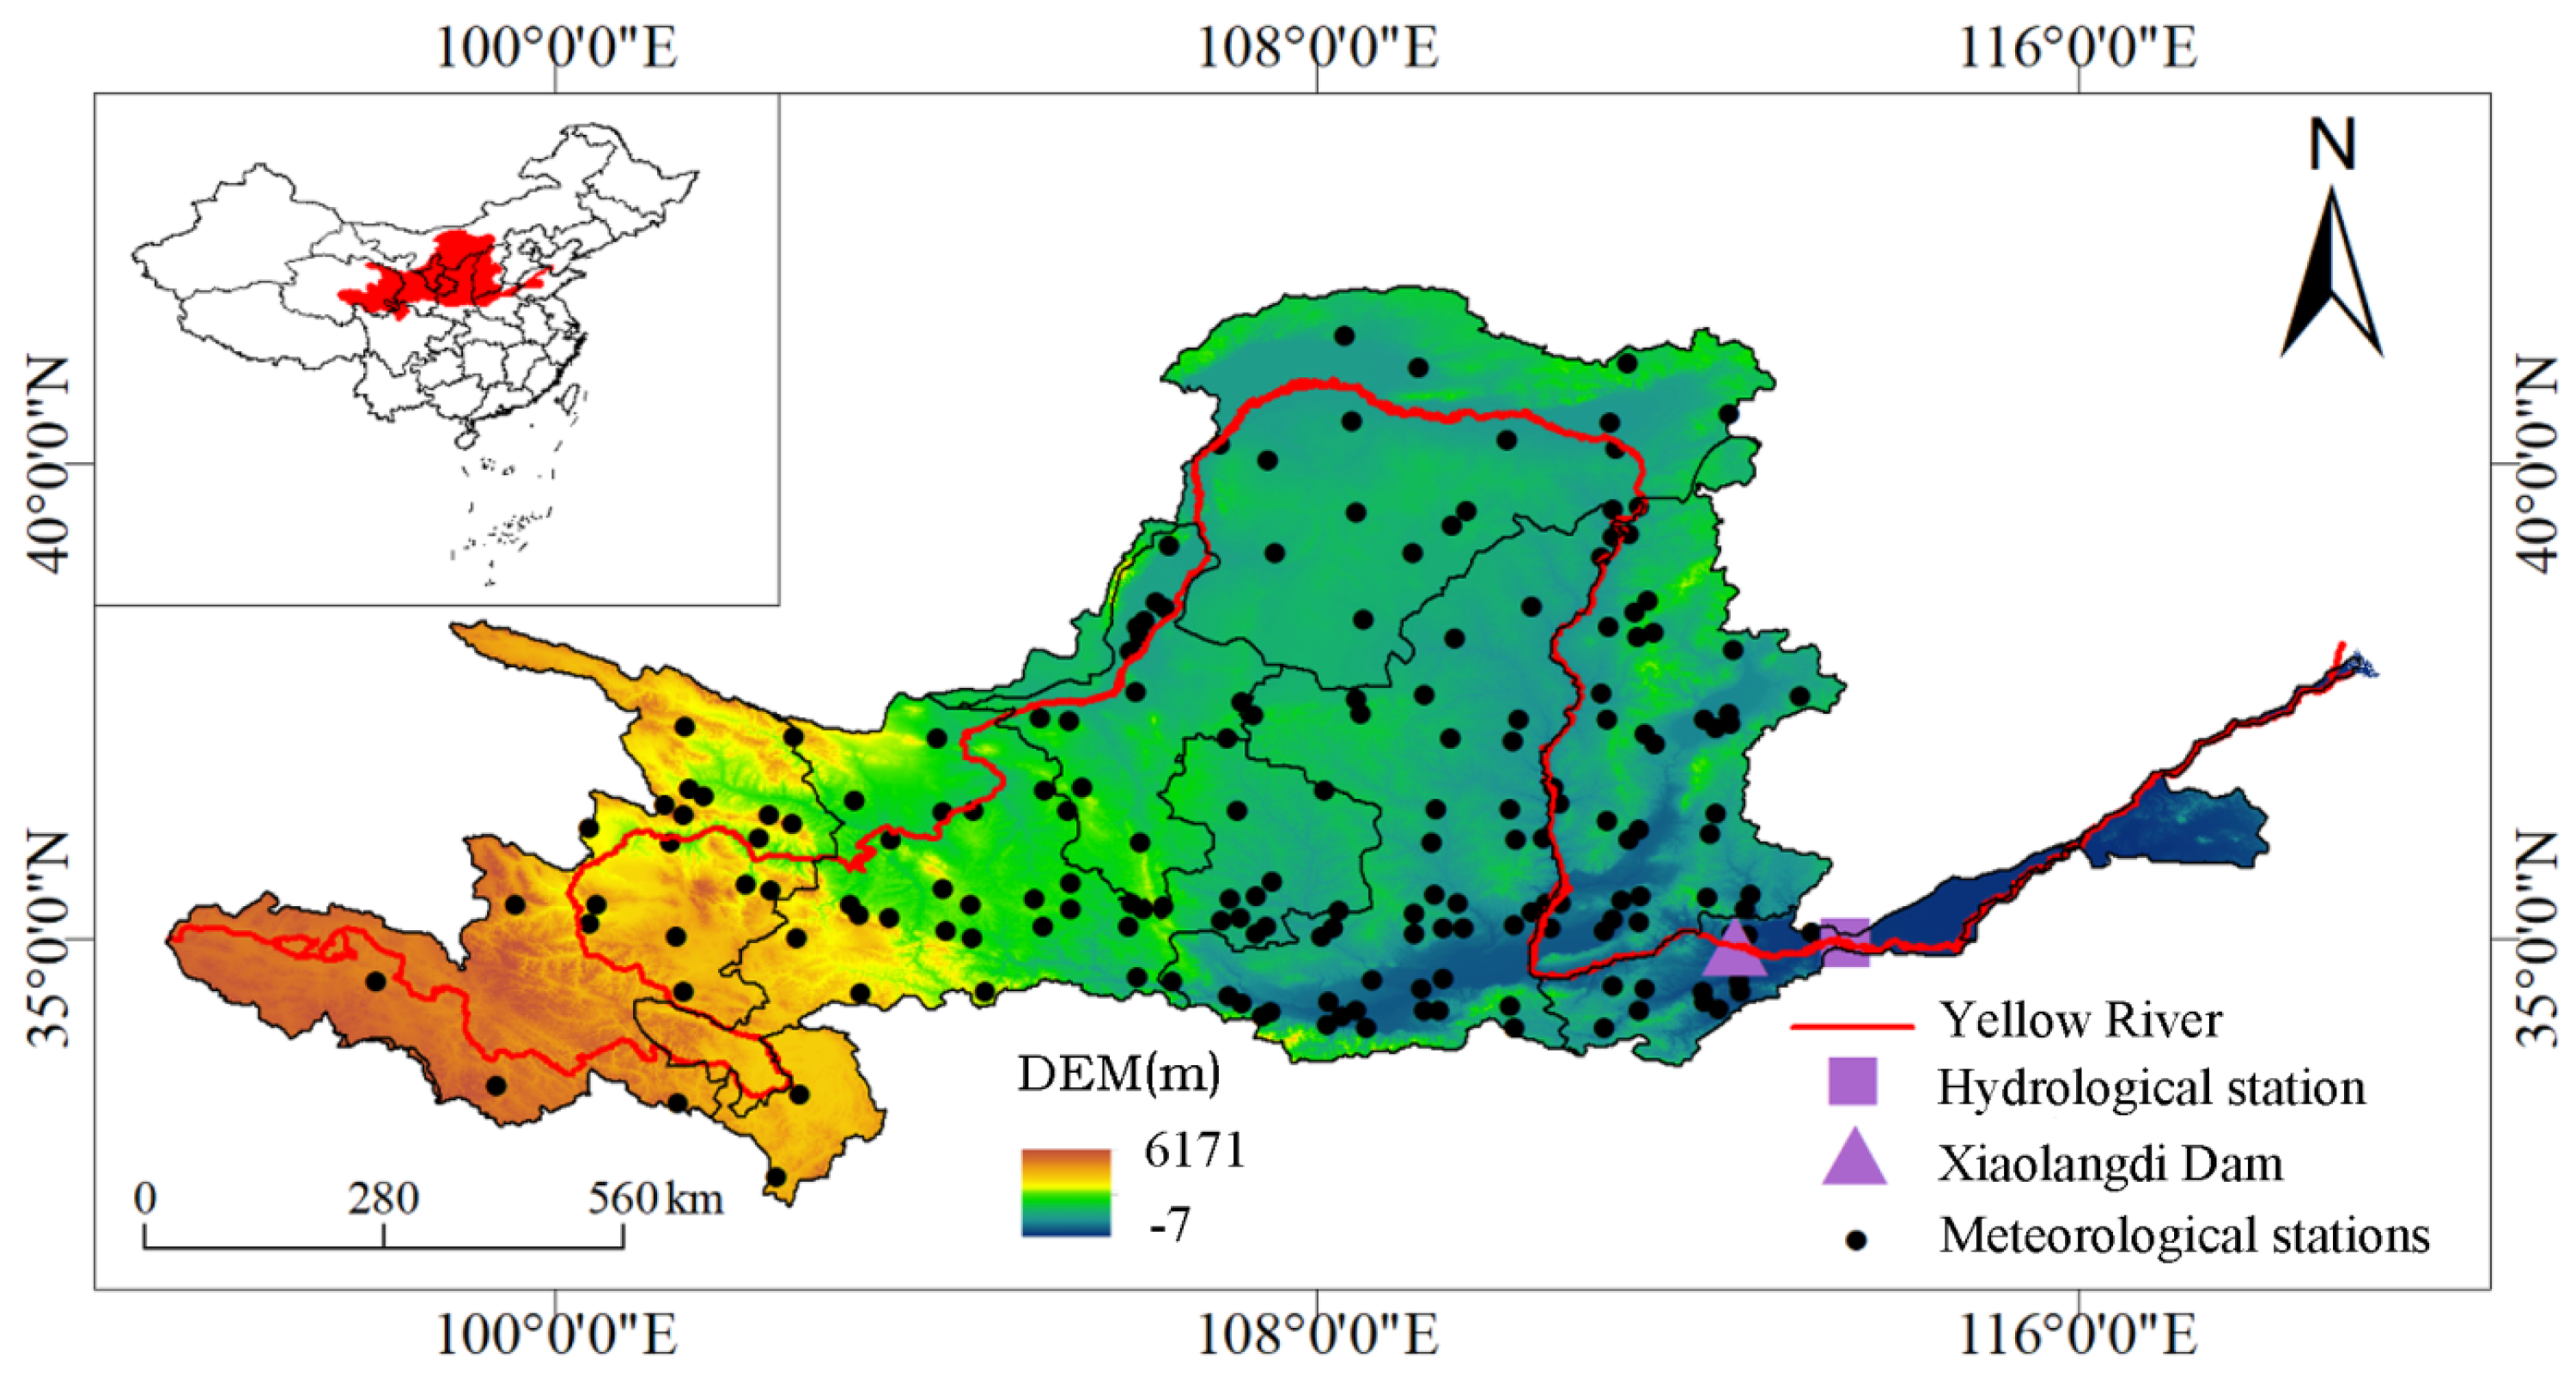
The Yellow River basin is located between 95°53′–119°05′ E longitude and 32°10′–42°50′ N latitude (Figure 1). The Yellow River has a drainage area of 7.95 × 10⁵ km2 and a length of 5464 km; it flows through the Qinghai-Tibet Plateau, the Inner Mongolia Plateau, the Loess Plateau, and the Huang-Huai-Hai Plain from west to east [19]. Grassland and unused land were the dominant land use types in the Yellow River basin, which accounted for 40.75% and 28.52% of the total land, respectively. The unused land is mainly composed of sandy land, bare rock gravel land, and saline alkali land. The cultivated land, forest land, construction land, and water area accounted for 17.01%, 8.50%, 2.94%, and 2.27% respectively of that total [19].
The Yellow River is generally divided into upper, middle, and lower reaches [44]. The upper reaches stretch from the river headwaters to Hekou Town (111°9′16″ E, 40°13′58″ N) in Inner Mongolia and account for 53.8% of the total river area. This area serves as the source of all fresh water in the Yellow River and is characterized by high water discharges with low sediment yields [4]. The upper reaches are surrounded by a continuous high mountain range with perennial snow cover. The middle reaches of the Yellow River are from Hekou Town to Taohuayu in Henan Province and account for 43.3% of the total river area. Flowing along the Loess Plateau, this area is characterized by severe soil erosion and heavy sediment loads [29]. The lower reaches of the Yellow River, which extend from Taohuayu to the Yellow River Delta and pass through the Huang-Huai-Hai Plain, are characterized by heavy sediment deposition with an average channel gradient of 0.15 m·km−1 [45]. Large amounts of suspended sediments (4 × 10⁸ kg per year) originating from the Loess Plateau are deposited on the riverbed of the lower reaches. As a consequence, the riverbed is 7–13 m higher than the surrounding alluvial plain; this area is famously known as the “suspended river” or “perched river” [47]. In order to reduce deposition and regulate floods and droughts in the lower Yellow River, the Xiaolangdi Dam (XLD), with a reservoir storage capacity of 126.5 × 10⁸ m3, was constructed from September 1994 to December 2001 [45]. The reservoir area experiences a temperate continental monsoon climate, with an annual average temperature of 12.4–14.3 °C, annual average precipitation of 616 mm, and annual average humidity of 62%.
Since 2002, the Yellow River Conservancy Commission (YRCC) of China conducted the water-sediment regulation scheme (WSRS) to mitigate the rising riverbed in the lower Yellow River and to reduce the sediment retention in the XLD Reservoir. Generally, the WSRS lasts for 2–3 weeks with two phases respectively for water regulation and sediment regulation. During the water regulation phase, which lasts for ∼10 days, a huge amount of runoff was released at the maximum discharge of 4000 m3/s to scour the river channel downstream dam and to preserve reservoir storage for flood control [44,45,46]. During the sediment regulation phase, sediments trapped in the XLD Reservoir were scoured to the lower Yellow River to maintain reservoir capacity. Meanwhile, during the sediment regulation phase, the water discharge from the XLD decreased from 4000 to ∼2000–3000 m3/s. During the WSRS, more than 1/3 of the total annual sediments and runoff was expected to be discharged into the sea [44,45,46]. As a consequence, the XLD and the WSRS should be the most direct factor influencing runoff in the lower Yellow River. The Huayuankou hydrological station located downstream of the XLD is an important hydrological monitoring station for the lower Yellow River. In this study, the Huayuankou hydrological station was selected as a base to analyze runoff changes in the Yellow River Basin.
2.2. Data Acquisition and Processing
The data used in this study included daily meteorological data and monthly runoff data collected from 1961–2018. Daily meteorological data were collated from 182 national climatic stations located within the upper and middle reaches of the Yellow River basin (Figure 1) and were obtained from the National Meteorological Information Center of China (http://data.cma.cn accessed on 17 June 2019); variables included precipitation, temperature (daily mean, maximum, and minimum), relative humidity, wind velocity, and sunshine duration. Using the daily meteorological data, potential evapotranspiration (PET) was calculated according to the Penman-Monteith equation revised by the Food and Agriculture Organization (FAO) [8]. The mean areal values for the meteorological variables and PET were calculated for the upper and middle reaches of the Yellow River basin using spatial interpolation [29]. Annual values for PET and the meteorological variables were obtained from the cumulative monthly data [23]. Monthly runoff data at the Huayuankou hydrological station were acquired from the Yellow River Conservancy Commission for the period from 1961 to 2018. For both the daily meteorological data and monthly runoff data, annual, flood season (June–October), and non-flood season (from November to May in next year) values were calculated.
2.3. Methodology
Runoff depth refers to the ratio of the total runoff at a designated cross section of the river within a certain time period to the related catchment area. Runoff data for different time periods were converted to runoff depth data. All runoff analyses in this study were based on runoff depth. Linear regression, moving averages, coefficients of variation, and extreme value ratios were used to analyze variation in runoff from 1961–2018. Among the analyses, linear regression is one of the simplest and most direct methods to test for trends in a time series, but it can be difficult to judge trend significance. The moving average method filters out frequent random fluctuations in the meteorological and hydrological data, making for smoother and clearer trend lines. It is also one of the most basic methods used to evaluate meteorological and hydrological series. In this study, hydrological series were analyzed with moving averages of five and ten years. The coefficient of variation is defined as the ratio of the standard deviation to the mean (for a given time series) and reflects inter-annual variation in long-term data (i.e., the degree of dispersion). Lastly, extreme value ratios are those between the maximum and minimum values of a given meteorological or hydrological variable over a particular timescale; they reflect the range of variation seen across long-term data. The larger the value, the greater the range, and vice versa. Nonparametric Mann-Kendall trend tests were used to determine the significance of runoff trends, while standard Mann-Kendall tests and the double mass curve method were used to detect abrupt changes in runoff time series. The double mass curve method and the sensitivity analysis method were applied to separate the effects of climate change and human activities on changes in runoff.
2.3.1. Mann-Kendall Tests
The nonparametric Mann-Kendall trend test has been widely used to evaluate meteorological and hydrological series [33,36]. One of the advantages of this test is that it does not require the data to conform to any particular probability distribution [37]. In this study, the Mann-Kendall trend test has been used to test the significance of change trend for the runoff series and meteorological series. The definition of the Mann-Kendall trend test can be found in references [5,33,36,37].
Many methods used to calculate the relative contributions of climate change versus human activities to variation in runoff require a baseline period to be defined [30,32]. Change points between the baseline period (pre-change period) and post-change period can then be identified for the runoff series. In this study, two methods commonly used for detecting abrupt change points were implemented. The first, the Mann-Kendall test, is a graphical technique based on progressive and retrogressive analysis of the Mann-Kendall statistic, the detail definition could be found in references [48,49]. The second, the double mass curve method, is defined as below.
2.3.2. Double Mass Curve
Double mass curves represent another approach for detecting abrupt change points in a runoff series; in this study, this approach was used to confirm change points detected by Mann-Kendall tests. A double mass curve is a plot showing the cumulative values of two related variables in a concurrent period [50]. Without the impact of human activities, the double mass curve is a straight line; deviations in the curve occur when human activities significantly affect at least one of the variables [4]. Recently, the double mass curve between precipitation and runoff has been effectively used to detect changes in hydrological regimes due to human activities [1]. In this study, a double mass curve between annual precipitation and annual runoff was used to identify abrupt changes in runoff occurring between 1961 and 2018.
The double mass curve method was also used to quantify how climate change and human activities contributed to changes in runoff. This method uses linear regression analysis of hydrological time series [32]. The regression equation for cumulative runoff and cumulative precipitation in the baseline period (pre-change period) can be calculated as:
where a denotes the rate of change in cumulative runoff versus cumulative precipitation, while b denotes the intercept. P denotes precipitation (mm). Next, the regression equation is applied to simulate the cumulative runoff in the post-change period. Once the cumulative runoff has been calculated, the annual runoff can be estimated [32]. The contributions from climate change and human activities can then be calculated:
where ΔQT indicates the total variation in runoff in mm; Qpre and Qpost indicate the runoff in the pre-change and post-change period, respectively; Qre-post indicates the reconstructed runoff for the post-change period based on the regression equation; and ΔQC and ΔQH represent the relative contributions of climate change and human activities, respectively.
2.3.3. Budyko-Based Elasticity Method
The Budyko hypothesis describes the water balance in a watershed as a function of available water and energy [43]. Precipitation (P) is suggested to measure the available water, while the potential evapotranspiration (PET) is proposed to measure the available energy [18]. The water balance can then be described as follows:
where P, AET, ΔS, and Q represent precipitation, actual evapotranspiration, the change in water storage, and streamflow, respectively. When considering the long-term water balance in a watershed, ΔS can be omitted [9]. The AET can be calculated with the following equation [18]:
where PET and ω represent the potential evapotranspiration and the integrated watershed characteristics (e.g., soil properties, slope, and vegetation cover), respectively. The PET can be estimated using the FAO’s Penman-Monteith equation [18]:
where Rn, G, T, U2, es, ea, es − ea, Δ, and γ denote the net radiation (MJ·m−2·d−1), soil heat flux density (MJ·m−2·d−1), mean daily air temperature at 2 m height (°C), the wind speed at 2 m height (m·s−1), the saturation vapor pressure (kPa), the actual vapor pressure (kPa), the saturation vapor pressure deficit(kPa), the slope of the vapor pressure (kPa·°C−1), and the psychrometric constant (kPa·°C−1), respectively. Thus, the water balance equation can be expressed as:
Given Q, P, and PET, the watershed characteristics (ω) can be estimated.
Assuming that the total change in Q (ΔQ) can be divided into two parts, namely, that induced by climate change (ΔQC) and that caused by human activities (ΔQH), and that P and PET are independent variables, ΔQC can be estimated with the climate elasticity model [7]:
where εP and εPET indicate the elasticity in Q in response to P and PET, respectively. ΔQ is calculated as the average annual Q during the pre-change period minus the average annual Q during the post-change period. ΔQH is then ΔQ minus ΔQC. ΔQP and ΔQPET are the changes in ΔQC induced by changes in annual P and average annual PET from the pre-change period to the post-change period. The elasticity values are given as follows [7]:
where Φ denotes the ratio of PET to P.
The individual contributions of climate change (P and PET) and human activities to changes in runoff can be obtained using the following equations:
where ηP, ηPET, and ηH are the percent contributions attributable to climate change (P and PET) and human activities, respectively.
3. Results
3.1. Changes in Annual and Seasonal Precipitation and Air Temperature
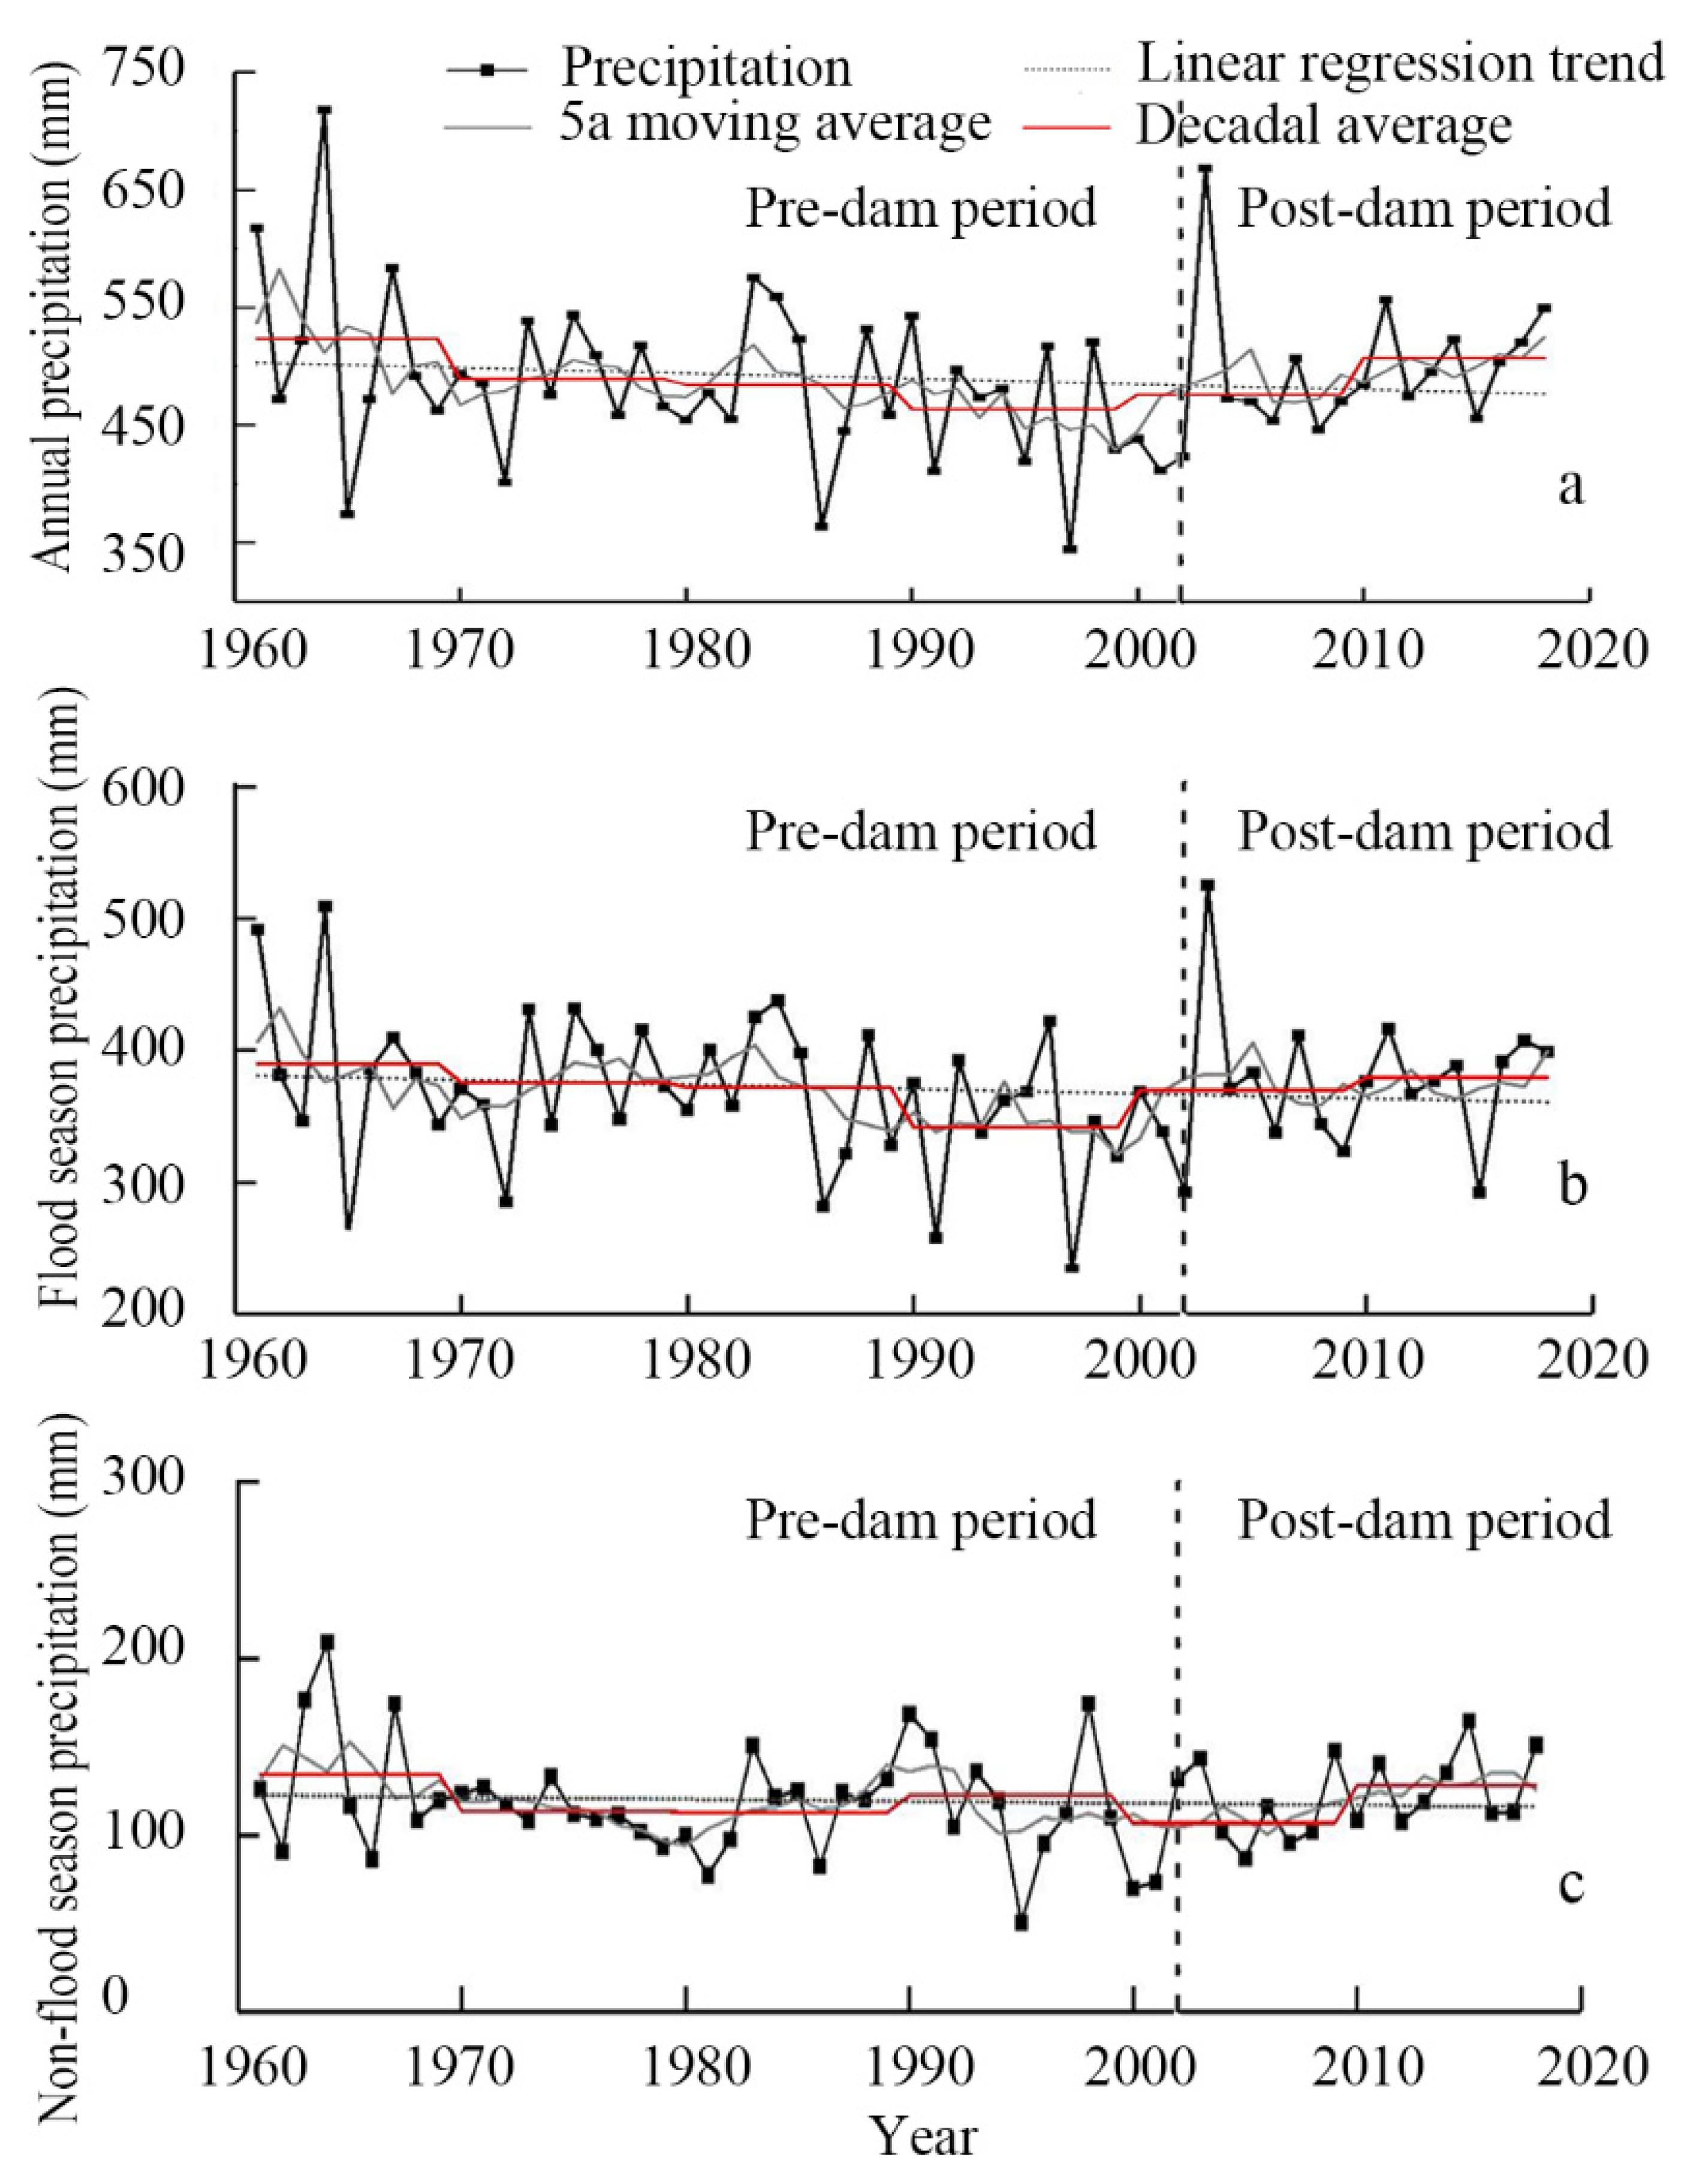
From 1961–2018, the average annual precipitation in the Yellow River basin was 489.71 mm, with an extreme value ratio of 2.08. The maximum precipitation was observed in 1964 (Figure 2a), at 718.06 mm, while the minimum runoff occurred in 1997, at only 344.47 mm. The Mann-Kendall trend test revealed that annual precipitation decreased with insignificant trend (p > 0.05) from 1961 to 2018 (Table 1). Both the five-year moving average and decadal average analysis showed annual runoff to be highest in the 1960s and 2010s. Seasonal precipitation showed a trend similar to that of annual precipitation. Runoff in both the flood season and non-flood season decreased with insignificant trend (p > 0.05) from 1961 to 2018 (Table 1). Comparing the flood season (Figure 2b) and non-flood season (Figure 2c), the average precipitation was 370.45 mm and 119.26 mm, respectively; the maximum precipitation was 525.12 mm (in 2003) and the minimum 232.46 mm (in 1997) for the flood season, while the maximum was 208.84 mm (in 1964) and the minimum 50.53 mm (in 1995) for the non-flood season. Flood season precipitation showed less inter-annual variation (Cv = 0.15) than did non-flood season precipitation (Cv = 0.24) (Table 1), though both showed low variability.
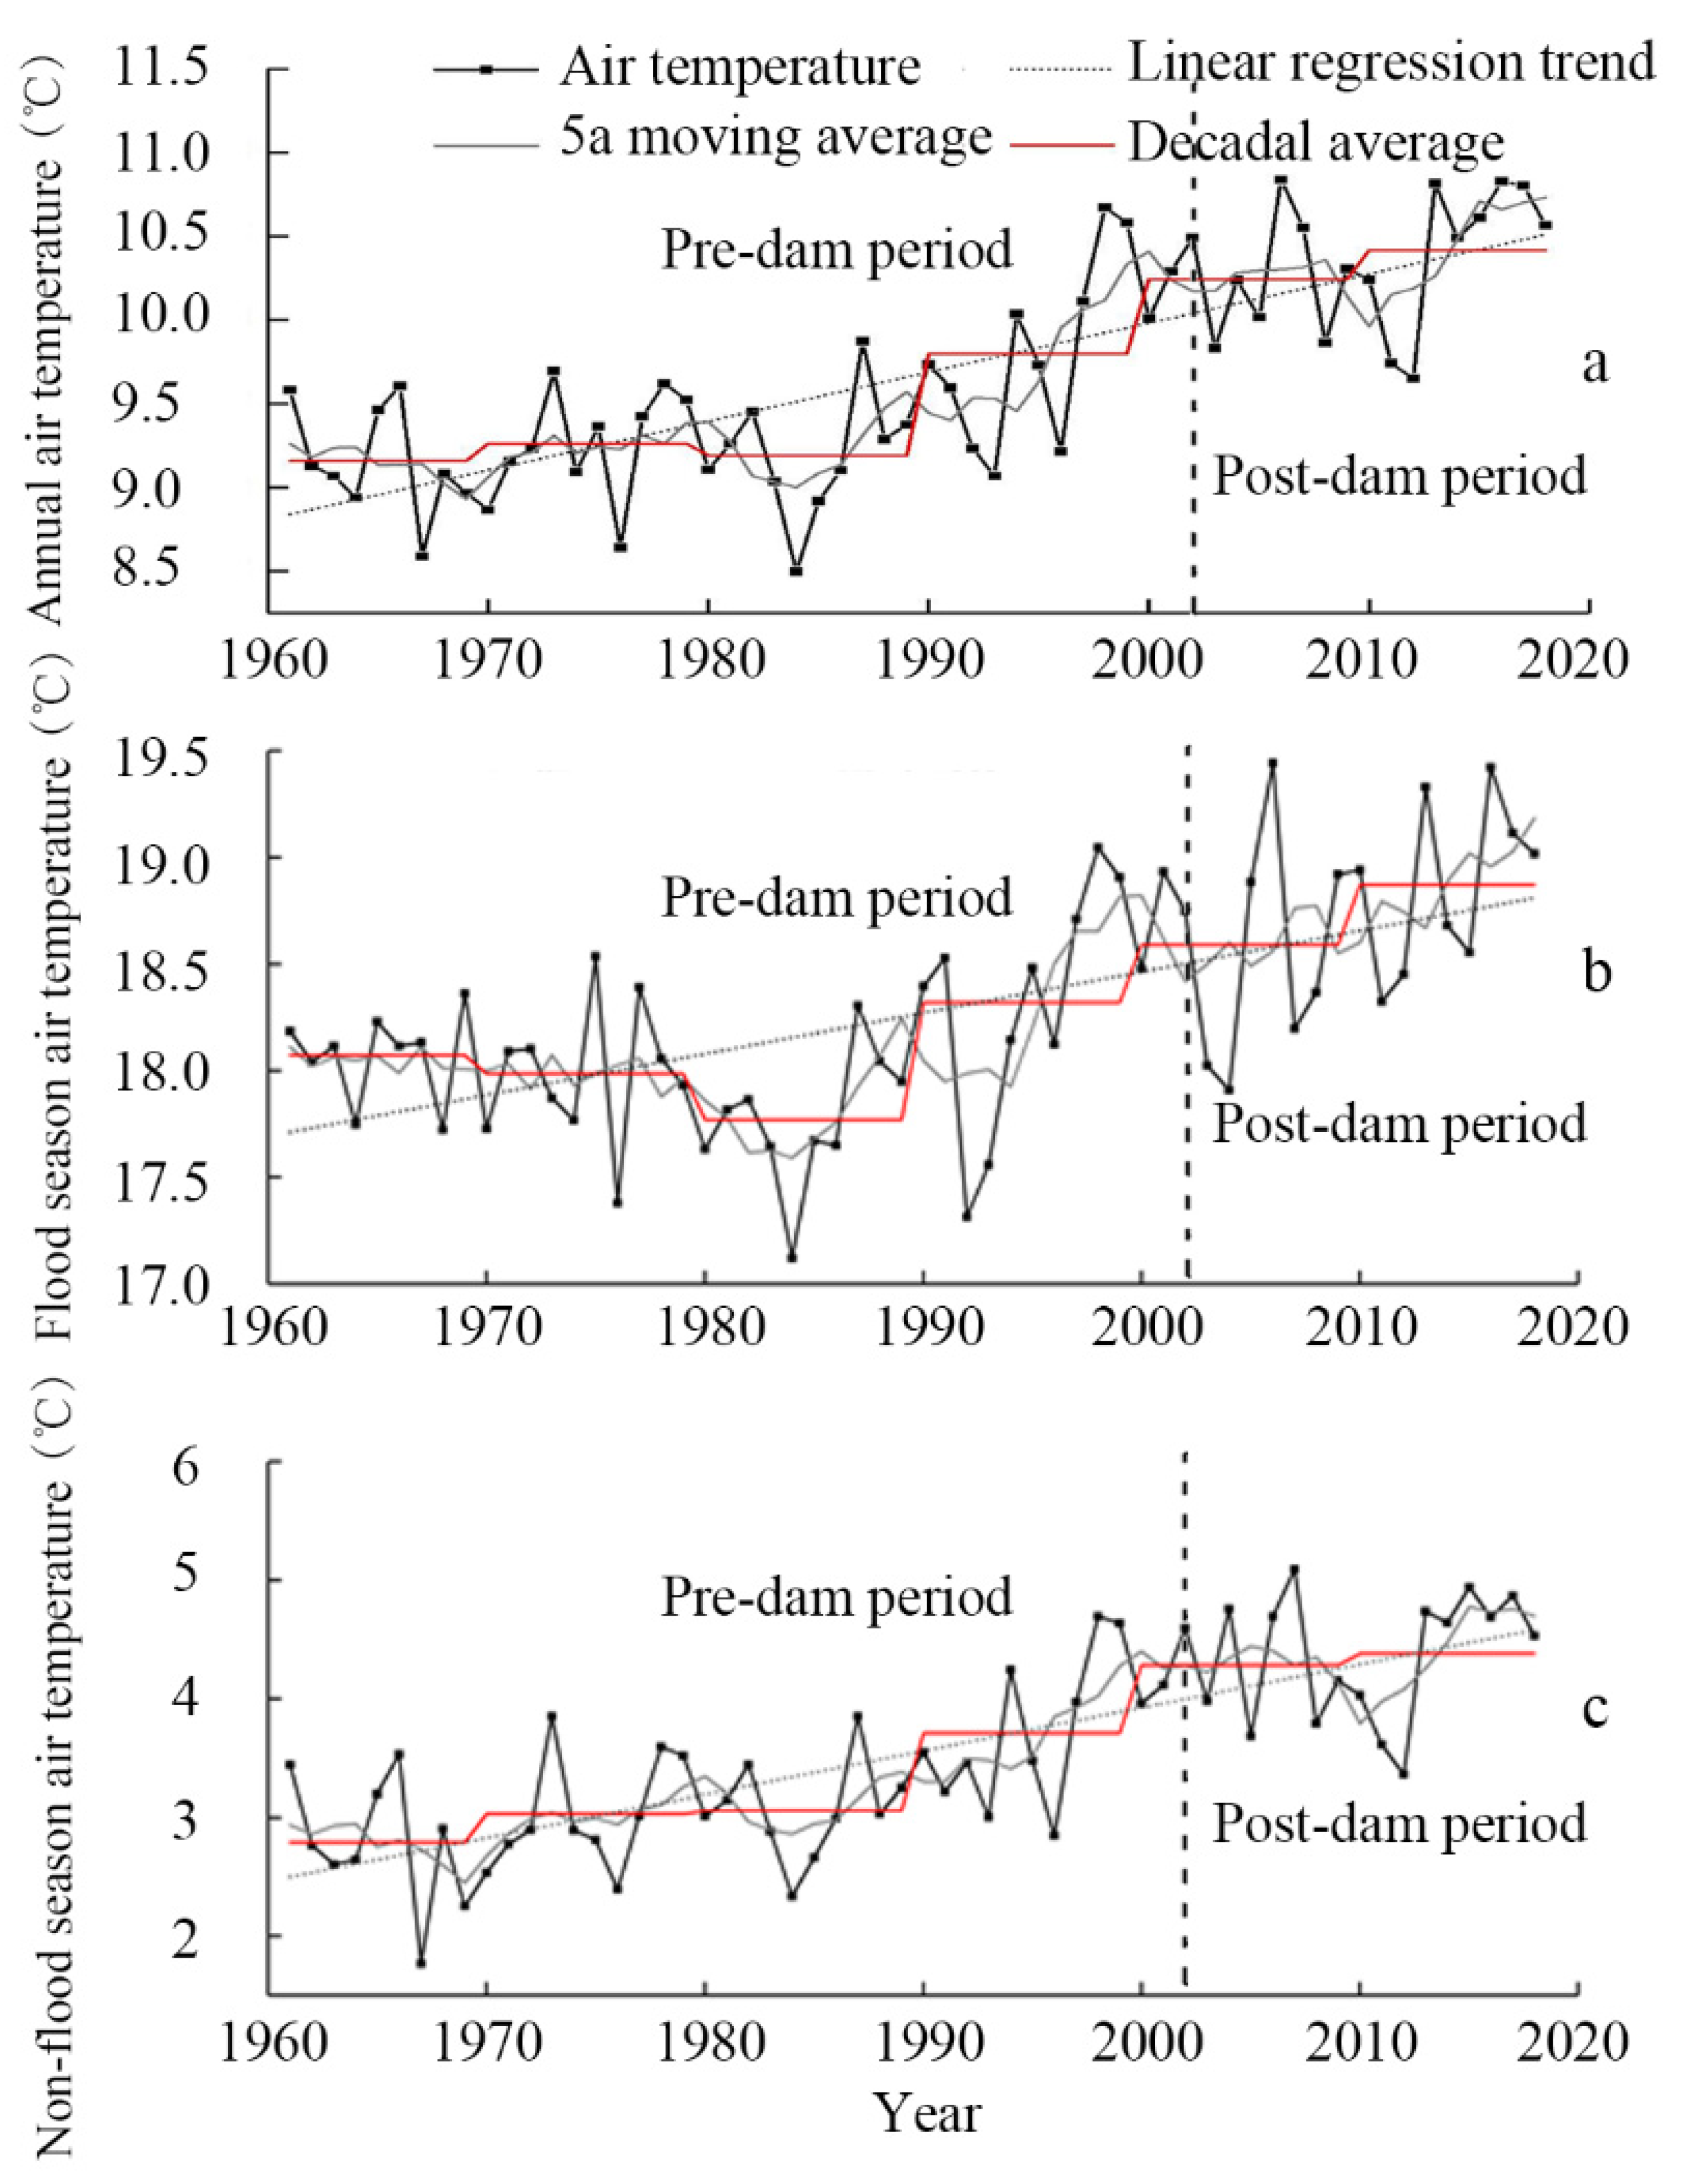
From 1961–2018, the average annual air temperature in the Yellow River basin was 9.67 °C with a change rate of 0.29 °C/10a which is higher than the average change rate of China (0.22 °C/10a). The maximum air temperature was observed in 2006 (Figure 3a), at 10.84 °C, while the minimum air temperature occurred in 1984, at 8.49 °C. The Mann-Kendall trend test revealed that annual air temperature increased significantly (p < 0.01) from 1961 to 2018 (Table 2). Both the five-year moving average and decadal average analysis showed a sharp increase since 1990s. Seasonal air temperature showed a trend similar to that of annual air temperature. Air temperature in both the flood season and non-flood season increased significantly (p < 0.01) from 1961 to 2018 (Table 2). The change rate was 0.19 and 0.37 °C/10a, respectively. In terms of variability, non-flood season air temperature showed more inter-annual variation (Cv = 0.22) than did flood season air temperature (Cv = 0.03) (Table 2).
3.2. Changes in Annual and Seasonal Runoff
3.2.1. Trends in Annual and Seasonal Runoff
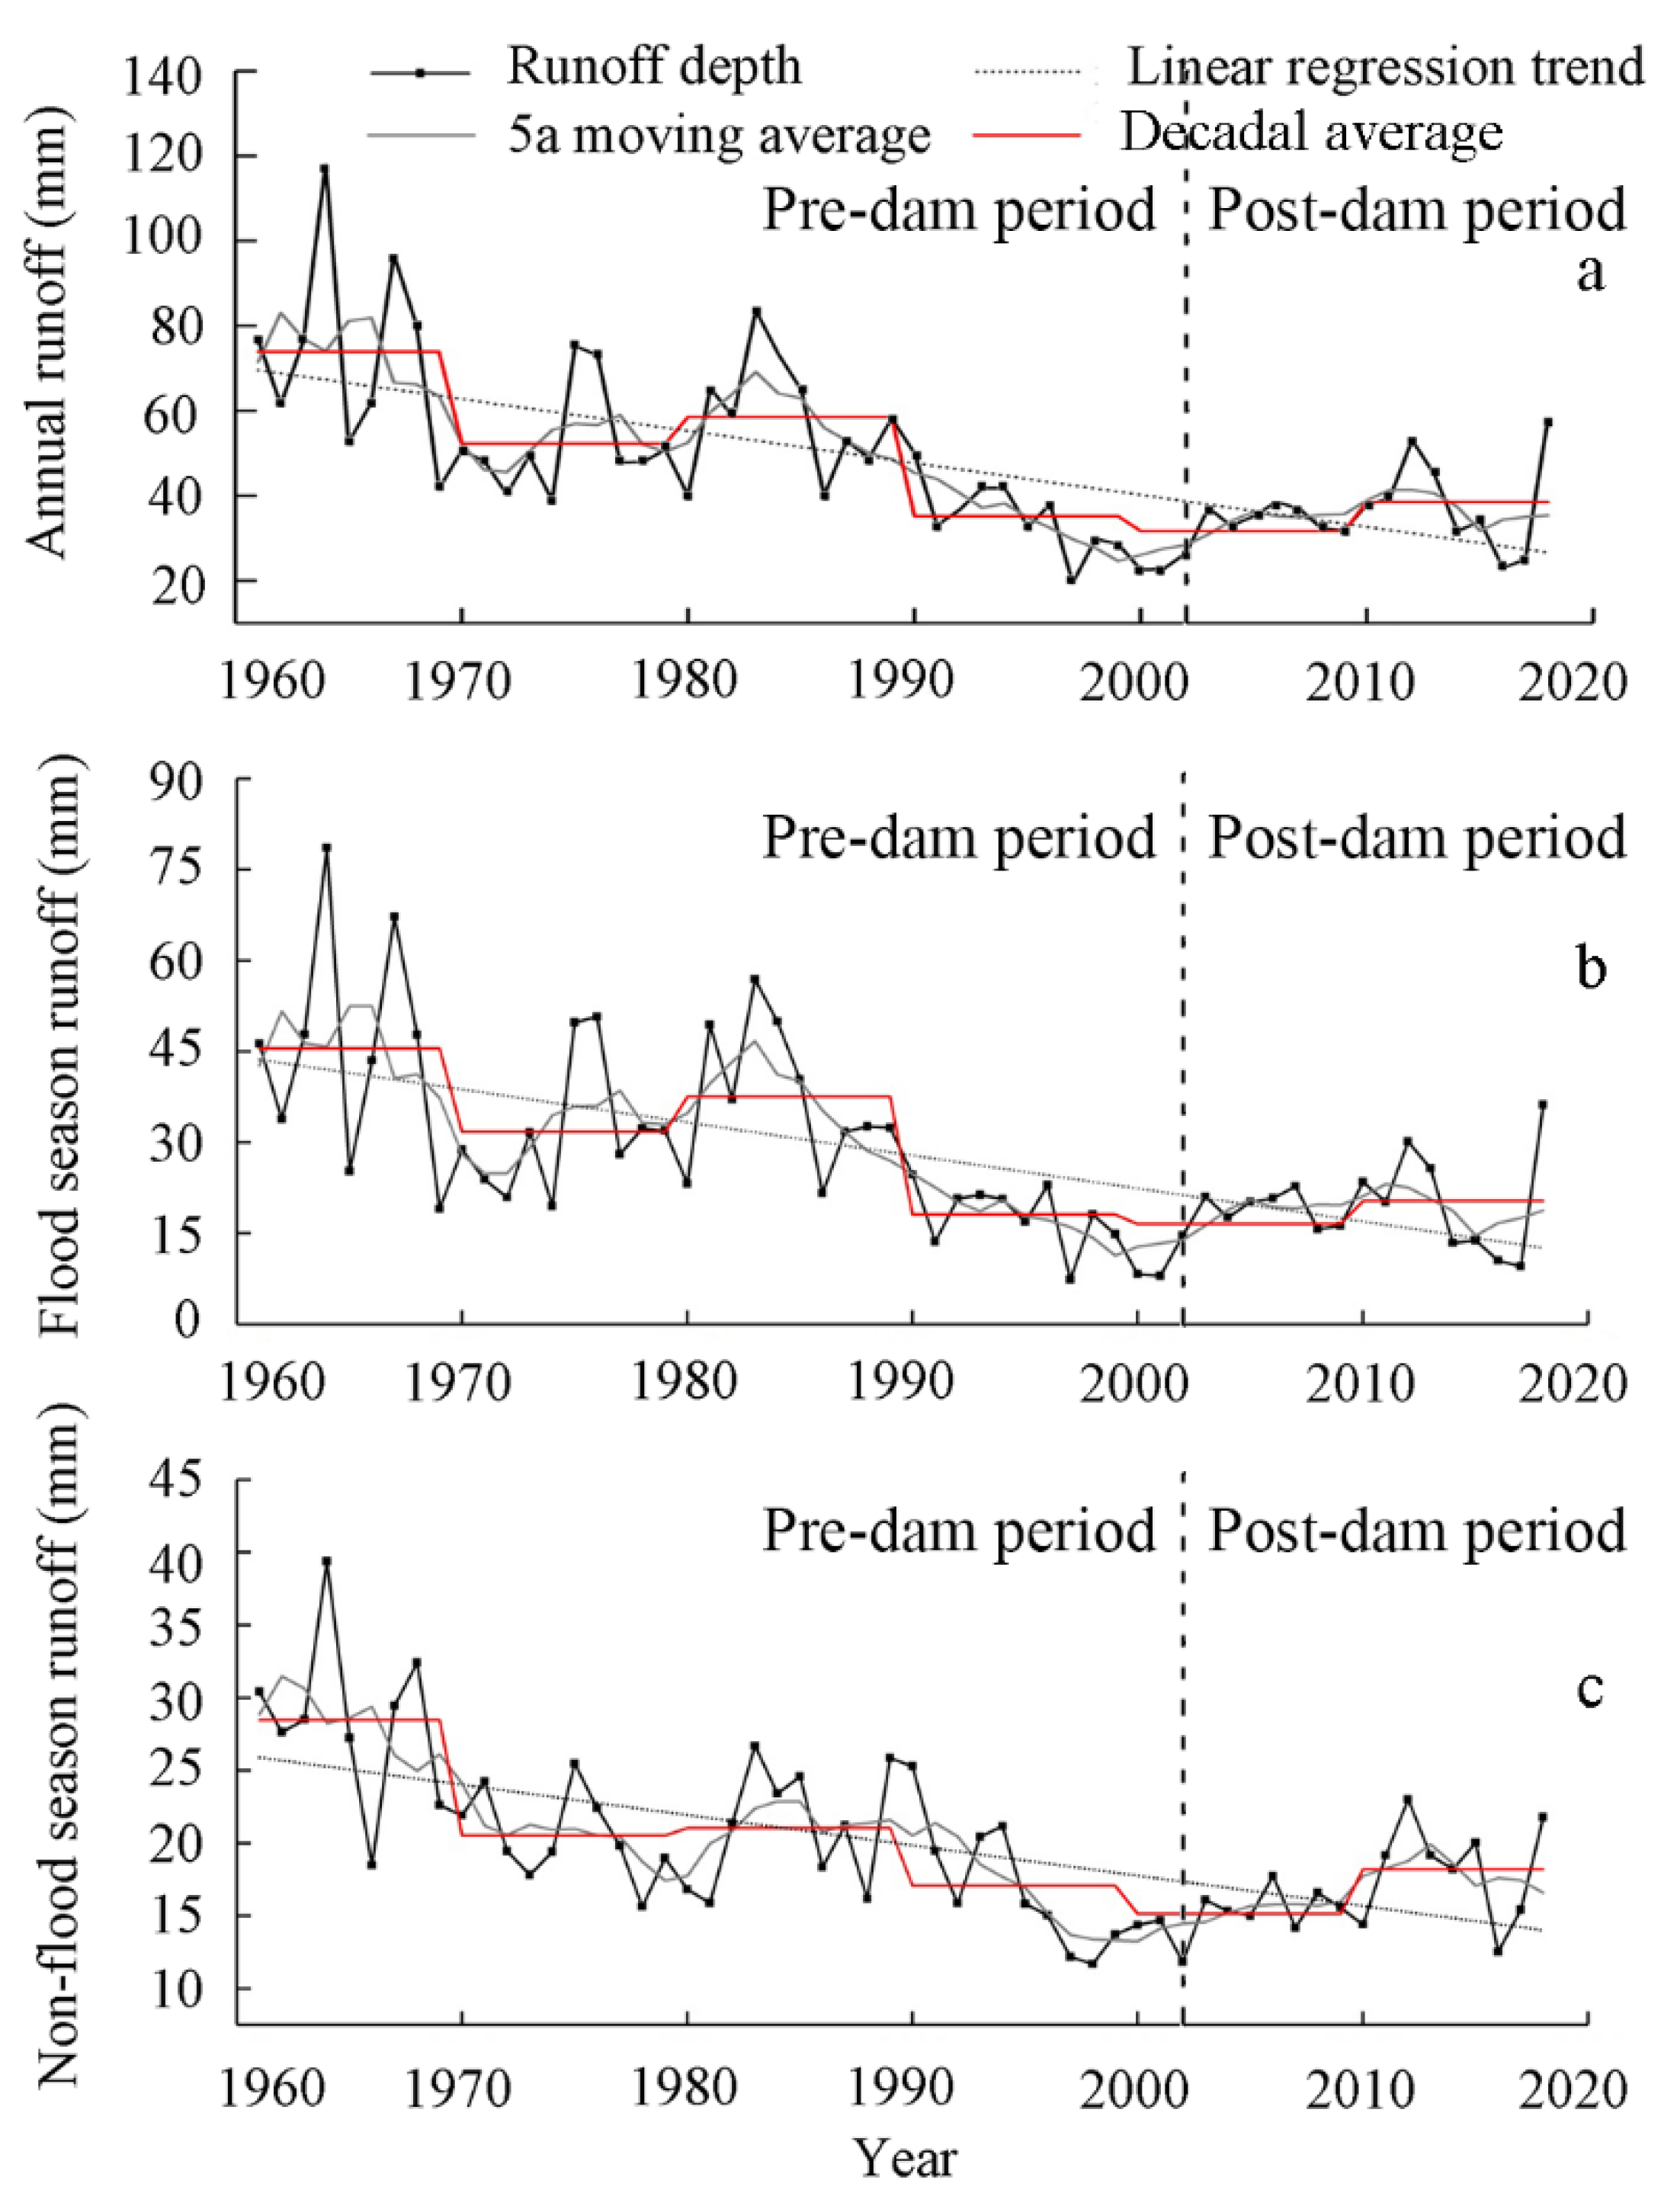
From 1961–2018, the average annual runoff in the Yellow River basin was 48.09 mm with an extreme value ratio of 6.04. The maximum runoff was observed in 1964 (Figure 4a), at 118.00 mm, while the minimum runoff occurred in 1997, at only 19.53 mm. The Mann-Kendall trend test revealed that annual runoff decreased (p < 0.01) from 1961 to 2018 (Table 3). Both the five-year moving average and decadal average analysis showed annual runoff to be highest in the 1960s, before decreasing to a minimum in the late 1990s. However, this effect was delayed in the decadal averages in comparison with the five-year moving averages. The decadal averages showed a slight increase in annual runoff from 2000 to 2018, but the factors underlying this change require further analysis (see later sections of this paper).
Seasonal runoff showed a trend similar to that of annual runoff. Runoff in both the flood season and non-flood season decreased (p < 0.01) from 1961 to 2018 (Table 3). Comparing the flood season (Figure 4b) and non-flood season (Figure 4c), the average runoff was 28.13 mm and 19.96 mm, respectively; the maximum runoff was 78.63 mm (in 1964) and the minimum 7.34 mm (in 1997) for the flood season, while the maximum was 39.37 mm (in 1964) and the minimum 11.68 mm (in 1998) for the non-flood season. The five-year moving averages and decadal averages showed similar trends: seasonal runoff was highest in the 1960s, decreased to a minimum in the late 1990s, and then increased from 2000 to 2018. In terms of variability, flood season runoff showed more inter-annual variation (Cv = 0.53) than did non-flood season runoff (Cv = 0.28) (Table 3).
3.2.2. Abrupt Changes in Annual and Seasonal Runoff
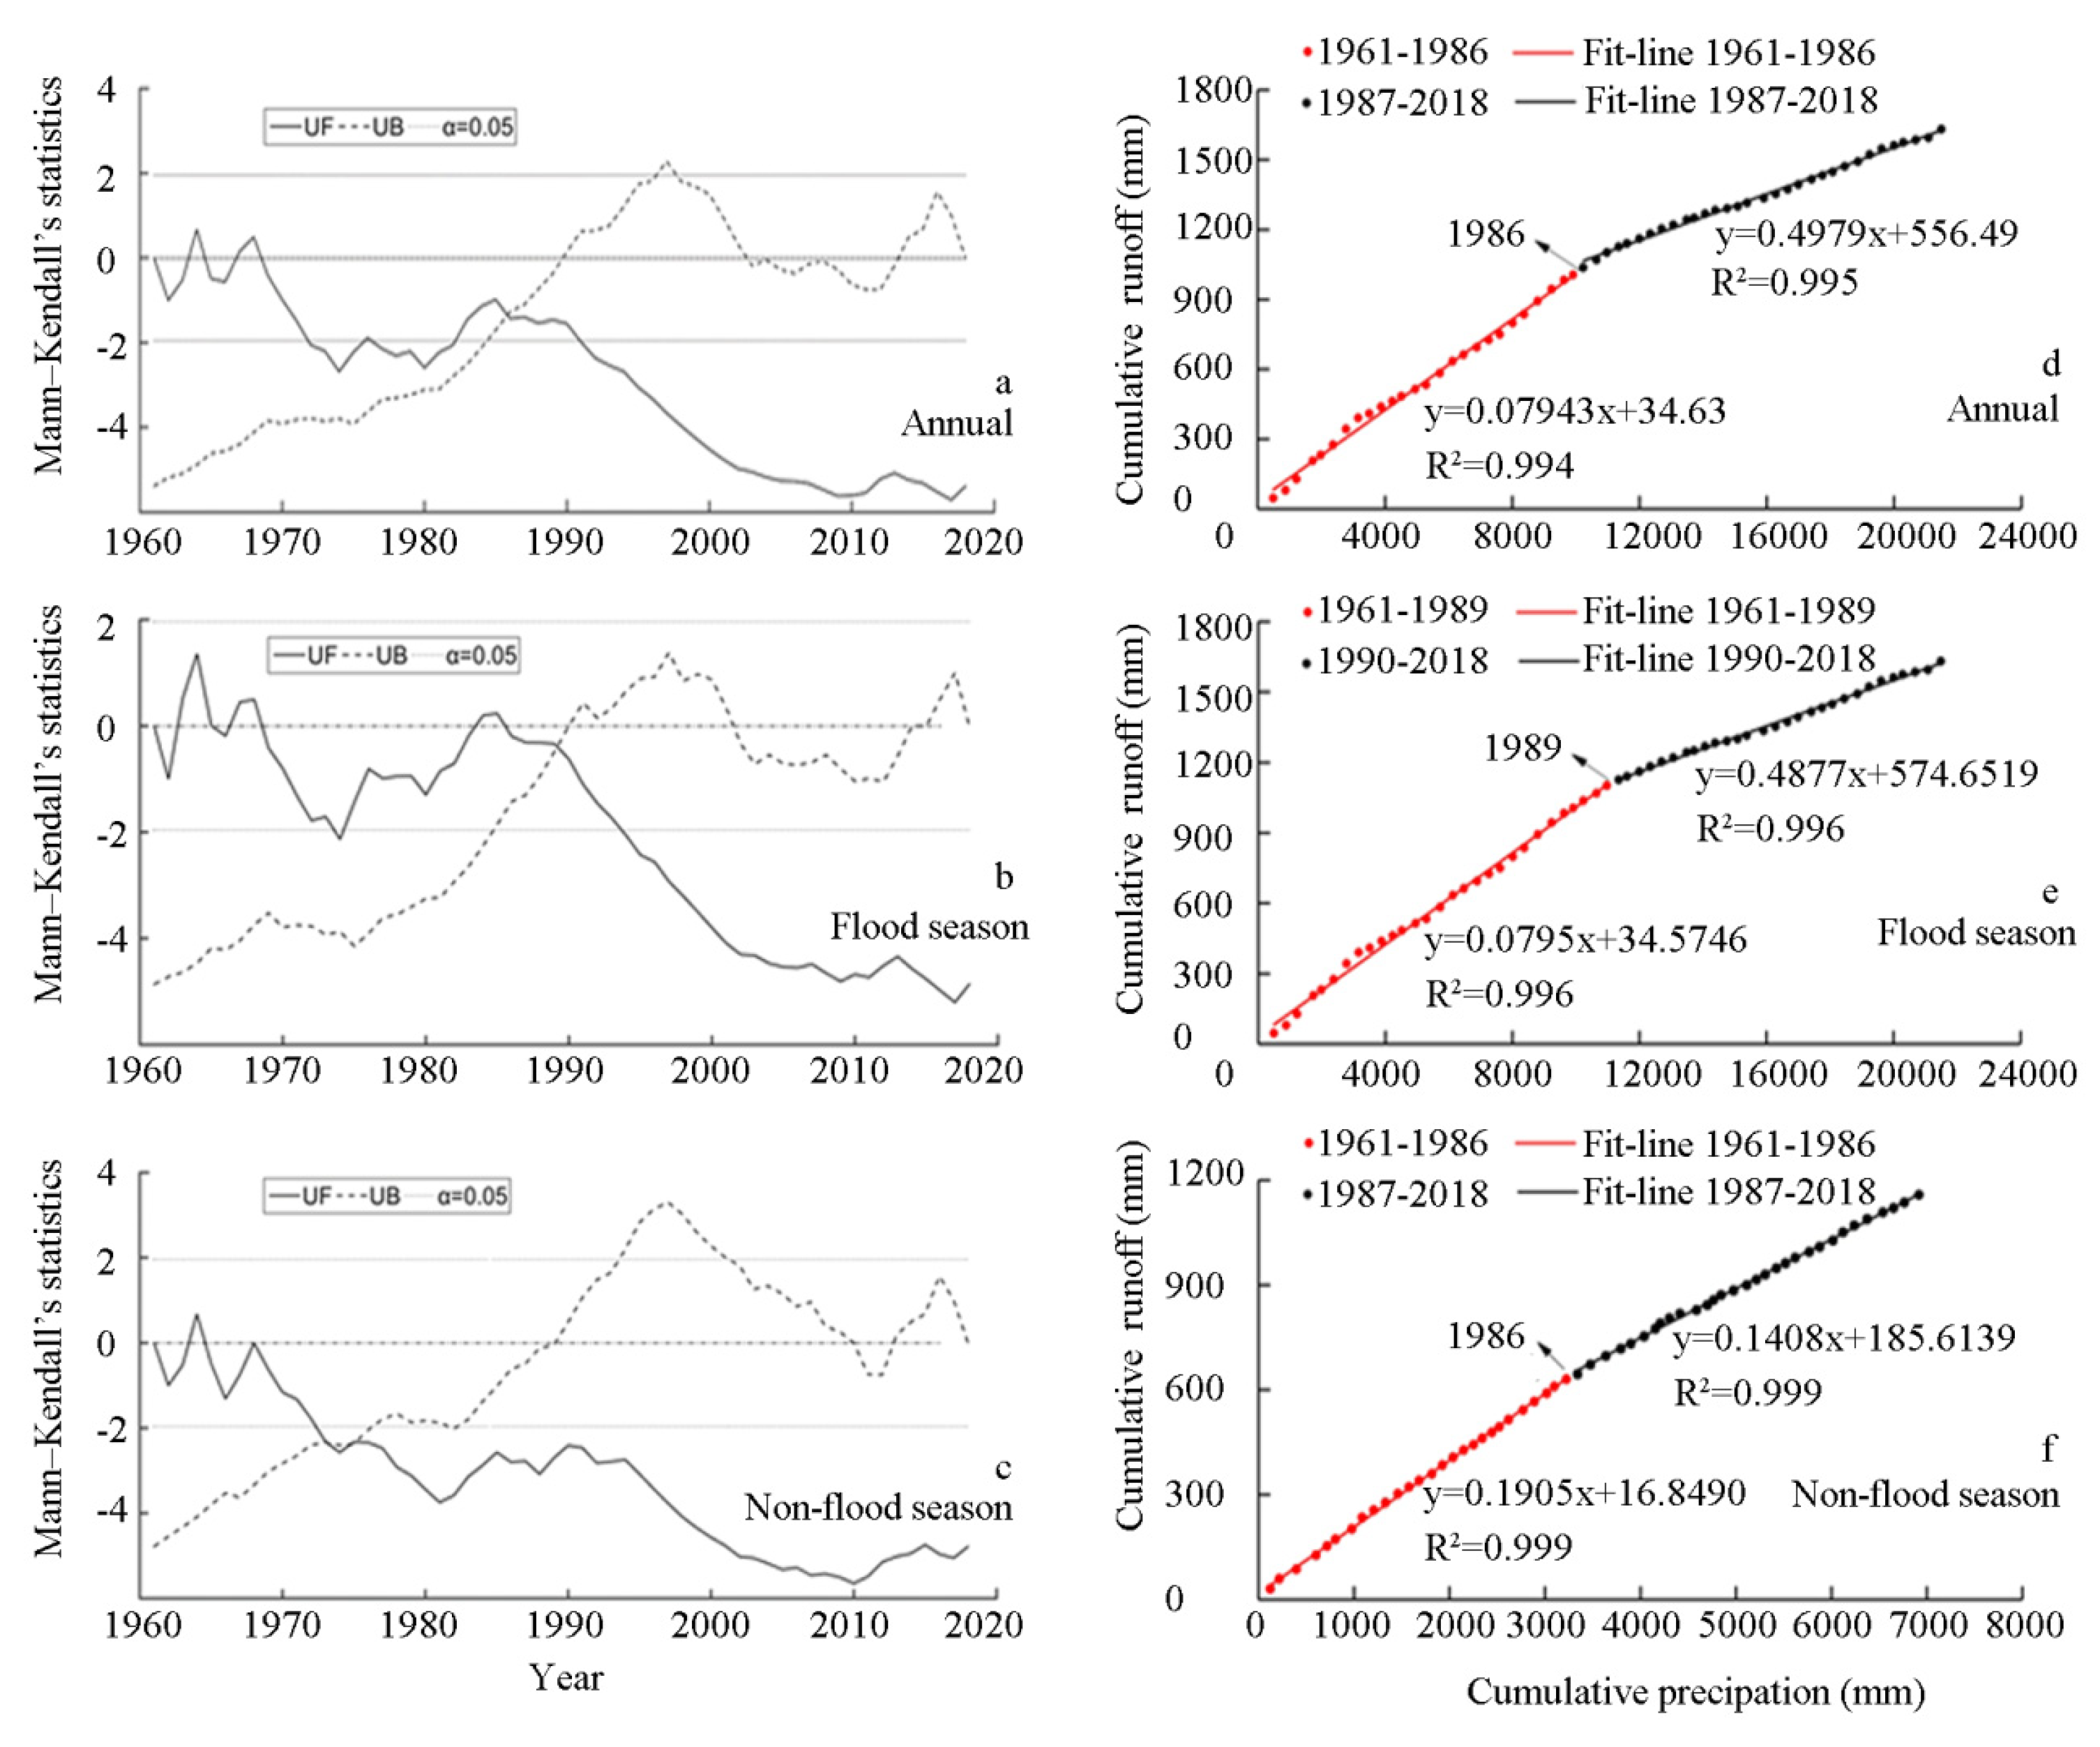
Mann-Kendall tests and the double mass curve method were applied to detect abrupt changes in annual and seasonal runoff. The computed change points are shown in Figure 5. In the Mann-Kendall test for annual runoff, the UF and UB curves had only one intersection point (in 1986) within the confidence interval (Figure 5a). In the flood season, the UF and UB curves only intersected in 1989 within the confidence interval (Figure 5b). For the non-flood season, the UF and UB curves intersected twice (Figure 5c). However, neither intersection fell within the confidence interval. From the plots of cumulative precipitation versus runoff, the annual (Figure 5d), flood season (Figure 5e), and non-flood season (Figure 5f) runoff plots each showed two straight lines with different slopes separated by abrupt change points in 1986, 1989, and 1986, respectively.
Comparing the two methods, the change points identified by the double mass curve approach were mostly consistent with those found by the Mann-Kendall tests; thus, 1986 (annual), 1989 (flood season), and 1986 (non-flood season) were taken as the consensus dates. It should be noted that neither the annual runoff nor the seasonal runoff changed after the completion of the XLD in 2001; this suggests that runoff regulation by the XLD may not have produced abrupt changes in runoff in the lower reaches of the Yellow River, or it may have moderated the occurrence of any such runoff changes. In contrast, other human activities, such as land use changes, likely produced the abrupt changes in runoff seen prior to the construction of the XLD.
3.3. Relative Contribution of Climate Change and Human Activities to Changes in Runoff
3.3.1. Attribution Analysis Using the Double Mass Curve Method
Using the double mass curve method and the observed change points, annual and seasonal runoff were simulated for the post-change period. This method evaluates the relationship between cumulative runoff and cumulative precipitation without consideration of local human activities; as such, the simulated runoff may only be influenced by climate change. Figure 6 compares both the observed and simulated annual runoff and seasonal runoff during the post-change period. The quantity of simulated runoff was greater than that observed for both annual and seasonal runoff, implying a strong impact of human activities in the post-change period, even though the post-change periods differed for annual versus seasonal runoff. Annual runoff was reduced by 25.34 mm in the post-change period as compared to the pre-change period (Table 4). Human activities accounted for 81.94% (or 20.76 mm) of this reduction, while climate change (i.e., reduction in precipitation) accounted for 18.06% (or 4.57 mm) of the total. For seasonal runoff, human activities contributed 19.76 mm (86.45%) and 5.63 mm (90.20%) to runoff reduction in the flood season and the non-flood season, respectively; meanwhile, climate change contributed 2.67 mm (13.53%) and 0.61 mm (9.80%) to runoff reduction in the flood season and the non-flood season, respectively. Thus, human activities were primarily responsible for the observed reductions in annual and seasonal runoff.
3.3.2. Attribution Analysis Using the Budyko-Based Elasticity Method
Using the Budyko-based elasticity method and the observed change points, the relative contributions of climate change and human activities to changes in annual and seasonal runoff were estimated. As a first step, the meteorological and hydrological variables were compared between the pre- and post-change periods. Runoff, P, PET, εP, and εPET were all lower in the post-change period as compared to the pre-change period (Table 5), with the exception of P in the non-flood season. Runoff reductions were measured as −25.34 mm (annual), −19.76 mm (flood season), and −6.24 mm (non-flood season). Precipitation was altered by −19.4 mm (annual), −15.83 mm (flood season), and 0.18 mm (non-flood season), while PET was reduced by −8.4 mm (annual), −6.83 mm (flood season), and −8.19 mm (non-flood season). The elasticity values changed by 0.04 (annual), 0.01 (flood season), and 0.84 (non-flood season); however, for εP the changes were negative, while for εPET they were positive. The negative εPET values indicate negative effects of PET on runoff. Thus, runoff was more sensitive to changes in P than to changes in PET at both the annual and seasonal scale. Meanwhile, the observed decreases in absolute value of εP and εPET suggest that, to some degree, other factors (mainly human activities) may have acted to reduce runoff elasticity.
Following the analysis of hydrological and meteorological variables, the Budyko-based elasticity method was used to evaluate the effects of climate change and human activities on runoff (Table 6). The effects were both positive and negative, with plus and minus signs reflecting effect direction. The PET had a negative effect on both annual and seasonal runoff reductions, indicating that lower PET in the post-change period (Table 5) caused runoff to increase. Changes in PET accounted for 0.94 mm (3.45%), 0.66 mm (3.13%), and 1.11 mm (12.79%) of the total variation in runoff annually, in the flood season, and in the non-flood season, respectively. Meanwhile, precipitation had a positive effect on both the annual and flood season runoff reductions, and a negative effect on the non-flood season runoff reduction. This suggests that a decrease in precipitation during the post-change period also decreased runoff annually and in the flood season, while an increase in precipitation during the post-change period increased runoff in the non-flood season. Changes in precipitation accounted for −5.93 mm (21.79%), −3.27 mm (15.51%), and 0.11 mm (−1.27%) of the total variation in runoff annually, in the flood season, and in the non-flood season, respectively. Human activities negatively affected annual and seasonal runoff reductions, accounting for −20.35 mm (74.76%), −17.15 mm (81.36%), and −7.46 mm (85.74%) of the total variation in runoff annually, in the flood season, and in the non-flood season, respectively. In general, no matter whether the effects were positive or negative, human activities were far more important than climate change in driving variation in runoff during the post-change period.
3.3.3. Comparison of the Double Mass Curve Method and Budyko-Based Elasticity Method
The assessment of factors underlying runoff variation was essentially consistent for both the double mass curve method (Table 4) and the Budyko-based elasticity method (Table 6). Together, these methods suggested that both human activities and climate change positively affected runoff reductions both annually and in the flood season for the post-change period: more than 74% of the variation in runoff could be explained by human activities, while the remainder was explained by climate change. However, with regard to the non-flood season, precipitation had the opposite effect on the runoff reduction. The Budyko-based elasticity method found that precipitation negatively affected the runoff reduction, while the double mass curve method found a positive effect. This discrepancy could be attributed to the fact that the double mass curve method only considers the relationship between precipitation and runoff, and not the effects of other climatic factors, such as temperature, net radiation, vapor pressure, and PET. This also explains the smaller observed contribution of climate change to runoff variation during the post-change period, as calculated by the double mass curve method. In brief, the double mass curve method is simple and easy to calculate, but it lacks a consideration of physical mechanisms; in contrast, the Budyko-based elasticity method considers both the water balance and the sensitivity of runoff to changes in precipitation and PET, consistent with actual hydrological cycles in watersheds. Therefore, the Budyko-based elasticity method was selected to test for effects of the XLD construction on runoff in the lower Yellow River.
3.4. Relative Contribution of the Xiaolangdi Dam to Runoff Changes in the Lower Yellow River
After determining the pre- and post-change periods for runoff, the post-change period was further subdivided using the XLD construction date (i.e., into a pre-dam and post-dam period). In this study, the main human activities affecting runoff in the pre-dam period were assumed to be changes in the underlying surface characteristics of the upper and middle Yellow River basin; meanwhile, for the post-dam period, the XLD construction was assumed to be the human activity most affecting runoff in the lower Yellow River. Based on the above assumptions, the impact of the XLD on runoff was separated from that of climate change.
Runoff, P, PET, εP, and εPET were compared between the pre- and post-dam periods (Table 7). In comparison with the pre-dam period, post-dam runoff was reduced by 2.15% annually, increased by 18.66% in the flood season, and reduced by 4.05% in the non-flood season. Precipitation increased by 8.04% (annually), 9.67% (flood season), and 5.15% (non-flood season), while PET was reduced by 3.27% (annually), 2.96% (flood season), and 3.33% (non-flood season). Meanwhile, runoff was more sensitive to changes in precipitation versus PET, though runoff elasticity became less sensitive to climate change in general following dam construction.
According to the Budyko-based elasticity method, annual runoff was 0.8 mm lower in the post-dam period than in the pre-dam period (Table 8). Precipitation, PET, and dam construction accounted for 8.20 mm (−31.39%), 4.46 mm (−17.08%), and −13.46 mm (51.53%) of this reduction, respectively. This result suggests that, although climate change caused an increase in annual runoff, this was countered by a decrease in annual runoff caused by dam construction. Thus, dam construction moderated the influence of climate change on annual runoff in the lower Yellow River.
Flood season runoff increased by 3.08 mm in the post-dam period, as compared to the pre-dam period. Both P and PET positively affected the runoff increase, contributing 4.57 mm (53.14%) and 1.27 mm (14.77%), respectively; in contrast, dam construction had a negative effect, contributing −2.76 mm (−32.09%). Runoff in the non-flood season decreased by 0.71 mm in the post-dam period, as compared to the pre-dam period. Both P and PET negatively affected this runoff reduction, contributing 3.45 mm (17.43%) and 6.09 mm (30.77%), respectively; meanwhile, dam construction had a positive effect, contributing −10.25 mm (51.79%). In general, during the post-dam period, increased P and decreased PET together facilitated an increase in annual and seasonal runoff; however, dam construction mitigated this positive effect.
4. Discussion
4.1. Changes in Runoff
Previous studies have reported a decrease in runoff in the Yellow River basin over the past six decades; this decrease has been attributed to both human activities and climate change. In the upper Yellow River basin, Cuo et al. [25] observed significantly lower annual, wet, and warm season runoff from 1956–2009. In the middle Yellow River basin, runoff in the high-flow season (June to September) exhibited a downward trend in 15 out of 17 catchments across the Loess Plateau from 1961–2013 [51]. Annual runoff in 14 of the 15 catchments of the Loess Plateau significantly decreased from 1961–2009 [29], and abrupt changes in annual runoff also occurred between 1971 and 1996 [7]. In a study of the Yellow River basin as a whole [19], runoff decreased over time, but this was only significant for the middle and lower Yellow River basin; runoff in all reaches of the River showed abrupt changes in the mid-1980s and the 1990s. Overall, this study found a similar trend to previous studies, with both annual and seasonal runoff decreasing (p < 0.01) from 1961 to 2018. Abrupt changes in the annual, flood season (June to October), and non-flood season (November to May) runoff were observed in 1986, 1989, and 1986, respectively. The change points identified here were inconsistent with previous studies, perhaps due to differences in the methods used, time periods examined, and base scenarios. For example, Jiang and Liu [52] described a single change point in 1985 (between 1955 and 2013), while Hu et al. [53] documented two such points: 1933–1934 and 1989–1990 (between 1919 and 2016). In contrast to the middle Yellow River basin, where runoff shifted at least twice (in the mid-1980s and the 1990s) [4,11,21], no abrupt changes were observed in runoff in the lower Yellow River after 1990 [52,53]. In particular, no changes were seen after completion of the XLD in 2001. This suggests that either the XLD did not affect runoff in the lower reaches of the Yellow River, or it moderated the effects of climate change and other human activities on runoff (negating any overall changes) [4].
4.2. Effects of Climate Change and Human Activities on Runoff
In this study, the double mass curve method and the Budyko-based elasticity method were used to test for effects of climate change and human activities on annual and seasonal runoff in the Yellow River. The quantitative results were essentially consistent between methods: runoff reductions in the post-change period were due to the combined effects of human activities and climate change, with human activities having a greater impact. Climate change accounted for 18.06–25.24%, 13.53–18.64%, and 9.80–14.06% of the reduction in annual, flood season, and non-flood season runoff, respectively, while human activities accounted for 74.76–71.94%, 81.36–86.47%, and 85.94–90.20%, respectively. These results are consistent with those of previous studies [54]. For example, Wang et al. [54] found that human activities contributed 83% of the reduction in runoff in the Yellow River basin from 1970–2008, while changes in precipitation contributed 17%. However, with regard to seasonal runoff, different results were observed here, in comparison with a study that examined 17 catchments across the Loess Plateau from 1961–2013 [51]. In that study, human activities were found to have a greater impact on runoff (accounting for 73% of the total variation) than climate change during the high-flow season, while the reverse was true in the low-flow season. The larger effect of climate change during the low-flow season was attributed to a combination of greater climate change effects and lower human activity effects. This inconsistency between studies could be related to differences in the hydrological seasons used, locations (mainstream and/or tributaries) of hydrological stations, and time periods studied.
Human activities are the most important driver of runoff changes in the Yellow River basin (accounting for more than 70% of runoff variation), and these effects are only increasing with time [4,7,11,21,51]. The effects of specific human activities on runoff have been examined, including surface water consumption and vegetation cover changes [4], cropland changes [19], land use/cover change, sediment-trapping dam operation [21], reservoir operation [46], and ecological restoration [7]. However, it remains difficult to distinguish the role of individual factors, due to interactions among factors and limitations of currently available methods. Firstly, different human activities impact runoff in different ways, but most previous studies have grouped all such activities together. This is likely because obtaining the requisite data for individual analysis is challenging; all other human activities, except the target activity, must be absent [5]. Therefore, consistent with previous studies, this study separated the effects of climate change from human activities as a whole, without considering activities individually. Second, climate change and human activities are inter-related and may affect each other [31,51]. However, most attribution analyses (including that of the present study) have assumed their independence [2,3], ignoring any potential interactions [5]. Third, disregarding the above assumptions, there remain other limitations associated with the attribution approaches. In the present study, the double mass curve method and the Budyko-based elasticity method were used to separate the effects of climate change and human activities on runoff. Although the two methods yielded consistent results (i.e., similar percent changes in runoff for the post-change period), the first method only distinguished the effects of precipitation on runoff, with no consideration of local human activities or other climatic factors [2]. The second method distinguished the effects of precipitation versus AET/PET [6,10]. In addition, as precipitation and AET/PET changed in opposite directions, this might lead to underestimation or overestimation of the climate contribution [2]. As such, the number of climatic factors to include in these two methods of analysis remains under debate [55]. Consequently, more work should be done to accurately quantify the effects of climate change and human activities, as well as their interaction, on runoff, whether in the Yellow River basin or other river basins worldwide.
4.3. Runoff Changes Associated with the Xiaolangdi Dam
In spite of the uncertainties and limitations associated with the attribution approaches used here, the comparable results found by both methods suggests that human activity effects were reliably separated from those of climate change. Therefore, using the Budyko-based elasticity method, the impact of the XLD construction was further separated from that of climate change. The XLD reduced annual and non-flood season runoff (by 51.53% and 51.79%, respectively), while increasing flood season runoff (32.09%). This result is consistent with that of Fang et al. [56], who found that dam construction and land use changes contributed 41.24% and 6.21%, respectively, to runoff reductions at the Huayuankou hydrological station. Indeed, most previous studies have found that dam construction exacerbates existing runoff reductions [57]. In addition, dams are increasingly being discussed as an option to buffer against climate-induced hydrological changes [37,40]. This was supported here, as the XLD mitigated increases (due to increased precipitation and decreased PET) in annual and seasonal runoff seen during the post-dam period.
5. Conclusions
Climate change and human activities affect all aspects of the hydrological cycle in river basins. The impact of human activities on runoff is becoming more pronounced over time in the context of the warming climate. A particularly problematic human activity, dam construction, can directly and dramatically alter downstream runoff. Therefore, a better understanding of the effects of dam construction on runoff is crucial for river management. However, such studies are complex, due to the need to account for the interacting and cumulative effects of multiple factors. As an attempt to explore how dam construction affected annual and seasonal runoff in the lower Yellow River, the present study first measured long-term trends and abrupt changes in runoff for the period from 1961–2018; next, the relative effects of climate change and human activities were separated. Unlike previous studies, which utilized the abrupt change points for annual runoff across multiple time scales, this study separately identified the base periods and change points for annual and seasonal runoff. Runoff in the Yellow River basin was simultaneously affected by both climate change and human activities, with human activities having a stronger impact. To better understand these effects, the contribution of dam construction to runoff changes in the lower Yellow River was examined from 2002 to 2018 (after the XLD became operational). The main conclusions are summarized below.
Both annual and seasonal runoff decreased over time (p < 0.01). However, abrupt changes were seen in different years for annual runoff (1986), flood season runoff (1989), and non-flood season runoff (1986). It is worth noting that no abrupt changes in runoff occurred during or after construction of the XLD; this suggests that the XLD either did not significantly alter runoff in the lower Yellow River, or it moderated runoff changes induced by climate change and other human activities.
Human activities were responsible for 74.76–71.94%, 81.36–86.47%, and 85.94–90.20% of annual, flood season, and non-flood season reductions in runoff, respectively; climate change was only responsible for 18.06–25.24%, 13.53–18.64%, and 9.80–14.06% of the reductions. Among the tested climatic factors, lower PET had a negative effect on the runoff reductions, and accounted for 3.45%, 3.13%, and 12.79% of the total variation annually, in the flood season, and in the non-flood season, respectively. In contrast, lower precipitation had a positive effect on the annual (21.79%) and flood season (15.51%) runoff reductions, while higher precipitation in the non-flood season had a negative effect on the runoff reduction (−1.27%).
For the post-dam period, the XLD decreased runoff annually (by 51.53%) and in the non-flood season (51.79%), while increasing runoff in the flood season (by 32.09%). As such, the XLD mitigated runoff increases induced by higher precipitation and decreased PET during the post-dam period. In this regard, the XLD moderated the effects of climate change on runoff in the Yellow River basin. This important insight into the effects of dam construction has implications for the sustainable management of water resources in regulated rivers.
Author Contributions
Conceptualization, Q.Z. and X.J.; methodology, Q.Z. and X.J.; software, X.J.; validation, Q.Z. and S.D.; formal analysis, X.J.; investigation, Z.H.; resources, S.D.; data curation, S.D.; writing—original draft preparation, Q.Z.; writing—review and editing, Q.Z.; visualization, M.L.; supervision, Q.Z. and S.D.; project administration, Q.Z.; funding acquisition, Q.Z., S.D. and P.W. All authors have read and agreed to the published version of the manuscript.
Funding
This research was funded by the National Natural Science Foundation of China (U1804119, 41771202, 41971229), the Natural Science Foundation of Henan (202300410050), the 2019 Young Backbone Teachers Foundation from Henan Province (2019GGJS030), and the Science and Technology Project of Water Conservancy of Henan Province of China (GG201826).
Institutional Review Board Statement
Not applicable.
Informed Consent Statement
Not applicable.
Data Availability Statement
Not applicable.
Acknowledgments
The authors would like to thank Emily Drummond at the University of British Columbia for her editing of the manuscript. Moreover, cordial thanks are extended to the editor and anonymous reviewers for their valuable comments that greatly improved the quality of this paper.
Conflicts of Interest
The authors declare no conflict of interest.
References
- Rakhimova, M.; Liu, T.; Bissenbayeva, S.; Mukanov, Y.; Gafforov, K.S.; Bekpergenova, Z.; Gulakhmadov, A. Assessment of the impacts of climate change and human activities on runoff using climate elasticity method and general circulation model (GCM) in the Buqtyrma River basin, Kazakhstan. Sustainability 2020, 12, 22. [Google Scholar] [CrossRef]
- Zeng, F.; Ma, M.-G.; Di, D.-R.; Shi, W.-Y. Separating the impacts of climate change and human activities on runoff: A review of method and application. Water 2020, 12, 2201. [Google Scholar] [CrossRef]
- Wang, X.; He, K.; Dong, Z. Effects of climate change and human activities on runoff in the Beichuan River Basin in the northeastern Tibetan Plateau, China. Catena 2019, 176, 81–93. [Google Scholar] [CrossRef]
- Yang, X.; Sun, W.; Mu, X.; Gao, P.; Zhao, G. Run-off affected by climate and anthropogenic changes in a large semi-arid river basin. Hydrol. Process. 2020, 34, 1906–1919. [Google Scholar] [CrossRef]
- Wu, L.; Zhang, X.; Hao, F.; Wu, Y.; Li, C.; Xu, Y. Evaluating the contributions of climate change and human activities to runoff in typical semi-arid area, China. J. Hydrol. 2020, 590, 125555. [Google Scholar] [CrossRef]
- Shahid, M.; Cong, Z.; Zhang, D. Understanding the impacts of climate change and human activities on streamflow: A case study of the Soan River basin, Pakistan. Theor. Appl. Climatol. 2017, 134, 205–219. [Google Scholar] [CrossRef]
- Liang, W.; Bai, D.; Wang, F.Y.; Fu, B.J.; Yan, J.P.; Wang, S.; Yang, Y.T.; Long, D.; Feng, M.Q. Quantifying the impacts of climate change and ecological restoration on streamflow changes based on a Budyko hydrological model in China’s Loess Plateau. Water Resour. Res. 2015, 51, 6500–6519. [Google Scholar] [CrossRef]
- Li, Z.; Huang, S.; Liu, D.; Leng, G.; Zhou, S.; Huang, Q. Assessing the effects of climate change and human activities on runoff variations from a seasonal perspective. Stoch. Environ. Res. Risk Assess. 2020, 34, 575–592. [Google Scholar] [CrossRef]
- Patterson, L.A.; Lutz, B.; Doyle, M.W. Climate and direct human contributions to changes in mean annual streamflow in the South Atlantic, USA. Water Resour. Res. 2013, 49, 7278–7291. [Google Scholar] [CrossRef]
- Yuan, Y.; Zhang, C.; Zeng, G.; Liang, J.; Guo, S.; Huang, L.; Wu, H.; Hua, S. Quantitative assessment of the contribution of climate variability and human activity to streamflow alteration in Dongting Lake, China. Hydrol. Process. 2016, 30, 1929–1939. [Google Scholar] [CrossRef]
- Shi, H.; Wang, G. Impacts of climate change and hydraulic structures on runoff and sediment discharge in the middle Yellow River. Hydrol. Process. 2015, 29, 3236–3246. [Google Scholar] [CrossRef] [Green Version]
- Chien, H.; Yeh, P.J.F.; Knouft, J.H. Modeling the potential impacts of climate change on streamflow in agricultural watersheds of the Midwestern United States. J. Hydrol. 2013, 491, 73–88. [Google Scholar] [CrossRef]
- Liuzzo, L.; Noto, L.V.; Vivoni, E.R.; La Loggia, G. Basin-scale water resources assessment in oklahoma under synthetic climate change scenarios using a fully distributed hydrologic model. J. Hydrol. Eng. 2010, 15, 107–122. [Google Scholar] [CrossRef]
- Wu, Y.; Fang, H.; Huang, L.; Ouyang, W. Changing runoff due to temperature and precipitation variations in the dammed Jinsha River. J. Hydrol. 2020, 582, 124500. [Google Scholar] [CrossRef]
- López-Moreno, J.I.; Zabalza, J.; Vicente-Serrano, S.M.; Revuelto, J.; Gilaberte, M.; Azorin-Molina, C.; Morán-Tejeda, E.; García-Ruiz, J.M.; Tague, C. Impact of climate and land use change on water availability and reservoir management: Scenarios in the Upper Aragón River, Spanish Pyrenees. Sci. Total Environ. 2014, 493, 1222–1231. [Google Scholar] [CrossRef] [Green Version]
- Zhang, J.; Wang, G.; He, R.; Liu, C. Variation trends of runoffs in the Middle Yellow River basin and its response to climate change. Adv. Water Sci. 2009, 20, 153–158. [Google Scholar]
- Voudouris, K.; Mavromatis, T.; Krinis, P. Assessing runoff in future climate conditions in Messara valley in Crete with a rainfall-runoff model. Meteorol. Appl. 2012, 19, 473–483. [Google Scholar] [CrossRef]
- Liu, J.; Zhang, Q.; Singh, V.P.; Shi, P. Contribution of multiple climatic variables and human activities to streamflow changes across China. J. Hydrol. 2017, 545, 145–162. [Google Scholar] [CrossRef] [Green Version]
- Li, H.; Zhang, Q.; Singh, V.P.; Shi, P.; Sun, P. Hydrological effects of cropland and climatic changes in arid and semi-arid river basins: A case study from the Yellow River basin, China. J. Hydrol. 2017, 549, 547–557. [Google Scholar] [CrossRef] [Green Version]
- Chaudhari, S.; Felfelani, F.; Shin, S.; Pokhrel, Y. Climate and anthropogenic contributions to the desiccation of the second largest saline lake in the twentieth century. J. Hydrol. 2018, 560, 342–353. [Google Scholar] [CrossRef]
- Shi, H.; Li, T.; Wang, K.; Zhang, A.; Wang, G.; Fu, X. Physically based simulation of the streamflow decrease caused by sediment-trapping dams in the middle Yellow River. Hydrol. Process. 2016, 30, 783–794. [Google Scholar] [CrossRef] [Green Version]
- Zhou, Y.; Shi, C.; Fan, X.; Shao, W. The influence of climate change and anthropogenic activities on annual runoff of Huangfuchuan basin in northwest China. Theor. Appl. Climatol. 2015, 120, 137–146. [Google Scholar] [CrossRef]
- He, Y.; Wang, F.; Mu, X.; Guo, L.; Gao, P.; Zhao, G. Human activity and climate variability impacts on sediment discharge and runoff in the Yellow River of China. Theor. Appl. Climatol. 2017, 129, 645–654. [Google Scholar] [CrossRef]
- Chawla, I.; Mujumdar, P.P. Isolating the impacts of land use and climate change on streamflow. Hydrol. Earth Syst. Sci. 2015, 19, 3633–3651. [Google Scholar] [CrossRef] [Green Version]
- Cuo, L.; Zhang, Y.; Gao, Y.; Hao, Z.; Cairang, L. The impacts of climate change and land cover/use transition on the hydrology in the upper Yellow River Basin, China. J. Hydrol. 2013, 502, 37–52. [Google Scholar] [CrossRef]
- Sterling, S.M.; Ducharne, A.; Polcher, J. The impact of global land-cover change on the terrestrial water cycle. Nat. Clim. Chang. 2013, 3, 385–390. [Google Scholar] [CrossRef]
- Döll, P.; Fiedler, K.; Zhang, J. Global-scale analysis of river flow alterations due to water withdrawals and reservoirs. Hydrol. Earth Syst. Sci. 2009, 13, 2413–2432. [Google Scholar] [CrossRef] [Green Version]
- Biemans, H.; Haddeland, I.; Kabat, P.; Ludwig, F.; Hutjes, R.W.A.; Heinke, J.; von Bloh, W.; Gerten, D. Impact of reservoirs on river discharge and irrigation water supply during the 20th century. Water Resour. Res. 2011, 47, W03509. [Google Scholar] [CrossRef] [Green Version]
- Gao, G.; Fu, B.; Wang, S.; Liang, W.; Jiang, X. Determining the hydrological responses to climate variability and land use/cover change in the Loess Plateau with the Budyko framework. Sci. Total Environ. 2016, 557–558, 331–342. [Google Scholar] [CrossRef]
- Zhu, S.; Xu, Z.Y.; Luo, X.G.; Wang, C.; Zhang, H.R. Quantifying the contributions of climate change and human activities to drought extremes, using an improved evaluation framework. Water Resour. Manag. 2019, 33, 5051–5065. [Google Scholar] [CrossRef]
- Wang, F.; Duana, K.; Fu, S.; Goua, F.; Liang, W.; Yana, J.; Zhang, W. Partitioning climate and human contributions to changes in mean annual streamflow based on the Budyko complementary relationship in the Loess Plateau, China. Sci. Total Environ. 2019, 665, 579–590. [Google Scholar] [CrossRef]
- Wu, J.; Miao, C.; Zhang, X.; Yang, T.; Duan, Q. Detecting the quantitative hydrological response to changes in climate and human activities. Sci. Total Environ. 2017, 586, 328–337. [Google Scholar] [CrossRef]
- Wang, H.; Stephenson, S.R. Quantifying the impacts of climate change and land use/cover change on runoff in the lower Connecticut River Basin. Hydrol. Process. 2018, 32, 1301–1312. [Google Scholar] [CrossRef]
- Wu, L.; Wang, S.; Bai, X.; Luo, W.; Tian, Y.; Zeng, C.; Luo, G.; He, S. Quantitative assessment of the impacts of climate change and human activities on runoff change in a typical karst watershed, SW China. Sci. Total Environ. 2017, 601–602, 1449–1465. [Google Scholar] [CrossRef] [PubMed]
- Zhang, L.; Nan, Z.; Wang, W.; Ren, D.; Zhao, Y.; Wu, X. Separating climate change and human contributions to variations in streamflow and its components using eight time-trend methods. Hydrol. Process. 2019, 33, 383–394. [Google Scholar] [CrossRef]
- Zhao, Q.; Liu, S.; Deng, L.; Dong, S.; Yang, J.; Wang, C. The effects of dam construction and precipitation variability on hydrologic alteration in the Lancang River Basin of southwest China. Stoch. Environ. Res. Risk Assess. 2012, 26, 993–1011. [Google Scholar] [CrossRef]
- Zhao, Q.; Liu, S.; Deng, L.; Dong, S. Evaluating influences of the Manwan Dam and climate variability on the hydrology of the Lancang-Mekong River, Yunnan Province, southwest China. J. Hydrol. Eng. 2013, 18, 1322–1330. [Google Scholar] [CrossRef]
- Tonkin, J.D.; Merritt, D.M.; Olden, J.D.; Reynolds, L.V.; Lytle, D.A. Flow regime alteration degrades ecological networks in riparian ecosystems. Nat. Ecol. Evol. 2018, 2, 86–93. [Google Scholar] [CrossRef] [PubMed]
- Grill, G.; Lehner, B.; Thieme, M.; Geenen, B.; Tickner, D.; Antonelli, F.; Babu, S.; Borrelli, P.; Cheng, L.; Crochetiere, H.; et al. Mapping the world’s free-flowing rivers. Nature 2019, 569, 215–221. [Google Scholar] [CrossRef]
- Günther, G.; Bernhard, L.; Alexander, E.L.; Graham, K.M.; Christiane, Z.; Catherine Reidy, L. An index-based framework for assessing patterns and trends in river fragmentation and flow regulation by global dams at multiple scales. Environ. Res. Lett. 2015, 10, 015001. [Google Scholar]
- Ibon, A.; Maite, A.; Aitor, L.; Lydia, P.; Sergi, S.; Daniel, S.; Arturo, E.; Vicenç, A. Flow regulation by dams affects ecosystem metabolism in Mediterranean rivers. Freshw. Biol. 2014, 59, 1816–1829. [Google Scholar]
- Dey, P.; Mishra, A. Separating the impacts of climate change and human activities on streamflow: A review of methodologies and critical assumptions. J. Hydrol. 2017, 548, 278–290. [Google Scholar] [CrossRef]
- Bai, P.; Liu, W.; Guo, M. Impacts of climate variability and human activities on decrease in streamflow in the Qinhe River, China. Theor. Appl. Climatol. 2014, 117, 293–301. [Google Scholar] [CrossRef]
- Li, J.; Xia, J.; Ji, Q. Rapid and long-distance channel incision in the Lower Yellow River owing to upstream damming. Catena 2021, 196, 104943. [Google Scholar] [CrossRef]
- Kong, D.; Latrubesse, E.M.; Miao, C.; Zhou, R. Morphological response of the Lower Yellow River to the operation of Xiaolangdi Dam, China. Geomorphology 2020, 350, 106931. [Google Scholar] [CrossRef]
- Li, Y.; Chang, J.; Tu, H.; Wang, X. Impact of the Sanmenxia and Xiaolangdi reservoirs operation on the hydrologic regime of the Lower Yellow River. J. Hydrol. Eng. 2016, 21, 06015015. [Google Scholar] [CrossRef]
- Hong, Z.; Ding, S.; Zhao, Q.; Qiu, P.; Chang, J.; Peng, L.; Wang, S.; Hong, Y.; Liu, G.-J. Plant trait-environment trends and their conservation implications for riparian wetlands in the Yellow River. Sci. Total Environ. 2021, 767, 144867. [Google Scholar] [CrossRef] [PubMed]
- Mwangi, H.M.; Julich, S.; Patil, S.D.; McDonald, M.A.; Feger, K.H. Relative contribution of land use change and climate variability on discharge of upper Mara River, Kenya. J. Hydrol. Reg. Stud. 2016, 5, 244–260. [Google Scholar] [CrossRef] [Green Version]
- Li, X.; Zhang, Q. Variation of floods characteristics and their responses to climate and human activities in Poyang Lake, China. Chin. Geogr. Sci. 2015, 25, 13–25. [Google Scholar] [CrossRef] [Green Version]
- Zhang, Y.; Guan, D.; Jin, C.; Wang, A.; Wu, J.; Yuan, F. Impacts of climate change and land use change on runoff of forest catchment in northeast China. Hydrol. Process. 2014, 28, 186–196. [Google Scholar] [CrossRef]
- Wu, J.; Miao, C.; Wang, Y.; Duan, Q.; Zhang, X. Contribution analysis of the long-term changes in seasonal runoff on the Loess Plateau, China, using eight Budyko-based methods. J. Hydrol. 2017, 545, 263–275. [Google Scholar] [CrossRef]
- Jiang, J.; Liu, Z. Change-point analysis for the precipitation-runoff relationships of the Yellow River based on likelihood function. Yellow River 2018, 40, 10–13. [Google Scholar]
- Hu, H.; Cui, K.; Cao, Q.; Li, S.; Chang, X.; Shen, L. Analysis of the characteristics of runoff evolution in Yellow River in recent 100 years. Yellow River 2019, 41, 14–19. [Google Scholar]
- Wang, Y.; Ding, Y.; Ye, B.; Liu, F.; Wang, J.; Wang, J. Contributions of climate and human activities to changes in runoff of the Yellow and Yangtze rivers from 1950 to 2008. Sci. China Earth Sci. 2013, 56, 1398–1412. [Google Scholar] [CrossRef]
- Peng, S.; Liu, W.; Wang, W.; Shao, Q.; Jiao, X.; Yu, Z.; Xing, W.; Xu, J.; Zhang, Z.; Luo, Y. Estimating the effects of climatic variability and human activities on streamflow in the Hutuo River basin, China. J. Hydrol. Eng. 2013, 18, 422–430. [Google Scholar] [CrossRef]
- Fang, H.; Yuan, Z.; Yan, D.; Yang, Z.; Yan, S. Study on attribution of runoff evolution of Yellow River. Water Resour. Hydropower Eng. 2014, 45, 1–6,58. [Google Scholar]
- Qi, P.; Xu, Y.J.; Wang, G. Quantifying the individual contributions of climate change, dam construction, and land use/land cover change to hydrological drought in a marshy river. Sustainability 2020, 12, 3777. [Google Scholar] [CrossRef]
Figure 1.
Location of the Xiaolangdi Dam, the Huayuankou hydrological station, and select meteorological stations in the Yellow River basin.
Figure 1.
Location of the Xiaolangdi Dam, the Huayuankou hydrological station, and select meteorological stations in the Yellow River basin.

Figure 2.
Variation in precipitation annually (a), in the flood season (b), and in the non-flood season (c) from 1961–2018 in the Yellow River basin.
Figure 2.
Variation in precipitation annually (a), in the flood season (b), and in the non-flood season (c) from 1961–2018 in the Yellow River basin.

Figure 3.
Variation in air temperature annually (a), in the flood season (b), and in the non-flood season (c) from 1961–2018 in the Yellow River basin.
Figure 3.
Variation in air temperature annually (a), in the flood season (b), and in the non-flood season (c) from 1961–2018 in the Yellow River basin.

Figure 4.
Variation in runoff annually (a), in the flood season (b), and in the non-flood season (c) from 1961–2018 at the Huayuankou hydrological station.
Figure 4.
Variation in runoff annually (a), in the flood season (b), and in the non-flood season (c) from 1961–2018 at the Huayuankou hydrological station.

Figure 5.
Abrupt changes in runoff annually (a,d), during the flood season (b,e), and during the non-flood season (c,f) from 1961–2018 at the Huayuankou hydrological station; change point assessments were made using Mann-Kendall tests and the double mass curve method.
Figure 5.
Abrupt changes in runoff annually (a,d), during the flood season (b,e), and during the non-flood season (c,f) from 1961–2018 at the Huayuankou hydrological station; change point assessments were made using Mann-Kendall tests and the double mass curve method.

Figure 6.
Double mass curves for cumulative precipitation-runoff measured annually (a), in the flood season (b), and in the non-flood season (c) in the Yellow River basin from 1961–2018.
Figure 6.
Double mass curves for cumulative precipitation-runoff measured annually (a), in the flood season (b), and in the non-flood season (c) in the Yellow River basin from 1961–2018.


Table 1.
Characteristics and trends in annual and seasonal precipitation in the Yellow River basin from 1961–2018.
Table 1.
Characteristics and trends in annual and seasonal precipitation in the Yellow River basin from 1961–2018.
| Mean (mm) | Standard Normal Variable (ZS) | Significance Level (p) | Trend Direction | Coefficient of Variation (Cv) | Extreme Value Ratio (ρ) | |
|---|---|---|---|---|---|---|
| Annual | 489.71 | −0.52 | ns | Decreasing | 0.13 | 2.08 |
| Flood season | 370.45 | −0.60 | ns | Decreasing | 0.15 | 2.26 |
| Non-flood season | 119.26 | −0.04 | ns | Decreasing | 0.24 | 2.36 |
Notes: ns indicates no significant change trend was observed.
Table 2.
Characteristics and trends in annual and seasonal air temperature in the Yellow River basin from 1961–2018.
Table 2.
Characteristics and trends in annual and seasonal air temperature in the Yellow River basin from 1961–2018.
| Mean (°C) | Standard Normal Variable (ZS) | Significance Level (p) | Trend Direction | Coefficient of Variation (Cv) | Change Rate (°C/10a) | |
|---|---|---|---|---|---|---|
| Annual | 9.67 | 6.16 | 0.01 | Increasing | 0.07 | 0.29 |
| Flood season | 18.26 | 5.24 | 0.01 | Increasing | 0.03 | 0.19 |
| Non-flood season | 3.54 | 6.29 | 0.01 | Increasing | 0.22 | 0.37 |
Table 3.
Characteristics and trends in annual and seasonal runoff at Huayuankou hydrological station from 1961–2018.
Table 3.
Characteristics and trends in annual and seasonal runoff at Huayuankou hydrological station from 1961–2018.
| Mean (mm) | Standard Normal Variable (ZS) | Significance Level (p) | Trend Direction | Coefficient of Variation (Cv) | Extreme Value Ratio (ρ) | |
|---|---|---|---|---|---|---|
| Annual | 48.09 | −5.38 | 0.01 | Decreasing | 0.41 | 6.04 |
| Flood season | 28.13 | −4.86 | 0.01 | Decreasing | 0.53 | 10.71 |
| Non-flood season | 19.96 | −4.78 | 0.01 | Decreasing | 0.28 | 3.37 |
Table 4.
Effects of climate change and human activities on annual and seasonal runoff at the Huayuankou hydrological station in the lower Yellow River.
Table 4.
Effects of climate change and human activities on annual and seasonal runoff at the Huayuankou hydrological station in the lower Yellow River.
| Periods | Observed Q (mm) | Simulated Q (mm) | ΔQT (mm) | ΔQC (mm) | ΔQH (mm) | ηC (%) | ηH (%) | |
|---|---|---|---|---|---|---|---|---|
| Annual | 1961–1986 | 62.07 | ||||||
| 1987–2018 | 36.73 | 57.5 | −25.34 | −4.57 | −20.76 | (+)18.06 | (+)81.94 | |
| Flood season | 1961–1989 | 38.01 | ||||||
| 1990–2018 | 18.25 | 35.33 | −19.76 | −2.67 | −17.08 | (+)13.53 | (+)86.47 | |
| Non-flood season | 1961–1986 | 23.41 | ||||||
| 1987–2018 | 17.17 | 22.79 | −6.24 | −0.61 | −5.63 | (+)9.80 | (+)90.20 |
Notes: Q indicates mean runoff; ΔQT indicates the total variation in runoff; ηC and ηH represent the relative contributions of climate change and human activities, respectively, to changes in runoff; the minus and plus signs in brackets reflect the direction of the contributions.
Table 5.
Annual and seasonal meteorological and hydrological characteristics for the Yellow River basin during the pre- and post-change periods.
Table 5.
Annual and seasonal meteorological and hydrological characteristics for the Yellow River basin during the pre- and post-change periods.
| Period | Q (mm) | P (mm) | PET (mm) | εP | εPET | |
|---|---|---|---|---|---|---|
| Annual | 1961–1986 | 62.07 | 500.41 | 914.67 | 3.13 | −2.13 |
| 1987–2018 | 36.73 | 481.02 | 906.27 | 3.09 | −2.09 | |
| Flood season | 1961–1989 | 38.01 | 378.37 | 501.52 | 2.73 | −1.73 |
| 1990–2018 | 18.25 | 362.54 | 494.69 | 2.72 | −1.72 | |
| Non-flood season | 1961–1986 | 23.41 | 119.16 | 417.78 | 5.09 | −4.09 |
| 1987–2018 | 17.17 | 119.34 | 409.59 | 4.25 | −3.25 |
Notes: Q indicates mean runoff; P indicates mean precipitation; PET indicates potential evapotranspiration; and εP and εPET represent the elasticity in Q to P and PET, respectively.
Table 6.
Attribution of variation in annual and seasonal runoff at Huayuankou hydrological station in the lower Yellow River from 1961–2018 to climate change versus human activities.
Table 6.
Attribution of variation in annual and seasonal runoff at Huayuankou hydrological station in the lower Yellow River from 1961–2018 to climate change versus human activities.
| Post-Change Period | ΔQ (mm) | ΔQ’ (mm) | ΔQP (mm) | ΔQPET (mm) | ΔQH (mm) | ηP (%) | ηPET (%) | ηH (%) | |
|---|---|---|---|---|---|---|---|---|---|
| Annual | 1987–2018 | −25.34 | 27.22 | −5.93 | 0.94 | −20.35 | (+)21.79 | (−)3.45 | (+)74.76 |
| Flood season | 1990–2018 | −19.76 | 21.08 | −3.27 | 0.66 | −17.15 | (+)15.51 | (−)3.13 | (+)81.36 |
| Non-flood season | 1987–2018 | −6.24 | 8.68 | 0.11 | 1.11 | −7.46 | (−)1.27 | (−)12.79 | (+)85.94 |
Notes: ΔQ indicates the actual variation in runoff; ΔQ’ indicates the sum of runoff variation caused by all individual variables; ΔQP, ΔQPET, and ΔQH indicate the relative contributions of precipitation, potential evapotranspiration, and human activities, respectively; ηP, ηPET, and ηH indicate the percent contributions of precipitation, potential evapotranspiration, and human activities; plus and minus signs in brackets reflect effect directions.
Table 7.
Annual and seasonal meteorological and hydrological characteristics in the Yellow River basin for the pre- and post-dam periods.
Table 7.
Annual and seasonal meteorological and hydrological characteristics in the Yellow River basin for the pre- and post-dam periods.
| Scale | Period | Q (mm) | P (mm) | PET (mm) | εP | εPET |
|---|---|---|---|---|---|---|
| Annual | Pre-dam (1987–2001) | 37.16 | 461.31 | 920.58 | 3.16 | −2.16 |
| Post-dam (2002–2018) | 36.36 | 498.41 | 890.47 | 3.03 | −2.03 | |
| Flood season | Pre-dam (1990–2001) | 16.45 | 343.09 | 502.24 | 2.80 | −1.80 |
| Post-dam (2002–2018) | 19.52 | 376.27 | 487.39 | 2.65 | −1.65 | |
| Non-flood season | Pre-dam (1987–2001) | 17.54 | 116.16 | 416.96 | 4.34 | −3.34 |
| Post-dam (2002–2018) | 16.83 | 122.14 | 403.08 | 4.18 | −3.18 |
Notes: Q indicates mean runoff; P indicates mean precipitation; PET indicates potential evapotranspiration; and εP and εPET represent the elasticity of Q to P and PET, respectively.
Table 8.
Effects of the Xiaolangdi Dam on changes in annual and seasonal runoff at the Huayuankou hydrological station for the post-dam period (2002–2018).
Table 8.
Effects of the Xiaolangdi Dam on changes in annual and seasonal runoff at the Huayuankou hydrological station for the post-dam period (2002–2018).
| Scale | ΔQ | ΔQ’ | ΔQP | ΔQPET | ΔQdam | ηP | ηPET | ηdam |
|---|---|---|---|---|---|---|---|---|
| Annual | −0.80 | 26.12 | 8.20 | 4.46 | −13.46 | (−)31.39 | (−)17.08 | (+)51.53 |
| Flood season | 3.08 | 8.60 | 4.57 | 1.27 | −2.76 | (+)53.14 | (+)14.77 | (−)32.09 |
| Non-flood season | −0.71 | 19.79 | 3.45 | 6.09 | −10.25 | (−)17.43 | (−)30.77 | (+)51.79 |
Notes: ΔQ indicates the actual variation in runoff; ΔQ’ indicates the sum of runoff variation caused by all individual variables; ΔQP, ΔQPET, and ΔQdam indicate the relative contribution to changes in runoff from precipitation, potential evapotranspiration, and the Xiaolangdi Dam, respectively; ηP, ηPET, and ηdam indicate the percent contributions of precipitation, potential evapotranspiration, and the Xiaolangdi Dam; the plus and minus signs in brackets reflect effect directions.
Publisher’s Note: MDPI stays neutral with regard to jurisdictional claims in published maps and institutional affiliations. |
© 2021 by the authors. Licensee MDPI, Basel, Switzerland. This article is an open access article distributed under the terms and conditions of the Creative Commons Attribution (CC BY) license (https://creativecommons.org/licenses/by/4.0/).
Share and Cite
MDPI and ACS Style
Zhao, Q.; Ding, S.; Ji, X.; Hong, Z.; Lu, M.; Wang, P. Relative Contribution of the Xiaolangdi Dam to Runoff Changes in the Lower Yellow River. Land 2021, 10, 521. https://0-doi-org.brum.beds.ac.uk/10.3390/land10050521
AMA Style
Zhao Q, Ding S, Ji X, Hong Z, Lu M, Wang P. Relative Contribution of the Xiaolangdi Dam to Runoff Changes in the Lower Yellow River. Land. 2021; 10(5):521. https://0-doi-org.brum.beds.ac.uk/10.3390/land10050521
Chicago/Turabian StyleZhao, Qinghe, Shengyan Ding, Xiaoyu Ji, Zhendong Hong, Mengwen Lu, and Peng Wang. 2021. "Relative Contribution of the Xiaolangdi Dam to Runoff Changes in the Lower Yellow River" Land 10, no. 5: 521. https://0-doi-org.brum.beds.ac.uk/10.3390/land10050521
Note that from the first issue of 2016, this journal uses article numbers instead of page numbers. See further details here.