
Quantifying the Relative Contribution of Climate Change and Anthropogenic Activities on Runoff Variations in the Central Part of Tajikistan in Central Asia

 ,
,  , and
, and
Abstract
:1. Introduction
2. Materials and Methods
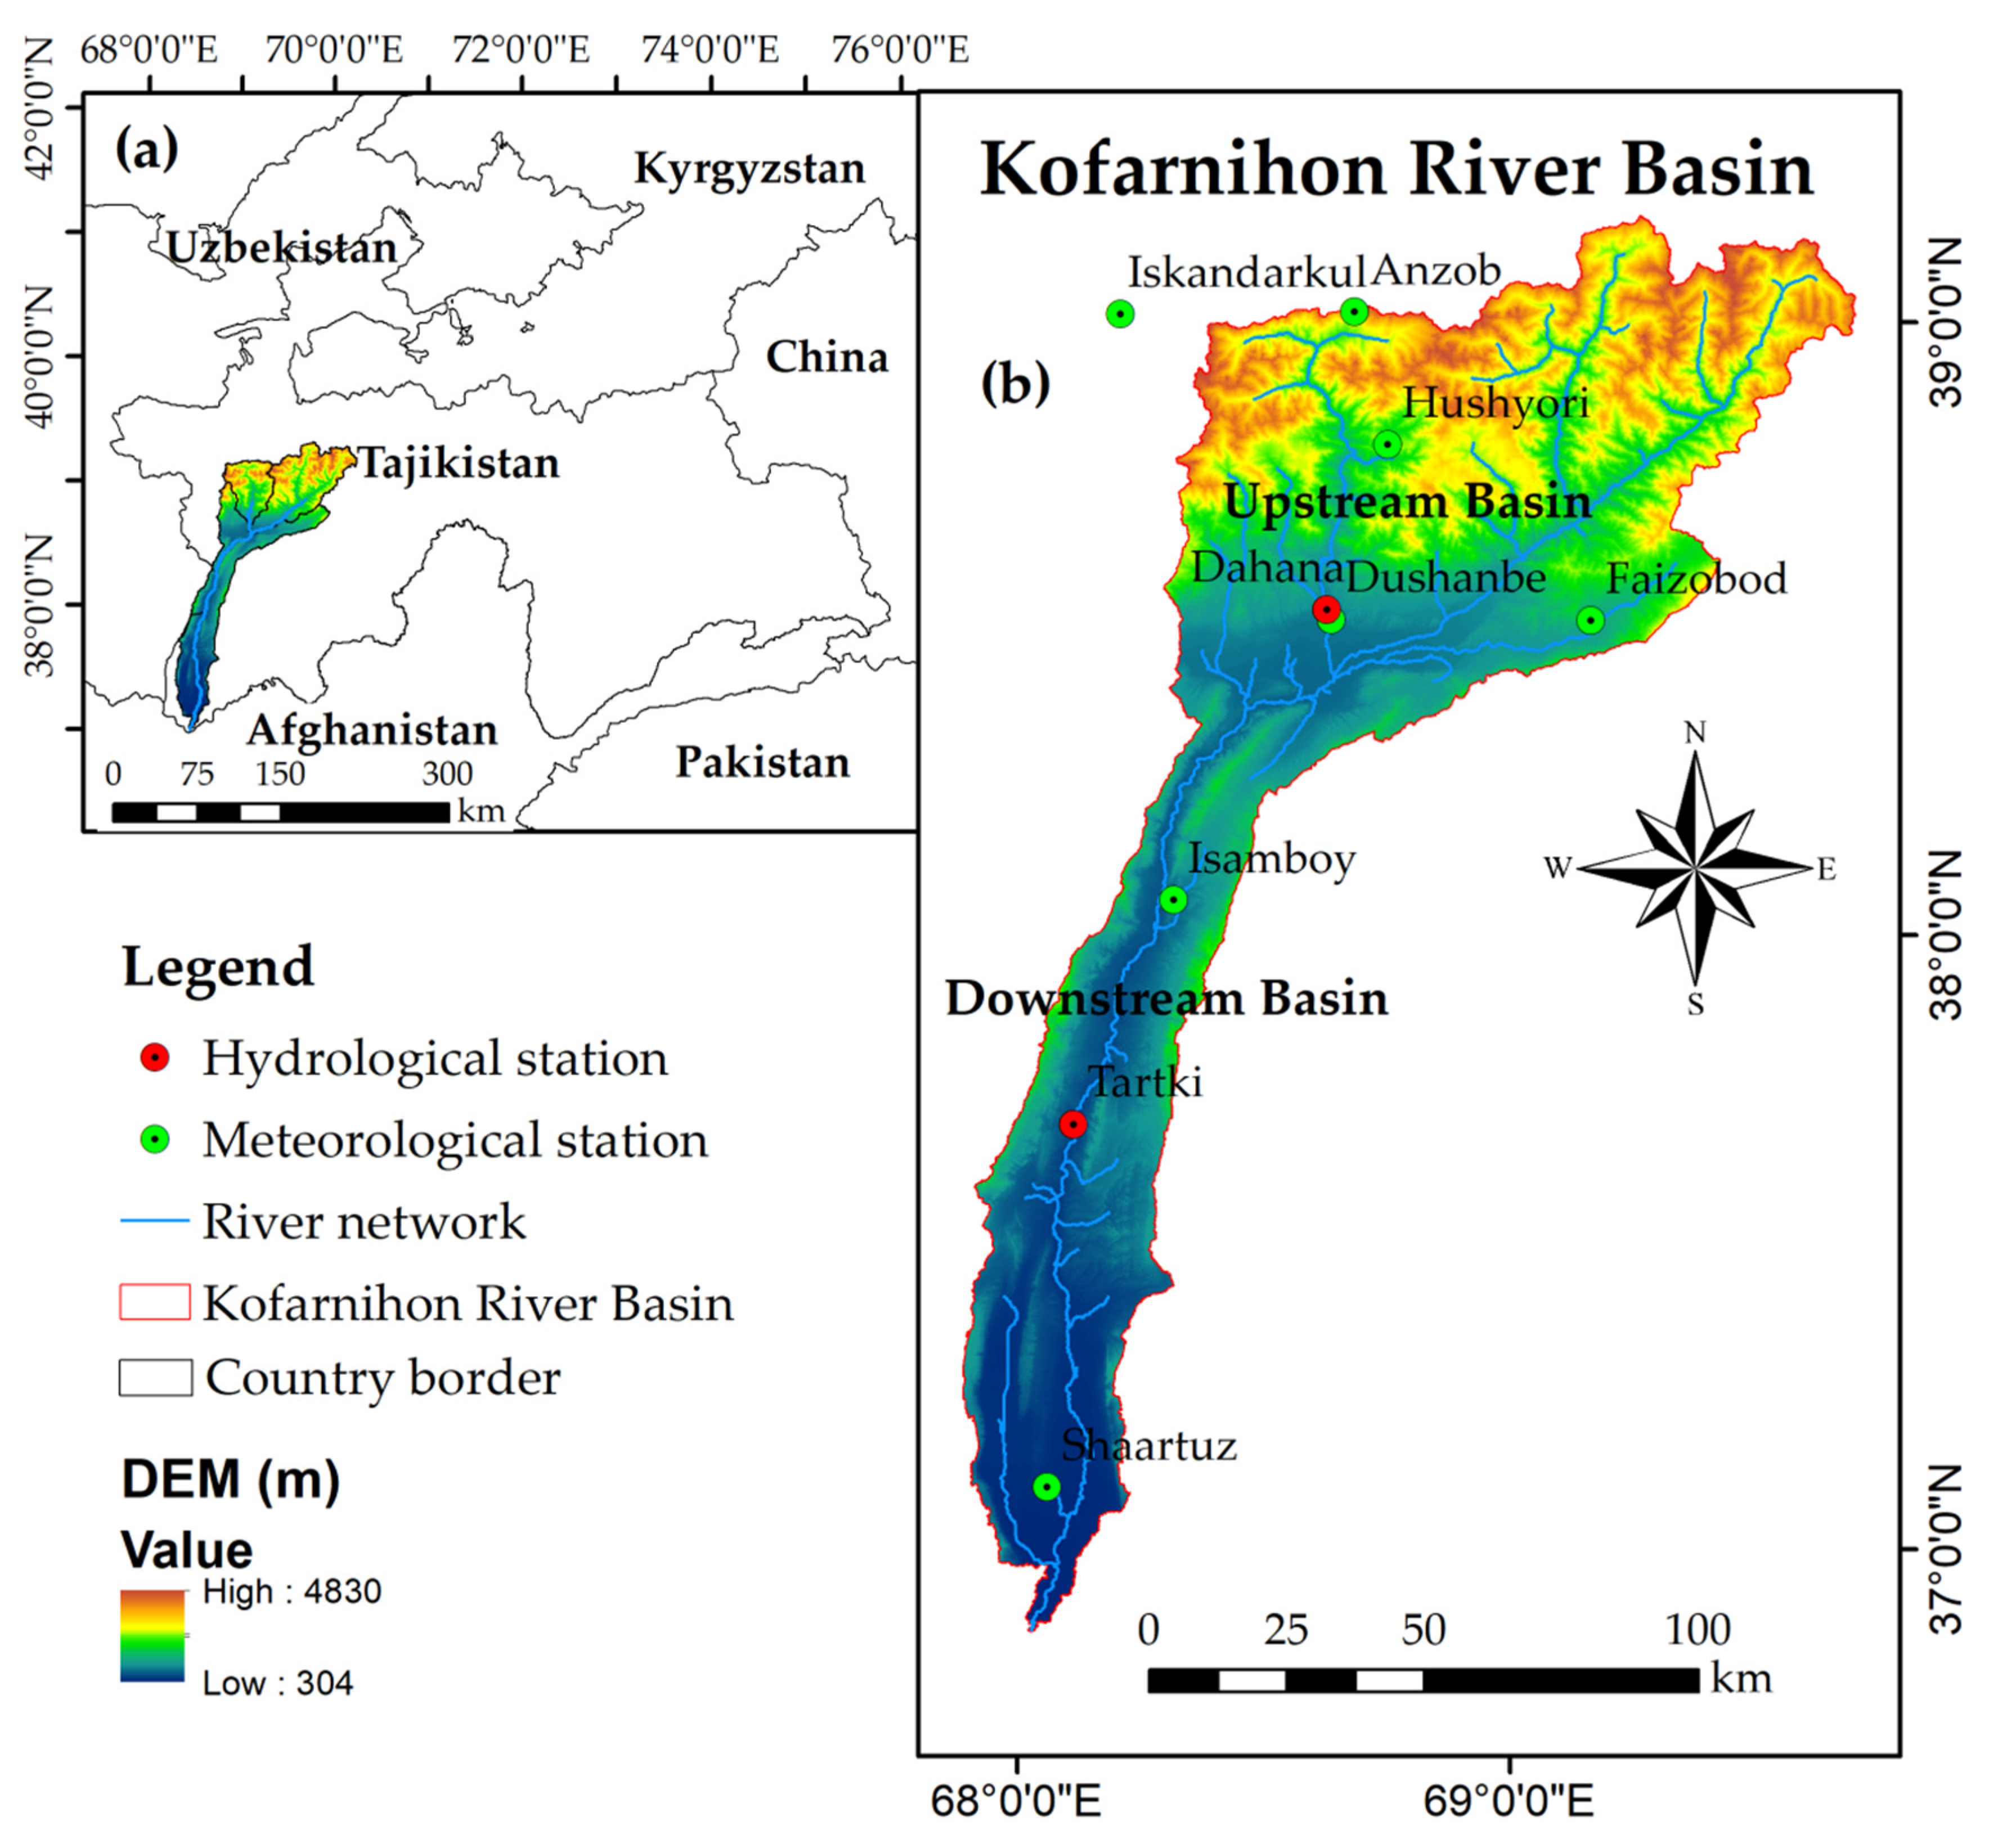
2.1. Study Area
2.2. Data Source
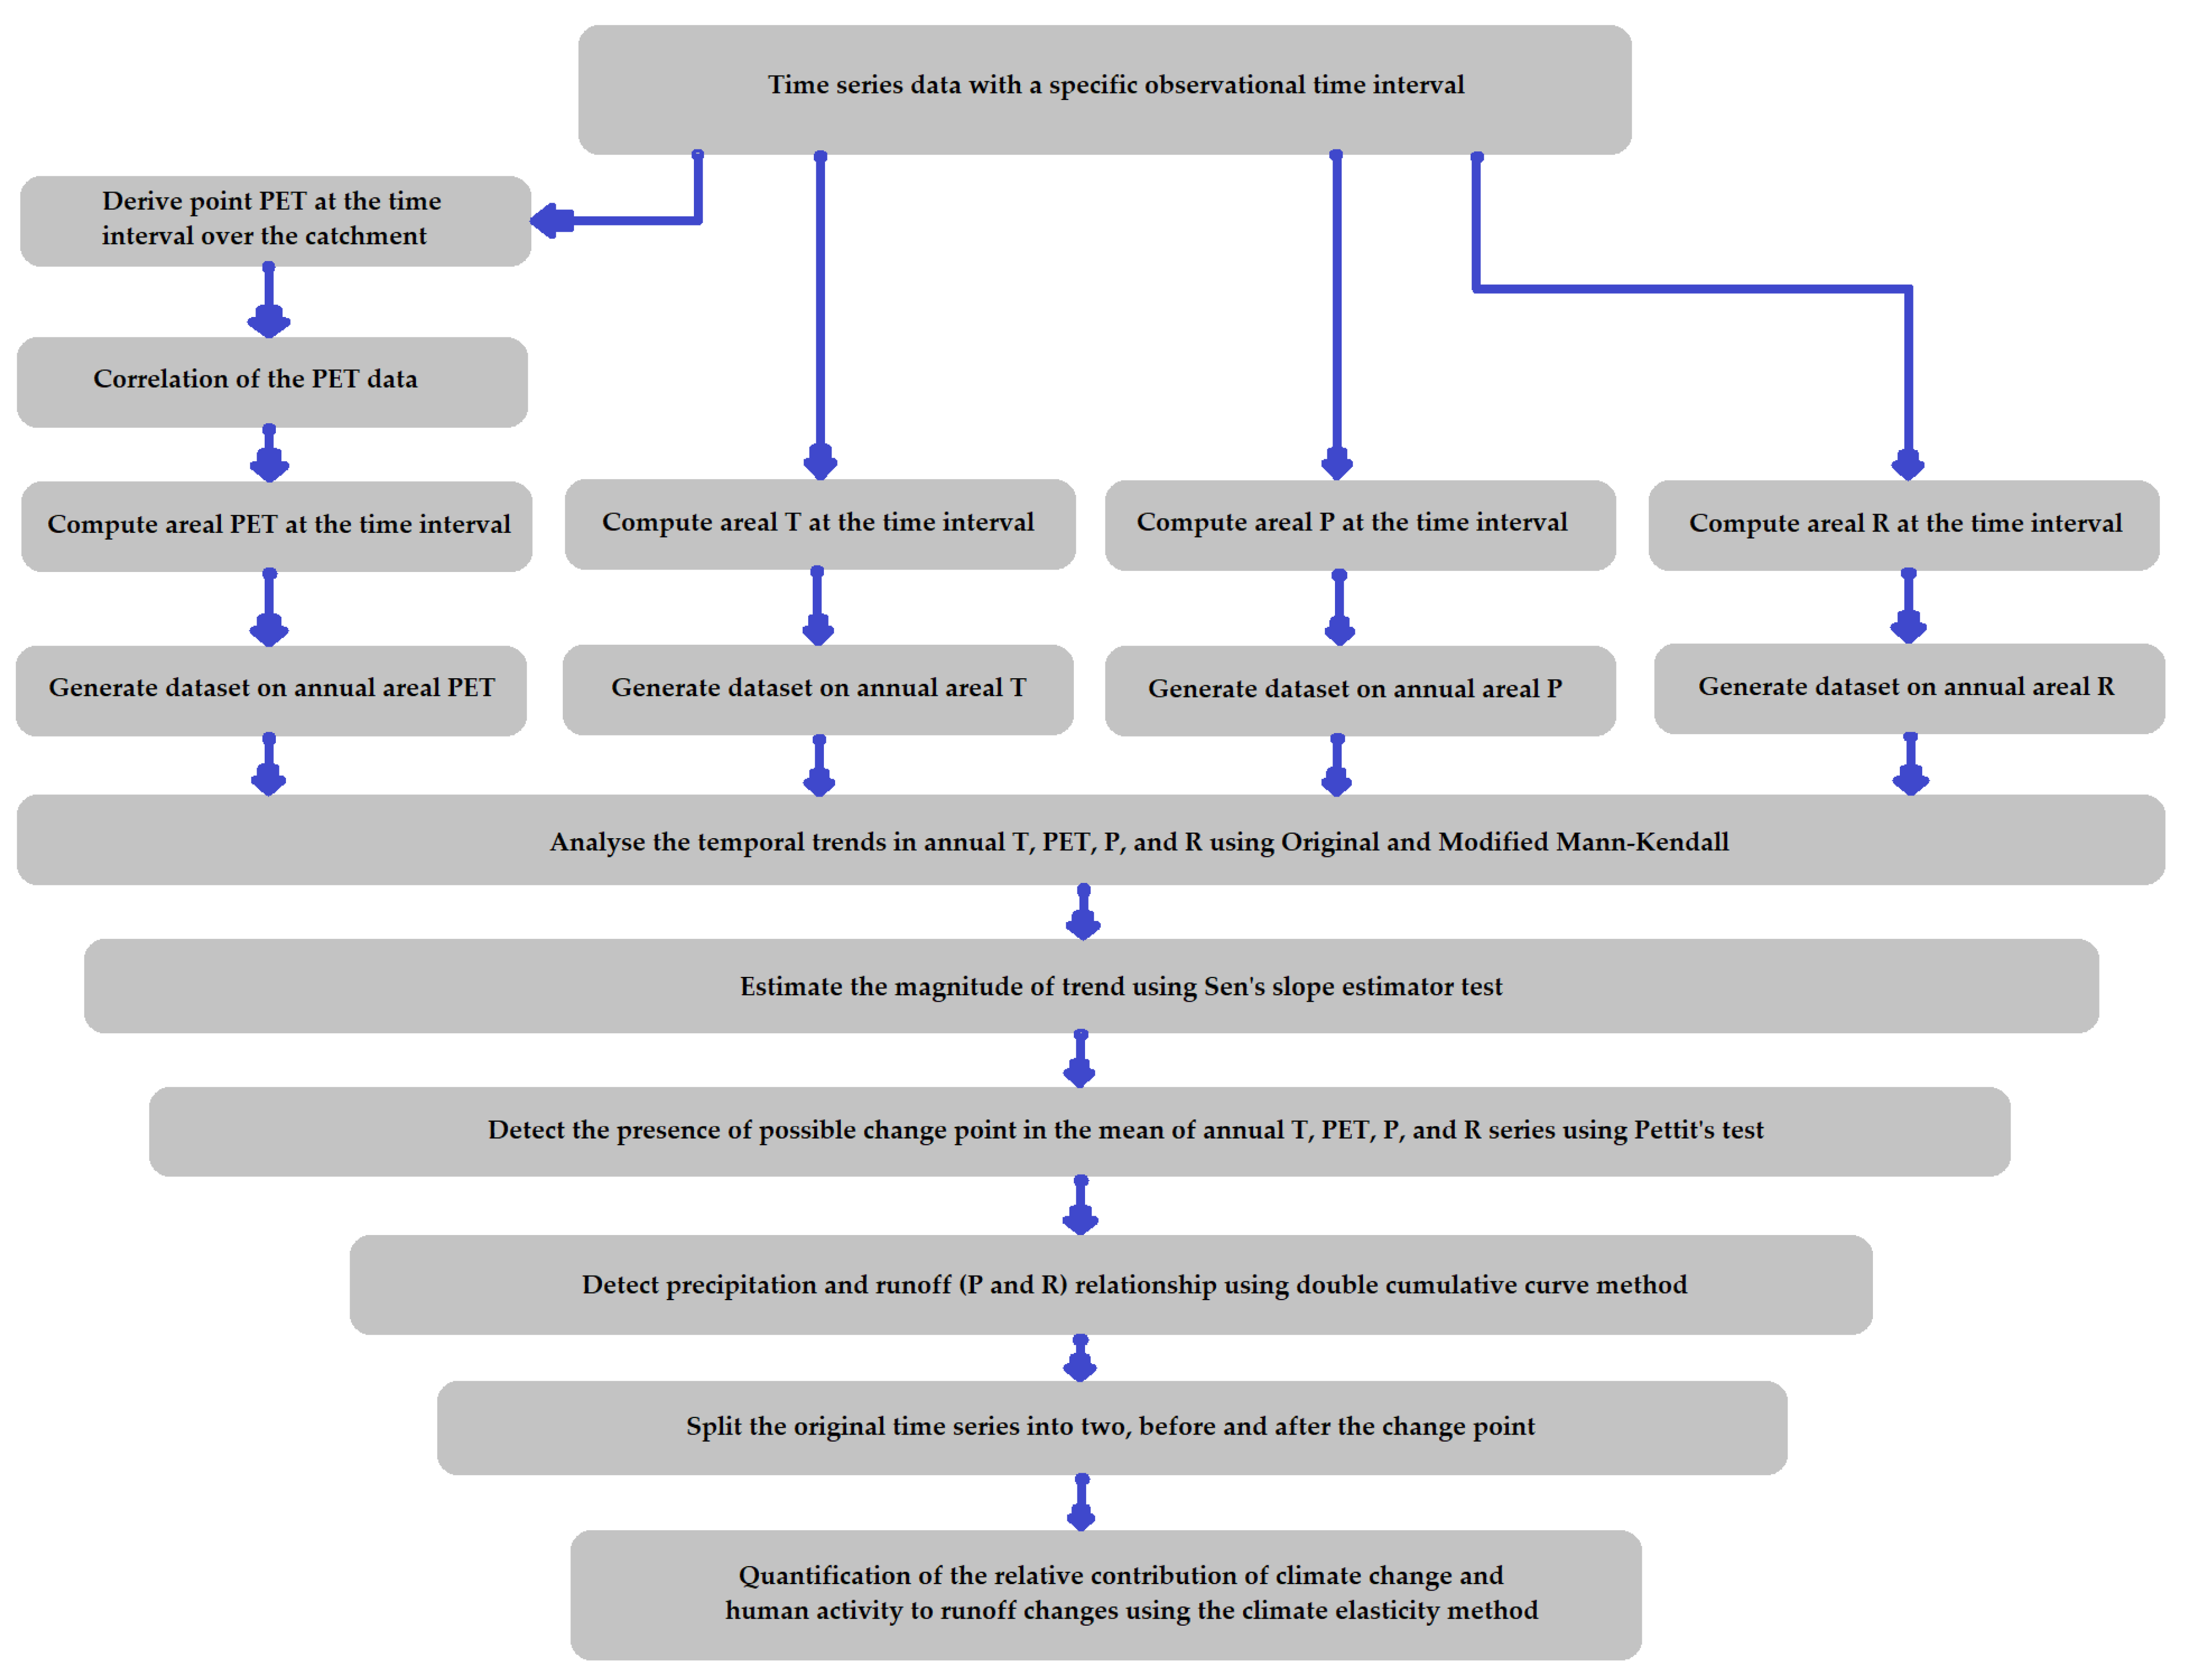
3. Methodology
3.1. Mann–Kendall Trend Test
3.2. Sen’s Slope Estimator
3.3. Change Point Detection
3.4. Double Cumulative Curve Method
3.5. The Climate Elasticity Method
4. Results
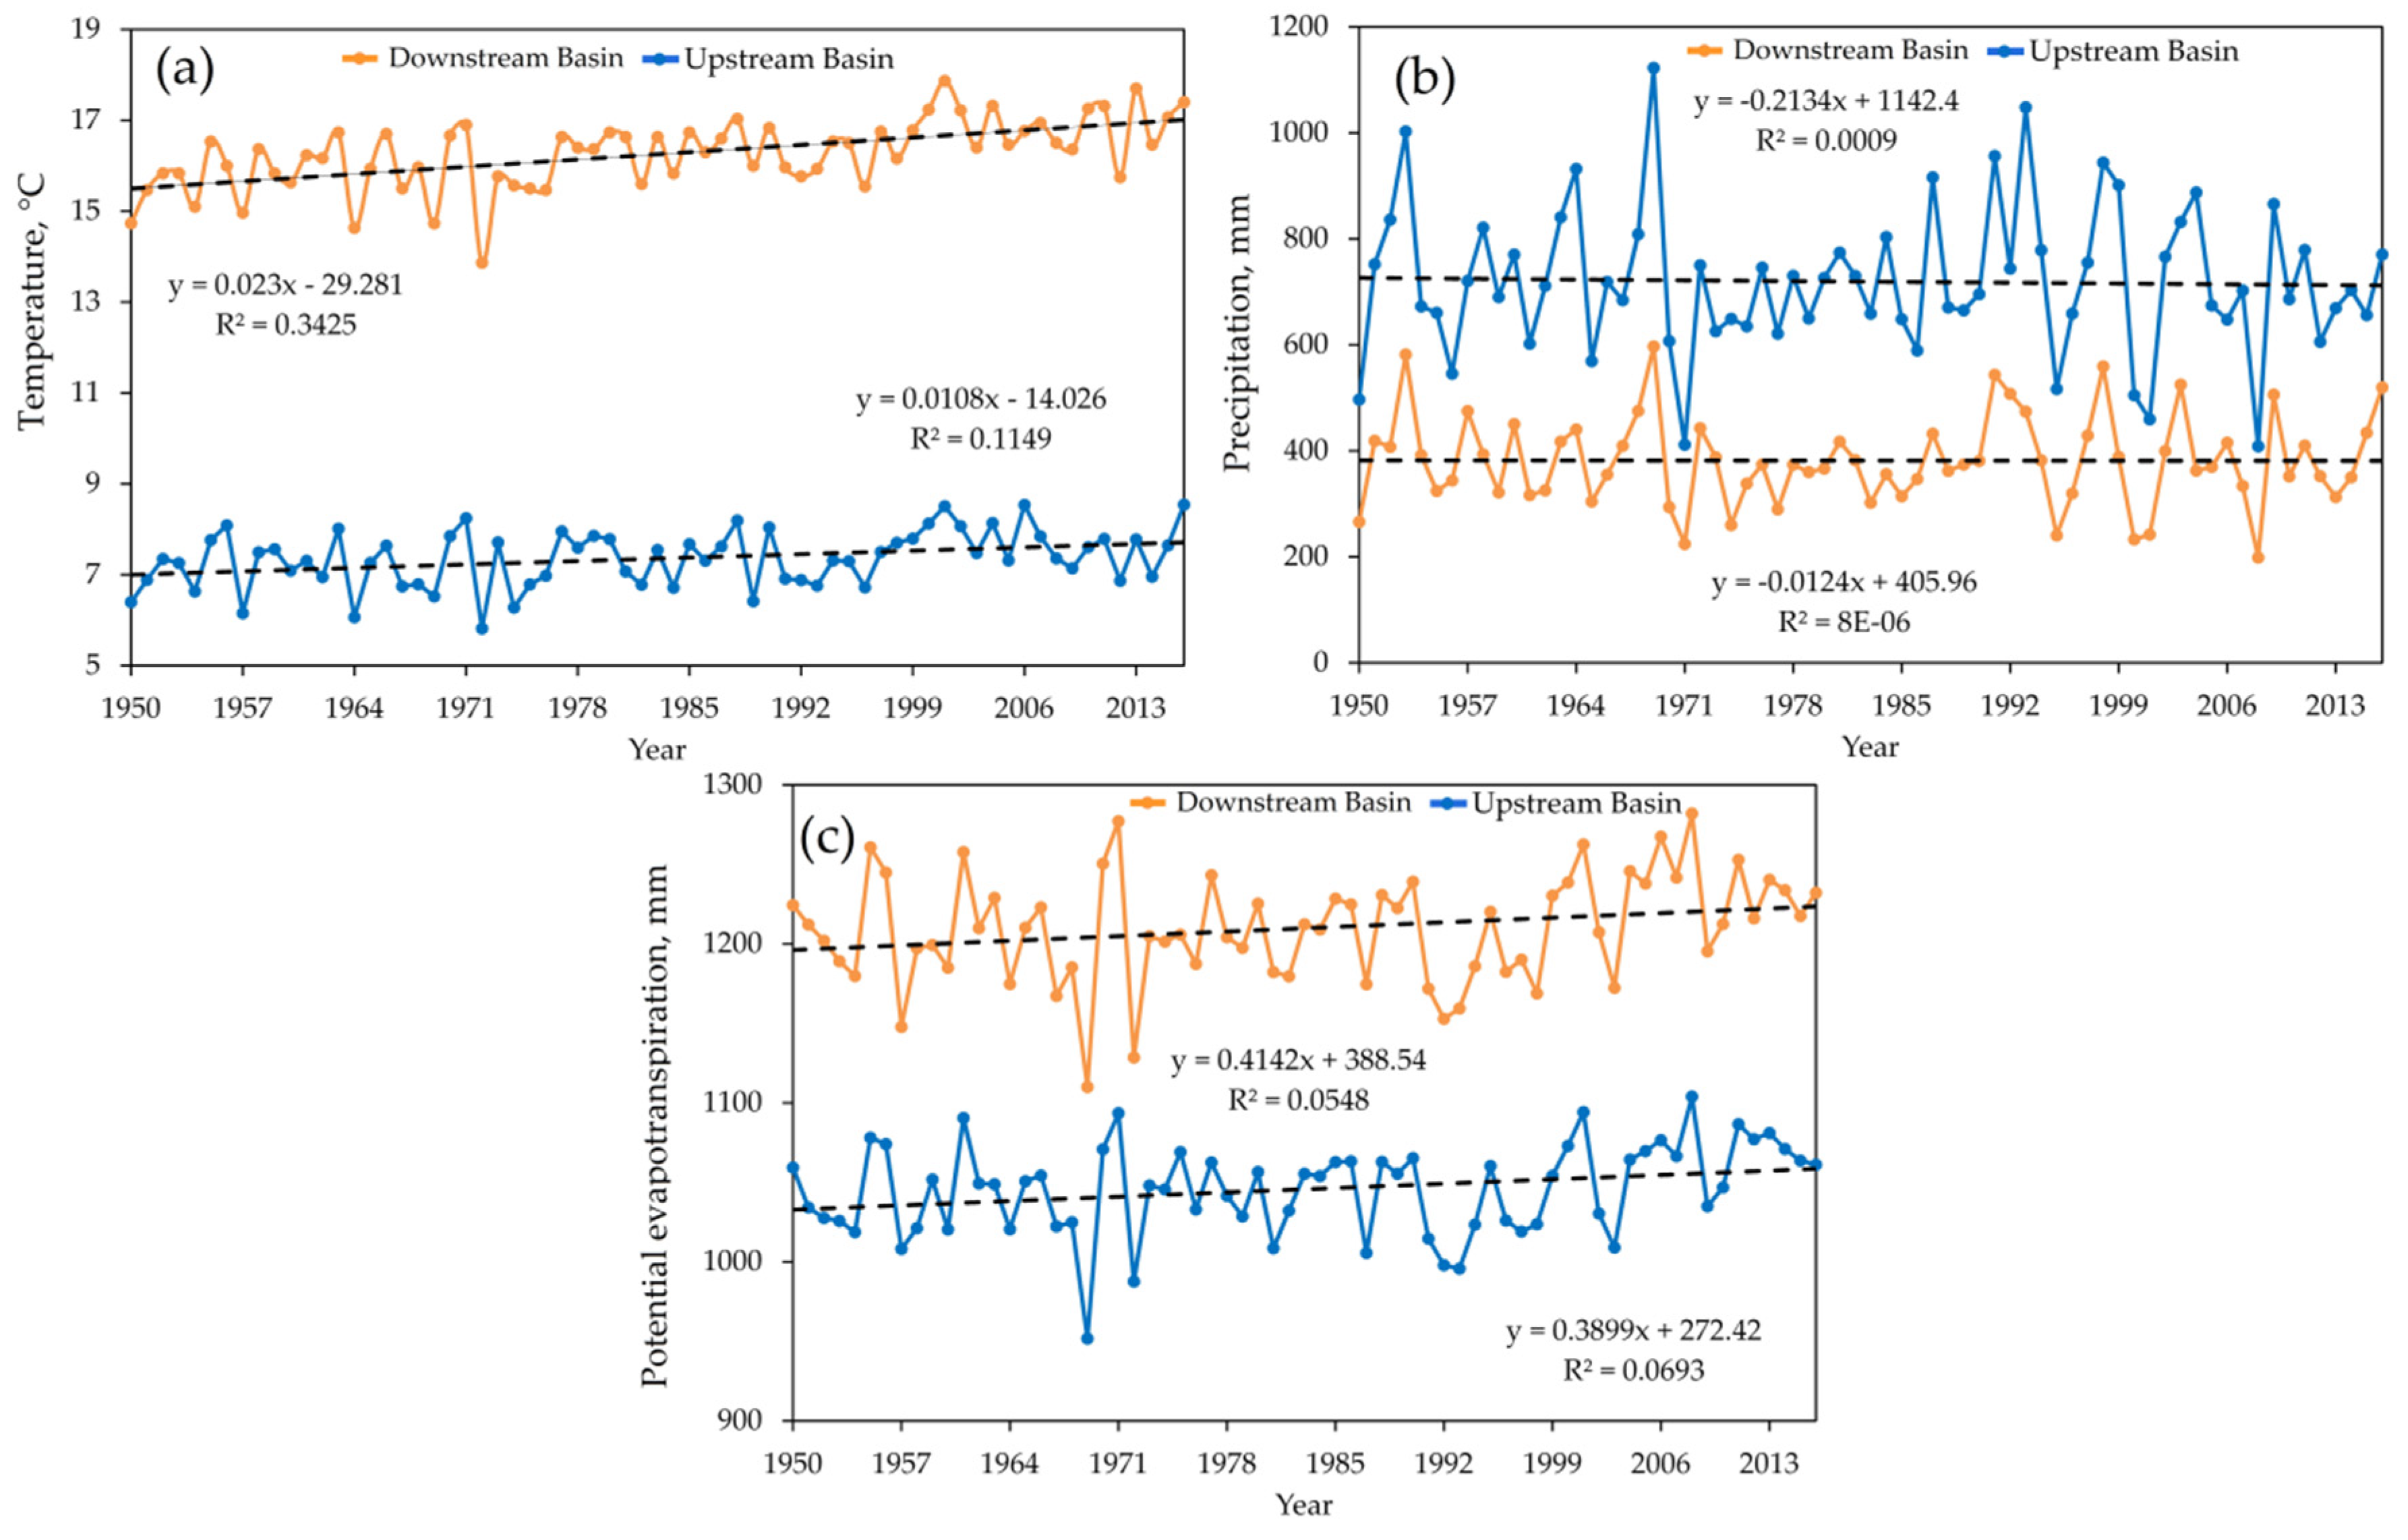
4.1. Trend and Change Point Analysis of the Temperature, Precipitation and Potential Evapotranspiration Series
4.2. Identification of Change Point and Trend Test of Runoff
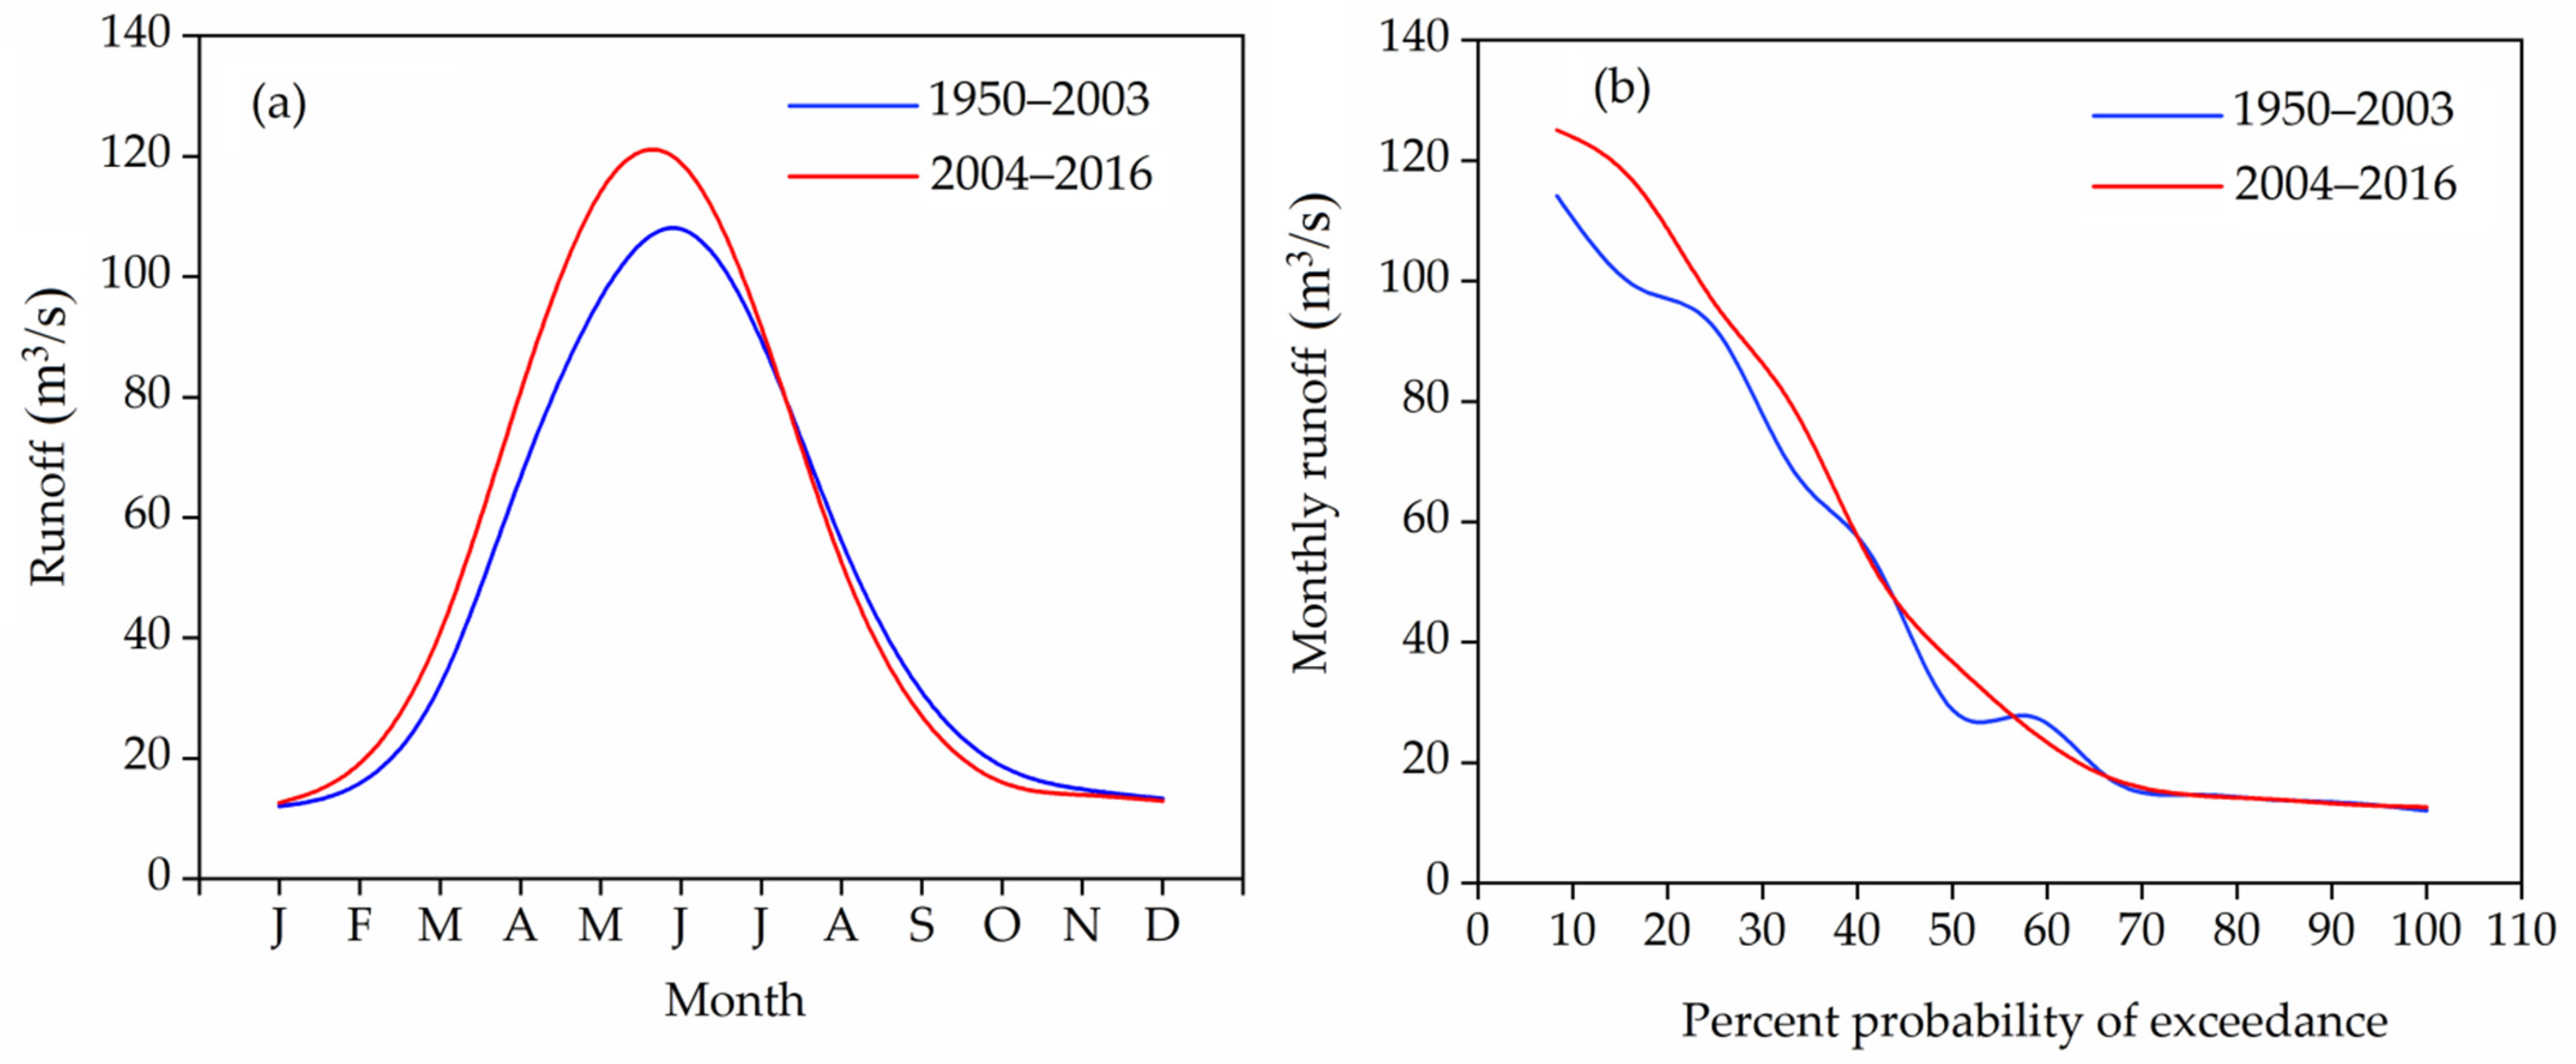
4.3. Changes in Runoff Regime
4.4. Effects of Climate Change and Anthropogenic Intervention on Runoff
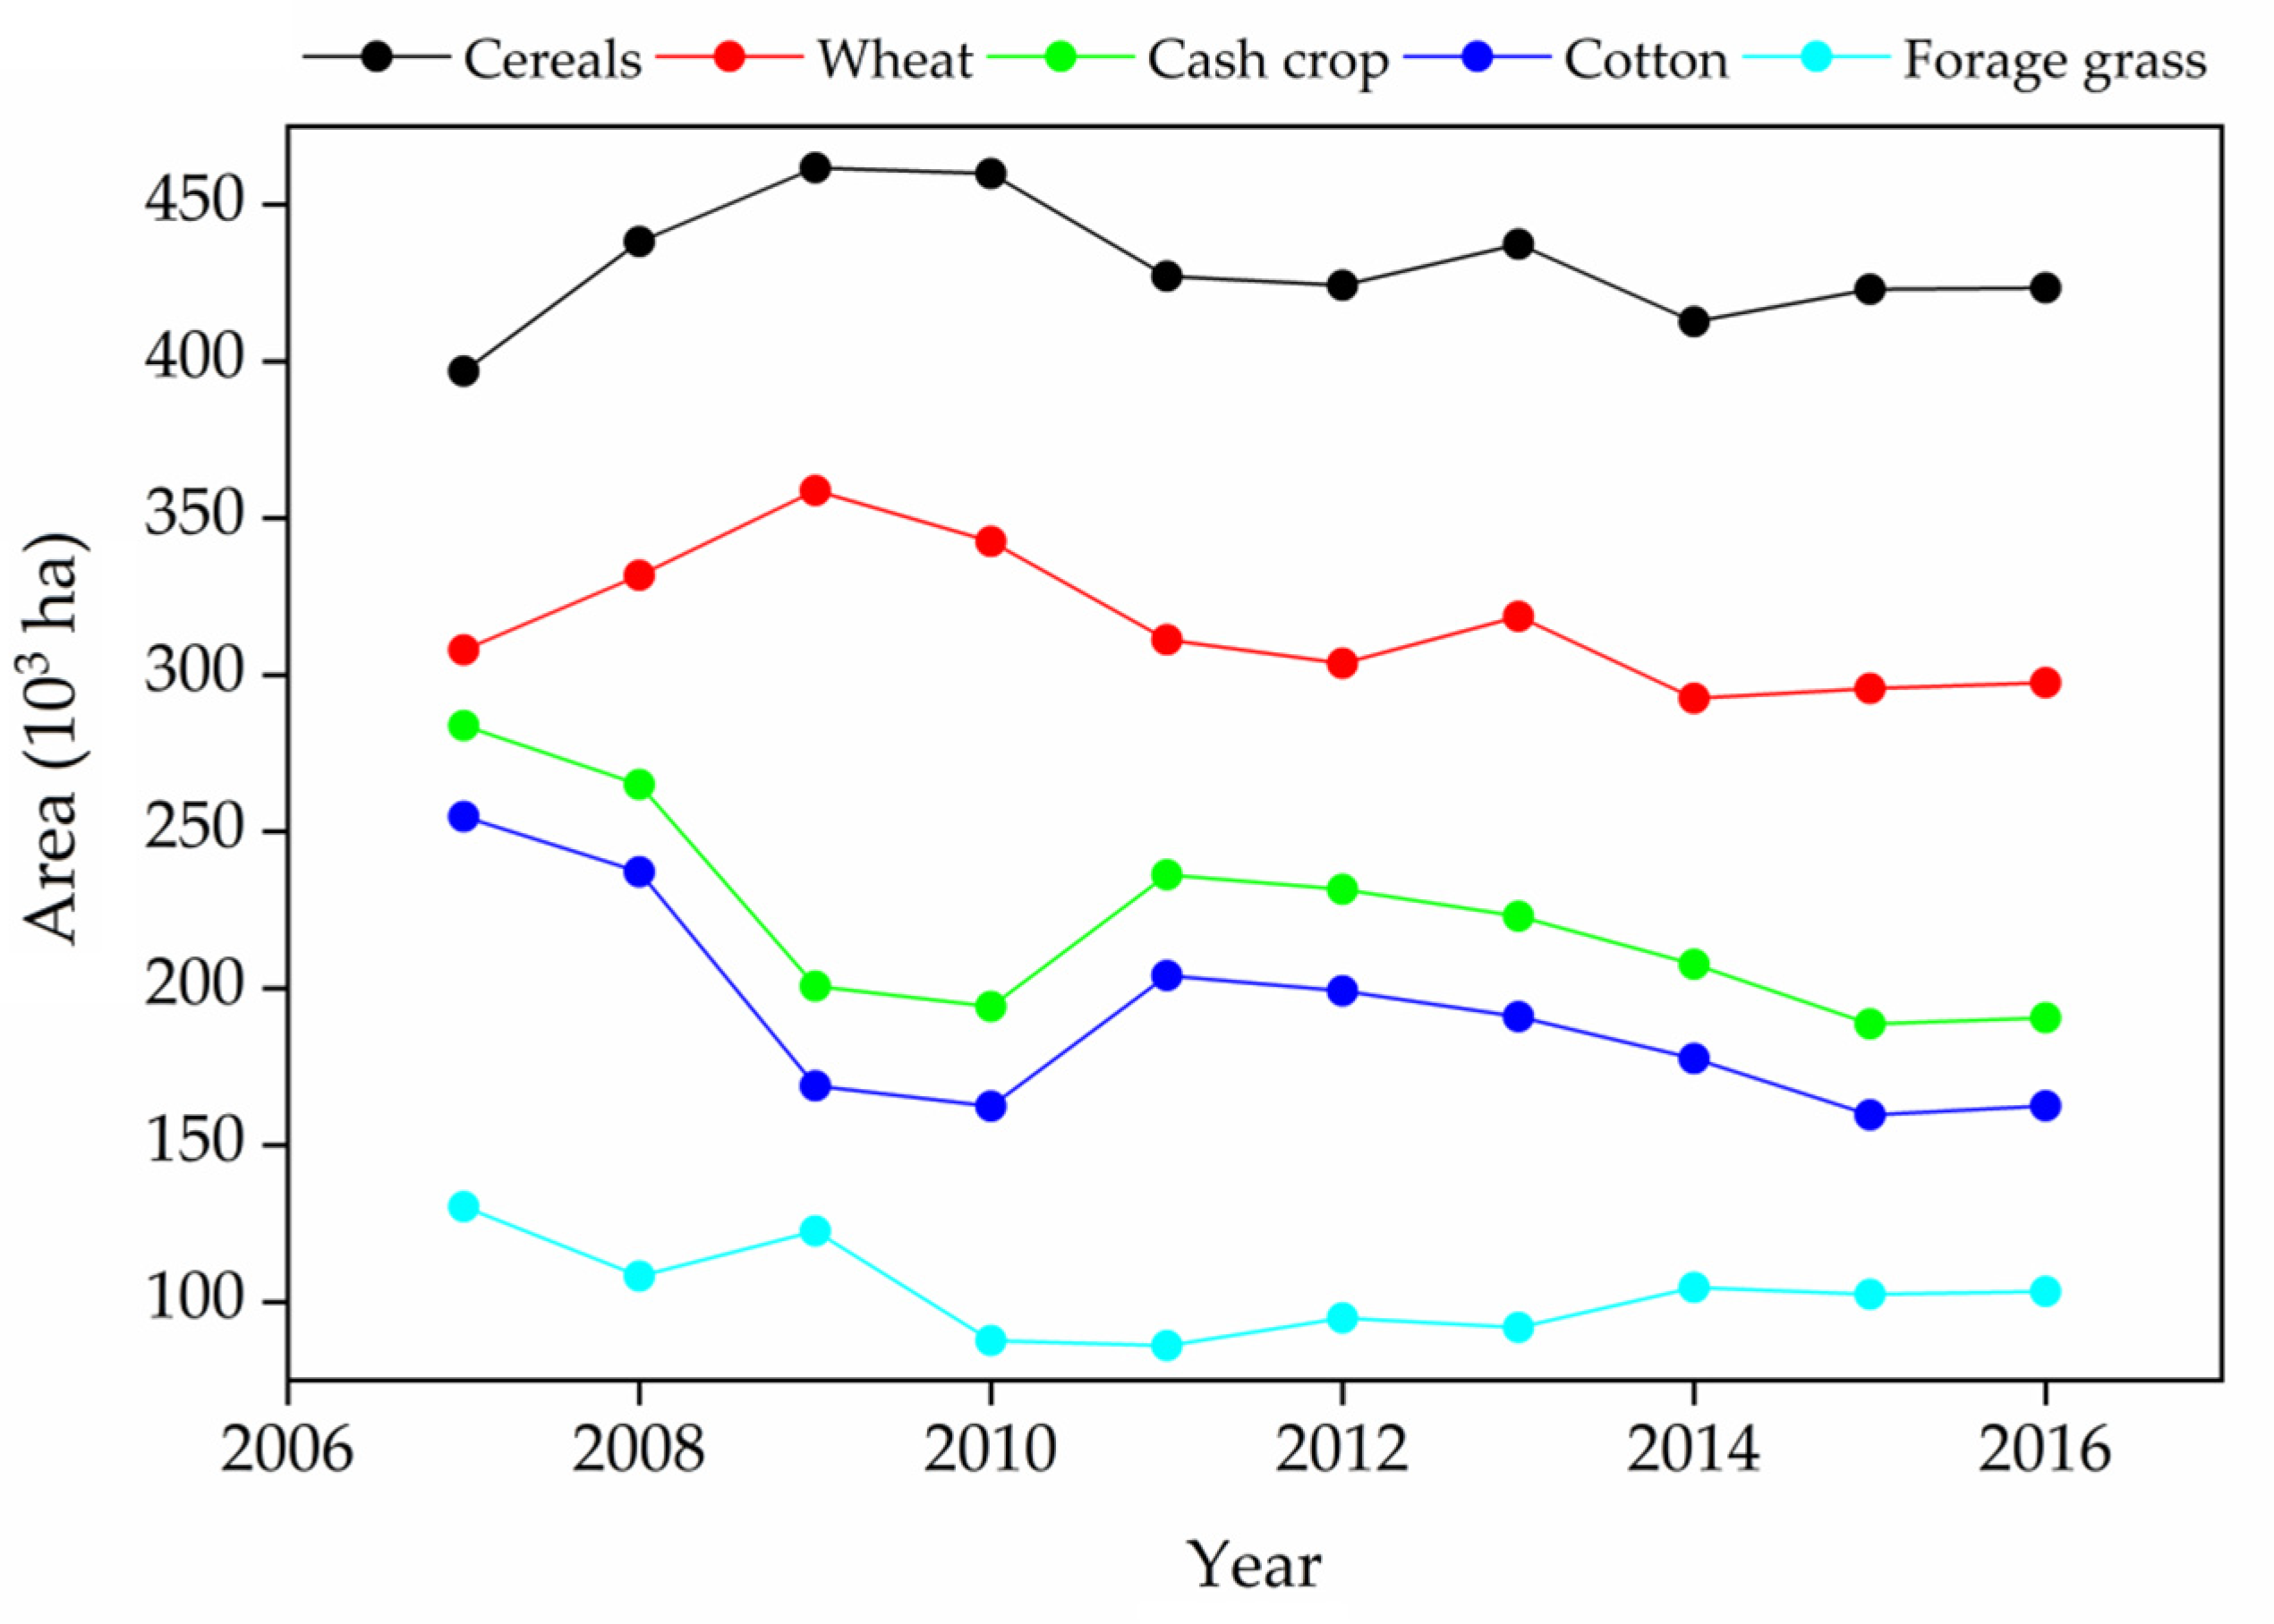
4.5. Land Use Changes over Kofarnihon River Basin
5. Discussion
6. Conclusions
- (1)
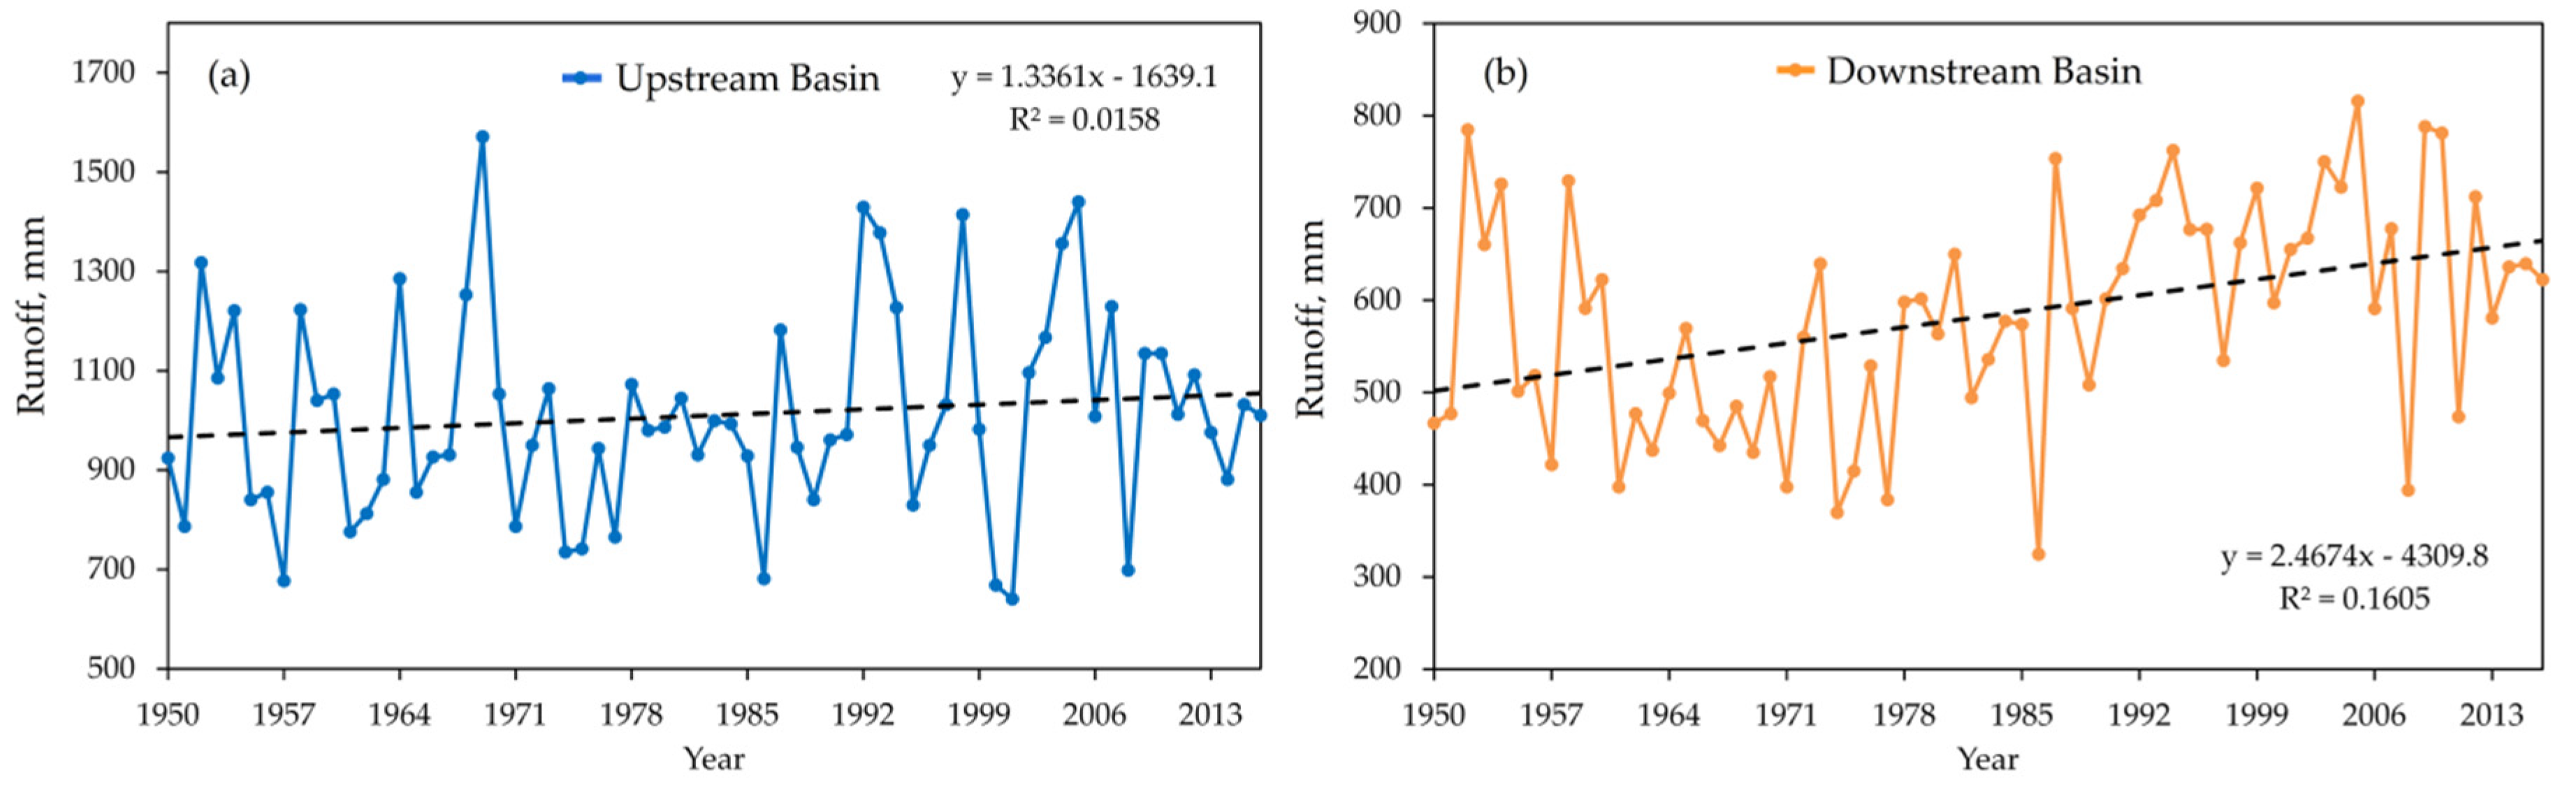
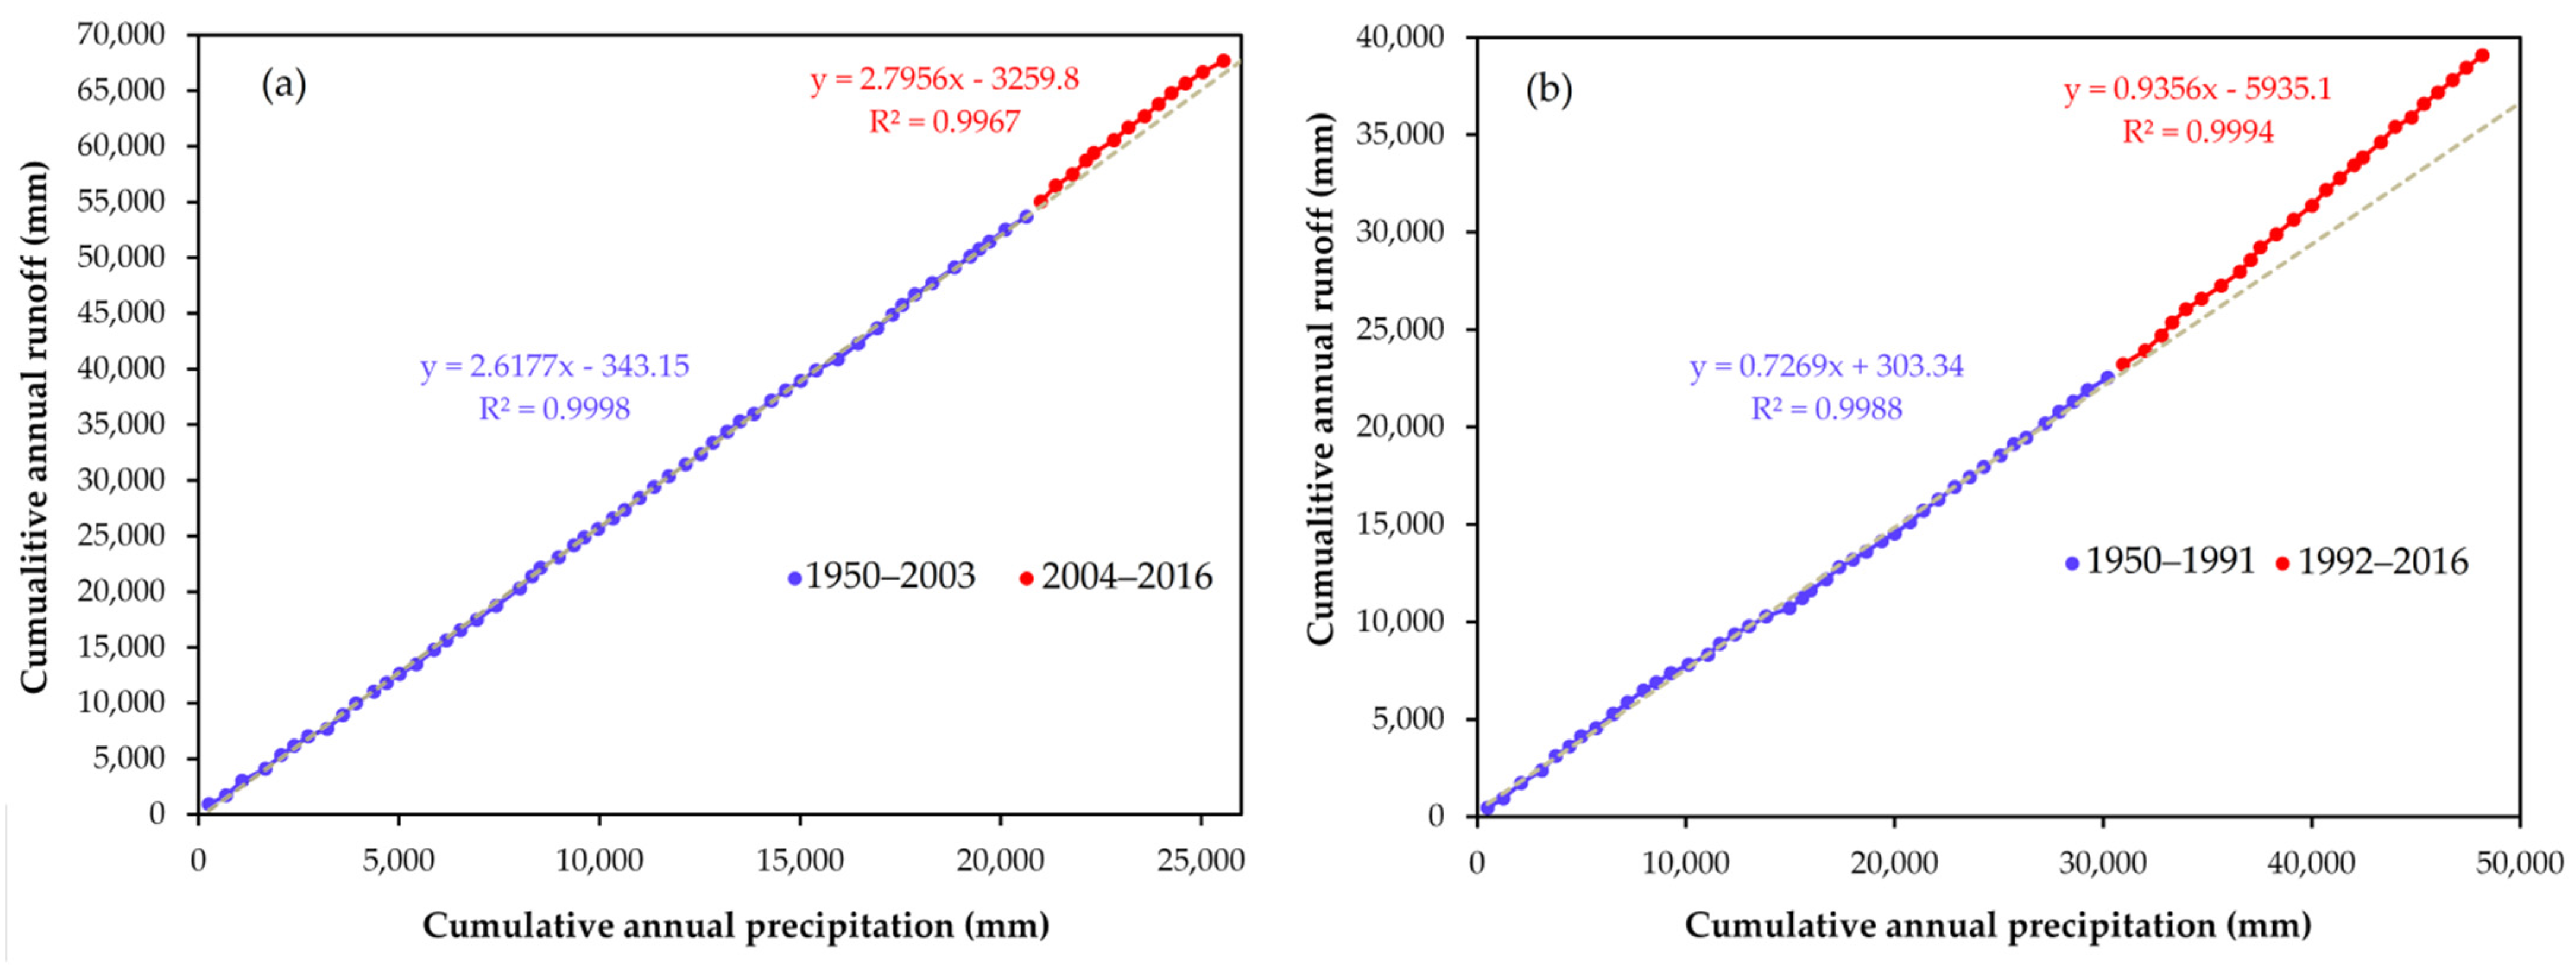
- The result of trend analysis showed an increasing trend in annual temperature at a rate of 0.0108 °C/year in the upstream region and a rate of 0.023 °C/year in the downstream region during the 1950–2016. The trend of annual potential evapotranspiration increased at a rate of 0.3899 mm/year and 0.4142 mm/year in the upstream and downstream. The annual runoff showed an increasing trend of about 2.4574 mm/year and 1.3361 in the upstream and downstream of the catchment. We revealed a statistically significant increasing trend in the annual runoff, potential evapotranspiration, and temperature over 1950–2016 in the KRB. Annul precipitation demonstrated slightly a decreasing trend in both the upstream and downstream at a rate of −0.2134 mm/year and −0.0124 mm/year; however, the trend decreased (not statistically significant). The change point for the annual mean temperature occurred around 1996 and 1976, for precipitation in 1969, and potential evapotranspiration in 1998 over 1950–2016 in the upstream and downstream areas. The runoff change point in the upstream region was detected in 1986 by Pettitt’s test and in 2004 by the double cumulative curve method and in the downstream region, both approaches showed the change point in 1991.
- (2)
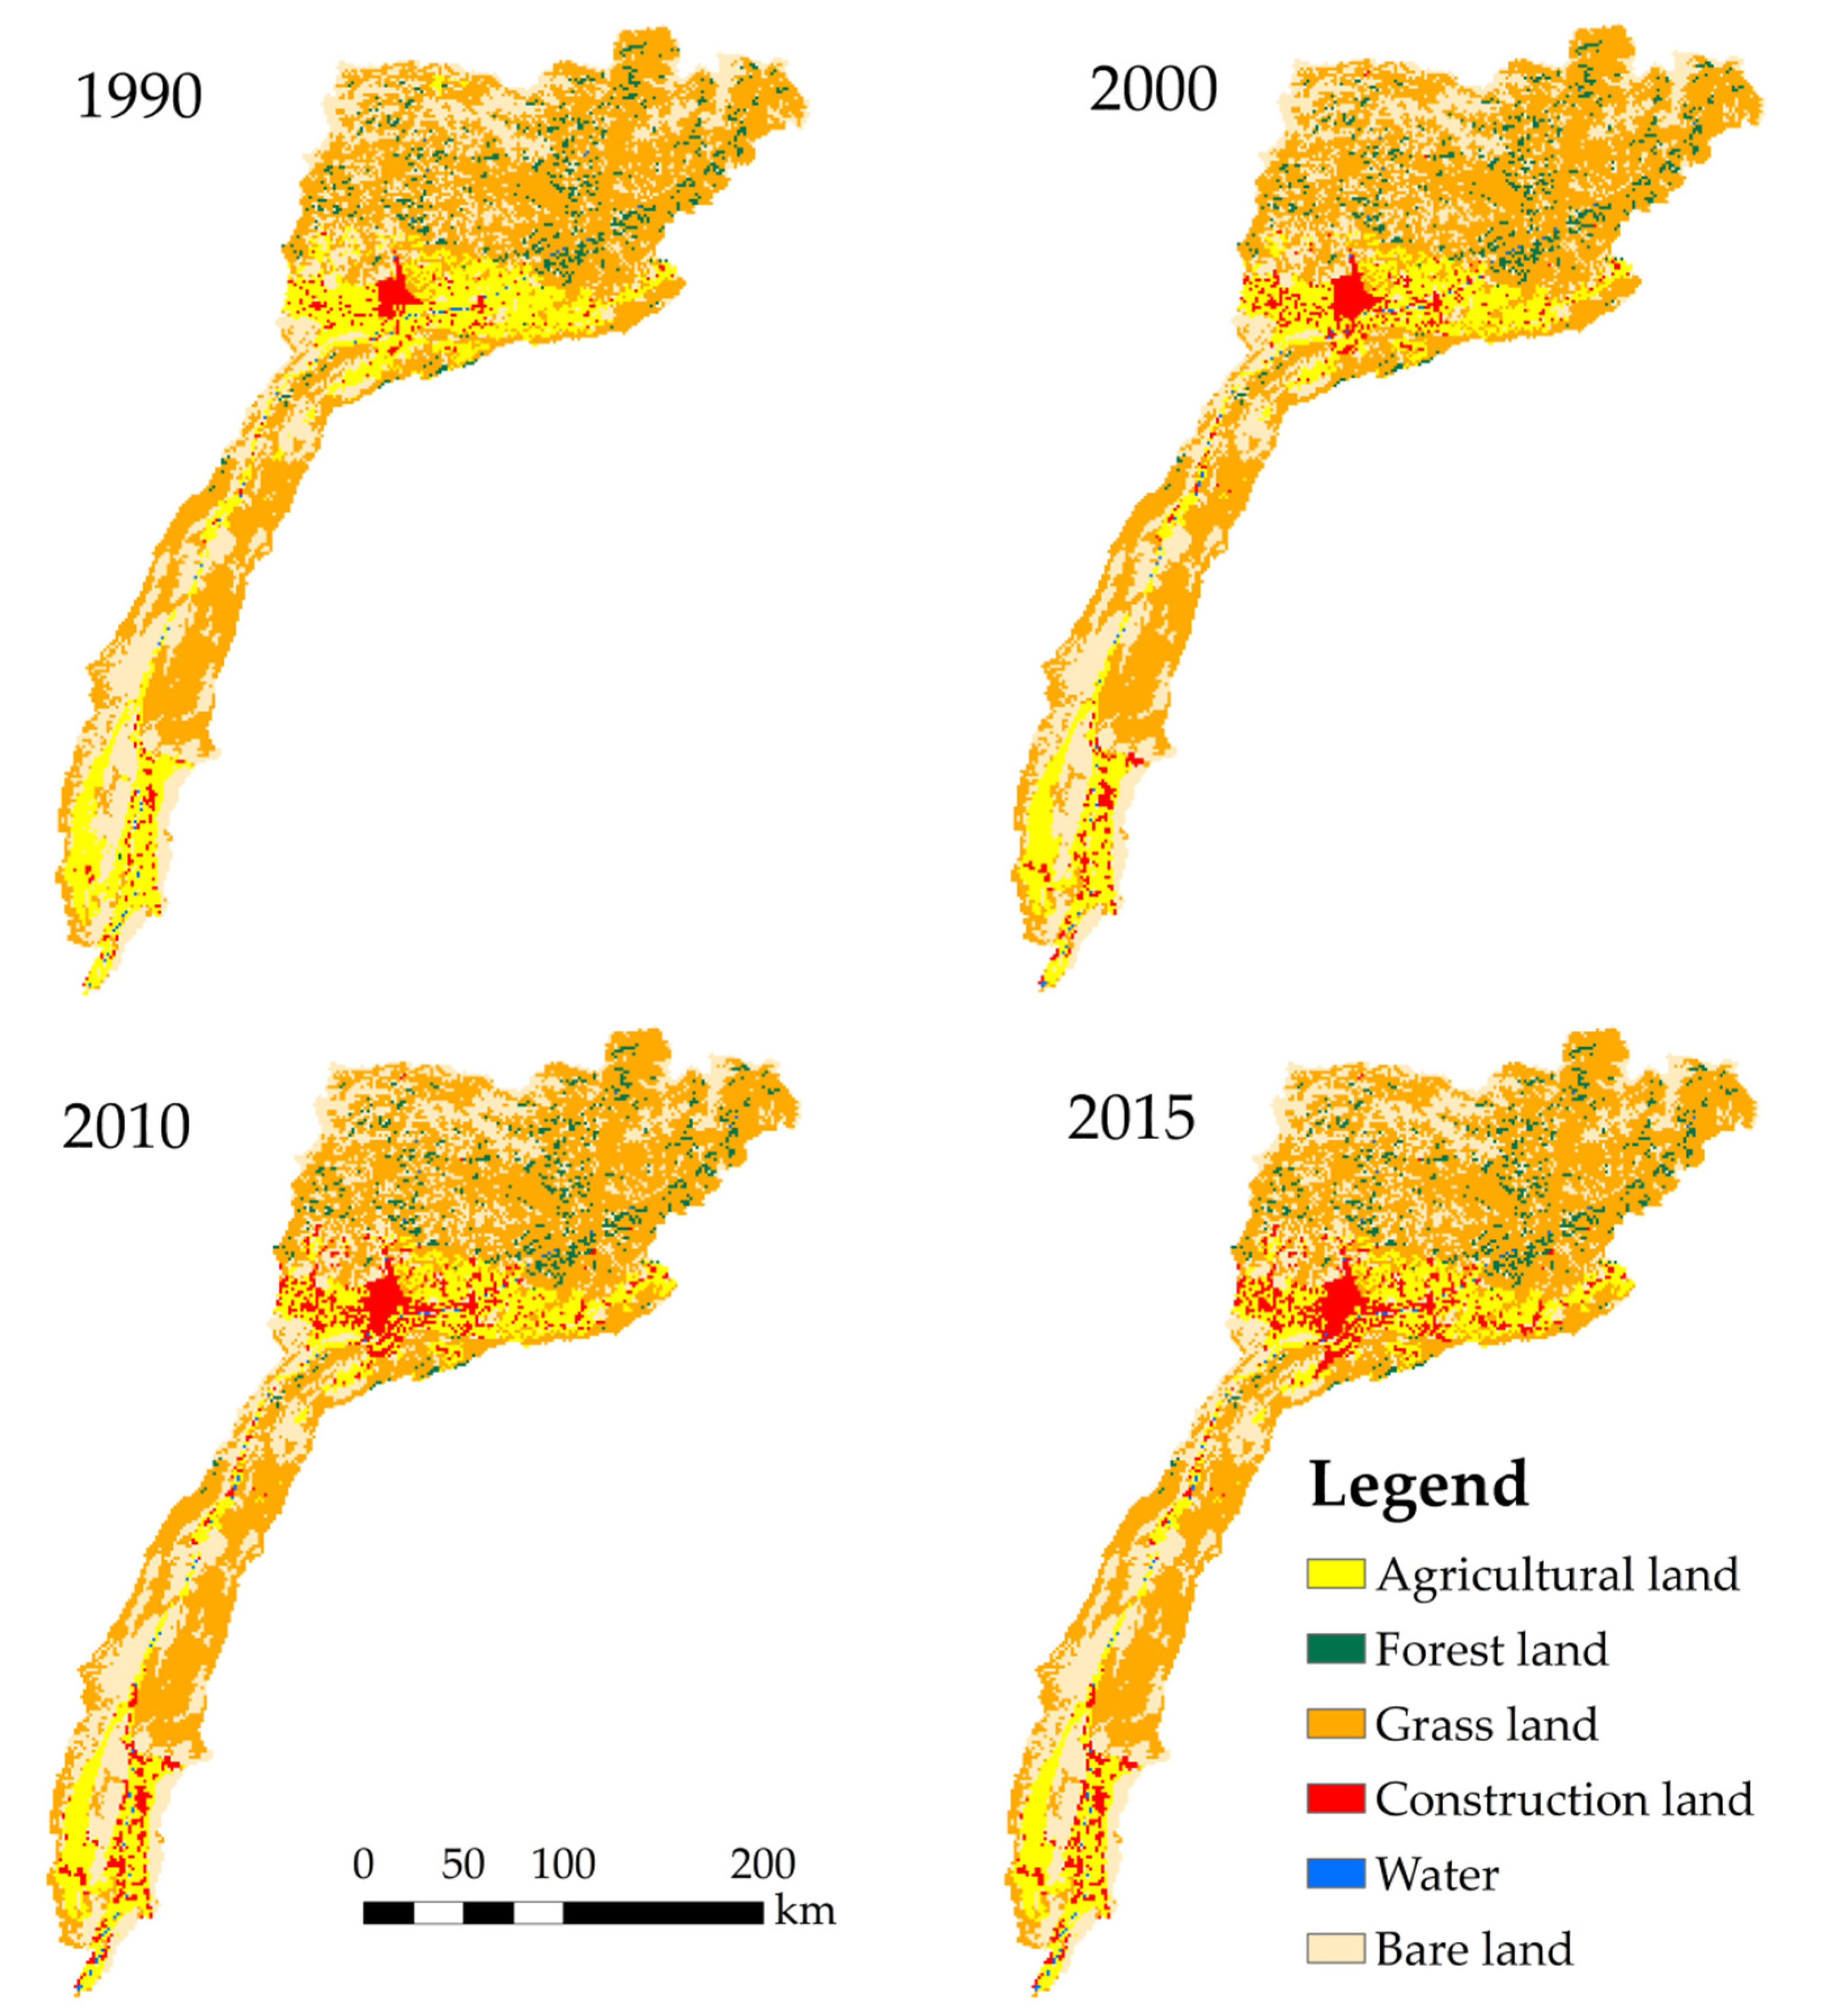
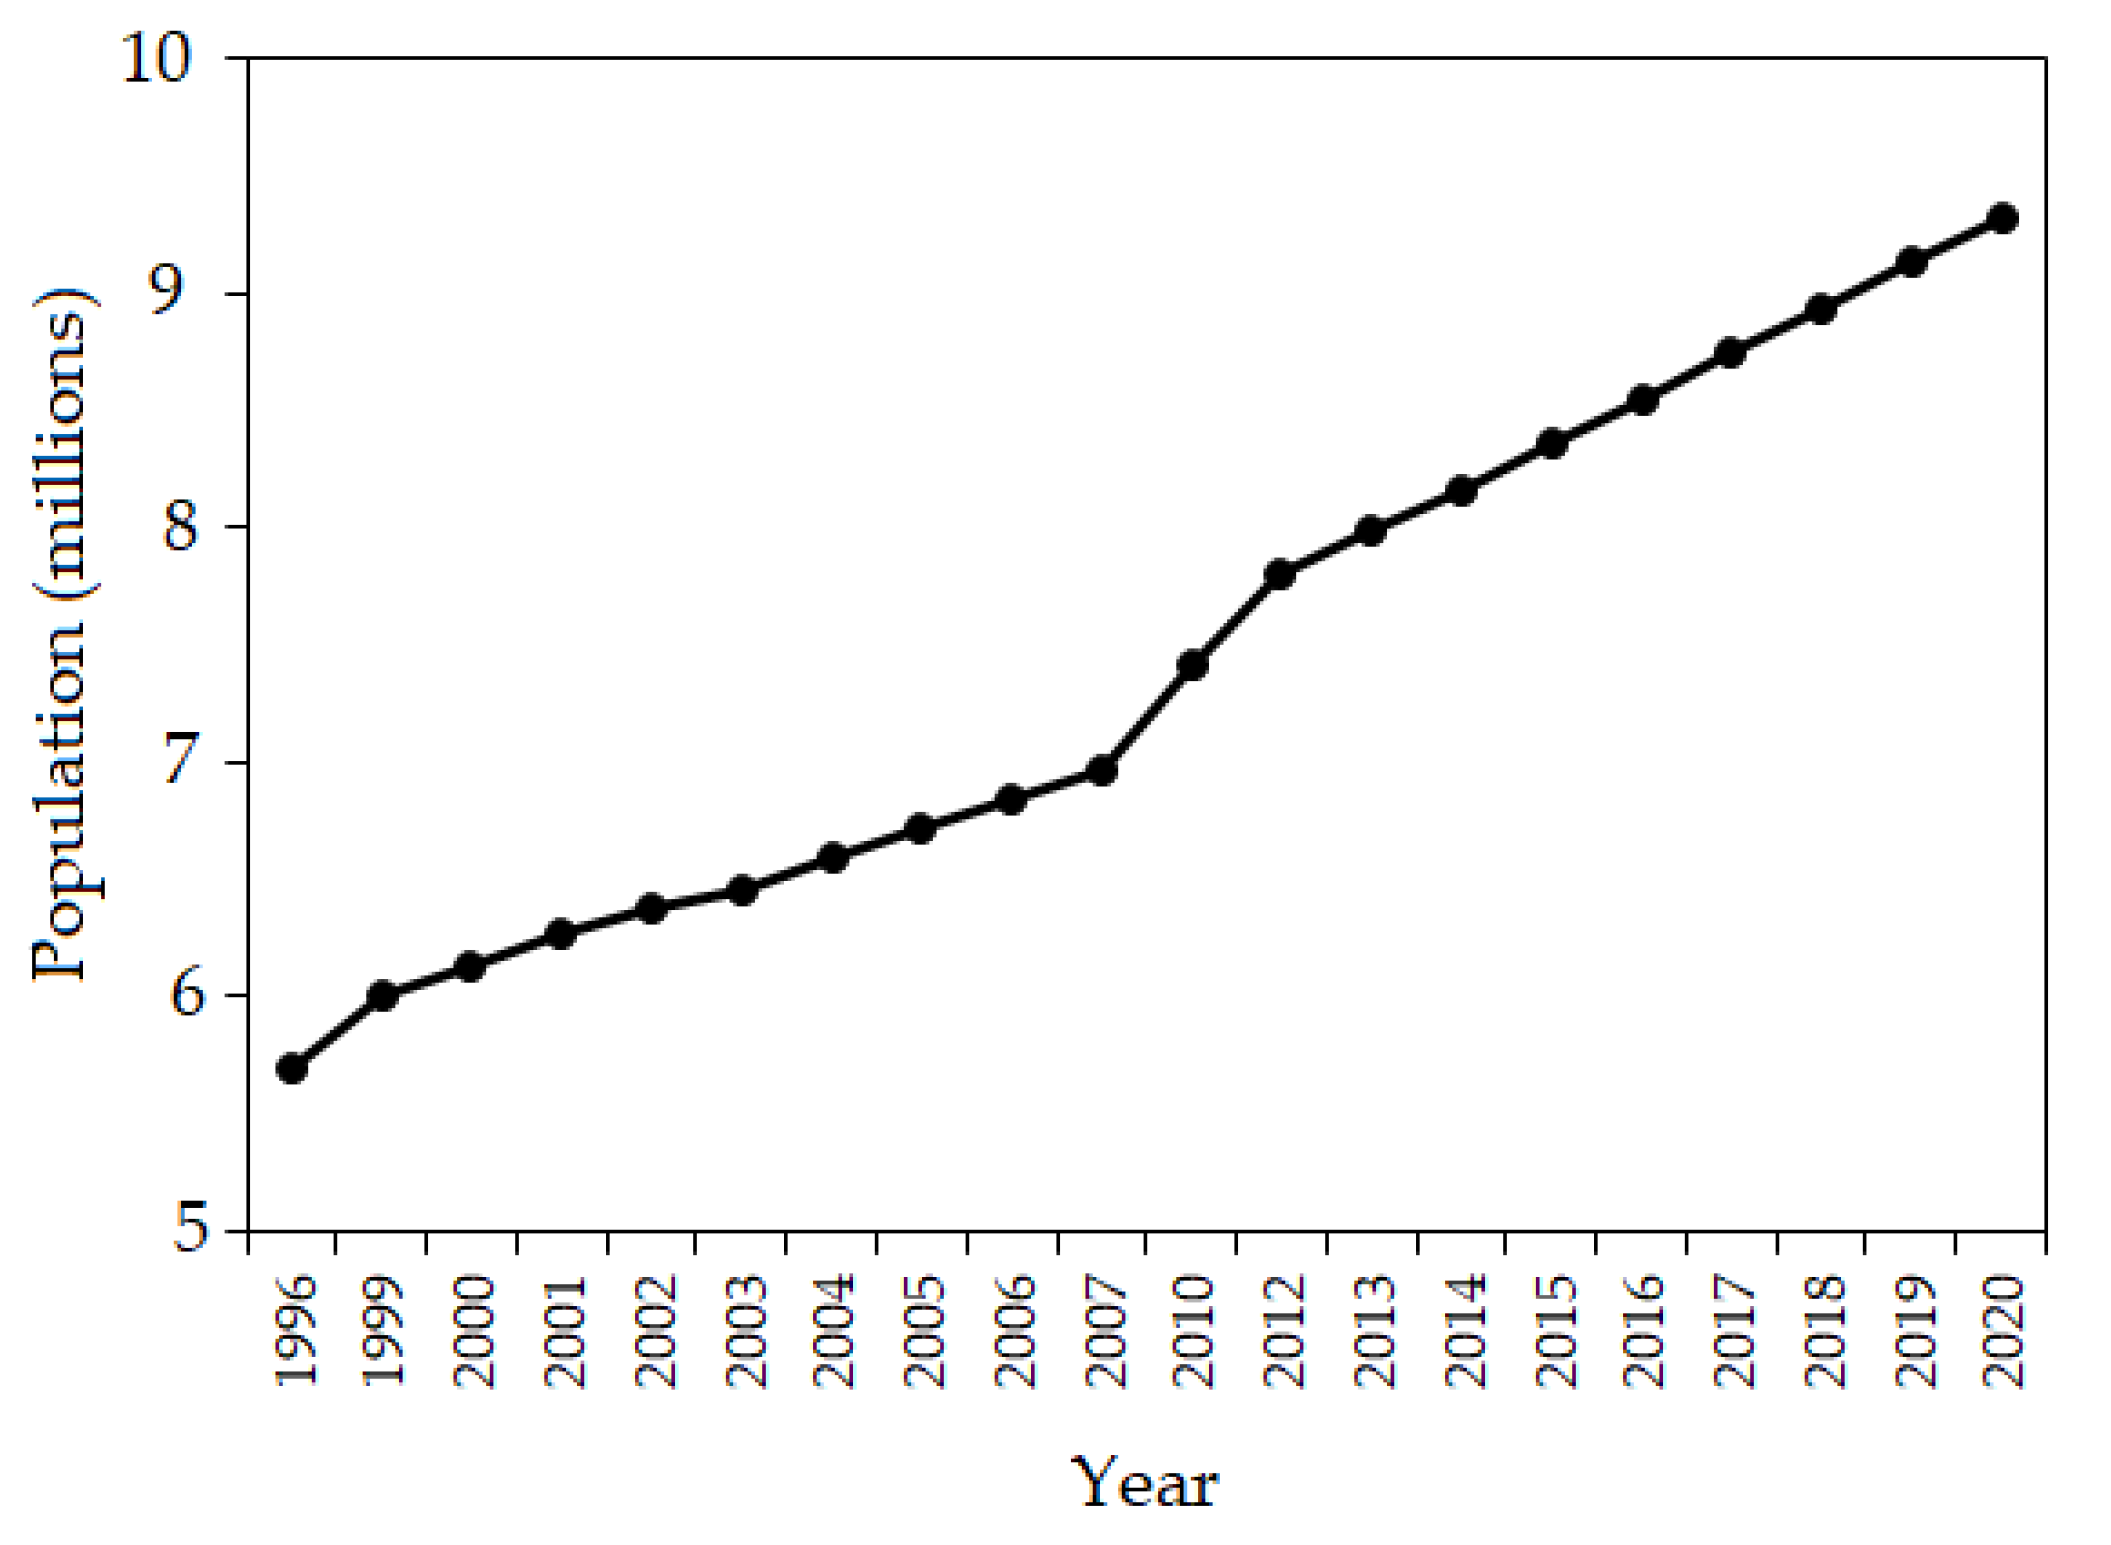
- The area of the construction land or residential land in 1990 was 248.63 km2 and increased to 685.45 km2 in 2015. The area of agricultural land in 1990 was 1900.11 km2, which decreased to 1527.16 km2 in 2015. These discrepancies show that land use in the middle and downstream areas changed from agriculture to residential due to the growing population in the Kofarnihon River Basin in Central Asia.
- (3)
- The result of the climate elasticity method showed that the effect of climate change on runoff variation in the post impacted period (1987–2016) is 98.64 mm (87.96%) in the upstream and −11.09 mm (7.53%) in the downstream. In the post impacted period, the change in runoff caused by anthropogenic activities is −13.51 (12.04%) in the upstream and 136.22 mm (92.47%) in the downstream. Our result showed that among all sub-periods, the most significant impact of climate change 285.60 mm (86.58%) occurred between 2002 and 2006 in the upstream and 82.87 mm (49.66%) from 1992 to 1996 in the downstream areas. The most significant impact of human activities in the upstream region is 217.70 mm (59.55%) between 2007 and 2011, and in the downstream region is 120.42 mm (84.11%) between 1997 and 2001. In this study, the impact of anthropogenic activities was a dominant factor in the runoff changes in the downstream region, and in the upstream region, the dominant factor was climate change, while the upstream region was less exposed to human activities due to the mountainous area. Climate change influences on runoff variations in the upstream were greater than in the downstream of the catchment. The continuously increasing air temperature might have induced rapid snowmelt, which caused an increase in high and median runoff in the catchment.
Author Contributions
Funding
Data Availability Statement
Acknowledgments
Conflicts of Interest
Appendix A. Software Package, “Modifiedmk”

References
- Jiang, Z.; Li, W.; Xu, J.; Li, L. Extreme precipitation indices over China in CMIP5 models. Part I: Model evaluation. J. Clim. 2015, 28, 8603–8619. [Google Scholar] [CrossRef]
- Piao, S.; Ciais, P.; Huang, Y.; Shen, Z.; Peng, S.; Li, J.; Zhou, L.; Liu, H.; Ma, Y.; Ding, Y. The impacts of climate change on water resources and agriculture in China. Nature 2010, 467, 43–51. [Google Scholar] [CrossRef] [PubMed]
- Zhao, G.; Tian, P.; Mu, X.; Jiao, J.; Wang, F.; Gao, P. Quantifying the impact of climate variability and human activities on streamflow in the middle reaches of the Yellow River basin, China. J. Hydrol. 2014, 519, 387–398. [Google Scholar] [CrossRef]
- Zhang, Y.; Guan, D.; Jin, C.; Wang, A.; Wu, J.; Yuan, F. Analysis of impacts of climate variability and human activity on streamflow for a river basin in northeast China. J. Hydrol. 2011, 410, 239–247. [Google Scholar] [CrossRef]
- Milly, P.C.; Dunne, K.A.; Vecchia, A.V. Global pattern of trends in streamflow and water availability in a changing climate. Nature 2005, 438, 347–350. [Google Scholar] [CrossRef] [PubMed]
- Xue, L.; Yang, F.; Yang, C.; Chen, X.; Zhang, L.; Chi, Y.; Yang, G. Identification of potential impacts of climate change and anthropogenic activities on streamflow alterations in the Tarim River Basin, China. Sci. Rep. 2017, 7, 1–12. [Google Scholar] [CrossRef]
- Wada, Y.; Bierkens, M.F.; Roo, A.d.; Dirmeyer, P.A.; Famiglietti, J.S.; Hanasaki, N.; Konar, M.; Liu, J.; Müller Schmied, H.; Oki, T. Human–water interface in hydrological modelling: Current status and future directions. Hydrol. Earth Syst. Sci. 2017, 21, 4169–4193. [Google Scholar] [CrossRef] [Green Version]
- Ranasinghe, R.; Wu, C.S.; Conallin, J.; Duong, T.M.; Anthony, E.J. Disentangling the relative impacts of climate change and human activities on fluvial sediment supply to the coast by the world’s large rivers: Pearl River Basin, China. Sci. Rep. 2019, 9, 1–10. [Google Scholar]
- Hijioka, Y.; Lin, E.; Pereira, C.; Corlett, R.; Cui, X.; Insarov, G.; Lasco, R.; Lindgren, E.; Surjan, A. Asia. In Climate Change 2014: Impacts, Adaptation, and Vulnerability. Part B: Regional Aspects. Contribution of Working Group II to the Fifth Assessment Report of the Intergovernmental Panel of Climate Change; Barros, V.R., Field, C.B., Dokken, D.J., Mastrandrea, M.D., Mach, K.J., Bilir, T.E., Chatterjee, M., Ebi, K.L., Estrada, Y.O., Genova, R.C., et al., Eds.; Cambridge University Press: Cambridge, UK; New York, NY, USA, 2014; pp. 1327–1370. [Google Scholar]
- Punkari, M.; Droogers, P.; Immerzeel, W.; Korhonen, N.; Lutz, A.; Venäläinen, A. Climate change and sustainable water management in Central Asia. Asian Dev. Bank 2014, 5, 1–27. [Google Scholar]
- Tarboton, D. Rainfall-runoff processes. Utah State Univ. 2003, 1, 1–159. [Google Scholar]
- Wang, D.; Yu, X.; Jia, G.; Wang, H. Sensitivity analysis of runoff to climate variability and land-use changes in the Haihe Basin mountainous area of north China. Agric. Ecosyst. Environ. 2019, 269, 193–203. [Google Scholar] [CrossRef]
- Alizadeh, B.; Limon, R.A.; Seo, D.-J.; Lee, H.; Brown, J. Multiscale post-processor for ensemble streamflow prediction for short-to-long ranges. J. Hydrometeorol. 2019, 1, 1–125. [Google Scholar]
- Dong, L.; Zhang, G.; Xu, Y. Effects of climate change and human activities on runoff in the Nenjiang River Basin, Northeast China. Hydrol. Earth Syst. Sci. Discuss. 2012, 9, 11521–11549. [Google Scholar]
- Oki, T.; Kanae, S. Global hydrological cycles and world water resources. Science 2006, 313, 1068–1072. [Google Scholar] [CrossRef] [PubMed] [Green Version]
- Prestele, R.; Arneth, A.; Bondeau, A.; de Noblet-Ducoudré, N.; Pugh, T.A.; Sitch, S.; Stehfest, E.; Verburg, P.H. Current challenges of implementing anthropogenic land-use and land-cover change in models contributing to climate change assessments. Earth Syst. Dyn. 2017. [Google Scholar] [CrossRef] [Green Version]
- Pachauri, R.K.; Allen, M.R.; Barros, V.R.; Broome, J.; Cramer, W.; Christ, R.; Church, J.; Clarke, L.; Dahe, Q.; Dasgupta, P. Climate Change 2014: Synthesis Report. Contribution of Working Groups I, II and III to the Fifth Assessment Report of the Intergovernmental Panel on Climate Change; IPCC: Geneva, Switzerland, 2014. [Google Scholar]
- Chang, J.; Wang, Y.; Istanbulluoglu, E.; Bai, T.; Huang, Q.; Yang, D.; Huang, S. Impact of climate change and human activities on runoff in the Weihe River Basin, China. Quat. Int. 2015, 380, 169–179. [Google Scholar] [CrossRef]
- Zhou, Y.; Lai, C.; Wang, Z.; Chen, X.; Zeng, Z.; Chen, J.; Bai, X. Quantitative evaluation of the impact of climate change and human activity on runoff change in the Dongjiang River Basin, China. Water 2018, 10, 571. [Google Scholar] [CrossRef] [Green Version]
- Ma, Z.; Kang, S.; Zhang, L.; Tong, L.; Su, X. Analysis of impacts of climate variability and human activity on streamflow for a river basin in arid region of northwest China. J. Hydrol. 2008, 352, 239–249. [Google Scholar] [CrossRef]
- Li, Y.; He, D.; Li, X.; Zhang, Y.; Yang, L. Contributions of climate variability and human activities to runoff changes in the upper catchment of the Red River Basin, China. Water 2016, 8, 414. [Google Scholar] [CrossRef] [Green Version]
- Li, Y.; Chang, J.; Wang, Y.; Jin, W.; Guo, A. Spatiotemporal impacts of climate, land cover change and direct human activities on runoff variations in the Wei River Basin, China. Water 2016, 8, 220. [Google Scholar] [CrossRef] [Green Version]
- Guo, Q.; Yang, Y.; Xiong, X. Using hydrologic simulation to identify contributions of climate change and human activity to runoff changes in the Kuye river basin, China. Environ. Earth Sci. 2016, 75, 417. [Google Scholar] [CrossRef]
- Zhao, C.; Liu, C.; Dai, X.; Liu, T.; Duan, Z.; Liu, L.; Mitrovic, S.M. Separation of the impacts of climate change and human activity on runoff variations. Hydrol. Sci. J. 2015, 60, 234–246. [Google Scholar] [CrossRef]
- Wang, S.; Wang, Y.; Ran, L.; Su, T. Climatic and anthropogenic impacts on runoff changes in the Songhua River basin over the last 56 years (1955–2010), Northeastern China. Catena 2015, 127, 258–269. [Google Scholar] [CrossRef]
- Yan, X.; Bao, Z.; Zhang, J.; Wang, G.; He, R.; Liu, C. Quantifying contributions of climate change and local human activities to runoff decline in the upper reaches of the Luanhe River basin. J. Hydro. Environ. Res. 2020, 28, 67–74. [Google Scholar] [CrossRef]
- Li, B.; Yu, Z.; Liang, Z.; Song, K.; Li, H.; Wang, Y.; Zhang, W.; Acharya, K. Effects of climate variations and human activities on runoff in the Zoige alpine wetland in the eastern edge of the Tibetan Plateau. J. Hydrol. Eng. 2014, 19, 1026–1035. [Google Scholar] [CrossRef]
- Bu, J.; Lu, C.; Niu, J.; Gao, Y. Attribution of runoff reduction in the Juma River basin to climate variation, direct human intervention, and land use change. Water 2018, 10, 1775. [Google Scholar] [CrossRef] [Green Version]
- Lee, S.; Kim, S.U. Quantification of hydrological responses due to climate change and human activities over various time scales in South Korea. Water 2017, 9, 34. [Google Scholar] [CrossRef] [Green Version]
- Rakhimova, M.; Liu, T.; Bissenbayeva, S.; Mukanov, Y.; Gafforov, K.S.; Bekpergenova, Z.; Gulakhmadov, A. Assessment of the impacts of climate change and human activities on runoff using climate elasticity method and General Circulation Model (GCM) in the Buqtyrma River Basin, Kazakhstan. Sustainability 2020, 12, 4968. [Google Scholar] [CrossRef]
- Bissenbayeva, S.; Abuduwaili, J.; Shokparova, D.; Saparova, A. Variation in runoff of the Arys river and keles river watersheds (Kazakhstan), as influenced by climate variation and human activity. Sustainability 2019, 11, 4788. [Google Scholar] [CrossRef] [Green Version]
- Gulakhmadov, A.; Chen, X.; Gulahmadov, N.; Liu, T.; Anjum, M.N.; Rizwan, M. Simulation of the potential impacts of projected climate change on streamflow in the Vakhsh river basin in central Asia under CMIP5 RCP scenarios. Water 2020, 12, 1426. [Google Scholar] [CrossRef]
- Guo, L.-P.; Mu, X.-M.; Hu, J.-M.; Gao, P.; Zhang, Y.-F.; Liao, K.-T.; Bai, H.; Chen, X.-L.; Song, Y.-J.; Jin, N. Assessing impacts of climate change and human activities on streamflow and sediment discharge in the Ganjiang River basin (1964–2013). Water 2019, 11, 1679. [Google Scholar] [CrossRef] [Green Version]
- Sharma, P.J.; Patel, P.; Jothiprakash, V. Impact of rainfall variability and anthropogenic activities on streamflow changes and water stress conditions across Tapi Basin in India. Sci. Total Environ. 2019, 687, 885–897. [Google Scholar] [CrossRef] [PubMed]
- Li, F.; Zhang, G.; Xu, Y.J. Separating the impacts of climate variation and human activities on runoff in the Songhua River Basin, Northeast China. Water 2014, 6, 3320–3338. [Google Scholar] [CrossRef] [Green Version]
- Chen, Z.; Chen, Y.; Li, B. Quantifying the effects of climate variability and human activities on runoff for Kaidu River Basin in arid region of northwest China. Theor. Appl. Climatol. 2013, 111, 537–545. [Google Scholar] [CrossRef]
- Guo, Y.; Li, Z.; Amo-Boateng, M.; Deng, P.; Huang, P. Quantitative assessment of the impact of climate variability and human activities on runoff changes for the upper reaches of Weihe River. Stoch. Environ. Res. Risk Assess. 2014, 28, 333–346. [Google Scholar] [CrossRef]
- Gao, P.; Mu, X.-M.; Wang, F.; Li, R. Changes in streamflow and sediment discharge and the response to human activities in the middle reaches of the Yellow River. Hydrol. Earth Syst. Sci. 2011, 15, 1. [Google Scholar] [CrossRef] [Green Version]
- Donohue, R.J.; Roderick, M.L.; McVicar, T.R. Assessing the differences in sensitivities of runoff to changes in climatic conditions across a large basin. J. Hydrol. 2011, 406, 234–244. [Google Scholar] [CrossRef]
- Bao, Z.; Zhang, J.; Wang, G.; Fu, G.; He, R.; Yan, X.; Jin, J.; Liu, Y.; Zhang, A. Attribution for decreasing streamflow of the Haihe River basin, northern China: Climate variability or human activities? J. Hydrol. 2012, 460, 117–129. [Google Scholar] [CrossRef]
- Ahn, K.-H.; Merwade, V. Quantifying the relative impact of climate and human activities on streamflow. J. Hydrol. 2014, 515, 257–266. [Google Scholar] [CrossRef]
- Mango, L.M.; Melesse, A.M.; McClain, M.E.; Gann, D.; Setegen, S. Land use and climate change impacts on the hydrology of the upper Mara River Basin, Kenya: Results of a modeling study to support better resource management. Hydrol. Earth Syst. Sci. 2010, 15, 2245–2258. [Google Scholar] [CrossRef] [Green Version]
- Bourgault, M.; Larocque, M.; Roy, M. Simulation of aquifer-peatland-river interactions under climate change. Hydrol. Res. 2014, 45, 425–440. [Google Scholar] [CrossRef]
- Xu, X.; Yang, H.; Yang, D.; Ma, H. Assessing the impacts of climate variability and human activities on annual runoff in the Luan River basin, China. Hydrol. Res. 2013, 44, 940–952. [Google Scholar] [CrossRef] [Green Version]
- Schilling, K.E.; Chan, K.-S.; Liu, H.; Zhang, Y.-K. Quantifying the effect of land use land cover change on increasing discharge in the Upper Mississippi River. J. Hydrol. 2010, 387, 343–345. [Google Scholar] [CrossRef]
- Dvory, N.Z.; Ronen, A.; Livshitz, Y.; Adar, E.; Kuznetsov, M.; Yakirevich, A. Quantification of groundwater recharge from an ephemeral stream into a mountainous karst aquifer. Water 2018, 10, 79. [Google Scholar] [CrossRef] [Green Version]
- Teng, F.; Huang, W.; Ginis, I. Hydrological modeling of storm runoff and snowmelt in Taunton River Basin by applications of HEC-HMS and PRMS models. Nat. Hazards 2018, 91, 179–199. [Google Scholar] [CrossRef]
- Chiew, F.H.; Peel, M.C.; McMahon, T.A.; Siriwardena, L. Precipitation elasticity of streamflow in catchments across the world. IAHS Publ. 2006, 308, 256. [Google Scholar]
- Fu, G.; Charles, S.P.; Chiew, F.H.S. A two-parameter climate elasticity of streamflow index to assess climate change effects on annual streamflow. Water Resour. Res. 2007, 43. [Google Scholar] [CrossRef]
- Arora, V.K. The use of the aridity index to assess climate change effect on annual runoff. J. Hydrol. 2002, 265, 164–177. [Google Scholar] [CrossRef]
- Wang, W.; Zou, S.; Shao, Q.; Xing, W.; Chen, X.; Jiao, X.; Luo, Y.; Yong, B.; Yu, Z. The analytical derivation of multiple elasticities of runoff to climate change and catchment characteristics alteration. J. Hydrol. 2016, 541, 1042–1056. [Google Scholar] [CrossRef]
- Zhang, L.; Dawes, W.; Walker, G. Response of mean annual evapotranspiration to vegetation changes at catchment scale. Water Resour. Res. 2001, 37, 701–708. [Google Scholar] [CrossRef]
- Zhang, Y.; Su, F.; Hao, Z.; Xu, C.; Yu, Z.; Wang, L.; Tong, K. Impact of projected climate change on the hydrology in the headwaters of the Yellow River basin. Hydrol. Process. 2015, 29, 4379–4397. [Google Scholar] [CrossRef]
- Williams, M.; Konovalov, V. Central Asia Temperature and Precipitation Data, 1879–2003; Version 1; National Snow and Ice Data Center: Boulder, CO, USA, 2008. [Google Scholar] [CrossRef]
- Aalto, J.; Kämäräinen, M.; Shodmonov, M.; Rajabov, N.; Venäläinen, A. Features of Tajikistan’s past and future climate. Int. J. Climatol. 2017, 37, 4949–4961. [Google Scholar] [CrossRef]
- Dukhovniy, V.A.Z.; Ziganshina, D.R.; Sorokin, A.G.; Sorokin, D.A.; Stulina, G.V.; Solodky, G.F.; Muminov, S.H.; Makhramov, M.Y.T.; Tilyavova, G.K.; Nazariy, A.M.; et al. The Future of the Amu Darya River Basin in the Condition of Changing Climate. Interstate Commission for Water Coordination in Central Asia. Available online: www.cawater-infor.net/project/peer-amudarya/ (accessed on 18 May 2018).
- Shultz, V.L. Peки Cpeднeй Aзии. Чacти I и II; Gidrometeoizdat: Saint Petersburg, Russia, 1965; Available online: http://www.cawater-info.net/library/rus/hist/shultz2/pages/002.htm (accessed on 21 December 2019). (In Russian)
- Catalog of glaciers of the USSR. Cpeдняя Aзия. Bыпycк 3. Aмyдapья. Чacть 05. Бacceйн peки Kaφиpнигaнa; Gidrometeoizdat: Saint Petersburg, Russia, 1980; Available online: https://www.twirpx.com/file/1519456/ (accessed on 10 January 2020). (In Russian)
- Zhang, Y.; You, Q.; Chen, C.; Ge, J. Impacts of climate change on streamflows under RCP scenarios: A case study in Xin River Basin, China. Atmos. Res. 2016, 178, 521–534. [Google Scholar] [CrossRef]
- Allen, R.G.; Pereira, L.S.; Raes, D.; Smith, M. Crop Evapotranspiration-Guidelines for Computing Crop Water Requirements-FAO Irrigation and Drainage Paper 56; FAO: Rome, Italy, 1998; Volume 300, p. D05109. [Google Scholar]
- Hargreaves, G.H.; Samani, Z.A. Reference crop evapotranspiration from temperature. Appl. Eng. Agric. 1985, 1, 96–99. [Google Scholar] [CrossRef]
- Makkink, G.F. Testing the Penman formula by means of lysimeters. J. Inst. Water Eng. 1957, 11, 277–288. [Google Scholar]
- Priestley, C.H.B.; TAYLOR, R.J. On the assessment of surface heat flux and evaporation using large-scale parameters. Mon. Weather Rev. 1972, 100, 81–92. [Google Scholar] [CrossRef]
- Jensen, M.E.; Haise, H.R. Estimating evapotranspiration from solar radiation. J. Irrig. Drain. Div. 1963, 89, 15–41. [Google Scholar] [CrossRef]
- Guo, H.; Bao, A.; Liu, T.; Ndayisaba, F.; Jiang, L.; Kurban, A.; De Maeyer, P. Spatial and temporal characteristics of droughts in Central Asia during 1966–2015. Sci. Total Environ. 2018, 624, 1523–1538. [Google Scholar] [CrossRef]
- Gupta, H.V.; Kling, H.; Yilmaz, K.K.; Martinez, G.F. Decomposition of the mean squared error and NSE performance criteria: Implications for improving hydrological modelling. J. Hydrol. 2009, 377, 80–91. [Google Scholar] [CrossRef] [Green Version]
- Moriasi, D.N.; Arnold, J.G.; Van Liew, M.W.; Bingner, R.L.; Harmel, R.D.; Veith, T.L. Model evaluation guidelines for systematic quantification of accuracy in watershed simulations. Trans. ASABE 2007, 50, 885–900. [Google Scholar] [CrossRef]
- Ren, P.; Li, J.; Feng, P.; Guo, Y.; Ma, Q. Evaluation of multiple satellite precipitation products and their use in hydrological modelling over the Luanhe River basin, China. Water 2018, 10, 677. [Google Scholar] [CrossRef] [Green Version]
- KGE Package ‘hydroGOF’. 2020. Available online: https://cran.r-project.org/web/packages/hydroGOF/hydroGOF.pdf (accessed on 9 September 2020).
- Hamed, K.H. Trend detection in hydrologic data: The Mann–Kendall trend test under the scaling hypothesis. J. Hydrol. 2008, 349, 350–363. [Google Scholar] [CrossRef]
- Mavromatis, T.; Stathis, D. Response of the water balance in Greece to temperature and precipitation trends. Theor. Appl. Climatol. 2011, 104, 13–24. [Google Scholar] [CrossRef]
- Yue, S.; Wang, C.Y. Applicability of prewhitening to eliminate the influence of serial correlation on the Mann-Kendall test. Water Resour. Res. 2002, 38, 4-1–4-7. [Google Scholar] [CrossRef]
- Şen, Z. Probabilistic formulation of spatio-temporal drought pattern. Theor. Appl. Climatol. 1998, 61, 197–206. [Google Scholar] [CrossRef]
- Pettitt, A. A non-parametric approach to the change-point problem. J. R. Stat. Soc. Ser. C 1979, 28, 126–135. [Google Scholar] [CrossRef]
- Searcy, J.K.; Hardison, C.H. Double–Mass Curves; US Government Printing Offce: Washington, DC, USA, 1960.
- Gao, P.; Li, P.; Zhao, B.; Xu, R.; Zhao, G.; Sun, W.; Mu, X. Use of double mass curves in hydrologic benefit evaluations. Hydrol. Process. 2017, 31, 4639–4646. [Google Scholar] [CrossRef]
- Budyko, M.I.; Miller, D.H.; Miller, D.H. Climate and Life; Academic Press: New York, NY, USA, 1974; Volume 508. [Google Scholar]
- Zhang, L.; Hickel, K.; Dawes, W.R.; Chiew, F.H.S.; Western, A.W.; Briggs, P.R. A rational function approach for estimating mean annual evapotranspiration. Water Resour. Res. 2004, 40. [Google Scholar] [CrossRef]
- Gulakhmadov, A.; Chen, X.; Gulahmadov, N.; Liu, T.; Davlyatov, R.; Sharofiddinov, S.; Gulakhmadov, M. Long-Term hydro–climatic trends in the mountainous kofarnihon river basin in central asia. Water 2020, 12, 2140. [Google Scholar] [CrossRef]
- Wang, W.; Shao, Q.; Yang, T.; Peng, S.; Xing, W.; Sun, F.; Luo, Y. Quantitative assessment of the impact of climate variability and human activities on runoff changes: A case study in four catchments of the Haihe River basin, China. Hydrol. Process. 2013, 27, 1158–1174. [Google Scholar] [CrossRef]
- Peng, S.; Liu, W.; Wang, W.; Shao, Q.; Jiao, X.; Yu, Z.; Xing, W.; Xu, J.; Zhang, Z.; Luo, Y. Estimating the effects of climatic variability and human activities on streamflow in the Hutuo River Basin, China. J. Hydrol. Eng. 2013, 18, 422–430. [Google Scholar] [CrossRef]
- Wu, J.; Wang, Z.; Dong, Z.; Tang, Q.; Lv, X.; Dong, G. Analysis of natural streamflow variation and its influential factors on the Yellow River from 1957 to 2010. Water 2018, 10, 1155. [Google Scholar] [CrossRef] [Green Version]
- Food and Agriculture Organization. International Institute for Applied Systems Analysis; International Soil Reference and Information Centre. JRC: Harmonized World Soil Database (Version 1.2); FAO: Rome, Italy; IIASA: Laxenburg, Austria, 2012. [Google Scholar]
- Hill, A.F.; Minbaeva, C.K.; Wilson, A.M.; Satylkanov, R. Hydrologic controls and water vulnerabilities in the Naryn River basin, Kyrgyzstan: A socio-hydro case study of water stressors in Central Asia. Water 2017, 9, 325. [Google Scholar] [CrossRef] [Green Version]
- World Bank. Key Issues for Consideration on the Proposed Rogun Hydropower Project. Available online: http://www.worldbank.org/content/dam/Worldbank/Event/ECA/central-asia/ (accessed on 10 September 2019).
- Yin, G.; Hu, Z.; Chen, X.; Tiyip, T. Vegetation dynamics and its response to climate change in Central Asia. J. Arid Land 2016, 8, 375–388. [Google Scholar] [CrossRef] [Green Version]
- Schiemann, R.; Lüthi, D.; Vidale, P.L.; Schär, C. The precipitation climate of central Asia—Intercomparison of observational and numerical data sources in a remote semiarid region. Int. J. Climatol. A J. R. Meteorol. Soc. 2008, 28, 295–314. [Google Scholar] [CrossRef]
- Schiemann, R.; Lüthi, D.; Schär, C. Seasonality and interannual variability of the westerly jet in the Tibetan Plateau region. J. Clim. 2009, 22, 2940–2957. [Google Scholar] [CrossRef]
- Tan, M.L.; Samat, N.; Chan, N.W.; Lee, A.J.; Li, C. Analysis of precipitation and temperature extremes over the Muda River Basin, Malaysia. Water 2019, 11, 283. [Google Scholar] [CrossRef] [Green Version]
- Jha, M.K.; Singh, A.K. Trend analysis of extreme runoff events in major river basins of Peninsular Malaysia. Int. J. Water 2013, 7, 142–158. [Google Scholar] [CrossRef]
- Yagbasan, O.; Demir, V.; Yazicigil, H. Trend Analyses of Meteorological Variables and Lake Levels for Two Shallow Lakes in Central Turkey. Water 2020, 12, 414. [Google Scholar] [CrossRef] [Green Version]
- Hu, Z.; Zhou, Q.; Chen, X.; Qian, C.; Wang, S.; Li, J. Variations and changes of annual precipitation in Central Asia over the last century. Int. J. Climatol. 2017, 37, 157–170. [Google Scholar] [CrossRef]
- Li, Z.; Chen, Y.; Fang, G.; Li, Y. Multivariate assessment and attribution of droughts in Central Asia. Sci. Rep. 2017, 7, 1–12. [Google Scholar] [CrossRef]
- Omani, N.; Srinivasan, R.; Karthikeyan, R.; Reddy, V.; Smith, P.K. Impacts of climate change on the glacier melt runoff from five river basins. Trans. ASABE 2016, 59, 829–848. [Google Scholar]
- Hock, R. Glacier melt: A review of processes and their modelling. Prog. Phys. Geogr. 2005, 29, 362–391. [Google Scholar] [CrossRef]
- Dong, L.; Zhang, G.; Cheng, X.; Wang, Y. Analysis of the contribution rate of climate change and anthropogenic activity to runoff variation in Nenjiang Basin, China. Hydrology 2017, 4, 58. [Google Scholar] [CrossRef] [Green Version]
- Zeng, S.; Xia, J.; Du, H. Separating the effects of climate change and human activities on runoff over different time scales in the Zhang River basin. Stoch. Environ. Res. Risk Assess. 2014, 28, 401–413. [Google Scholar] [CrossRef]
- Amirgaliev, N.; Gogol, L.; Zheksenbai, E.; Saianov, S. Regime of hydrochemical indicators of the Syrdarya River in the conditions of anthropogenic impacts. Ecol. Hydrofauna 2008, 2, 82–91. [Google Scholar]
- Xacaнзoдa, Г.; Шoкиpзoдa, Ш.; Дaвлaтзoдa, K.; Kacымoв, X.; Oдилзoдa, У.; Гaφypoв, Ш.; Kyлoв, A.; Acмaтбeкoв, Φ.; Haджибyллoeв, K. Coциaльнo-экoнoмичecкoe пoлoжeниe Pecпyблики Taджикиcтaн. Aгeнтcтвo пo cтaтиcтикe пpи Пpeзидeнтe Pecпyблики Taджикиcтaн. Дyшaнбe. Available online: https://www.stat.tj/ru (accessed on 7 October 2020).
- Hamed, K.H.; Rao, A.R. A modified Mann-Kendall trend test for autocorrelated data. J. Hydrol. 1998, 204, 182–196. [Google Scholar] [CrossRef]
- Yue, S.; Pilon, P.; Phinney, B.; Cavadias, G. The influence of autocorrelation on the ability to detect trend in hydrological series. Hydrol. Process. 2002, 16, 1807–1829. [Google Scholar] [CrossRef]
- R Foundation for Statistical Computing. R: A Language and Environment for Statistical Computing; R Foundation for Statistical Computing: Vienna, Austria, 2015; Volume 2018, p. 2013. Available online: http://www.R-project.org/ (accessed on 7 May 2021).
- Patakamuri, S.; O’Brien, N.M. Modified Versions of Mann Kendall and Spearman’s Rho Trend Tests 2019; R Foundation for Statistical Computing: Vienna, Austria, 2019; Volume 1, pp. 1–27. Available online: https://CRAN.R-project.org/package=modifiedmk (accessed on 7 May 2021).


| WMO Nr | Climate Station | Latitude (°N) | Longitude (°E) | Elevation (m) |
|---|---|---|---|---|
| 38,719 | Anzob | 39.50 | 68.52 | 3373 |
| 38,718 | Iskenderkul | 39.10 | 68.38 | 2204 |
| 38,833 | Hushyori | 38.53 | 68.50 | 1361 |
| 38,845 | Faizobod | 38.32 | 69.19 | 1215 |
| 38,836 | Dushanbe | 38.35 | 68.44 | 800 |
| 38,838 | Isambay | 38. 3 | 68. 21 | 563 |
| 38,937 | Shaartuz | 36.58 | 68.20 | 378 |
| WMO Nr | Discharge station | Latitude (°N) | Longitude (°E) | Elevation (m) |
| 17,150 | Dahana | 38.59 | 68.77 | 1295 |
| 17,137 | Tartki | 37.78 | 68.18 | 419 |
| Crop Area\Year | 1980 | 1999 | 2005 | 2007 | 2010 | 2012 | 2013 | 2014 | 2015 | 2016 | 2017 |
|---|---|---|---|---|---|---|---|---|---|---|---|
| Area (103 ha) | 627.6 | 717.9 | 732.4 | 741.7 | 743.6 | 748.3 | 749.6 | 749.6 | 752.5 | 753.0 | 753.9 |
| Rate (%) | 14.4 | 16.7 | 18.2 | 18.5 | 19.2 | 19.4 | 19.4 | 19.9 | 20.0 | 20.1 |
| Factor | Upstream Basin | |||||
| Original MK Test | Modified MK Test | p-Value | Slope | Significance Based on the Modified MK Test | Change Point (Year) | |
| Z-Value | Z-Value | |||||
| Temperature | 2.576 | 8.131 | 0.000 | 0.009 | *** | 1996 |
| Precipitation | –0.065 | –0.223 | 0.823 | 0.073 | NS | 1969 |
| PET | 2.414 | 4.543 | 0.000 | 0.418 | *** | 1998 |
| Factor | Downstream Basin | |||||
| Original MK Test | Modified MK Test | p-Value | Slope | Significance Based on the Modified MK Test | Change Point (Year) | |
| Z-Value | Z-Value | |||||
| Temperature | 4.921 | 17.252 | 0.000 | 0.023 | *** | 1976 |
| Precipitation | –0.022 | –0.076 | 0.940 | 0.015 | NS | 1969 |
| PET | 1.927 | 3.760 | 0.000 | 0.438 | *** | 1998 |
| Hydrological Station | Original MK Test | Modified MK Test | Change Rate (mm/10a) | p-Value | Slope | Significance Based on the Modified MK Test | Change Point (Year) |
|---|---|---|---|---|---|---|---|
| Z-Value | Z-Value | ||||||
| Tartki (Downstream) | 3.561 | 5.307 | 2.467 | 0.000 | 3.038 | *** | 1991 |
| Dahana (Upstream) | 1.445 | 4.471 | 1.336 | 0.000 | 1.804 | *** | 1986 |
| Regions | Prior Impacted Period | Post Impacted Period | Change (%) | ||||
|---|---|---|---|---|---|---|---|
| Mean (mm) | SD (mm) | CV | Mean (mm) | SD (mm) | CV | ||
| Upstream | 972.23 | 194.11 | 0.20 | 1057.36 | 215.74 | 0.20 | 8.76 |
| Downstream | 536.47 | 107.95 | 0.20 | 661.60 | 97.32 | 0.15 | 23.32 |
| Regions | Period | R | P | PET | ΔR | ΔP | ΔPET | ΔRclimate | ΔRhuman | |||
|---|---|---|---|---|---|---|---|---|---|---|---|---|
| (mm) | (mm) | (mm) | (mm) | (mm) | (mm) | mm | % | mm | % | |||
| Upstream Basin | Basline Meaure | 1950–1986 | 972.23 | 374.21 | 1041.77 | |||||||
| 1987–1991 | 980.13 | 379.50 | 1041.64 | 7.90 | 5.29 | −0.12 | 35.42 | 56.28 | −27.52 | 43.72 | ||
| 1992–1996 | 1162.83 | 384.72 | 1020.67 | 190.60 | 10.51 | −21.10 | 119.12 | 62.50 | 71.48 | 37.50 | ||
| 1997–2001 | 947.46 | 370.37 | 1052.83 | −24.77 | −3.84 | 11.06 | −41.36 | 71.37 | 16.59 | 28.63 | ||
| 2002–2006 | 1213.55 | 414.51 | 1049.99 | 241.33 | 40.31 | 8.22 | 285.60 | 86.58 | −44.28 | 13.42 | ||
| 2007–2011 | 1042.03 | 360.05 | 1067.76 | 69.80 | −14.16 | 25.99 | −147.89 | 40.45 | 217.70 | 59.55 | ||
| 2012–2016 | 998.18 | 393.79 | 1070.81 | 25.96 | 19.58 | 29.04 | 85.17 | 58.99 | −59.22 | 41.01 | ||
| 1987–2016 | 1057.36 | 390.35 | 1050.47 | 85.14 | 16.14 | 8.70 | 98.64 | 87.96 | −13.51 | 12.04 | ||
| Downstream Basin | Baseline Meaure | 1950–1991 | 536.47 | 719.49 | 1205.01 | |||||||
| 1992–1996 | 703.37 | 749.30 | 1180.18 | 166.89 | 29.81 | −29.63 | 82.87 | 49.66 | 84.02 | 50.34 | ||
| 1997–2001 | 634.16 | 712.93 | 1218.09 | 97.68 | −6.57 | 8.28 | −22.74 | 15.89 | 120.42 | 84.11 | ||
| 2002–2006 | 709.35 | 761.57 | 1226.17 | 172.87 | 42.08 | 16.36 | 74.16 | 42.90 | 98.71 | 57.10 | ||
| 2007–2011 | 622.96 | 688.45 | 1236.89 | 86.49 | −31.04 | 27.08 | −88.29 | 33.56 | 174.77 | 66.44 | ||
| 2012–2016 | 638.17 | 680.99 | 1227.98 | 101.70 | −38.51 | 18.17 | −101.52 | 33.31 | 203.22 | 66.69 | ||
| 1992–2016 | 661.60 | 718.65 | 1217.86 | 46.69 | −0.32 | 8.05 | −11.09 | 7.53 | 136.22 | 92.47 | ||
| Land Use Type | 1990 | 2000 | 2010 | 2015 | |
|---|---|---|---|---|---|
| Agricultural land | Area (km2) | 1900.11 | 1612.70 | 1572.78 | 1527.16 |
| Rate (%) | −15.12 | −17.23 | −19.63 | ||
| Forest land | Area (km2) | 423.70 | 421.99 | 424.27 | 424.27 |
| Rate (%) | −0.40 | 0.13 | 0.13 | ||
| Grass land | Area (km2) | 5733.41 | 5925.02 | 5798.42 | 5795.57 |
| Rate (%) | 3.34 | 1.13 | 1.08 | ||
| Construction land | Area (km2) | 248.63 | 422.56 | 638.12 | 685.45 |
| Rate (%) | 69.69 | 156.65 | 175.69 | ||
| Water | Area (km2) | 32.50 | 33.65 | 38.21 | 38.21 |
| Rate (%) | 3.54 | 17.57 | 17.57 | ||
| Bare land | Area (km2) | 3251.63 | 3174.08 | 3118.19 | 3119.33 |
| Rate (%) | −2.38 | −4.10 | −4.07 | ||
Publisher’s Note: MDPI stays neutral with regard to jurisdictional claims in published maps and institutional affiliations. |
© 2021 by the authors. Licensee MDPI, Basel, Switzerland. This article is an open access article distributed under the terms and conditions of the Creative Commons Attribution (CC BY) license (https://creativecommons.org/licenses/by/4.0/).
Share and Cite
Gulahmadov, N.; Chen, Y.; Gulakhmadov, A.; Rakhimova, M.; Gulakhmadov, M. Quantifying the Relative Contribution of Climate Change and Anthropogenic Activities on Runoff Variations in the Central Part of Tajikistan in Central Asia. Land 2021, 10, 525. https://0-doi-org.brum.beds.ac.uk/10.3390/land10050525
Gulahmadov N, Chen Y, Gulakhmadov A, Rakhimova M, Gulakhmadov M. Quantifying the Relative Contribution of Climate Change and Anthropogenic Activities on Runoff Variations in the Central Part of Tajikistan in Central Asia. Land. 2021; 10(5):525. https://0-doi-org.brum.beds.ac.uk/10.3390/land10050525
Chicago/Turabian StyleGulahmadov, Nekruz, Yaning Chen, Aminjon Gulakhmadov, Moldir Rakhimova, and Manuchekhr Gulakhmadov. 2021. "Quantifying the Relative Contribution of Climate Change and Anthropogenic Activities on Runoff Variations in the Central Part of Tajikistan in Central Asia" Land 10, no. 5: 525. https://0-doi-org.brum.beds.ac.uk/10.3390/land10050525