Article

Effects of Land-Use Intensity and Land Management Policies on Evolution of Regional Land System: A Case Study in the Hengduan Mountain Region

1
College of Geography and Environment, Shandong Normal University, No. 1, University Road, Changqing District, Jinan 250358, China
2
Lhasa Plateau Ecosystem Research Station, Key Laboratory of Ecosystem Network Observation and Modeling, Institute of Geographic Sciences and Natural Resources Research, Chinese Academy of Sciences, Beijing 100101, China
3
University of Chinese Academy of Sciences, Beijing 100049, China
4
Land Reserve Center, Department of Natural Resources, Shandong Province, No. 114, East Jing Shi Road, Li Xia District, Jinan 250014, China
*
Author to whom correspondence should be addressed.
Submission received: 9 April 2021 / Revised: 5 May 2021 / Accepted: 13 May 2021 / Published: 15 May 2021
(This article belongs to the Section Land Systems and Global Change)

Abstract

:
In the last few decades, land use/land cover (LULC) has changed significantly under the influence of local planning and policy implementation, and this has had a profound impact on the regional ecological environment. By taking the Hengduan Mountain region as the study area, this study considered the demands of various commodities and services and applied the CLUMondo model to predict the trajectory of change in the land system for the years 2010–2030. The results indicate that the forest system expands significantly in this time, while the grassland and cropland systems are projected to develop intensively under the three scenarios. The high demand for livestock products is the main cause of the intensification of the grassland system under the TREND scenario, the demand for forests leads to the expansion of the forest land system under the FOREST scenario, and the significant intensification of the cropland system under the CONSERVATION scenario is closely related to an increase in the area of ecological land. The results of this study can provide a scientific reference for the optimal management of land systems in other mountainous areas.

1. Introduction

Land is the spatial carrier of all human activities and the material basis for human survival [1]. With the increase in population and accelerating urbanization, human activities have had a profound impact on the global natural environment that has manifested as a sharp decrease in biodiversity, soil erosion, and environmental pollution [2,3,4,5]. A large number of studies have been carried out on regional ecological conservation. For instance, researchers have concluded that establishing nature reserves can significantly change the landscape patterns and curb human pressure on evergreen mountain habitats [6], and the migration of refugees from the Cox’s Bazar–Teknaf Peninsula of Bangladesh has severely damaged regional vegetation cover, biomass, and carbon stocks. Conservation-related decisions, priority-based interventions, and public policy are vital for protecting the ecological environment [7]. Since the late 1970s, China has launched six projects for ecological restoration across the country to restore the degraded ecosystem, and this has yielded positive results [8,9,10]. However, the transformation from production space to ecological and living spaces has led to an increasingly prominent conflict between the limited production of commodities and services, and growing human demand, especially in ecologically fragile mountainous areas [11,12,13].
The Global Land Project (GLP) has noted that simulations are an important means of understanding changes in the land system (a spatiotemporal system composed of multiple elements) as well as the rules governing dynamic changes in it. They can be used to quantitatively and visually display the land-use characteristics and the process of dynamic changes in them [2,14]. Different types of dynamic models of land systems have been used to study changes in land use and their environmental effects. Researchers in different fields have constructed models of land-use changes using a variety of methods, including system, statistical, expert, cellular, hybrid, and agent-based models [15,16]. However, most of these models consider specific types of land use/land cover (LULC) as simulation units, and ignore the impact of the intensity of land use and the land management policy, which can better reflect the impact of socioeconomic development and human activities on land-use patterns [17,18]. In addition, in the context of the construction of an ecological civilization, changes in land use are no longer driven only by commodities and services, such as food and timber, but by policies of afforestation and protection of biodiversity, which have gradually had a growing impact on the LULC. To overcome these limitations, a land-system-based method of modeling, called the CLUMondo model, has been proposed that uses the land system, rather than the type of LULC, as the simulation unit [1]. This model can capture the major ecological and socioeconomic characteristics associated with land use at the landscape level by considering the requirements of multiple commodities and services [19]. The CLUMondo model has been widely used at the global, national, and regional scales [17,20,21], but the relevant studies have paid little attention to changes in land systems in mountain areas.
Mountainous areas account for about 70% of all land in China, and house more than 40% of its population [22]. These areas are also poverty stricken, ecologically fragile, and environmentally sensitive [23]. Changes in land-use types in mountainous areas are relatively minor, and the importance of the intensity of land use and land management policies to the evolution of the land system cannot be underestimated [24,25]. The Hengduan Mountain region is an important area for ecological functions in China. Its ecological services not only support the development of mountain areas but also serve as an important ecological barrier for regions and countries [26]. With annual erosion of 108 t of soil, the Hengduan Mountain region is among the most significantly affected areas in China [27]. The intensity of land-use and land management policies are crucial to the effective control of soil erosion. Given the importance of the Hengduan Mountain region in protecting the ecological environment, it is important to explore the impact of land-use intensity and land management policies on the evolution of land systems under different scenarios to help managers and decision-makers implement appropriate policies. This study evaluated the characteristics of the evolution of land systems in the Hengduan Mountain region under different scenarios. The results can provide scientific support for the sustainable development of land use in mountainous areas.

2. Materials and Methods
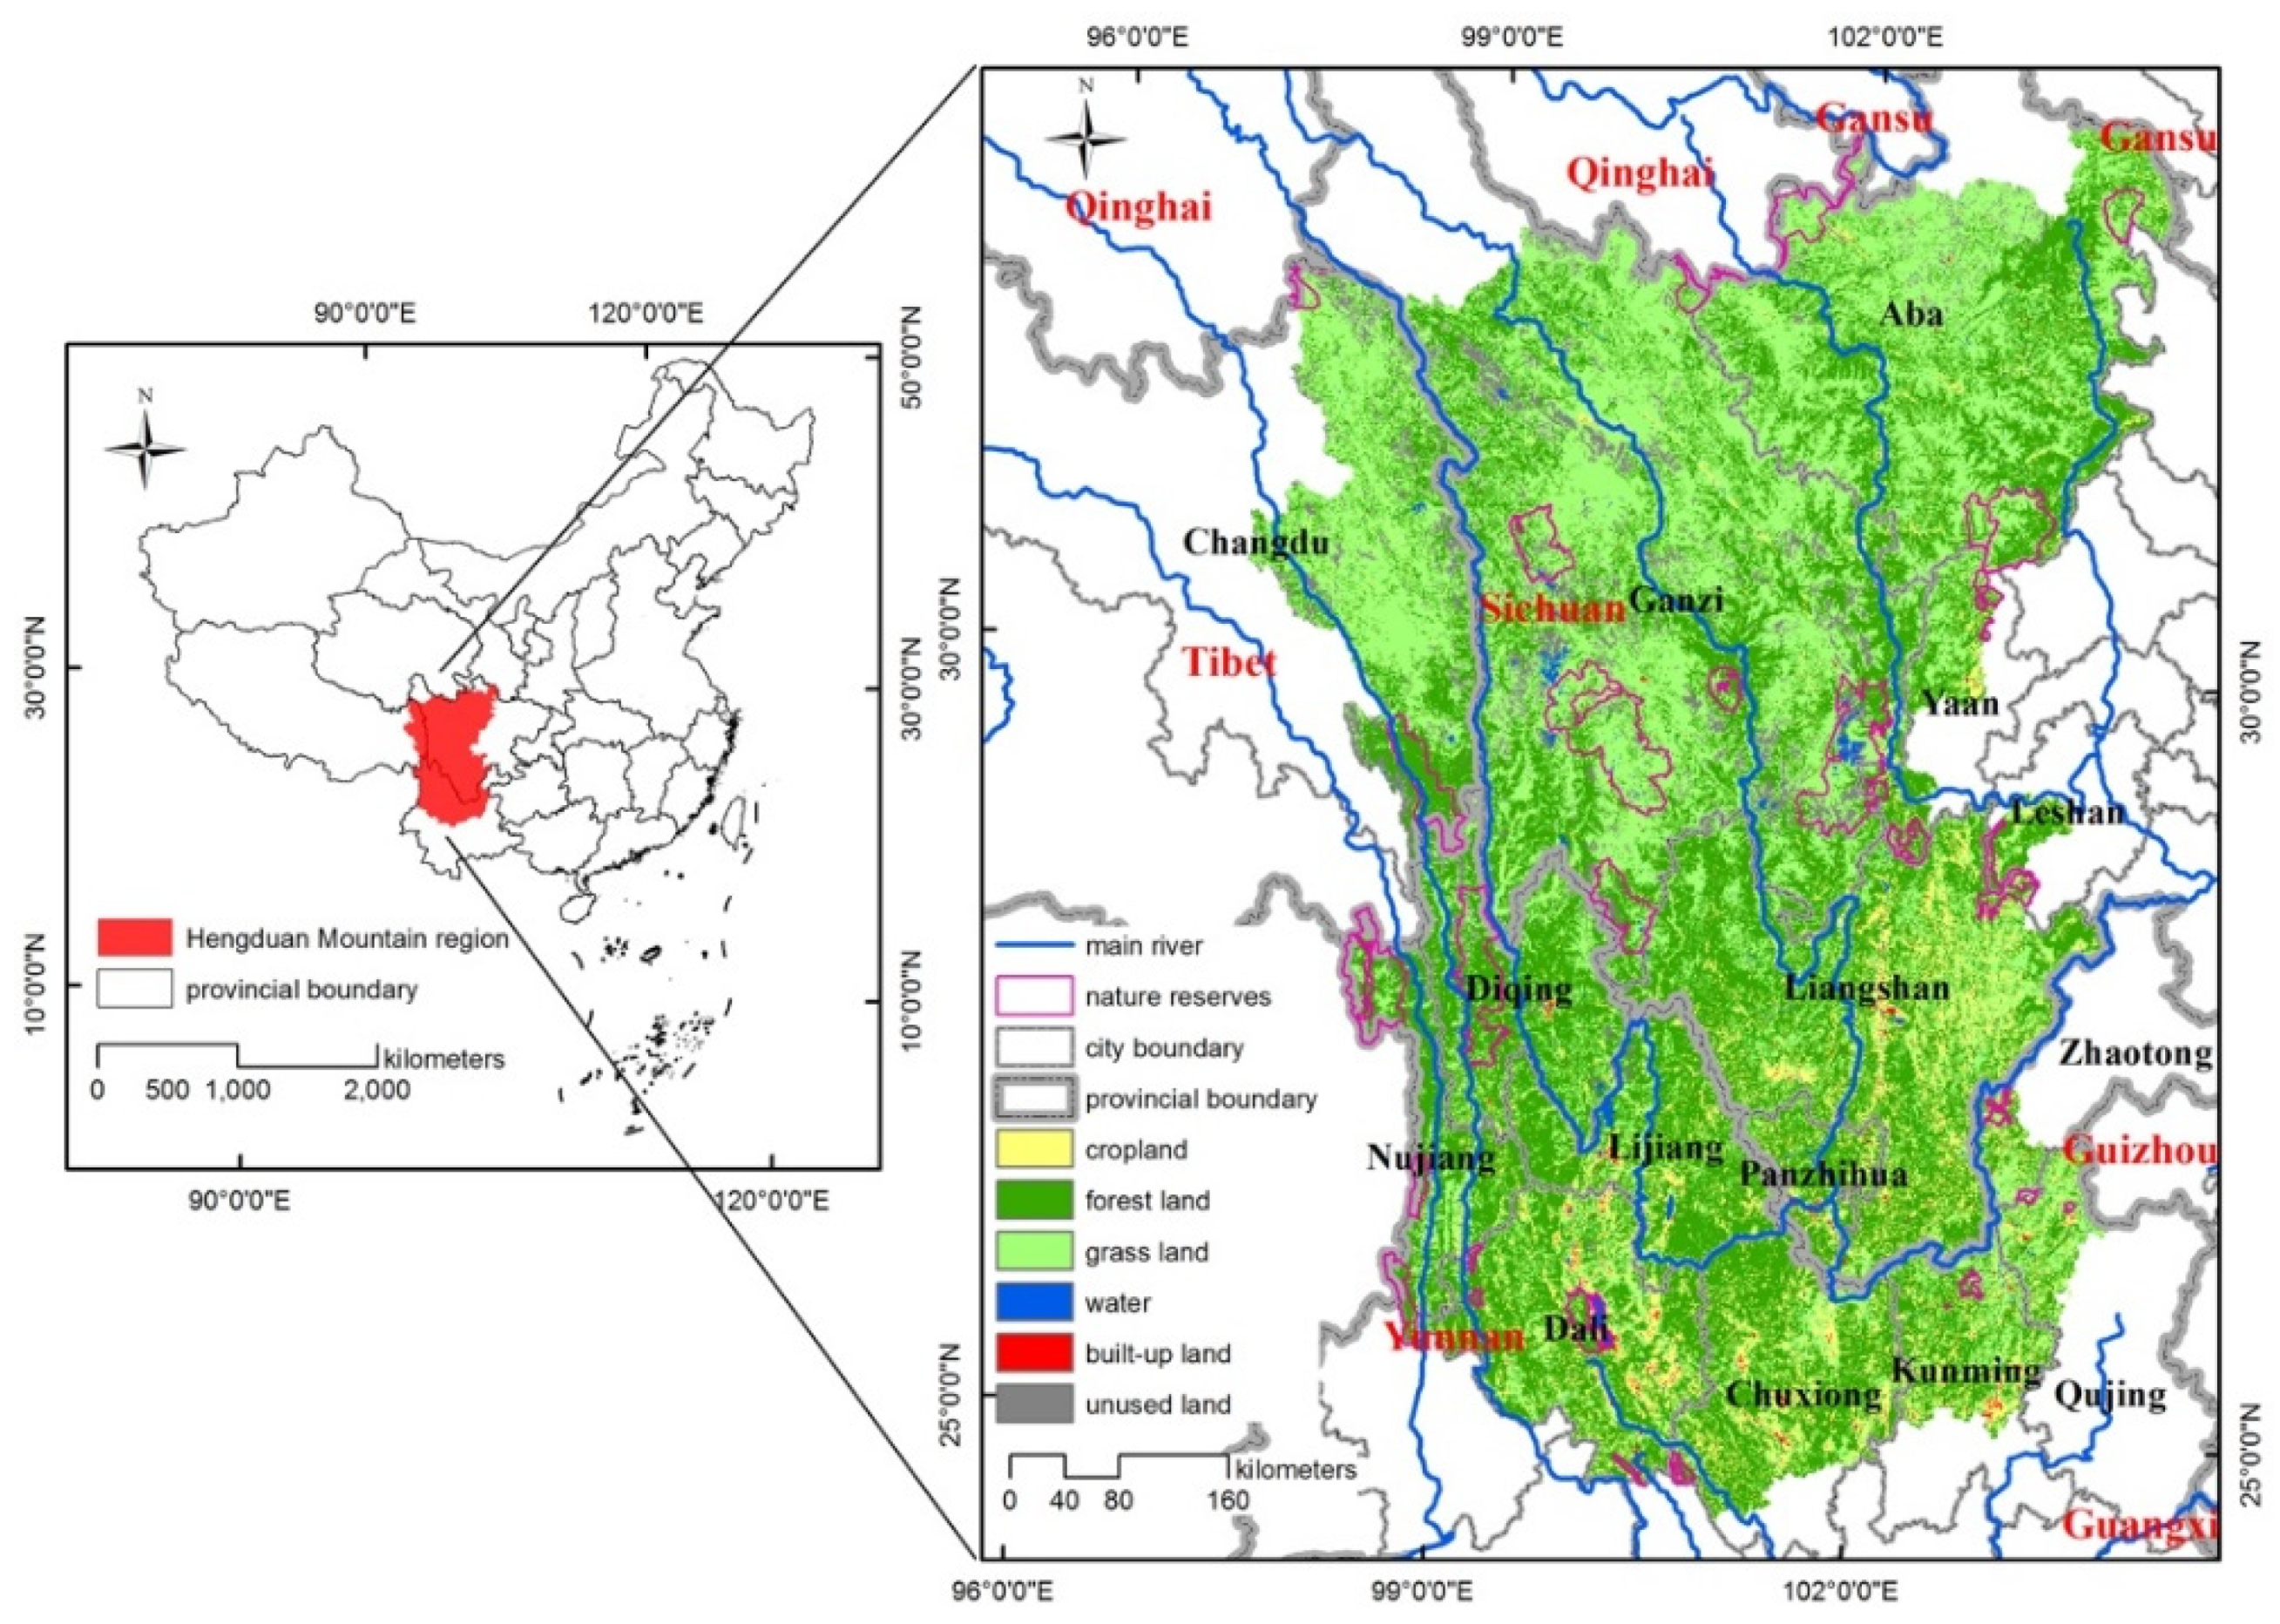
2.1. Study Area

The Hengduan Mountain region is named for its complex and varied topography. It refers to the north–south trending mountains in the western part of Sichuan Province, the northern part of Yunnan Province, and the eastern part of Tibet Autonomous Region, located between 24°29′–33°43′ N and 97°10′–104°25′ E (Figure 1). It covers an area of 450,000 km2, with elevation ranging from 329 to 6304 m, of which the area above 3000 m accounts for 61.18% of the total. The annual average temperature is 5–13 °C, and the annual total precipitation is 500–1000 mm. Of this, the precipitation from May to October accounts for 60–90% of the total [28]. The Hengduan Mountain region is an important soil and water conservation area. By the end of 2015, 24 national nature reserves had been established here to protect the forest ecosystem, wetland ecosystem, and wildlife (http://www.gov.cn/guoqing/2019-04/09/content_5380702.htm, accessed on 20 July 2020).

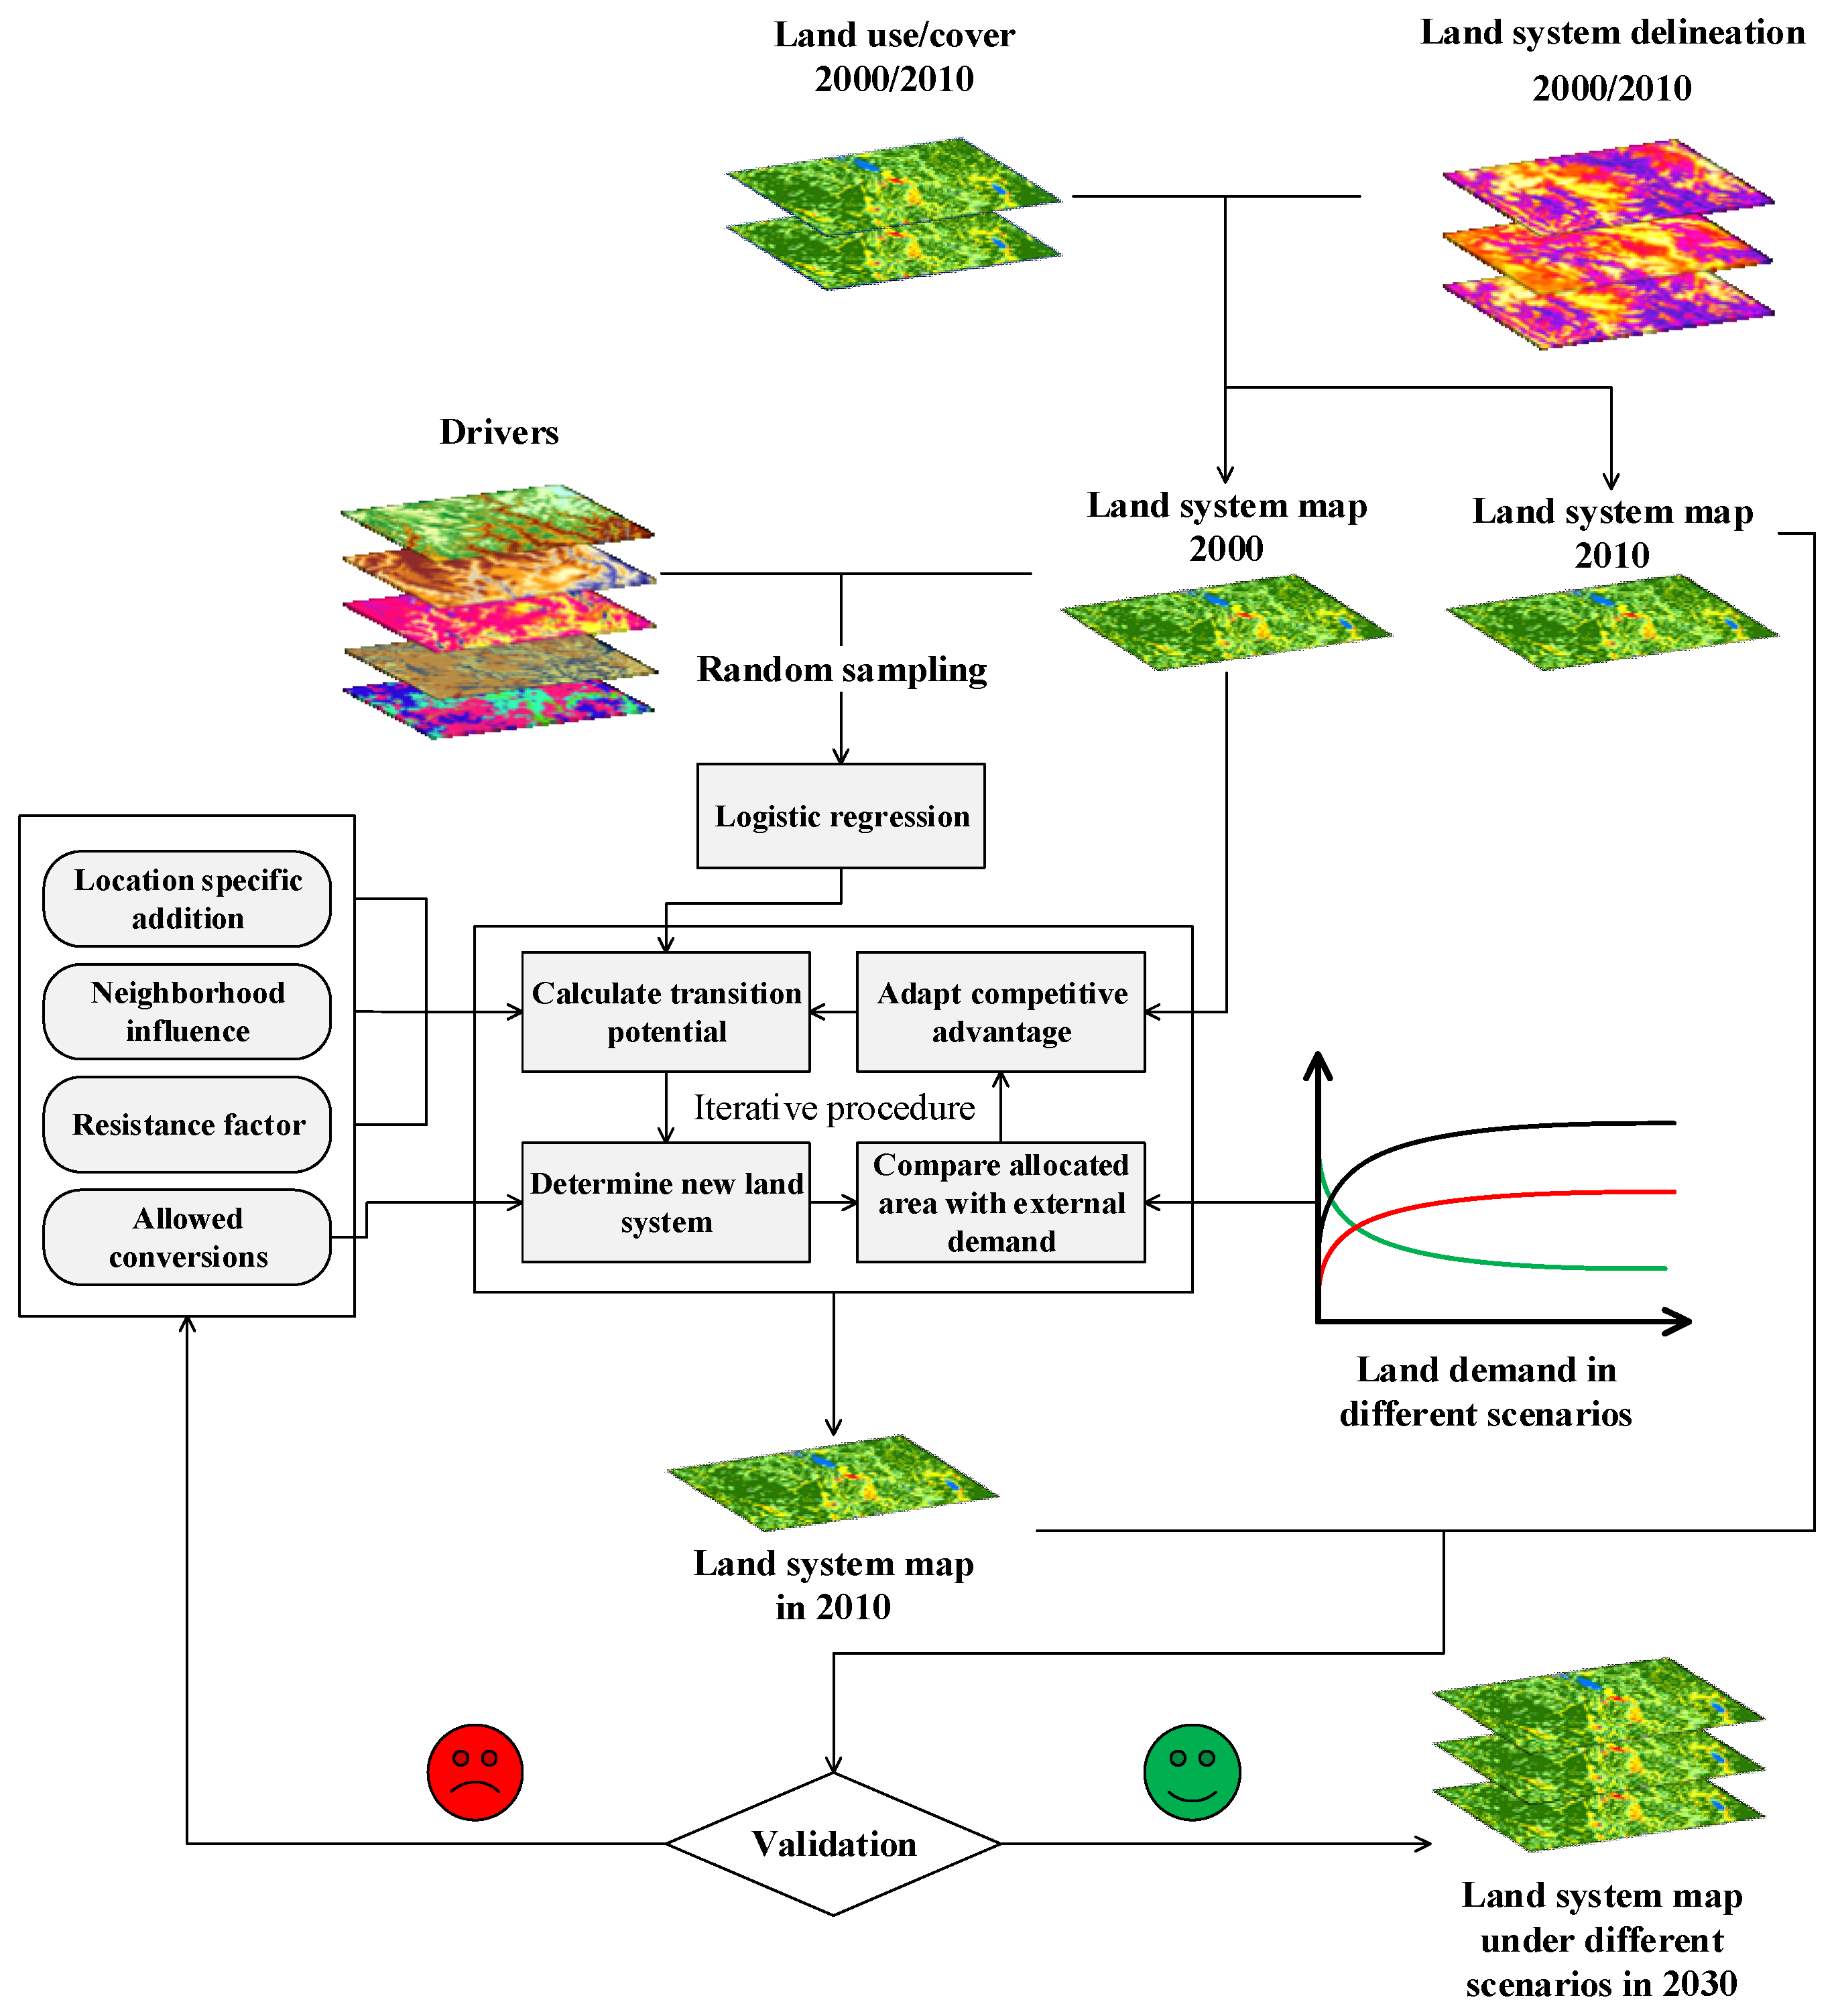
2.2. Research Framework

This study describes changes in the land system of the Hengduan Mountain region due to interference by the local natural and socioeconomic environment. First, to jointly consider different demands for commodities and services, the land-use/land cover data of the Hengduan Mountain region in 2000 and 2010 were delineated into different land systems. Second, the logistic regression model between land systems and factors driving their development in 2000 was established. Once the model parameters had been calibrated, the land system of the Hengduan Mountain region in 2030 was simulated as driven by multiple commodities and services under different scenarios. The sources of data for this study are shown in Table S1, and the research framework is shown in Figure 2.

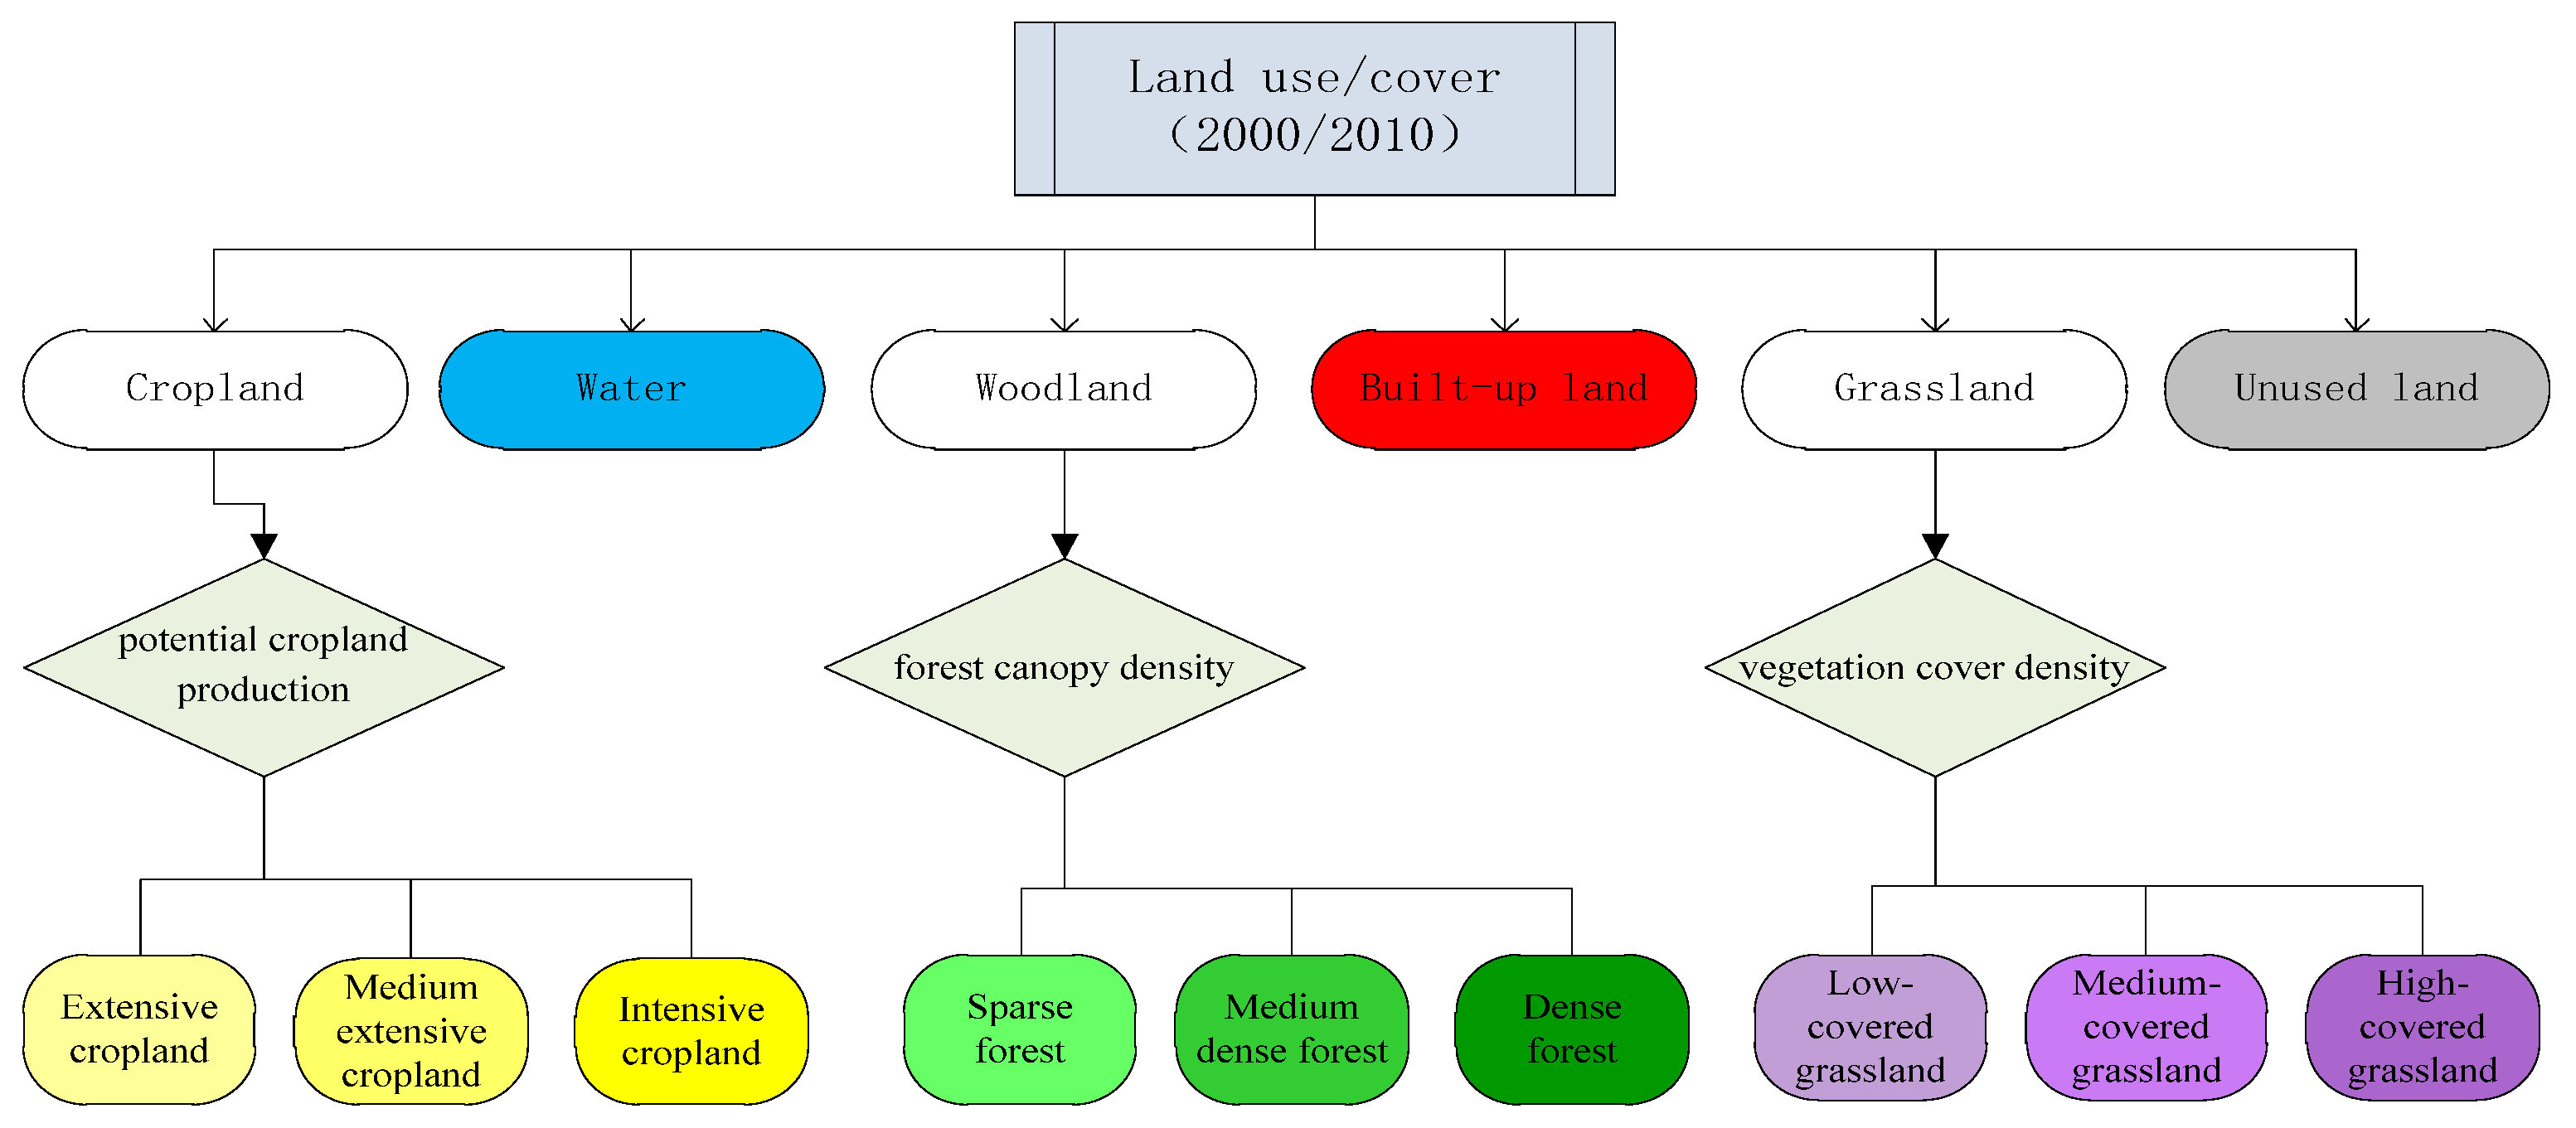
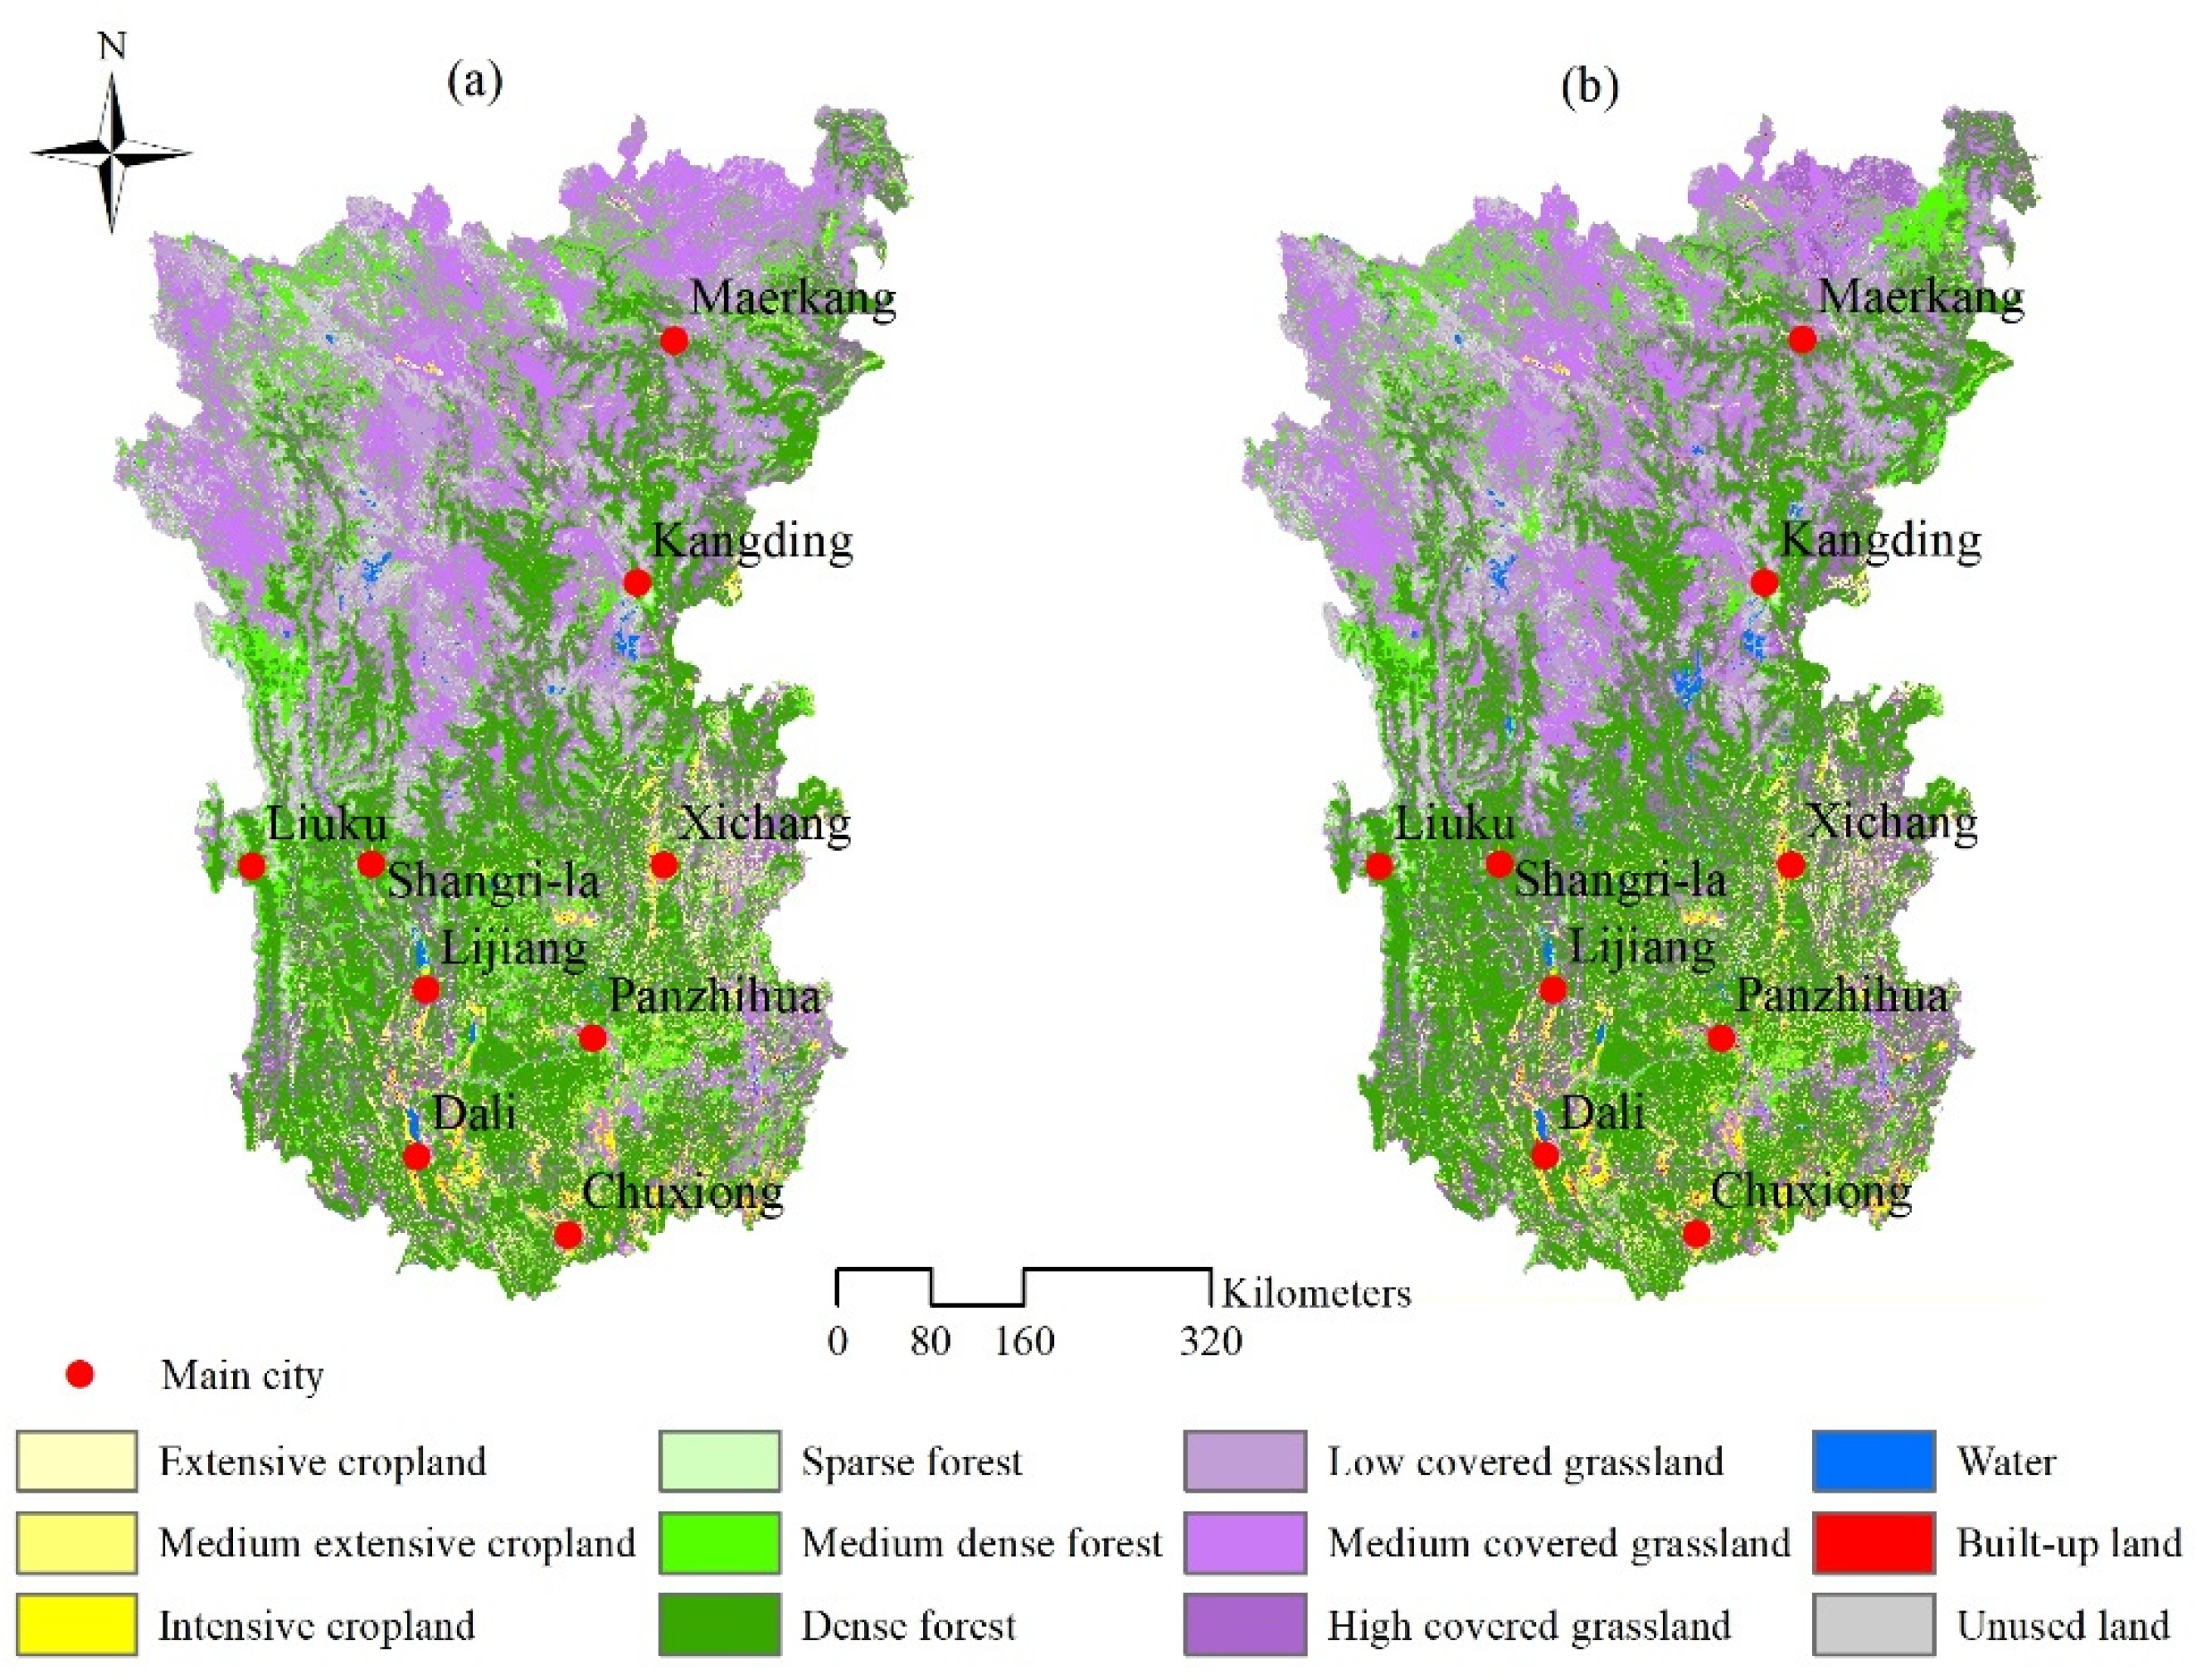
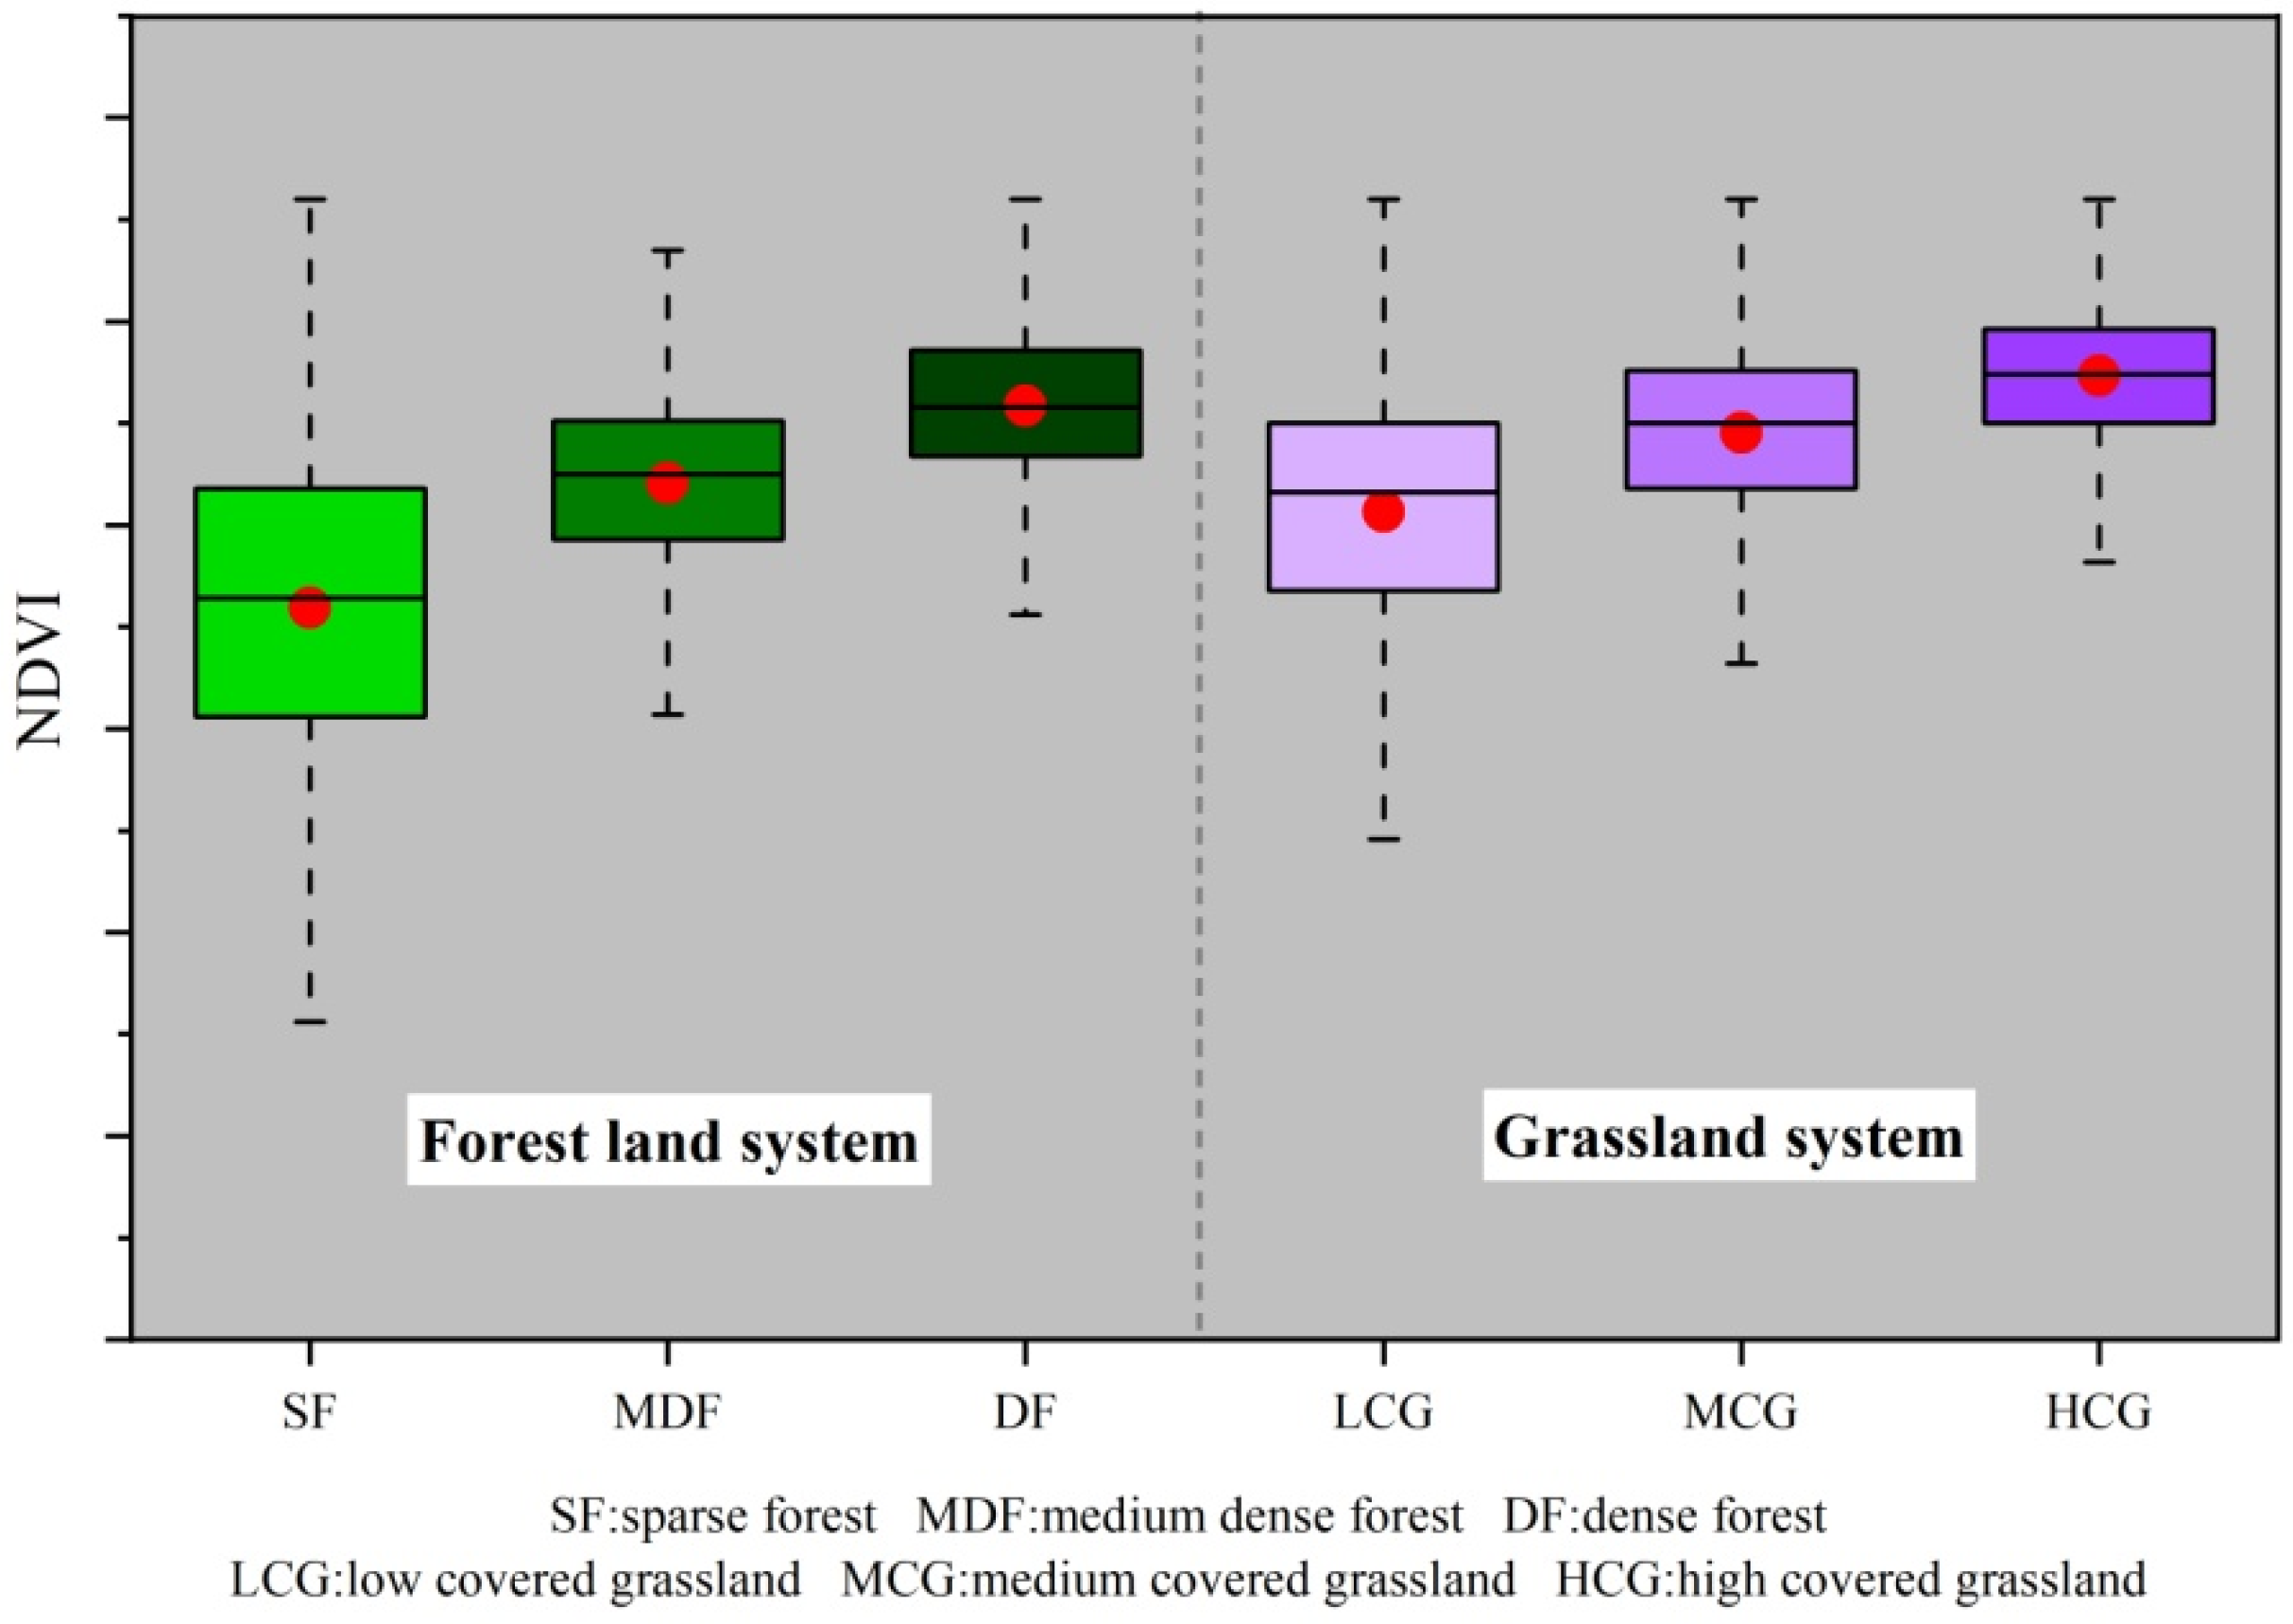
2.3. Delineation of Land System

According to land-use data for the Hengduan Mountain region in 2015, its main land-use types were forest land (46%), grassland (41.56%), and cropland (7.52%) and were closely related to the major commodities and services that the area provided. This study delineated the cropland, forest land, and grassland of the Hengduan Mountain region in 2000 and 2010 based on potential cropland production [29], densities of the forest canopy [30], and vegetation cover [31], respectively. The classification threshold was determined by natural breaks. The cropland system was divided into extensive cropland, medium–extensive cropland, and intensive cropland, the forest land system was divided into sparse forest, medium dense forest, and dense forest, and the grassland system was divided into low-covered grassland, medium-covered grassland, and high-covered grassland. The approaches to land system delineation and its results for the Hengduan Mountain region in 2000 and 2010 are shown in Figure 3 and Figure 4, respectively.

2.4. Parameter Setting of the CLUMondo Model

The CLUMondo model is a dynamic and spatially intuitive land-use model that represents the latest developments based on a series of models in the framework for the Conversion of Land Use and its Effects (CLUE) model. It is designed to simulate changes in land cover and the degree of land use. The core of the CLUMondo model is a combination of a land-use simulation based on an empirical analysis of the suitability of the given location and a dynamic simulation of the competition and interaction between different land systems. A total of 20 driving factors, including climate, topography, soil attributes, socioeconomic concerns, and vegetation types, were used as explanatory variables for changes to the land system in the Hengduan Mountain region. Factors with correlation coefficients higher than 0.8 were eliminated by multi-collinearity analysis. Logistic regression was then established for each land system and the factors driving it, and the results of fitting were determined by the level of significance and AUC (area under the curve), which represent the accuracy of the analysis of regression (Table S2). Resistance to conversion is a key factor influencing changes to the land system and was assigned values ranging from 0 (easy conversion) to 1 (irreversible change). In general, types of land use with high capital investment or an irreversible impact on the environment are difficult to convert. In this study, the resistance to conversion was set according to changes in different land systems in the Hengduan Mountain region from 2000 to 2010. The order of conversion described how the model altered land use to meet external demands. All land systems that provided commodities or services were assigned a value starting from 1, and systems that did not provide commodities or services were set to 0. The supply of ecosystem services per pixel was determined by the total supply of regional ecosystem services, such as crop production, first according to the number of pixels of extensive cropland, medium–extensive cropland, and intensive cropland to determine their proportional areas, and then by calculating the pixel-scale crop production according to the regional crop production (Table S3). For the detailed information and parameter setting of the CLUMondo model, refer to http://www.environmentalgeography.nl/site/data-models/data/clumondo-model/, accessed on 15 November 2020.

2.5. Scenario Setting

Based on the different goals of ecological protection as well as regional policies and plans, the TREND, FOREST, and CONSERVATION scenarios were designed to identify the trajectories of evolution of land systems in the Hengduan Mountain region. Crop production, livestock numbers, area of built-up land, and area of forested land were set as the constraints on the evolution of the land system under the different scenarios (Table 1). To ensure consistency among the different datasets, 2010–2030 was selected as the study period for the simulation. By considering the small area of cropland in the study area and the gradual increase in the demand for food, this study set the same growth rate of crop production in all three scenarios.
The historical trend scenario (TREND) followed the rule of changes to different kinds of demands in the Hengduan Mountain region over the past decade. Based on the county statistical yearbook data from 2000 to 2010, the annual growth rates of demands for different materials of living, services, and commodities were calculated. The growth rates of crop production, livestock, built-up land, and forest land were set to 1%, 0.3%, 4%, and 0.2%, respectively. Crop production, livestock, and demand for built-up land and forest land over the next 20 years were predicted by using these growth rates.
The implementation of afforestation projects has significantly improved the status of vegetation in the Hengduan Mountain region, and these include the Yangtze River Shelter Forest Project (initiated in 1989), Natural Forest Protection Project (initiated in 1998), and Grain for Green Project (initiated in 2000). The scenario of demand for forest land (FOREST) focused on the role of forests in environmental protection and was based on the TREND scenario with more stringent constraints on the demand for forest land. The growth rate of forest land for this scenario was set at 0.25% instead of 0.2%. Based on the Yangtze River Shelterbelt System Construction Project, Phase III (2011–2020), and the General Land-use Planning of Sichuan Province, Yunnan Province, and Tibet Autonomous Region (2006–2020), the annual demand was obtained by the linear interpolation of crop production, livestock, and areas of built-up land and forest land.
The unique natural environment of mountainous areas provides a strong guarantee for the protection of regional biodiversity. The scenario with strong conservation targets (CONSERVATION) was designed to protect the natural habitat and prevent the loss of biodiversity. Therefore, in addition to setting the growth rates of crop production, livestock, built-up land, and forest land, this study considered nature reserves and the growth rate of ecological land as constraints. In the CONSERVATION scenario, the authors regarded nature reserves as areas of restricted development and set the annual growth rate of ecological land (sparse forest, medium dense forest, dense forest, low-covered grassland, medium-covered grassland, high-covered grassland, and water) to 0.05%.

2.6. Model Validation

The accuracy of the CLUMondo model was validated by comparing the map of the simulated land system with its actual map in 2010. Conventional methods to verify the accuracy of models include cell-by-cell comparisons of simulated land-use maps and actual land-use areas, such as by using the kappa coefficient. However, the absolute value of this statistic depends largely on the magnitude of land-use changes during the simulation period, and better results are usually obtained by modeling areas with fewer changes. Given that the land system in the Hengduan Mountain region was relatively stable from 2000 to 2010, this study used the kappa simulation, kappa transition, and kappa coefficient of transition in location to account for the magnitude of land-use changes and validate the accuracy of simulations of the CLUMondo model.

3. Results

3.1. Results of Model Validation

In general, the overall accuracy of the model simulation was 0.835, where the coefficients of kappa transition and kappa location transition were 0.89 and 0.938, respectively. For different land systems, the coefficients of the kappa simulation, kappa transition, and kappa location transition were all greater than 0.75. This indicates that the CLUMondo model was highly accurate in simulating changes to the land system in the Hengduan Mountain region. The statistical accuracies of different land systems in the region are shown in Table S4.

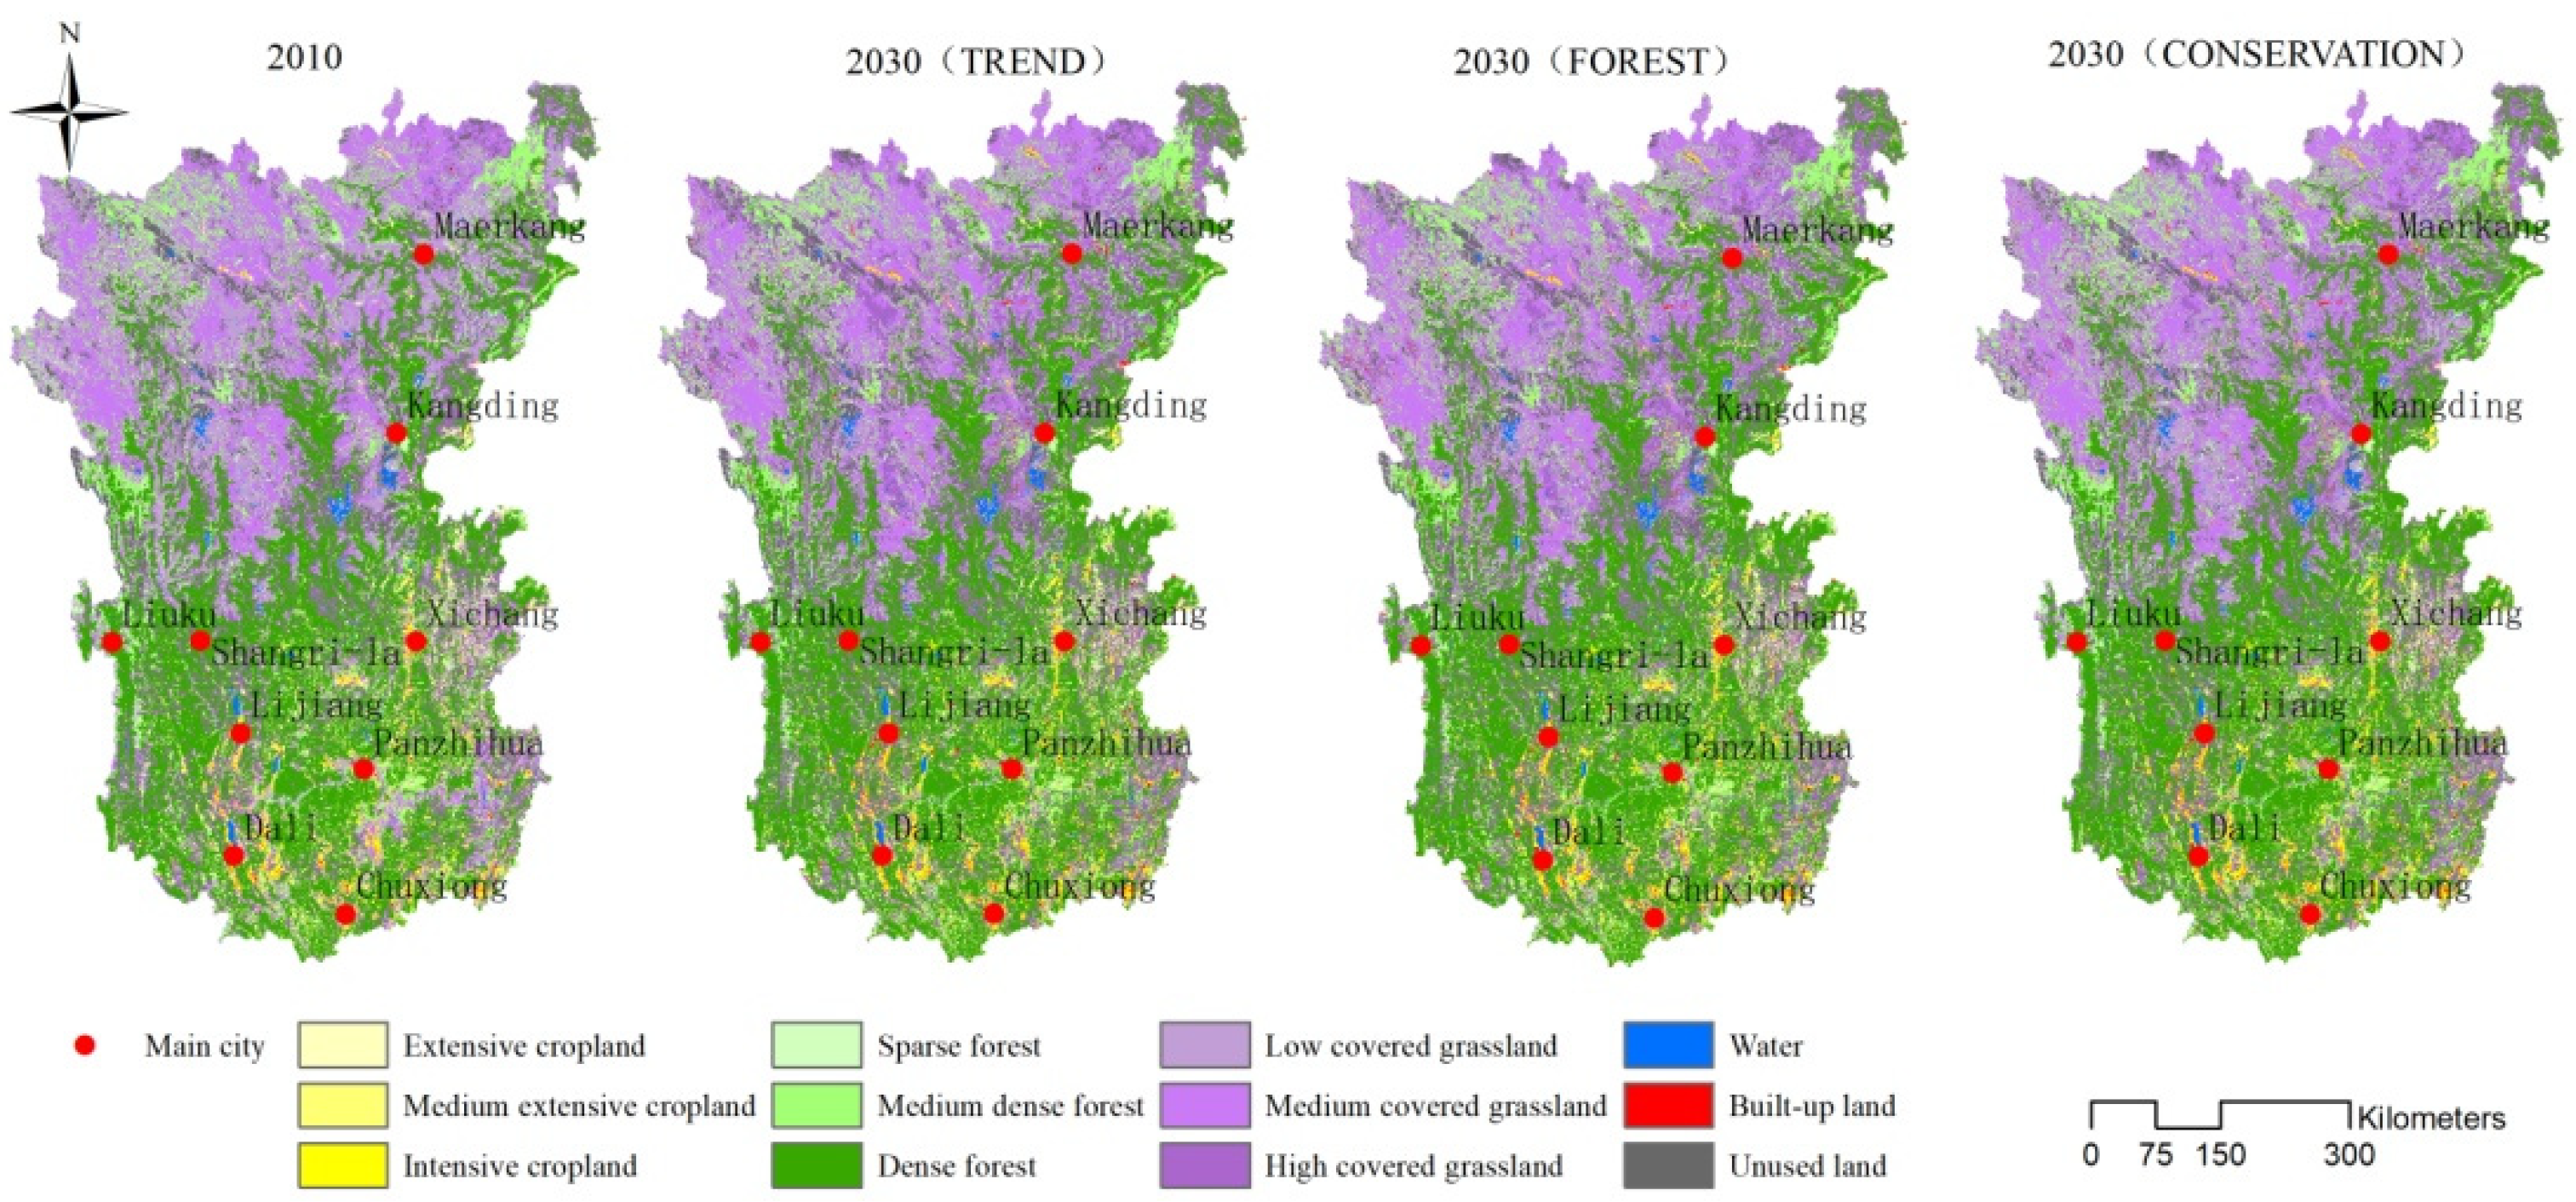
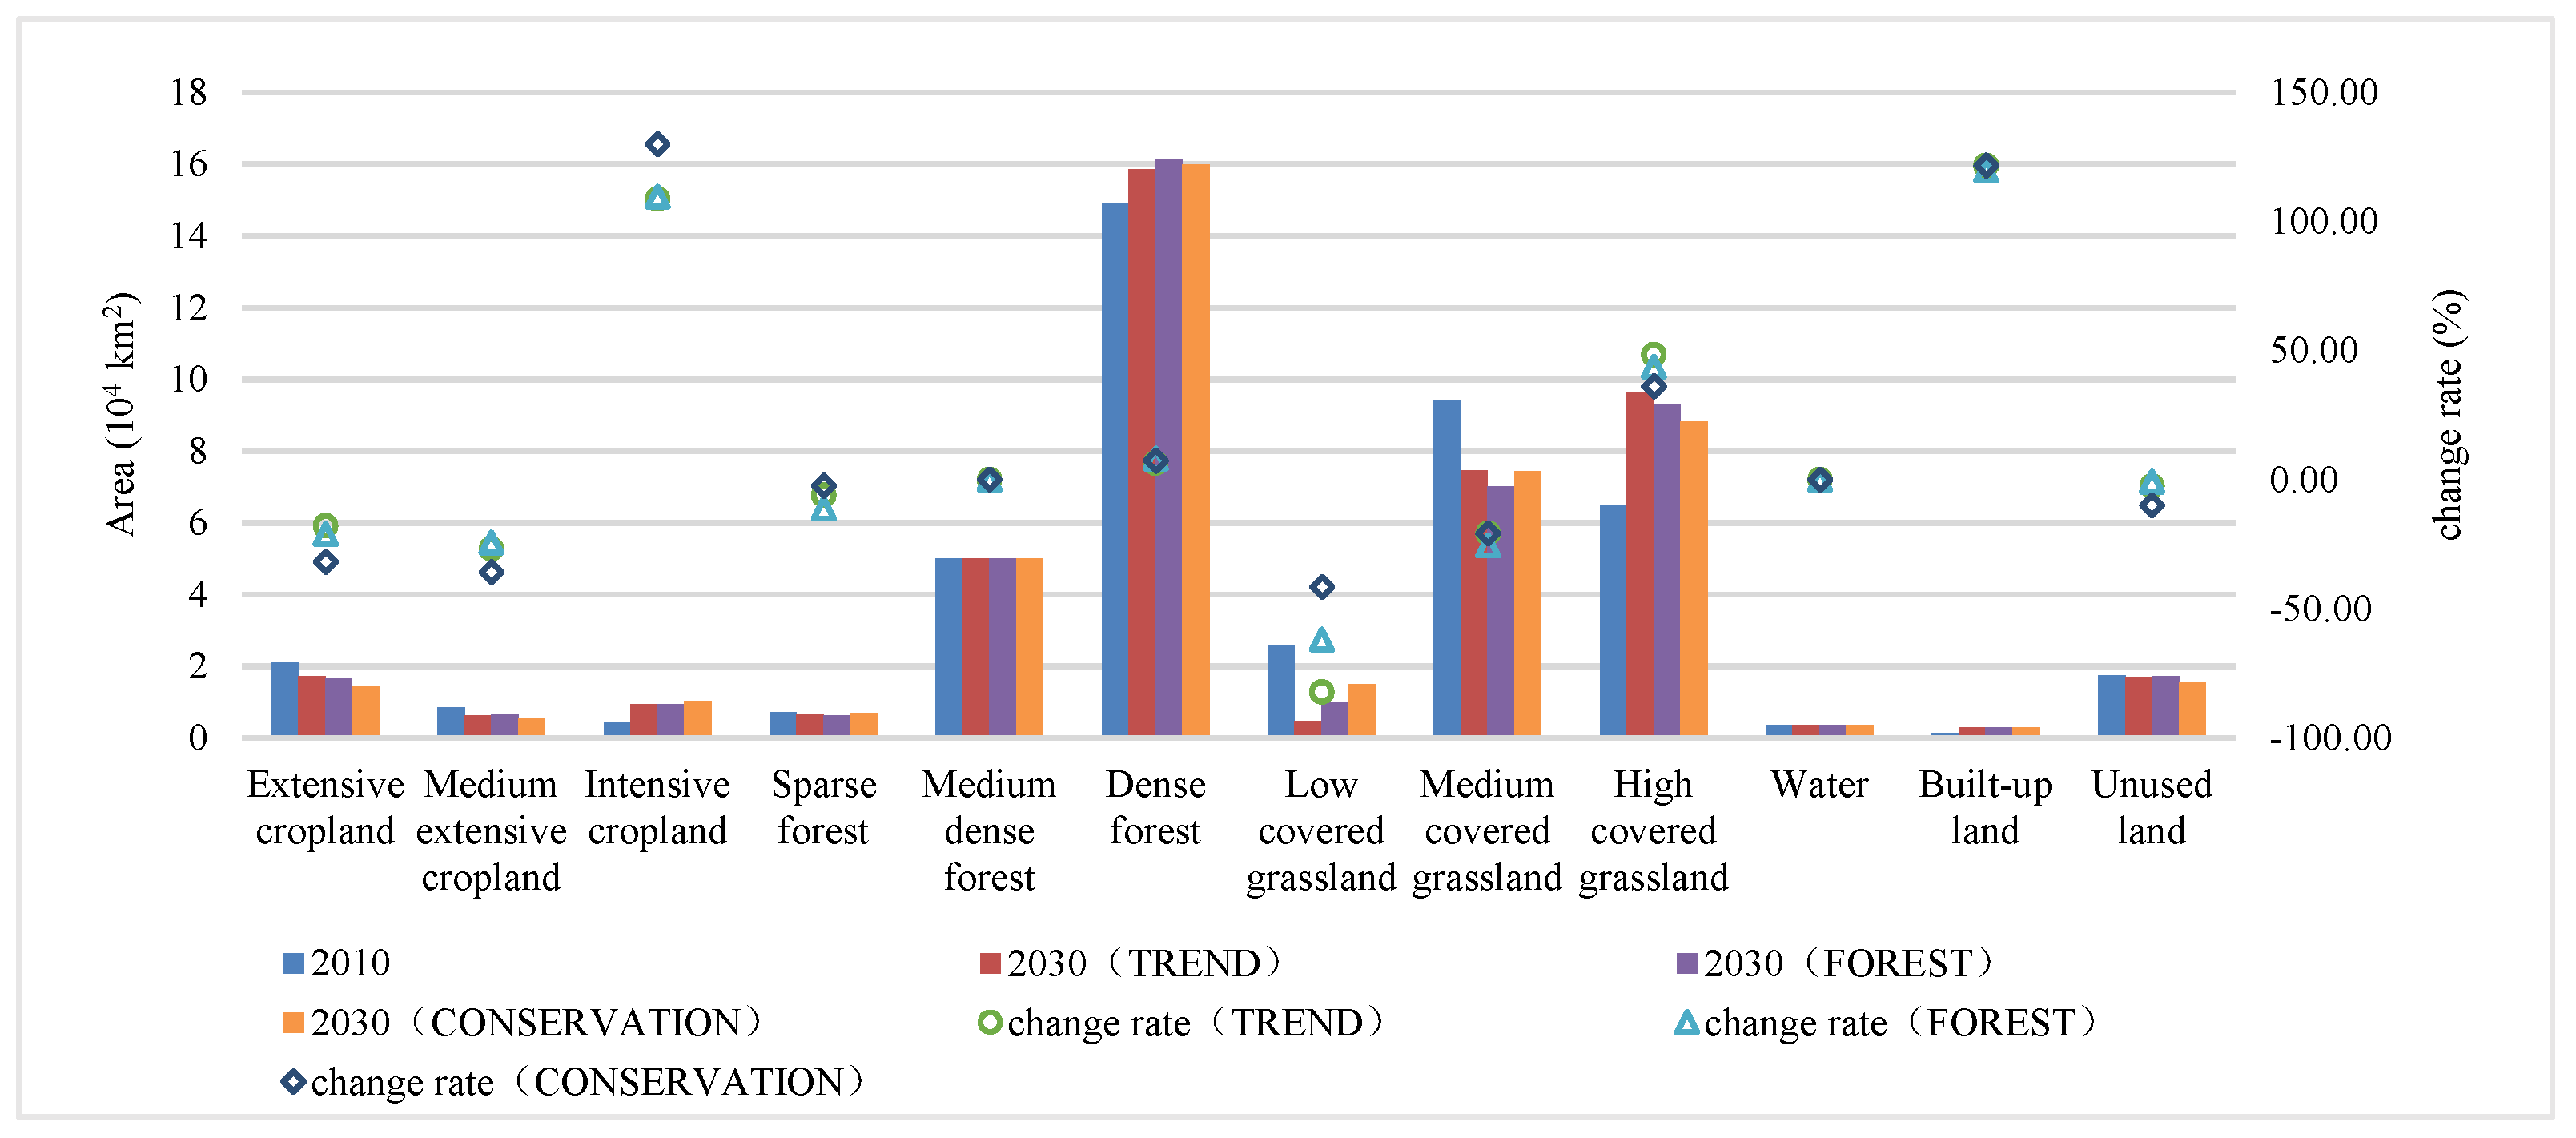
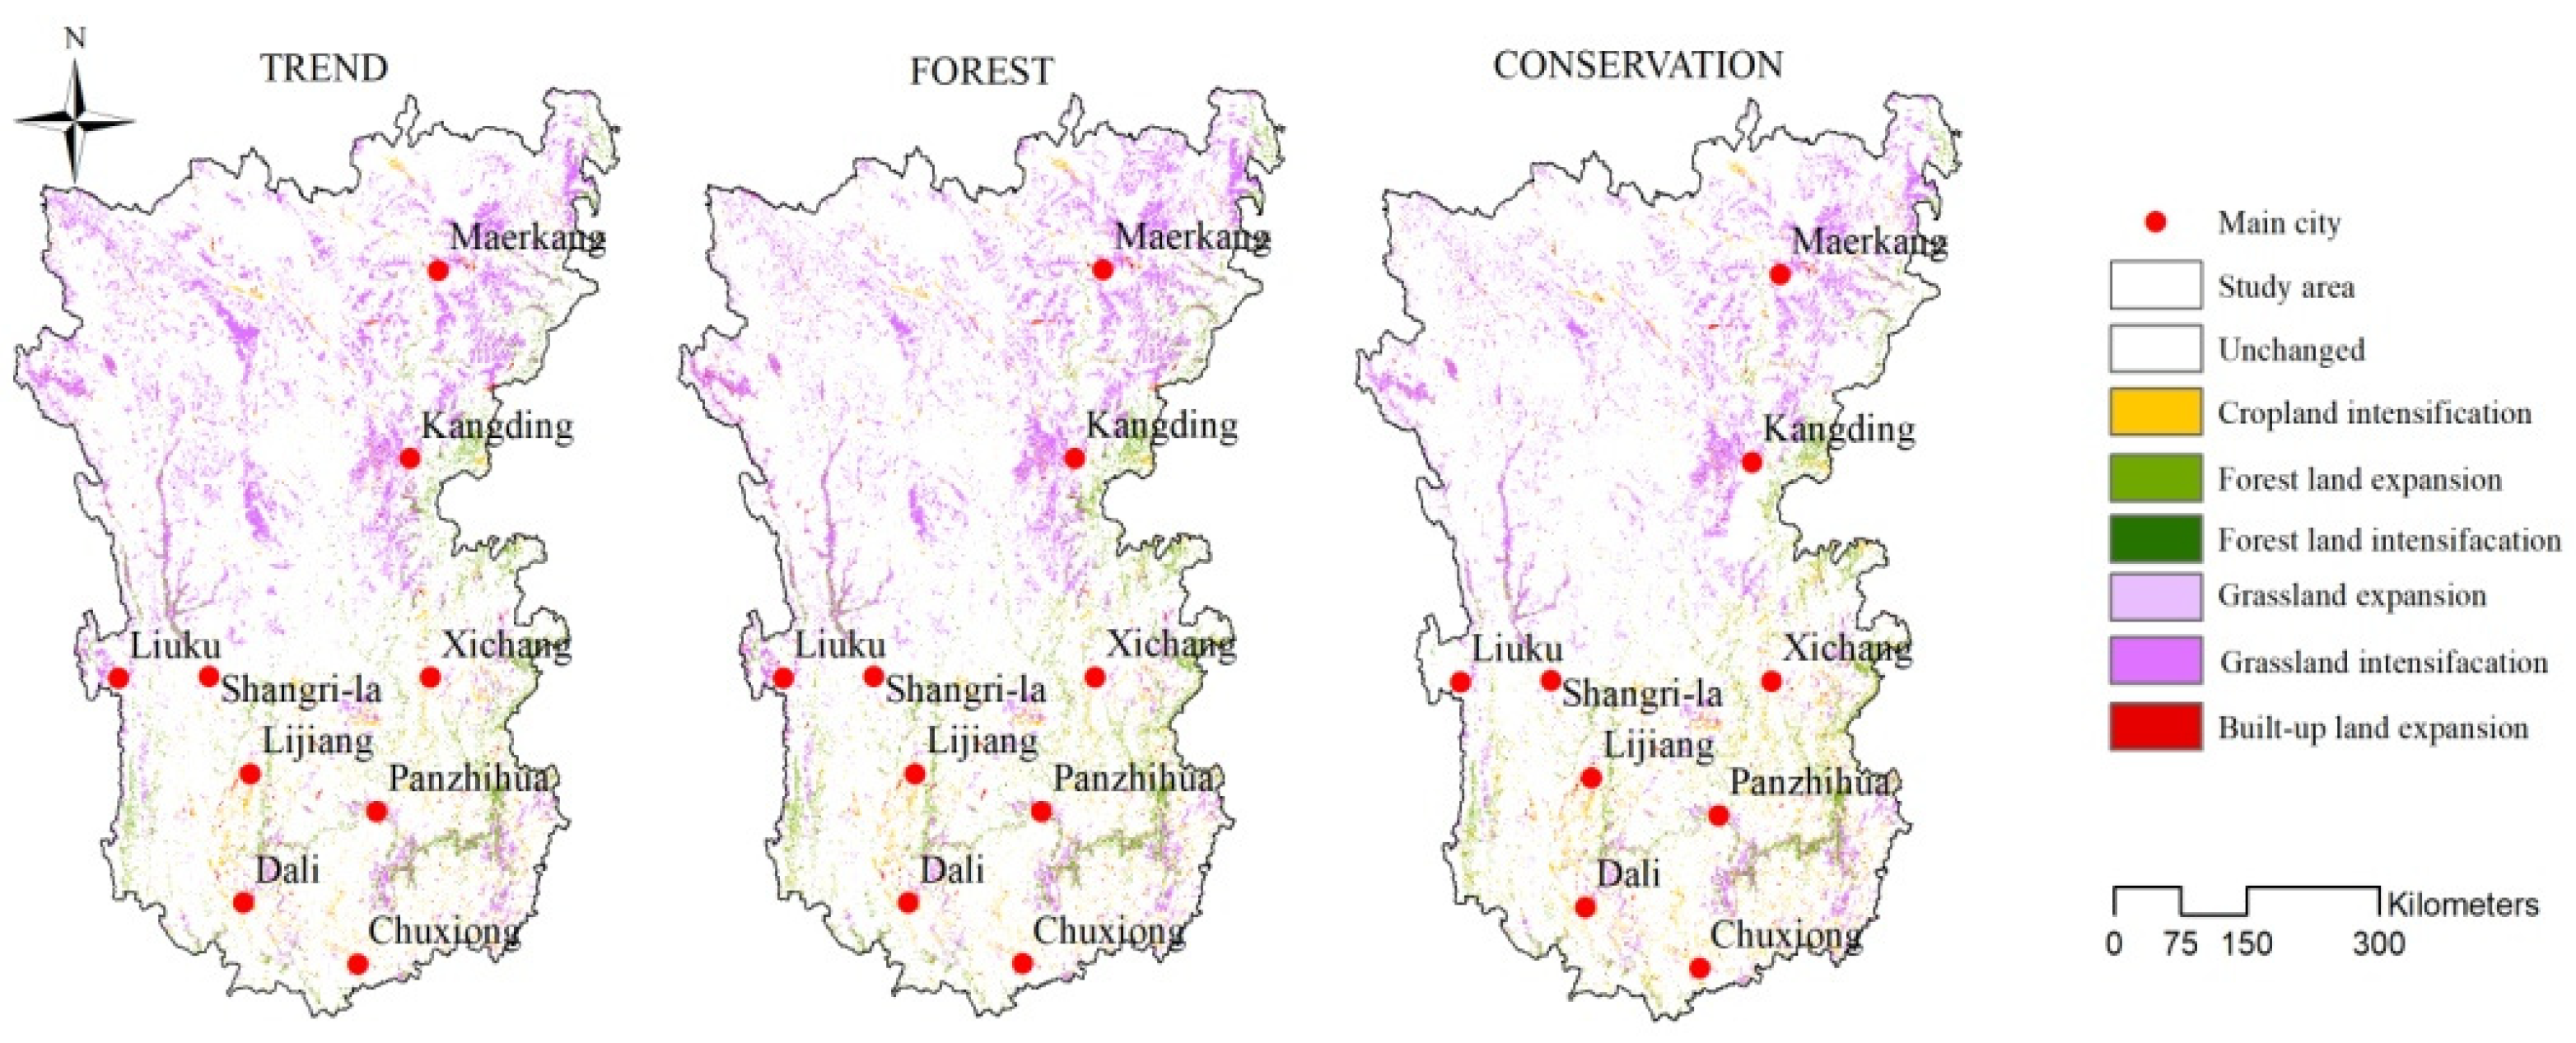
3.2. Characteristics of Changes in Land System under Different Scenarios

The different demands for commodities and services led to different trajectories of change in the land systems in the different scenarios considered (Figure S1). In general, the pattern of distribution of each land system in the Hengduan Mountain region did not change; the southern region was dominated by forest land, the north by grassland, and croplands and built-up land were mainly distributed in low-lying valley areas (Figure 5). The changes in the land system in the Hengduan Mountain region under different scenarios were mainly manifested as the expansion of forest land and the intensification of cropland and grassland. In addition, although the built-up land area in the Hengduan Mountain region was small compared with other land systems, it showed a significant trend of increase under all three scenarios. Furthermore, the area occupied by water and unused land remained relatively stable under all three scenarios (Figure 6).
To meet the growing demand for food, the cropland system underwent a significant increase in area in all three scenarios. A large number of extensive croplands were converted into medium-intensive croplands and intensive croplands, mainly due to the scarcity of croplands in the Hengduan Mountain region. Only intensive development was found to be suitable to meet the increasing demand for food caused by population growth. In general, owing to the rapid increase in ecological land, the intensity of increase in the cropland system was the highest under the CONSERVATION scenario. Although there were differences in the area of land intensification among the scenarios, there was no significant difference in its location, and it was mainly distributed in the low-lying dry–hot valleys in the south (Figure 7).
The implementation of ecological restoration projects is the main cause of the expansion of forest land in the Hengduan Mountain region. Forest land expanded along the Nu River, Lancang River, Jinsha River, and Dadu River south of the Hengduan Mountain region (Figure 7). Of the three scenarios, the area occupied by forests expanded by the most in the FOREST scenario, followed by the TREND and CONSERVATION scenarios.
Affected by the expansion of regional forests and an increase in livestock, the area occupied by grassland systems decreased gradually in all three scenarios, but the trend of intensification was significant, and a large area of low-covered grassland was gradually replaced by high-covered grassland. The intensification in the grassland system was most prominent under the TREND scenario and was closely related to the significant increase in livestock. Figure 7 shows that the intensification of grassland systems was mostly distributed in the northern part of the Hengduan Mountain region and a small part in the southeast. Changes in the locations of such regions were slightly different under different scenarios and might have been related to differences in increases in livestock and certain constraints. For example, the intensification of the grassland systems in nature reserves was not significant under the CONSERVATION scenario.

4. Discussion

4.1. Rationality of Land System Delineation

Using the results of classification of land systems in 2000 as an example, statistical data and NDVI data on crop production were used in this study to validate the accuracy of classification of cropland systems, forest land systems, and grassland systems. For cropland systems, this study selected 30 counties with the highest crop production; calculated their ratios of extensive cropland, medium–extensive cropland, and intensive cropland; and used Pearson’s correlation analysis to assess the relationship between types of cropland and crop production (Figure 8). The results showed that with a decrease in the area of intensive cropland and increase in that of extensive cropland, crop production decreased significantly (r = 0.72, p < 0.01). Moreover, the normalized difference vegetation index (NDVI) was used to evaluate the reasonableness of the classification of the forest land and grassland systems. A one-way analysis of variance and multiple comparison tests using Tukey’s least significant difference method were used to analyze the differences between the forest land and the grassland system, as well as those between forest land (sparse forest, medium dense forest, and dense forest) and the grassland system (low-covered grassland, medium-covered grassland, and high-covered grassland). The results showed significant difference between the mean NDVI between the forest land system and the grassland system (p < 0.05). The results of multiple comparison tests by using Tukey’s least significant difference of the mean NDVI were also significantly different (p < 0.01) (Figure 9). Therefore, the method used to classify land systems based on potential cropland production and the densities of the forest canopy and vegetation cover could be used to distinguish among land systems and reflect the unique land-use status of the Hengduan Mountain region.

4.2. Land Systems under Different Scenarios

The simulation of land systems was intended to clarify the characteristics of their evolution under different policies and measures and to aid understanding of their ecological and environmental effects. In general, the evolutionary characteristics of a land system under the three scenarios in the Hengduan Mountain region involved the expansion of forest land in the south and the grassland in the north during 2000–2010 (Figure S2). The significant difference was that the forest land in the northeastern part of the Hengduan Mountain region expanded significantly from 2000 to 2010, and this might have been related to large-scale afforestation after the Wenchuan earthquake in 2008 [32,33].
For the cropland system, although the General Land-use Planning of Sichuan Province, Yunnan Province, and Tibet Autonomous Region (2006–2020) clearly required strict protection of cropland, this study found that a small number of croplands were still occupied by forest land systems, grassland systems, and built-up land. In addition, extensive cropland had gradually been transformed into medium-intensive cropland and intensive cropland under the three future scenarios, which means that the intensity of land use was expected to gradually increase. Given that the cropland consisted of mainly sloping farmland, and the increased intensity of land use might aggravate soil erosion [34,35,36], stringent measures are needed to protect such areas and reduce the negative ecological effects of an increase in the intensity of land use.
The implementation of ecological restoration projects has caused the area of forest land in the Hengduan Mountain region to expand and soil erosion to reduce, but it has also led to a series of inevitable problems. On the one hand, the expansion of ecological land enhances the regional capacity for water and soil conservation but leads to a decline in the regional water yield [27,37] that exacerbates water shortage in the lower reaches of the Yangtze River. On the other hand, studies have shown that although ecological restoration projects have increased regional forest cover by 32%, native forests have suffered a net loss of 6.6% in Southwestern China from 2000 to 2015 [38]. It is thus clear that forest restoration projects in this area did not help restore the local forest landscape and yield the corresponding environmental benefits. Therefore, land managers need to strengthen the protection of forests and avoid expanding the planting area for them without due consideration.
The grassland system showed a trend of reduction in area and intensification in all three scenarios, especially in the TREND and FOREST scenarios. Although some studies have shown that a moderate increase in the intensity of grazing is beneficial for the quality of grasslands and vegetation coverage [39,40,41], this study found that under constraints related to crop production, intensity of grazing, and area of forest land, low-covered grassland decreased sharply in the area in all scenarios, and long-term high-intensity grazing might cause grassland systems to degrade further. In addition, with reference to the “Hu line,” the population distribution in the Hengduan Mountain region was extremely uneven, and the demand for products of animal husbandry in the southeast was high. This was not matched by the rich grassland resources in the north [42]. It is important for the government to balance the use of grassland resources in different parts of the study area.
An examination of the rule of changes to land systems under the TREND, FOREST, and CONSERVATION scenarios shows that overemphasizing the role of forest land in ecological protection increases the intensity of grassland systems while reducing the area occupied by them. With increasing livestock numbers, this increases the pressure on the grassland system. Therefore, future work on afforestation should seek to strengthen field research and accurately carry out regional afforestation projects. In addition, the implementation of measures for land system management can limit changes in the regional land system, such as in terms of natural habitat and protection of biodiversity, through the establishment of nature reserves under the CONSERVATION scenario. Given the small area of cropland in the study area and the importance of food for regional food security, croplands should protect through spatial planning and stricter policies for cropland protection [43,44,45].

5. Conclusions

Changes in land systems are closely related to regional socioeconomic development, land-use planning, and management policies. Based on the land system as the simulation unit, and by considering multiple demands for commodities and services, this study used the CLUMondo model to simulate the land system in the Hengduan Mountain region under the TREND, FOREST, and CONSERVATION scenarios. In general, cropland and grassland systems in the Hengduan Mountain region were projected to develop intensively while the forest land system was predicted to expand significantly under different scenarios. The rapid increase in livestock was the main cause of the significant intensification of grassland under the TREND scenario, with low-covered grassland decreasing rapidly and high-covered grassland increasing significantly. Under the FOREST scenario, the expansion of forest land came at the cost of a decrease in grassland, while the expansion of ecological land under the CONSERVATION scenario led to a decline in the area of croplands and increase in the intensity of their use. The results here can provide scientific reference for land planning and sustainable management for the Hengduan Mountain region.

Supplementary Materials

The following are available online at https://0-www-mdpi-com.brum.beds.ac.uk/article/10.3390/land10050528/s1, Table S1: Sources of data used in this study, Table S2: Suitability analysis and AUC values of land systems, Table S3: Order of conversion of land systems and services, Table S4: Coefficient of simulation accuracy of different land systems, Figure S1: Land conversion under different future scenarios, Figure S2: Spatial distribution of changes in land system from 2000 to 2010.

Author Contributions

Conceptualization, E.D.; methodology, L.Y.; software, L.Y.; validation, L.Y. and B.Z.; formal analysis, L.Y.; resources, E.D.; writing—original draft preparation, L.Y.; writing—review and editing, L.Y. and B.Z.; supervision, G.X. and B.Z.; funding acquisition, B.Z. All authors have read and agreed to the published version of the manuscript.

Funding

This research was funded by the National Social Science Foundation of China [18BJY086].

Institutional Review Board Statement

Not applicable.

Informed Consent Statement

Not applicable.

Data Availability Statement

The datasets used or analyzed during the current study are available from the corresponding author on reasonable request.

Conflicts of Interest

The authors declare that they have no conflict of interest regarding the publication of this paper.

References

  1. Van Asselen, S.; Verburg, P.H. Land cover change or land-use intensification: Simulating land system change with a global-scale land change model. Glob. Chang. Biol. 2013, 19, 3648–3667. [Google Scholar] [CrossRef]
  2. Gordon, R.M.; Ingram, J.; Mosier, A.; Rodrigue, A.; Singh, R.; Trotman, A. Science Plan and Implementation Strategy; Global Land Project; IGBP Secretariat: Stockholm, Sweden, 2005. [Google Scholar]
  3. Newbold, T.; Hudson, L.N.; Arnell, A.P.; Contu, S.; De Palma, A.; Ferrier, S.; Hill, S.L.L.; Hoskins, A.J.; Lysenko, I.; Phillips, H.R.P. Has land use pushed terrestrial biodiversity beyond the planetary boundary? A global assessment. Science 2016, 353, 288–291. [Google Scholar] [CrossRef]
  4. Gang, H.E.; Cai, Y.L. Advances of researches on relationship between LUCC and soil erosion. Prog. Geogr. 2011, 22, 227–235. [Google Scholar]
  5. Tu, J. Spatially varying relationships between land use and water quality across an urbanization gradient explored by geographically weighted regression. Appl. Geogr. 2011, 31, 376–392. [Google Scholar] [CrossRef]
  6. López, S.; López-Sandoval, M.F.; Gerique, A.; Salazar, J. Landscape change in Southern Ecuador: An indicator-based and multi-temporal evaluation of land use and land cover in a mixed-use protected area. Ecol. Indic. 2020, 115, 106357. [Google Scholar] [CrossRef]
  7. Hasan, M.E.; Zhang, L.; Dewan, A. Spatiotemporal pattern of forest degradation and loss of ecosystem function associated with Rohingya influx: A geospatial approach. Land Degrad. Dev. 2020, 1–18. [Google Scholar] [CrossRef]
  8. Lu, F.; Hu, H.; Sun, W.; Zhu, J.; Liu, G.; Zhou, W.; Zhang, Q.; Shi, P.; Liu, X.; Wu, X. Effects of national ecological restoration projects on carbon sequestration in China from 2001 to 2010. Proc. Natl. Acad. Sci. USA 2018, 115, 4039–4044. [Google Scholar] [CrossRef] [Green Version]
  9. Ouyang, Z.; Zheng, H.; Xiao, Y.; Polasky, S.; Liu, J.; Xu, W.; Wang, Q.; Zhang, L.; Xiao, Y.; Rao, E. Improvements in ecosystem services from investments in natural capital. Science 2016, 352, 1455–1459. [Google Scholar] [CrossRef]
  10. Chen, F.J.; Shen, Y.J.; Qian, L.I.; Guo, Y.; Li-Mei, X.U. Spatio-temporal variation analysis of ecological systems NPP in China in past 30 years. Sci. Geol. Sin. 2011, 31, 1409–1414. [Google Scholar]
  11. Shi, Z.; Deng, W.; Zhang, S. Spatio-temporal pattern changes of land space in Hengduan Mountains during 1990–2015. J. Geo. Sci. 2018, 28, 529–542. [Google Scholar] [CrossRef] [Green Version]
  12. He, C.; Liu, Z.; Xu, M.; Ma, Q.; Dou, Y. Urban expansion brought stress to food security in China: Evidence from decreased net primary productivity. Sci. Total Environ. 2017, 576, 660–670. [Google Scholar] [CrossRef] [PubMed]
  13. Ediger, L.; Chen, H. Upland China in transition: The impacts of afforestation on landscape patterns and livelihoods. Mt. Res. Dev. 2006, 26, 220–226. [Google Scholar] [CrossRef]
  14. Veldkamp, A.; Verburg, P.H. Modelling land use change and environmental impact. J. Environ. Manag. 2004, 72, 1–3. [Google Scholar] [CrossRef]
  15. Parker, D. Multi-agent systems for the simulation of land-use and land-covered change: A review. Ann. Assoc. Am. Geogr. 2003, 93, 314–337. [Google Scholar] [CrossRef] [Green Version]
  16. Dai, E.F.; Ma, L. Review on land change modeling approaches. Prog. Geogr. 2018, 37, 152–162. [Google Scholar]
  17. Ornetsmuller, C.; Verburg, P.H.; Heinimann, A. Scenarios of land system change in the LAO PDR: Transitions in response to alternative demands on goods and services provided by the land. Appl. Geogr. 2016, 75, 1–11. [Google Scholar] [CrossRef] [Green Version]
  18. Jin, X.; Jiang, P.; Ma, D.; Li, M. Land system evolution of Qinghai-Tibetan Plateau under various development strategies. Appl. Geogr. 2019, 104, 1–9. [Google Scholar] [CrossRef]
  19. Van Asselen, S.; Verburg, P.H. A land system representation for global assessments and land-use modeling. Glob. Chang. Biol. 2012, 18, 3125–3148. [Google Scholar] [CrossRef] [PubMed] [Green Version]
  20. Liu, Z.F.; Verburg, P.H.; Wu, J.; He, C. Understanding land system change through scenario-based simulations: A case study from the drylands in northern China. Environ. Manag. 2017, 59, 440–454. [Google Scholar] [CrossRef] [PubMed]
  21. Wolff, S.; Schrammeijer, E.; Schulp, C.J.E.; Verburg, P.H. Meeting global land restoration and protection targets: What would the world look like in 2050? Glob. Environ. Chang. 2018, 52, 259–272. [Google Scholar] [CrossRef]
  22. Chen, G.J. Economic conditions and approaches to development in mountain regions in south central China. Mt. Res. Dev. 2000, 20, 300–305. [Google Scholar]
  23. Cao, S.; Wang, Y.; Duan, F. Coupling between ecological vulnerability and economic poverty in contiguous destitute areas, China: Empirical analysis of 714 poverty-stricken counties. J. Appl. Ecol. 2016, 027, 2614–2622. [Google Scholar]
  24. Tasser, E.; Leitinger, G.; Tappeiner, U. Climate change versus land-use change—What affects the mountain landscapes more? Land Use Policy 2017, 60, 60–72. [Google Scholar] [CrossRef]
  25. Liu, G.; Wang, H.; Cheng, Y. The impact of rural out-migration on arable land use intensity: Evidence from mountain areas in Guangdong, China. Land Use Policy 2016, 59, 569–579. [Google Scholar] [CrossRef]
  26. Chen, T.; Peng, L.; Wang, Q.; Liu, S. Measuring the coordinated development of ecological and economic systems in Hengduan Mountain area. Sustainability 2017, 9, 1270. [Google Scholar] [CrossRef] [Green Version]
  27. Dai, E.; Yin, L.; Wang, Y.; Ma, L.; Tong, M. Quantitative assessment of the relative impacts of land use and climate change on the key ecosystem services in the Hengduan Mountain region, China. Sustainability 2020, 12, 4100. [Google Scholar] [CrossRef]
  28. Li, Z.X.; He, Y.Q.; Xin, H.J.; Wang, C.F.; Jia, W.X.; Zhang, W.; Liu, J. Spatio-temporal variations of temperature and precipitation in Mts. Hengduan region during 1960–2008. Acta Geogr. Sin. 2010, 27, 980–986. [Google Scholar]
  29. Liu, L.; Xu, X.; Chen, X. Assessing the impact of urban expansion on potential crop yield in China during 1990–2010. Food Secur. 2015, 7, 33–43. [Google Scholar] [CrossRef] [Green Version]
  30. Hansen, M.C.; Potapov, P.V.; Moore, R.; Hancher, M.; Turubanova, S.A.; Tyukavina, A.; Thau, D.; Stehman, S.V.; Goetz, S.J.; Loveland, T.R.; et al. High-resolution global maps of 21st-century forest cover change. Science 2013, 342, 850–853. [Google Scholar] [CrossRef] [PubMed] [Green Version]
  31. Mu, X.; Hu, M.; Song, W.; Ruan, G.; Ge, Y.; Wang, J.; Huang, S.; Yan, G. Evaluation of sampling methods for validation of remotely sensed fractional vegetation cover. Remote Sens. 2015, 7, 16164–16182. [Google Scholar] [CrossRef] [Green Version]
  32. Zhang, J.; Hull, V.; Huang, J.; Yang, W.; Zhou, S.; Xu, W.; Huang, Y.; Ouyang, Z.; Zhang, H.; Liu, J. Natural recovery and restoration in giant panda habitat after the Wenchuan earthquake. Forest Ecol. Manag. 2014, 319, 1–9. [Google Scholar] [CrossRef]
  33. Ren, H.; Lu, H.; Wang, J.; Liu, N.; Guo, Q. Forest restoration in China: Advances, obstacles, and perspectives. Tree For. Sci. Biotech. 2012, 6, 7–16. [Google Scholar]
  34. Sun, W.; Shao, Q.; Liu, J.; Zhai, J. Assessing the effects of land use and topography on soil erosion on the loess plateau in China. CATENA 2014, 121, 151–163. [Google Scholar] [CrossRef]
  35. Peng, T.; Wang, S.-J. Effects of land use, land cover and rainfall regimes on the surface runoff and soil loss on karst slopes in southwest China. CATENA 2012, 90, 53–62. [Google Scholar] [CrossRef]
  36. Wang, S.J.; Liu, M.; Zhang, D.F. Karst rocky desertification in southwestern China: Geomorphology, land use, impact and rehabilitation. Land Degrad. Dev. 2004, 15, 115–121. [Google Scholar] [CrossRef]
  37. Li, J.; Liu, D.; Wang, T.; Li, Y.; Wang, S.; Yang, Y.; Wang, X.; Guo, H.; Peng, S.; Ding, J. Grassland restoration reduces water yield in the headstream region of Yangtze River. Sci. Rep. 2017, 7, 2162. [Google Scholar] [CrossRef]
  38. Hua, F.; Wang, L.; Fisher, B.; Zheng, X.; Wang, X.; Yu, D.W.; Tang, Y.; Zhu, J.; Wilcove, D.S. Tree plantations displacing native forests: The nature and drivers of apparent forest recovery on former croplands in southwestern China from 2000 to 2015. Biol. Conserv. 2018, 222, 113–124. [Google Scholar] [CrossRef]
  39. Lu, X.; Kelsey, C.K.; Yan, Y.; Sun, J.; Wang, X.; Cheng, W. Effects of grazing on ecosystem structure and function of alpine grasslands in Qinghai–Tibetan Plateau: A synthesis. Ecosphere 2017, 8, 1–16. [Google Scholar] [CrossRef]
  40. Miao, L.; Sun, Z.; Ren, Y.; Schierhorn, F.; Müller, D. Grassland greening on the Mongolian Plateau despite higher grazing intensity. Land Degrad. Dev. 2021, 32, 792–802. [Google Scholar] [CrossRef]
  41. Yin, L.; Dai, E.; Zheng, D.; Wang, Y.; Tong, M. What drives the vegetation dynamics in the Hengduan Mountain region, southwest China: Climate change or human activity? Ecol. Indic. 2020, 112, 106013. [Google Scholar] [CrossRef]
  42. Qi, W.; Liu, S.; Zhao, M. Study on the stability of hu line and different spatial patterns of population growth on its both sides. Acta Geogr. Sin. 2015, 70, 551–566. [Google Scholar]
  43. Tobias, S.; Price, B. How effective is spatial planning for cropland protection? An assessment based on land-use scenarios. Land 2020, 9, 43. [Google Scholar] [CrossRef] [Green Version]
  44. Li, X.; Qu, F.; Tan, R. Research on the variations and protection of the cropland in China. J. Nat. Resour. 2009, 24, 387–401. [Google Scholar]
  45. Guo, X.; Chang, Q.; Xiao, L.; Zhang, Y. Multi-dimensional eco-land classification and management for implementing the ecological redline policy in China. Land Use Policy 2018, 74, 15–31. [Google Scholar] [CrossRef]
Figure 1. Location and land-use (2015) map of the Hengduan Mountain region.
Land 10 00528 g001
Figure 2. Research framework of this study.
Land 10 00528 g002
Figure 3. Approaches to land system delineation.
Land 10 00528 g003
Figure 4. Results of land system delineation in (a) 2000, (b) 2010.
Land 10 00528 g004
Figure 5. Spatial distribution of the land system in 2010 and different scenarios.
Land 10 00528 g005
Figure 6. Relative change rates of land system under different scenarios compared with their state in 2010.
Land 10 00528 g006
Figure 7. Spatial distribution of changes to the land system under different scenarios.
Land 10 00528 g007
Figure 8. Validation of results of cropland classification. The histogram represents the ratios of different types in the cropland system; the green dots show total crop production at the county level, and the black dotted line shows the results of linear fitting.
Land 10 00528 g008
Figure 9. Validation of the results of classification of the forest land and grassland systems. The red point represents the mean NDVI, and the five horizontal lines from top to bottom represent the upper limit, upper quartile, middle value, lower quartile, and lower limit of the NDVI.
Land 10 00528 g009
Table 1. Growth rates of demands for land use under different scenarios (%/year).
ScenariosCrop Production (t)Livestock Numbers (h)Built-Up Land (km2)Forest Land (km2)Ecological Land (km2)Restricted Areas
TREND1.00%0.30%4.00%0.20%--
FOREST1.00%0.15%4.00%0.25%--
CONSERVATION1.00%0.15%4.00%0.20%0.05%nature reserves
Publisher’s Note: MDPI stays neutral with regard to jurisdictional claims in published maps and institutional affiliations.

