Article

Plant Diversity in the Dynamic Mosaic Landscape of an Agricultural Heritage System: The Minabe-Tanabe Ume System

1
Faculty of Systems Engineering, Wakayama University, Sakaedani 930, Wakayama 640-8510, Japan
2
Osaka Branch Office, Ryokusei Research Institute Inc., Minami-Sakurazuka 2-6-30, Toyonaka, Osaka 561-0882, Japan
3
Wakayama Prefectural Museum of Natural History, Funo 370-1, Kainan, Wakayama 642-0001, Japan
4
Faculty of Life Sciences, Kyoto Sangyo University, Motoyama, Kamigamo, Kita Ward, Kyoto 603-8555, Japan
*
Author to whom correspondence should be addressed.
Submission received: 1 May 2021 / Revised: 21 May 2021 / Accepted: 22 May 2021 / Published: 26 May 2021
(This article belongs to the Section Landscape Ecology)

Abstract

:
The Minabe-Tanabe Ume System in central Japan is defined as a Globally Important Agricultural Heritage System (GIAHS) by the United Nations Food and Agriculture Organization. This study examined relationships between parcel-level plant diversity and land use, management, and development in traditional sloped Ume (Japanese apricot; Prunus mume) orchards and adjoining level orchards recently developed through large-scale cut-fill land development. We constructed and overlaid past (1974) and present (2015) digital land-use maps to assess land use and topography. We conducted field vegetation surveys in land parcels with different development and management histories. Although 249 ha (4.6% of the total 2015 area) were developed using cut-fill methods, 5148 ha remain a traditional orchard surrounded by coppice forests. Vegetation surveys and a two-way indicator species analysis revealed that traditional orchards had more native species and a higher plant diversity index. Cut-fill orchards contained a higher proportion of alien species; however, the degree depended on parcel history and management. Overall, this area remains a dynamic mosaic landscape containing a core of long-standing Ume orchards. We suggest that biodiversity conservation in this area should focus on conservation measures such as indirect land-use regulations, including some acceptable landform transformations, to promote continued farming of this ecologically important area.

1. Introduction

Traditional agricultural dynamic mosaic landscapes around the world are attracting increasing scientific and public attention as land-use systems with long-term sustainability and high biodiversity [1], ranging from tropical agroforestry [2] and wetland mosaics [3] to temperate satoyama ecosystems [4]. Since 2002, the United Nations Food and Agriculture Organization (FAO) has been selecting Globally Important Agricultural Heritage Systems (GIAHS) in order to promote local sustainable land-use systems [5]. The GIAHS scheme emphasizes dynamic landscape conservation measures that involve positive human management over systems that only protect the target area, which is sometimes seen in UNESCO World Heritage schemes. This dynamic approach to conservation emphasizes the sustainability of a total land-use system, thereby allowing changes to landscape elements and installation of new agricultural technologies (within bounds that prevent future destruction of the total land-use system) that support the daily needs and continuous livelihoods of the local people [6].
Nevertheless, in some cases, the conflicts between agricultural modernization and intensification and traditional cultural landscape conservation remain dominant [7]. Moreover, both during the GIAHS application process and after recognition, there are few criteria to distinguish modernization elements and traditional elements, making it difficult to evaluate the overall sustainability of the land-use system [8]. Although agricultural land-use systems might change over time, in many GIAHS and other dynamic conservation scheme sites, long-term landscape changes are understudied, and the dynamic equilibrium of the target conservation landscape is vague, resulting in emphasis of contemporary scenic elements over the dynamics of the system as a whole [9]. In general, local people and the GIAHS promotion authority tend to focus on the value of the GIAHS designation for local economic revitalization [10], with less consideration of biodiversity and ecosystem services, which are also key criteria in the GIAHS scheme [11]. Thus, balancing these elements in a manner based on scientific evidence remains challenging in the current and candidate GIAHS sites [8].
We used the Minabe-Tanabe Ume system, which is a dynamic landscape mosaic due to long-standing parcel-level land-use management [11], as a case study site. We examined the spatiotemporal transitions of forest–orchard–rice fields landscape mosaics in an area including both traditional and intensified modern agricultural land uses at a regional scale using GIS. We identified representative sample sites that included both traditional and modern land uses and investigated natural and anthropogenic topographic conditions at a parcel-level scale. We also conducted a field vegetation survey at several sites with different land-use histories and management conditions, and performed vegetation diversity analysis (Simpson’s diversity index) and a two-way indicator species analysis (TWINSPAN). Finally, we compared the vegetation patterns with land-use history and management and analyzed how to balance traditional and intensified land-use mosaic patterns to maximize local biodiversity as well as socioeconomic vitality.

2. Materials and Methods
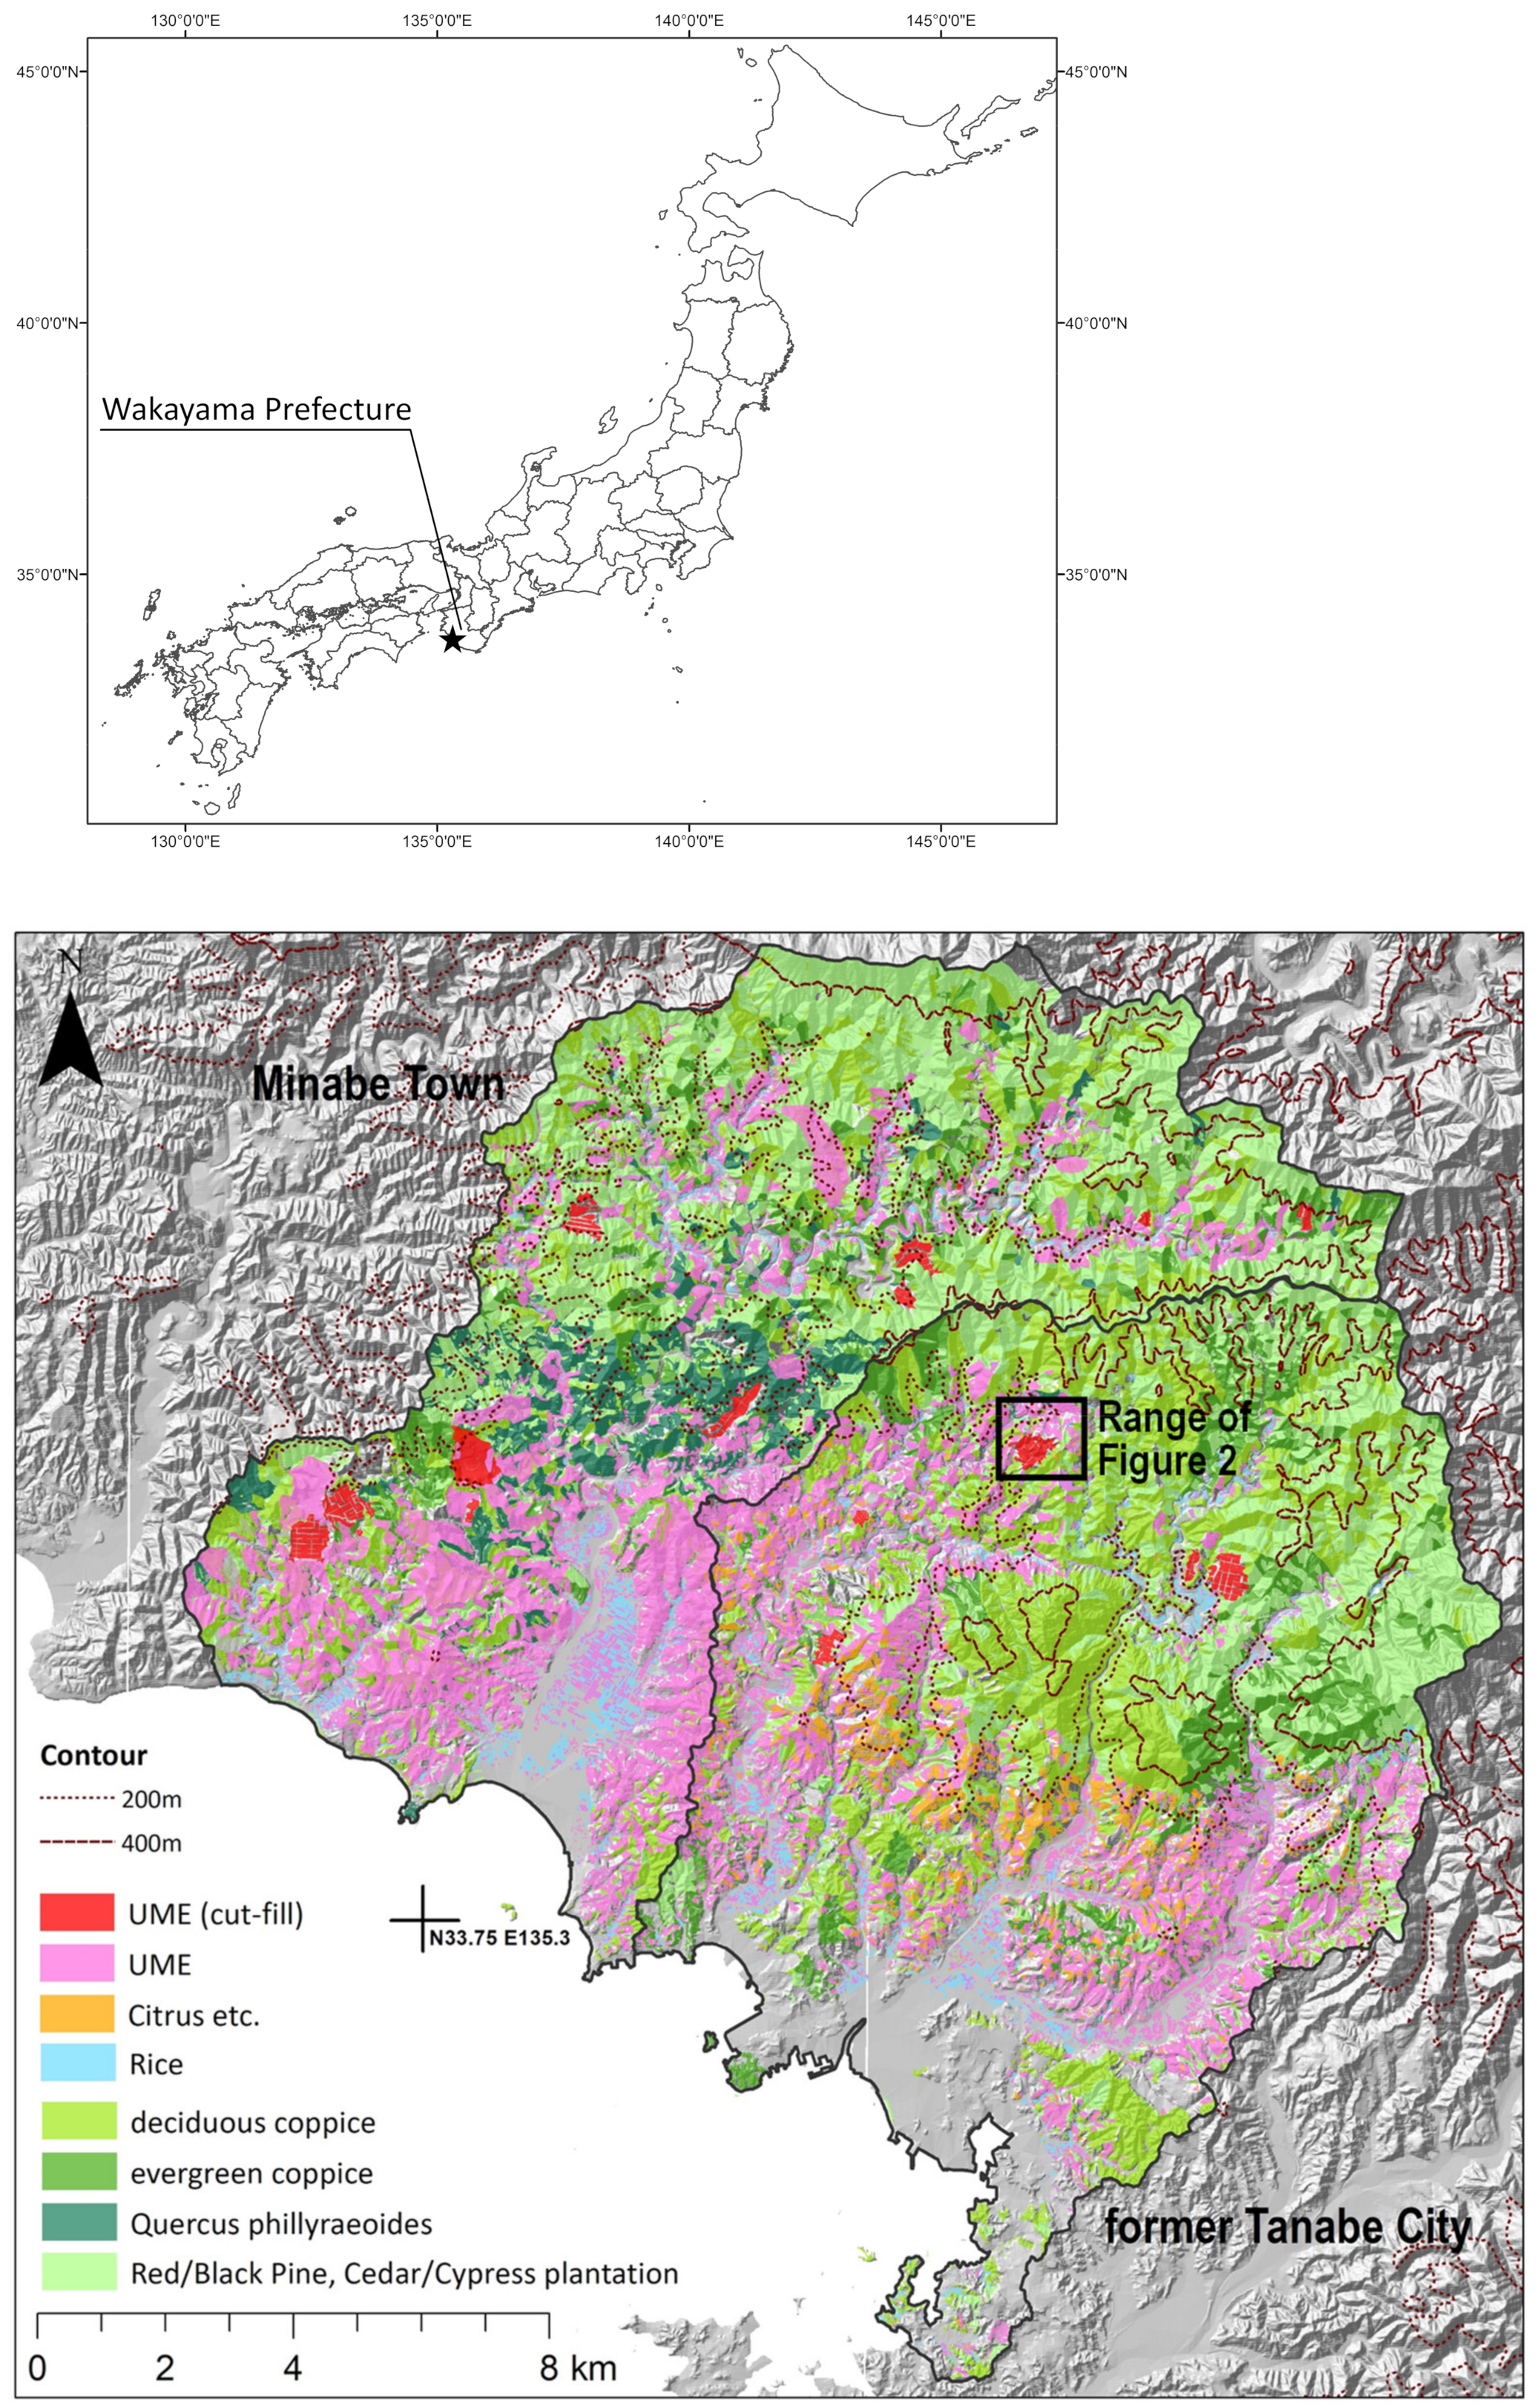
2.1. Study Area

The Minabe-Tanabe Ume System is in the Wakayama Prefecture, in the southern part of the Kii Peninsula in central Japan. The climate is humid and temperate, with an average temperature of 16.6 °C and annual precipitation of about 2000 mm [11]. The GIAHS site (designated on 15 December 2015) had a population of 79,563 in 2010 [11] and includes all of Minabe Town and the western part of Tanabe City (the original Tanabe City area before the municipality merger in 2005). Unlike other large cities in Japan (including Tokyo and Osaka) that are sited on large alluvial plains with historical rice-producing land and many original populations, the Minabe-Tanabe area has a limited area of plains surrounded by hills and mountainous areas with relatively flat ridges and steep slopes (Figure 1). This area, with the exception of the small valley plain, is unsuitable for rice production. About 400 years ago, the inhabitants of the region began to grow Ume (Prunus mume, Japanese apricot), one of the few crops that could be cultivated on this terrain, while preserving and utilizing the surrounding mixed woods as coppice forests (Figure 1). By maintaining the woods around the Ume orchards and along the ridges of steep slopes, the inhabitants have helped to conserve watersheds, supply nutrients, and prevent slope collapse, thereby supporting Ume production. Allowing grass to grow in Ume orchards also prevents soil desiccation and erosion, and mown grass is returned to the soil to fertilize the Ume. Moreover, coppice forests provide habitat for Japanese honeybees (Apis cerana japonica), and the local inhabitants have long used a unique type of beehive to attract these bees and enlist their help in pollinating the Ume. At the same time, Ume trees are a valuable source of nectar because they bloom in early spring and help honeybee colonies get off to a good start. Because various coppice forest trees and shrubs that flower after Ume trees are also nectar sources, the honeybee population is maintained by a year-round supply of nectar and pollen from a large variety of vegetation types (Figure 1).

2.2. Creating the Map of Past Land Uses

To understand the land-use dynamics, we produced a map of land uses in 1974. We used an existing 2015 land-use dataset [11] as a base map and overlaid it with a 1974 color ortho aerial photograph provided by the Geospatial Information Authority of Japan (GSI) [12]. We added the 1974 land-use attribution for each parcel by onscreen visual interpretation. In this way, we attributed a past land-use type to each of the 35,299 land parcels. Next we overlaid the land-use maps for these two periods and identified changes in the pattern of Ume cultivation. We selected two sites for our field topographic and vegetation surveys, one traditional and one cut-fill Ume orchard (Figure 2). The sites are within the core site that underwent the GIAHS evaluation process and we have a very good history of cooperation with locals through our research and onsite education program [11].

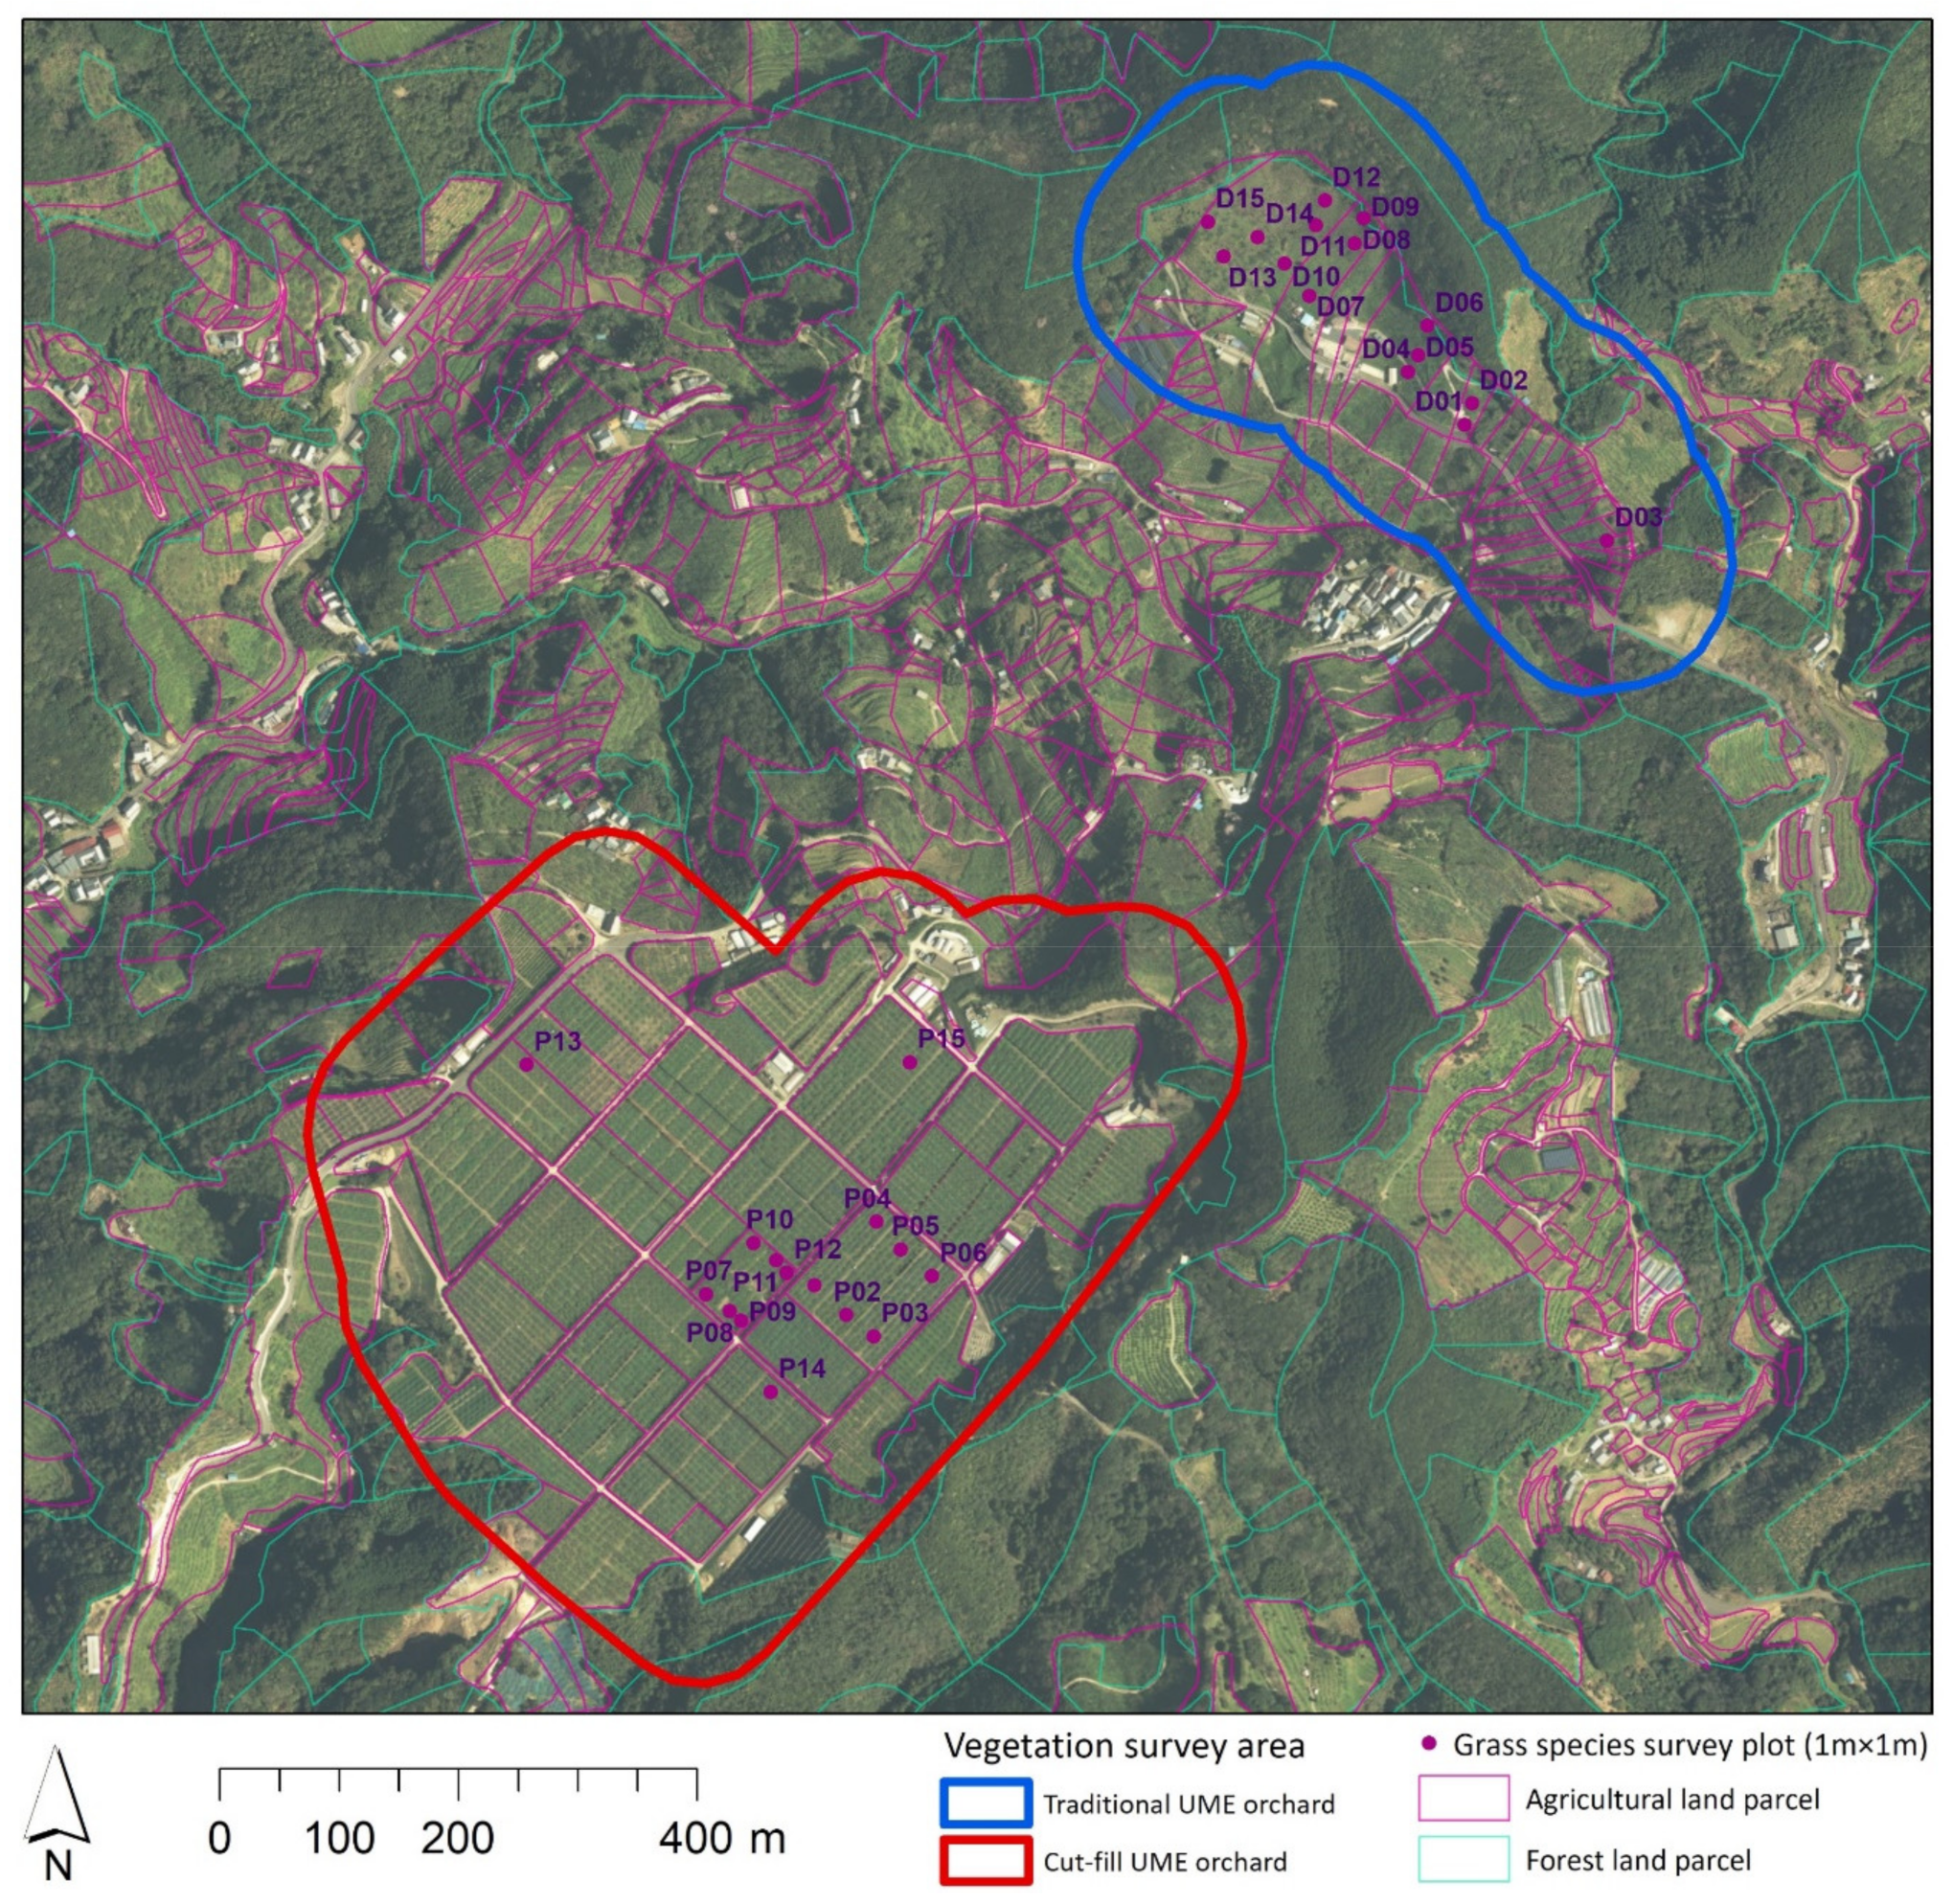
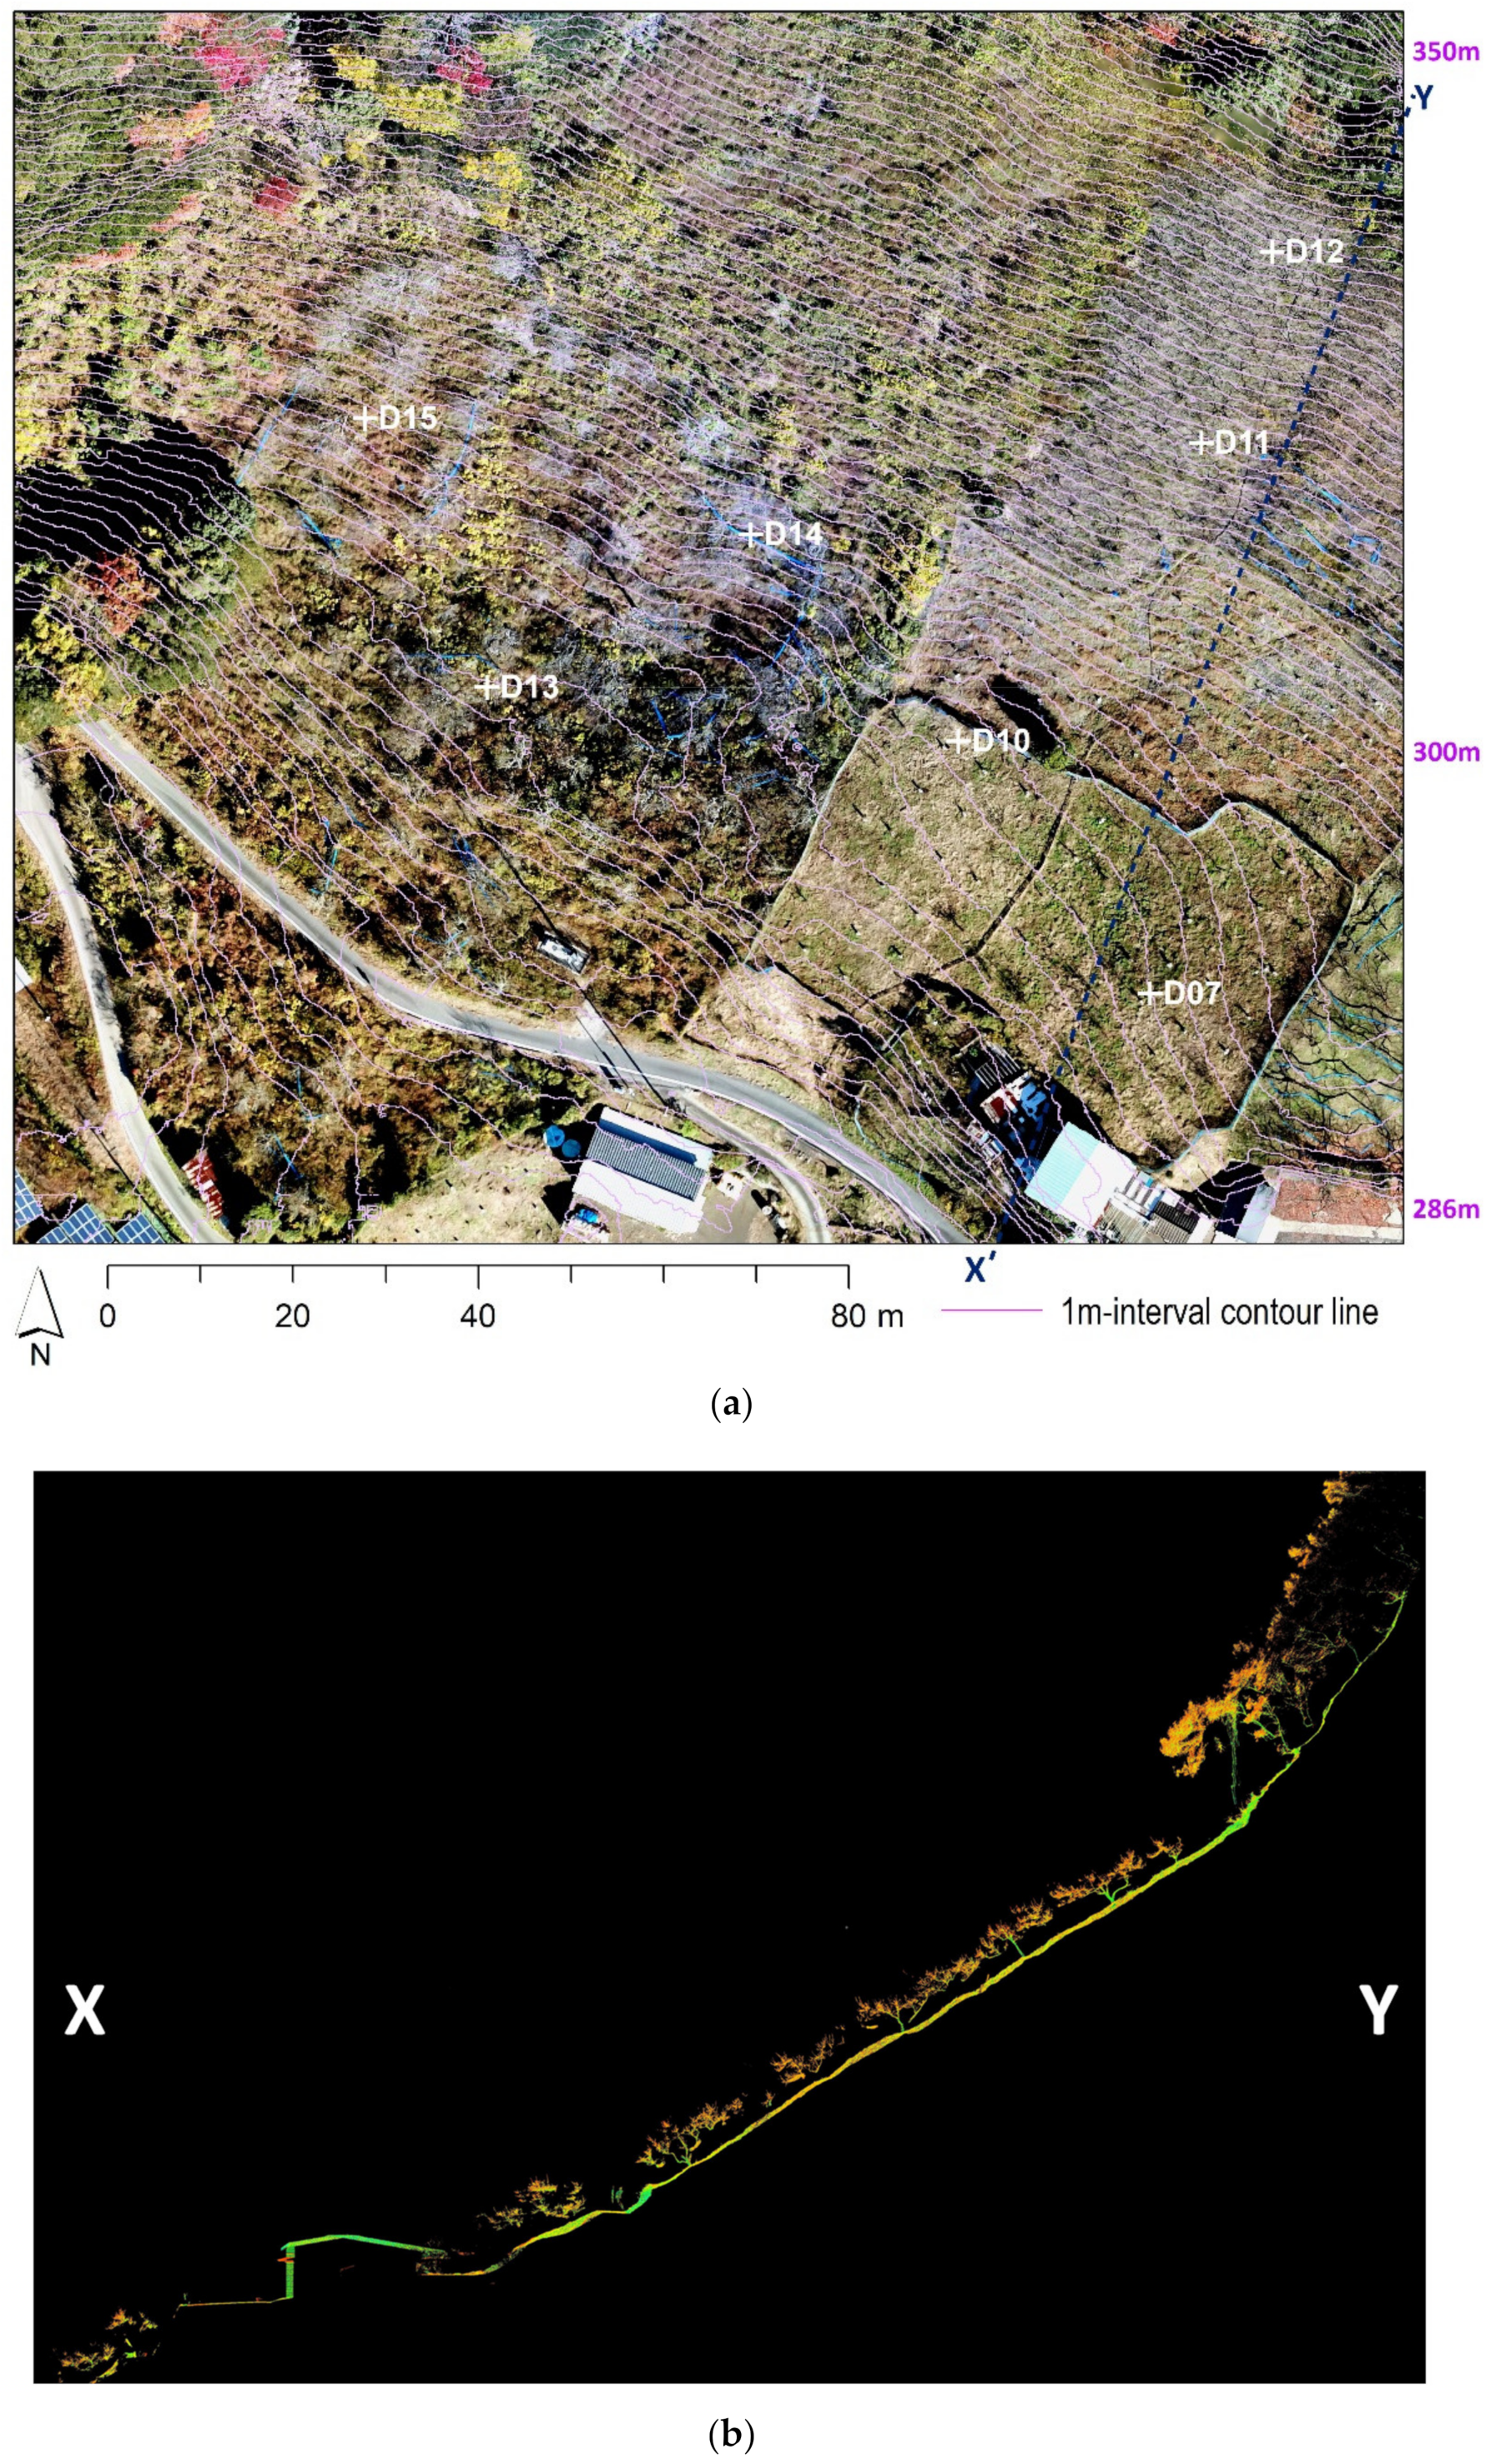
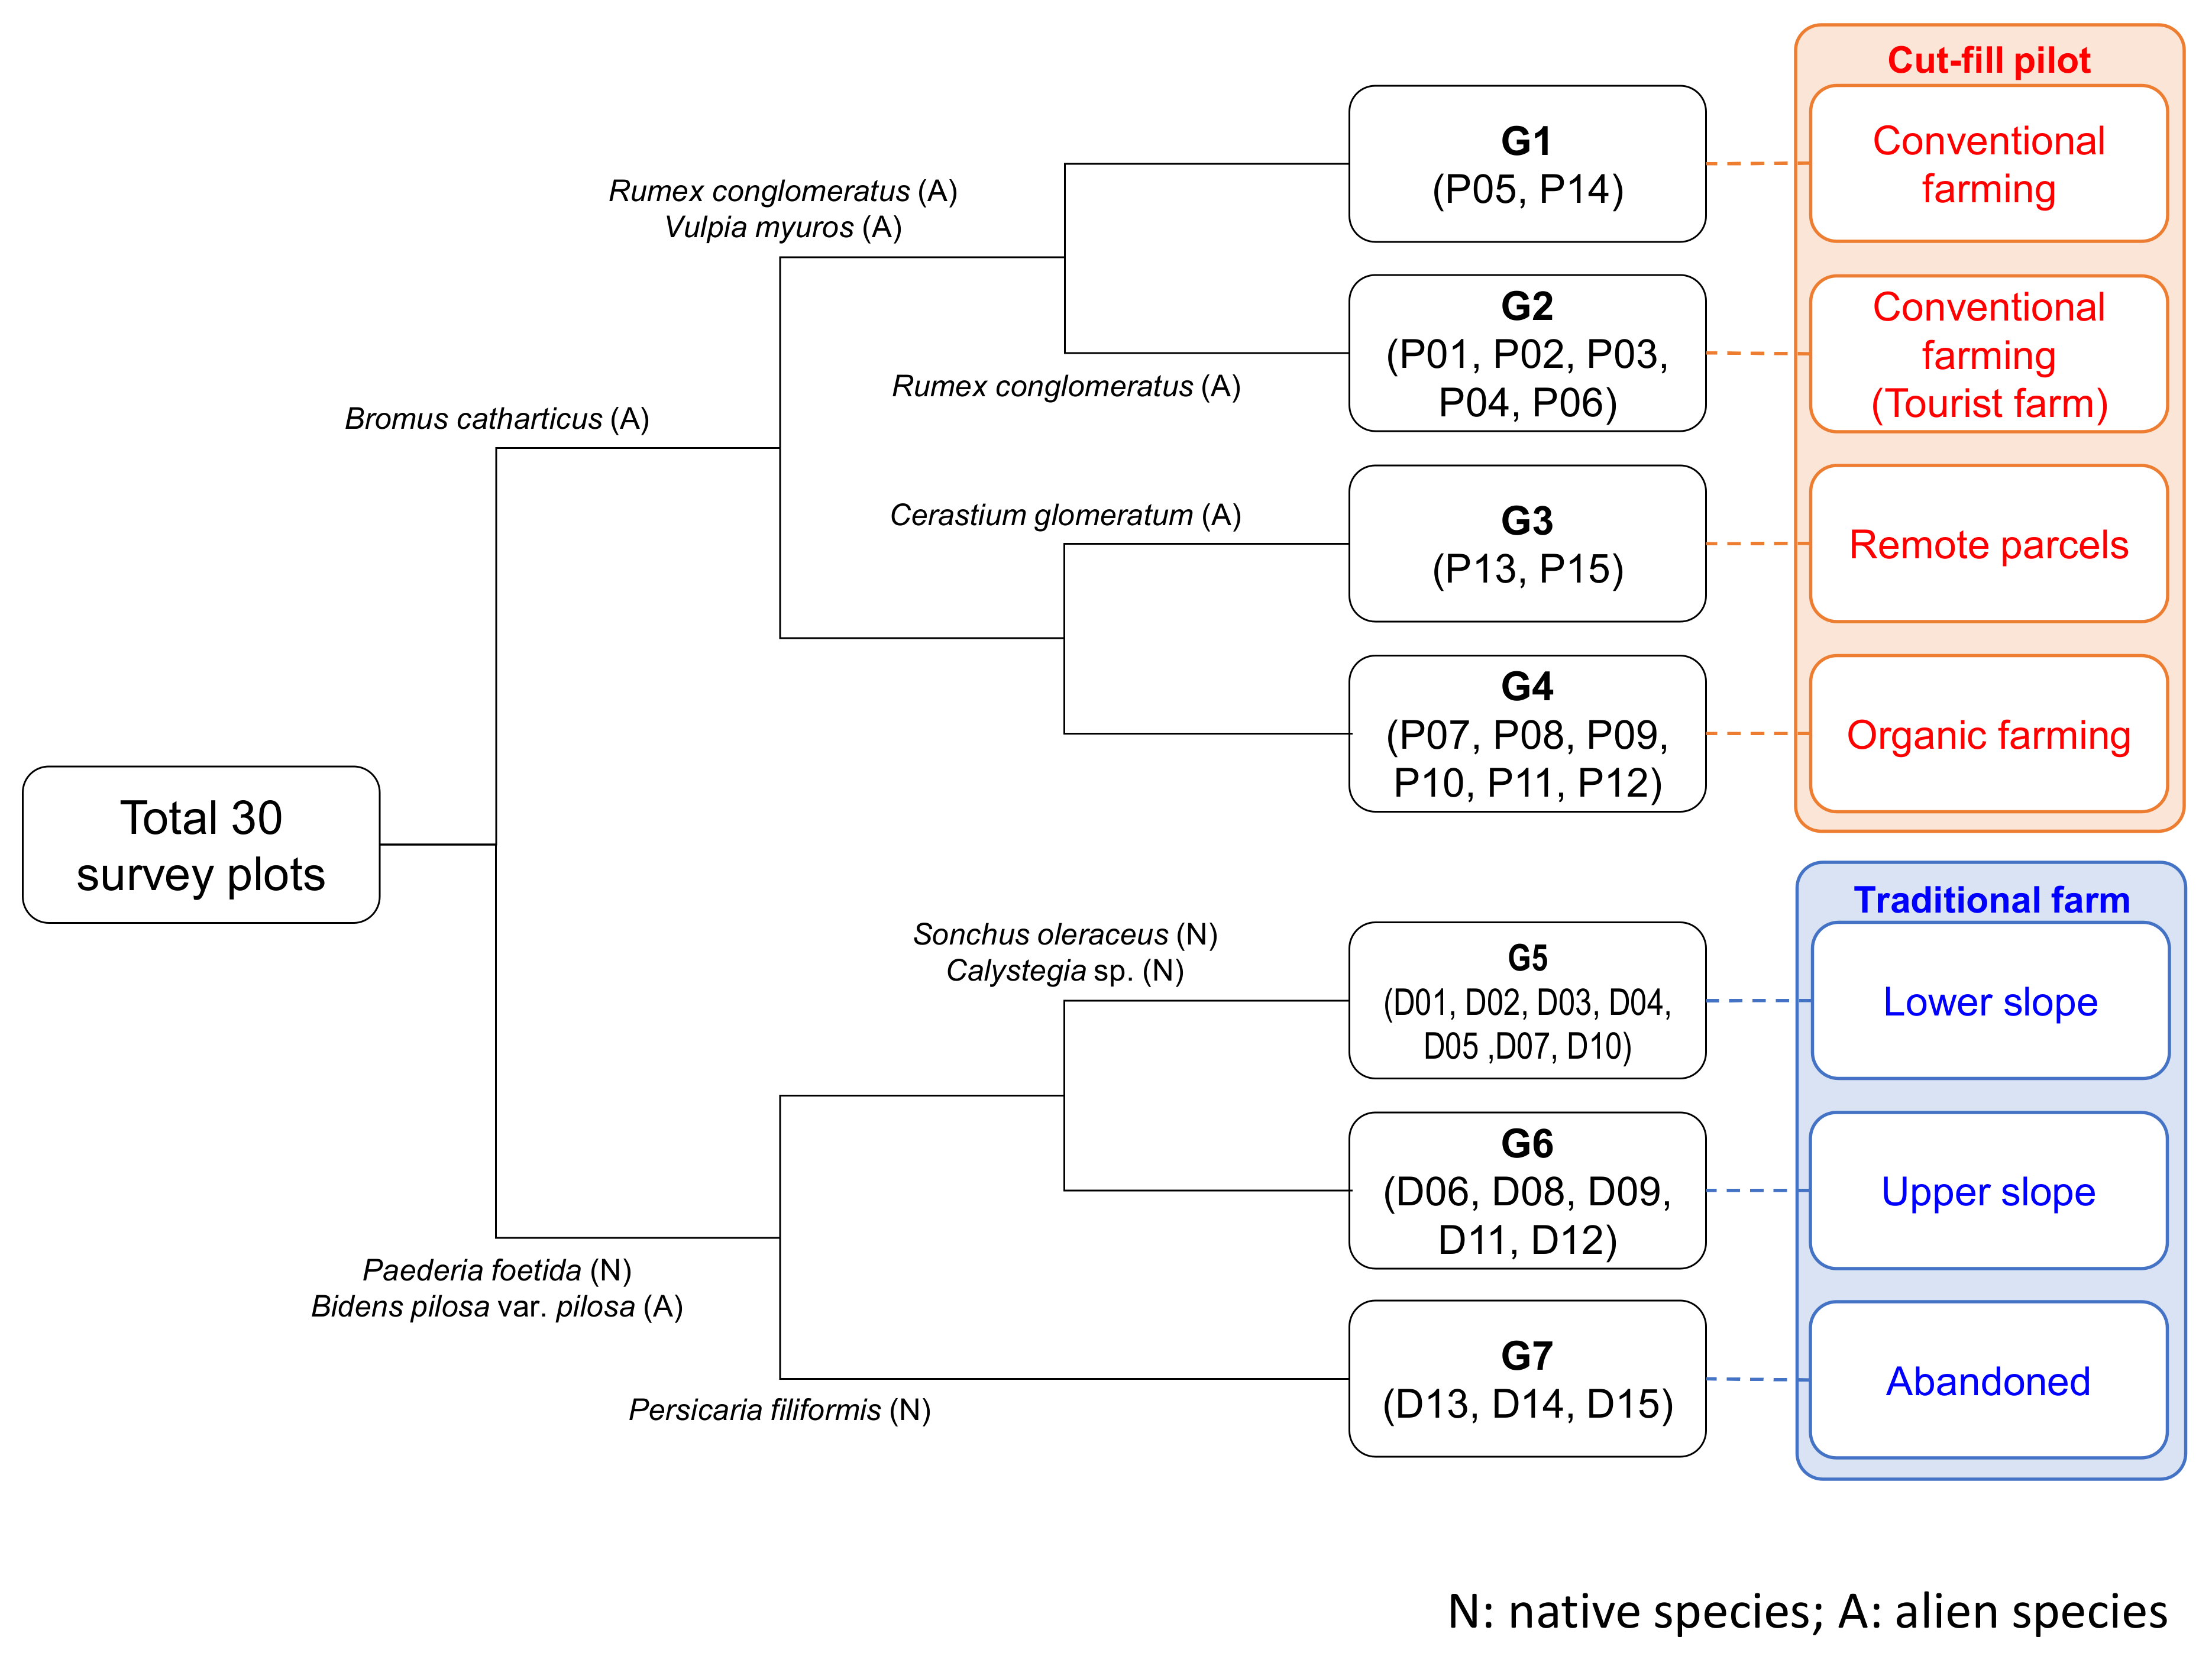
2.3. Vegetation and Topographic Investigations at the Traditional and Cut-Fill Sites

We conducted vegetation surveys in the traditional and cut-fill (developed in 1995) orchard sites (Figure 2 and Figure 3) in 2018. First, we created detailed vegetation maps for these two sites based on (1) interpretation of aerial photographs and satellite images provided by GSI and Google Earth, (2) drone images we seasonally acquired by using a DJI Mavic Pro (drone images were modified into georeferenced ortho images covering our sample sites using Agisoft PhotoScan Professional 64-bit, version 1.3.0.3772), and (3) field surveys of major vegetation types. We also measured the surface terrain. For the traditional site, because of its fine-scale slope condition, topographical data were obtained using a Leica ScanStation C10 laser scanner by Kyouwa Co., Ltd. (Wakayama, Japan) [13] to acquire a point cloud at an almost 10-cm resolution DTM and detailed slope slice transects. For the cut-fill site, due to its wider spatial scale and flatter terrain, we used an existing 5-m resolution DEM produced using aerial photographs in April 2017 by GSI [14]. We geo-referenced a 1967 paper topographic map (1:25,000) and digitized the contours within the cut-fill site, and then by interpolation we produced a 5-m DEM for 1967 that could be exactly overlaid with the current DEM. Through this process, we created a 5-m resolution landform change map for our cut-fill site, which reflected the current surface soil and topographic conditions. Spatial processing was performed using ESRI ArcMap version 10.2. We chose locations for the 1 m × 1 m vegetation plots (N = 30, 15 at the traditional site and 15 at the cut-fill site, Figure 2) based upon our vegetation map and topographic survey results.
In the vegetation plots, we surveyed the species composition, each species sociability, and coverage ratio (six classes; 5: 75–100%; 4: 50–75%; 3: 25–50%; 2: 10–25%; 1: 1–10%; +: 0–1%) based on the methods of phytosociology [15]. We conducted these surveys on 26–28 April 2018 (spring), and 16–17 July 2018 (summer). In parallel, we interviewed land parcel owners about parcel-use history, cultivation methods, grass management practices, and honeybee utilization to investigate the effects of management style on vegetation diversity. For parcels with absentee landowners, we interviewed local key persons and officials, especially during our Wakayama University GIAHS field class [11].
We conducted the TWINSPAN statistical analysis using the software program PC-ORD for Windows, version 4.0 [16]. We used binary species data (present/absent) for vegetation for the spring and summer surveys combined. The maximum level of divisions was set at 6, and the minimum group size for divisions was 5. Then we calculated the Simpson’s diversity index using the median ratio of each coverage class. We compared the diversity index between traditional and cut-fill farms by using the Wilcoxon rank-sum test in the R software, version 3.6.2 [17].

3. Results

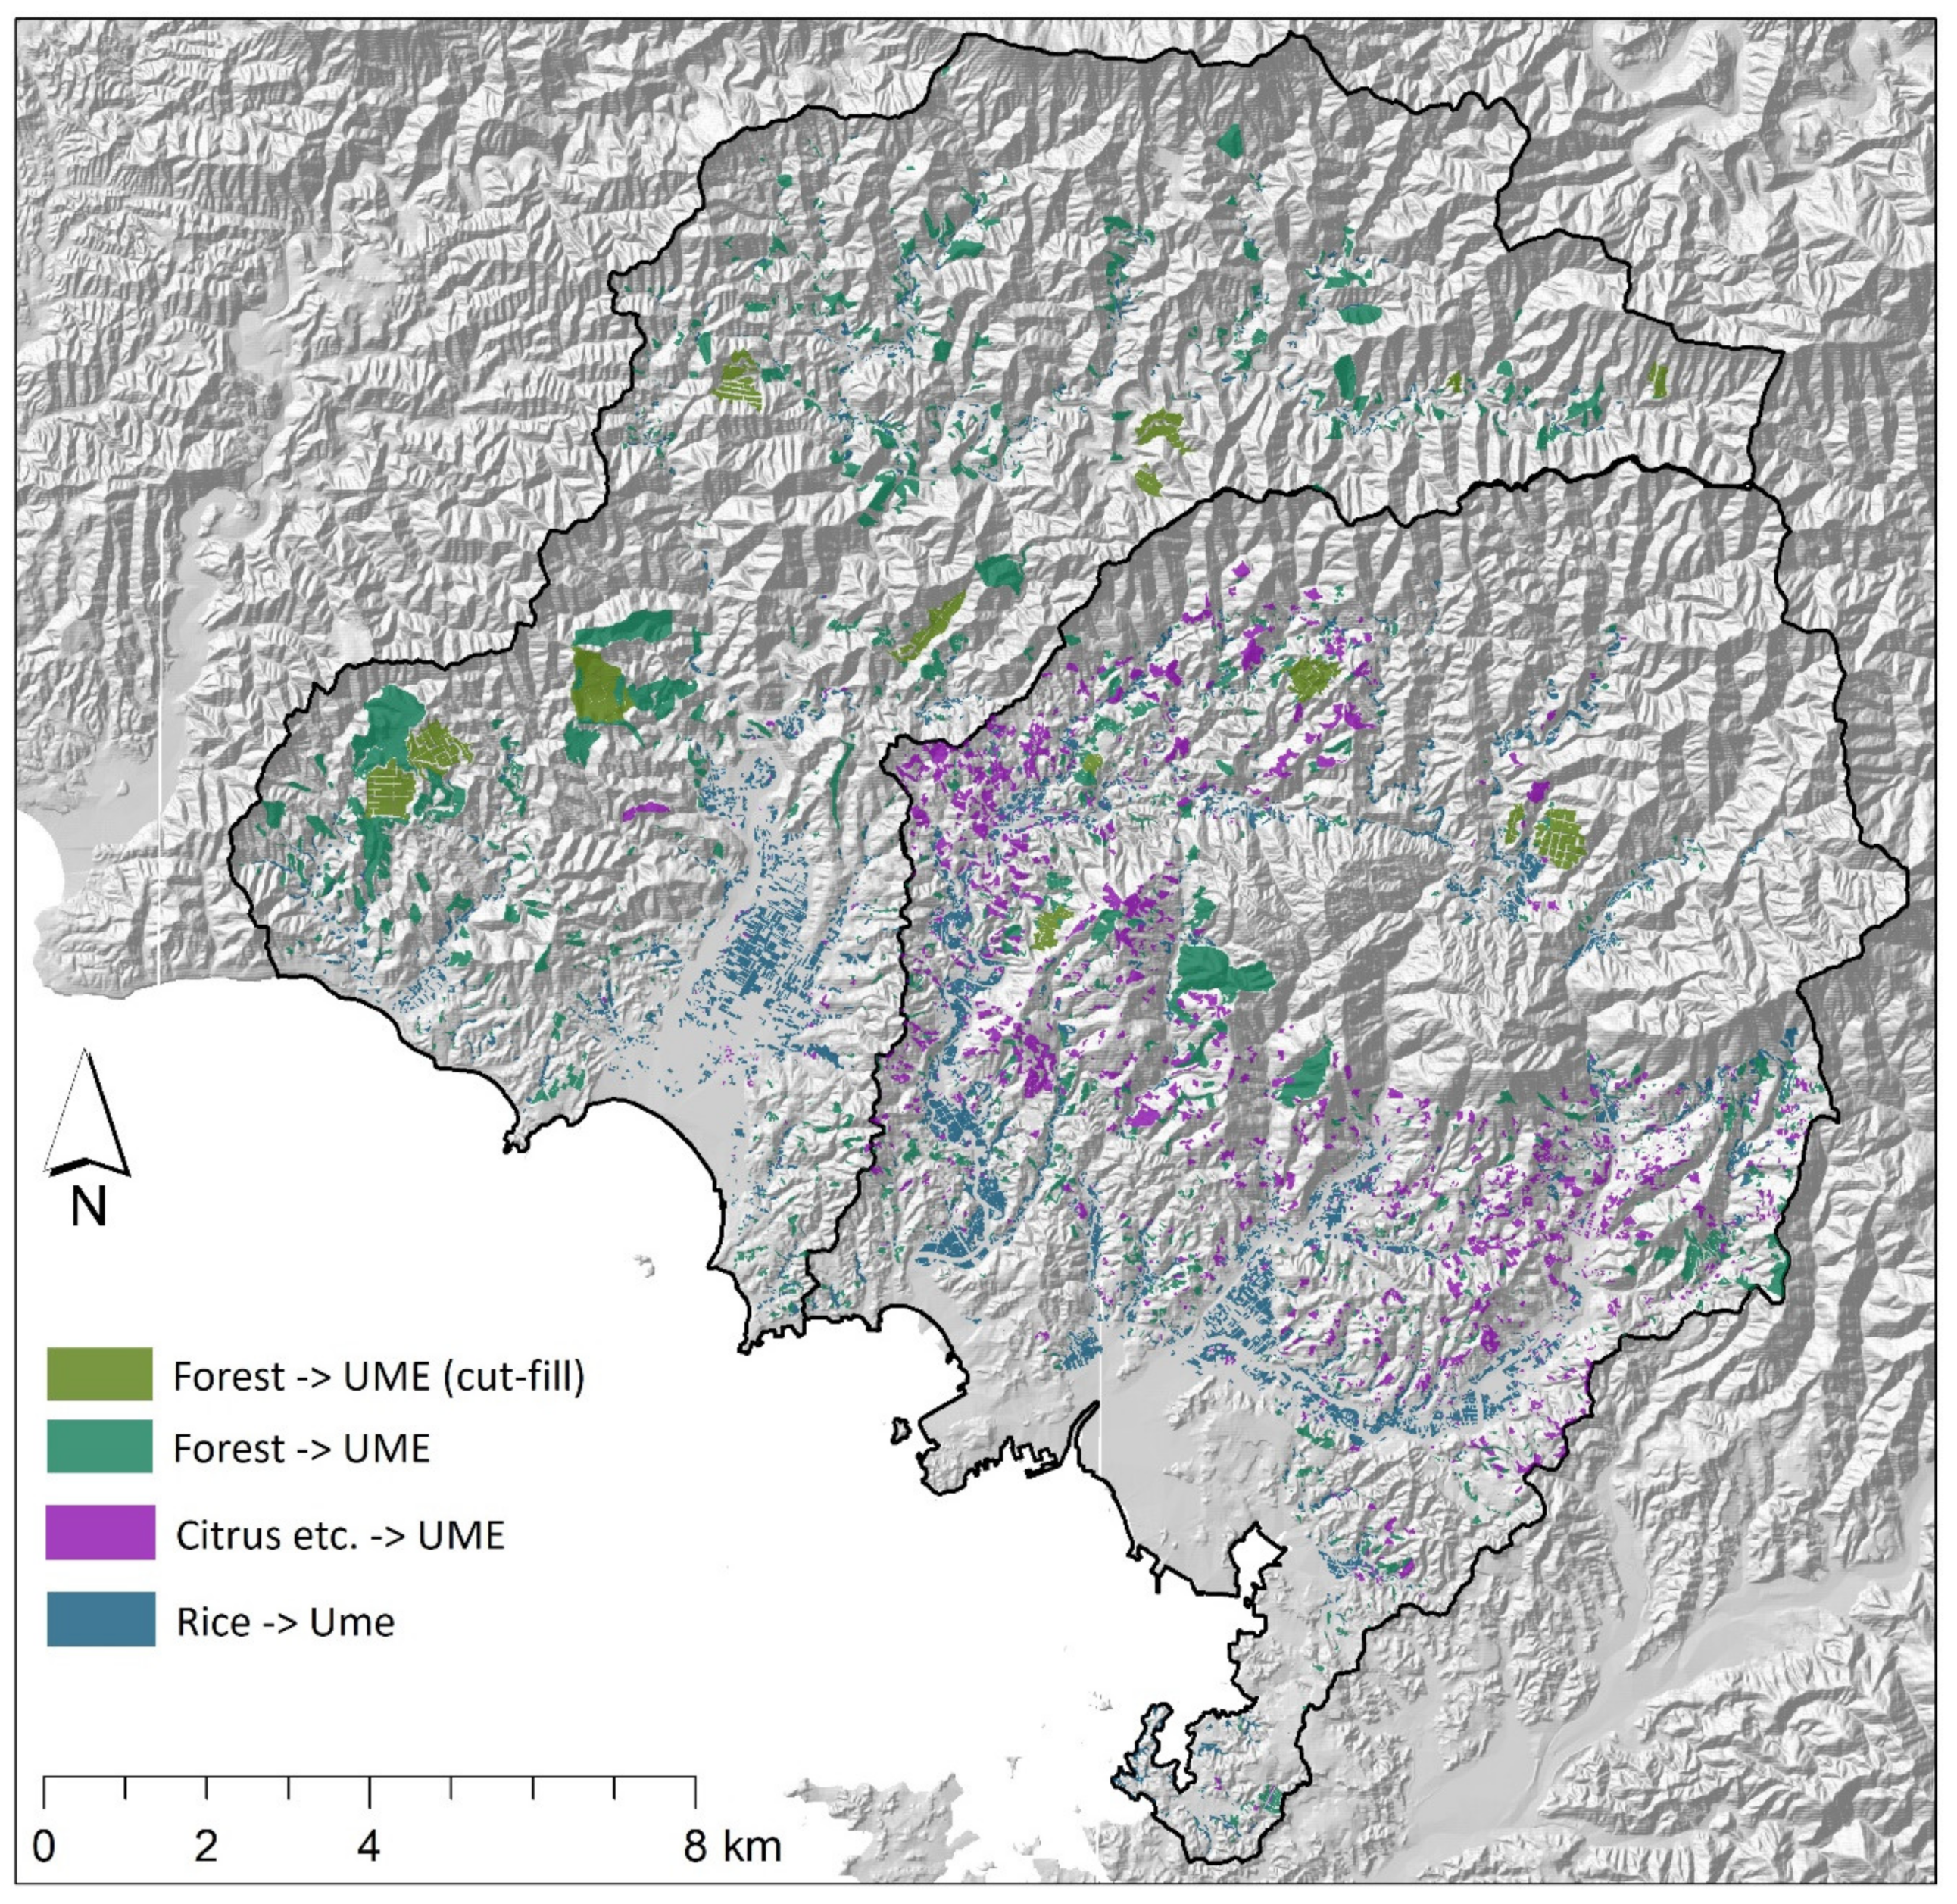
3.1. Land-Use Changes between 1974 and 2015

Table 1 is a cross table of the area altered between 1974 and 2015, and Figure 4 shows the spatial distribution of the altered land parcels overlayed on the topographic relief map. The cut-fill Ume orchards (locally called pilot farms) were developed in areas that were steep and forested in 1974, and all were developed after 1974. The newly developed orchards occupy relatively large (Table 1) parcels of land (Figure 4) leveled to improve farming efficiency [11]. Of the land cultivated as traditional Ume orchards in 2015, 59% had been in use as traditional Ume orchards (highlighted in the GIAHS proposal [18]) in 1974, 11% originated from rice fields, 12% originated from citrus orchards, and 17% were newly developed from forests. Thus, although slope-type Ume orchards have been historically cultivated [18], nearly half of the current traditional-type Ume orchards were developed since the 1970s, when Japan faced economic growth and intensive governmental support for agriculture was initiated against rapid urbanization and global free trade movements [19].

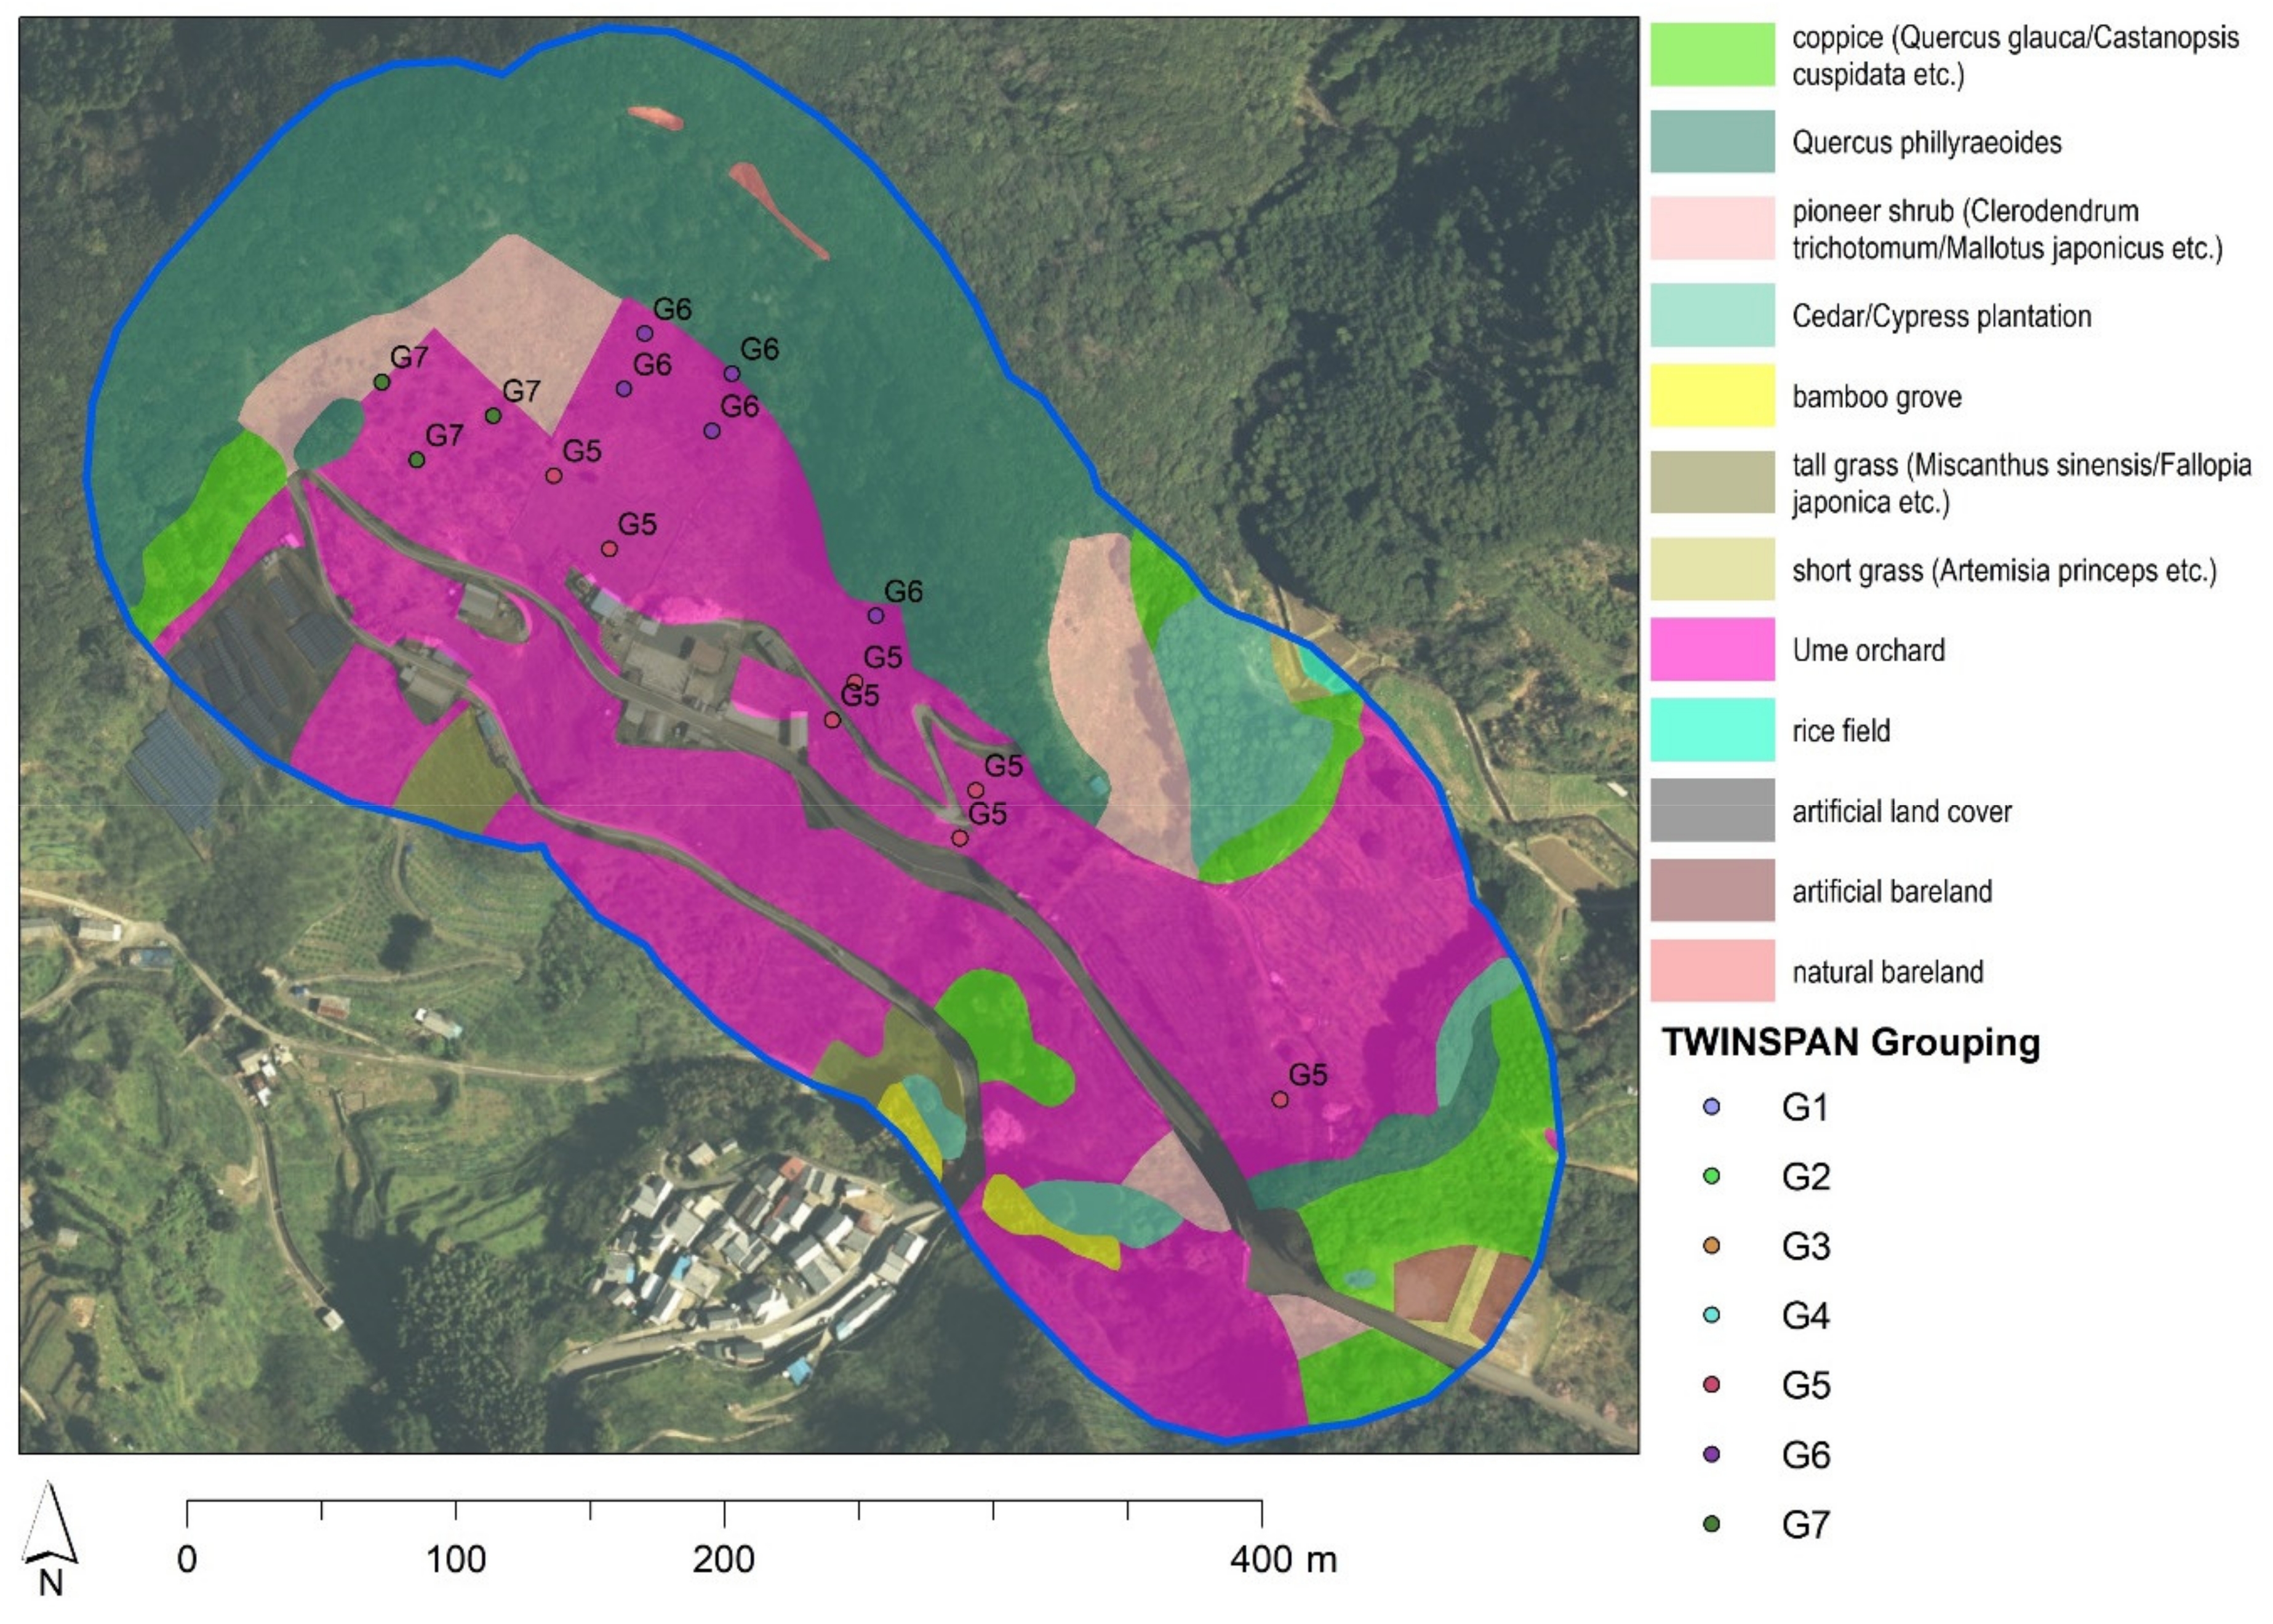
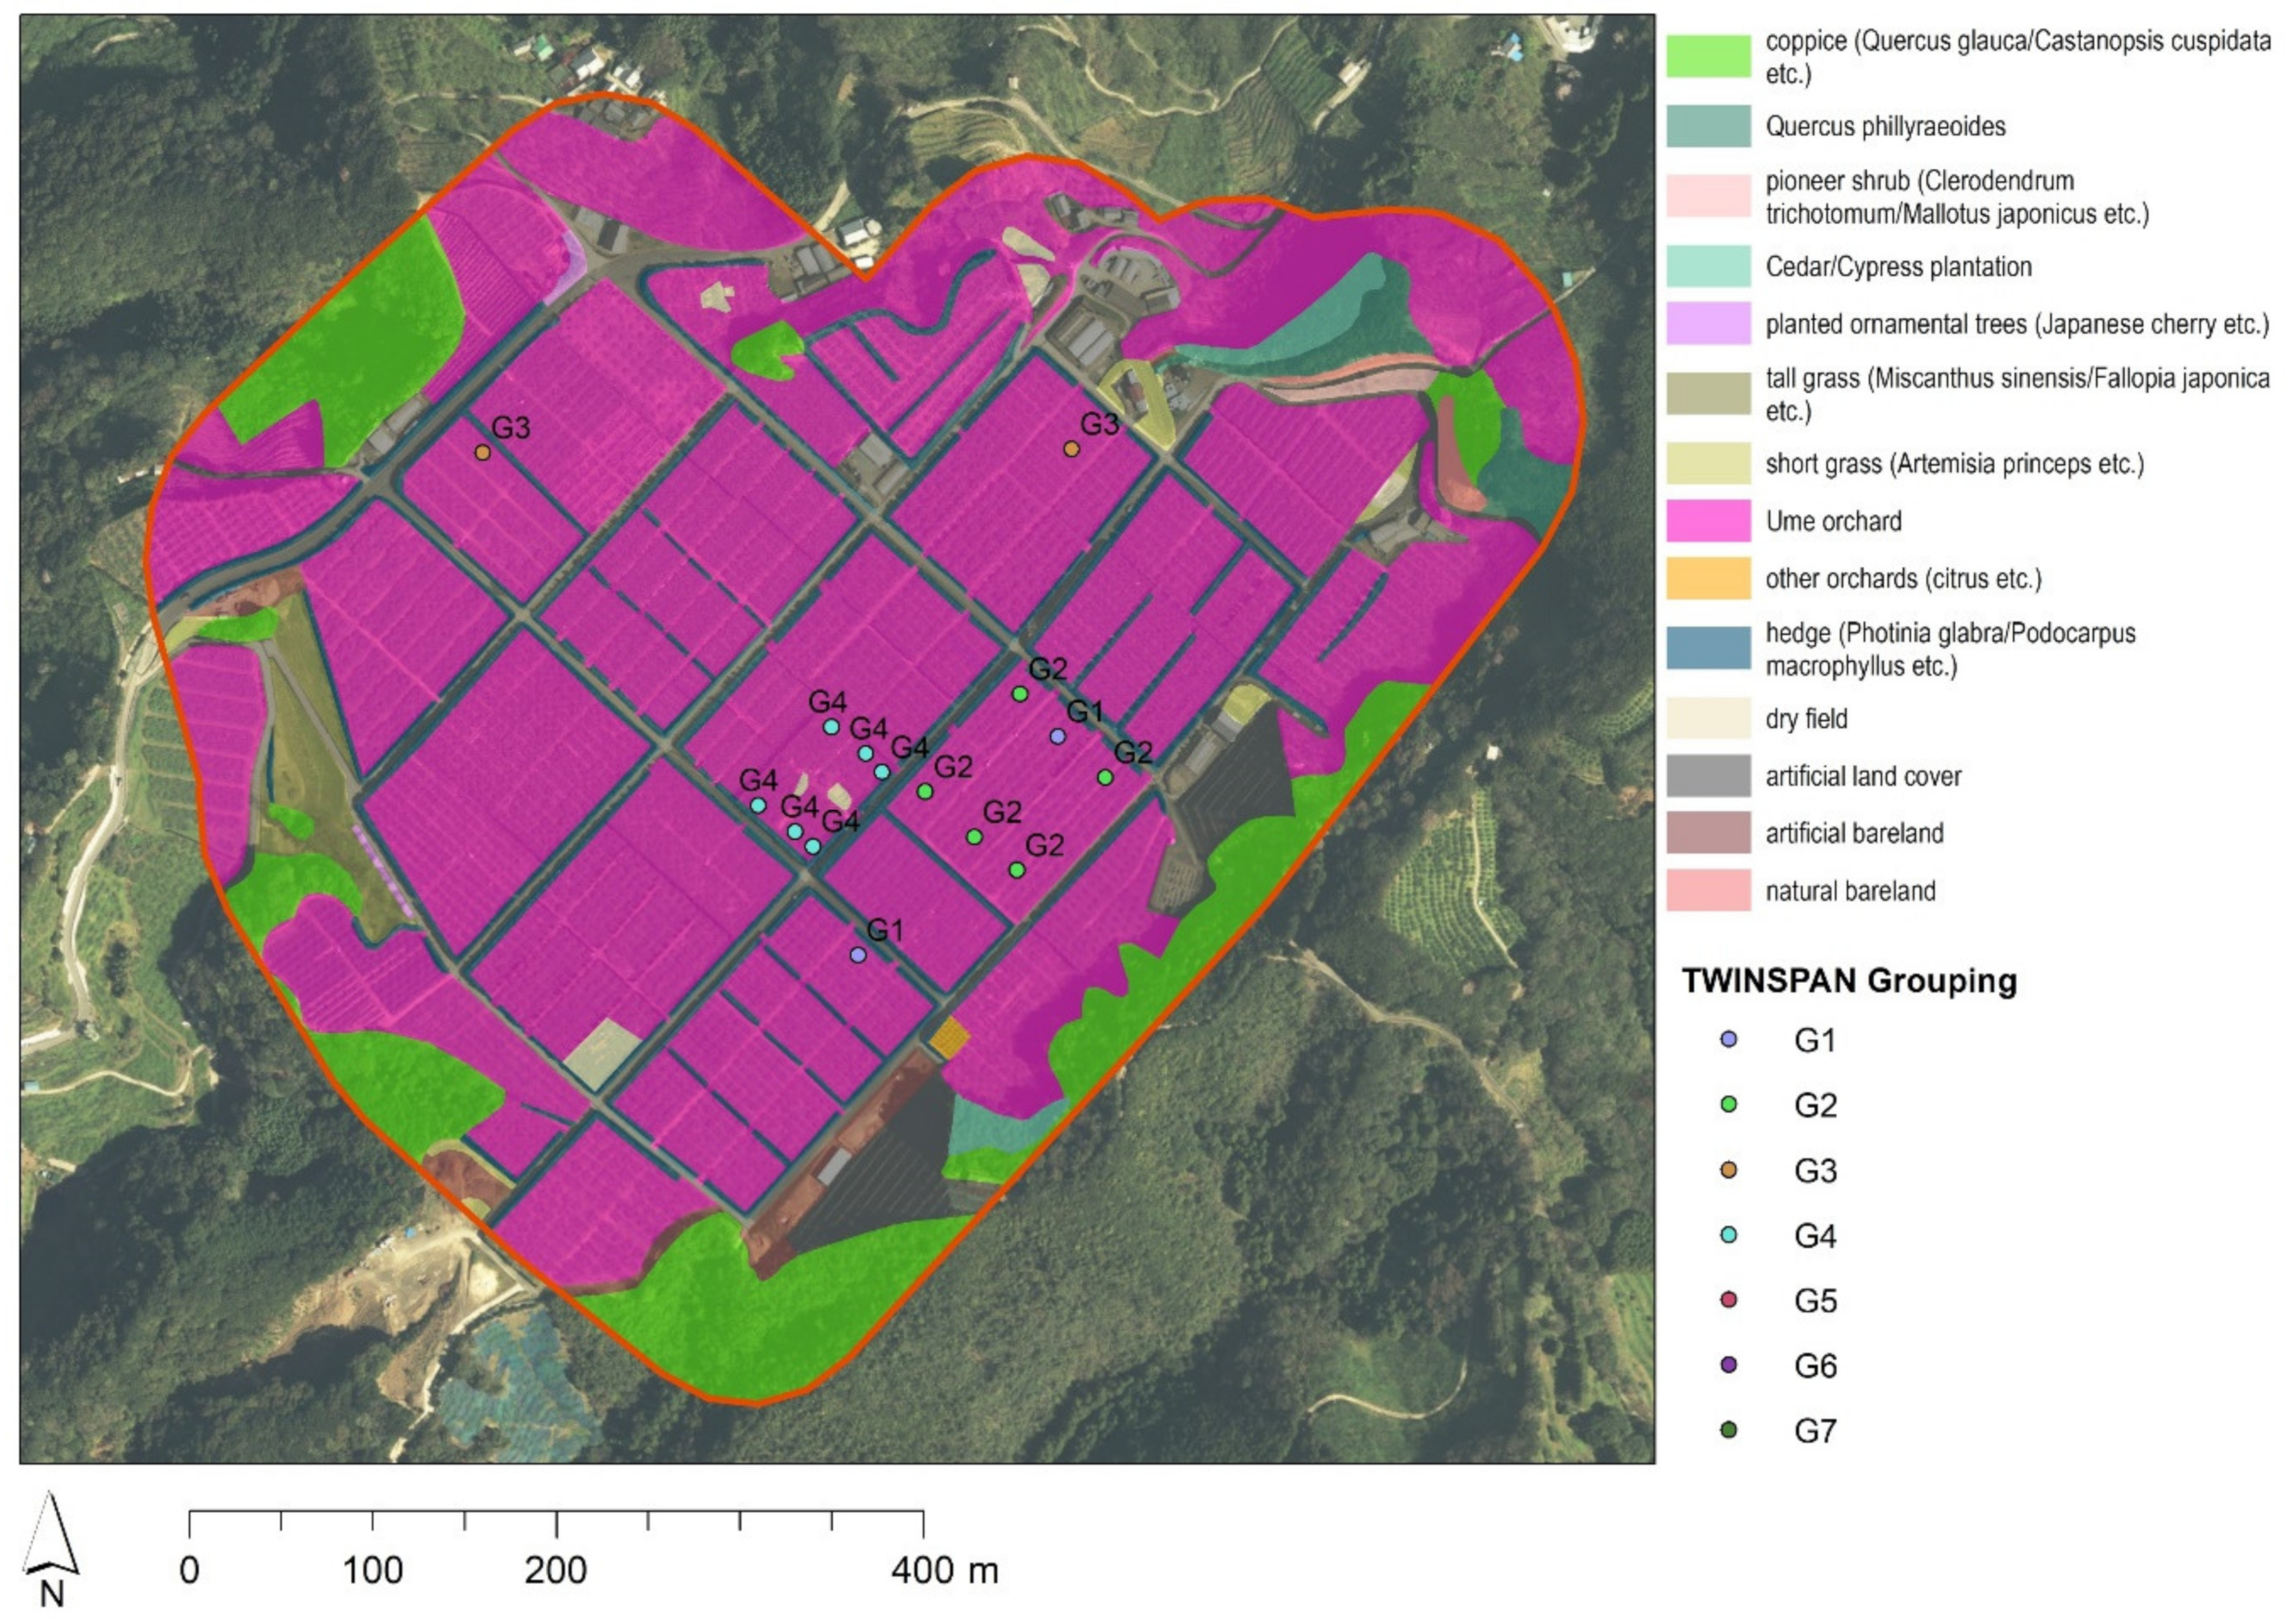
3.2. Micro Natural and Anthropogenic Landform Characteristics in GIAHS Farms

To analyze microtopography, we focused on the western part of our traditional sample site, for which we had both detailed DTM and ortho drone image data. Figure 5 shows the microtopography (1-m contours) derived from laser measurements mapped onto our ortho drone images acquired on 2 December 2017. Because it was captured in late autumn in good weather, this drone image clearly visualized vegetation differences based on differences in leaf colors, and we selected this image as the base photo. This figure also includes a transect sliced from the point cloud that we compared with the transect model submitted in the GIAHS proposal [18]. As shown in this figure, a traditional Ume orchard was planted on a steep slope, and above it, on the ridge landform, there is a coppice forest, consistent with the GIAHS proposal model [18]. Moreover, on the Ume–coppice border, various ecotone fringe vegetation is visible with highly variable red and/or yellow-colored leaves in the late autumn. The Ume orchards vary in height and density, seemingly according to land parcel management, and this variation may support further plant diversity as discussed in Section 4.2.
Figure 6 shows the landform transformation of our modern pilot Ume orchard sample site, visualizing the ridge cut and valley fill at a 5-m resolution. Based on the overlay analysis of old and new 5-m resolution DEMs, the total volumes of cut and fill soil were 4,435,350 m3 and 2,846,625 m3, respectively; the remainder of the soil was probably transported and used outside our sample site. According to our interviews with parcel owners, this cut-fill development started in 1995 with financial support from municipal, prefectural, and national governments, and it was completed in 10 years. Topsoil was stockpiled in a nearby open forest area and reused after land leveling. Moreover, as advised by the government, they spread several fast-greening, nitrogen-fixing plants, such as Vicia villosa, an introduced species discussed in Section 4.3. We also observed during the interviews and field surveys that some parcels had good quality topsoil and were managed organically, producing organic vegetables in addition to Ume. However, other parcels had gravelly soil containing crushed mudstone and little fertile topsoil, as discussed in Section 4.2.

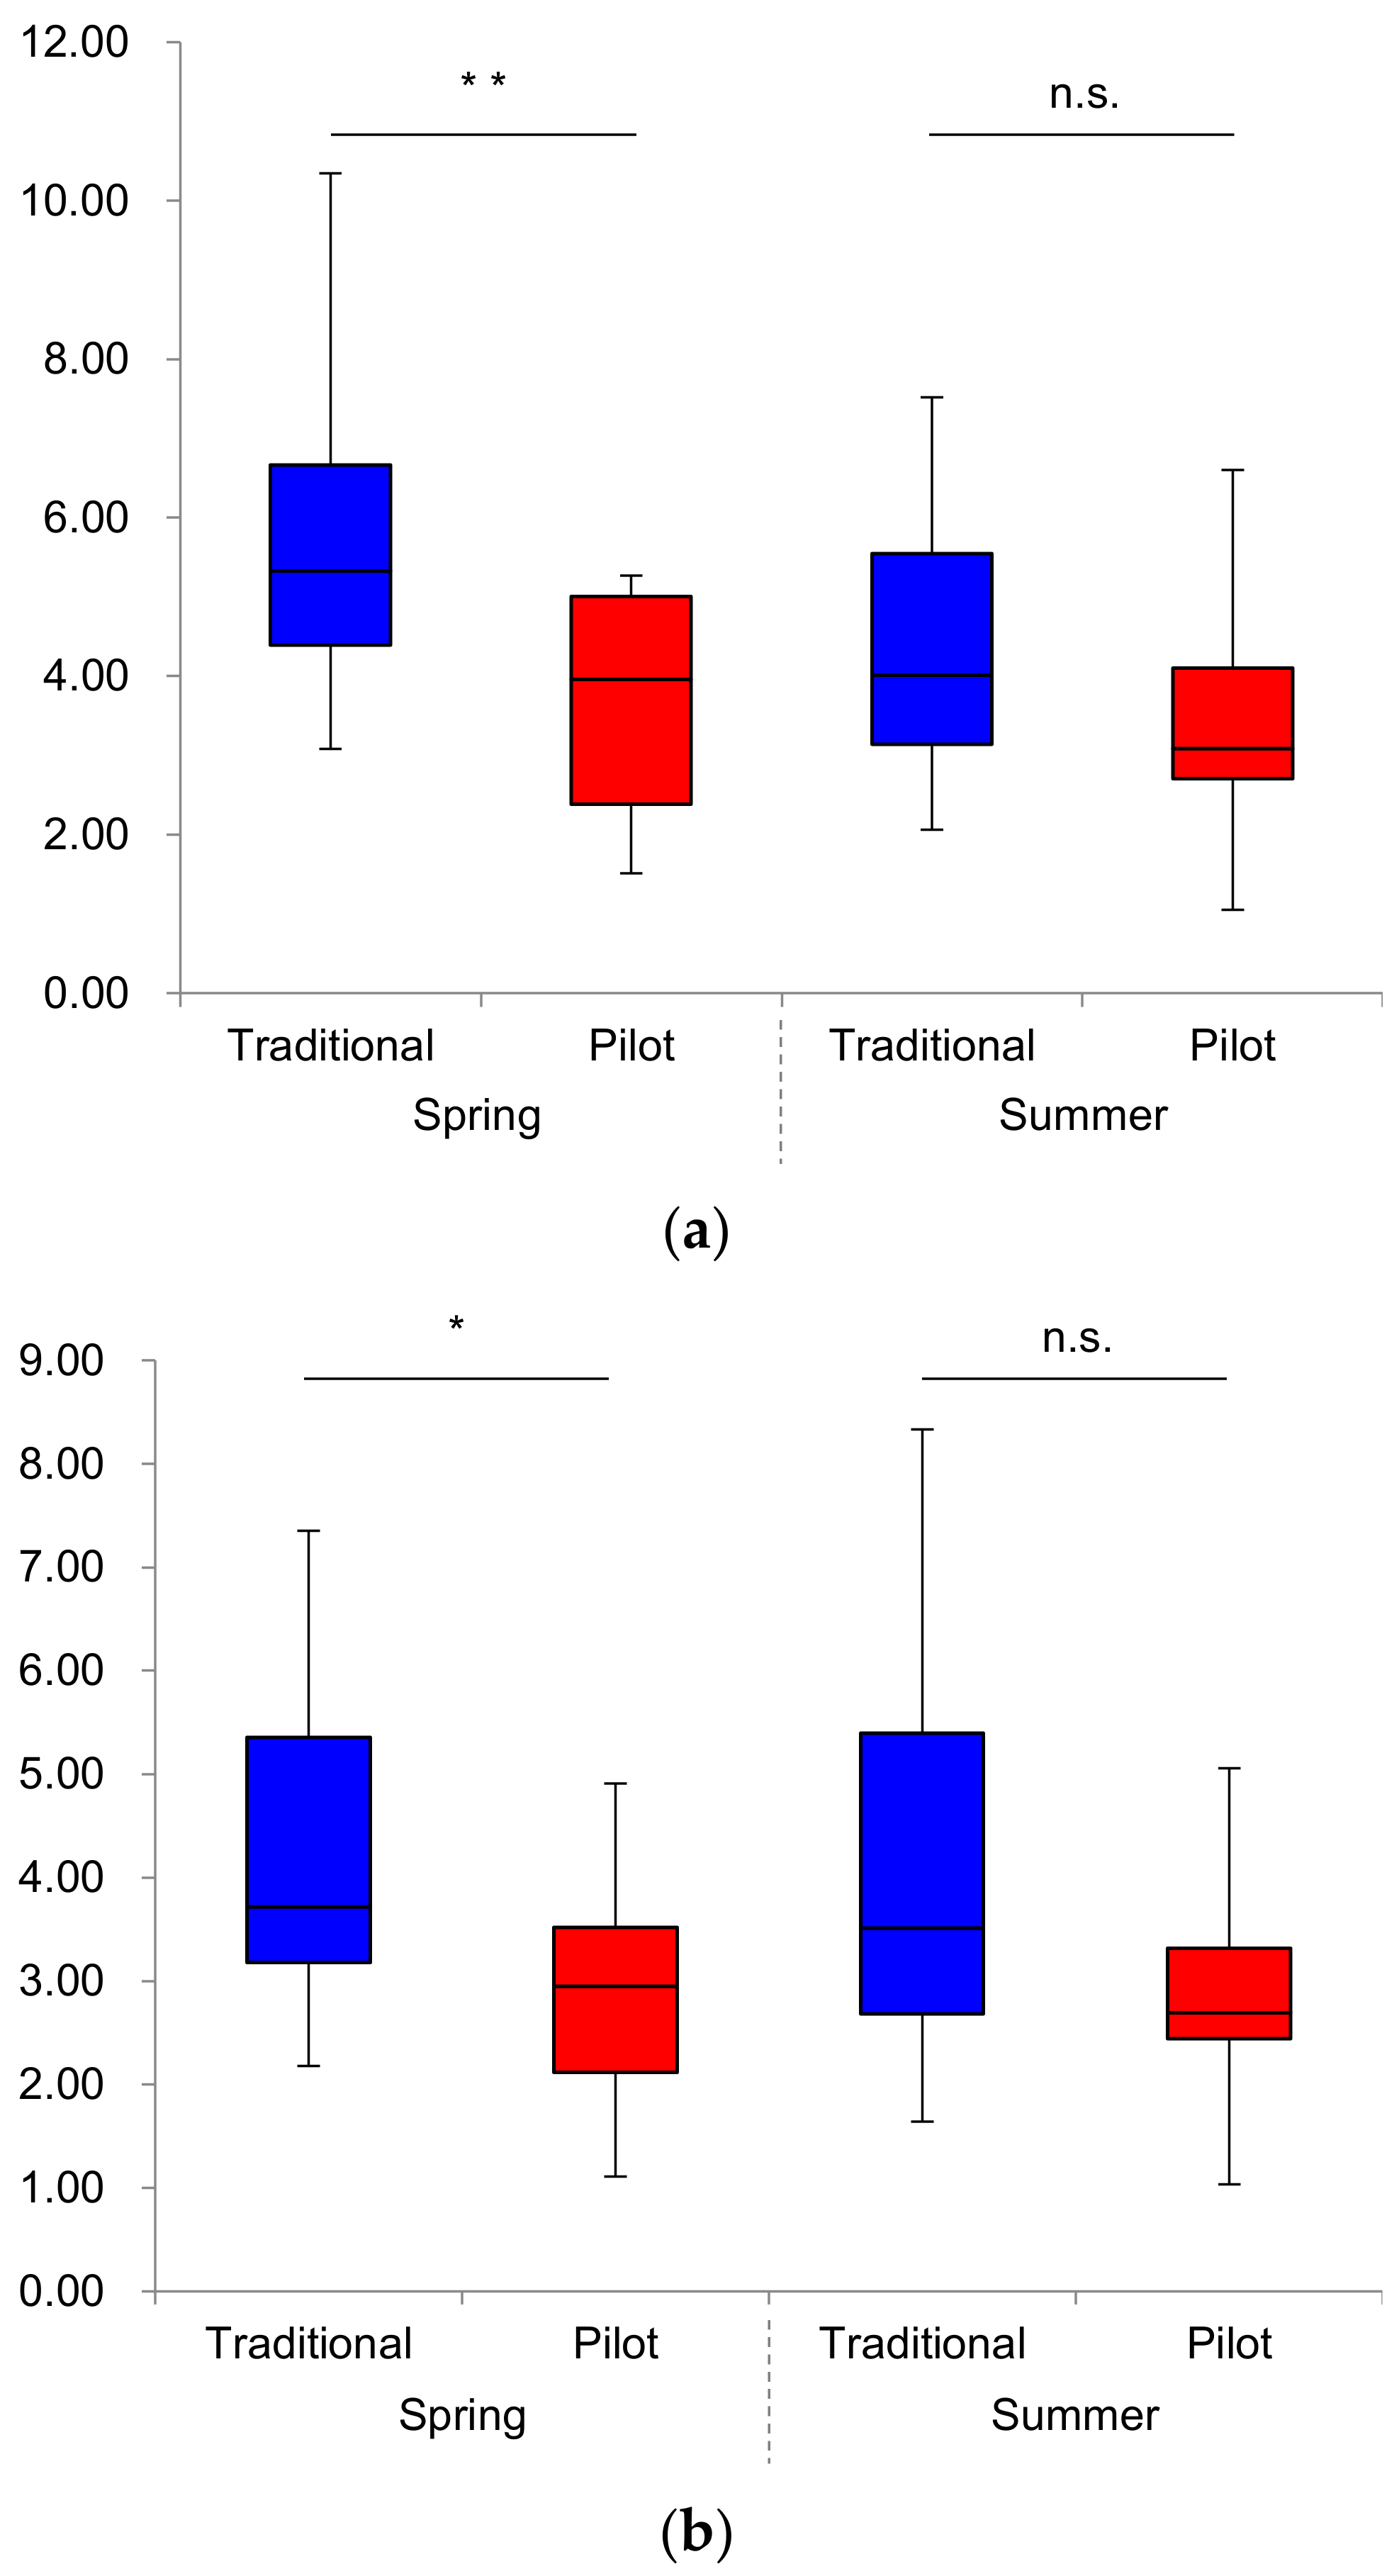
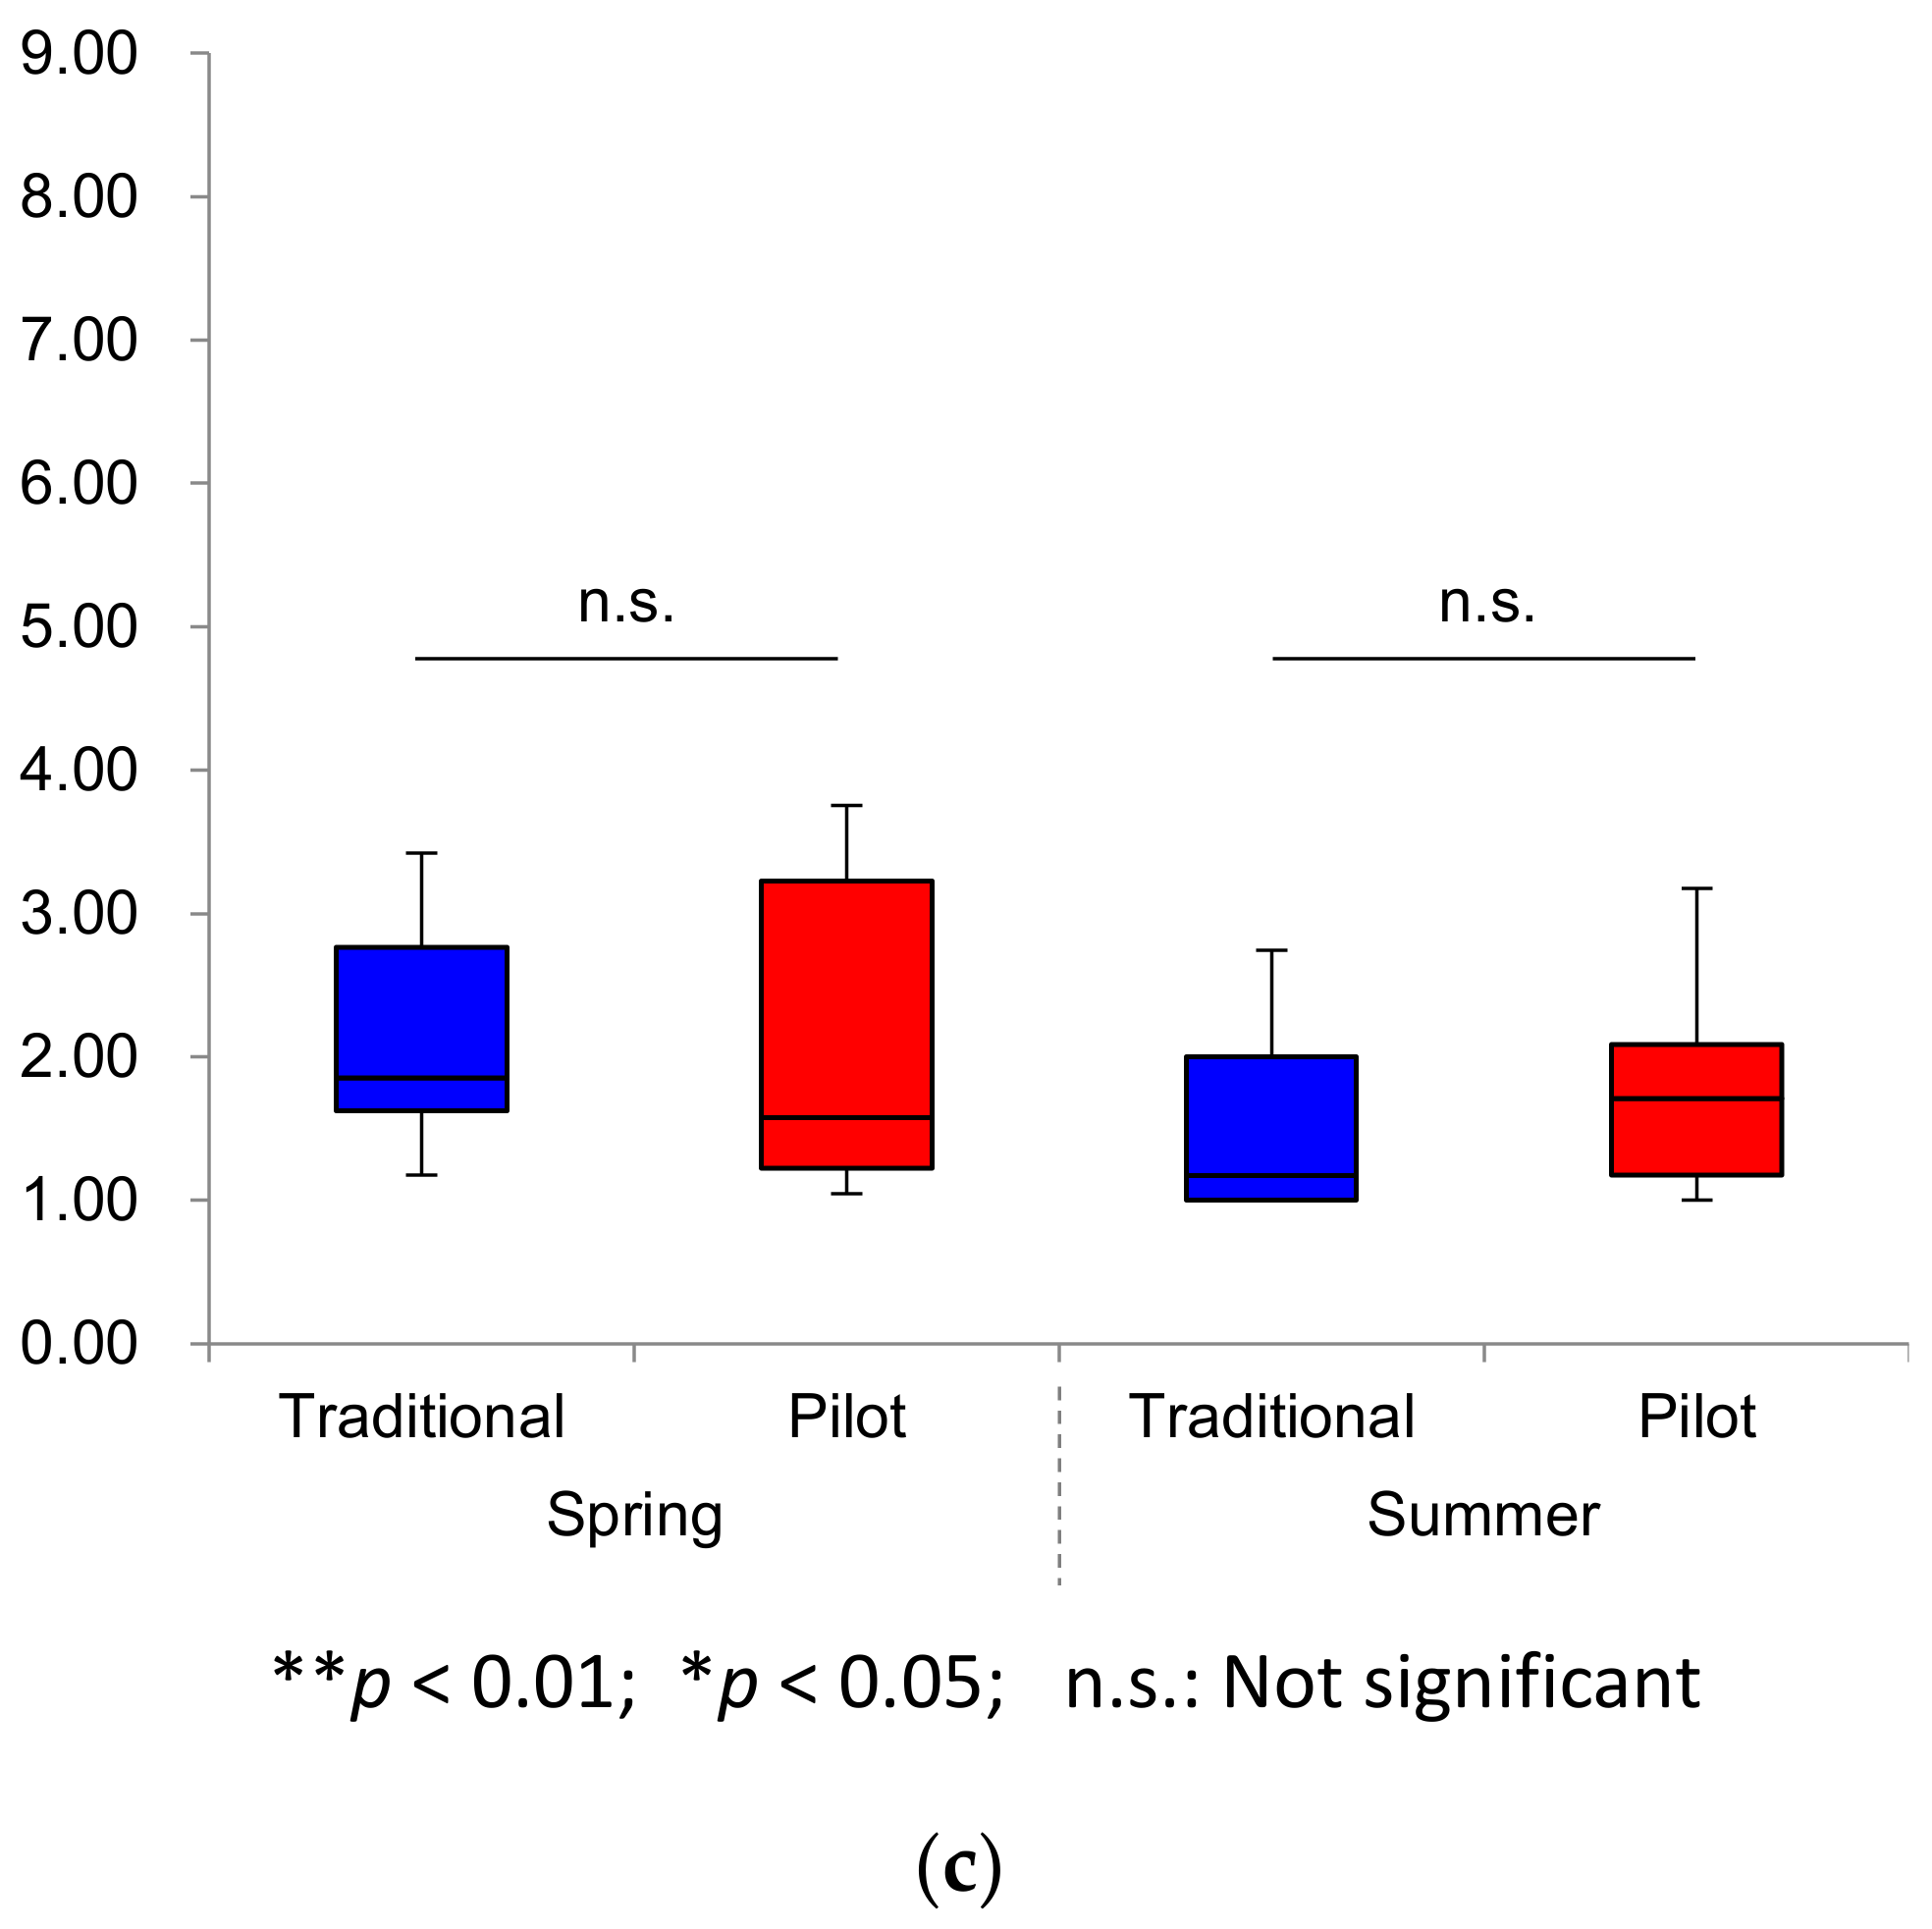
3.3. Plant Species Diversity in Traditional and Modern Orchards

All plant species observed at our sites are listed in Table S1. Figure 7 shows a tree diagram of our TWINSPAN results. The dataset was divided into two groups, traditional and cut-fill pilot farms. The dataset was further subdivided into seven groups (G1–G7) according to parcel use (Figure 7). In the traditional farm group, indicator species were mainly native species, and in the cut-fill pilot farm group, indicator species were mainly alien species. Figure 8 and Figure 9 show the TWINSPAN groupings for traditional and pilot farms overlaid on vegetation maps. Comparison of Figure 8 with Figure 2 and Figure 5 revealed that three groups (G5–G7) were correlated with parcel use or vegetation management. G5 was placed on the lower part of slopes in still ongoing traditional Ume cultivation plots. G6 was placed on the upper part of the slope, near the coppice forest ridges. G7 was placed on an abandoned Ume orchard parcel that showed signs of succession (Figure 5) toward shrubs and forests. The owner of this parcel lives in remote Osaka City and has not tended this parcel since 2014; he cultivated Ume until 2014, when he cut down all the Ume trees, according to interviews with the owners of the adjoining parcel and a Tanabe city hall official in charge of the agricultural sector.
Figure 9 shows the TWINSPAN groupings for cut-fill sites overlaid on the vegetation map. G4 was concentrated within a single parcel in the central part of the pilot farm, near the border between the cut and fill portions (Figure 6). The owner of this parcel avoided the use of chemicals where possible and emphasized growing organic vegetables alongside the Ume trees. G1 was placed on fill areas in two different parcels (Figure 6) with conventional farming methods (some chemical use), according to the interviews with locals. G2 was placed within a single conventionally farmed parcel (Figure 6), which was also used as a tourist farm, based on the interviews. G3 was distributed to two widely spaced parcels with cut and fill (Figure 6).
The Simpson’s diversity indexes we calculated revealed that the plots in traditional farms (D01–D15) had higher diversity than those in cut-fill pilot farms (P01–P15). The average index was the highest in G5 in both spring (D = 7.06) and summer (D = 5.22). Figure 10 shows differences in the Simpson’s diversity indexes between two farms by season and native/alien species. In spring, the diversity index was significantly higher on traditional farms than on pilot farms (p = 0.0066). Moreover, considering only native species, in spring, the diversity index was significantly higher on traditional farms than on pilot farms (p = 0.024), but no difference was detected between traditional and pilot farms when only alien species were considered.

4. Discussion

4.1. Balancing Traditional and Modern Agriculture in a GIAHS Site

During interviews conducted with local people as part of our Wakayama University field class in GIAHS sites since 2017 [11], many farmers, especially older ones, told us that they prefer cut-fill Ume orchards and those developed from rice paddies to traditional slope-type orchards because of their greater labor efficiency and productivity, even though they acknowledged the importance of traditional orchards in their land-use systems. They thus projected that an increasing proportion of Ume production would shift to level orchards given Japan’s aging population and recent governmental support of agricultural sectors. Presently, more than a half of Ume orchards are the traditional slope type, and therefore meet the GIAHS criteria for dynamic conservation; however, careful monitoring of the dynamics will be needed in the near future. Indeed, an increasing number of Ume orchards are being abandoned as the population ages, and, in response, the local forestry sector has begun reforestation of abandoned slope-type Ume orchards, particularly with Quercus phillyraeoides, with the aim of producing charcoal [11]. Furthermore, our central traditional site (Figure 5) experienced a sudden landslide on 23 April 2020, even though there was no extreme weather; subsequently, the older farmers in this area (who were also experiencing some health issues) stopped the Ume production as well as Japanese honeybee keeping. The parcel that experienced the landslide is now under the control of the national government and is being converted to a national landslide protection forest. Thus, in an aging society in which traditional orchards are being abandoned, triggers such as the abovementioned landslide can accelerate the shift away from traditional farming practices, threatening the balance between Ume, forest, and other land uses that forms the basis of these dynamic land-use systems.
Considering the landform transformation required to create an anthropogenic flatland, we calculated that to create our sample cut-fill pilot farm, 4,435,350 m3 of soil was removed and 2,846,625 m3 of soil was used as a fill; the difference of 1,588,725 m3 may have been transported to another area. The natural river erosion rate in this area is 24 m3/km2/year [20], so 66,196 years would be required for the river to erode this much topsoil, whereas this pilot project was completed within 10 years, showing the massive power of people using fossil-fuel powered equipment as geomorphologic agents. Moreover, when we applied specific gravity at 2.5 for this soil for the cut and CO2 unit at 5.65 kg/t in nearer area [21], we obtained 62,649 tons of CO2 generated from this pilot farm project. This was many times larger than the 3000 tons of CO2 emitted by the agricultural sector of Minabe Town in 2018 [22]. In terms of energy expenditure, the pilot project used only slightly less than the estimated energy savings that could be achieved by promoting local food systems in the Osaka City region (which includes Wakayama and the nearby Osaka, Nara, Hyogo, Kyoto, Shiga Prefectures); i.e., 1 × 10⁶ GJ [23], which is equivalent to 67,100 tons of CO2 based on conversion using the petrol coefficient of 0.0183 t C/GJ [24].
In addition, we roughly extrapolated these calculations to our whole study area (Figure 1). Our cut-fill DEM analysis (Figure 6) covered an area of 1 km2. Using the area converted to cut-fill Ume orchard between 1974 and 2015 (249 ha or 2.49 km2; Table 1), multiplied by 1,588,725 m3 (topsoil outflow), we obtained a figure of 3,955,925 m3 for the anthropogenic soil outflow from our whole study area. Considering that the total area of our study site was 257 km2, we could estimate the total anthropogenic soil outflow as 15,393 m3/km2, which is equivalent to 375 m3/km2/year. This figure is lower than the average surface transformation ratio of the urban fringes of mega-cities such as Tokyo (33,000 m3/km2/year), Metro Manila (4900 m3/km2/year), and Bangkok (5700 m3/km2/year) [25]. Nonetheless, when we consider that our study area has mostly agricultural and forest land uses (Figure 1), this figure represents a large anthropogenic environmental impact, 15.6 times larger than that of the natural river erosion rate (24 m3/km2/year [20]). Moreover, considering that this kind of earth work is not part of formal public record [25], there might be further indirect or hidden environmental impacts. In terms of energy, when we used our sample cut-fill site as an energy unit (62,649 t CO2/km2) and multiplied it by the total cut-fill area (2.49 km2), we obtained a value of 155,996 tons of CO2 generated during the landform transformation of the Ume orchards. This number is approximately 52 times larger than the annual CO2 emission by the agricultural sector in Minabe Town [22].
Based on this rough quantification of its environmental load, it appears that the cut-fill development may be completely counter to the goal of dynamic conservation of this mosaic land-use system. We must also note that although the cut-fill development required enormous energy use, the resulting area is now being intensively farmed and is bringing new, younger farmers to the area, according to our interviews [11]. Moreover, the farmers understood the historical importance and value of traditional Ume orchards as a core land use in this area, in spite of its labor inefficiency. Thus, the importance of balancing traditional and modern orchard types is recognized, particularly by active farmers who were involved in the GIAHS application and who are now forming human resource networks that can impact various land-use decision-making [11]. Further study of the long-term energy balance is warranted for the life cycle assessment (LCA) of this land-use system. A household and site-scale input–output investigation and LCA (which can be extrapolated to a broader scale using GIS) are important [26], especially given the recent trend to cut costs by minimizing collection of public statistical data in such fields in Japan [27]. However, because the ecosystem services provided by the various land uses in our study area are complex, it may be difficult to include all effects and elements in the land-use and associated energy analysis. Long-term research and practice should be continued in dynamic land-use systems [28], with the goal of their conservation in the context of the Anthropocene [29,30].

4.2. Plant Diversity and Land Management History

Both of our study sites have various vegetation types (Figure 8 and Figure 9), with Ume orchard as the core, surrounded by a coppice forest and other vegetation types such as hedges and bamboo. Hedges were planted around parcels (Figure 2 and Figure 3) to protect Ume against strong wind, and bamboo was utilized for making household items in the past, as noted by locals. Hedges and other vegetation elements of the Ume agroecosystem might also function as nectar sources, as noted by locals and as described qualitatively in the GIAHS proposal [18]. Thus, in this area, the vegetation has been managed at a parcel level as part of the locals’ management of their living spaces, promoting parcel vegetation diversity [11]. Furthermore, by contrasting traditional and modern farms (Figure 10), we showed that even within the Ume orchards, usually a single category on vegetation maps, there is a considerable diversity in the plant species composition related to land use. For instance, as shown in Figure 5, Ume orchards include various stages, ranging from grafting, harvesting, replanting, to abandoned by the landowner’s choice, which impact plant diversity. Even in the pilot farm, land-use history as cut or fill could impact plant diversity (Figure 7) in addition to the parcel owner’s current management scheme. By comparing Figure 6 to Figure 7 and Figure 9, we hypothesized that parcels bordering those were cut or filled might have better original topsoil without higher land disturbance from earth works. Thus, current and past land management practices play a vital role in maintaining plant diversity in this area, similar to other areas of the Japanese agroecosystem or satoyama landscapes, as noted in previous studies [31,32,33] and even in vacant lot-dominated suburban residential areas with a history of earth works [34].

4.3. Realistic Indirect Promotion of Biological Diversity through Dynamic Landscape Conservation

Can this parcel-level vegetation diversity be sustained over the long term? As shown in Figure 1 and Table 1, this Ume system has a wide distribution of both traditional and pilot farms similar to our sample sites. Each parcel has one use at any time under its user’s management scheme, such as Ume or coppice; other farms are surrounded by linear hedges and bamboo, although combinations of Ume and vegetable cultivation were observed on several pilot farms. Moreover, these parcel-specific uses can change over time (Figure 4). This situation is common in the Japanese satoyama landscape [35] but quite different from large parcel uses in other areas, which often include various land covers and habitats, such as a pond, forest, grassland, and farm within one parcel, often of large size (average of 32.5 ha in the suburbs of New York City in the USA, for example) [36], which is much larger than the parcel size here, 2313 m2, or 0.23 ha (the pilot farm average, which is the largest among our parcel types). Thus, it might be more affordable to address indirect control schemes to each specific use, thereby addressing the total land-use dynamics in this area (Figure 4). In a parcel-based dynamic landscape mosaic such as this one, the usual methods to protect important native species and to remove particular invasive species might have limited impact in terms of total biodiversity conservation. For example, as we mentioned in Section 3.2, alien species have been and sometimes still are utilized as green fertilizers and as nectar sources, and it may be difficult to prohibit such utilization under conventional agricultural methods. Hence, too much focus on particular species and only unique onsite lot uses are not helpful to conserve biodiversity given by the dynamic parcel-based landscape in this area. Instead, indirect land-use regulation could be used to avoid excessive development, such as the recent solar panel movement with full vegetation clearance (partially shown in Figure 3; the prefectural government is working on further ordinance [37]), or abandonment. Subsidies and incentives could be used to encourage continuous management of traditional Ume orchards by helping to sustain labor input, which could be maintained using the current existing pilot farm as a production baseline.

5. Conclusions

This study revealed that within the dynamic landscape mosaic in the GIAHS Ume orchard area, there is an increasing trend toward large-scale anthropogenic cut-fill land developments, which promote efficient Ume cultivation and are becoming core sites of production. Nevertheless, large areas continue to function as traditional slope-type Ume orchards with surrounding coppice forest, providing major landscape components. Our vegetation survey in sample traditional and cut-fill Ume orchards revealed that traditional orchards have more native species and higher plant diversity indexes, owing to their varied topography and parcel management history. Cut-fill orchards had a considerable amount of alien species, but the degree depended on land parcel history and individual land management practices. Overall, this area has not experienced any one-way land-use change toward extensive and abandonment until now; instead, it remains a dynamic mosaic landscape with a core of long-standing Ume orchards, which provide ecosystem services in the form of plant species diversity across the area. Based on these results, we suggest that biodiversity conservation in this area should focus not on direct protection of specific species and/or places, with probably higher socioeconomic costs, but on dynamic landscape conservation measures such as indirect land-use regulations and incentives. Such measures, in consideration of balancing traditional and modern agricultures, can be applicable to other existing and candidate GIAHS sites in the world. They could be inspiration not only for already developed regions with changing traditional land uses and existing infrastructures, but also for still developing regions, where required modern agricultural facilities coexisted with long-standing local agroecological environments.

Supplementary Materials

The following is available online at https://0-www-mdpi-com.brum.beds.ac.uk/article/10.3390/land10060559/s1, Table S1: List of species observed in our field vegetation survey.

Author Contributions

Y.H. acquired research funding, managed research design and planning, conducted field surveys especially on topography and landform transformation, generated maps, and wrote the manuscript. S.O. and Y.U. conducted vegetation field surveys. K.I. conducted statistical analysis of vegetation composition. Y.T. produced the 1974 land-use map. A.N. identified plant species. Y.S. conducted field interviews. All authors have read and agreed to the published version of the manuscript.

Funding

This study was supported by the Mitsui & Co. Environment Fund (R16-0021). See also at: https://www.mitsui.com/jp/ja/sustainability/contribution/fund/results/1224438_13007.html (accessed on 24 May 2021).

Acknowledgments

We greatly appreciated the cooperation of the local people and officials during our field investigations. We also thank Chizuko Hirai (GIS specialist in plusGIS; see https://plusgis.weebly.com) for preparing the DEM dataset.

Conflicts of Interest

The authors declare no conflict of interest.

References

  1. Takahashi, Y.; Park, K.J.; Natori, Y.; Dublin, D.; Dasgupta, R.; Miwa, K. Enhancing synergies in nature’s contributions to people in socio-ecological production landscapes and seascapes: Lessons learnt from ten site-based projects in biodiversity hotspots. Sustain. Sci. 2021. [Google Scholar] [CrossRef]
  2. Okubo, S.; Parikesit; Harashina, K.; Muhamad, D.; Abdoellah, O.S.; Takeuchi, K. Traditional perennial crop-based agroforestry in West Java: The tradeoff between on-farm biodiversity and income. Agroforest. Syst. 2010, 80, 17–31. [Google Scholar] [CrossRef]
  3. Hara, Y.; Yamaji, K.; Yokota, S.; Thaitakoo, D.; Sampei, Y. Dynamic wetland mosaic environments and Asian openbill habitat creation in peri-urban Bangkok. Urban Ecosyst. 2018, 21, 305–322. [Google Scholar] [CrossRef] [Green Version]
  4. Yamada, S.; Kusumoto, Y.; Tokuoka, Y.; Yamamoto, S. Landform type and land improvement intensity affect floristic composition in rice paddy fields from central Japan. Weed Res. 2010, 51, 51–62. [Google Scholar] [CrossRef]
  5. Globally Important Agricultural Heritage Systems (GIAHS) (by UN FAO). Available online: http://www.fao.org/giahs/en/ (accessed on 28 March 2021).
  6. Zhang, Y.; Min, Q.; Li, H.; He, L.; Zhang, C.; Yang, L. A Conservation Approach of Globally Important Agricultural Heritage Systems (GIAHS): Improving Traditional Agricultural Patterns and Promoting Scale-Production. Sustainability 2017, 9, 295. [Google Scholar] [CrossRef] [Green Version]
  7. Niles, D. Agricultural Heritage and Conservation Beyond the Anthropocene. In The Oxford Handbook of Public Heritage Theory and Practice; Labrador, A.M., Silberman, N.A., Eds.; Oxford University Press: Oxford, UK, 2018. [Google Scholar] [CrossRef]
  8. Niles, D.; Roth, R. Conservation of Traditional Agriculture as Living Knowledge Systems, Not Cultural Relics. J. Resour. Ecol. 2016, 7, 231–236. [Google Scholar] [CrossRef] [Green Version]
  9. Kajihara, H.; Zhang, S.; You, W.; Min, Q. Concerns and Opportunities around Cultural Heritage in East Asian Globally Important Agricultural Heritage Systems (GIAHS). Sustainability 2018, 10, 1235. [Google Scholar] [CrossRef] [Green Version]
  10. He, S.; Li, H.; Min, Q. Is GIAHS an Effective Instrument to Promote Agrosystem Conservation? A Rural Community’s Perceptions. J. Resour. Ecol. 2020, 11, 77–86. [Google Scholar] [CrossRef]
  11. Hara, Y.; Sampei, Y.; Tanaka, K. The Minabe-Tanabe Ume System: Linkage of Landscape Units by Locals. Sustainability 2018, 10, 1079. [Google Scholar] [CrossRef] [Green Version]
  12. Map Tile of 1974 Aerial Photograph by Geospatial Information Authority of Japan. Available online: https://cyberjapandata.gsi.go.jp/xyz/gazo1/{z}/{x}/{y}.jpg (accessed on 31 March 2021).
  13. KYOUWA Co., Ltd. Available online: https://www.gis-kyouwa.co.jp (accessed on 28 March 2021). (In Japanese).
  14. 5m Resolution DEM by Geospatial Information Authority of Japan. Available online: https://fgd.gsi.go.jp/download/menu.php (accessed on 31 March 2021). (In Japanese)
  15. Braun-Blanquet, J. Pflanzensoziologie. Grundzuge der Vegetationskunde, 3rd ed.; Springer: Vienna, Austria, 1964. [Google Scholar]
  16. McCune, B.; Mefford, M.J. PC-ORD. Multivariate Analysis of Ecological Data, Version 4.0; MjM Software Design: Gleneden Beach, OR, USA, 1999. [Google Scholar]
  17. R Core Team. R Software Version 3.6.2. 2019. Available online: https://cran.r-project.org/bin/windows/base/old/3.6.2/ (accessed on 21 May 2021).
  18. GIAHS Application Proposal of Minabe-Tanabe Ume System. Available online: https://www.giahs-minabetanabe.jp/en/downloads/ (accessed on 30 March 2021).
  19. Motoyasu, Y.; Hara, Y. Satoyama Landscape Change in the Periphery of a Japanese Regional City from 1884 to 2002: A Case Study in Wakayama Prefecture. In Proceedings of the International Symposium on City Planning 2011, Gyeongju, Korea, 25–27 August 2011; pp. 529–538. Available online: http://repository.center.wakayama-u.ac.jp/2793 (accessed on 24 May 2021).
  20. Ohmori, H. Characteristics of the erosion rate in the Japanese mountains from the viewpoint of climatic geomorphology. Z. Geomorphol. Suppl. 1983, 46, 1–14. [Google Scholar]
  21. Hara, Y.; Tanouchi, H. Maximizing Ordinary Location Environment and Ecosystem of Suburban University with Cut-Fill Land Development in Japan for Disaster Prevention Research and Education: A Case in Wakayama University. Res. Rep. Center Educ. Res. Disaster Sci. Wakayama Univ. 2018, 2, 50–54. (In Japanese) [Google Scholar] [CrossRef]
  22. Minabe Town in CO2 Emission Karte per Municipality (by the Ministry of the Environment Japan). Available online: https://www.env.go.jp/policy/local_keikaku/tools/karte.html (accessed on 26 March 2021). (In Japanese)
  23. Hara, Y.; Tsuchiya, K.; Matsuda, H.; Yamamoto, Y.; Sampei, Y. Quantitative assessment of the Japanese “local production for local consumption” movement: A case study of growth of vegetables in the Osaka city region. Sustain. Sci. 2013, 8, 515–527. [Google Scholar] [CrossRef]
  24. Typical Coefficients for Calculating CO2 Emission by Energy Source (by the Ministry of the Environment Japan). Available online: https://www.env.go.jp/council/16pol-ear/y164-04/mat04.pdf (accessed on 28 March 2021). (In Japanese)
  25. Hara, Y.; Thaitakoo, D.; Takeuchi, K. Landform transformation on the urban fringe of Bangkok: The need to review land-use planning processes with consideration of the flow of fill materials to developing areas. Landsc. Urban. Plan. 2008, 84, 74–91. [Google Scholar] [CrossRef]
  26. Nakao, A.; Yamamoto, Y.; Matsui, T.; Shiga, T.; Yoshida, N. Potential of Carbon Credits Creation through Replacing Energy Using Facilities and Utilizing Biomass Fuels in Glasshouse Horticulture. J. Jpn. Soc. Civil. Eng. Ser. G Environ. Res. 2013, 69, II_371–II_382. (In Japanese) [Google Scholar] [CrossRef] [Green Version]
  27. Agricultural Household Level Statistics (by the Ministry of Agriculture, Forestry and Fisheries Japan). Available online: https://www.maff.go.jp/j/tokei/kouhyou/kensaku/bunya3.html (accessed on 28 March 2021). (In Japanese)
  28. Reyes, S.R.C.; Miyazaki, A.; Yiu, E.; Saito, O. Enhancing Sustainability in Traditional Agriculture: Indicators for Monitoring the Conservation of Globally Important Agricultural Heritage Systems (GIAHS) in Japan. Sustainability 2020, 12, 5656. [Google Scholar] [CrossRef]
  29. Santos, J.S.d.; Dodonov, P.; Oshima, J.E.F.; Martello, F.; Jesus, A.S.d.; Ferreira, M.E.; Silva-Neto, C.M.; Ribeiro, M.C.; Collevatti, R.G. Landscape ecology in the Anthropocene: An overview for integrating agroecosystems and biodiversity conservation. Perspect. Ecol. Conserv. 2021, 19, 21–32. [Google Scholar] [CrossRef]
  30. Zimmerer, K.S.; de Haan, S.; Jones, A.D.; Creed-Kanashiro, H.; Tello, M.; Carrasco, M.; Meza, K.; Amaya, F.P.; Cruz-Garcia, G.S.; Tubbeh, R.; et al. The biodiversity of food and agriculture (Agrobiodiversity) in the Anthropocene; Research advances and conceptual framework. Anthropocene 2019, 25, 100192. [Google Scholar] [CrossRef]
  31. Koyanagi, T.; Kusumoto, Y.; Yamamoto, S.; Okubo, S.; Takeuchi, K. Historical impacts on linear habitats: The present distribution of grassland species in forest-edge vegetation. Biol. Conserv. 2009, 142, 1674–1684. [Google Scholar] [CrossRef]
  32. Uchida, K.; Kamura, K. Traditional Ecological Knowledge Maintains Useful Plant Diversity in Semi-natural Grasslands in the Kiso Region, Japan. Environ. Manag. 2020, 65, 478–489. [Google Scholar] [CrossRef] [PubMed]
  33. Uchida, K.; Koyanagi, T.F.; Matsumura, T.; Koyama, A. Patterns of plant diversity loss and species turnover resulting from land abandonment and intensification in semi-natural grasslands. J. Environ. Manag. 2018, 218, 622–629. [Google Scholar] [CrossRef] [PubMed]
  34. Tsuzuki, Y.; Koyanagi, T.F.; Miyashita, T. Plant community assembly in suburban vacant lots depends on earthmoving legacy, habitat connectivity, and current mowing frequency. Ecol. Evol. 2020, 10, 1311–1323. [Google Scholar] [CrossRef] [PubMed]
  35. Ichikawa, K.; Okubo, N.; Okubo, S.; Takeuchi, K. Transition of the satoyama landscape in the urban fringe of the Tokyo metropolitan area from 1880 to 2001. Landsc. Urban Plan. 2006, 78, 398–410. [Google Scholar] [CrossRef]
  36. Sampei, Y.; Hara, Y.; Marcotullio, P.J. Characteristics of Agricultural Conservation Easement in watershed protection program of New York City. J. Jpn. Inst. Landsc. Archit. 2017, 80, 701–706. (In Japanese) [Google Scholar] [CrossRef] [Green Version]
  37. Ordinance on Solar Power Generation Business (by Wakayama Prefectural Government in Japan). Available online: https://www.pref.wakayama.lg.jp/prefg/032000/taiyokojorei/gaiyo.html (accessed on 8 April 2021). (In Japanese)
Figure 1. Study area (land-use data is adapted from [11]).
Land 10 00559 g001
Figure 2. Zoomed-in image of our sample field survey sites (parcel data is adapted from [11]).
Land 10 00559 g002
Figure 3. Drone image from the southern cut-fill sites (foreground) toward the northern traditional sloped sites (background) (acquired on 12 May 2018).
Land 10 00559 g003
Figure 4. Map of changes in land use at the parcel level between 1974 and 2015.
Land 10 00559 g004
Figure 5. Microtopography of the western part of the traditional Ume orchard site based on an ortho drone image (a) and a transect sliced from the point cloud (b).
Land 10 00559 g005
Figure 6. Anthropogenic landform transformation in the Ume orchard pilot farm.
Land 10 00559 g006
Figure 7. Tree diagram of the TWINSPAN results.
Land 10 00559 g007
Figure 8. TWINSPAN groupings for traditional sites overlaid onto the vegetation map.
Land 10 00559 g008
Figure 9. TWINSPAN groupings for cut-fill sites overlaid onto the vegetation map.
Land 10 00559 g009
Figure 10. Differences in the Simpson’s diversity index between two farms by season (a), native species (b), and alien species (c).
Land 10 00559 g010aLand 10 00559 g010b
Table 1. Cross table of areas (in hectares) altered between 1974 and 2015. Numbers in parentheses are average parcel sizes in m2.
2015
1974Ume (Cut-Fill)Ume (Trad.)Citrus etc.RiceForestUninterpretableTotal
Ume (cut-fill)0000000
Ume (trad.)5.83027.627.00029.23089.7
(1461)(1765)(975) (1727)(1482)
Citrus etc.0598.7421.90018.71039.4
(1833)(1739) (1102)(1786)
Rice0.1579.59.0453.804.31046.7
(1187)(785)(636)(639) (1102)(870)
Forest242.9905.615.90041.21205.5
(4291)(2951)(1786) (5570)(3649)
Uninterpretable036.65.75.401.349.0
(890)(1415)(556) (956)(954)
Total248.85148.1479.4459.2094.86430.3
(2313)(1645)(1310)(597) (2228)(1619)
Publisher’s Note: MDPI stays neutral with regard to jurisdictional claims in published maps and institutional affiliations.

