
Long-Term Land Cover Changes in the Western Part of the Korean Demilitarized Zone


1
Research Institute for Agriculture and Life Sciences, Seoul National University, Seoul 08826, Korea
2
DMZ Ecology Research Institute, Paju 10881, Korea
3
School of Biological Sciences, Seoul National University, Seoul 08826, Korea
*
Author to whom correspondence should be addressed.
Land 2021, 10(7), 708; https://0-doi-org.brum.beds.ac.uk/10.3390/land10070708
Submission received: 15 May 2021
/
Revised: 24 June 2021
/
Accepted: 30 June 2021
/
Published: 5 July 2021
(This article belongs to the Section Land Systems and Global Change)
Abstract
:After the Korean War, human access to the Korean Demilitarized Zone (DMZ) was highly restricted. However, limited agricultural activity was allowed in the Civilian Control Zone (CCZ) surrounding the DMZ. In this study, land cover and vegetation changes in the western DMZ and CCZ from 1919 to 2017 were investigated. Coniferous forests were nearly completely destroyed during the war and were then converted to deciduous forests by ecological succession. Plains in the DMZ and CCZ areas showed different patterns of land cover changes. In the DMZ, pre-war rice paddies were gradually transformed into grasslands. These grasslands have not returned to forest, and this may be explained by wildfires set for military purposes or hydrological fluctuations in floodplains. Grasslands near the floodplains in the DMZ are highly valued for conservation as a rare land type. Most grasslands in the CCZ were converted back to rice paddies, consistent with their previous use. After the 1990s, ginseng cultivation in the CCZ increased. In addition, the landscape changes in the Korean DMZ and CCZ were affected by political circumstances between South and North Korea. Our results provide baseline information for the development of ecosystem management and conservation plans for the Korean DMZ and CCZ. Given the high biodiversity and ecological integrity of the Korean DMZ region, transboundary governance for conservation should be designed.
1. Introduction
Transboundary frontiers are areas artificially defined by international political circumstances rather than ecological grounds. Many transboundary areas include high biodiversity and various landscape components [1]. Of mammal species in the Americas, 62% are distributed in transboundary regions [2]. The region between China and Russia is an essential refuge for endangered Amur tigers (Panthera tigris altaica) and Amur leopards (Panthera pardus orientalis) [3,4]. However, since borderlines are often politically sensitive, proper governance may not be arranged, resulting in indiscriminate poaching, and militarized frontiers may affect the ecosystem through military activities. In this context, close cooperation on the national and international levels was emphasized for habitat connectivity and ecological integrity [5,6,7].
The Korean Demilitarized Zone (DMZ) forms a unique transboundary ecosystem across the middle of the Korean Peninsula, dividing it into South and North Korea. As established by the Korean Armistice Agreement in 1953, the DMZ is 4 km wide (2 km to the south and 2 km to the north of the military demarcation line) and 248 km long at a latitude of roughly 38° N. At the same time, the South Korean military established the Civilian Control Zone (CCZ), a concordant area 5–10 km to the south of the DMZ. Access to the DMZ has been strictly prohibited for nearly seven decades, since the end of the Korean War, except for certain members of the military defense force, including soldiers posted in the Panmunjom Joint Security Area, and a few authorized civilians, such as the residents of the villages of Daeseong-dong and Kijong-dong in South and North Korea, respectively. Limited agricultural activity is permitted in the CCZ, and this limited access has resulted in exceptionally high biodiversity in the region [8]. The DMZ and CCZ have drawn international attention due to both military tension from the Cold War, and for their remarkably high biodiversity and unique ecosystem.
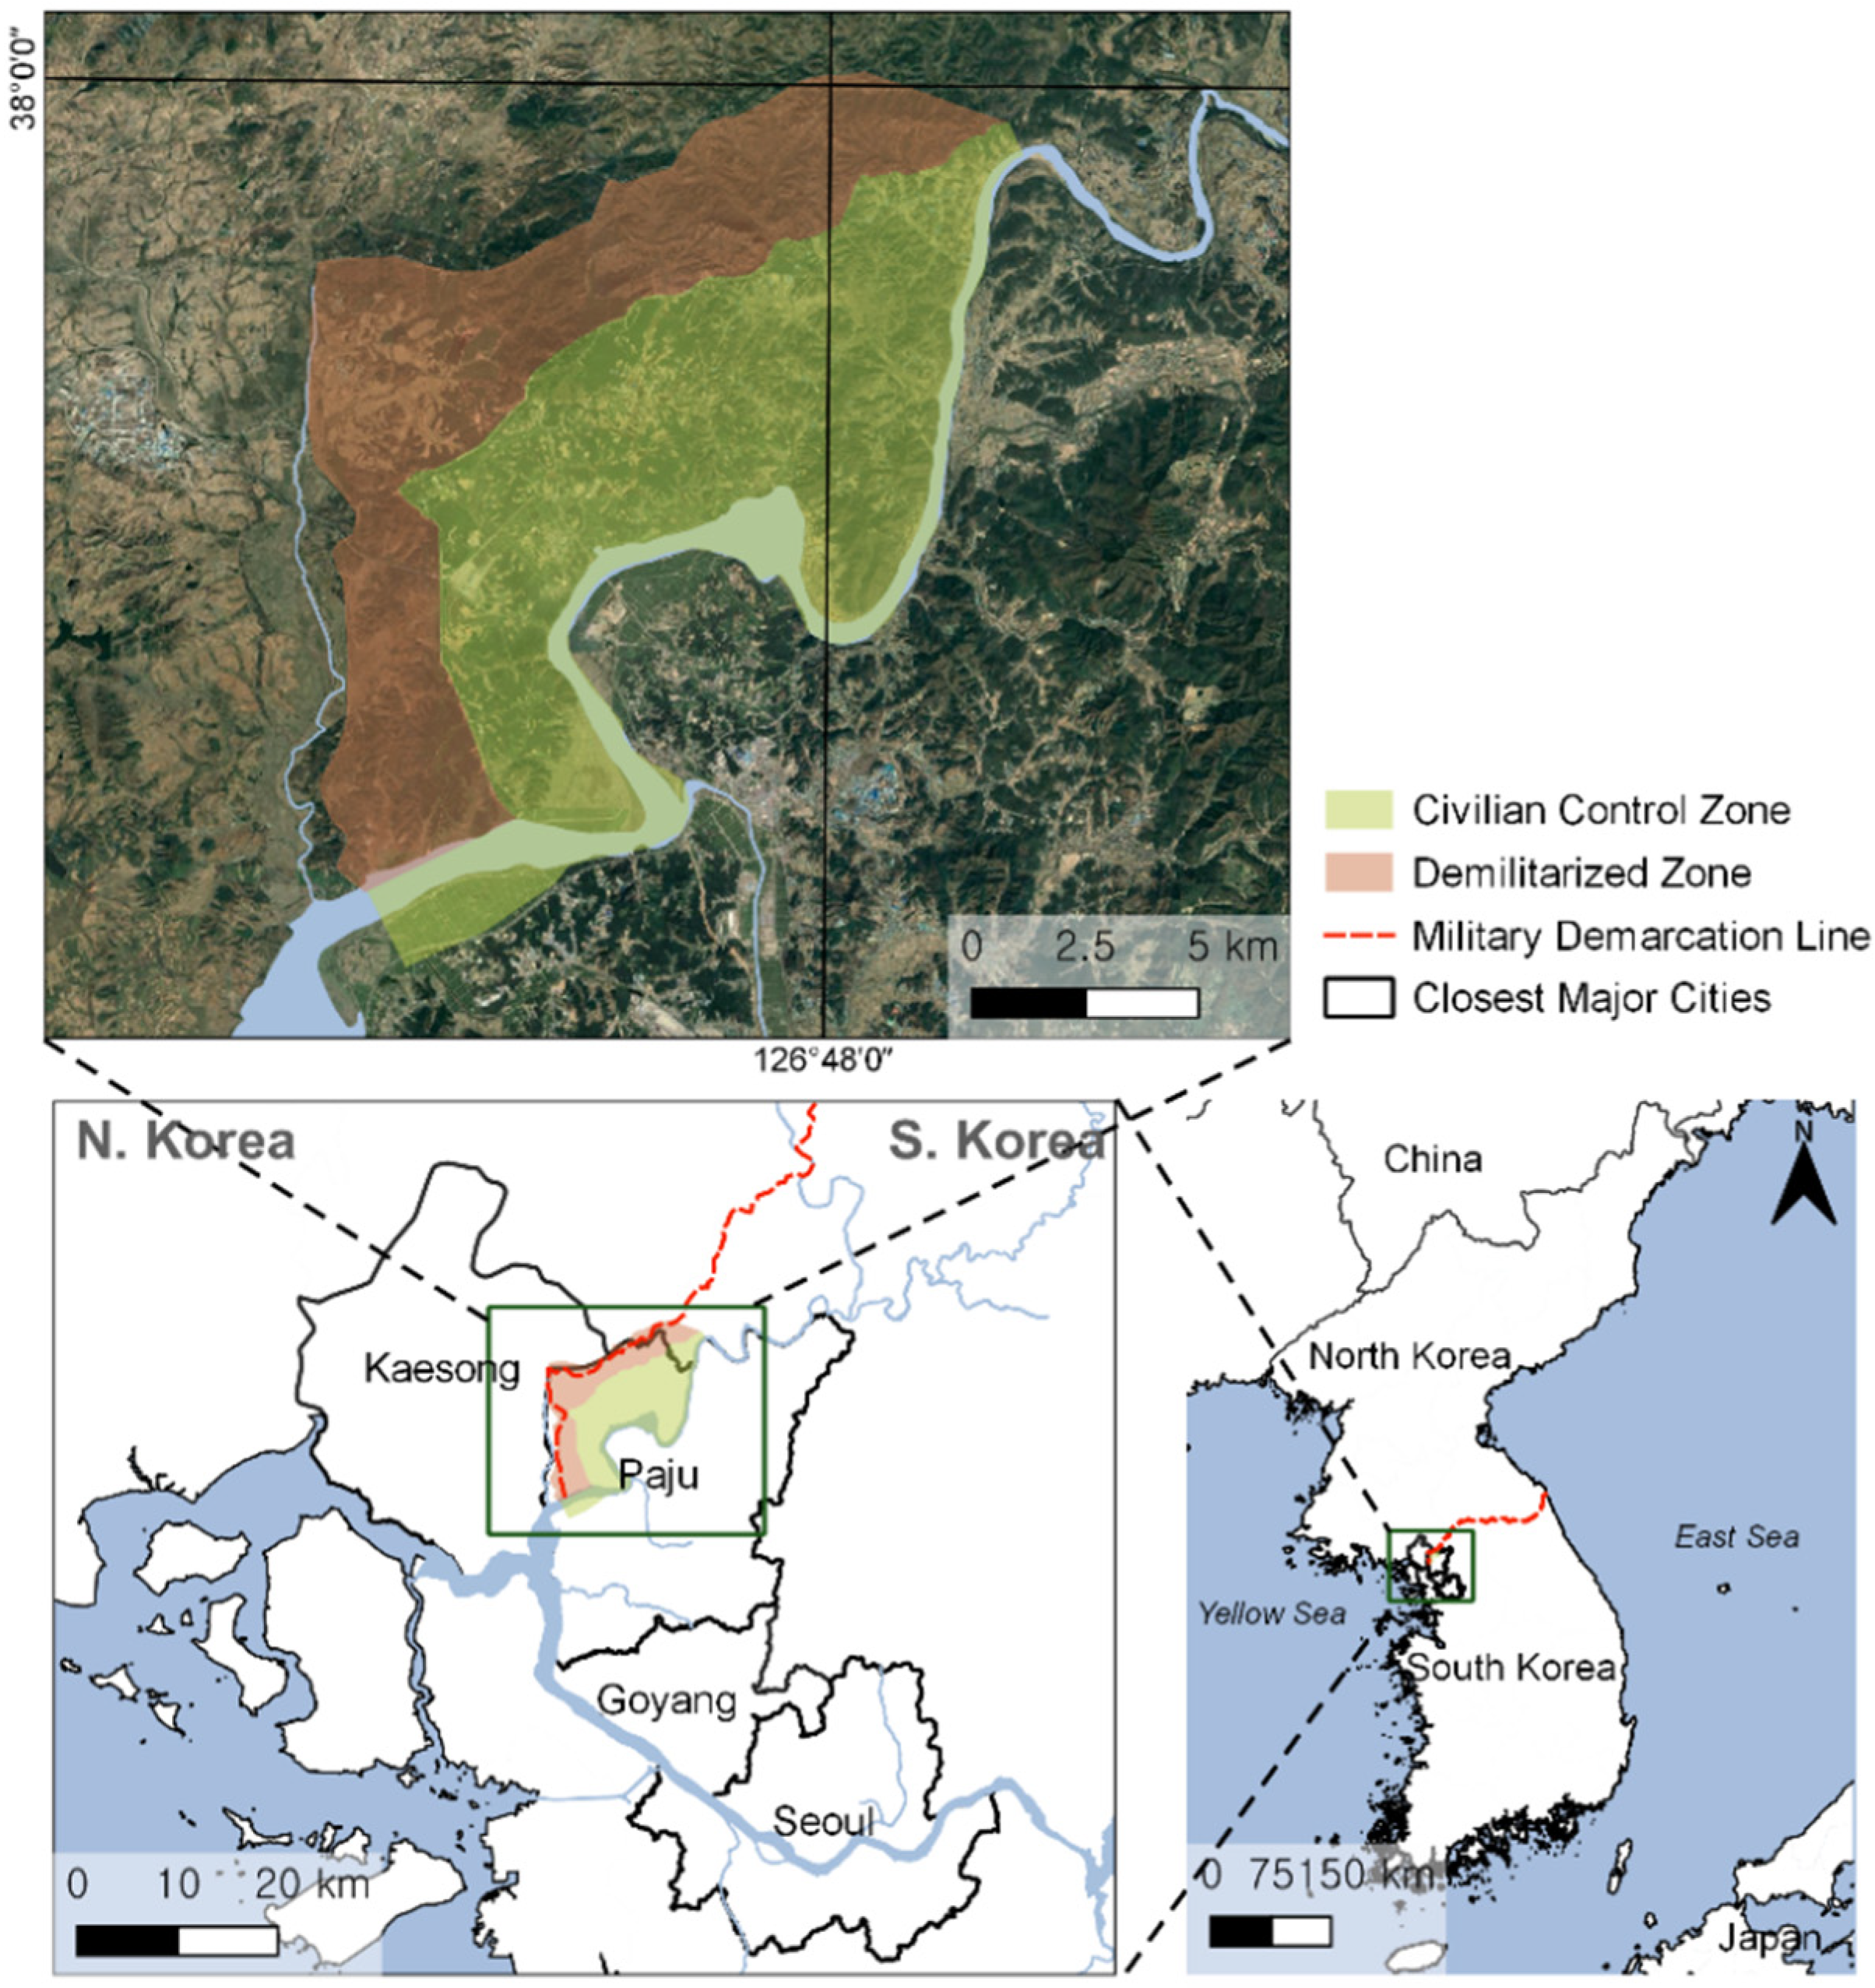
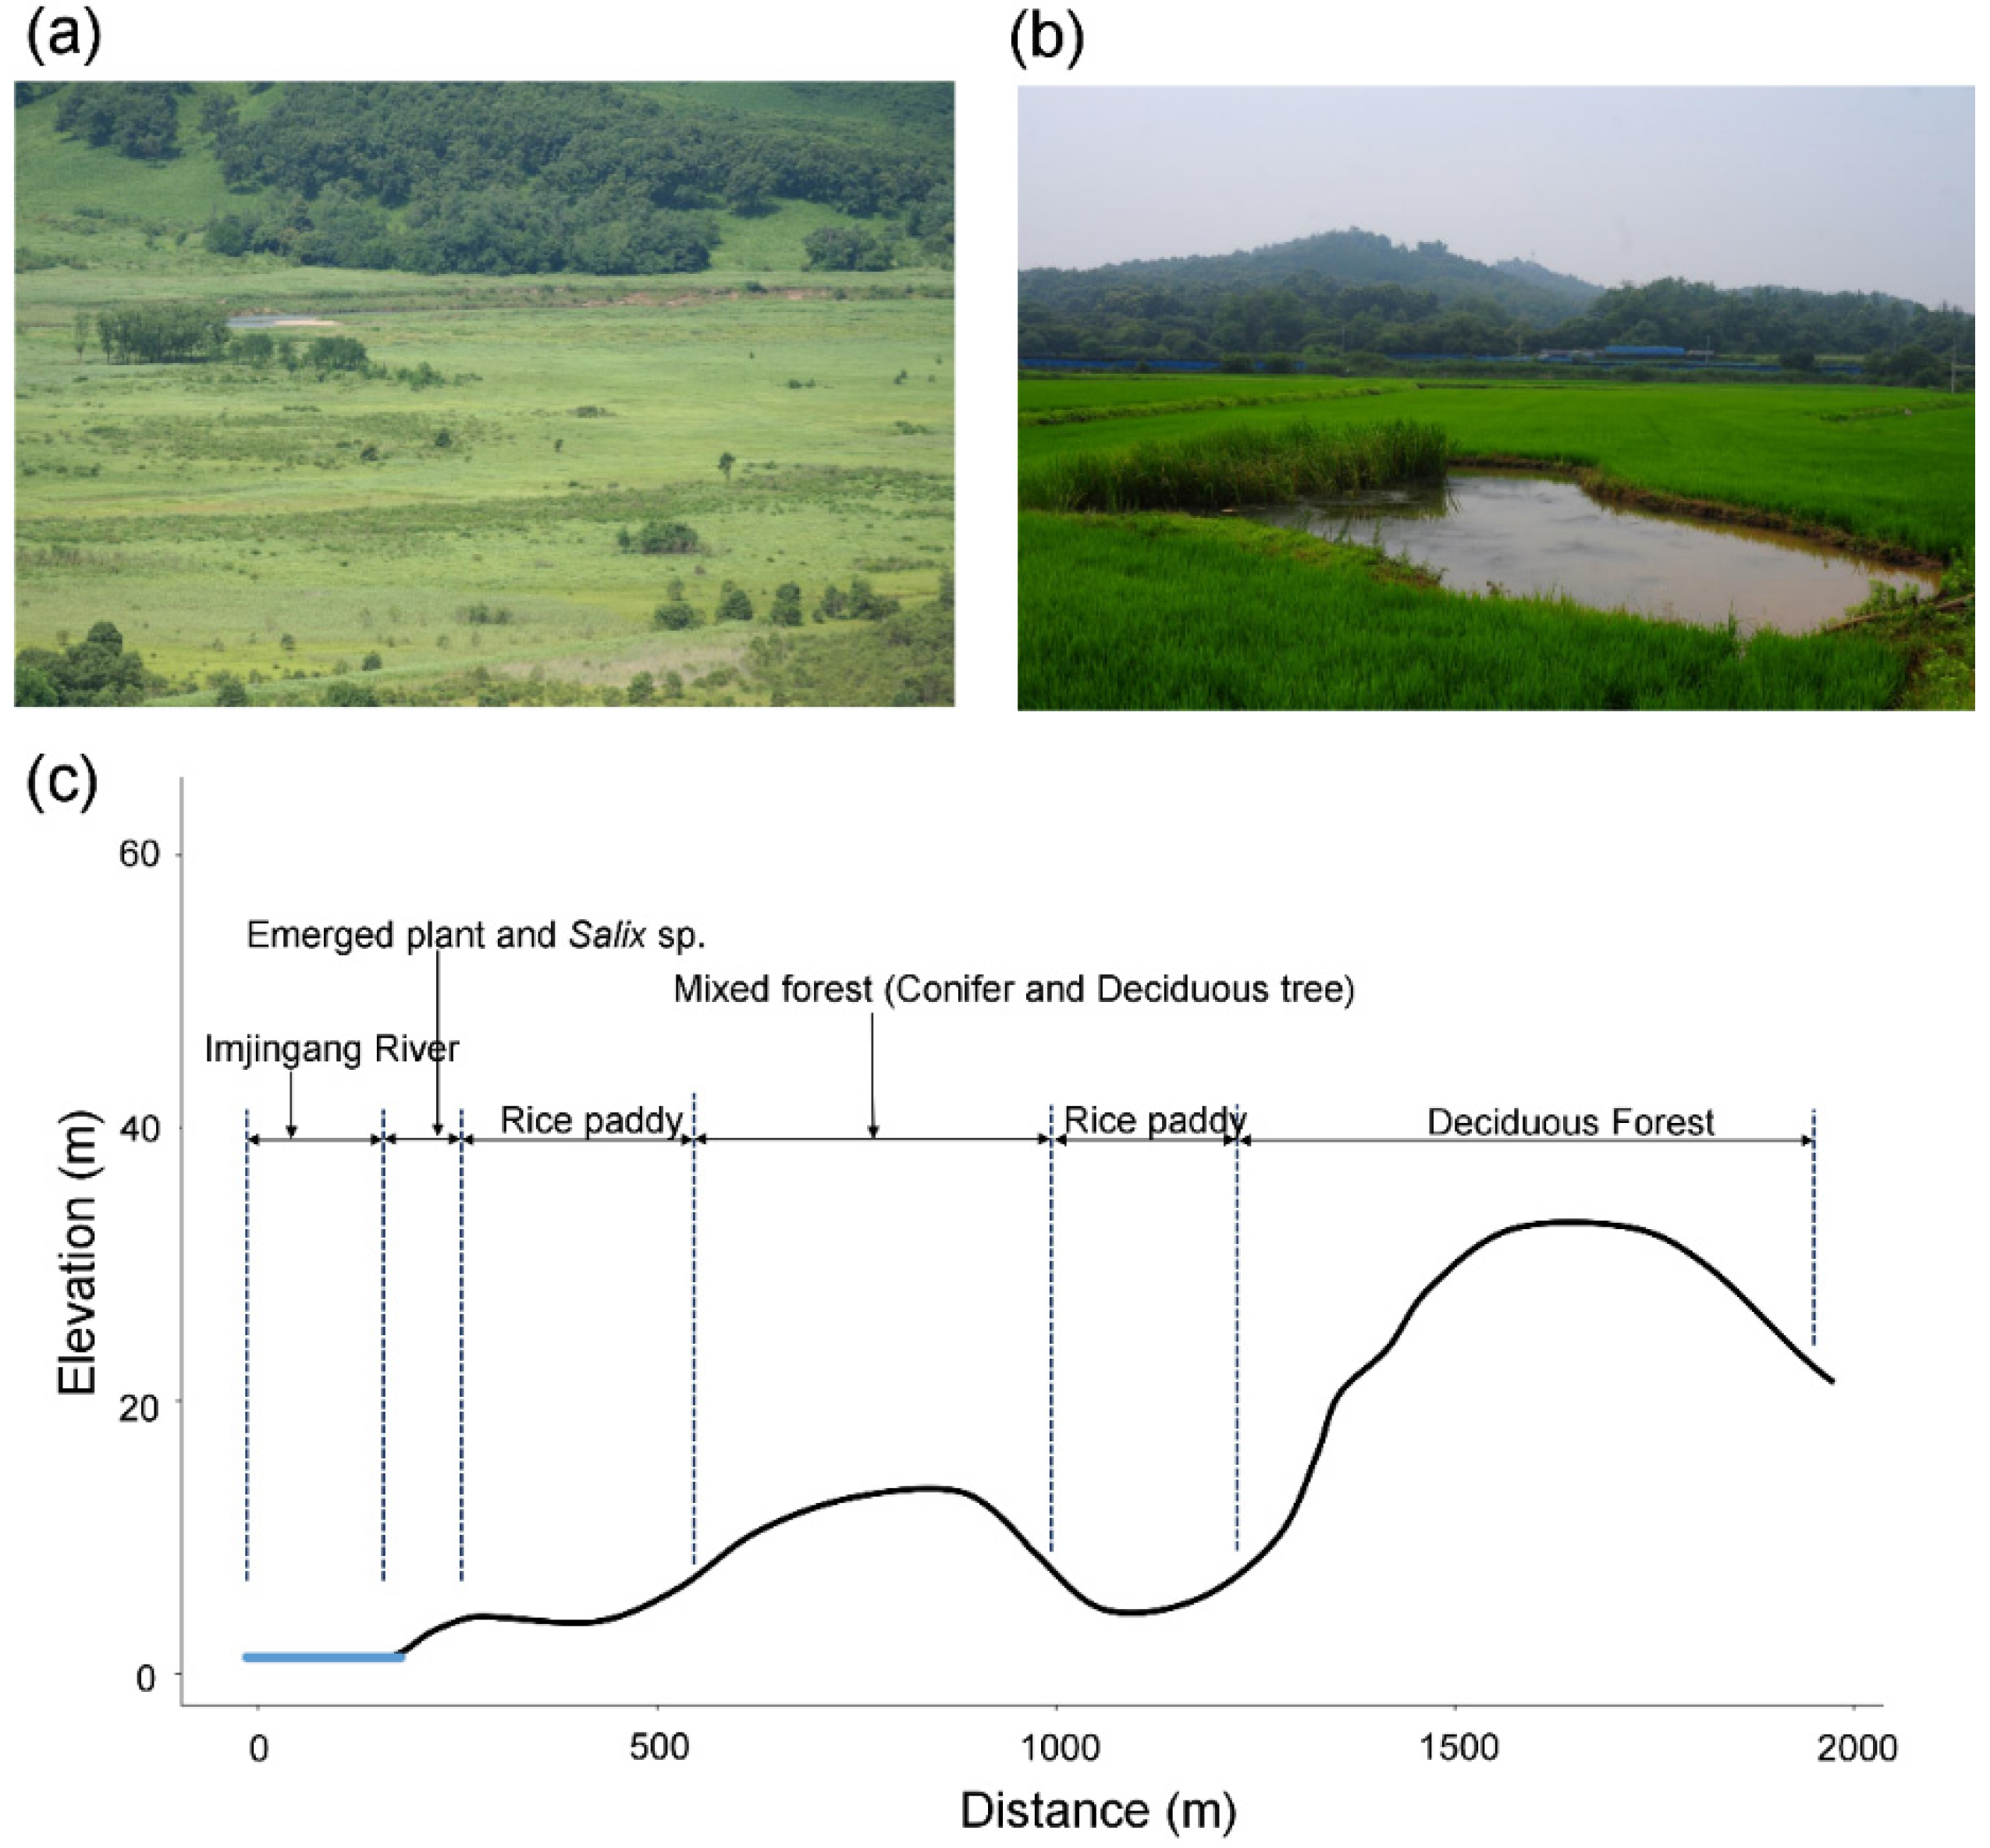
The landscapes of the whole DMZ are classified according to three major features [9]. The eastern region of the DMZ is best characterized as rugged mountains, and the central part is wide open plains. The western region of the DMZ and CCZ is characterized by particularly high biodiversity due to the heterogeneous landscapes with rolling topography, estuaries, floodplains, and traditional agricultural areas (Figure 1 and Figure 2). While the DMZ remains inaccessible, agriculture has been promoted in the CCZ of South Korea since the 1970s with the establishment of the village of Tongilchon, just 4.5 km south of the Military Demarcation Line. The inhabitants built the village from scratch, cultivating fields of beans, ginseng, and rice. Even though the agricultural system in Korea has been modernized, the traditional landscape in the CCZ has been preserved [10] including the dumbeong system (Figure 2b), which irrigates 89% of the rice paddies in the western CCZ, thus helping to maintain its biodiversity [11,12,13]. The Korean dumbeong system provides shelter for wildlife even under extreme conditions [13,14]. The traditional landscape elements that make up the western region of the DMZ and the CCZ include small hills, wide plains, nonconcrete waterways, groves, forests, and streams flowing into brackish water (Figure 2). The Hangang and Imjingang riversides, with a huge tidal marsh consisting of emergent plants (e.g., reeds), Salix sp., mixed forests, and broadleaf forests are principal wintering and stopover sites for migratory birds, and a vast sanctuary for invertebrates (Figure 2c).
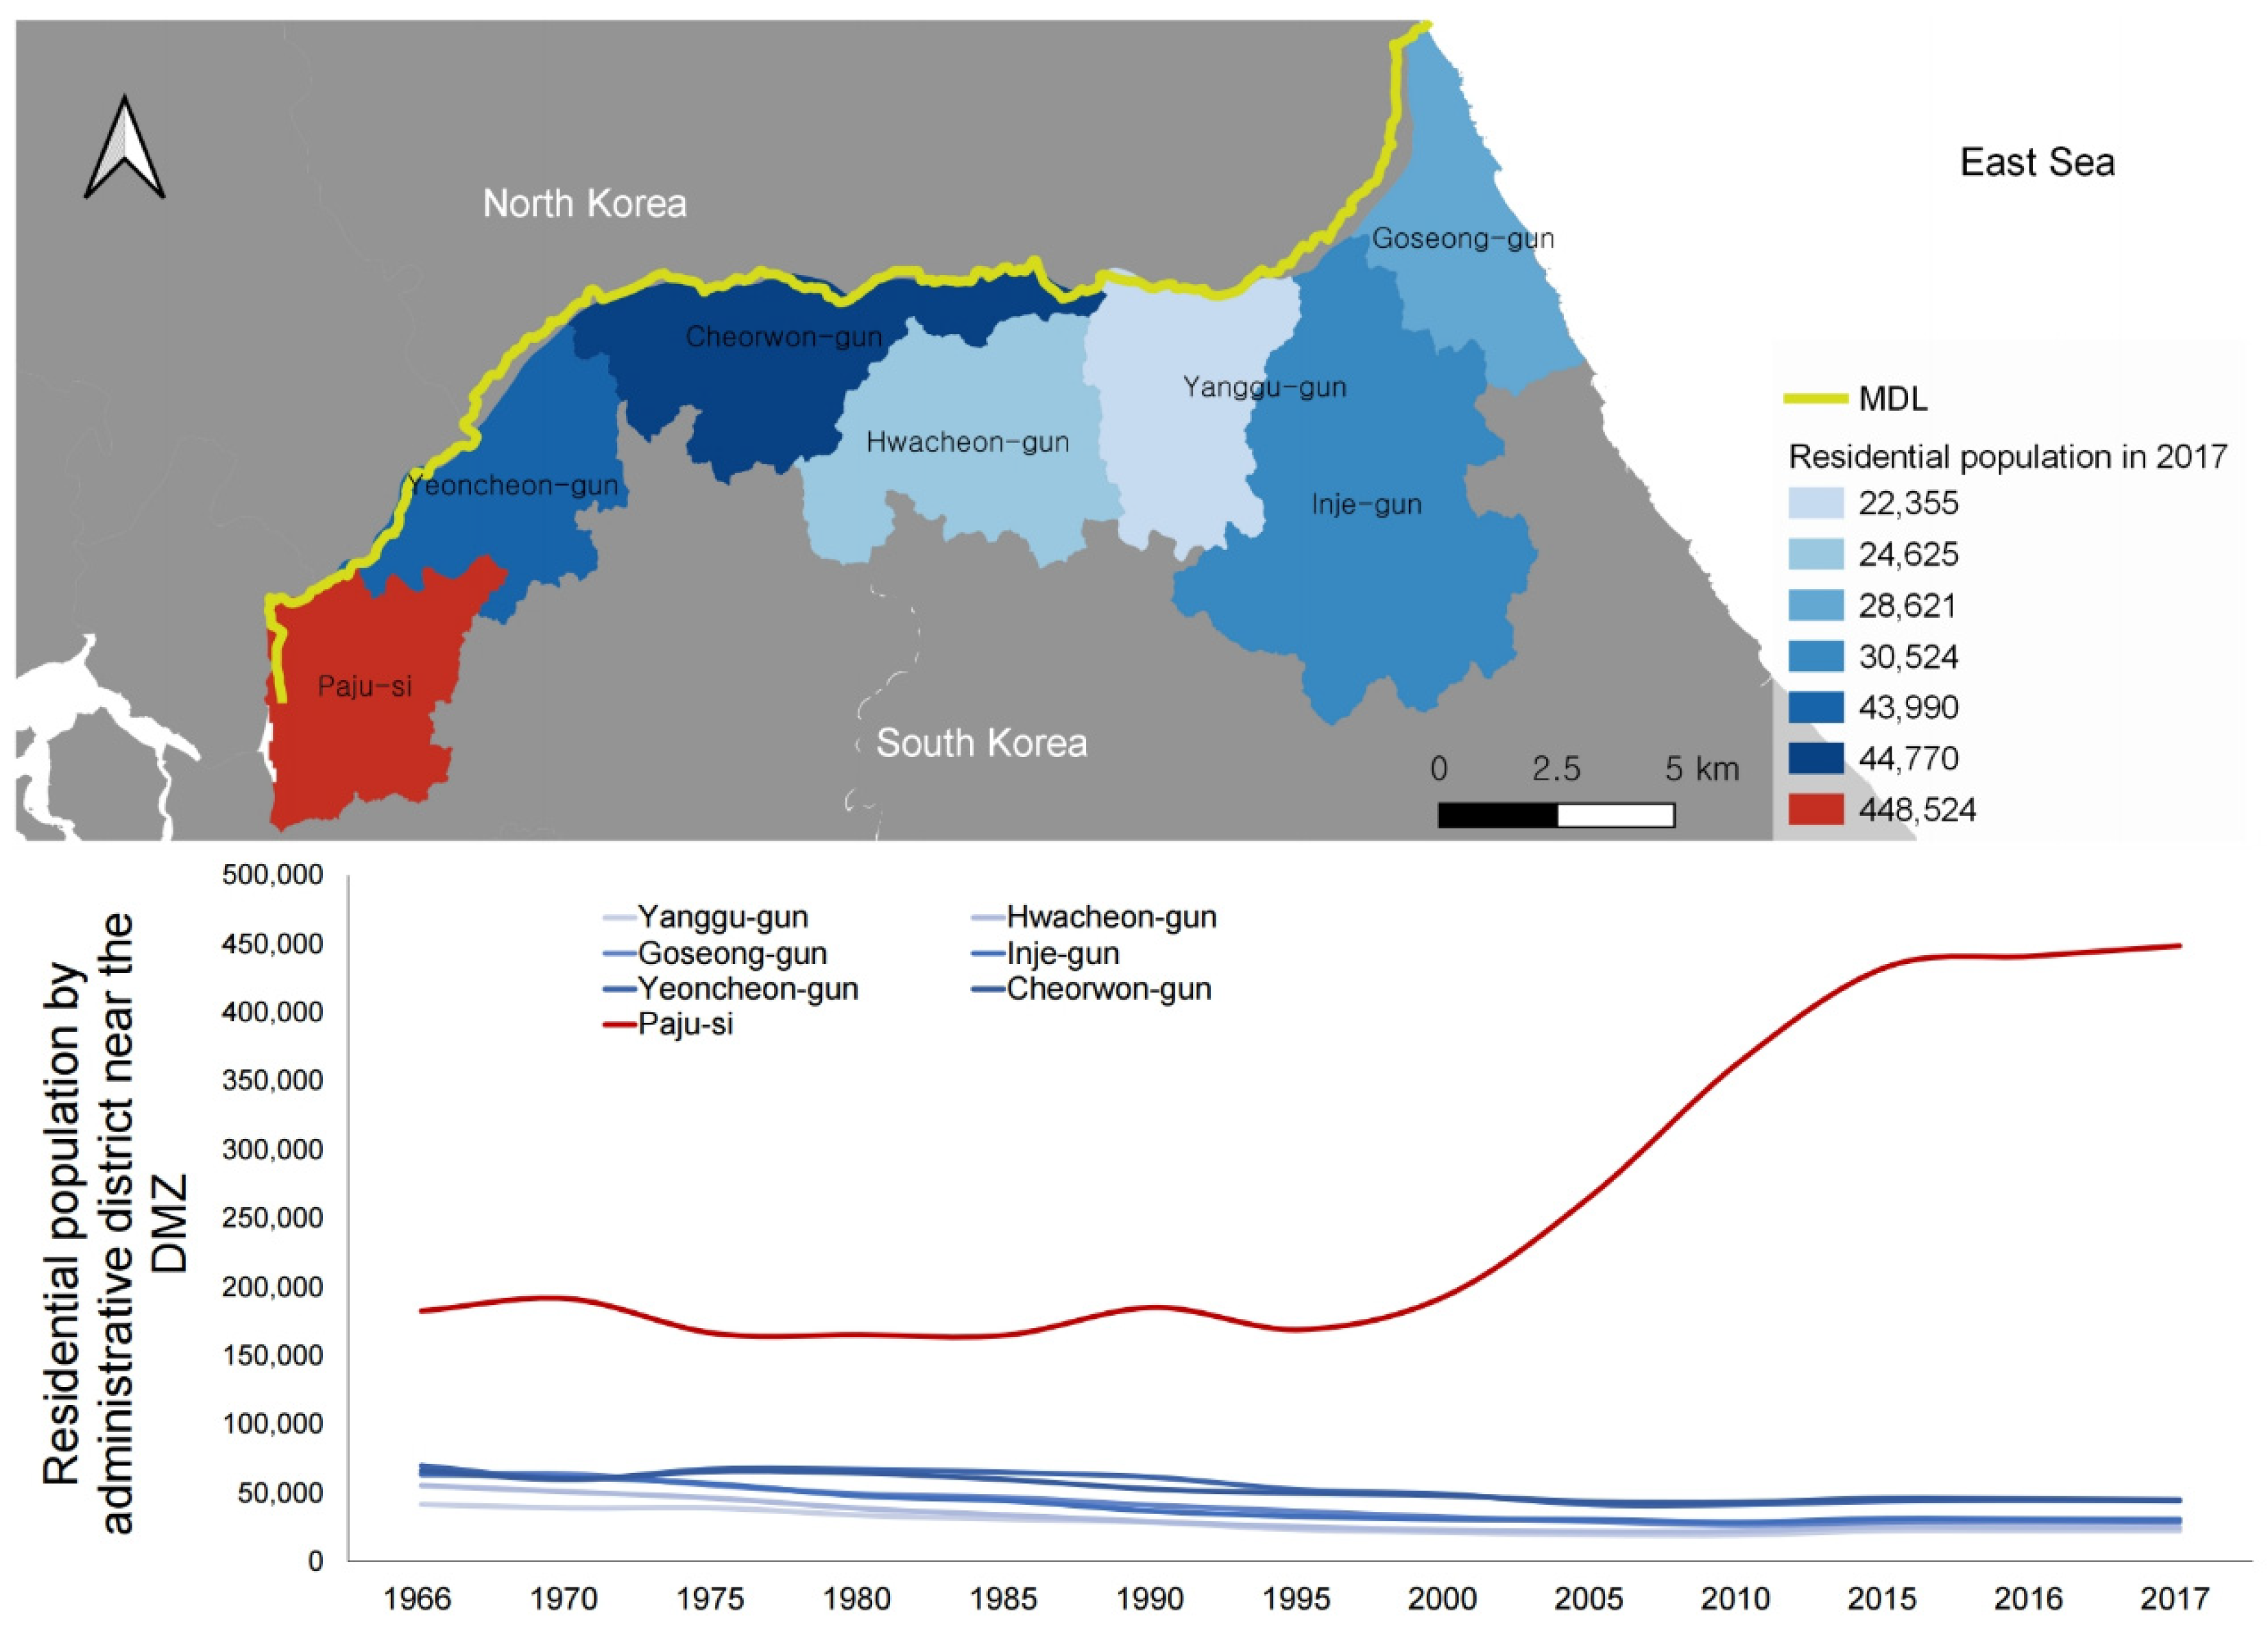
However, biodiversity in the DMZ and CCZ is threatened by the intense demand for commercial development owing to their proximity to Seoul, the metropolitan capital city of South Korea (Figure 1, Figure 2 and Figure 3) [15,16]. In addition, improvements in inter-Korean relations may encourage property speculation [17]. Because Kaesong, the flagship city for inter-Korean exchange, and Pyongyang, the capital city of North Korea, are located in the western region of the Korean Peninsula, efforts to connect the cities with cites in South Korea have been growing (Figure 3). In addition, because Paju has long cultivated Korean ginseng, a widely known traditional medicine, the cultivation of cash crops is another threat to regional biodiversity [18,19,20]. Despite the ecological value of the Korean DMZ, military activity, geopolitical factors, and economic feasibility have made it challenging to design conservation plans for the western DMZ and CCZ.
Given the decades of limited access, the biological features of the Korean DMZ and CCZ should be explored in detail. However, studies focused on the flora and fauna of the DMZ and CCZ ecosystems, and are typically limited to species inventories and habitat descriptions [21,22,23]. Restrictions of access to the Korean DMZ have enabled a wide range of species to flourish; however, ecological research is limited. From basic genetic studies of the DMZ ecosystem to complex studies considering various biological factors, it is necessary to characterize the ecosystem by multiple approaches.
Considering that it is impossible to enter the DMZ, remote-sensing methodology that does not require physical access to the region is a promising approach. Remote sensing can be used to investigate long-term changes in a specific region and over vast geographical ranges [24]. In particular, LANDSAT imagery has been available since 1972, and most land covers on Earth have been recorded. Thus, it is possible to track anthropogenic effects on ecosystems over five decades [25,26]. More recently, remote sensing in combination with geographical information systems (GIS) has been increasing to allow for long-term monitoring and finding factors associated with changes in land cover [27].
Long-term analyses of land cover could help to explore changes in ecosystems over extended periods, and results could yield important information about ecological parameters [28] and targets for restoration [29]. Additionally, the long-term tracking of landscape changes is an integral part of conservation planning and the maintenance of biodiversity.
However, very little is known about temporal and spatial changes in the landscape of the Korean DMZ and CCZ. Natural succession over several decades in these regions is worth exploring to investigate changes in temperate biomes in the absence of human interference. To characterize the Korean DMZ ecosystem, investigations of landscape structures in the Korean DMZ area are essential. Understanding land use and cover changes can clarify factors affecting changes in the Korean DMZ ecosystem.
This study investigated landscape changes in the Korean DMZ and CCZ during the last 100 years. The DMZ and CCZ are in an ecological zone; however, the Korean DMZ ecosystem is exclusively off-limits to people, whereas the CCZ has allowed for some civilian activities. Thus, we examined the CCZ ecosystem by biota surveys, and the DMZ ecosystem on the basis of satellite images and supplementary observations via the CCZ. From a map made during the Japanese colonial period to satellite images from the 2010s, changes in landscape elements were tracked, and natural and artificial factors that contributed to these changes were evaluated.
2. Materials and Methods
2.1. Study Area
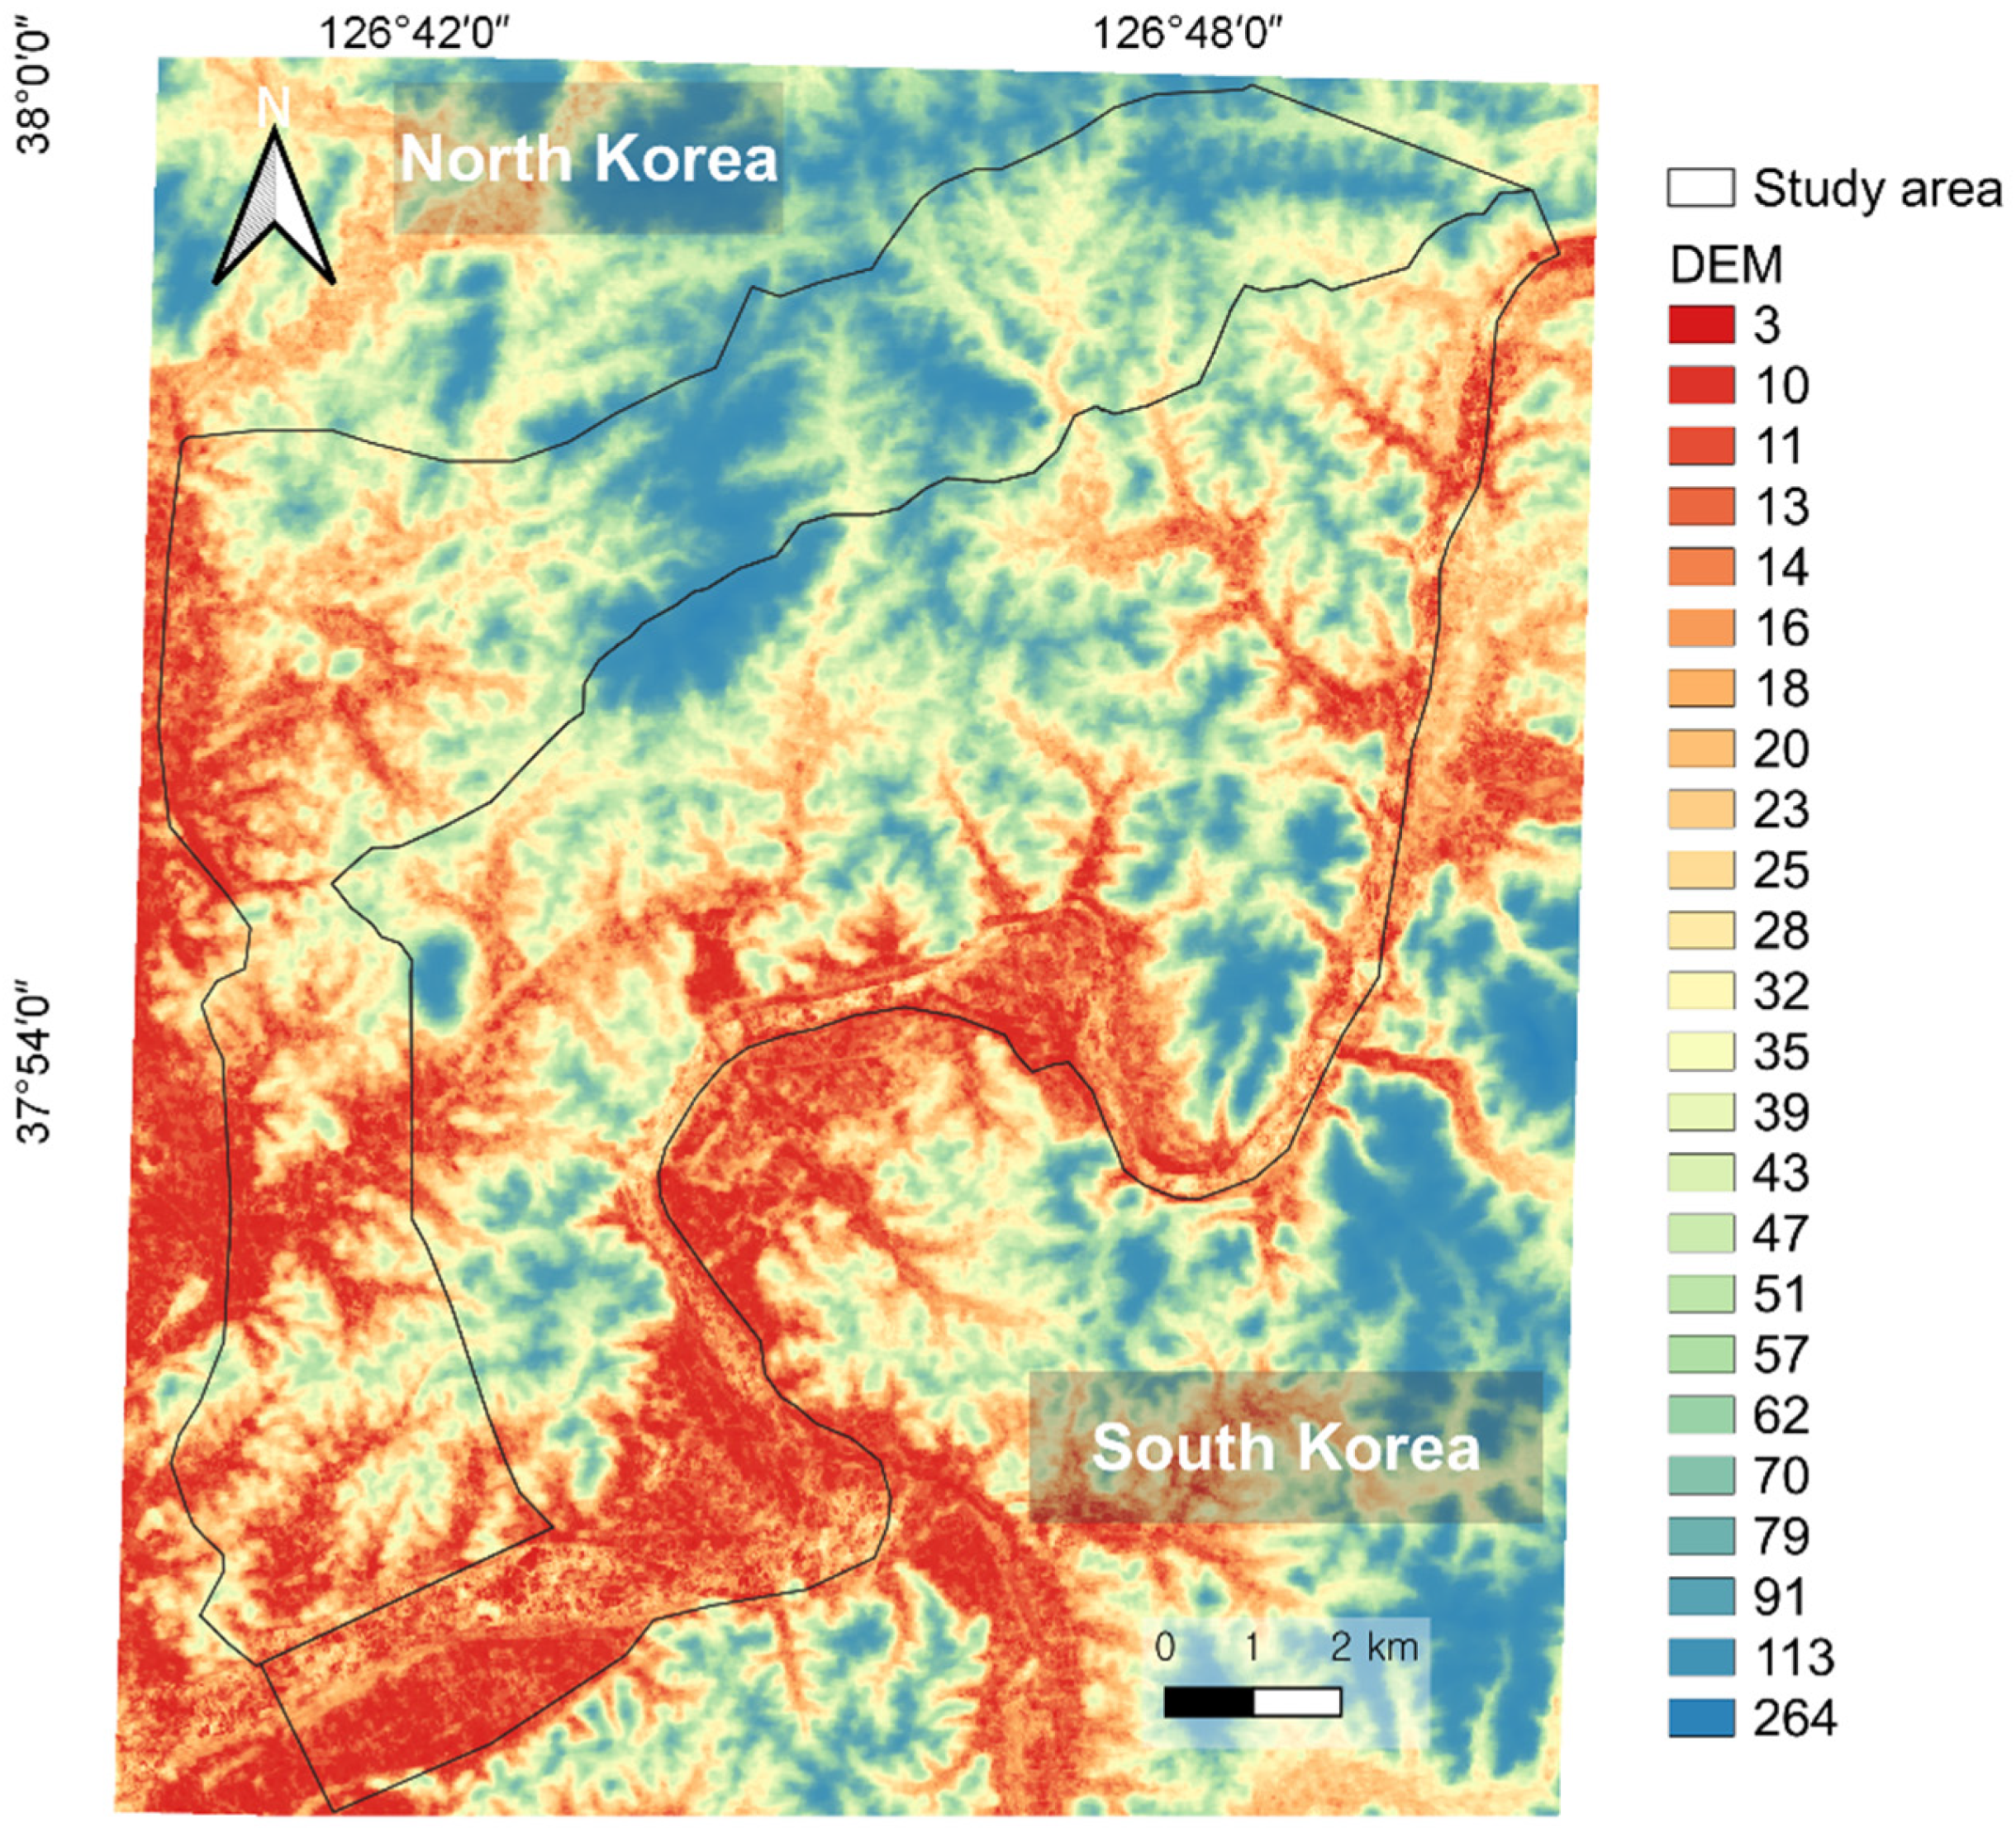
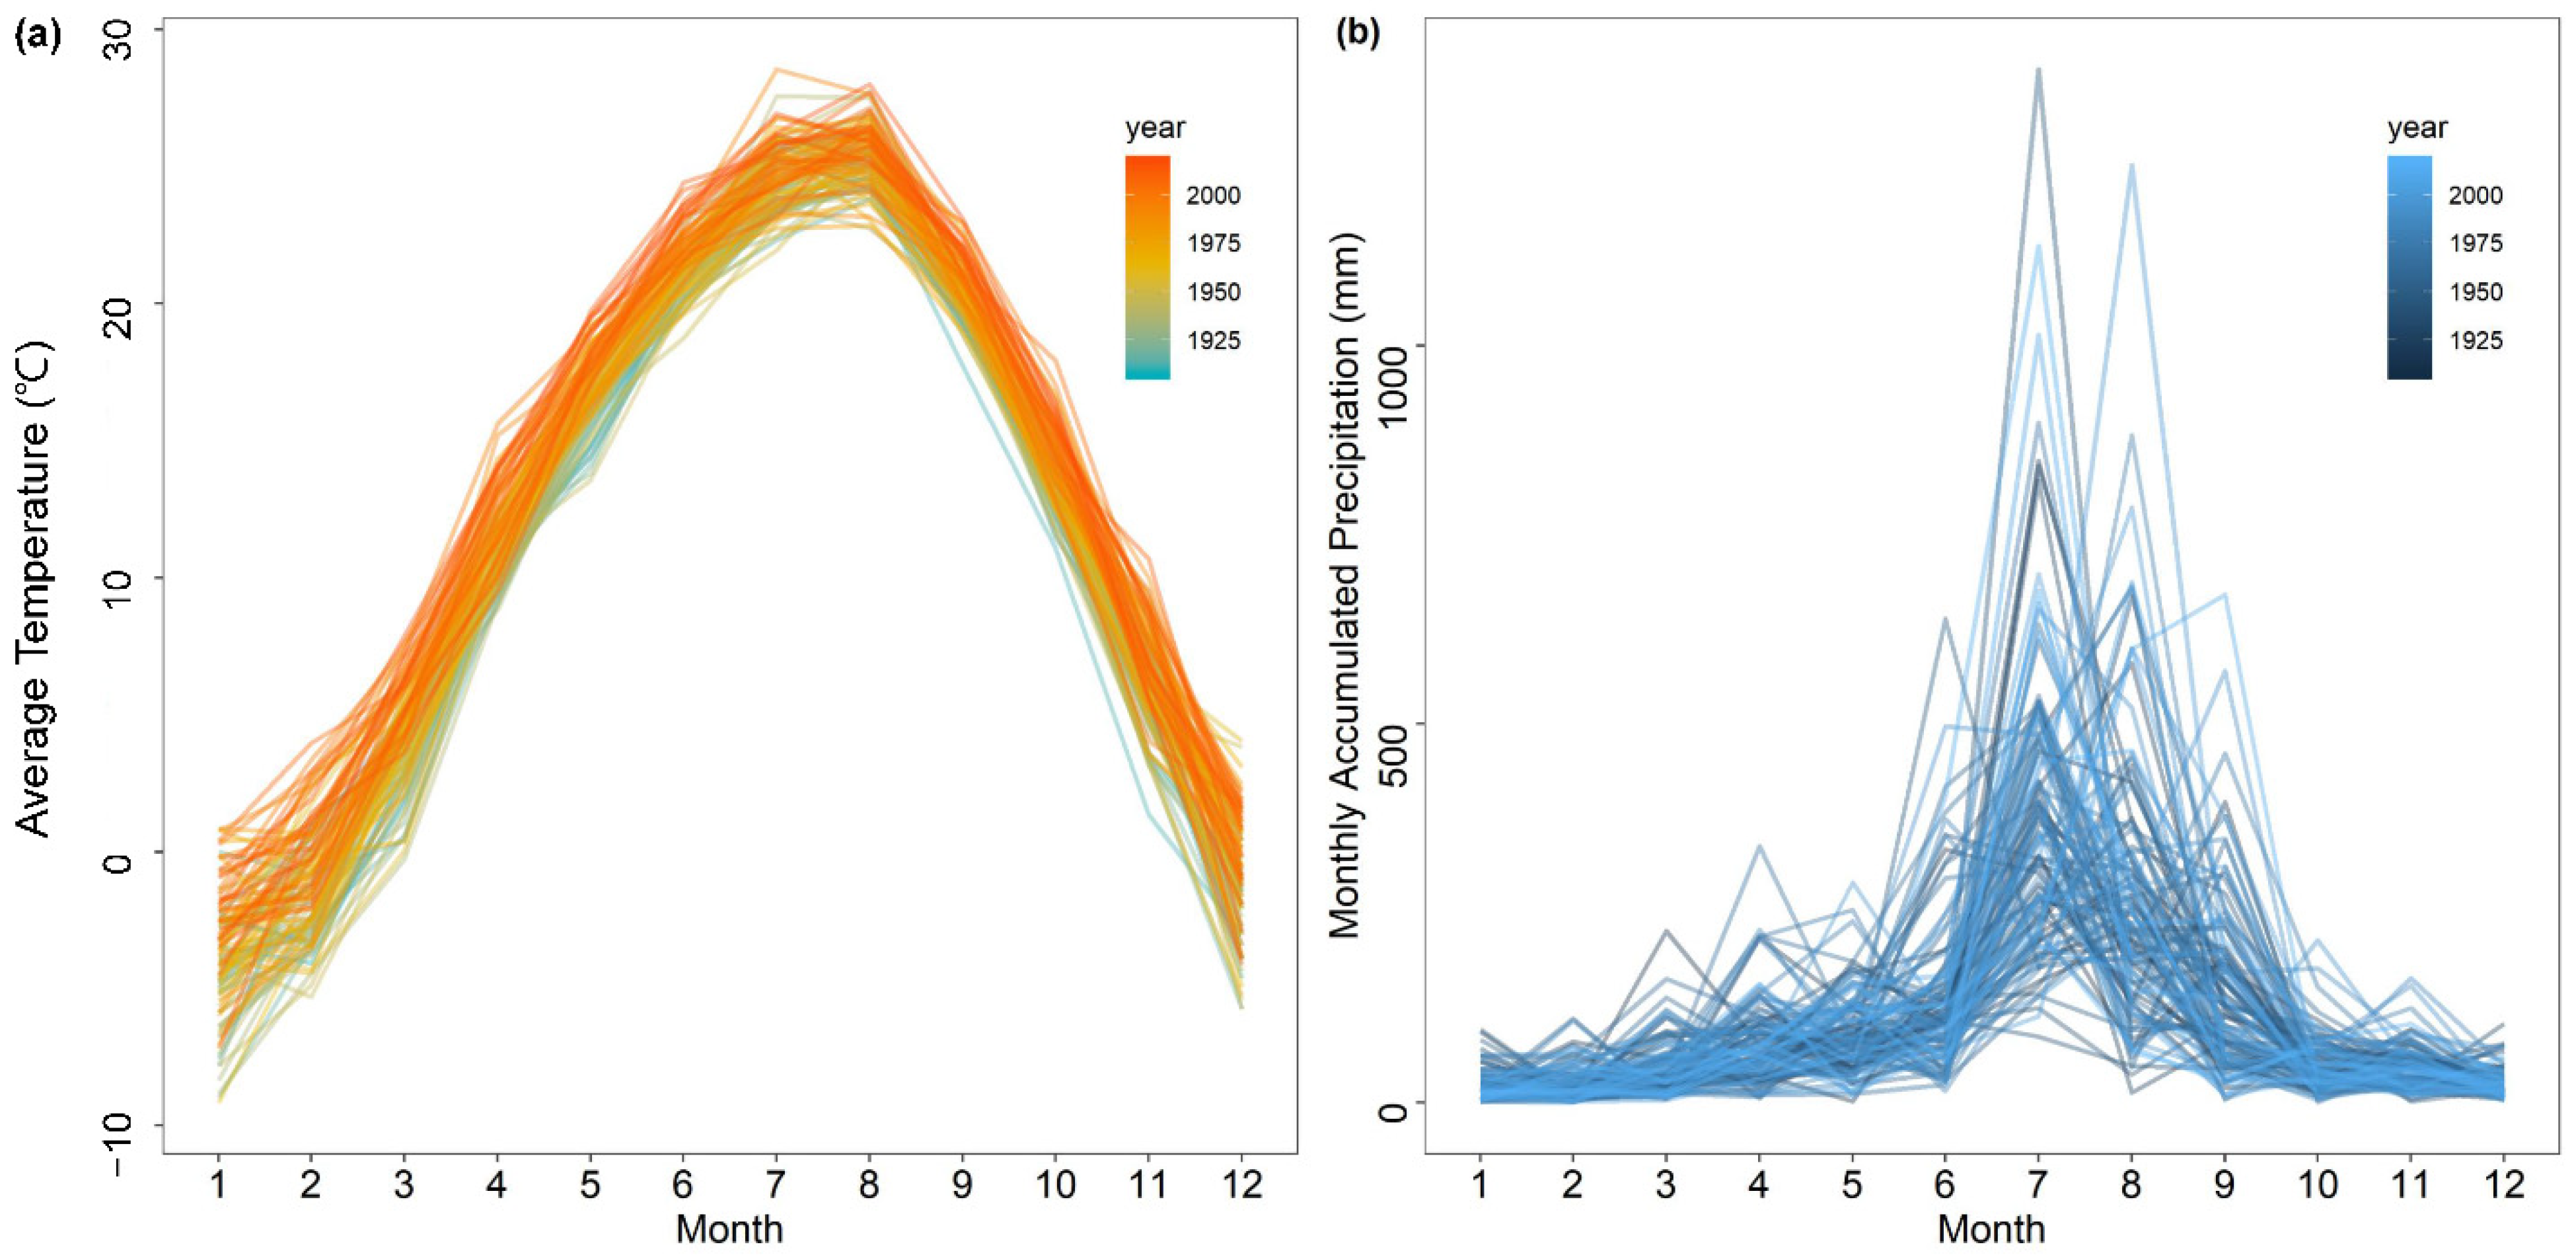
Our study area covered the western DMZ and CCZ (6,987 ha and 10,427 ha), corresponding to the city of Paju-si and parts of Yeoncheon-gun county of Gyeonggi-do province in the middle of the Korean Peninsula (38°00′ N 126°51′ E, 37°49′ N 126°40′ E; Figure 1). The range of altitude in the study area is 3 to 264 m (Appendix A). The Korean Peninsula has a typical monsoon climate; June–August is a warm season with frequent torrential rains, and November–February is mostly below 0 °C, with low precipitation (Appendix B).
Since the establishment of the DMZ, the north and south have gradually invaded the DMZ. Thus, the DMZ boundary has changed. Therefore, Google Earth’s high-resolution satellite images and field visits were used to examine the current western DMZ boundaries in our study site. The western DMZ boundary of North Korea was determined on the basis of high-resolution images from Google Earth. The DMZ was identified along North Korea’s guard post within the DMZ on the basis of the lack of clear fences along the Northern Limit Line from the demarcation line.
2.2. Data Collection, Preprocessing, and Analysis
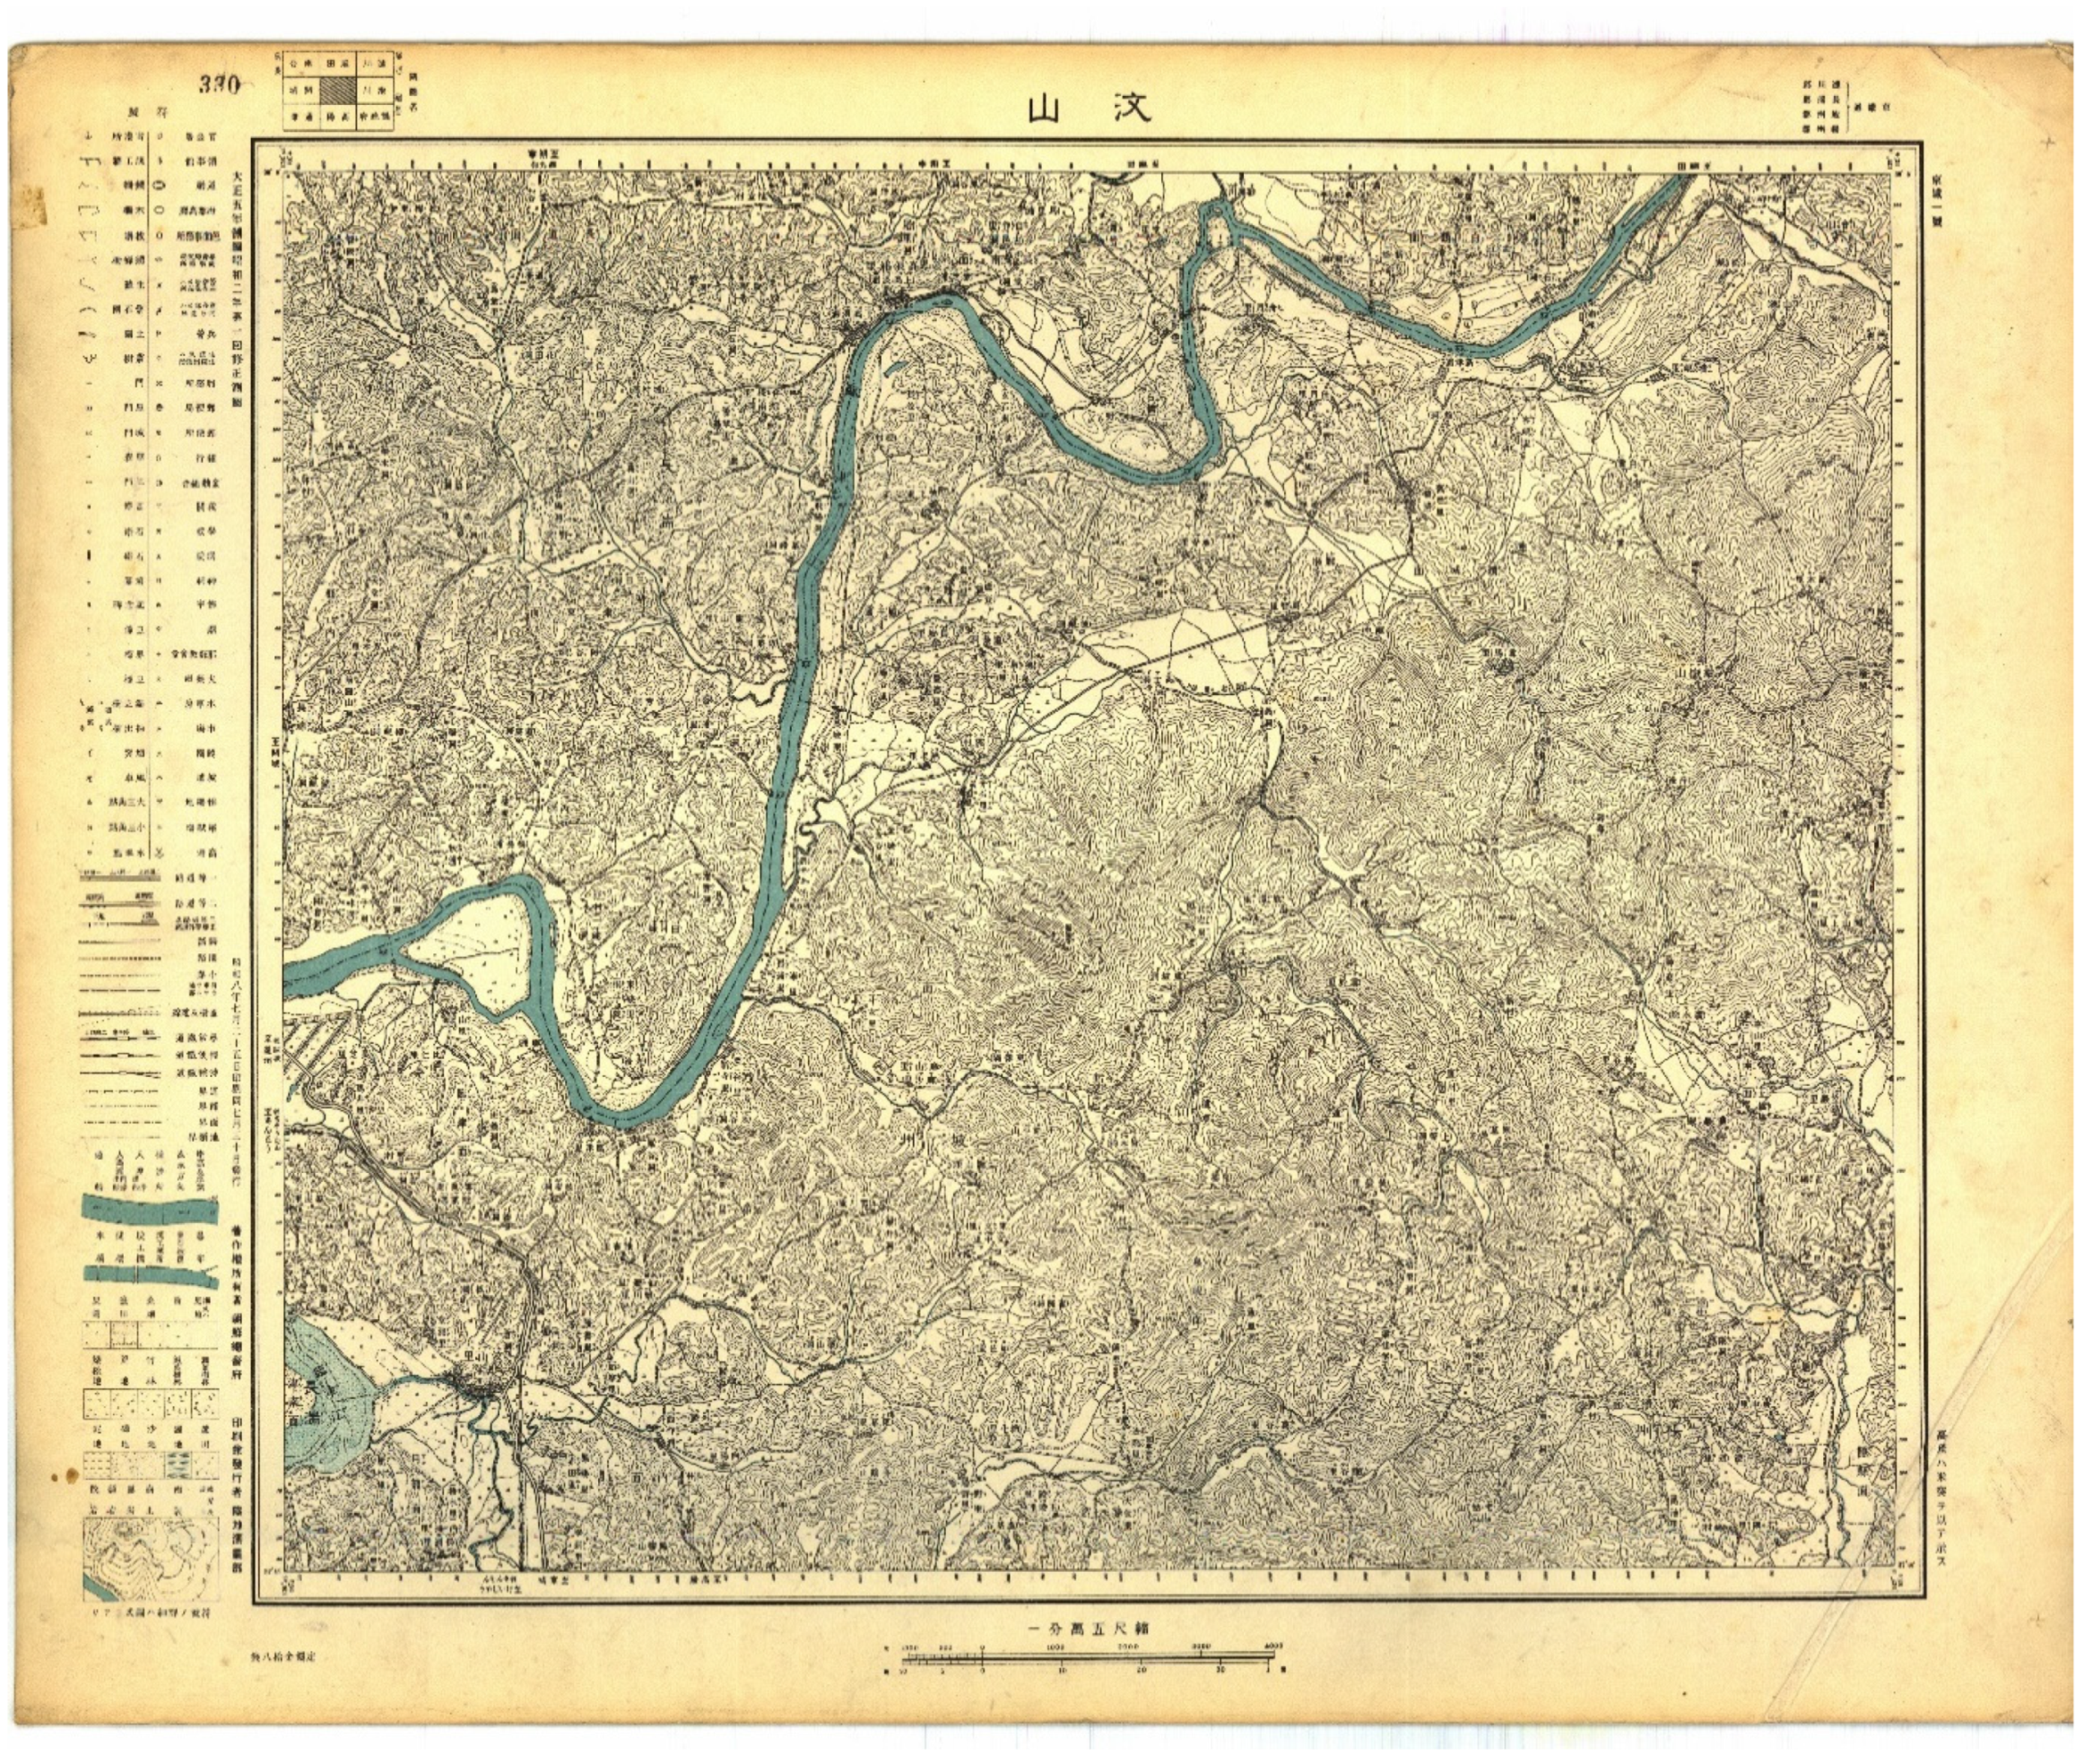
The record of the landscape 100 years ago exploited in this study was reconstructed from an old map of the Japanese colonial period before the Korean War. A map from 1919, before the Korean War, was vectorized from old maps, which were drawn in 1919 (1:50,000) in the Japanese colonial era (Appendix C). The old maps were downloaded from the National Geographic Information Institute [30]. Since 1984, when the oldest imagery of the research site had been produced, the changes in the landscape were tracked over a 10 year period. We searched the imagery between May and September of the given years, and inspected the data before and after the year when the thick clouds covered the study sites. Lastly, we used images of 1984, 1994, 2006, and 2017. Maps generated from 1980 to 2017 were built on the basis of Landsat satellite images from Thematic Mapper (TM) (1984, 1994), Enhanced Thematic Mapper (ETM+) (2006), and Operational Land Imager (OLI) (2017) (see Table 1). Satellite images were downloaded in orthorectified form from Earth Explorer [31]. Region-of-interest (ROI) data were referenced with the high-resolution Google Earth images (1984, 1994, 2006, and 2017) and confirmed through field studies in 2017. After we had obtained ground-truth points of the corresponding years, we randomly selected 70% of the points for training and 30% for validation. In addition, calibration type was radiance, output interleave was BIL, and scale factor was 0.1. After radiometric calibration, the FLAASH Atmospheric Correction Model was applied to Landsat data according to the ENVI manual (ENVI ver. 5.3) [32].
Pre- and post-war maps were then analyzed within eight landscape categories: built-up structure (buildings, houses, shelters, ginseng fields, and agricultural facilities), paddy field, coniferous forest, deciduous forest, vegetation (grassland), water body, bare ground, and floodplain.
We then performed supervised classification employing the neural-net method using ENVI ver. 5.3 and an accuracy test [33,34].
Vegetation vitality was determined by the normalized difference vegetation index (NDVI; Equation (1)) and normalized difference moisture index (NDMI; Equation (2)) according to the following formulae:
NDVI = (NIR − Red)/(NIR + Red)
NDMI = (NIR − SWIR)/(NIR + SWIR)
NDVI is relevant to plant productivity, and is highly correlated with the vegetation community and plant biomass [35]. It is also related to the amount of water absorbed by plants and provides information about the extent of water stress in plants. The SWIR correction factor was applied to increase the correlation between NDVI and leaf-area index [36]. NDMI is more sensitive to moisture stress than NDVI is [37]. Changes in the NDVI and NDMI values in the DMZ and CCZ were evaluated by the Kruskal–Wallis rank-sum test using the nparcomp package in R ver. 1.1.447 [38].
In addition, wildfires are frequent in the DMZ due to landmine explosions caused by wild animals and military activities. Thus, wildfire analysis was carried out for spring and autumn, the driest seasons during which fires are most frequent in Korea. From 1985 to 2017, Landsat images were normalized by the Normalized Burn Ratio Thermal (NBRT; Equation (3)) to cover fires [39]. NBRT consists of a combination of NIR and MidIR (midinfrared: 2215 nm) and thermal bands (TB). While visually checking satellite images, the extent of fires was evaluated. All processes were performed using NBRT of the Landsat dataset (LANDSAT/LT05/C01/T1_8DAY_NBRT) obtained by Google Earth Engine. The following equation was used:
NBRT = (NIR − MidIR × TB)/(NIR + MidIR × TB)
Statistical data for population growth in Paju and CCZ were obtained from the Korean Statistical Information Service (Accessed on 11 April 2018) [40]. Prewar administrative districts were ascertained with old maps, and population statistics were obtained with names consistent with those in the current CCZ (our study site).
3. Results
3.1. Land-Use and -Cover Changes
Overall accuracy rates and kappa coefficients were 95% and 0.94, 85% and 0.81, 95% and 0.92, and 93.8% and 0.92 for 1984, 1994, 2006, and 2017 maps, respectively.
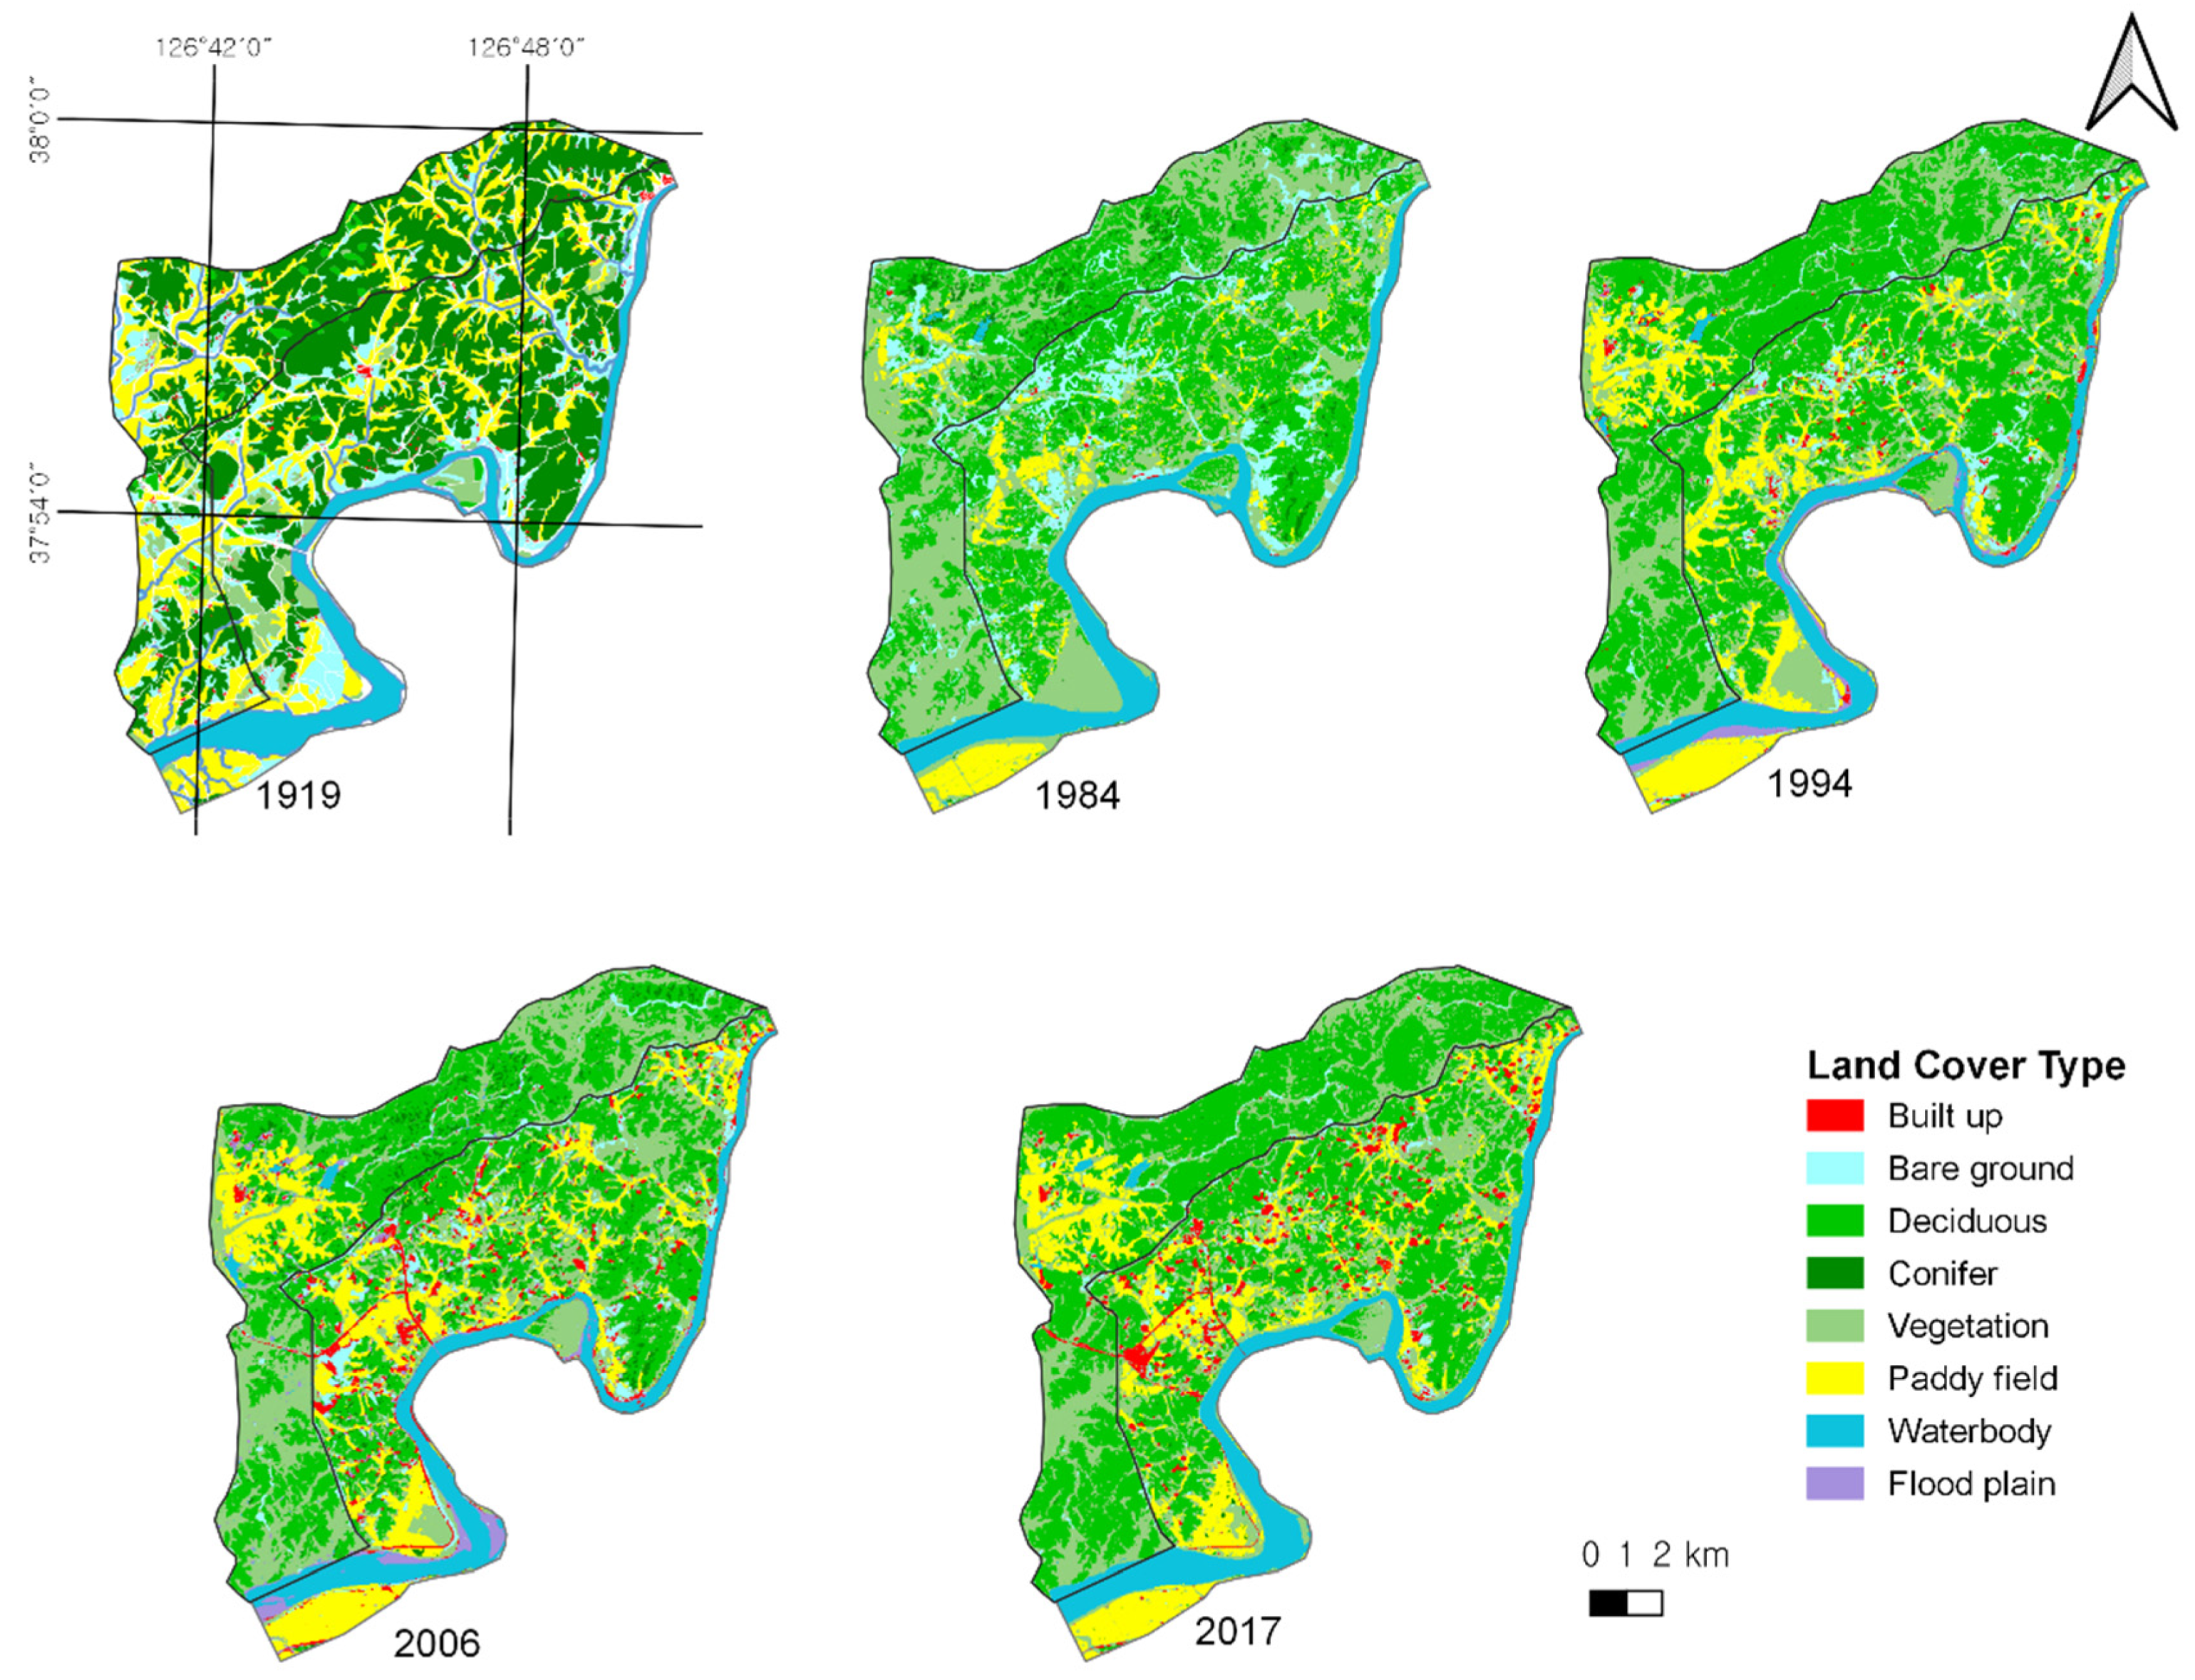
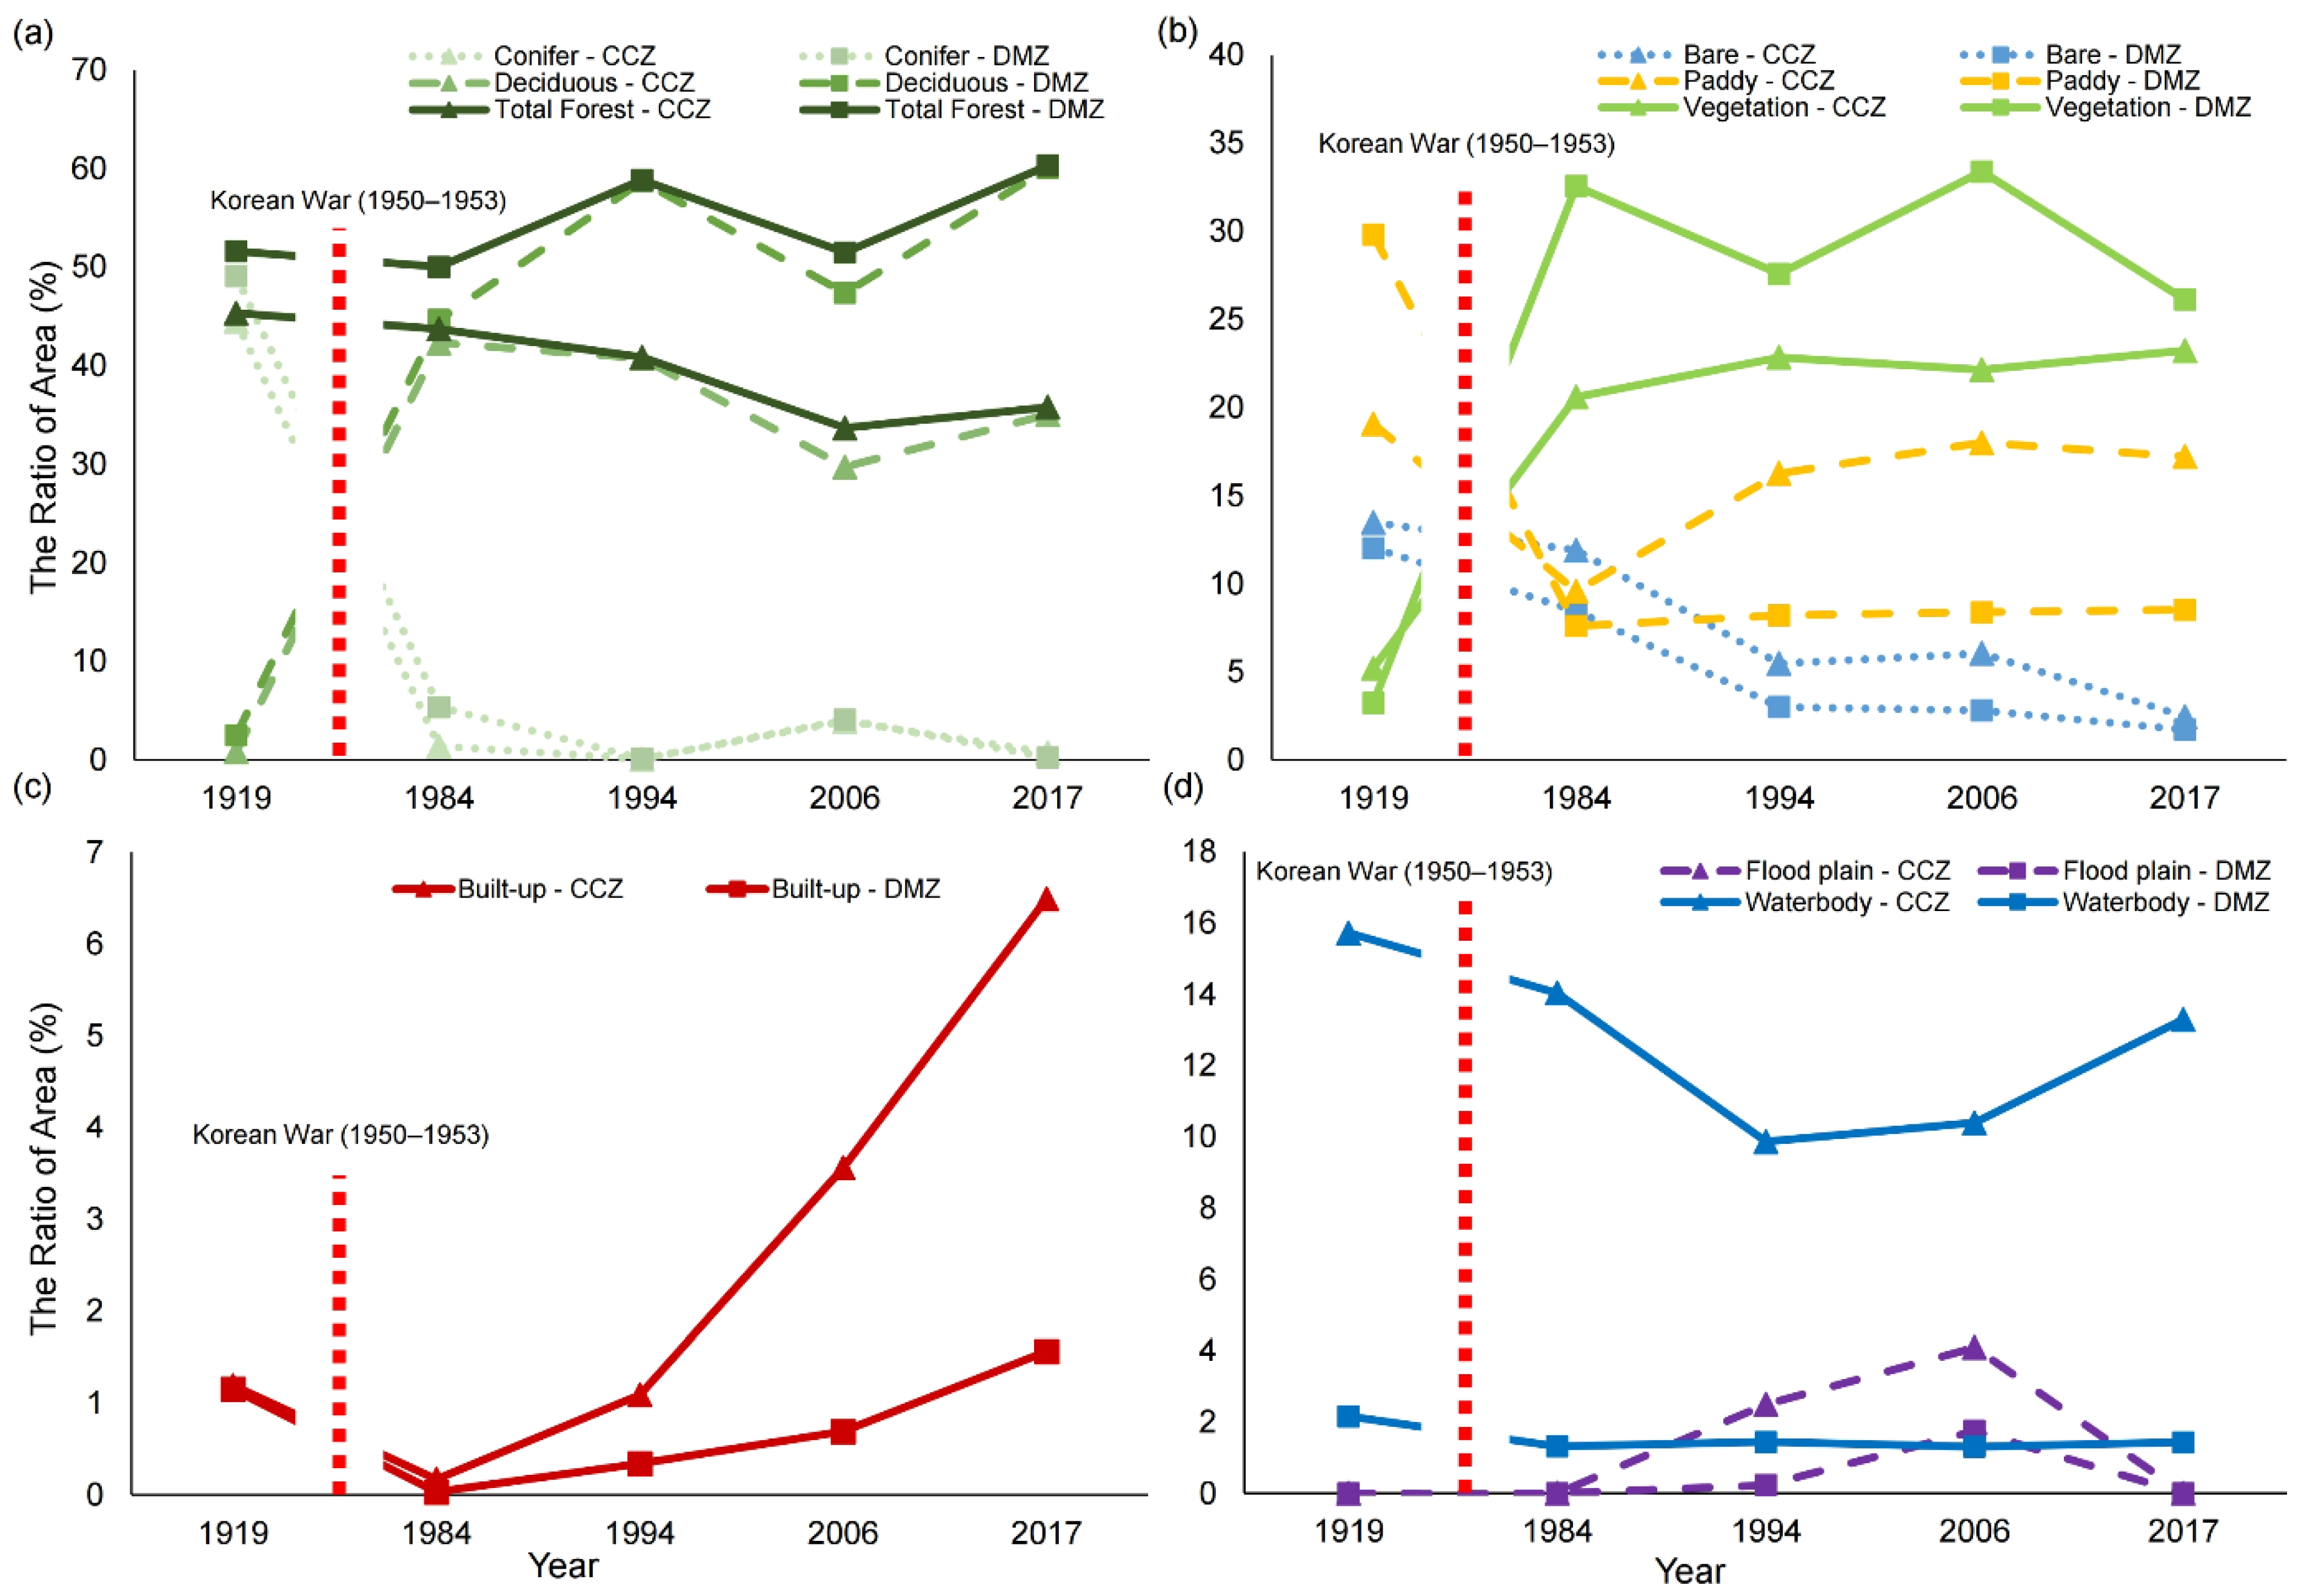
The landscape of the western DMZ and CCZ within the study area changed significantly from the end of the Korean War until 2017 (Figure 4, Appendix D). Before the war, according to the 1919 map, forests covered approximately 51% and 45% of the DMZ and CCZ, respectively (Figure 4 and Figure 5a). In the DMZ, the proportion of forests gradually increased to 60% in 2017, while the forest area of the CCZ gradually decreased, accounting for 41% of the total land in 2017. In both the DMZ and CCZ, the forest composition differed before and after the war, with coniferous forests being predominant before the war (1919) (coniferous, 52%, and deciduous, 1% in the CCZ; coniferous, 49%, and deciduous, 2.5%, in the DMZ), and deciduous forests were predominant from the 1980s to the 2010s (coniferous, 1.6–4%, and deciduous, 33–49%, in the CCZ; coniferous, 0.1–5.3%, and deciduous, 44–60%, in the DMZ).
Rice paddies were the second most common landscape component in 1919 within the study area (30% in the DMZ and 19% in the CCZ; Figure 5b). However, in the 1980s, when satellite images were available for the first time after the war, the area of rice paddy fields was reduced (i.e., 9.5% of the CCZ and 7.6% of the DMZ). Since then, the area of rice paddies gradually increased in the CCZ, reaching around 17% in 2017 (Figure 5b), while rice paddies accounted for 8% of the total area of the DMZ.
The DMZ and CCZ grassland within the study area increased after the Korean War from 3% and 5% in 1919 to 33% and 21% in the 1980s, respectively (Figure 4 and Figure 5b). CCZ vegetation remained at around 20% in the 1990s, 2000s, and 2010s. DMZ vegetation remained at around 25–35% from the 1980s to 2010s. Rice fields in the DMZ region shifted to grassland (Figure 4).
Bare grounds within the study area, mainly consisting of residential and community yards, and streamsides were not abundant in 1919, accounting for approximately 12% and 13% of the DMZ and CCZ, respectively. These land types decreased to 8% in the 1980s. Since then, they shrank steadily over the past three decades, representing 2% of the total DMZ land in 2017, as grassland vegetation increased. Bare ground in the CCZ was maintained at 12% until the 1980s and was used for military activity after the war, but gradually decreased to 2.4% in 2017. This reduction was largely due to the expansion of rice paddies (Figure 4 and Figure 5).
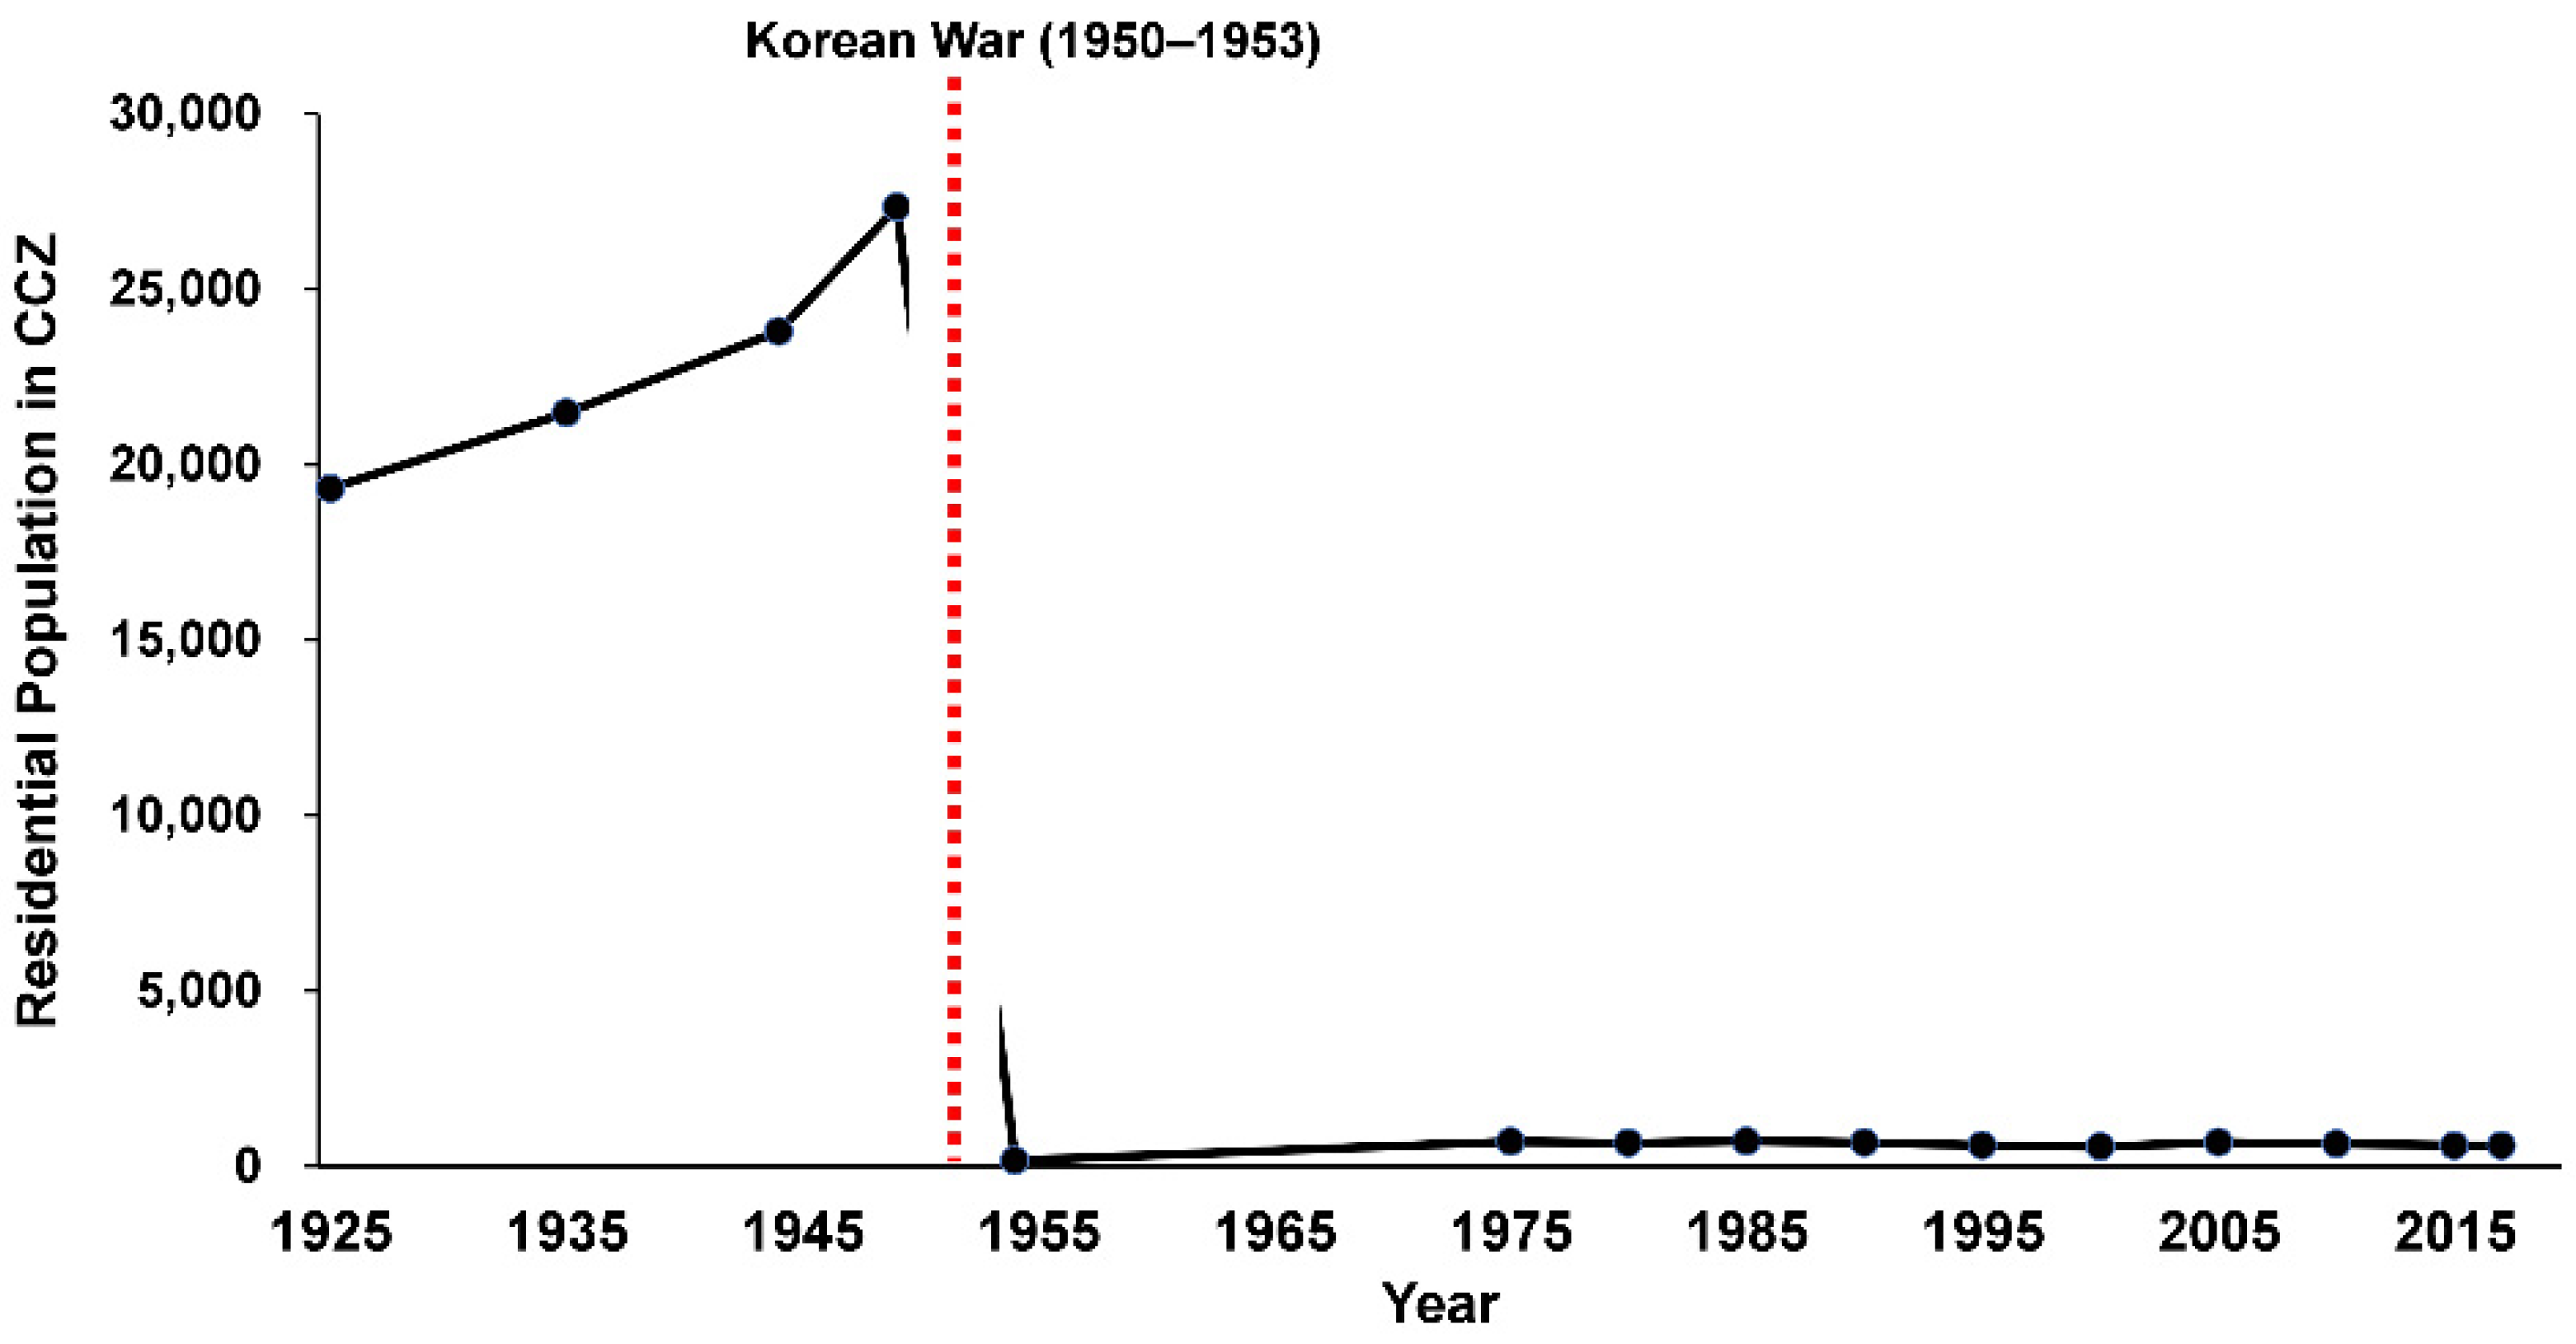
Built-up areas within the study area occupied approximately 1% of total lands in 1919. Due to postwar restrictions, the number of residents in the CCZ plummeted (Figure 6), and 0.2% of the built-up structures were in use in the 1980s. Upon relaxed access and permission for cultivation with the expectation of rapprochement between the two Koreas, the cover of built-up land, including ginseng fields, increased rapidly to 2% in the 1990s and 7.9% in the 2010s (Figure 4 and Figure 5c). Compared to the 1980s, when agricultural activities had been permitted, the number of artificial structures in the CCZ region increased by 46 times in 2010, and the proportion of artificial structures in 2010 was about 6.6 times higher than that in 1919 when civilians occupied the area. In the DMZ, the built-up area increased owing to the construction of roads to the Kaesong Industrial Region. The area of artificial structures was 0.03% in the 1980s and increased to 1.74% in the 2010s. It rose by about 58 times compared with estimates for 30 years ago, and 1.5 times compared with estimates for 100 years ago.
3.2. Wildfires and Changes in NDVI and NDMI
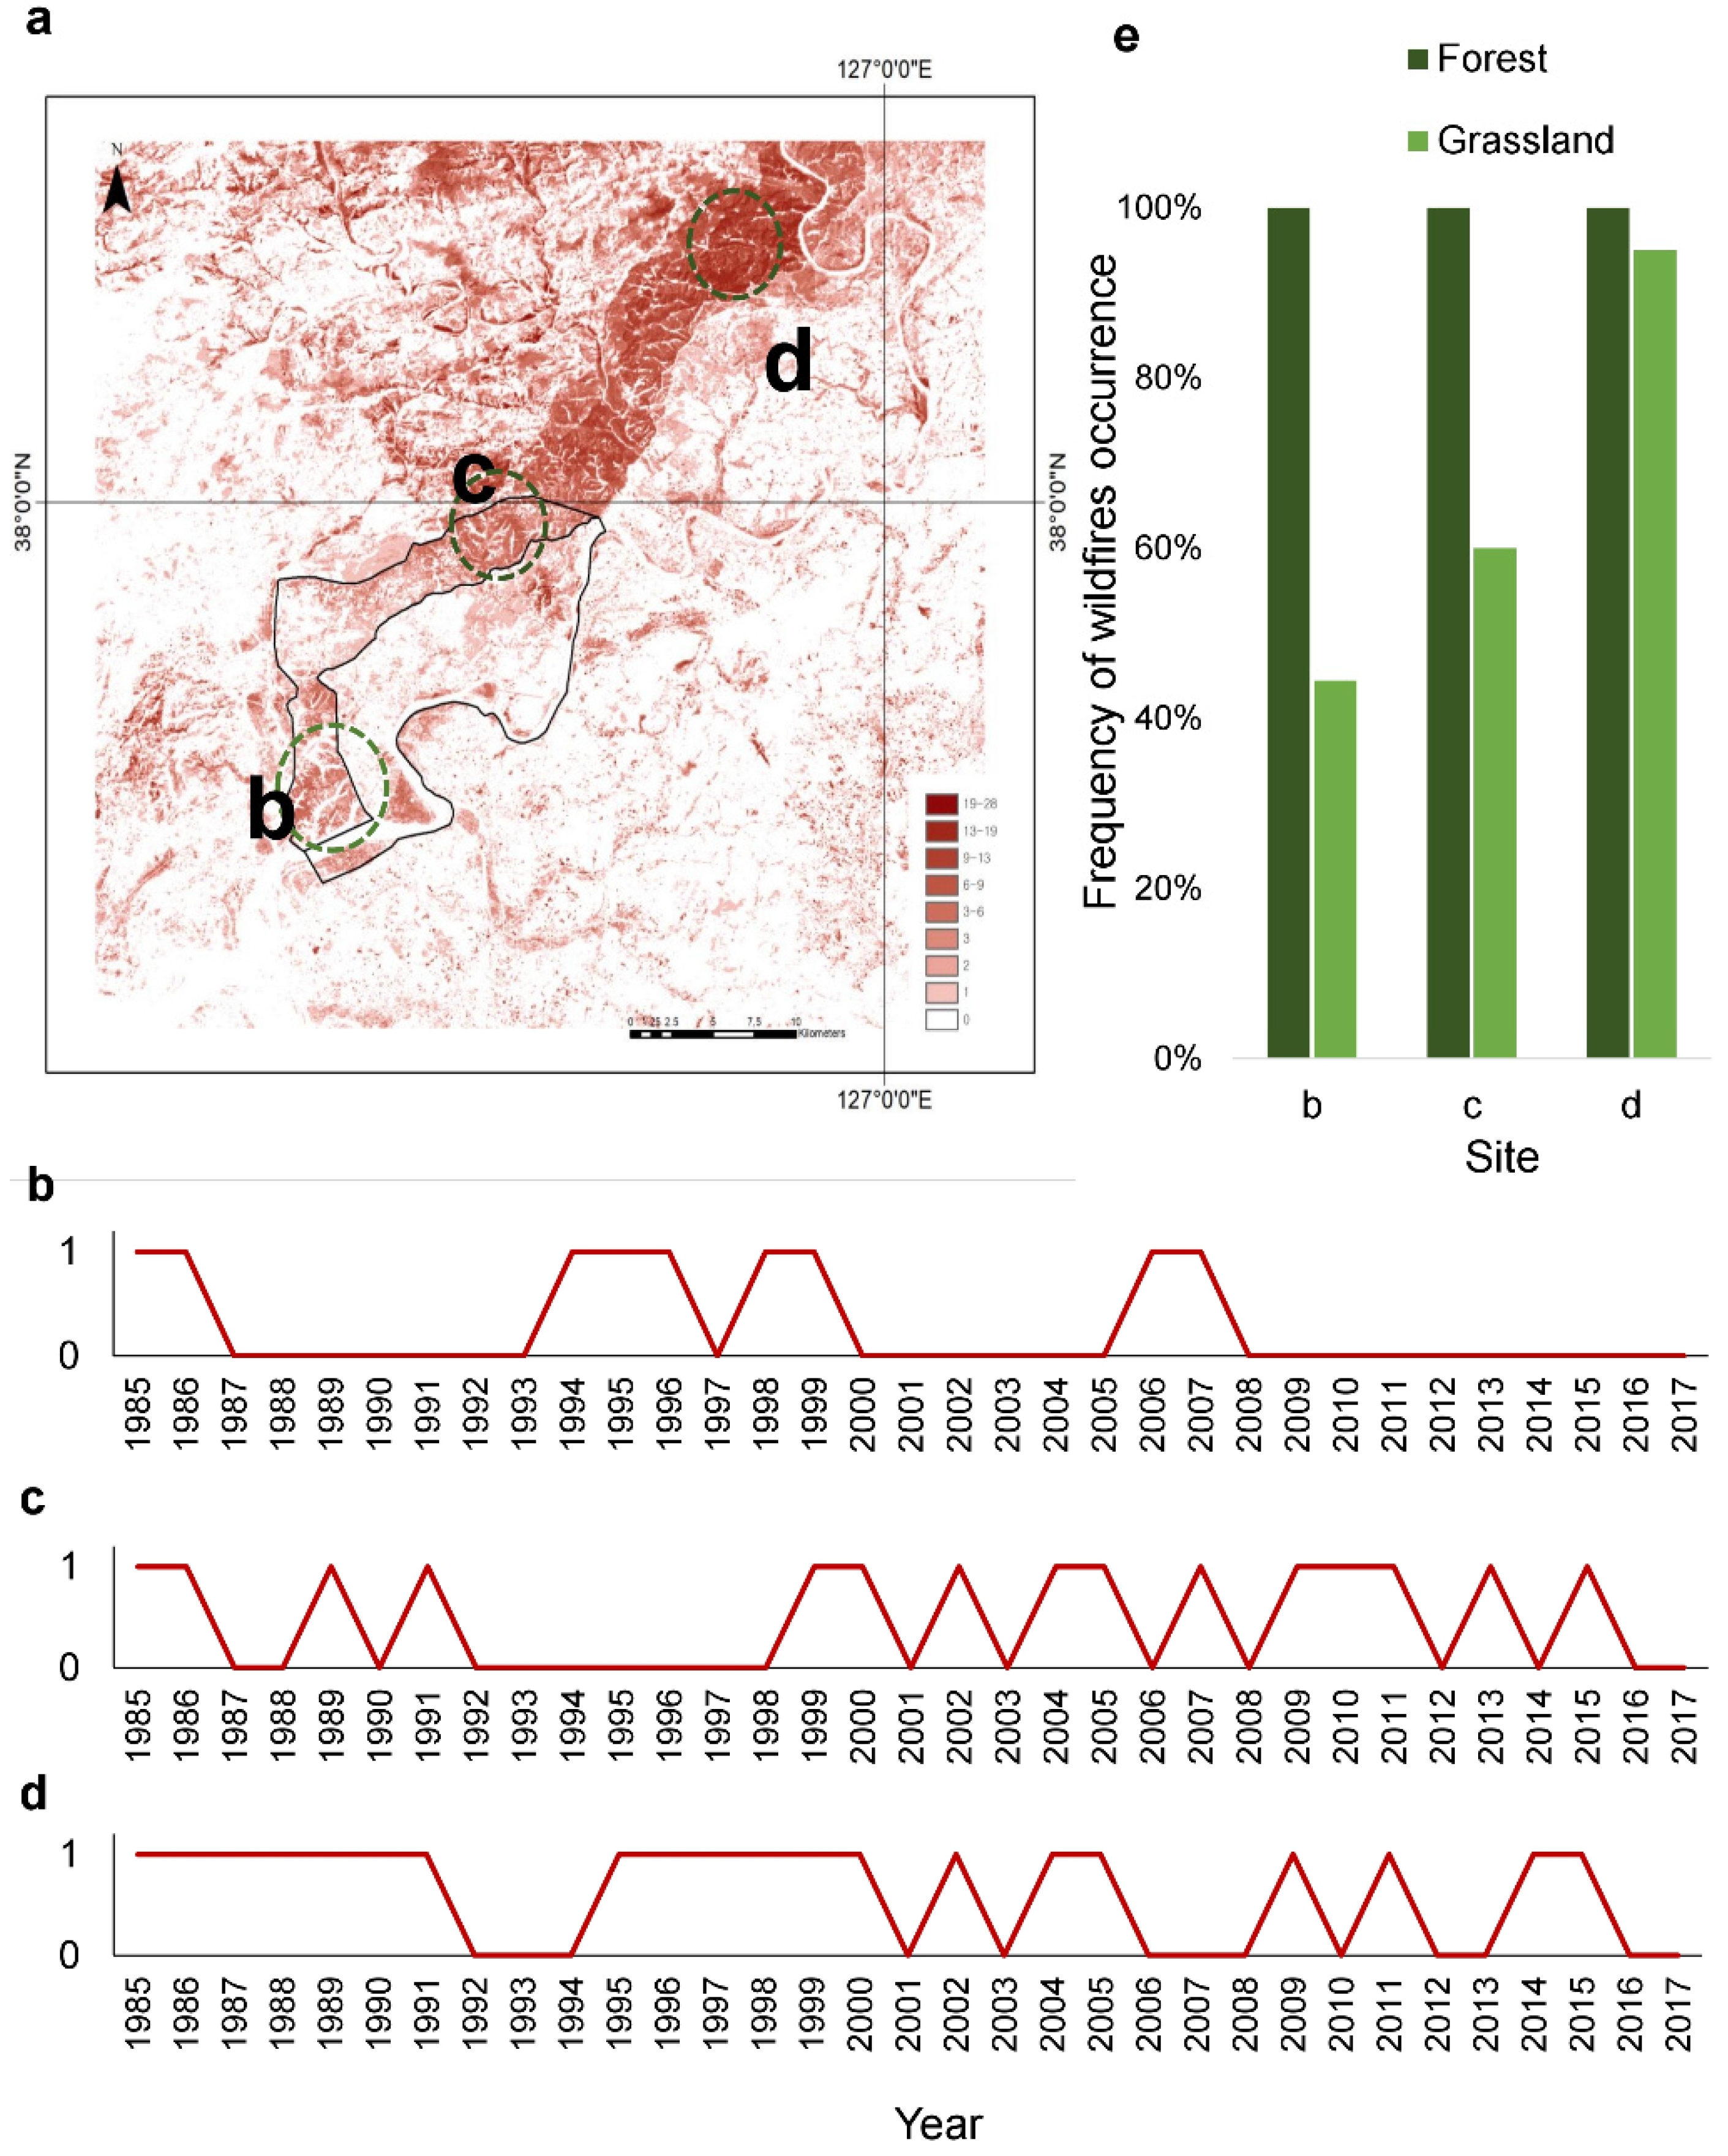
Over the past 35 years, 28 fires have been reported in the western DMZ, including in Paju-si and Yeoncheon-gun. The fires occurred more frequently and extensively on the north side (toward Yeoncheon). The southern part, Paju (Figure 7b), had 9 fires, while the northern part, Paju and Yeoncheon, had 15 fires (Figure 7c). Yeoncheon-gun county had 20 fires in the last 35 years (Figure 7d). Region b (the southern part of Paju) had 44% of fires breaking out in grassland and 100% in forests (Figure 7e). Region c (the northern part) had 60% of fires breaking out in grassland and 100% in forests. Region d had 95% of fires breaking out in grassland and 100% in forests. Despite the different land-use compositions, differences in NDVI and NDMI values between the DMZ and CCZ were not statistically significant (p > 0.05, Kruskal–Wallis test, Appendix E).
4. Discussion
In the western DMZ and CCZ, our study area, the most prominent landscape changes after the Korean War were found in forests. Forests were drastically diminished during the war [41]. Forests in the region were predominantly coniferous before the war, but showed succession to broadleaf forests of oak trees (Quercus spp.). During the Japanese colonial period and the Korean War, forests in the Korean Peninsula were mostly devastated [41,42]. Forest reconstruction involved ecological succession to deciduous forests by the predominance of oak trees over coniferous trees. Forests entirely destroyed by fire are likely to more quickly form oak forests [43]. When a forest consisting of 70% coniferous, 3% deciduous, and 28% mixed forests recovered after fire loss, its composition was quickly altered to 71% deciduous trees [43]. This could also probably be attributed to the strong reproductive capacity of oak trees. Oak population growth may be explained by the strong propagation ability of oak by bud and seed germination [44]. This corresponds with the general forest-succession trend in South Korea [43].
Grasslands were a major element of the regional landscape. In this study, rice fields within the DMZ turned into grassland after the war. This grassland area was sustained for nearly 70 years after the establishment of the DMZ (Figure 4 and Figure 5). This observation contradicts a previous study showing that abandoned rice paddies became grasslands and eventually forests in South Korea within a decade [45]. Two factors may have arrested succession. First, fires prevent the establishment of trees and shrubs in temperate regions [46,47,48,49]. Fires occur around the DMZ due to spontaneously or by anthropogenic factors, such as the deliberate ignition of fires by soldiers for sight clearance or accidental fires by landmine explosions. Owing to the military confrontation between North and South Korea, it is nearly impossible to instantly extinguish fires. We identified at least 28 instances of wildfire in the western DMZ and CCZ over the past 35 years. Fires may play a significant role in landscape changes, maintenance, and biodiversity in the region.
Second, periodic flooding could impede the transition from grasslands to forests [50,51]. The response of vegetation in wetlands to hydrological fluctuations can vary [52,53,54]. When wetlands experience fluctuations such as floodplains, the establishment of terrestrial plants or trees could be hampered by the maintenance of a certain water level and inundation in wetlands [55,56,57]. Grassland areas in the southern part of the DMZ within the study area are adjacent to a stream, and could have thus been subjected to periodic flooding (Appendix F). Most of the Korean wetlands along rivers and estuaries have been converted into agricultural land due to its high productivity. The conversion of grasslands into agricultural lands is globally common [58]. Therefore, the temperate grassland in the DMZ region within the study area could be considered to be a very scarce ecosystem without human intervention, and with valuable wildlife habitats [59,60,61]. Our study identified that the grassland was maintained without wildfire outbreaks within the DMZ, indicating that DMZ conservation planning should be based on regional properties and long-term land-cover changes.
There has been a substantial increase in built-up structures since the 1990s in Paju and Yeoncheon in the CCZ. This can mainly be explained by the conversion of rice paddies into ginseng cultivation fields. Ginseng, a valued cash crop for Asian medicine, needs shading facilities for cultivation. These shading facilities were classified as built-up structures in this study, and these structures reduce habitat quality for wildlife [19]. The conversion of rice paddies into ginseng fields is a primary factor threatening regional biodiversity [19]. Thereby, a decrease in rice paddies and seminatural wetlands exploited by many animals, such as birds, amphibians, reptiles, and insects may affect the regional ecosystem. Land-use changes driven by commercial value likely pose a threat to regional biodiversity. However, the conservation and revitalization of traditional agricultural landscapes, such as rice paddies and small forest patches, can help to maintain biodiversity in regional land-use plans [10]. Moreover, in the 2000s, pressure for commercial development on western CCZ, including the study area, increased as political tensions between the two Koreas loosened [62]. A train station, railroads, storage buildings, power lines, and roads to the Kaesong Industrial Region were built in the CCZ. Recently, the Republic of Korea government presented a plan to build a huge distribution center and a highway through the CCZ in our study area. The current peace dialog, along with cooperative economic-development plans, between the two Koreas places further pressure on the land in the DMZ and CCZ at the expense of regional biodiversity [63]. A long-term plan for the conservation of biodiversity is needed for the DMZ and CCZ.
As there is still a strong military tension around the Korean DMZ, ecosystem characteristics are dependent on political circumstances. As such, the ecological integrity of the Korean DMZ and CCZ has intentionally not been maintained. Aside from the landscape elements that we analyzed, there are many other factors affecting the DMZ and CCZ ecosystem. If the CCZ is kept under high development pressure for tourism and speculation, it is difficult to expect its role as a buffer zone for biodiversity in the DMZ. Foreign troops, which are one of the channels for introducing exotic species to Korea, are also stationed in the CCZ, and invasive alien plants, such as giant ragweed (Ambrosia trifida) and white heath aster (Aster pilosus), which are presumed to have been introduced while attached to military supplies, flourish around the DMZ region [64,65].
Considering biodiversity conservation as the primary goal for sustainable development [66], transboundary conservation across one or more international boundaries is essential [1]. The Korean DMZ region with high biodiversity should be respected as a vital ecosystem rather than a base for military confrontation. However, there is still no clear conservation plan in the Korean DMZ. Since the Korean DMZ is officially under UN control, we should call on transboundary conservation for the DMZ. As the IUCN guideline and case studies indicate, many actors for transboundary governance should also be involved in the cooperative management of the DMZ ecosystem [1,5]. Monitoring the ecosystem, and enhancing the ecological awareness of residents and farmers in the CCZ area should be accompanied by cooperation.
5. Conclusions
The strict restriction of human access to the DMZ has enabled its vegetation to undergo natural succession. For instance, cut and burned coniferous forests in the western DMZ were naturally transformed into broadleaf forests, and prewar DMZ rice paddies were converted into grassland with some forest succession. The maintenance of grasslands can be explained by both natural (water) and artificial (wildfire) factors. Grasslands have changed substantially in the DMZ and CCZ. However, much CCZ vegetation has been lost or altered for human use (e.g., commercial development and infrastructure construction). Pressure for such development, which is likely to increase under the current political climate of reduced tension between South and North Korea, poses a major threat to the conservation of biodiversity in the region. Given the high biodiversity and ecological integrity of the Korean DMZ region, transboundary governance for conservation should be designed. We suggest a conservation plan for the DMZ region. The Korean DMZ, which is included rare and recovered grasslands, should be protected as a core area. The CCZ around the DMZ should remain as a buffer or transitional area for ecological reasons. Without a buffer region, the DMZ with a disparate ecosystem from the neighboring cities may not maintain its own ecosystem, and may be vulnerable to drastic changes.
Author Contributions
Conceptualization, J.H.K.; Methodology, J.H.K.; Software, J.H.K.; Formal analysis, J.H.K.; Investigation, J.H.K., S.P. and S.H.K.; Resources, J.H.K., and S.H.K.; Writing—original draft preparation, J.H.K., S.P.; Writing—Review and editing, J.H.K. and S.P.; Visualization, J.H.K. and S.P.; Supervision, S.H.K. and E.J.L.; Project administration, E.J.L.; Funding acquisition, S.H.K. and E.J.L.; Validation, S.H.K. and E.J.L. All authors have read and agreed to the published version of the manuscript.
Funding
This work was supported by National Research Foundation of Korea [NRF-2017R1A2B4006761].
Institutional Review Board Statement
Not applicable.
Informed Consent Statement
Not applicable.
Data Availability Statement
The data presented in this study are available on request from the author.
Conflicts of Interest
The authors declare no conflict of interest.
Appendix A
Figure A1.
Digital elevation model (DEM) of the study site. ASTER GDEM was used, which was downloaded from USGS (https://earthexplorer.usgs.gov/, accessed on 1 June 2021).
Figure A1.
Digital elevation model (DEM) of the study site. ASTER GDEM was used, which was downloaded from USGS (https://earthexplorer.usgs.gov/, accessed on 1 June 2021).

Appendix B
Figure A2.
Characteristics of study-site climate from 1907 to 2017. (a) Monthly average temperature; (b) monthly accumulated precipitation. Data were downloaded from the Korea Meteorological Administration website (https://www.weather.go.kr/, accessed on 15 August 2019).
Figure A2.
Characteristics of study-site climate from 1907 to 2017. (a) Monthly average temperature; (b) monthly accumulated precipitation. Data were downloaded from the Korea Meteorological Administration website (https://www.weather.go.kr/, accessed on 15 August 2019).

Appendix C
Figure A3.
Old map drawn during the Japanese colonial era (1919).

Appendix D

Table A1.
Land-use and -cover transition matrix in this study. Deci, deciduous forest; Vege, vegetation; Water, water body and floodplains.
Table A1.
Land-use and -cover transition matrix in this study. Deci, deciduous forest; Vege, vegetation; Water, water body and floodplains.
| DMZ | 1984 | 2006 | |||||||||||||
| Bare | Deci | Built | Conifer | Paddy | Vege | Water | Bare | Deci | Built | Conifer | Paddy | Vege | Water | ||
| 1919 | Bare | 8.14% | 41.43% | 0.01% | 2.28% | 12.05% | 35.99% | 0.09% | |||||||
| Deci | 8.38% | 66.57% | 0.00% | 4.56% | 3.83% | 16.66% | 0.00% | ||||||||
| Built | 6.73% | 59.62% | 0.00% | 0.94% | 9.39% | 23.32% | 0.00% | ||||||||
| Conifer | 11.20% | 58.11% | 0.06% | 7.44% | 4.76% | 18.38% | 0.05% | ||||||||
| Paddy | 4.07% | 27.33% | 0.01% | 4.50% | 10.28% | 52.73% | 1.09% | ||||||||
| Vege | 12.43% | 51.42% | 0.00% | 0.53% | 8.18% | 27.35% | 0.09% | ||||||||
| Water | 5.01% | 10.50% | 0.14% | 4.07% | 4.07% | 38.01% | 38.21% | ||||||||
| 1994 | Bare | 21.36% | 1.53% | 11.11% | 1.27% | 1.02% | 0.92% | 0.30% | 31.09% | 16.11% | 4.10% | 1.94% | 9.50% | 33.38% | 3.89% |
| Deci | 25.56% | 81.07% | 11.11% | 72.46% | 53.44% | 38.17% | 1.42% | 1.03% | 70.07% | 0.37% | 6.17% | 1.61% | 19.69% | 1.06% | |
| Built | 2.68% | 0.26% | 29.63% | 2.47% | 0.36% | 0.46% | 2.94% | 5.31% | 8.79% | 23.63% | 6.59% | 13.74% | 15.93% | 26.01% | |
| Conifer | 0.05% | 0.05% | 0.00% | 0.89% | 0.02% | 0.06% | 2.54% | 3.09% | 13.40% | 4.12% | 21.65% | 18.56% | 10.31% | 28.87% | |
| Paddy | 8.58% | 3.07% | 14.81% | 5.56% | 27.74% | 7.94% | 5.79% | 1.98% | 3.70% | 1.56% | 1.42% | 73.31% | 15.58% | 2.44% | |
| Vege | 41.55% | 13.89% | 14.81% | 14.30% | 17.35% | 51.60% | 1.73% | 3.64% | 18.90% | 0.66% | 0.88% | 5.86% | 68.03% | 2.04% | |
| Water | 0.21% | 0.13% | 18.52% | 3.05% | 0.08% | 0.86% | 85.28% | 0.92% | 0.77% | 4.06% | 0.46% | 5.44% | 8.50% | 79.86% | |
| 2017 | Bare | 35.44% | 0.40% | 11.73% | 0.31% | 0.45% | 1.12% | 2.14% | |||||||
| Deci | 2.32% | 93.18% | 2.79% | 80.00% | 3.61% | 36.32% | 5.64% | ||||||||
| Built | 4.51% | 0.01% | 33.87% | 0.16% | 0.28% | 0.05% | 4.96% | ||||||||
| Conifer | 0.00% | 0.01% | 0.15% | 4.66% | 0.48% | 0.01% | 0.17% | ||||||||
| Paddy | 3.81% | 0.39% | 9.53% | 8.31% | 78.90% | 2.56% | 11.35% | ||||||||
| Vege | 53.46% | 6.01% | 36.22% | 6.47% | 15.84% | 59.90% | 32.76% | ||||||||
| Water | 0.46% | 0.00% | 5.72% | 0.09% | 0.45% | 0.05% | 42.98% | ||||||||
| CCZ | 1984 | 2006 | |||||||||||||
| Bare | Deci | Built | Conifer | Paddy | Vege | Water | Bare | Deci | Built | Conifer | Paddy | Vege | Water | ||
| 1919 | Bare | 19.12% | 33.67% | 0.63% | 0.60% | 11.67% | 32.33% | 1.97% | |||||||
| Deci | 14.48% | 50.75% | 2.32% | 2.43% | 6.03% | 19.35% | 4.64% | ||||||||
| Built | 22.23% | 43.81% | 0.00% | 0.82% | 6.32% | 26.83% | 0.00% | ||||||||
| Conifer | 13.40% | 65.97% | 0.06% | 2.29% | 3.21% | 14.84% | 0.23% | ||||||||
| Paddy | 9.96% | 30.30% | 0.03% | 1.23% | 26.45% | 29.46% | 2.57% | ||||||||
| Vege | 12.01% | 56.33% | 0.30% | 1.11% | 3.74% | 21.87% | 4.64% | ||||||||
| Water | 1.35% | 2.47% | 0.07% | 0.32% | 5.45% | 9.44% | 80.90% | ||||||||
| 1994 | Bare | 22.89% | 3.23% | 13.02% | 1.68% | 2.29% | 5.13% | 0.68% | 24.72% | 11.18% | 12.11% | 11.72% | 0.90% | 34.06% | 5.30% |
| Deci | 23.86% | 70.28% | 4.69% | 73.52% | 15.70% | 26.93% | 0.51% | 3.36% | 60.65% | 3.49% | 5.36% | 7.67% | 17.37% | 2.11% | |
| Built | 4.82% | 1.04% | 24.48% | 1.49% | 0.84% | 1.69% | 4.88% | 13.35% | 6.06% | 20.00% | 9.80% | 1.26% | 21.93% | 27.60% | |
| Conifer | 11.45% | 6.99% | 22.40% | 8.39% | 65.43% | 22.79% | 5.12% | 1.77% | 15.93% | 4.42% | 21.24% | 12.39% | 8.85% | 35.40% | |
| Paddy | 0.02% | 0.05% | 0.00% | 0.25% | 0.06% | 0.15% | 0.24% | 6.65% | 1.78% | 6.28% | 63.32% | 1.55% | 15.63% | 4.79% | |
| Vege | 35.88% | 18.31% | 17.71% | 13.49% | 15.39% | 41.41% | 4.16% | 8.62% | 17.20% | 6.51% | 19.26% | 1.71% | 43.38% | 3.32% | |
| Water | 1.08% | 0.10% | 17.71% | 1.18% | 0.29% | 1.90% | 84.42% | 0.92% | 0.29% | 4.50% | 1.66% | 0.35% | 2.38% | 89.90% | |
| 2017 | Bare | 16.11% | 0.57% | 5.03% | 0.35% | 1.03% | 3.53% | 0.57% | |||||||
| Deci | 4.22% | 88.86% | 4.19% | 67.97% | 3.86% | 20.26% | 2.00% | ||||||||
| Built | 14.60% | 0.40% | 22.36% | 1.93% | 4.26% | 2.67% | 1.20% | ||||||||
| Conifer | 12.63% | 1.25% | 14.43% | 10.96% | 67.98% | 10.56% | 1.80% | ||||||||
| Paddy | 0.24% | 0.17% | 0.31% | 6.84% | 1.91% | 0.21% | 0.07% | ||||||||
| Vege | 49.61% | 8.74% | 43.62% | 11.53% | 20.37% | 62.52% | 8.85% | ||||||||
| Water | 2.59% | 0.00% | 10.07% | 0.42% | 0.60% | 0.25% | 85.52% | ||||||||
Appendix E
Table A2.
Average NDVI and NDMI values depending on plant types of corresponding years (Mean ± SD). There were no significant differences between CCZ and DMZ within a year.
Table A2.
Average NDVI and NDMI values depending on plant types of corresponding years (Mean ± SD). There were no significant differences between CCZ and DMZ within a year.
| Plant Type | Year | NDVI | NDMI | ||
|---|---|---|---|---|---|
| CCZ | DMZ | CCZ | DMZ | ||
| Deciduous | 1984 | 0.78 ± 0.11 | 0.79 ± 0.1 | 0.32 ± 0.08 | 0.33 ± 0.08 |
| 1994 | 0.79 ± 0.07 | 0.78 ± 0.05 | 0.27 ± 0.08 | 0.26 ± 0.06 | |
| 2006 | 0.84 ± 0.03 | 0.84 ± 0.03 | 0.31 ± 0.03 | 0.29 ± 0.03 | |
| 2017 | 0.89 ± 0.02 | 0.88 ± 0.02 | 0.33 ± 0.04 | 0.31 ± 0.03 | |
| Conifer | 1984 | 0.79 ± 0.11 | 0.79 ± 0.11 | 0.32 ± 0.08 | 0.32 ± 0.09 |
| 1994 | 0.74 ± 0.06 | 0.73 ± 0.07 | 0.37 ± 0.04 | 0.37 ± 0.03 | |
| 2006 | 0.84 ± 0.04 | 0.84 ± 0.03 | 0.35 ± 0.04 | 0.33 ± 0.03 | |
| 2017 | 0.91 ± 0.03 | 0.89 ± 0.04 | 0.43 ± 0.06 | 0.41 ± 0.05 | |
| Vegetation | 1984 | 0.79 ± 0.1 | 0.8 ± 0.1 | 0.32 ± 0.08 | 0.33 ± 0.08 |
| 1994 | 0.75 ± 0.08 | 0.75 ± 0.07 | 0.27 ± 0.07 | 0.27 ± 0.07 | |
| 2006 | 0.78 ± 0.05 | 0.79 ± 0.06 | 0.28 ± 0.05 | 0.27 ± 0.06 | |
| 2017 | 0.79 ± 0.09 | 0.81 ± 0.08 | 0.29 ± 0.06 | 0.29 ± 0.06 | |
Appendix F
Figure A4.
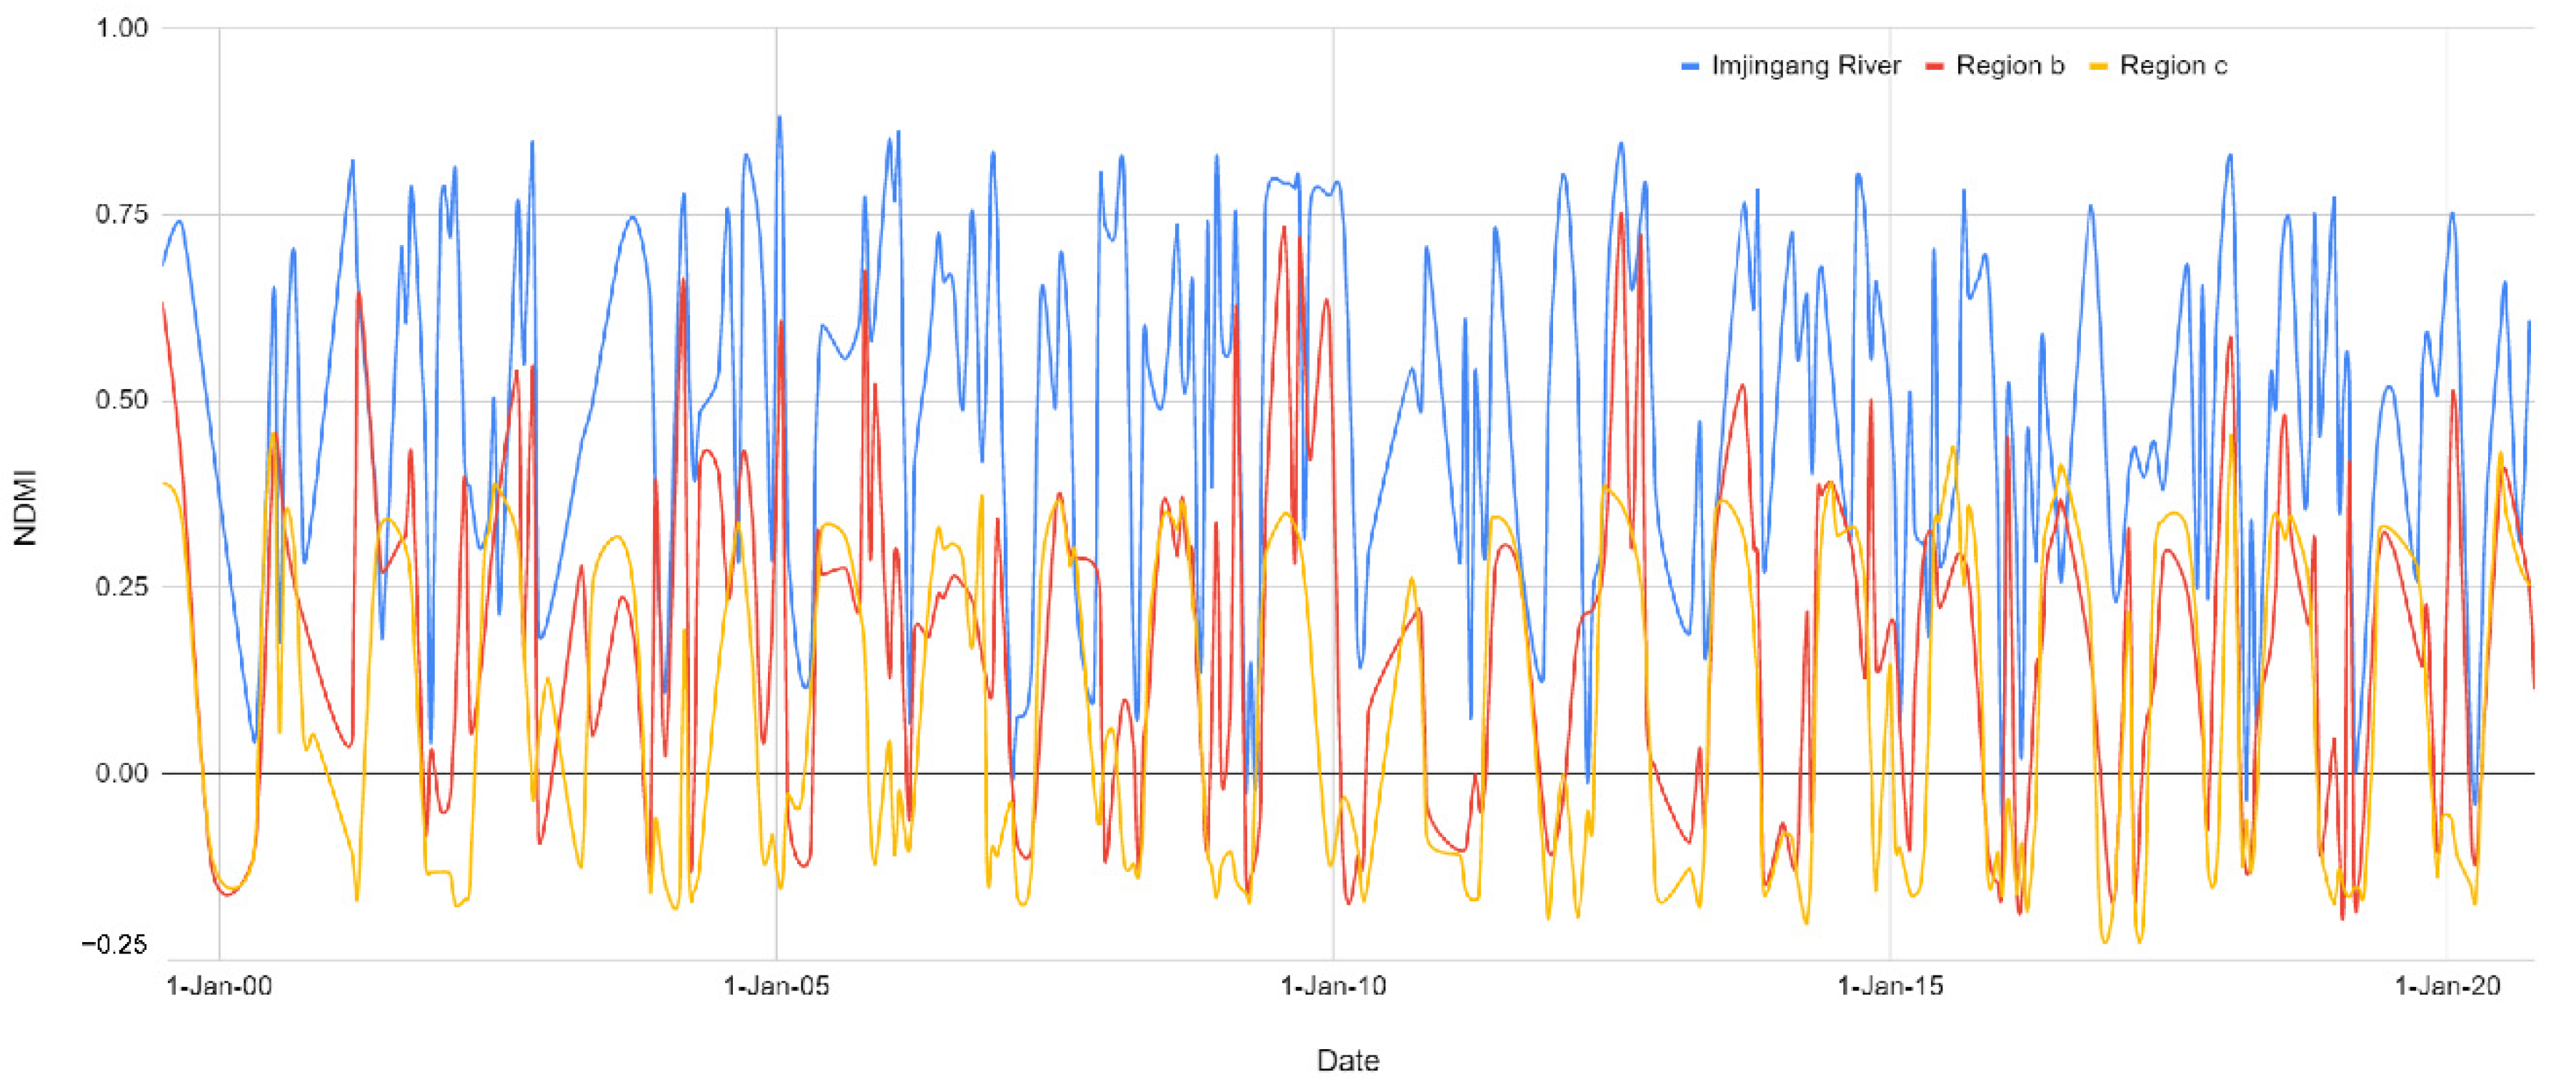
Time-series pattern of NDMI in the DMZ. Red line, NDMI of Region b in Figure 7b; wetland was maintained by water fluctuation. Yellow line, NDMI of Region c in Figure 7c; frequent fires occurred in the grassland. Blue line, NDMI of Imjingang River, which is the baseline. Data were analyzed from 1999 to 2020 using Landsat 7. NDMI of wetlands appeared to be affected by flooding caused by river overflows. NDMI was calculated using the Google Earth Engine.
Figure A4.
Time-series pattern of NDMI in the DMZ. Red line, NDMI of Region b in Figure 7b; wetland was maintained by water fluctuation. Yellow line, NDMI of Region c in Figure 7c; frequent fires occurred in the grassland. Blue line, NDMI of Imjingang River, which is the baseline. Data were analyzed from 1999 to 2020 using Landsat 7. NDMI of wetlands appeared to be affected by flooding caused by river overflows. NDMI was calculated using the Google Earth Engine.

References
- Vasilijević, M.; Zunckel, K.; McKinney, M.; Erg, B.; Schoon, M.; Rosen Michel, T. Transboundary conservation: A systematic and integrated approach. In Best Practice Protected Area Guidelines Series; The World Conservation Union (IUCN): Gland, Switzerland, 2015; pp. 12–107. ISBN 1817-3713. [Google Scholar]
- Thornton, D.H.; Branch, L.C. Transboundary mammals in the Americas: Asymmetries in protection challenge climate change resilience. Divers. Distrib. 2019, 25, 674–683. [Google Scholar] [CrossRef]
- Wang, T.; Feng, L.; Mou, P.; Wu, J.; Smith, J.L.D.; Xiao, W.; Yang, H.; Dou, H.; Zhao, X.; Cheng, Y.; et al. Amur tigers and leopards returning to China: Direct evidence and a landscape conservation plan. Landsc. Ecol. 2016, 31, 491–503. [Google Scholar] [CrossRef]
- Vitkalova, A.V.; Feng, L.; Rybin, A.N.; Gerber, B.D.; Miquelle, D.G.; Wang, T.; Yang, H.; Shevtsova, E.I.; Aramilev, V.V.; Ge, J. Transboundary cooperation improves endangered species monitoring and conservation actions: A case study of the global population of Amur leopards. Conserv. Lett. 2018, 11, e12574. [Google Scholar] [CrossRef]
- Liu, J.; Yong, D.L.; Choi, C.Y.; Gibson, L. Transboundary Frontiers: An Emerging Priority for Biodiversity Conservation. Trends Ecol. Evol. 2020, 35, 679–690. [Google Scholar] [CrossRef]
- Petursson, J.G.; Vedeld, P.; Kaboggoza, J. Transboundary biodiversity management: Institutions, local stakeholders, and protected areas: A case study from Mt. Elgon, Uganda And Kenya. Soc. Nat. Resour. 2011, 24, 1304–1321. [Google Scholar] [CrossRef]
- Griffin, P.J.; Ali, S.H. Managing transboundary wetlands: The Ramsar Convention as a means of ecological diplomacy. J. Environ. Stud. Sci. 2014, 4, 230–239. [Google Scholar] [CrossRef]
- Kim, K.C. Preserving Biodiversity in Korea’s Demilitarized Zone. Science 1997, 278, 242–243. [Google Scholar] [CrossRef]
- National Institute of Ecology Comprehensive Report of Biodiversity in the DMZ and its Vicinities; Ministry of Environment: Sejong, Korea, 2016; ISBN 9791186197592.
- Kim, J.H.; Park, S.; Kim, S.H.; Kang, K.; Waldman, B.; Lee, M.H.; Yu, M.; Yang, H.; Chung, H.Y.; Lee, E.J. Structural implications of traditional agricultural landscapes on the functional diversity of birds near the Korean Demilitarized Zone. Ecol. Evol. 2020. [Google Scholar] [CrossRef]
- Kim, S.H.; Kim, J.H.; Kim, J.G. Classification of small irrigation ponds in western Civilian Control Zone in Korea. J. Wetl. Res. 2011, 13, 275–289. [Google Scholar] [CrossRef]
- Sebastián-González, E.; Sánchez-Zapata, J.A.; Botella, F. Agricultural ponds as alternative habitat for waterbirds: Spatial and temporal patterns of abundance and management strategies. Eur. J. Wildl. Res. 2010, 56, 11–20. [Google Scholar] [CrossRef] [Green Version]
- Chung, H.-Y.; Yeom, C.-M.; Kim, J.H.; Park, S.; Lee, Y.-W.; Pyo, G.; Kim, S.H. Species Diversity and Community Characteristics of Benthic Macroinvertebrates from Irrigation Ponds in the Western CCZ area, Korea. Korean J. Ecol. Environ. 2020, 53, 173–184. [Google Scholar] [CrossRef]
- Lee, D.W. Ecological Implications of Landscape Elements in Traditional Korean Villages; Seoul National University Press: Seoul, Korea, 2005; ISBN 8952105834. [Google Scholar]
- Koh, D.Y. The Place-ness of the DMZ: The rise of DMZ tourism and the real DMZ project. Positions 2019, 27, 654–685. [Google Scholar] [CrossRef]
- Sung, C.-Y.; Cho, W. Landscape Analysis of Habitat Fragmentation in the North and South Korean Border. Korean J. Environ. Ecol. 2012, 26, 952–959. [Google Scholar]
- Paek, B.; Park, Y. ‘Security-Economy Nexus’ and Geo-political Economies of Territorization and De-territorializatin in the Border Regions of the Korean Peninsula. J. Korean Geogr. Soc. 2019, 54, 199–228. [Google Scholar]
- Kim, S.-T.; Jung, M.-P.; Kim, H.-S.; Shin, J.-H.; Lim, J.-H.; Kim, T.-W.; Lee, J.-H. Insect Fauna of Adjacent Areas of DMZ in Korea. J. Ecol. Environ. 2006, 29, 125–141. [Google Scholar] [CrossRef]
- Park, E.J.; Nam, M.A. Changes in Land Cover and the Cultivation Area of Ginseng in the Civilian Control Zone -Paju City and Yeoncheon County-. Korean J. Environ. Ecol. 2013, 27, 507–515. [Google Scholar]
- Sung, H.-C.; Kim, S.-R.; Kang, D.-I.; Seo, J.-Y.; Lee, S.-M. Analysis on the Type of Damaged Land in DeMilitarized Zone(DMZ) Area and Restoration Direction. J. Korea Soc. Environ. Restor. Technol. 2016, 19, 185–193. [Google Scholar] [CrossRef] [Green Version]
- Ju, J.; Kim, J.H.; Kim, S.H. Habitat Fragmentation by a Levee and Its Impact on Frog Population in the Civilian Control Zone. J. Wetl. Res. 2016, 18, 113–120. [Google Scholar] [CrossRef] [Green Version]
- Kim, J.H.; Chung, H.Y.; Kim, S.H.; Kim, J.G. The influence of water characteristics on the aquatic insect and plant assemblage in small irrigation ponds in Civilian Control Zone, Korea. J. Wetl. Res. 2016, 18, 331–341. [Google Scholar] [CrossRef] [Green Version]
- Jang, M.-H.; Yoon, J.-D.; Shin, J.-H.; Joo, G.-J. Status of freshwater fish around the Korean Demilitarized Zone and its implications for conservation. Aquat. Conserv. Mar. Freshw. Ecosyst. 2008, 18, 819–828. [Google Scholar] [CrossRef]
- Stefanov, W.L.; Ramsey, M.S.; Christensen, P.R. Monitoring urban land cover change: An expert system approach to land cover classification of semiarid to arid urban centers. Remote Sens. Environ. 2001, 77, 173–185. [Google Scholar] [CrossRef]
- Wang, S.W.; Gebru, B.M.; Lamchin, M.; Kayastha, R.B.; Lee, W.-K. Land Use and Land Cover Change Detection and Prediction in the Kathmandu District of Nepal Using Remote Sensing and GIS. Sustainability 2020, 12, 3925. [Google Scholar] [CrossRef]
- Zhu, Z.; Woodcock, C.E. Continuous change detection and classification of land cover using all available Landsat data. Remote Sens. Environ. 2014, 144. [Google Scholar] [CrossRef] [Green Version]
- Weng, Q. Land use change analysis in the Zhujiang Delta of China using satellite remote sensing, GIS and stochastic modelling. J. Environ. Manage. 2002, 64, 273–284. [Google Scholar] [CrossRef] [Green Version]
- Falcucci, A.; Maiorano, L.; Boitani, L. Changes in land-use/land-cover patterns in Italy and their implications for biodiversity conservation. Landsc. Ecol. 2007, 22, 617–631. [Google Scholar] [CrossRef]
- Marcucci, D.J. Landscape history as a planning tool. Landsc. Urban Plan. 2000, 49, 67–81. [Google Scholar] [CrossRef]
- National Geographic Information Institute. Available online: http://map.ngii.go.kr/ms/map/NlipMap.do (accessed on 1 March 2018).
- Earth Explorer. Available online: https://earthexplorer.usgs.gov/ (accessed on 1 June 2021).
- ENVI Atmospheric Corrections. Available online: https://www.l3harrisgeospatial.com/docs/routines-163.html (accessed on 2 July 2017).
- Rumelhart, D.E.; Hinton, G.E.; Williams, R.J. Learning Internal Representations by Error Propagation; California University San Diego La Jolla Institute for Cognitive Science: San Diego, CA, USA, 1985; pp. 318–351. [Google Scholar]
- Richards, J.A.; Richards, J.A. Remote Sensing Digital Image Analysis; Springer: Berlin/Heidelberg, Germany, 1999; Volume 3, ISBN 3642300618. [Google Scholar]
- Reed, B.C.; Brown, J.F.; VanderZee, D.; Loveland, T.R.; Merchant, J.W.; Ohlen, D.O. Measuring phenological variability from satellite imagery. J. Veg. Sci. 1994, 5, 703–714. [Google Scholar] [CrossRef]
- Nemani, R.; Pierce, L.; Running, S.; Band, L. Forest ecosystem processes at the watershed scale: Sensitivity to remotely-sensed leaf area index estimates. Int. J. Remote Sens. 1993, 14, 2519–2534. [Google Scholar] [CrossRef]
- Wilson, E.H.; Sader, S.A. Detection of forest harvest type using multiple dates of Landsat TM imagery. Remote Sens. Environ. 2002, 80, 385–396. [Google Scholar] [CrossRef]
- Konietschke, F.; Placzek, M.; Schaarschmidt, F.; Hothorn, L.A. nparcomp: An R Software Package for Nonparametric Multiple Comparisons and Simultaneous Confidence Intervals. J. Stat. Softw. 2015, 64. [Google Scholar] [CrossRef] [Green Version]
- Holden, Z.A.; Smith, A.M.S.; Morgan, P.; Rollins, M.G.; Gessler, P.E. Evaluation of novel thermally enhanced spectral indices for mapping fire perimeters and comparisons with fire atlas data. Int. J. Remote Sens. 2005, 26, 4801–4808. [Google Scholar] [CrossRef]
- Korean Statistical information service Population Data. Available online: http://kosis.kr/index/index.do (accessed on 16 January 2019).
- Bae, J.S.; Joo, R.W.; Kim, Y.-S. Forest transition in South Korea: Reality, path and drivers. Land Use Policy 2012, 29, 198–207. [Google Scholar] [CrossRef]
- Bae, J.S.; Kim, T.-H. Changes in Timber Supply-and-Demand, and Forest Resources of Joseon in the Japanese colonial period: Poor Forest Resources and Excessive Timber Production. J. Asiat. Stud. 2021, 64, 113–152. [Google Scholar] [CrossRef]
- Choung, Y.; Lee, B.C.; Cho, J.H.; Lee, K.S.; Jang, I.S.; Kim, S.H.; Hong, S.K.; Jung, H.C.; Choung, H.L. Forest responses to the large-scale east coast fires in Korea. Ecol. Res. 2004, 19, 43–54. [Google Scholar] [CrossRef]
- Chung, S.H.; Lee, Y.G.; Lee, S.T. Characteristics of Occurrence and Growth for Oak Sprouts on the Slope: With Particular Focused on Chungcheong Region of South Korea. J. Korean For. Soc. 2018, 107, 336–343. [Google Scholar]
- Lee, C.; You, Y.; Robinson, G.R. Secondary Succession and Natural Habitat Restoration in Abandoned Rice Fields of Central Korea. Restor. Ecol. 2002, 10, 306–314. [Google Scholar] [CrossRef]
- Liu, L.; Ge, J. Effects of fire disturbance on the forest structure and succession in the natural broad-leaved/Korean pine forest. J. For. Res. 2003, 14, 269–274. [Google Scholar] [CrossRef]
- Odum, E.P.; Barrett, G.W. Fundamentals of Ecology, 5th ed.; Thomson Brooks/Cole: Belmont, CA, USA, 2005. [Google Scholar]
- Franklin, J.; Syphard, A.D.; He, H.S.; Mladenoff, D.J. Altered fire regimes affect landscape patterns of plant succession in the foothills and mountains of southern California. Ecosystems 2005, 8, 885–898. [Google Scholar] [CrossRef]
- Lim, J.-H.; Kim, J.-H.; Bae, S.-W. Natural Regeneration Patten of Pine Seedlings on the Burned Forest Site in Gosung, Korea. Korean J. Agric. For. Meteorol. 2012, 14, 222–228. [Google Scholar] [CrossRef]
- Keddy, P.A. Wetland Ecology: Principles and Conservation; Cambridge University Press: New York, NY, USA, 2010. [Google Scholar]
- De Jager, N.R.; Van Appledorn, M.; Fox, T.J.; Rohweder, J.J.; Guyon, L.J.; Meier, A.R.; Cosgriff, R.J.; Vandermyde, B.J. Spatially explicit modelling of floodplain forest succession: Interactions among flood inundation, forest successional processes, and other disturbances in the Upper Mississippi River floodplain, USA. Ecol. Modell. 2019, 405, 15–32. [Google Scholar] [CrossRef]
- Deegan, B.M.; White, S.D.; Ganf, G.G. The influence of water level fluctuations on the growth of four emergent macrophyte species. Aquat. Bot. 2007, 86, 309–315. [Google Scholar] [CrossRef]
- Wang, P.; Zhang, Q.; Xu, Y.S.; Yu, F.H. Effects of water level fluctuation on the growth of submerged macrophyte communities. Flora Morphol. Distrib. Funct. Ecol. Plants 2016, 223, 83–89. [Google Scholar] [CrossRef]
- Wilcox, D.A. Implications of hydrologic variability on the succession of plants in Great Lakes wetlands. Aquat. Ecosyst. Health Manag. 2004, 7, 223–231. [Google Scholar] [CrossRef]
- Garssen, A.G.; Baattrup-Pedersen, A.; Voesenek, L.A.C.J.; Verhoeven, J.T.A.; Soons, M.B. Riparian plant community responses to increased flooding: A meta-analysis. Glob. Chang. Biol. 2015, 21, 2881–2890. [Google Scholar] [CrossRef]
- Jian, Z.; Ma, F.; Guo, Q.; Qin, A.; Xiao, W. Long-term responses of riparian plants’ composition to water level fluctuation in China’s Three Gorges Reservoir. PLoS ONE 2018, 13, e0207689. [Google Scholar] [CrossRef] [PubMed]
- Vulink, J.T.; Van Eerden, M.R. Hydrological conditions and herbivory as key operators for ecosystem development in Dutch artificial wetlands. In Grazing and Conservation Management; Springer: Dordrecht, The Netherlands, 1998; pp. 217–252. [Google Scholar]
- Henwood, W.D. Toward a strategy for the conservation and protection of the world’s temperate grasslands. Great Plains Res. 2010, 20, 121–134. [Google Scholar]
- Phifer, C.C.; Knowlton, J.L.; Webster, C.R.; Flaspohler, D.J.; Licata, J.A. Bird community responses to afforested eucalyptus plantations in the Argentine pampas. Biodivers. Conserv. 2017, 26, 3073–3101. [Google Scholar] [CrossRef]
- Carbutt, C.; Henwood, W.D.; Gilfedder, L.A. Global plight of native temperate grasslands: Going, going, gone? Biodivers. Conserv. 2017, 26, 2911–2932. [Google Scholar] [CrossRef]
- Azpiroz, A.B.; Isacch, J.P.; Dias, R.A.; Di Giacomo, A.S.; Fontana, C.S.; Palarea, C.M. Ecology and conservation of grassland birds in southeastern South America: A review. J. Field Ornithol. 2012, 83, 217–246. [Google Scholar] [CrossRef]
- Kim, S.; Lee, A.S.; Hwang, S. Aid to North Korea for Capacity Building of the Unification of Korea—Comparative Analysis on the Role of States and International Organizations. J. Int. Polit. 2018, 23, 5–43. [Google Scholar] [CrossRef]
- Kang, M.-J.; Lim, Y.-H.; Yon, H.-A. A Plan of Land Use for Border Areas between South and North Korea in Preparing for Reunification: Focusing on the Projects for the Inter-Korean Cooperation; Korea Research Institute for Human Settlements: Sejong, Korea, 2017; ISBN 9791158982454. [Google Scholar]
- Lee, S.; Choi, S.; Lee, D.; Hwang, S.; Ahn, J. The Flora of Vascular Plants in the West Side of DMZ Area. Korean J. Environ. Ecol. 2016, 30, 1–18. [Google Scholar] [CrossRef]
- Son, H.J.; Kim, Y.S.; Ahn, C.-H.; Park, W.G. Analysis of the Flora and Vegetation Community in Forest Genetic Resources Reserves (Mt. Daeseng, Juparyeong), Near the DMZ. J. Korean For. Soc. 2016, 105, 19–41. [Google Scholar] [CrossRef]
- UN THE 17 GOALS | Sustainable Development. Available online: https://sdgs.un.org/goals (accessed on 19 June 2021).
Figure 1.
Location of study site in the Demilitarized Zone (DMZ) and Civilian Control Zone (CCZ) of Korea. Red- and yellow-green regions indicate the study site, including Paju-si city and Yeoncheon-gun county. The study site is surrounded by large cities of North and South Korea, such as Seoul, Goyang, Paju, and Kaesong.

Figure 2.
Landscape of western DMZ and CCZ in Paju. Typical topography and composition of vegetation. (a) Grassland and forest areas in western DMZ (photograph by Seung Ho Kim). (b) Agricultural landscape, including dumbeong, a traditional irrigation pond, in western CCZ (photograph by Jae Hyun Kim). (c) Topographical map of the western CCZ. Landscape mainly consists of emergent plants and Salix species in the riverside, rice paddies, and forests.

Figure 3.
Residential population by administrative district near the DMZ. The population of Paju has increased rapidly since the 2000s.
Figure 3.
Residential population by administrative district near the DMZ. The population of Paju has increased rapidly since the 2000s.

Figure 4.
Maps of land-use types in western DMZ and CCZ in Paju-si and Yeoncheon-gun over 100 years (1919–2017) in Korea.
Figure 4.
Maps of land-use types in western DMZ and CCZ in Paju-si and Yeoncheon-gun over 100 years (1919–2017) in Korea.

Figure 5.
Changes in land-use patterns in western DMZ and CCZ in Paju-si and Yeoncheon-gun over 100 years (1919–2017) in Korea. (a) Changes in forest area. Forests classified as coniferous and deciduous, and relative area of total forest is indicated. (b) Changes in areas of vegetation, rice paddies, and bare soil. (c) Changes in areas of artificial structures, including built-up (such as roads) and agricultural (such as ginseng fields) facilities. (d) Changes in water bodies and floodplain (lacking vegetation).

Figure 6.
Population change in western CCZ in Paju. Since the division, a limited number of people have lived in civilian control areas.
Figure 6.
Population change in western CCZ in Paju. Since the division, a limited number of people have lived in civilian control areas.

Figure 7.
Wildfire outbreaks in western DMZ and CCZ from 1985 to 2017. (a) Cumulative map of number of wildfires. (b) Wildfires from 1985 to 2017 in Region b. Fires in Region b mainly occurred in forests, followed by grasslands. Note: 1, fire outbreak. (c) Wildfires from 1985 to 2017 in Region c. This area is inland and, unlike Region b, wetlands were not developed. (d) Wildfires from 1985 to 2017 in Region d. Region belongs to Yeoncheon-gun, and fires were frequent. (e) Frequency of wildfires on different vegetation types in Regions b–d.

Table 1.
Landsat image properties.
| Satellite | Sensor | Date | Resolution |
|---|---|---|---|
| Landsat | TM5 | 3 July 1984 | 30 m |
| Landsat | TM5 | 12 September 1994 | 30 m |
| Landsat | ETM | 5 September 2006 | 30 m |
| Landsat | OLI | 26 August 2017 | 30 m |
Publisher’s Note: MDPI stays neutral with regard to jurisdictional claims in published maps and institutional affiliations. |
© 2021 by the authors. Licensee MDPI, Basel, Switzerland. This article is an open access article distributed under the terms and conditions of the Creative Commons Attribution (CC BY) license (https://creativecommons.org/licenses/by/4.0/).
Share and Cite
MDPI and ACS Style
Kim, J.H.; Park, S.; Kim, S.H.; Lee, E.J. Long-Term Land Cover Changes in the Western Part of the Korean Demilitarized Zone. Land 2021, 10, 708. https://0-doi-org.brum.beds.ac.uk/10.3390/land10070708
AMA Style
Kim JH, Park S, Kim SH, Lee EJ. Long-Term Land Cover Changes in the Western Part of the Korean Demilitarized Zone. Land. 2021; 10(7):708. https://0-doi-org.brum.beds.ac.uk/10.3390/land10070708
Chicago/Turabian StyleKim, Jae Hyun, Shinyeong Park, Seung Ho Kim, and Eun Ju Lee. 2021. "Long-Term Land Cover Changes in the Western Part of the Korean Demilitarized Zone" Land 10, no. 7: 708. https://0-doi-org.brum.beds.ac.uk/10.3390/land10070708
Note that from the first issue of 2016, this journal uses article numbers instead of page numbers. See further details here.