1. Introduction
As the provider of resources and the recipient of emissions from human activities, soil is an important contributor to the survival of the human environment. Its quality and pollution level not only influence the output of agricultural activities, but also affect human health [
1,
2,
3]. With the acceleration of industrialization and urbanization, the pollutants discharged from industry, transportation, and daily life are increasing, which brings about new challenges to the environment [
4,
5,
6,
7]. Due to their potential toxicity, high degree of concealment, and irreversible characteristics, potentially toxic elements (PTEs) are representative pollutants in industrialized societies and have become a problem that people urgently need to understand and solve [
8,
9,
10]. An excessive amount of PTEs in soil will result in direct damage to crops and could even lead to the death of plants. In addition, PTEs harm human health through the food chain and could also indirectly threaten human health by affecting the quality of water and the atmospheric environment. For example, mercury can sink into the liver, causing great damage to the brain, nerves, and vision, and cadmium can not only cause hypertension, cardiovascular disease, and cerebrovascular disease, but can also damage bones, the liver, and kidneys and cause renal failure [
11,
12].
Urbanization is a significant driving factor in global environmental change, which is inseparable from the development of industrialization. It manifests as the intensification of the population in cities and their surrounding areas as well as the centralization of the industrial distribution [
13,
14]. As the transitional zone of the city and countryside, the urban fringe is an interactive interface of economic activities between urban and rural areas. In the process of urbanization, the urban fringe is strongly interfered with by human beings, its surface structure and land use types are diverse and highly variable, and it its size far exceeds that of the central urban area and rural hinterland [
15,
16]. The land use type is an important projection of the relationship between humans and nature. With the increasing scale and speed of urbanization and industrialization, the land use pattern of the urban fringe has changed greatly [
17]. As it is affected by human activities, transportation, industry, etc., the amount of heavy metal pollution emissions in the urban fringe is high and the impact on the surrounding high-density population and farmland is more significant [
18,
19]. The spatial heterogeneity of pollution is also higher than that of other regions [
20,
21]. Recent studies on PTEs in soil in the urban fringe have mainly focused on the content distribution characteristics [
22,
23,
24] and the sources [
25,
26,
27] of PTEs. For example, Zuzolo et al. [
28] investigated PTEs in soil in southern Italy and used compositional CLR to explain the geological process and the source of each element. Buttafuoco et al. [
29] used principal component analysis (PCA) and factorial Kriging analysis (FKA) to explain the source and distribution of the urban soil in the city of Tampere (Finland). However, there are many varieties of land use types and production enterprises in the urban fringe, and the sources of and risk control standards for the PTEs in soil are also different. There have only been a few controlled studies that have explored the sources of PTEs in soil in order to formulate prevention and remediation measures according to local conditions by combining different types of risk control standards and enterprise production environments.
The current study focuses on Weidong New District in Weinan, Shaanxi Province, China, which is an area located on an urban fringe with numerous industrial facilities, such as cement, chemical, vehicle repair, machinery, and coal plants, which may cause heavy metal pollution in the soil. Residents in the study area have been using nearby water sources to irrigate agricultural land, which may be harmed by heavy metal pollution from various sources. This study analyzed the spatial distribution characteristics of As, Hg, Pb, Cr, Cu, and Ni in soil by using geostatistical methods and GIS technology. Based on the field investigation results, we plotted the distribution status of land use and enterprises in the study area and analyzed the relationship between the distribution of different PTEs, land use types, and pollution facilities. The status of heavy metal pollution in different land use types was evaluated. Finally, based on the research results, we discuss the treatment measures that are suitable for local conditions. Through the analysis of the spatial distribution characteristics of PTEs in the soil in the study area, combined with the human activities in and the ecological background of the study area, we have deepened our understanding of the soil environment’s quality in order to provide guidance for the prevention and control of PTE pollution in the soil and ecological environment restoration.
2. Materials and Methods
2.1. Study Area
2.1.1. Basic Information
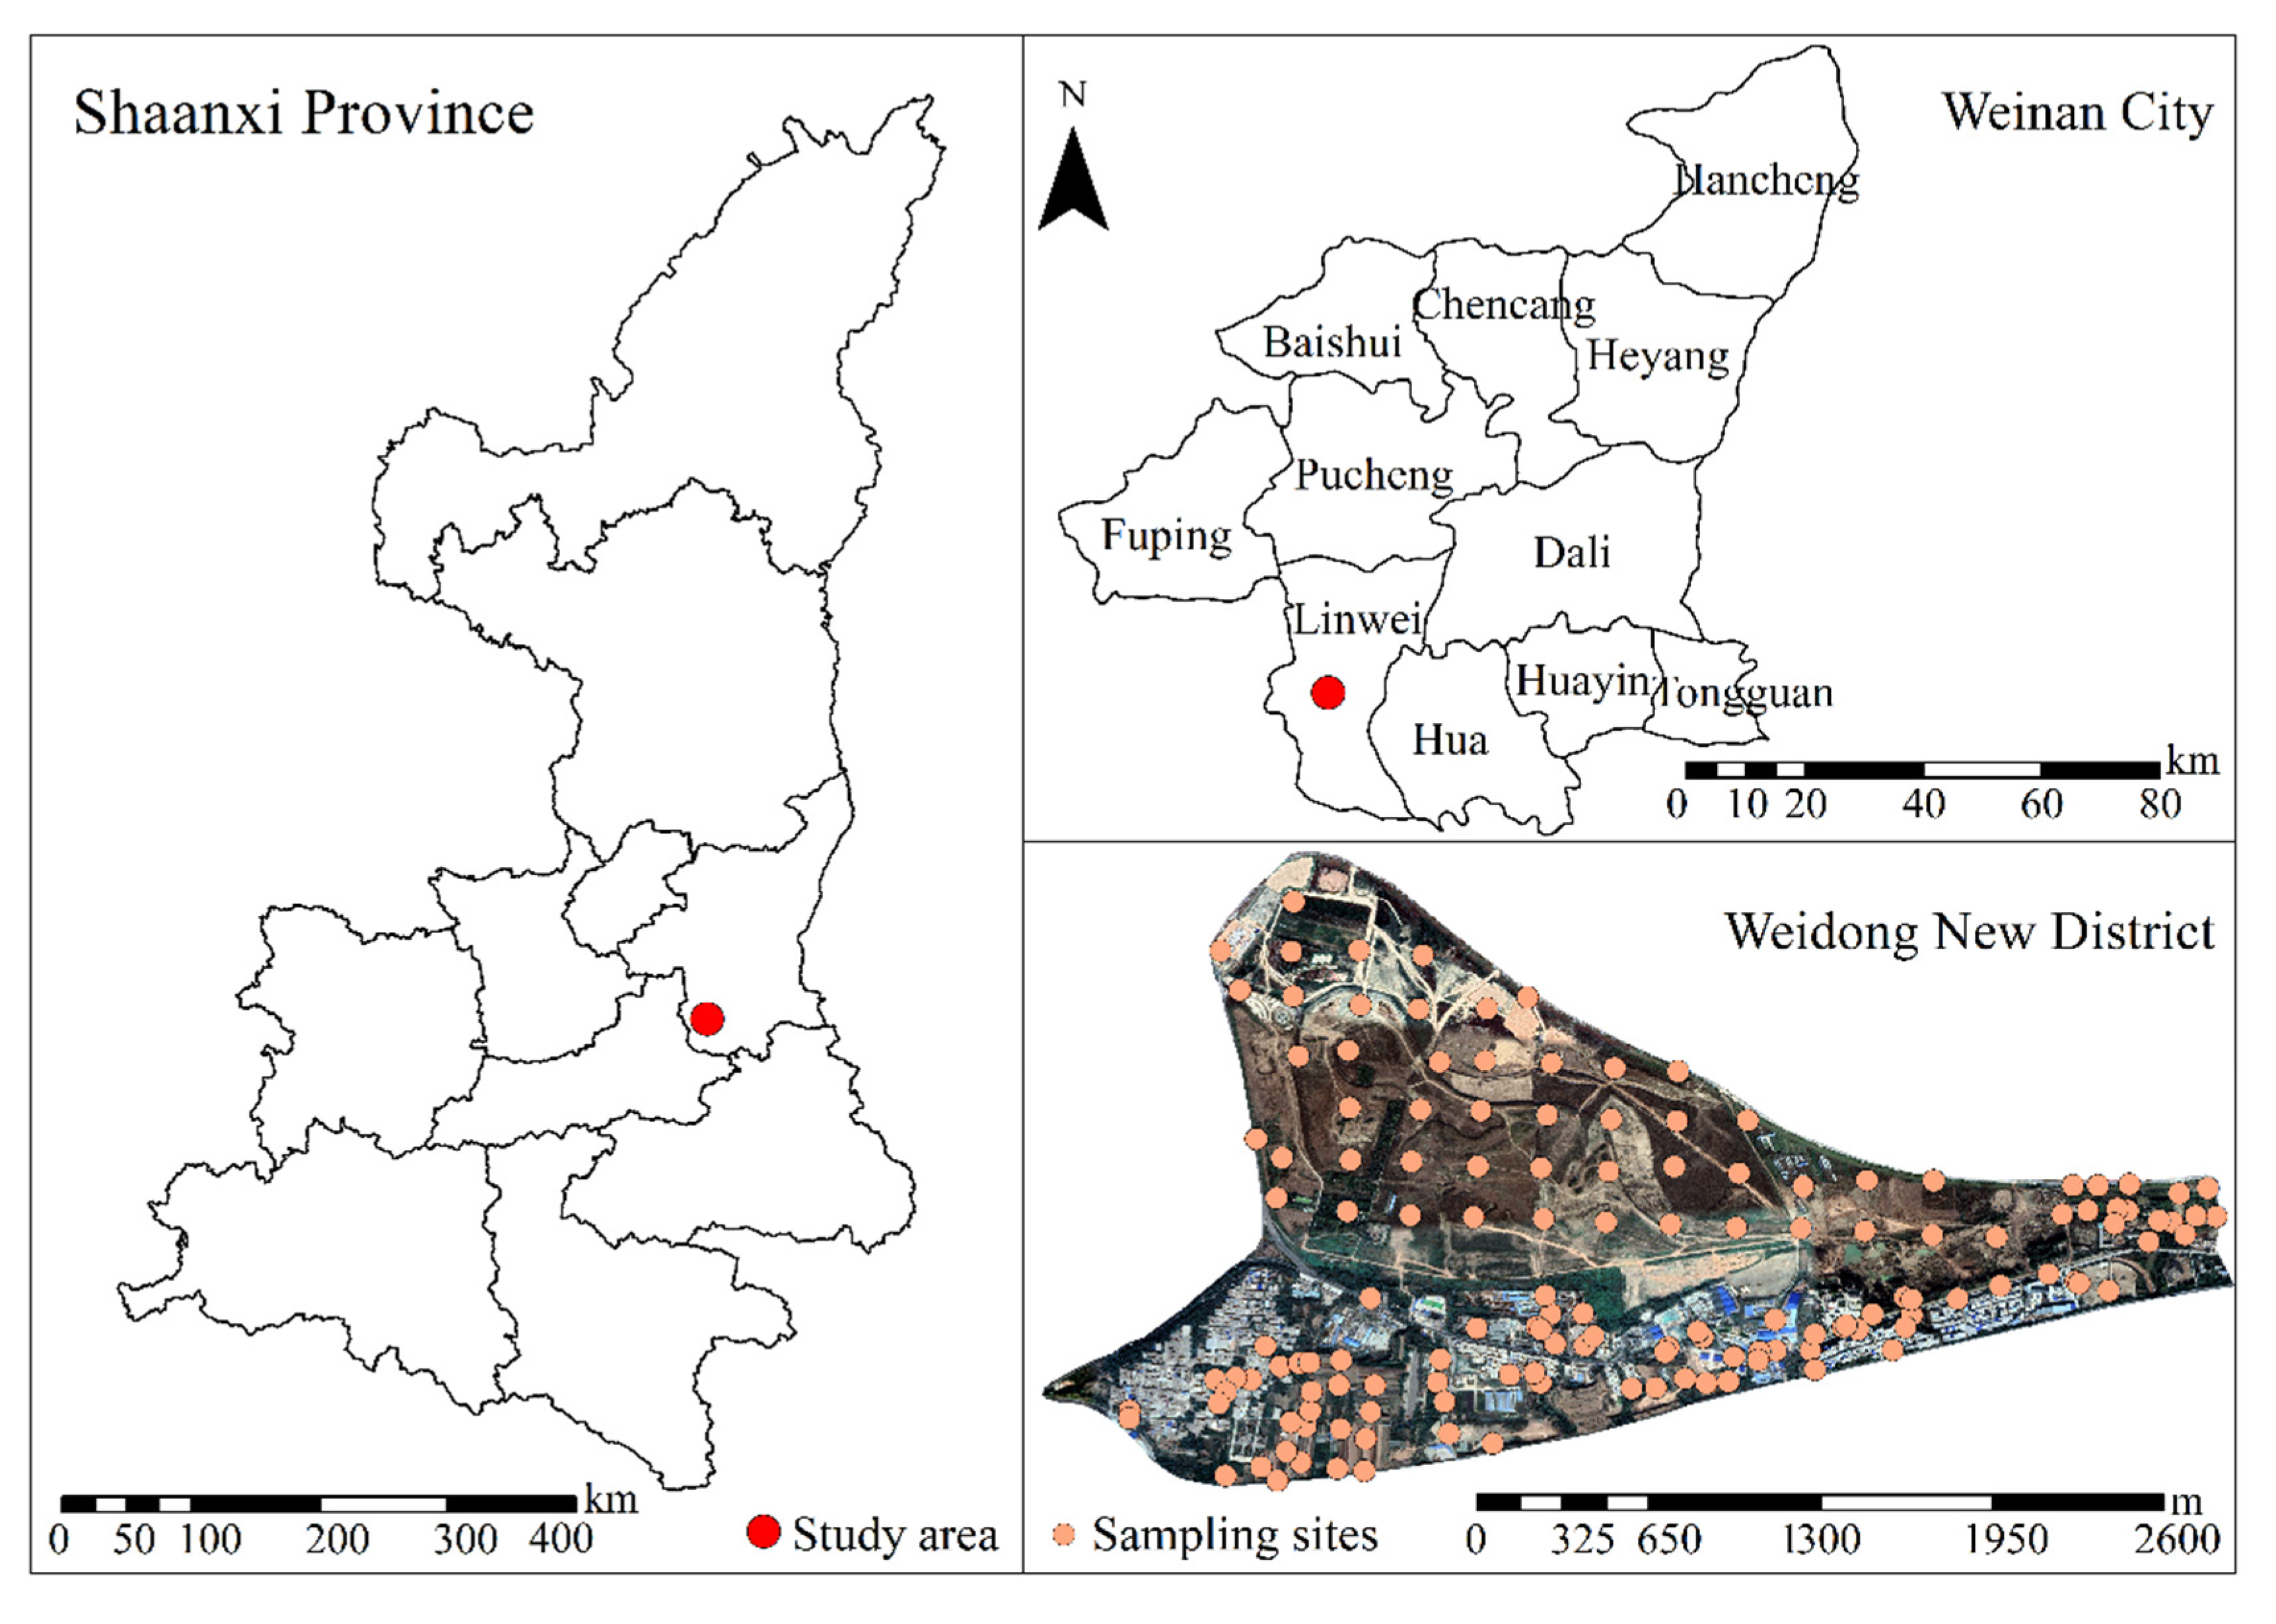
The study area is Weidong New District in Weinan, Shaanxi Province, China (
Figure 1), which is surrounded by the loess tableland of Linwei District and the Weihe Plain. Weinan is located in the Weihe basin, which lies between the Qinling fold mountain and the Ordos platform. The stratigraphic system is divided into North China and Qinling. The exposed strata include Archean, middle Late Proterozoic, Cambrian Ordovician, Devonian, Carboniferous, Permian, Triassic, Jurassic, Cretaceous, and Cenozoic strata. The bedrock in the Weinan area is distributed in Archean and Lower Paleozoic strata, while the depression area is dominated by Lower Paleozoic strata. The bedrock is overlaid by a very thick Cenozoic sedimentary layer, beneath which you can see the Ordovician strata and a very deep Cenozoic sedimentary layer (4500 m in the deep zone and 3000–3500 m in the terraces). The area lies between the southern bank of the Weihe River and the Lian-Huo Highway, which is east of the G310 national highway, south of Tiding Road, and north of the Jing-Kun highway (109°31′43″–109°34′7″ E, 34°29′28″–34°30′45″ N). The study area has a total area of approximately 4.0 km
2. The stratigraphic texture of the study area mainly includes the first, second, and third terraces of the Weihe River, the riverbed of the Weihe River, and the floodplain loess platform. The study area is located in a warm zone with a semi-humid and semi-arid monsoon climate, four distinct seasons, and an abundance of sunlight and rainfall. Its mean annual air temperature ranges from 12 to 14 °C, and the annual precipitation is approximately 600 mm, which mainly occurs in summer and fall. The precipitation in July and August accounts for nearly 35% of the annual precipitation. The main soil types are fluvo-aquic soil and yellow loess soil. Weinan has experienced rapid urbanization over the past several decades. There are more than 20 types of polluting enterprises in the suburb, such as chemical plants, funeral homes, and medical waste treatment plants. These polluting enterprises also constitute areas of direct discharge of wastewater, waste gas, and waste slag in Weinan city. In recent years, PTE pollution caused by the city’s expansion has drastically affected the soil ecological environment and human health.
2.1.2. Land Use and Enterprise Facilities Distribution
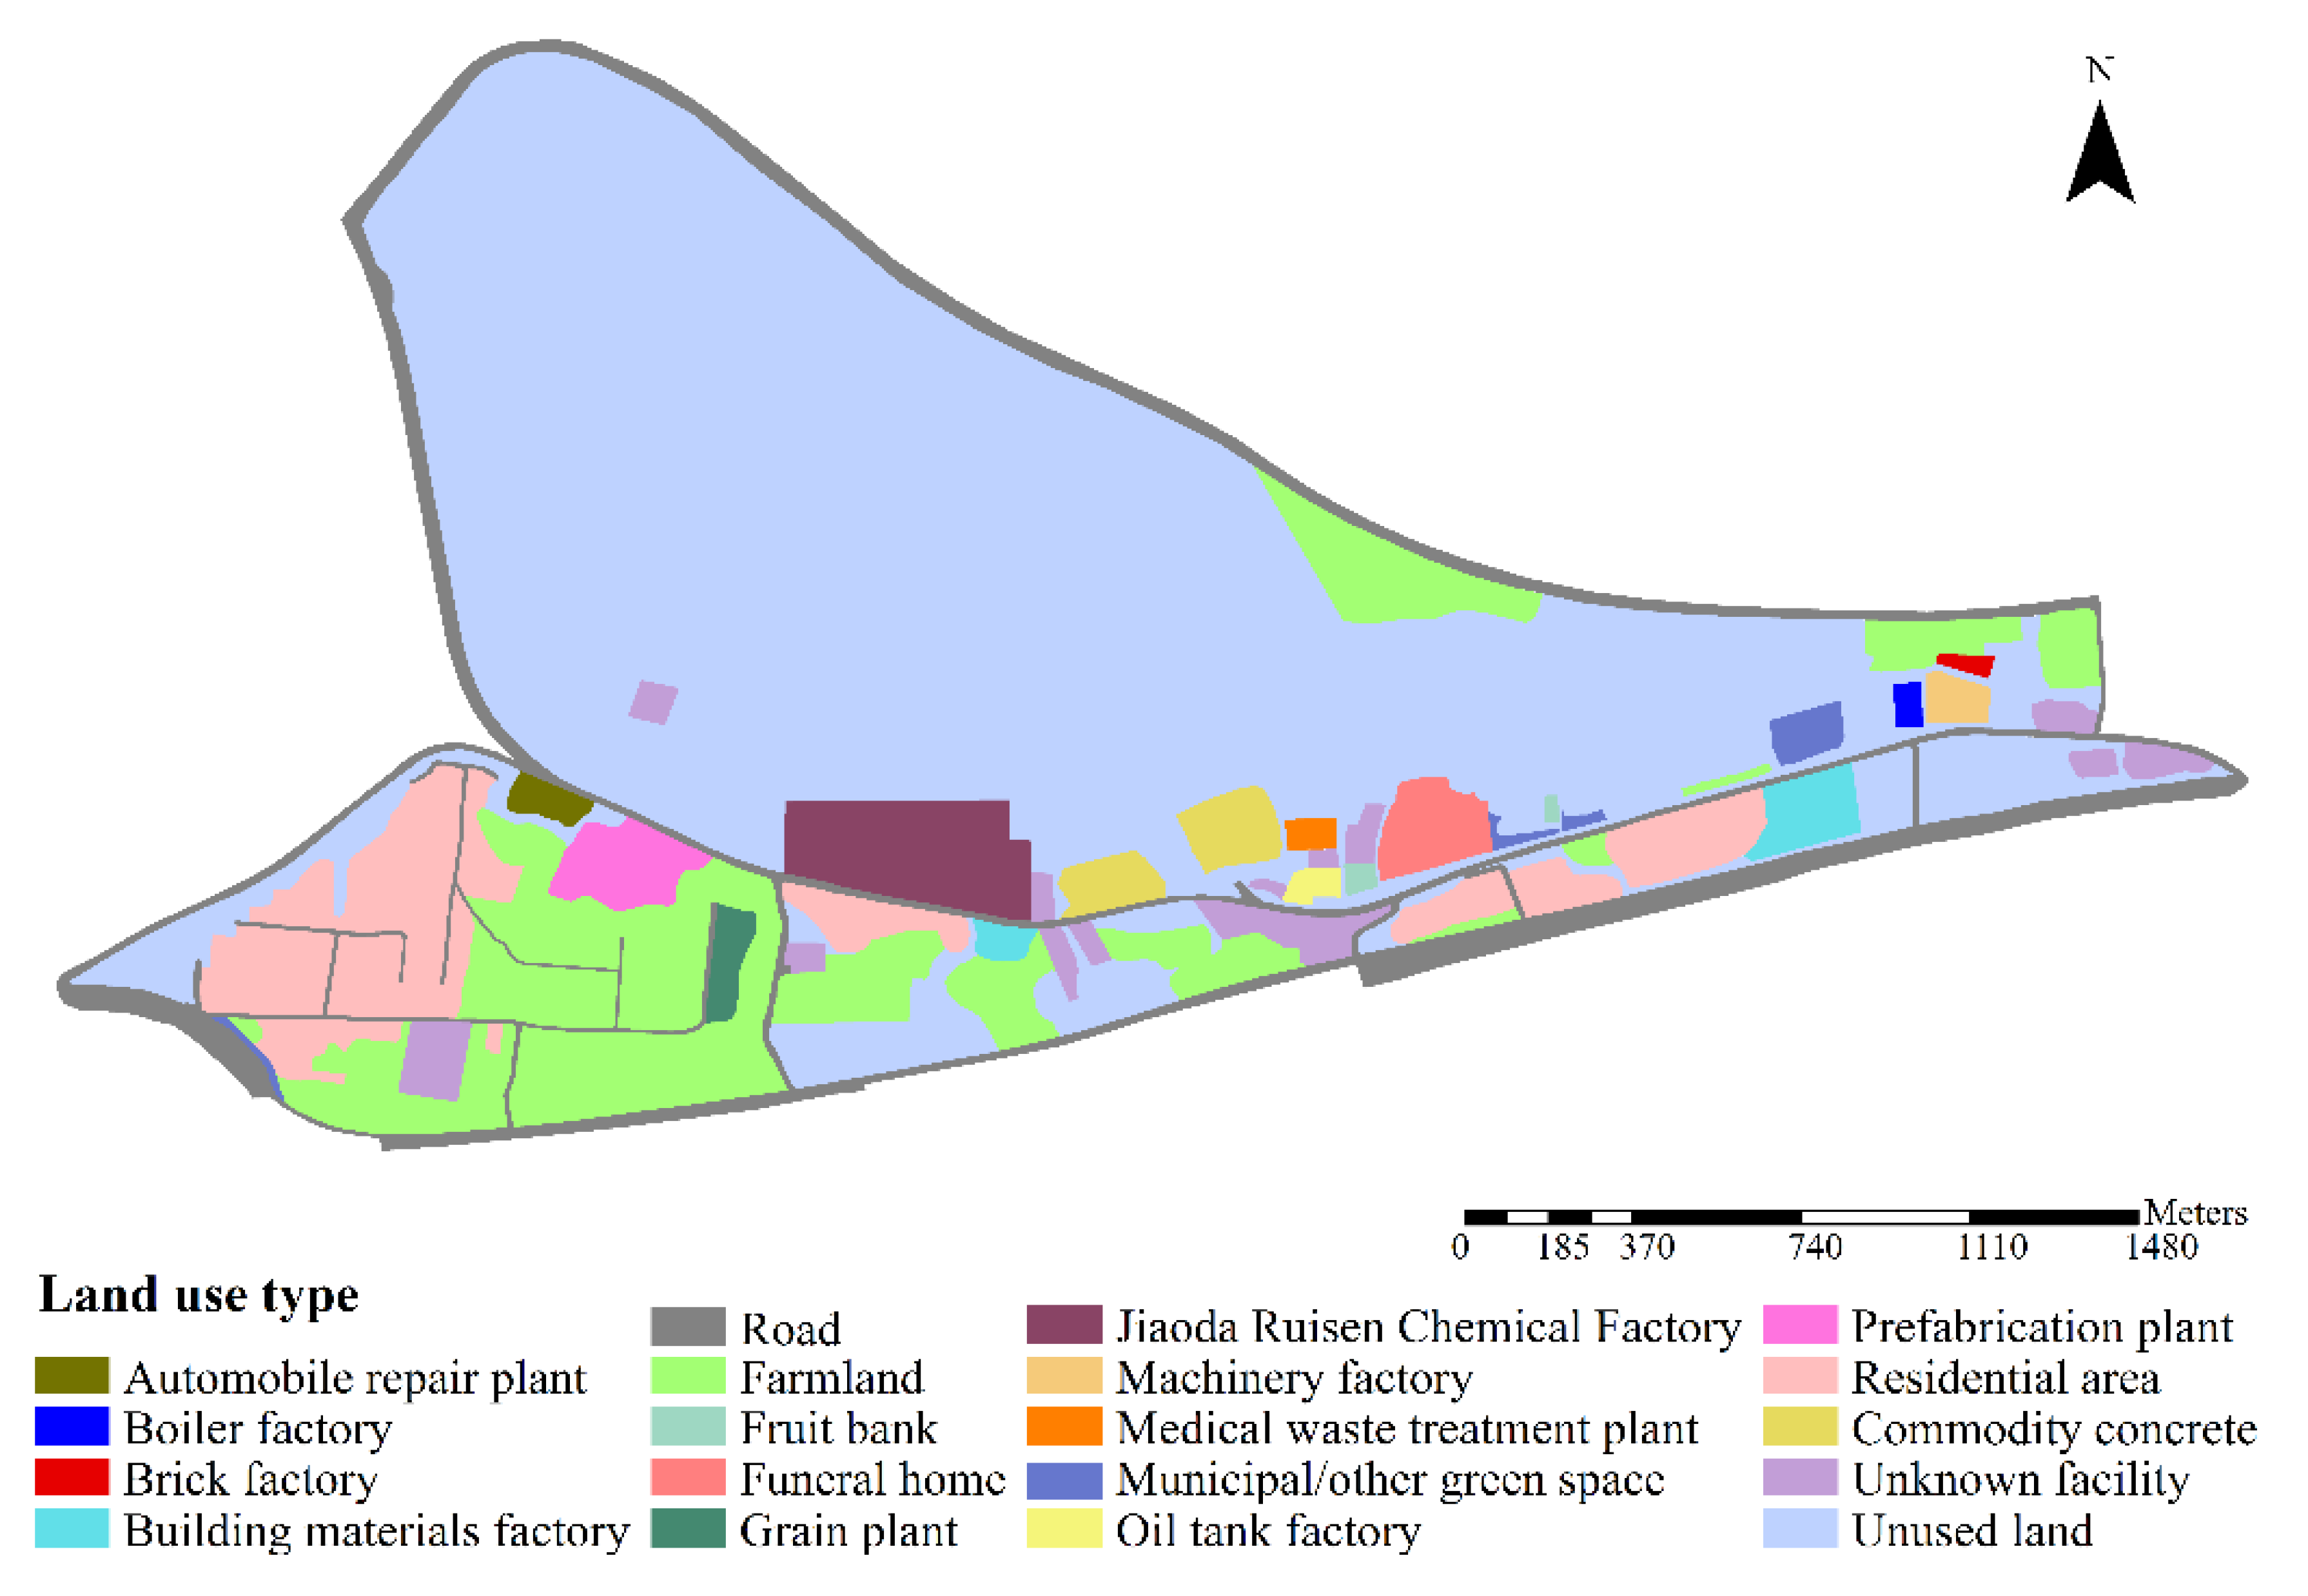
The study area contains villages, farmlands, a wetland park (under construction), machinery plants, a chemical industrial plant, a funeral parlor, and a slaughterhouse, among other things (
Figure 2). The slaughterhouse is in the north of the study area, while the villages, farmland, and machinery plants are in the south, alongside and south of the G310 national highway. The farmlands mainly comprise croplands and woodlands, and the main crops on the former are corn, wheat, and vegetables. More than 20 industrial enterprises are located in the south, including a chemical industrial plant, a medical scrap station, a funeral parlor, a vehicle repair plant, a bituminous concrete plant, a building material plant, and a prefabrication plant (
Table 1). The enterprises and facilities in the study area may have caused some pollution to occur during their operations.
2.2. Field Investigation, Sample Collection, and Measurement
The land use types, factory distribution, and raw materials, products, and production processes used in industrial production in the study area were investigated in detail. The fertilizers, pesticides, and irrigation water used in agricultural production were also investigated. Based on an analysis of the land use and the geological background, sampling points were selected to represent a range of soil pollutants. In the northern part of the study area, a flat and open ecological park was selected with a sampling interval of 200 m and sampling points evenly distributed in a net-like structure. In the southern part of the study area, sampling points were selected from unturned and unmoved soil areas located near villages or industrial facilities. During sampling, sundries, such as large-grain gravel, weeds, and plant roots, were first removed from the soil. Wooden spades were then used to extract the topsoil, which had a thickness of 0–20 cm. Diagonal sampling was used in five places inside the quadrat. After uniformly mixing the collected materials from these five sites, the samples were quartered in order to reduce their weight to 1 kg and then sealed in numbered polyethylene plastic bags. In total, 138 topsoil samples were collected, and their geographical coordinates were determined via a real-time kinematic (RTK) with a precision of 1 cm.
The soil samples were dried in an oven at 85 °C to a constant weight after debris, such as stones and plant tissue, were removed. The soil was then ground using a porcelain mortar, passed through a 100-mesh sieve, and stored [
24]. The soil samples were microwave-digested using HNO
3–HCl–HClO
4. The As, Pb, Cr, Cu, and Ni contents were measured using ICP-AES (Thermo Fisher Scientific Inc., Bremen, Germany), and the Hg content was measured by atomic fluorescence spectrometry (AFS). All reagents used in this study were high-purity reagents, and Chinese national standard soil samples were used for quality control [
25]. The recovery rate was 100 ± 10% (mean ± standard deviation), which conformed to the required precision.
2.3. Spatial Distribution Characteristics of PTEs
The spatial interpolation method was used to analyze the spatial distribution of PTEs in the soil in the study area. Spatial interpolation is an analytical method based on the spatial autocorrelation of the distribution of objects. It can use existing points to predict or complement planar areas of the raster data. These interpolation methods for deterministic models include inverse distance weighting, natural neighborhood interpolation, spline interpolation, rectangular interpolation, and polynomial interpolation. For non-deterministic models, the Kriging method is a mainstream interpolation approach that can be used for the semi-variable function in order to simulate a continuous surface. When calculating the value of a raster, the Kriging interpolation method considers the distance between and variation in the data points by calculating the weighted linear combination of points around the desired point. The Kriging method can not only be used to calculate the best unbiased estimator and the corresponding weight under known conditions, but also to set the trend direction for the semi-variable function during interpolation. Furthermore, it can be used to evaluate the residual for each interpolated point, which provides a confidence coefficient. Kriging interpolation uses a geostatistical model and is a common spatial interpolation method. This method consists of a regression algorithm for spatially modeling and interpolating the stochastic process/random field based on the covariance function. The Kriging method gives the best linear unbiased prediction (BLUP) in a specific stochastic process, so it is also called spatial BLUP [
30,
31]. In geostatistics, this method has several forms, including simple and ordinary Kriging interpolation. The equations for simple Kriging interpolation are as follows:
In Equation (1), is the estimated value of at point ; is the value near known point; and is the Kriging weight. For simple Kriging interpolation, this is an unbiased weight . Equation (2) provides the weight calculation.
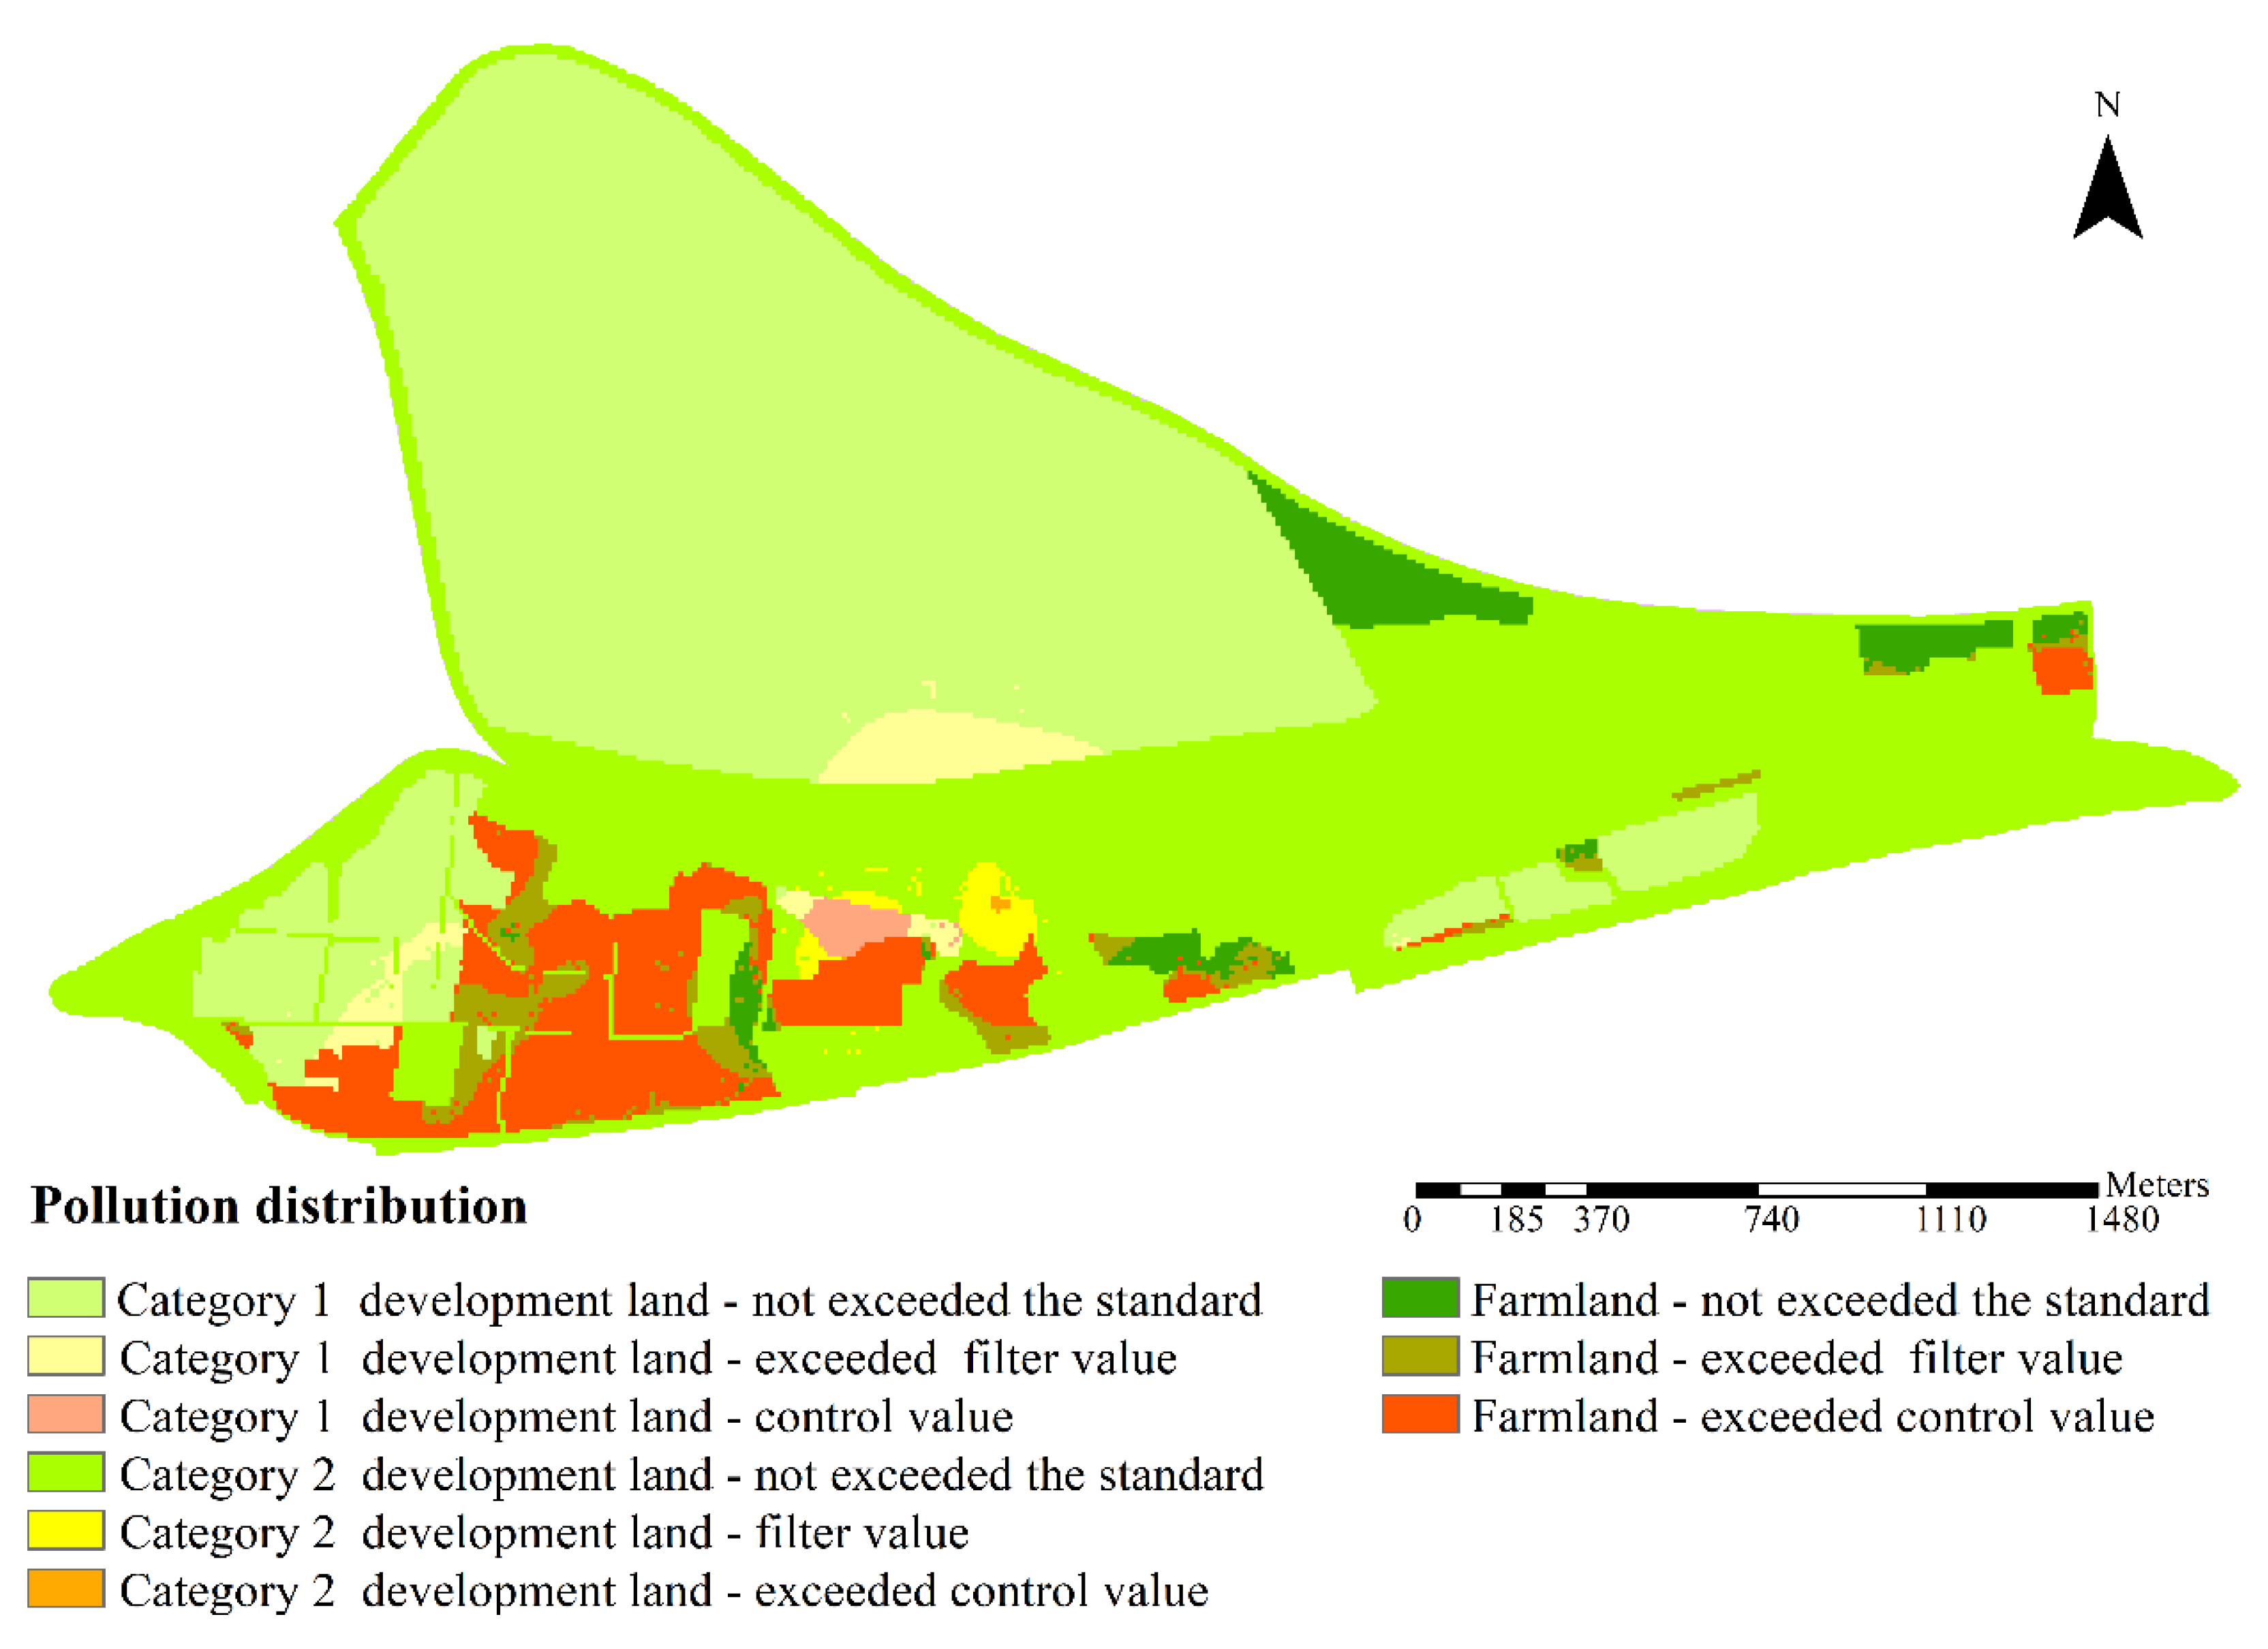
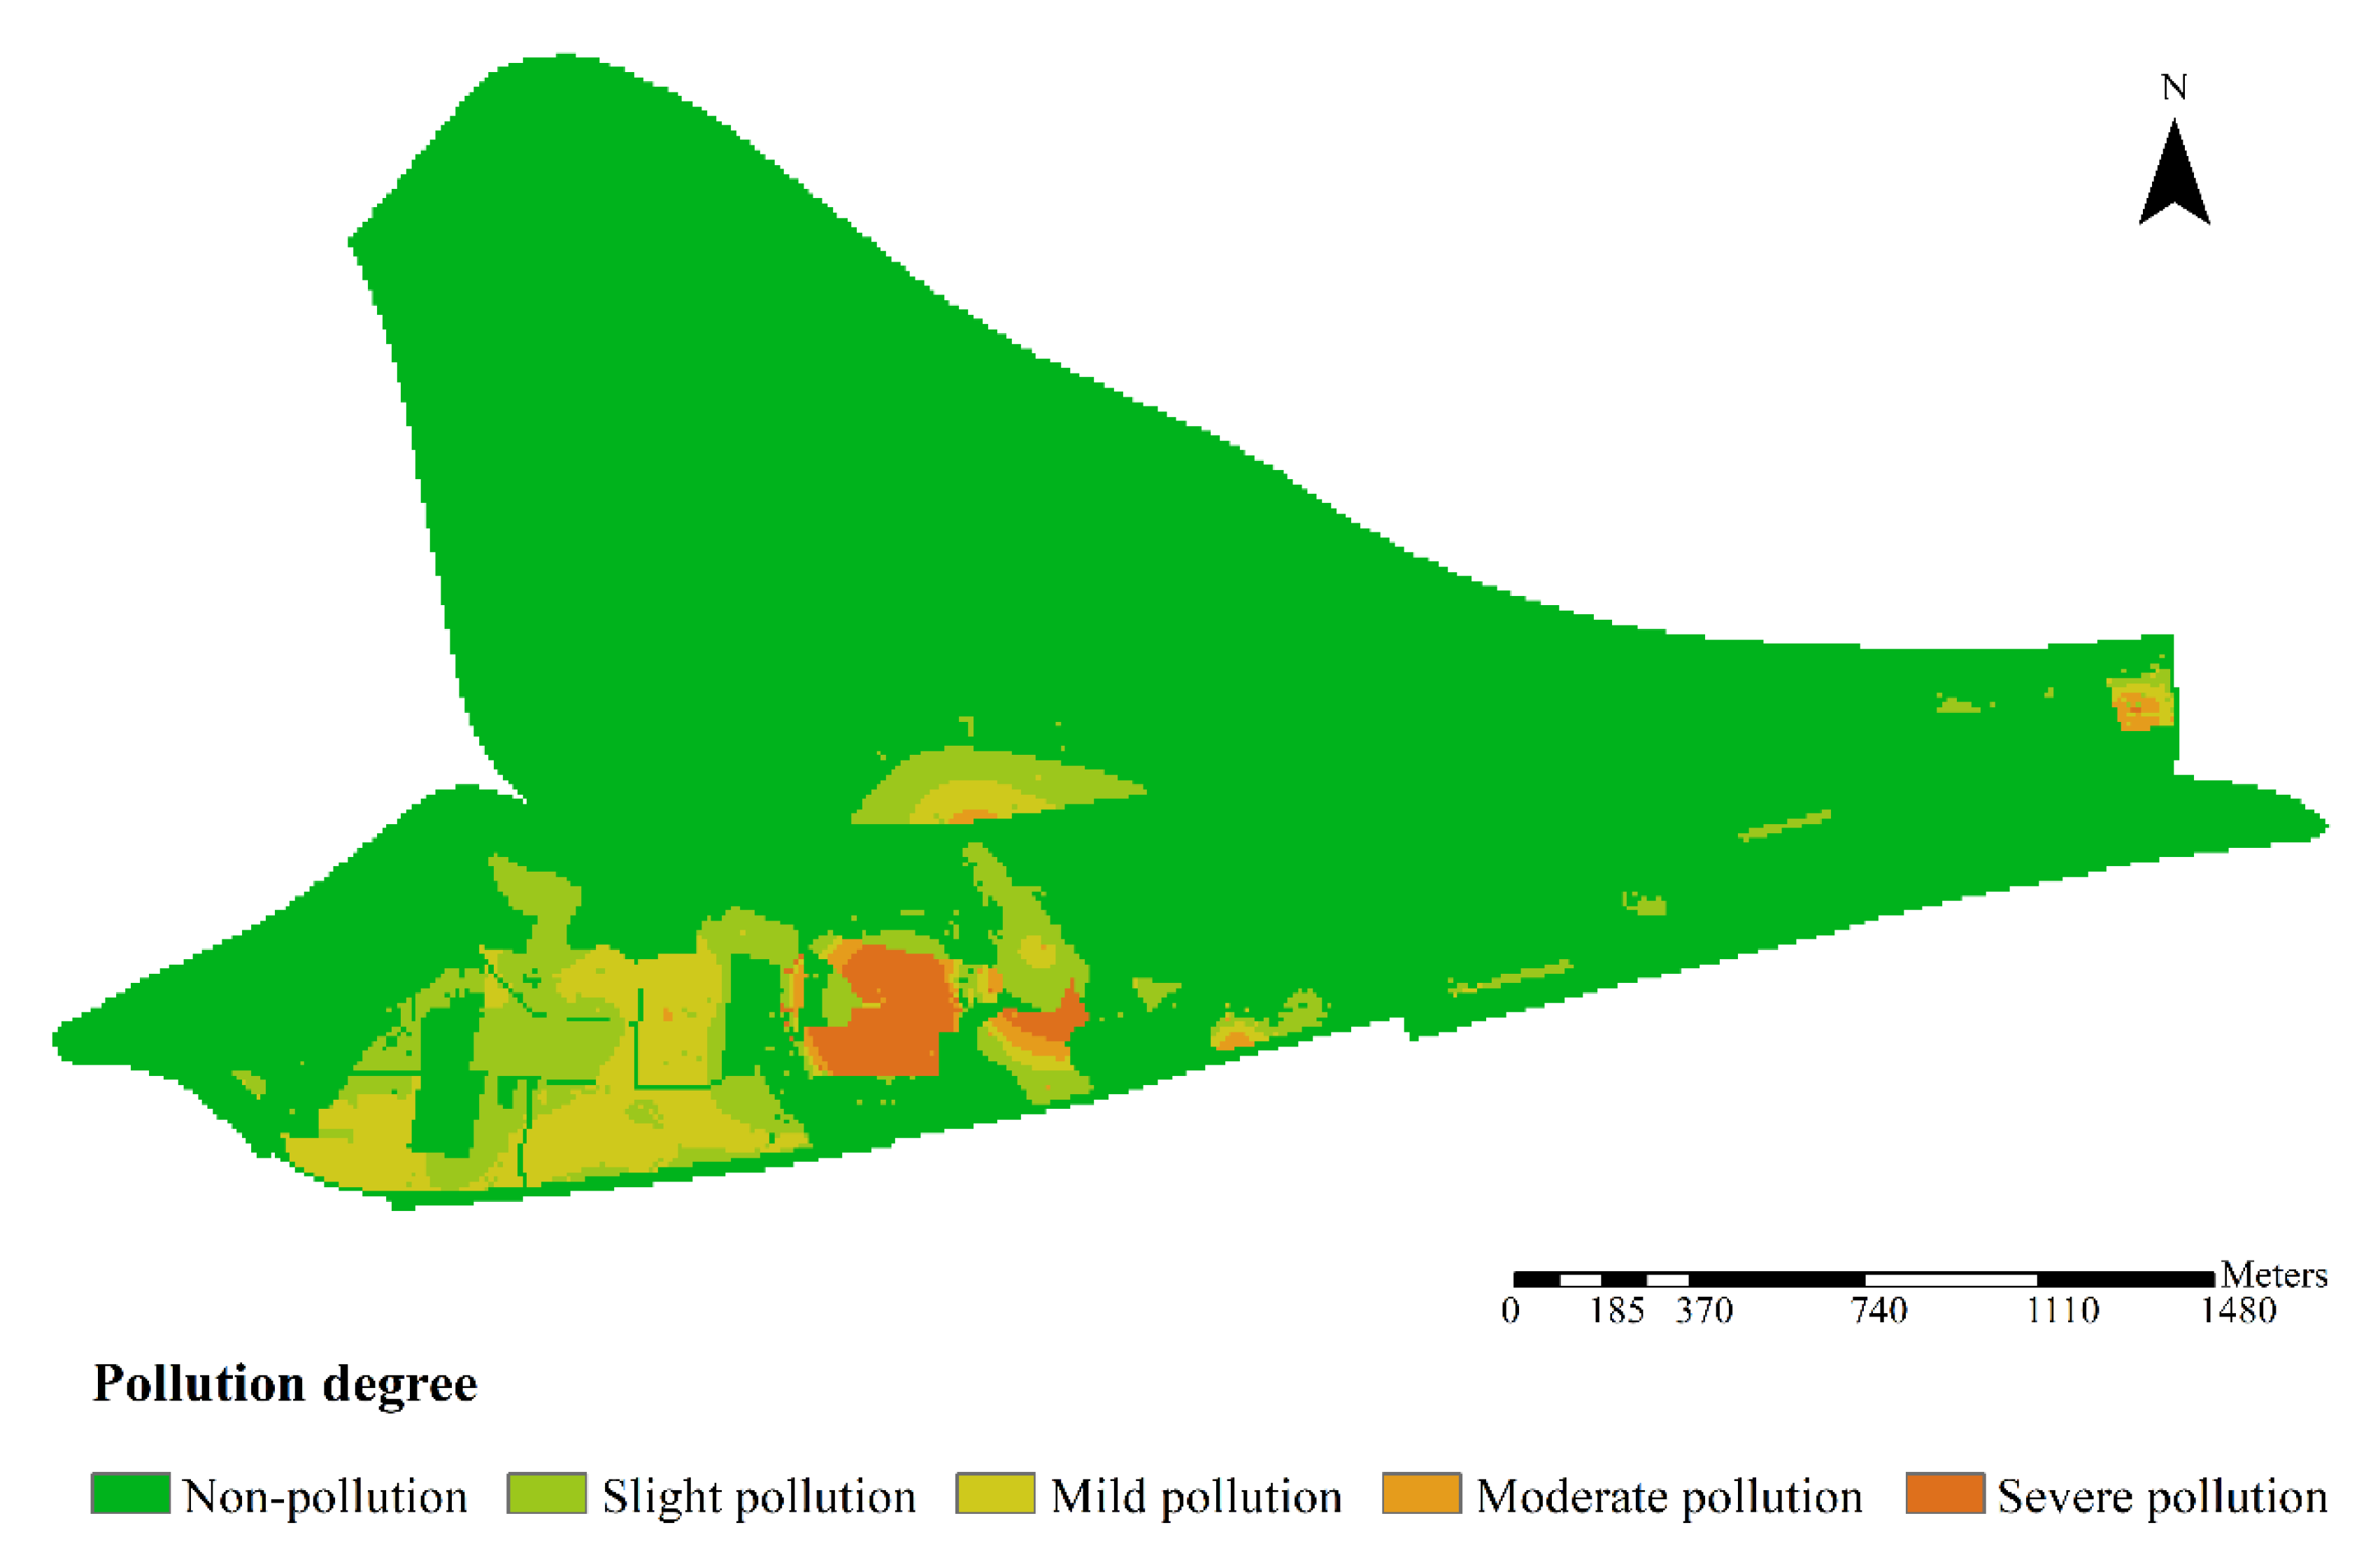
2.4. Evaluation of PTE Pollution
The single-factor pollution index (SPI) [
32] was used to evaluate the degree of soil PTE pollution in the study area. The SPI describes the relationship between the measured value and the standard value, which is suitable for the evaluation of different types of pollution. The calculation formula is as follows:
where
is the single-factor pollution index,
(mg/kg) is the measured value, and
(mg/kg) is the reference standard value. The SPI can be divided into five levels (
Table 2). When the
value is less than 1, it indicates no pollution; when the
value is greater than 1, it indicates that the measured value exceeds the standard reference value and there is an over-standard situation. The over-standard part is divided into slight pollution, mild pollution, moderate pollution, and severe pollution.
2.5. Data Processing
Pearson’s correlation analyses and normal distribution tests for the PTE content in the soil samples were implemented in MATLAB R2020A, and the spatial distribution feature map of PTE pollution was plotted in ArcGIS 10.6.
The PTE pollution assessment references the Chinese Soil Environmental Quality Risk Control Standard for Soil Contamination of Agricultural Land [
33] and Soil Environmental Quality Risk Control Standard for Soil Contamination of Development Land [
34].
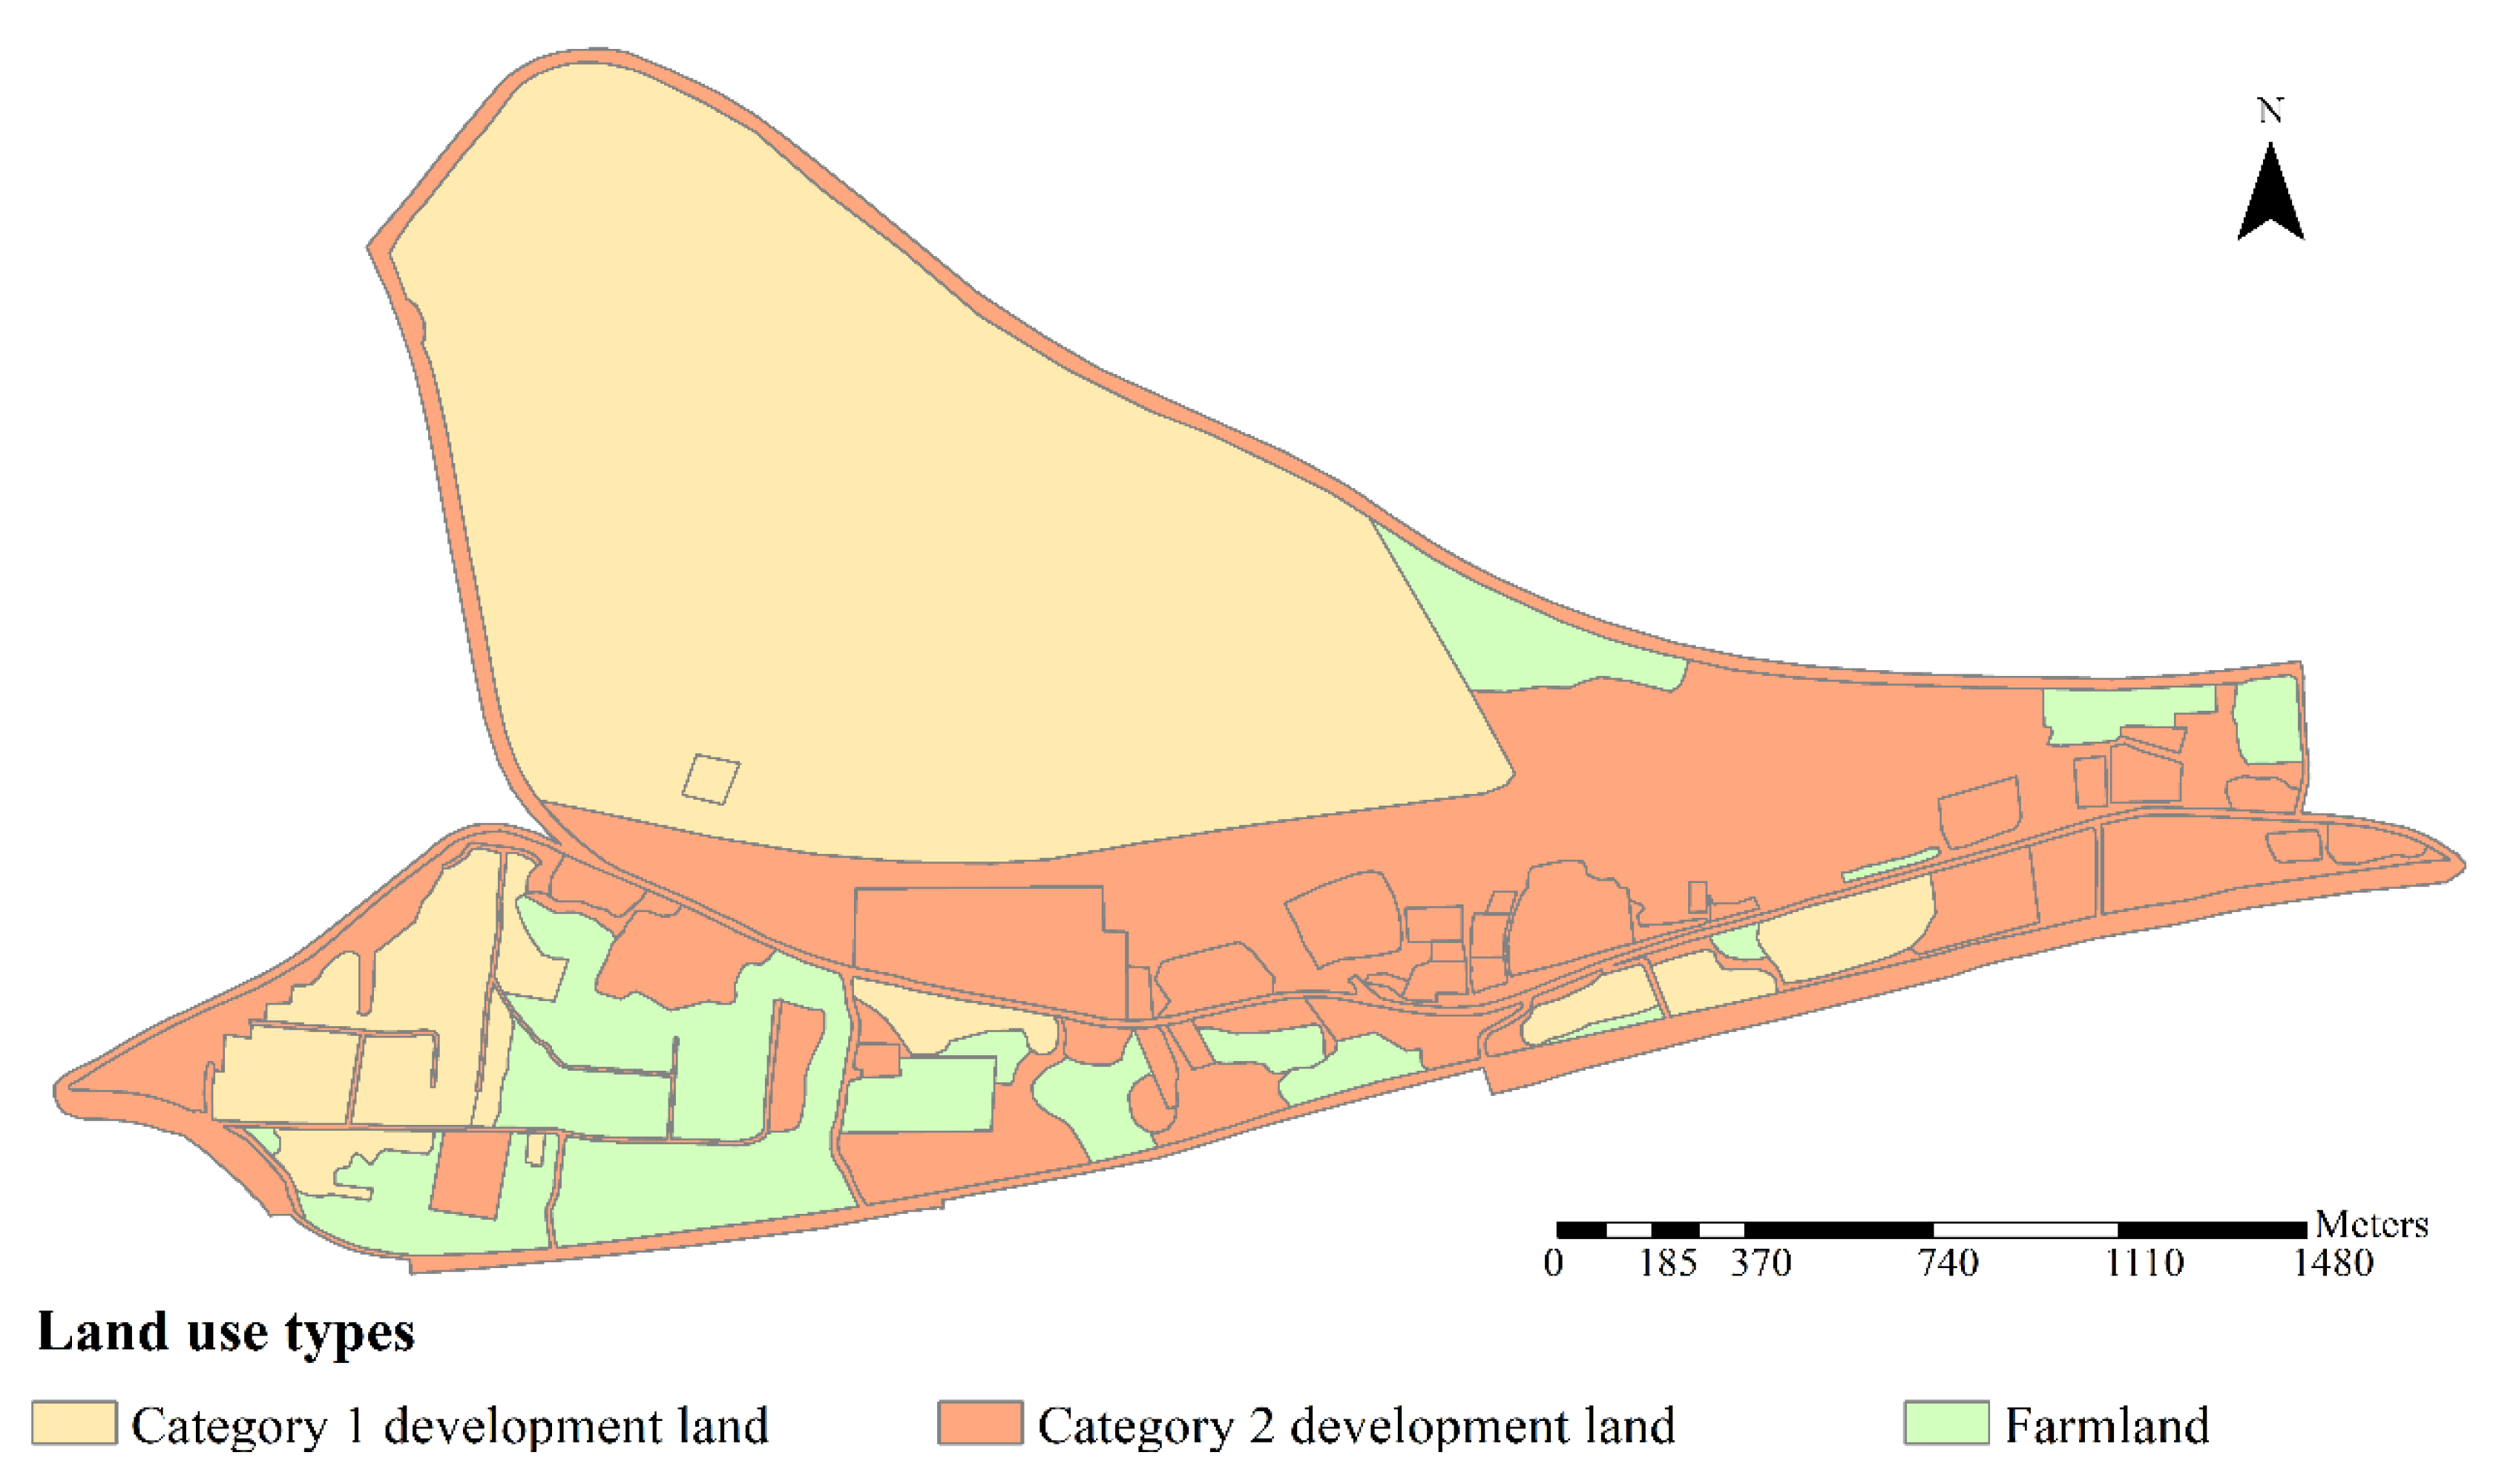
Table 3 and
Table 4 show the filter and control values of the PTE pollution risk for farmlands and development lands, respectively. The urban development lands, residential lands, primary and secondary school lands in public management and public service areas, lands for medical and healthcare facilities, lands for social welfare facilities, and lands for community or children’s parks in green spaces belong to category 1 development land. Industrial lands, lands for logistics and storage, lands for commercial service facilities, lands for roads and transportation facilities, lands for public facilities, lands for public management and services (except lands for primary and secondary schools, lands for medical and healthcare facilities, and lands for social welfare facilities), and lands for green spaces and squares (except lands for community and children’s parks) belong to category 2 development land.
4. Discussion
4.1. Analysis of Sources of PTE Pollution in Soil
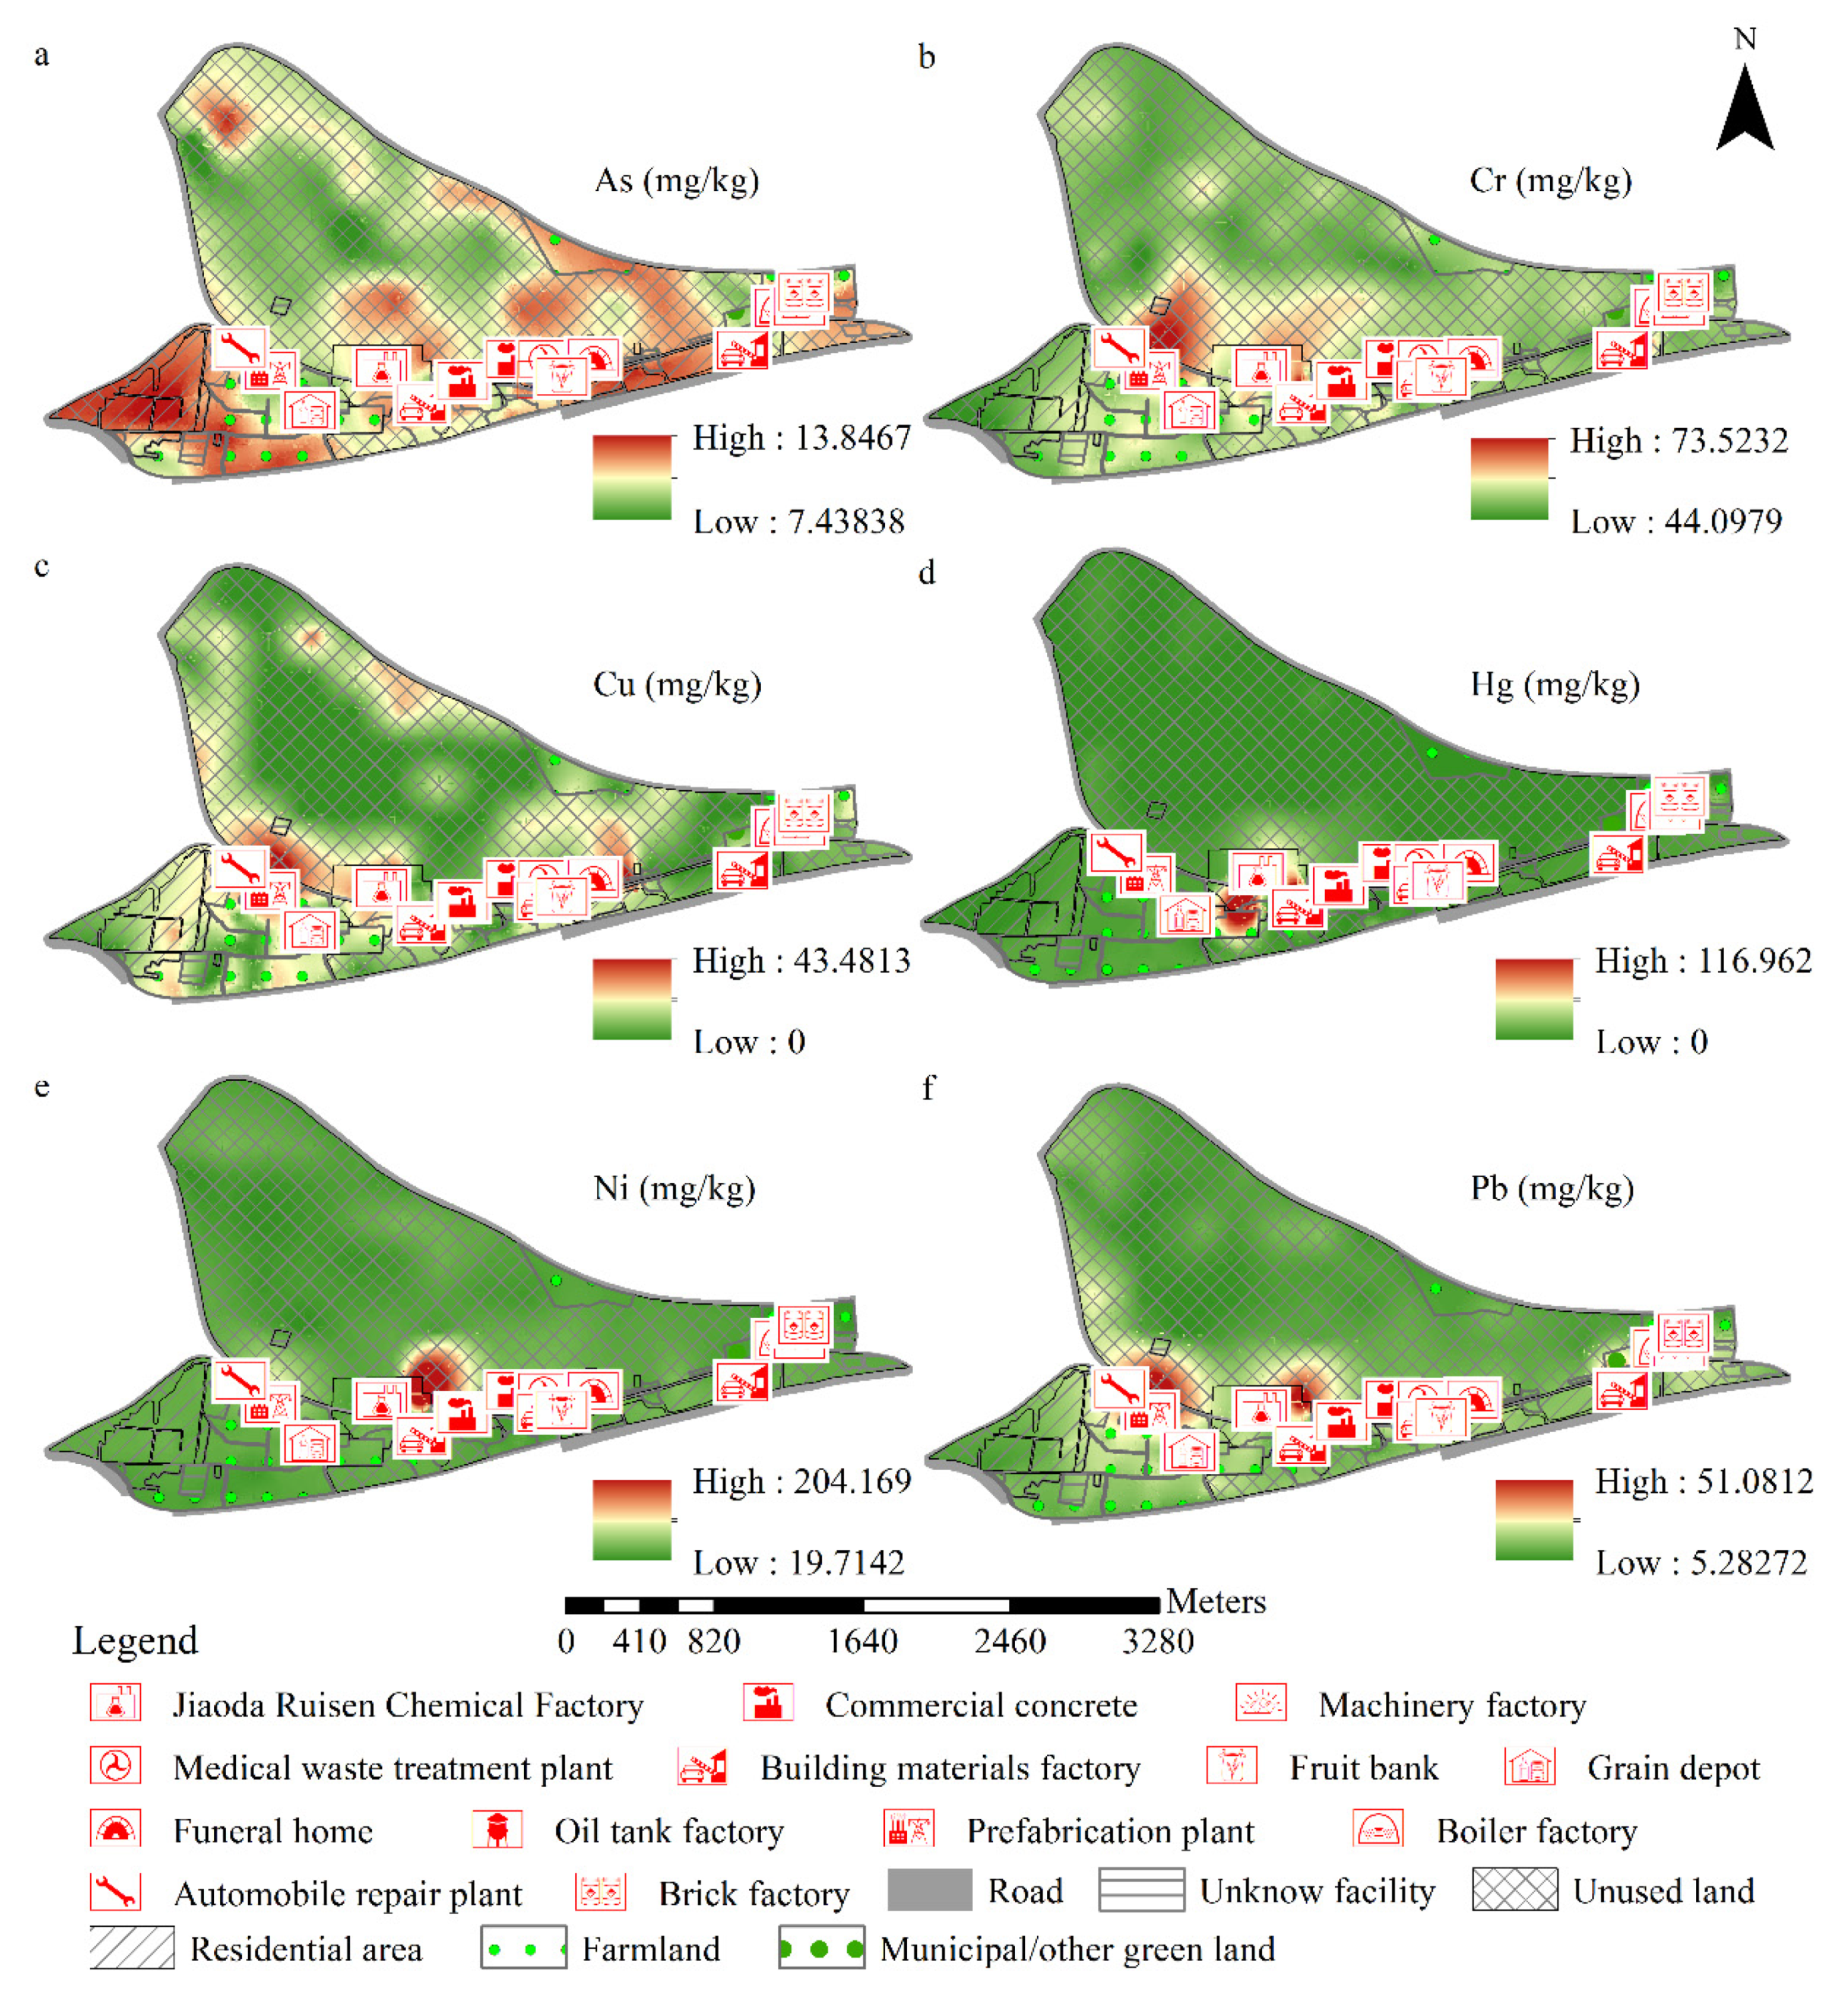
The content of As was relatively high around the transportation corridors, farmlands, and residential areas, indicating that the distribution of As may be affected by human activities and that it gathered in areas where intensive human activities occur. In these areas, the increase in soil arsenic content may be due to the use of arsenic-containing pesticides. A possible explanation for the low As content in the northern part of the study area might be that some of the surface soil was removed and the lower layer of soil was exposed due to the construction of ecological parks in the original unused land. In general, the As mainly came from the weathering of parent materials in the soil, and was less affected by human activities.
The risk control standard for soil contamination in development land did not stipulate the total Cr content, and so it was impossible to determine whether the Cr content in the development land exceeded the standard. The field investigation showed that the building material factories and prefabrication factories in the study area were mainly engaged in the production of cement concrete, floor slabs, and curbstones. The concrete production process did not involve chromium-containing raw materials, but the concrete precast slabs produced by the building material factories and prefabrication factories were filled with bars made of stainless steel, whose Cr content was usually between 15% and 30%. The Cr in the soil may have come from the debris generated by the factory during the cutting of steel bars or from the Cr-containing debris generated by the wear of stainless-steel equipment used in industrial production, which enters the soil, increases the Cr content in the soil, and spreads to lower altitudes with rainfall.
The high Cu content around the prefabrication plant and the auto-repair plant could have been caused by the use of Cu-containing materials or the loss of equipment during production or facility use. Cu-containing pesticides have good control effects on common fungal and bacterial diseases and are widely used in production. The Cu-containing agents commonly used in agriculture, such as the ‘Bordeaux mixture’, can also increase the content of Cu in soil. Due to the excavation and removal of the topsoil in the ecological park, the unused land in the eastern part of the study area, and some farmland, the lower layer of soil was exposed, so the Cu content in the soil samples collected was low.
According to the field survey, the source of Hg in the soil around the Jiaoda Ruisen chemical industrial plant may have been pollutants that leaked from the plant. The Hg in the soil in the residential land, the farmland, and the unused land to the southwest of the chemical plant may have been caused by the effects of wind transport and precipitation diffusion of pollutants from the chemical plant. Due to the sewage discharged from chemical plants, agricultural irrigation water entering farmland in the irrigation process will also cause Hg pollution. In addition, the use of Hg-containing agricultural agents, such as ethyl mercuric chloride and phenylmercuric acetate, can also lead to an increase in the Hg content in agricultural land.
The Ni content in the soil to the northeast of the Jiaoda Ruisen chemical industrial plant was relatively high. The source of Ni may have been the stainless-steel containers that can be corroded by reagents or waste liquid in production. The Ni in stainless steel can be discharged into a sewage tank with waste liquid and leak into the surroundings, which may increase the Ni content in soil.
The higher Pb content in the soil at the Jiaoda Ruisen chemical plant may have been due to the production process or facility wear. The increased Pb concentration in the soil at the prefabrication plant and the automobile repair plants may have been due to the impact of fossil fuel burning, where particles settle on the surrounding soil. In the eastern part of the study area, the Pb concentration in the farmlands and municipal land or other green lands was higher than that in the surrounding area, and this was possibly due to agricultural activities using Pb-containing agricultural agents, such as Pb arsenate insecticides. The Pb concentration near the G310 national road and the G30 Jing-kun highway was high, and was possibly caused by exhaust particles from gases containing traces of Pb or particles of vehicle abrasion alongside the roads [
36].
4.2. Soil PTE Pollution Control Measures
The urban fringe is being assimilated by cities, and industries with a large area and serious pollution emissions are moving to the urban fringe. Coupled with the low capacity for pollution control and the scattered distribution of local township enterprises, as well as the multiple pressures on agriculture and transportation, a large number of pollutants accumulate and diffuse in the soil, which leads to the PTE content being significantly increased and the quality of soil in the urban fringe being significantly decreased, which poses a serious threat to the regional ecological environment and to human health [
37]. In view of the current distribution characteristics and pollution status of PTEs in the soil, combined with the local daily living activities and production methods that were identified during field visits, the following measures are put forward for the prevention and control of PTE pollution of the soil in the study area.
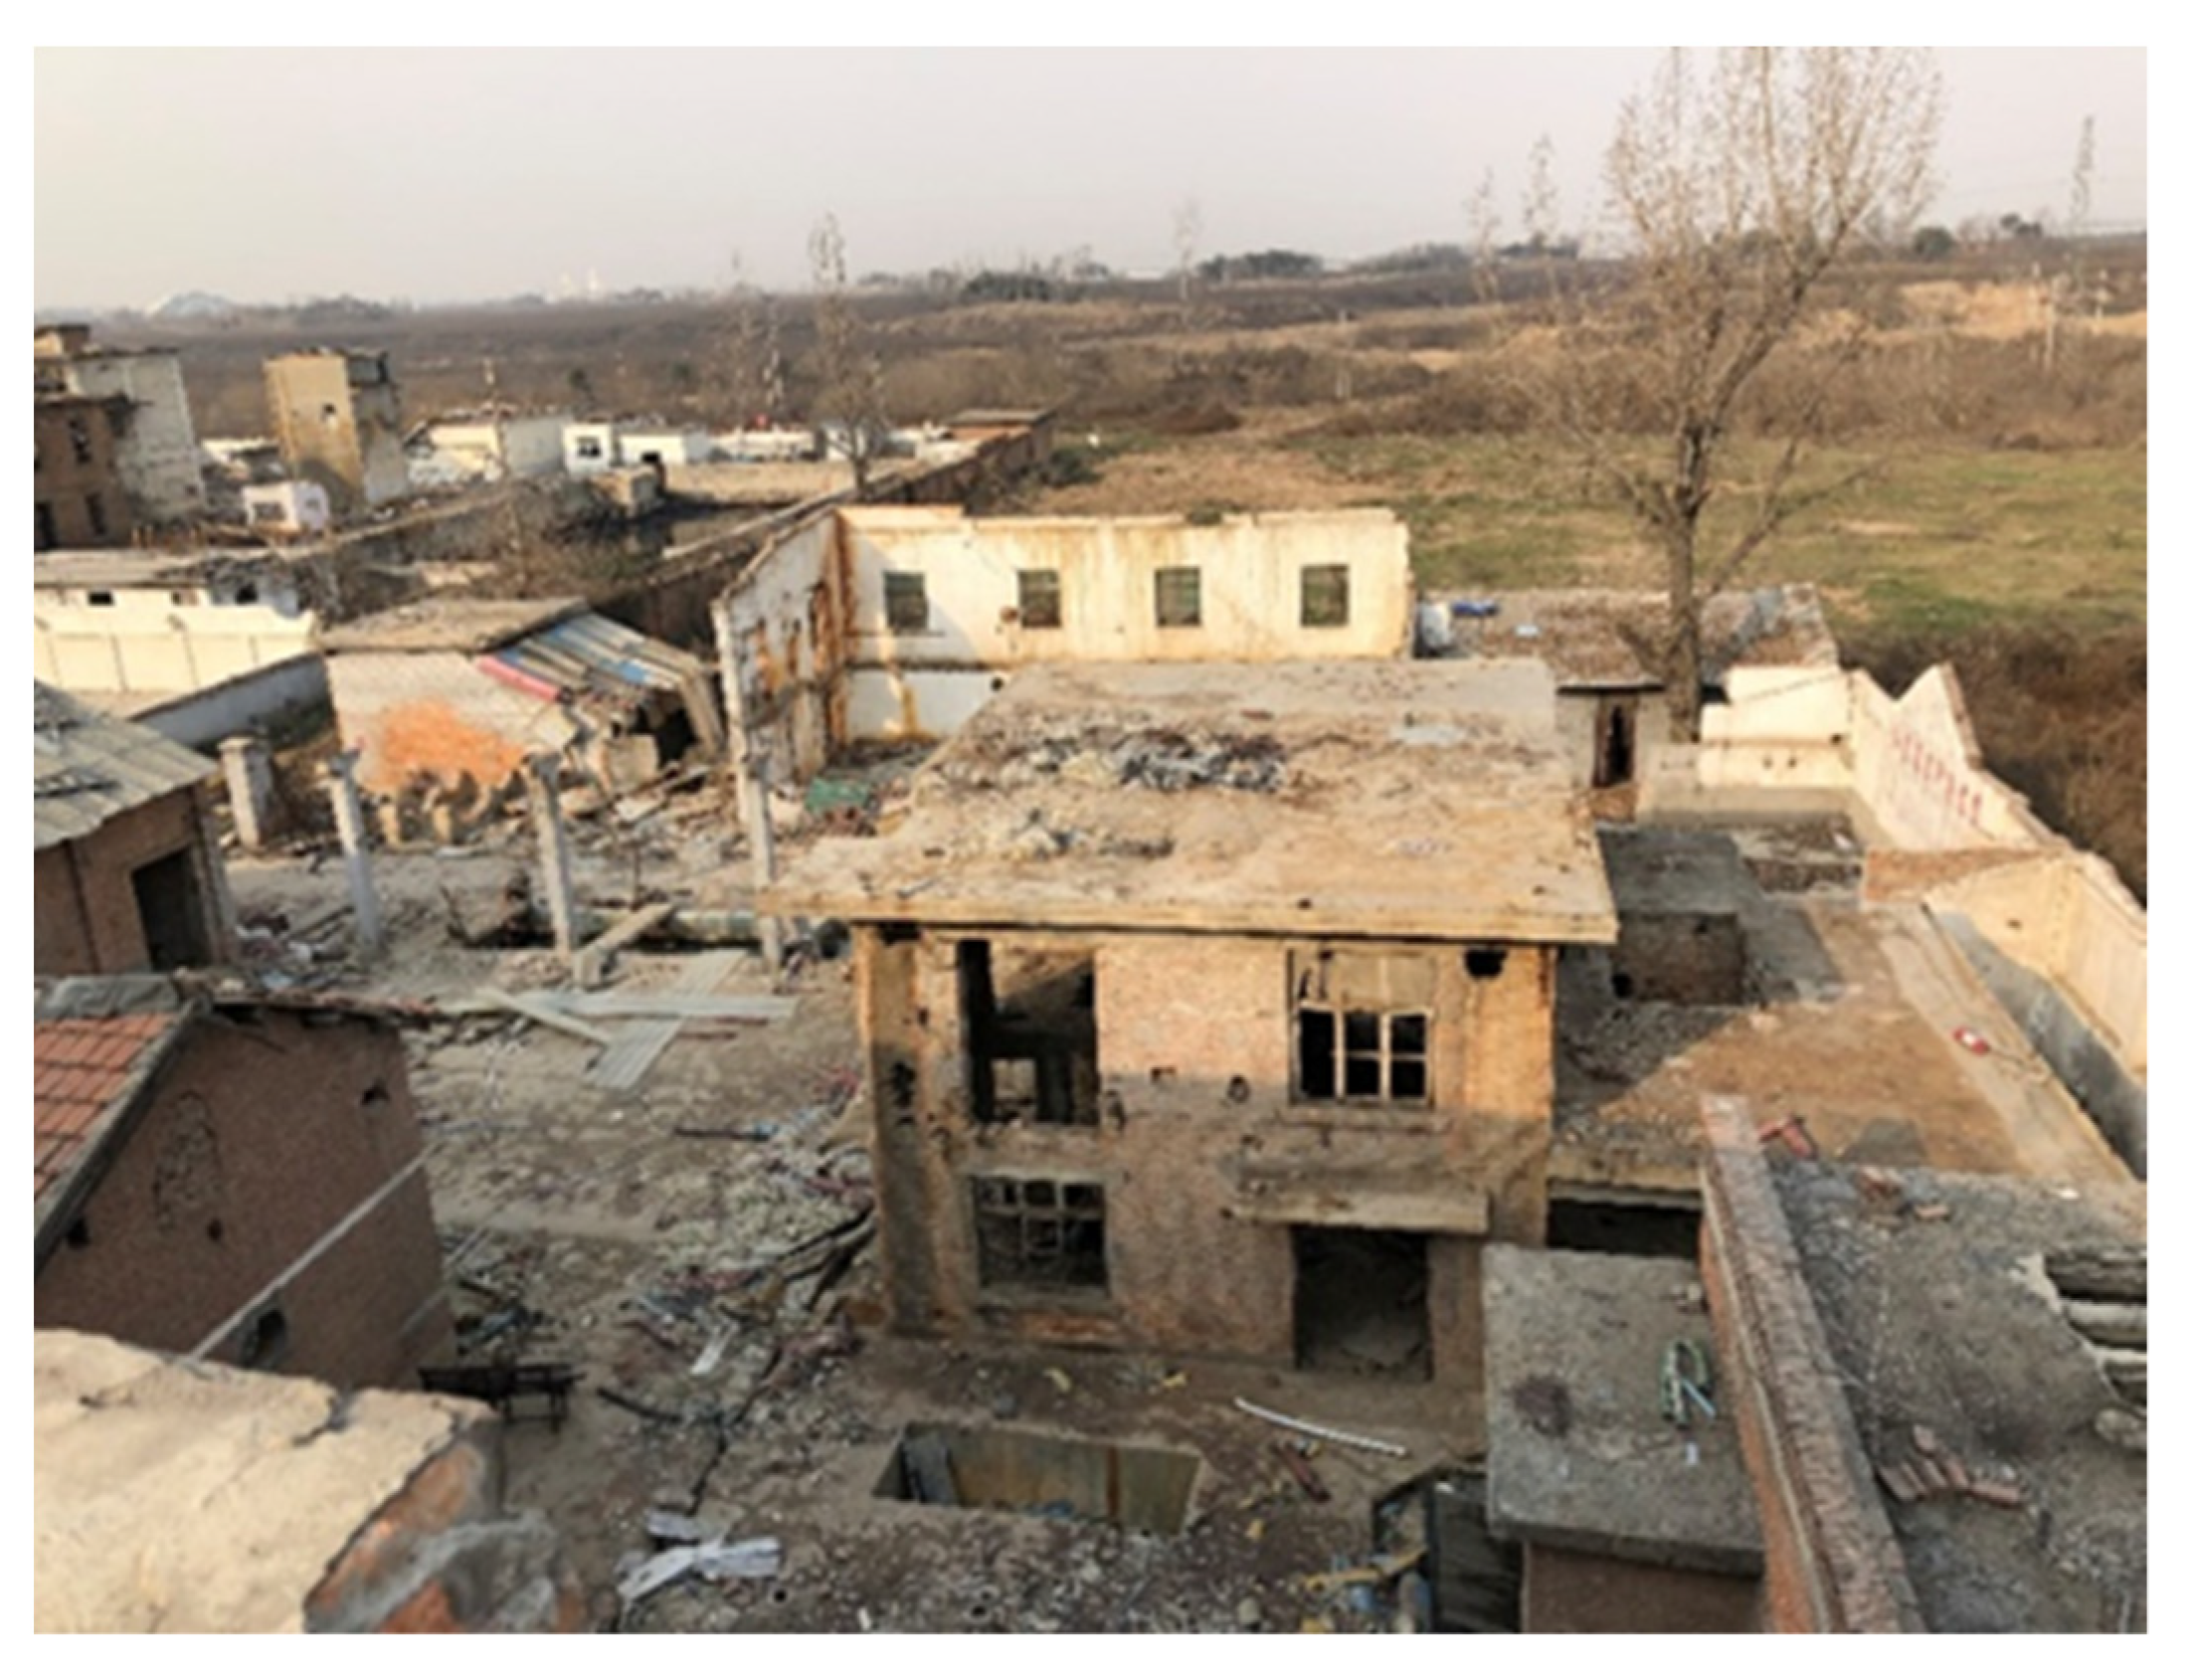
(1) Strengthen the pollution monitoring of industrial facilities, improve the production process, reduce the amount of “Three Wastes” (industrial wastewater, waste gases, and waste residues) emissions, and cut off sources of PTE pollution. Industrial production is an important source of soil PTE pollution [
8,
36,
37]. Industrial facilities, especially chemical plants, should strictly control the discharge of pollutants in the production process, closely monitor the discharge system in the plant area, and prevent the leakage or seepage of pollutants. Through field investigations, it was found that the Jiaoda Ruisen chemical plant has been demolished (
Figure 7), but there remains serious pollution in the surrounding soil, which is worthy of attention and vigilance. Enterprises with the possibility of pollution in the production process should also clean facilities, containers, and sewage tanks of residual reagents or raw materials at the time of demolition in order to avoid the uncontrolled leakage and migration of pollutants to the surrounding soil.
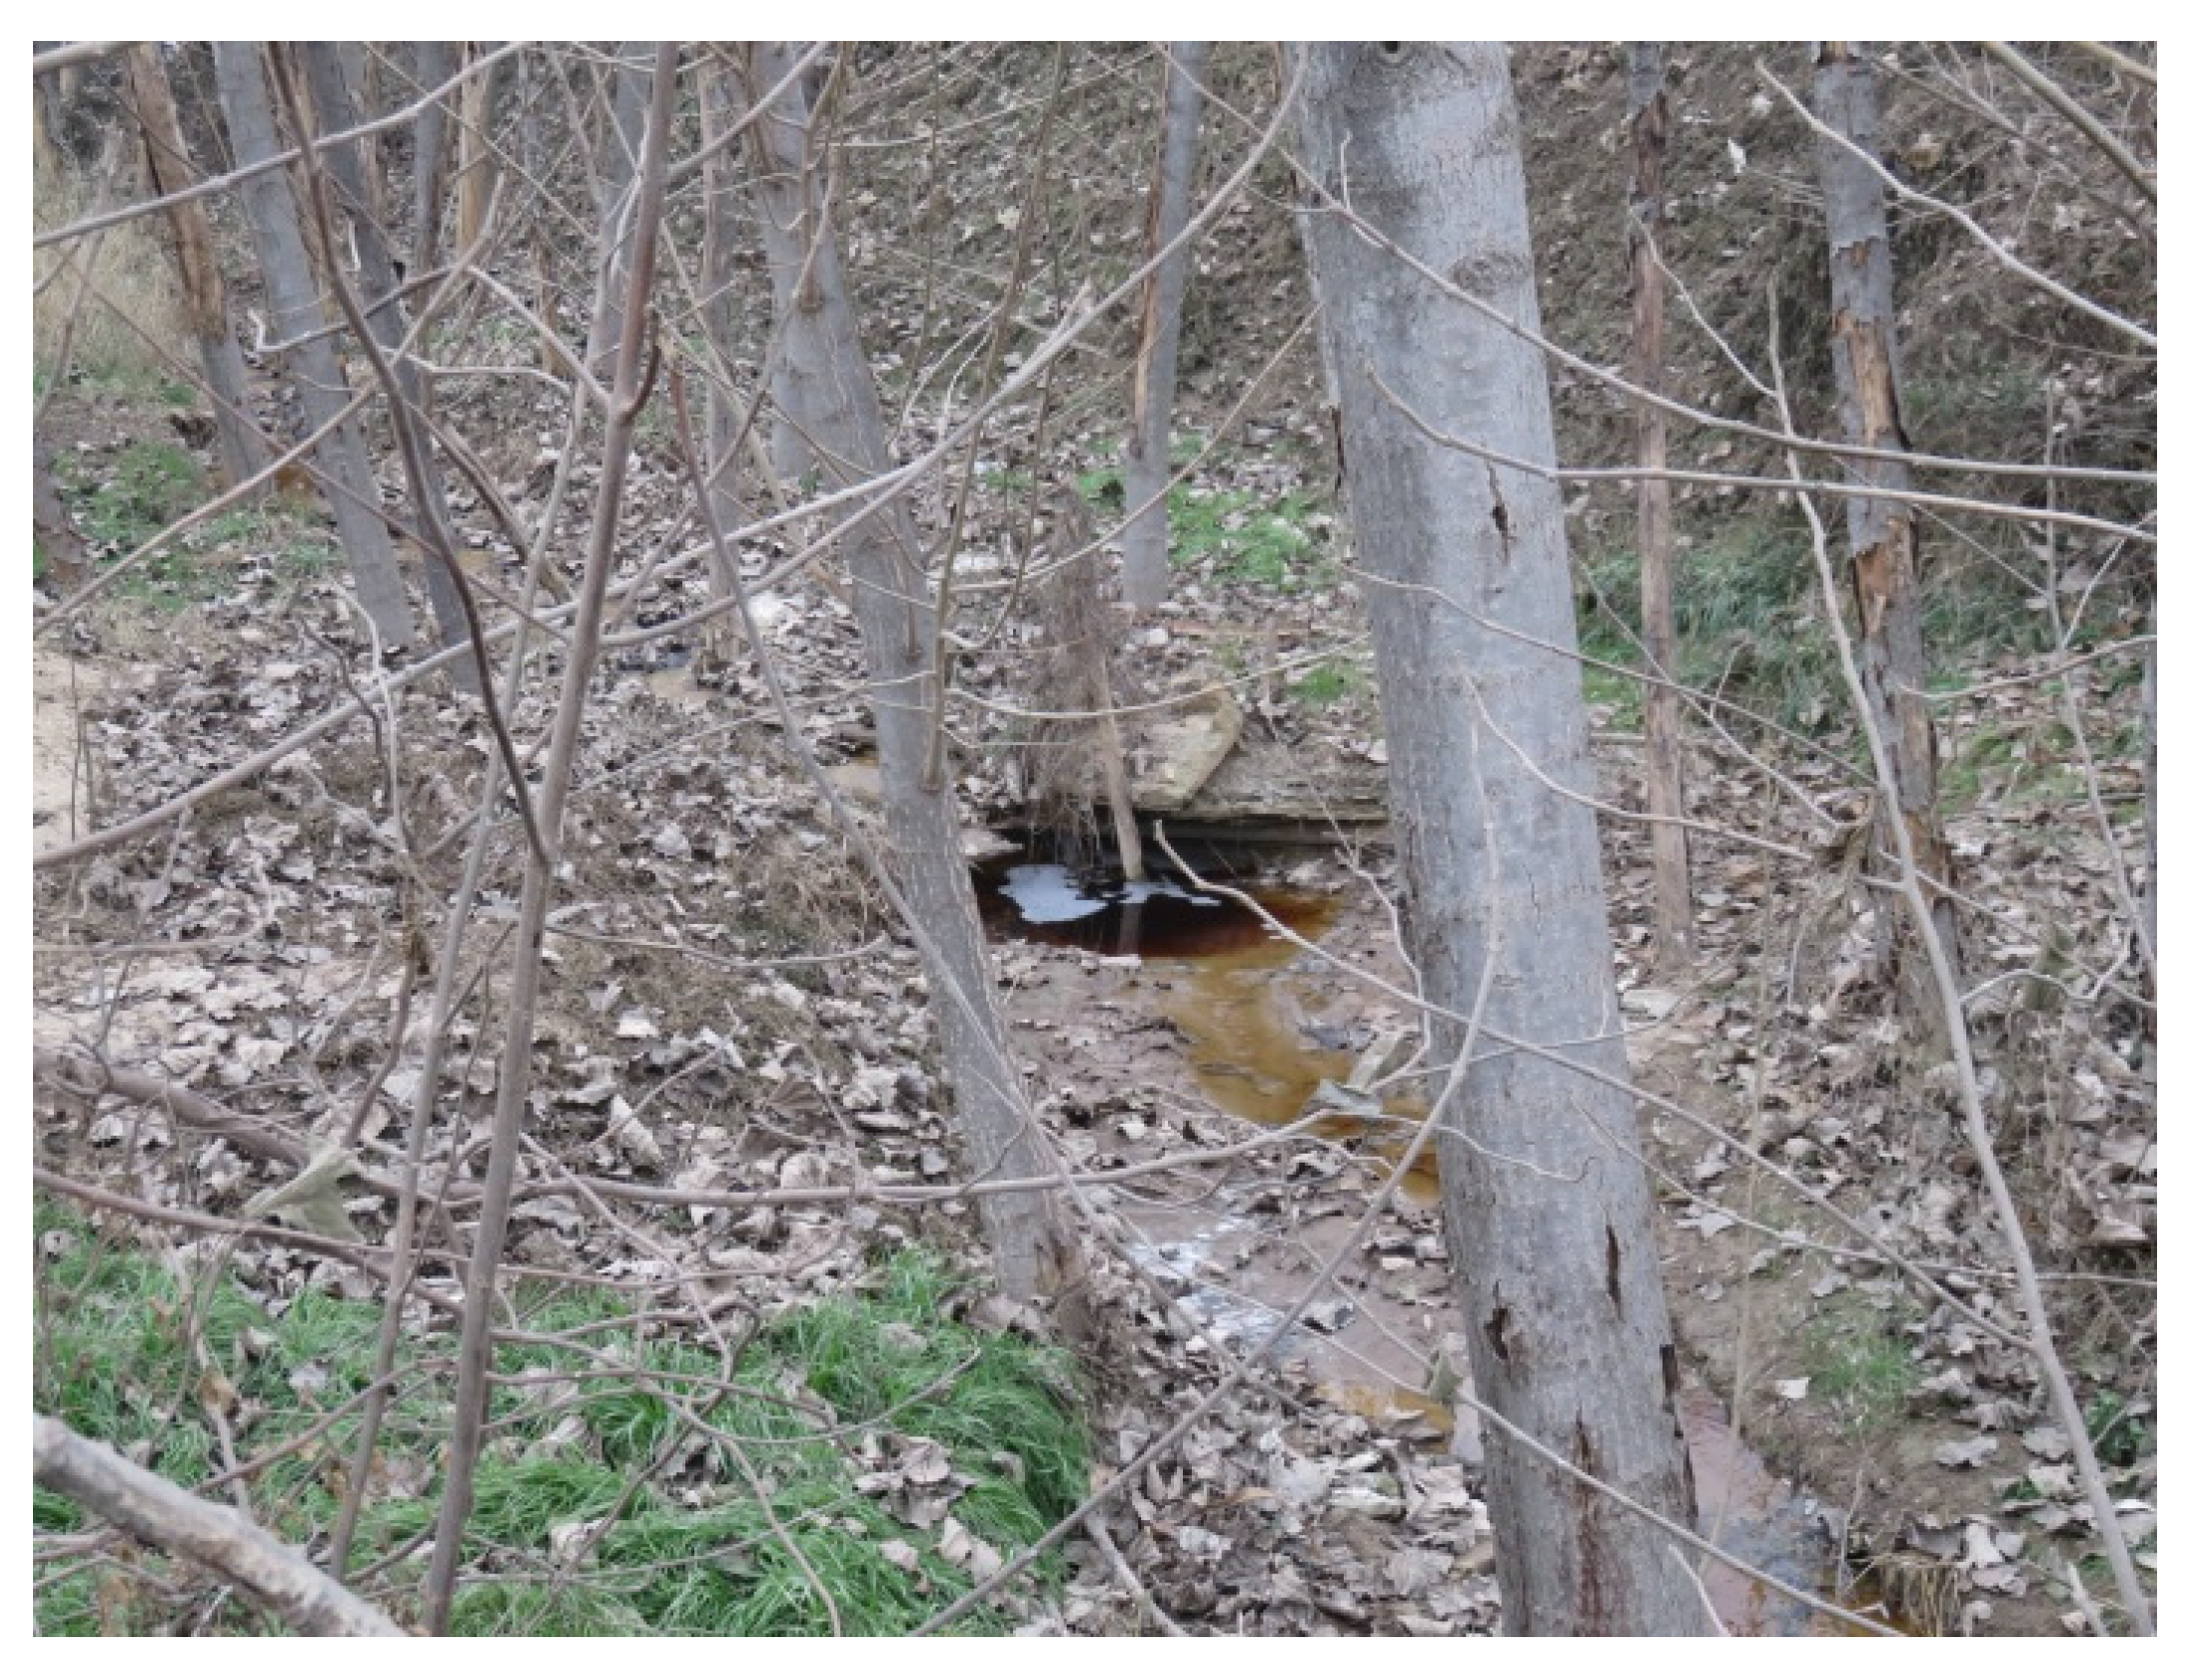
(2) Standardize agricultural production and ensure food security. PTE pollution in farmland will directly affect food security, and polluted irrigation water will increase the PTE content in farmland soil and crops [
38,
39,
40]. A clean water source will guarantee the safety of agricultural production. While controlling the pollutant discharge of industrial facilities, it is also necessary to avoid the pollution of irrigation water caused by industrial sewage entering sources of water used in agricultural production through migration to the soil or other means. The field survey results show that some irrigation canals were used to discharge sewage (
Figure 8). Therefore, standard irrigation canals should be built, and a reasonable distance should be maintained between the canals and industrial facilities in order to prevent the pollution of irrigation water sources. Additionally, the unreasonable use of pesticides and fertilizers will cause an increase in PTE content in the soil [
41]. Thus, the government should educate farmers and strengthen the supervision of pesticide use. It is vital to reduce the pollution due to agricultural production by scientifically reducing the use of pesticides and fertilizers.
(3) Scientifically plan land use to reduce the spread of pollution. In the process of urban development in China, the historical problems left by the industrial layout have caused great pressure on the environment; for instance, some polluting enterprises have been set up in densely populated cities or suburbs [
42]. In recent years, with the rapid development of the Chinese automobile industry, the number of car owners has reached 250 million [
43]. The compounds produced by automobiles are the main sources of pollution of the urban atmosphere as well as the main source of PTE pollution in the soil on both sides of the highway [
44,
45]. Some industrial facilities and large transport arteries in the study area were close to agricultural land. PTEs can easily be spread to the surrounding farmlands through dust or rainwater transporting them, resulting in the pollution of soil and crops in farmland. In future urban planning, industrial facilities and large transport arteries should be separated from residential and agricultural land. In addition, the question of whether the soil quality, after the adjustment of different land types, meets the national standards should be considered during planning. For example, in this study, if Category 2 development land is adjusted to Category 1 development land, the Ni content may exceed the standard.
4.3. Soil PTE Pollution Remediation Measures
A safe soil environment is the basis of high-quality development of urbanization. Before the secondary development and utilization of contaminated land, it must be fully restored and treated in order to prevent toxic soil from becoming a potential and lasting environmental hazard. Control measures for PTE pollution in soil include physical measures [
46,
47], chemical measures [
48,
49], agricultural measures [
50,
51], biological measures [
52,
53], and remediation using a combination of several measures [
54]. According to the evaluation of the status of PTE pollution, it can be seen that there is serious Hg pollution in the study area. We propose the following remediation measures.
(1) With an area of about 0.04 km2, the Jiaoda Ruisen chemical plant and its surrounding areas were the areas with the most serious Hg pollution. The ground around the factory mainly consisted of bare soil without hardening and the soil texture was fine and sandy clay loam. Due to the fine soil texture and elevated terrain, a chemical leaching method is not suitable for pollution remediation. Therefore, a curing/stabilization method could be selected for remediation. Cement, asphalt, and other materials could be used to bind the topsoil around chemical plants for in situ solidification/stabilization in order to reduce the PTE content in the topsoil and to reduce or avoid the diffusion of pollutants caused by wind blowing dust and precipitation scouring. In addition, to avoid potential health hazards, such high-risk sites should be adjusted to non-sensitive construction lands, such as urban landscapes, municipal facilities, and commercial services.
(2) Contaminated farmland can be renovated by the method of soil replacement and phytoremediation. In the Shentongchuan watershed in Fushan County, Japan, Cd pollution in farmland was controlled by moving it into a soil layer with a thickness of greater than 15 cm using the soil replacement method [
55]. In this study, the area of contaminated farmland was about 0.39 km
2 in size. If a 15-cm-thick layer of improved soil was imported from elsewhere, about 58,116 m
3 of soil would be needed. This method has a high economic cost but can quickly and directly solve the impact of pollution on topsoil. Compared with the soil replacement method, phytoremediation cannot rapidly reduce the Hg content in topsoil, but it is cheap and can provide economic income to farmers. The results of Long et al.’s study [
56] showed that
Boehmeria nivea (L.) Gaudich. is a soil remediation crop, the annual purification rate of Hg in soil was as high as 41%, and the rate of soil self-remediation was 8.5 times higher than that when a food crop was planted. Since the accumulation of PTEs in
Boehmeria nivea (L.) Gaudich. is mainly concentrated in the roots, the Cd content in the products of processed ramie stems obtained from this crop is extremely low, so they can be sold as normal products [
57].
Boehmeria nivea (L.) Gaudich. is widely distributed in China. The study area has the climatic and soil conditions to plant
Boehmeria nivea (L.) Gaudich and a history of planting this crop. Therefore, it is feasible to use
Boehmeria nivea (L.) Gaudich to repair Hg-contaminated farmland soil in the study area.
(3) The study area is close to a traffic artery, and the results show that there was possibly Pb pollution in the study area. Some plants not only have a PTE enrichment capacity, but can also increase land cover, reduce the amount of dust, purify the air, and beautify urban landscapes [
58]. Therefore, planting hyperaccumulators of Pb on both sides of the roads and around enterprises that produce a high Pb concentration in the soil in the study area may be a useful measure to reduce and prevent Pb pollution.
5. Conclusions
In the process of urbanization, due to the broad range of land use changes and the distribution of small and medium-sized enterprises, the environment is strongly affected by human activities and there is a potential risk of PTE pollution in the soil. Through a field investigation and the collection of surface soil samples, this study analyzed the distribution of enterprises, land uses, and soil PTE pollution in Weidong New District in Weinan City, Shaanxi Province, China, and discussed the prevention and remediation measures suitable for local soil PTE pollution. The results show that the As, Pb, Cr, Cu, and Ni contents in the study area did not exceed the national soil environmental quality standards. PTE pollution is more likely to occur around factories, and the type of PTE pollution depends on the products the factory produces and the process flows. The areas of slight, mild, moderate, and severe Hg-contaminated land in the study area accounted for 6.89%, 4.14%, 0.96%, and 2% of the total area, respectively. The Hg pollution mainly came from the Jiaoda Ruisen chemical plant. The contents of Cr, Ni, and Pb in the soil around the chemical plant were significantly higher than those in other areas. A total of 77.3% of the PTEs in farmland soils exceeded the standard, and the main cause was the diffusion of pollutants and irregular agricultural production activities.
For places where the PTE pollution exceeded the standard, (1) the chemical plants and surrounding soils could be repaired by a solidification/stabilization method to reduce the diffusion of pollutants, and the land use type could be adjusted to non-sensitive construction land; (2) contaminated agricultural land could be repaired by the soil method and the planting method, choosing Boehmeria nivea (L.) Gaudich as the soil remediation plant; and (3) the planting of hyperaccumulative plants with landscape effects around roads and production enterprises could prevent the excessive accumulation of PTEs in the soil.
For places where potential PTE pollution risks exist, in order to improve the soil pollution situation in the study area, the following objectives should be achieved: (1) industrial facilities should exercise strict control over the discharge of pollutants and reduce pollution sources; (2) agricultural production activities should be standardized, agricultural water should be clean, and pesticide and fertilizer use should be reduced; and (3) the government should pay attention to the rationality of a land type adjustment in land use planning in order to reduce the impact of pollution on human beings.


 ,
, 


