
Landscape Pattern and Ecological Network Structure in Urban Green Space Planning: A Case Study of Fuzhou City

1
College of Arts, College of Landscape Architecture, Fujian Agriculture and Forestry University, Fuzhou 350118, China
2
Graduate School of Design, National Yunlin University of Science and Technology, Yunlin 64002, Taiwan
3
College of Architecture and Urban Planning, Fujian University of Technology, Fuzhou 350118, China
*
Author to whom correspondence should be addressed.
Land 2021, 10(8), 769; https://0-doi-org.brum.beds.ac.uk/10.3390/land10080769
Submission received: 1 June 2021
/
Revised: 29 June 2021
/
Accepted: 19 July 2021
/
Published: 22 July 2021
(This article belongs to the Special Issue Human-Urban Green Space Interactions and Their Integration into Urban and Green Space Planning and Management)
Abstract
:During the process of urbanization, many green spaces are fragmented for other uses. The key problems for researchers and planners are reducing the fragmentation of green spaces, constructing urban ecological networks, and maintaining sustainable environments to cope with the rapid urbanization process. This paper analyzes Fuzhou, China as a case study of the effects of urbanization, and reviews three epochs in Fuzhou: 2000, 2010, and 2021. First, the integration degree of landscape pattern index and spatial syntactic attribute value is used to quantify the urbanization situation of Fuzhou and the degree of green space fragmentation in the process of urbanization. Second, it adopts the network analysis method to construct an urban ecological network featuring “one city and two rings”. Finally, urban green spaces are assessed by the corridor structure analysis, and the improvement of the urban green space ecological network is quantitatively evaluated by comparing the green space ecological network with the green space planning system. The results show that the urbanization of Fuzhou city center is apparent and the fragmentation of urban green space is a serious issue from 2000 to 2021. The green space planning in Fuzhou is ineffective in improving the existing green space. According to the results, the street integration of space syntax aptly reflects the process of urbanization. In conclusion, the planned ecological network increases the shape complexity of green patches and landscape connectivity and reduces landscape fragmentation, thus improving the urban ecological environment quality and facilitating the sustainability of urban green spaces.
1. Introduction
Urbanization is a complex process that encompasses the urban population, the expansion of the urban scale, and a series of economic and social changes. Its essence is the change of the urban economic structure, social structure, and spatial structure [1,2,3]. In the process of urbanization and industrialization, the problems of landscape fragmentation and green space isolation are of particular concern, as these weaken the stability of the urban ecosystem. The problem of the urban ecological environment has thus gained wide attention and become the subject of much scientific research. For example, Erickson conducted a comparative study on the history and current situation of the green space ecological network in Milwaukee, WI, USA and Taihua, ON, Canada. The study shows that the park system is an important aspect of urban development, and a more conscious planning of green space ecological networks is an important part of regional planning of modern metropolises [4]. In addition, Gobster and Westphal adopted a qualitative approach by studying the public’s perception of the ecological corridor of the Chicago River. They found that the natural, artistic, clean, safe, developmental, and approachable elements have a direct impact on the public’s perception of green space ecological networks [5]. Asakawa et al. adopted a quantitative methodology that found that the vegetation types and the degree of protection on both sides of the river have great influence on the public perception [6]. Turner conducted a questionnaire survey on typical cases of green space ecological networks in Northern Ireland, Scotland, England, and Wales. The questionnaire asks about the definition of green space ecological networks, the current situation of green space ecological networks, and a local green space ecological network project [7,8]. Recognition of the importance of green space in urban ecosystems has led to considerable work on urban green space planning to improve the urban environment and enhance the quality of life [4,9].
In the process of rapid urbanization, green space enhances urban ecological safety and the inhabited environment. Research on urban green space systems is key to settling the problem of urban inhabited environments [10]. Green space ecological networks derive from the extended concept of urban green space systematism, networking, and greenway. Presently, the concept of green space ecological networks and the planning method is continually developing. It is widely applied and practiced in some developed countries [4,11]. There are obvious effects from the controlling of disorderly urban expansion. Namely, ecological networks can solve the problem of intensified and fragmented land use and safeguard the survival of the natural populations of species and threatened habitats [9]. Ecological green network planning mainly includes green spot node selection, ecological corridor construction, and ecological green network optimization. For the selection of green nodes, most researchers currently use green spaces that have been evaluated as having significant ecological value as ecological network nodes. Others choose key green spaces as network nodes through quantitative analysis of landscape connectivity [12,13,14,15,16]. Further improvement, however, is needed in judging the selected patches and the reasonable degree of potential for constructing corridors, as well as in optimizing the ecological green network [17,18,19]. As a result, the development of green space networks is increasingly considered a suitable approach to improve the ecological value of urban green space and the urban environment [20,21]. Moreover, various methods and principles of landscape ecology have been applied to green space ecological network planning, such as landscape pattern metrics and network analysis [22]. However, less attention has been paid to the method integrating landscape metrics with network analysis in the planning of urban green space ecological networks [23].
As the provincial capital of Fujian, Fuzhou City has seen rapid development in recent years, including greatly improved infrastructure, green space protection is ignored, which leads to the reduction and fragmentation of urban green space [24]. As a result, the protection and creation of urban green spaces under the background of rapid urbanization is a problem that must be urgently addressed by urban landscape planners in Fuzhou City. In order to solve this problem, most researchers have focused their research on the construction of ecological corridors and the optimization of the ecological green space network [25]. A group of scholars studying the urban and rural landscape planning in Nuoro, Italy, suggested an optimized ecological network for urban planning to meet the requirements of a good urban ecosystem [26]. They noted the important role of network models in protecting and improving species diversity, preventing landscape fragmentation, and establishing links between isolated ecological patches. The Maryland Department of Natural Resources uses the Green Infrastructure Network Assessment to plan large-scale, contiguous natural areas connected by ecological corridors, industrial reproduction, and migration. By identifying important ecological nodes and ecological corridors to inform the basic structure of planning, large-scale planning is translated into standards at the local scale to assist in the implementation of greenfield infrastructure at the local, state, and national scales [27]. However, assessments of urban green space fragmentation in past research lack convincing data because related data do not present the urbanization level of different regions. With the development of big data and more research studies, a new quantitative method, the integration of spatial attributes in the space syntax, is being applied to explore urbanization [28]. Although, in the ecological network planning of urban green spaces, researchers have rarely combined landscape scale with network analysis [29], thus, this study combined network analysis and the landscape pattern index to evaluate and optimize city green space systems. The main purpose of this study is to analyze the degree of urbanization and fragmentation of urban green space in Fuzhou, to construct an urban green space ecological network for it, and to evaluate whether the network will improve the quality of urban green space.
2. Materials and Methods
2.1. Study Area
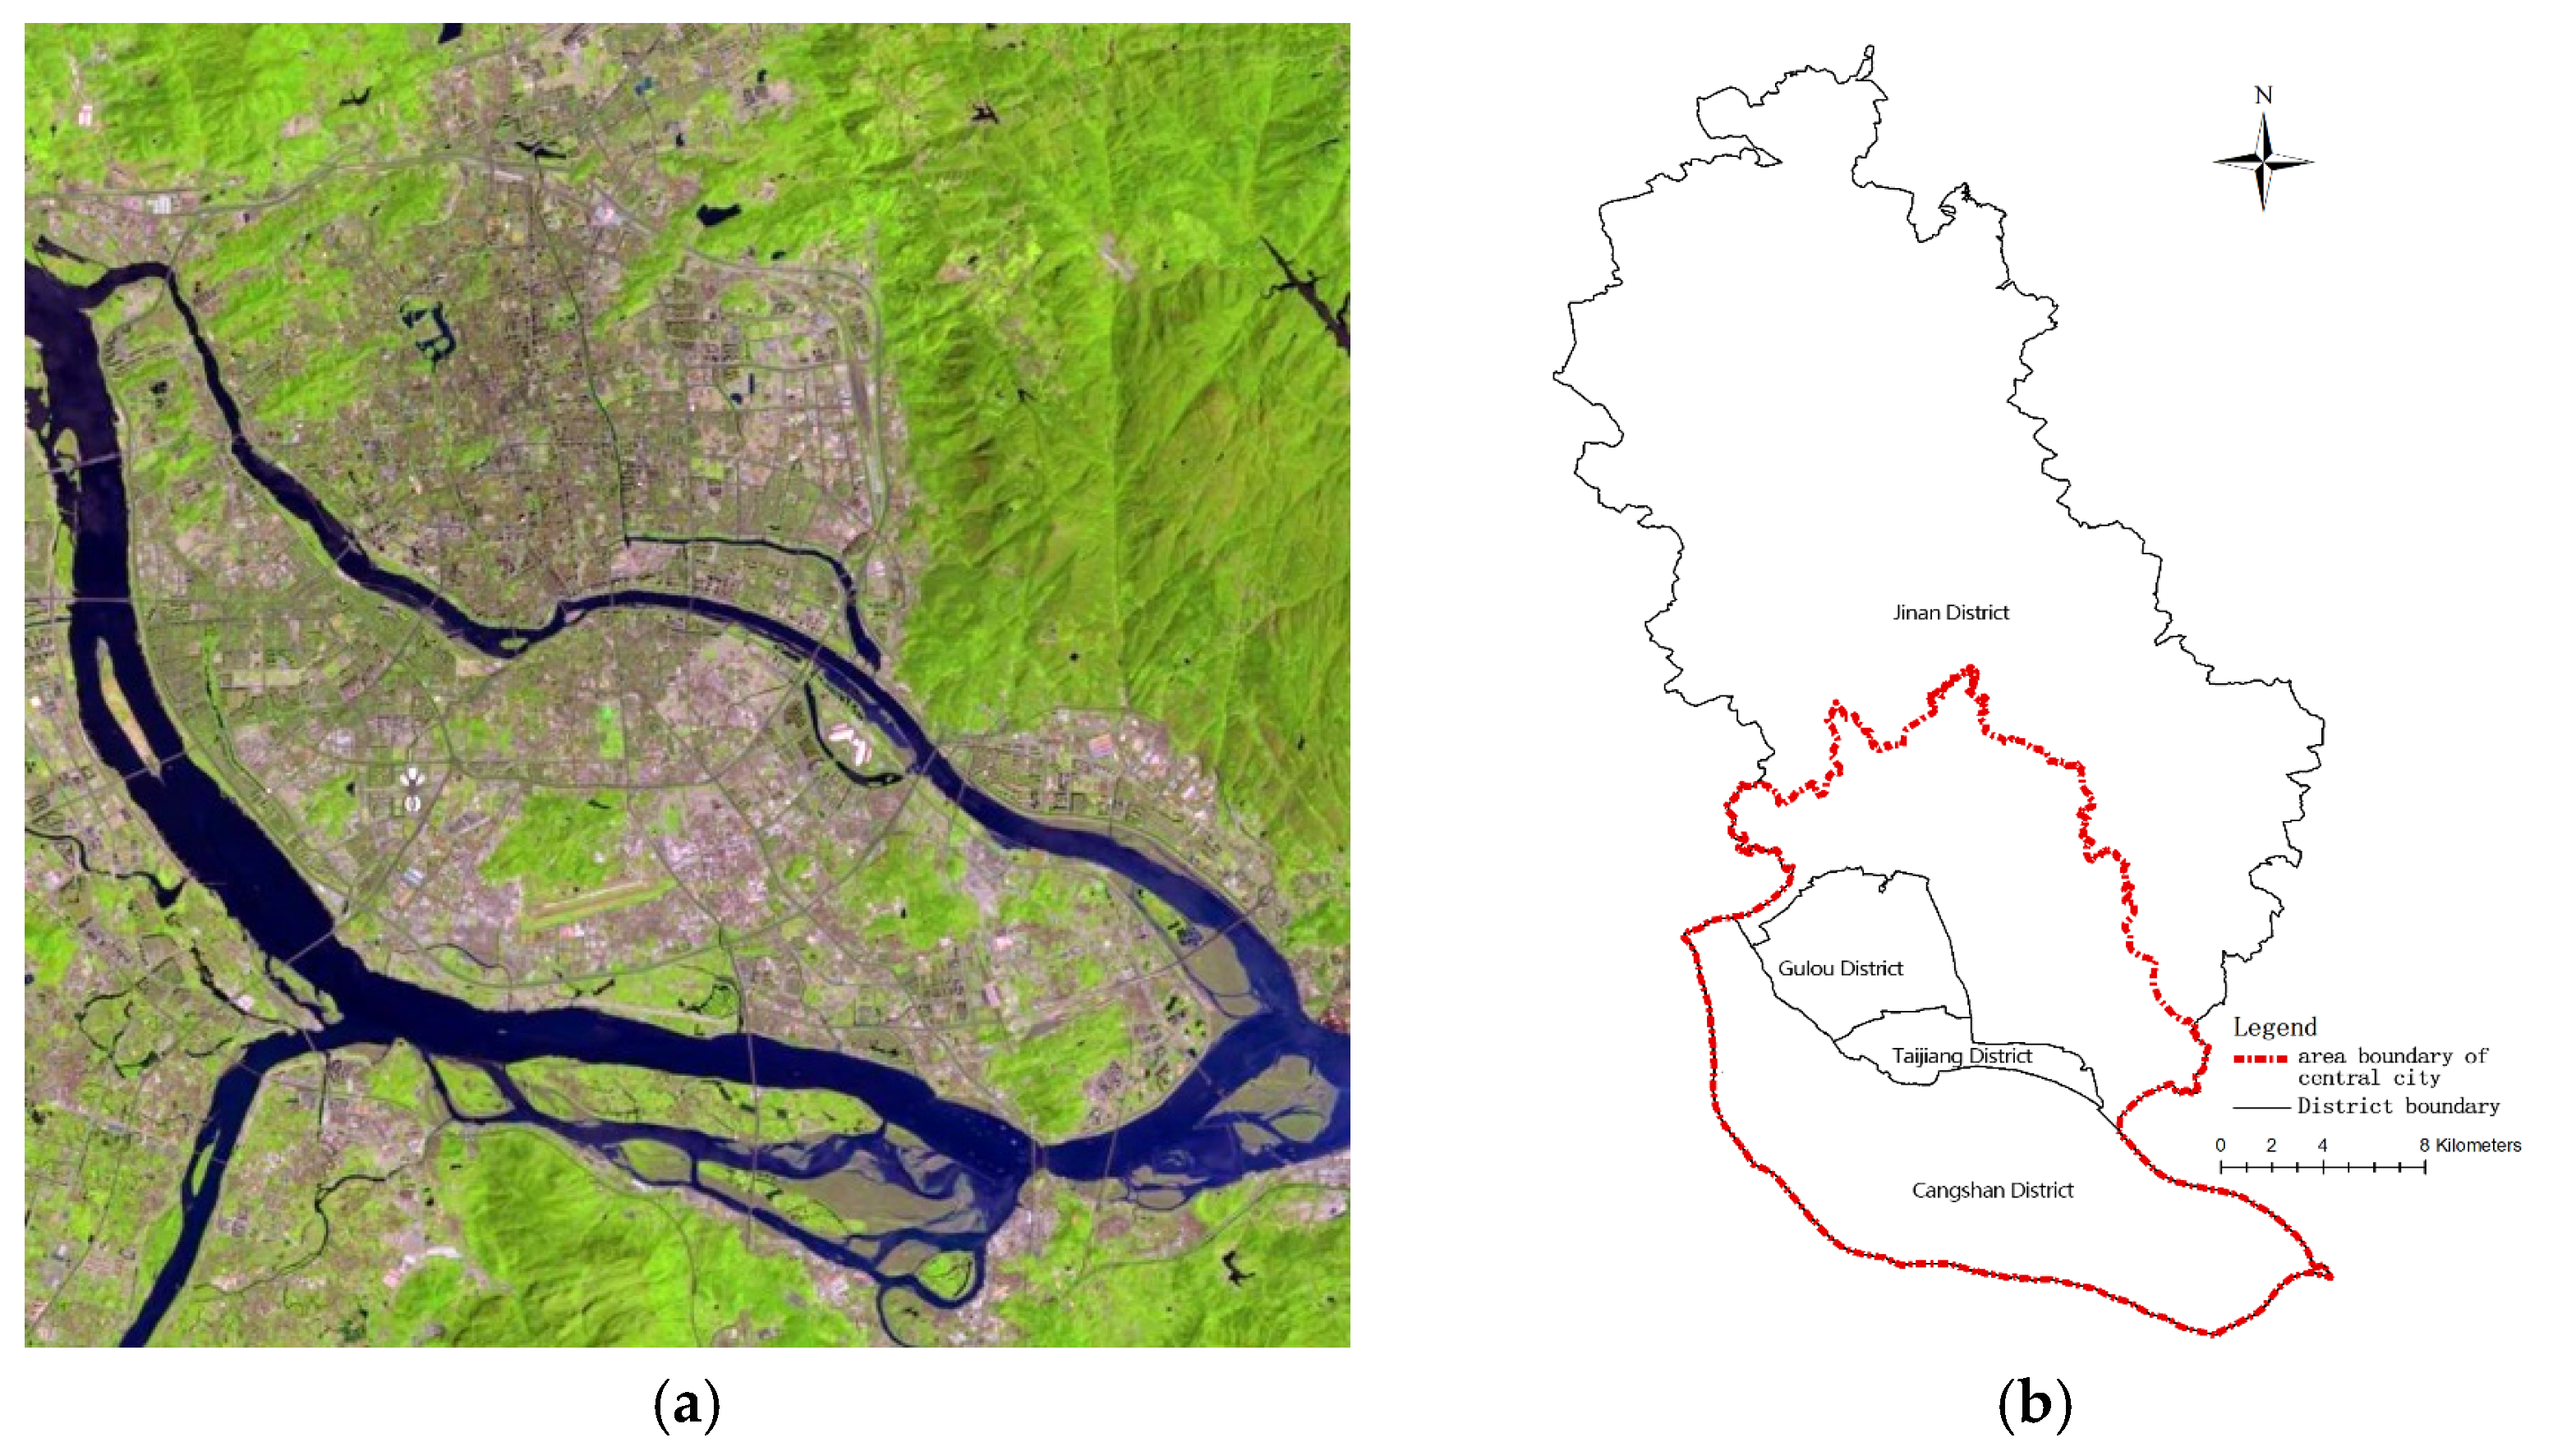
Fuzhou City is located on the southeastern edge of the Eurasian continent and at the mouth of the Minjiang River in the central-eastern part of Fujian Province, which is situated on the southeast coast of China. Its longitude and latitude coordinates are 25°15′~26°39′ N, 118°08′~120°31′ E. According to statistics, the gross domestic product (GDP) of Fuzhou City was RMB 708.552 billion in 2017. As of 2018, the city has 6 districts, 6 counties, and 1 county-level city, with a total area of 11,968 square kilometers, a built-up area of 357 square kilometers, a resident population of 7.8 million in 2019, and an urbanization rate of 70.5%. This study focuses on the central area of Fuzhou City, including Gulou District, Taijiang District, Cangshan District, and part of Jin’an District, covering a total area of 31,041 square meters (Figure 1).
Fuzhou in southeastern China has 45 major parks and scenic areas, with a total area of 2149.21 hectares. There are 10 city-level comprehensive parks, 6 regional parks, 12 special parks, and 4 suburban parks distributed around the Beifeng and Gushan scenic areas [30]. There are still some problems in urban green space planning, though, and the construction of the urban green space system has not yet been perfected. At present, the green space construction in the central urban area of Fuzhou is still dominated by block green spaces, such as park and street green spaces, while the green space construction along the river system is still relatively backward. The afforestation status of the different administrative areas varies greatly. The Cangshan district has the best greening situation because its original vegetation is better and most of it is new urban area. In the old city district of Taijiang, on the other hand, the afforestation level is the lowest due to historical reasons. The main urban parks of Fuzhou are distributed in the Gulou District and Cangshan District, of which the West Lake Park, South Minjiang Park, and Jinshan Park are at a higher level of construction. Jin’an District and Taijiang District in the central city, however, have a single form of green space, and the system needs improvement.
2.2. Space Syntax
Space syntax, proposed by Professor Hillier at the University of London, is a method for analyzing urban spaces based on spatial morphological analysis. It is a quantitative description of the spatial attributes of transport lines in urban free spaces through morphological analysis of variables. Connectivity, choice, control, depth, and integration are the main morphological variables of the traditional space syntax model, among which the choice index is later included [5]. The spatial morphological analysis variables are obtained by constructing segment maps using computer software. Based on the principle of “the least and the longest”, the space syntax uses long axes to depict and abstract the urban road network to obtain an axis map, which can then be translated into a segment map by software. The depiction of visible spaces by using axes expresses a person’s subjective perception in space; that is, a road with twists and turns gives the person a sense of multiple spatial layers, and the person identifies them and walks according to the adjacency relations of the roads rather than the actual distance [6]. Space syntax has been widely used in research to analyze urban spatial problems [31,32,33,34,35] and has been continuously verified and improved through empirical evidence. Its rationality is generally recognized in the literature.
The Space syntax can quantify the urban spatial structure. Past studies have pointed out that its spatial attribute value has strong explanatory power for many activities in a city, such as street accessibility, distribution of land use, etc. [36], and its attributes can be calculated by Depth Map X software [37]. This study takes the integration of spatial attributes as an independent variable, and the value is the performance of spatial depth. High integration can be expressed as the concentrated activity area of personnel [38]. At the same time, integration is also a manifestation of the connection between spaces. The calculation formula of this value is [39]:
where Dn provides the standardized value for the integration measure and RRAi stands for the RRA value of space i.
The road data of Fuzhou downtown area in 2000, 2010, and 2020 were obtained from the Geospatial Data Cloud Website and Open Street Map, respectively, and then AutoCAD software was used and according to the drawing rules of Axial Map. That is, the longest and least number of axis interconnection graphs of all spatial units of a space system are connected in series, and the axis graphs of 3 years were drawn, respectively. Then, Depth Map X software was used to calculate the integration degree of the streets. Depth map X works at a variety of scales from buildings and small urban areas to whole cities or states. At each scale, the aim of the software is to produce a map of spatial elements and connect them via relationship (for example, intervisibility, intersection, or adjacency) and then performs a graph analysis of the resulting network. The objective of the analysis is to derive variables which may have social or experiential significance [40].
2.3. Land Use and Green Space Classification
This study obtained the remote sensing image dataset of Fuzhou City for 2000, 2010, and 2021 from the geospatial data cloud website [41] based on LANDSAT satellite and processed it with ENVI software (5.1) to draw the spatial distribution map of land use over time. The calculated land use map was then divided into a 500 m × 500 m grid using the “Create Fishnet” tool in ArcMap.
In order to obtain the information of urban green space in Fuzhou city center area, based on the results of land use analysis, we combined field investigation and ground reality, and drew the urban green map by manual interpretation. In addition, the 2016–2021 urban green space planning map (1: 50,000), as compiled by the Fuzhou City Gardens Bureau, was vectorized and converted into a grid format of 10 m × 10 m pixels.
2.4. Landscape Pattern Analysis
The landscape pattern index refers to a quantitative index that can highly concentrate landscape pattern information and reflect its structural composition and spatial allocation characteristics. It is an important technical means and method for landscape pattern analysis [42,43] and has good explanatory power in describing the structural characteristics and spatial distribution of urban green space ecological networks [12,20]. In recent years, studies have found that different pattern indices reflect the different emphases of patterns, and it is often difficult for a single pattern index to give a comprehensive and accurate explanation of ecological processes. Thus, the explanatory ability of landscape index sets to define ecological processes serve as an effective method to analyze landscape spatial patterns [44]. This study used FRAGSTATS version 4.2 to analyze the landscape pattern index. Based on Class-Level Metrics and Landscape-Level Metrics, landscape pattern index with specific ecological significance was selected to evaluate the green space system in Fuzhou city: Class area, Patch density, Edge density, Mean patch size, Shannon’s diversity index, Shannon’s evenness index, Landscape Shape Index, Mean fractal dimension index, Euclidean Nearest-Neighbor Distance, Connectance Index, Largest patch index, and simple descriptions of these indices are given in Table 1. Class metrics represent the amount and spatial distribution of a single patch type and are interpreted as fragmentation indices. Landscape metrics represent the spatial pattern of the entire landscape mosaic and generally interpreted more broadly as landscape heterogeneity indices because they measure the overall landscape structure [45].
2.5. Network Analysis
The network structure is key to the formation of green space ecological networks. More and more experts and scholars have used topology (graph theory) theories and methods to carry out research and exploration and have abstracted real and complex landscape elements into relatively simple “graphs” for research. With the development of computer technology, the graph theory has been widely used in almost all fields and has achieved unprecedented developments. The main contents of the graph theory include the basic concepts and properties of graphs, the theory of graphs, and their applications. Structure determines function, and many studies have shown that the topology of a network determines its characteristics. In this regard, using the graph theory to plan green space ecological networks is effective.
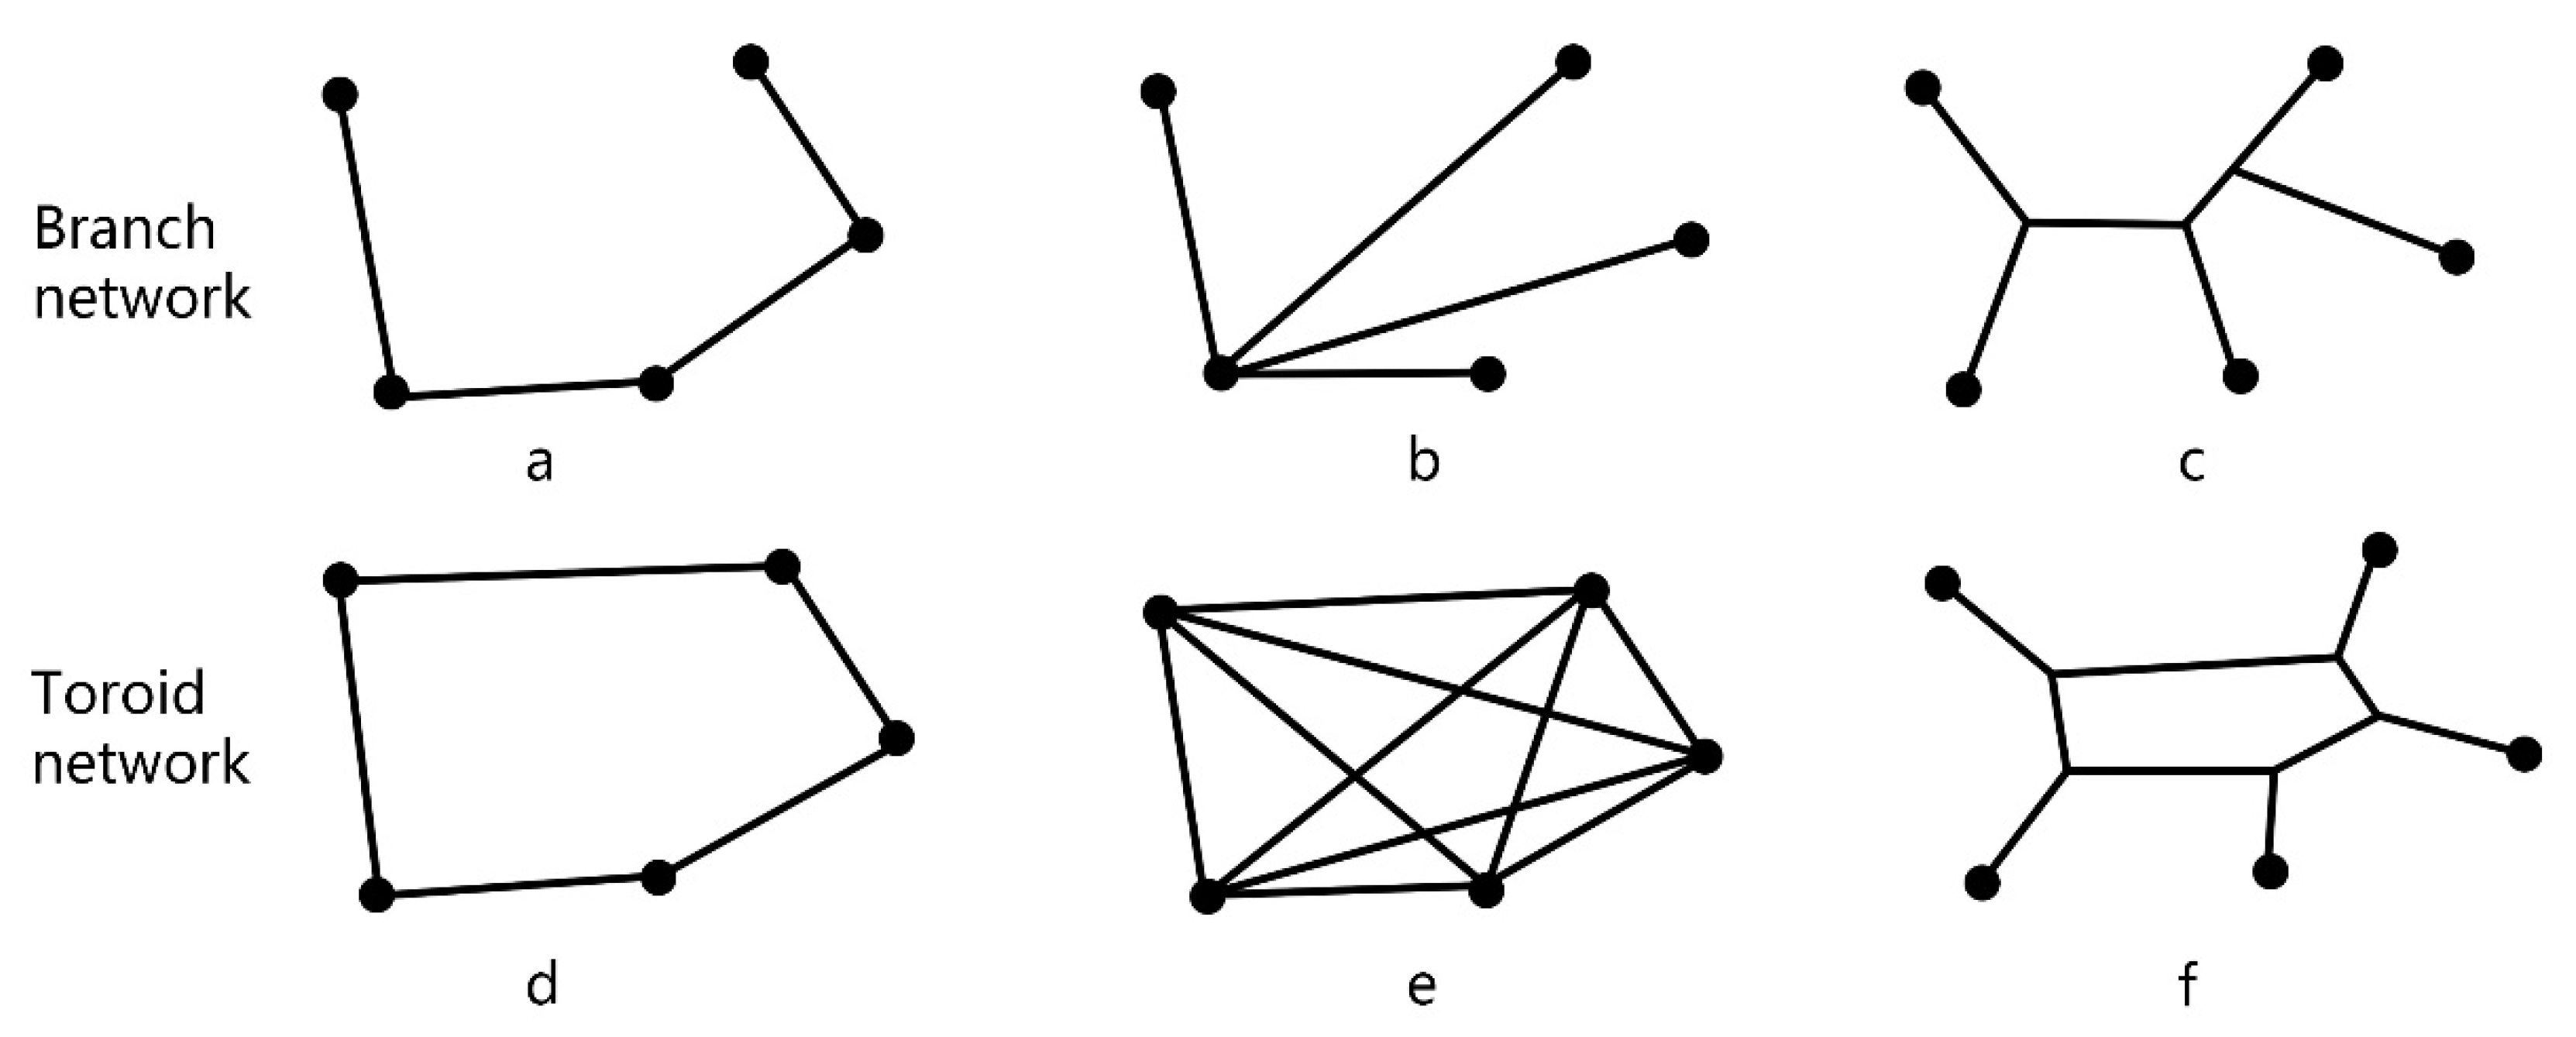
In 1989, Helmond pointed out that common network forms are divided into branch networks and ring networks, and listed six specific network form diagrams (Figure 2), which represent different network forms, respectively: the branch networks are a, b, and c; while the rings networks are d, e, and f. When using the graph theory method to plan a green space ecological network, the first concern is efficiency, which is usually defined by “cost to use” and “cost to builder” [46], as cost balance is an important framework to determine the network spatial pattern. Network a is the most basic of all networks; network b is a branch network, which belongs to the network with the lowest cost to use, and its “flow” flows to other nodes through a central node to redistribute the combination; network c is the network with the lowest cost to builder, and all nodes in the network are the end points. Ring networks are more complex and form closed loops; network d is the most basic kind of ring network; network e has the lowest cost to use, and each node is connected to each other; network f reflects the best balance between cost to use and cost to builder [47]. The above common network types can form various network models under different targets.
2.6. Network Structure Analysis
The network structure index was introduced into landscape ecology in the 20th century, and the graph theory method has been used to analyze internal network attributes according to the aspects of topological structure, complexity, and the connectivity of networks, in order to optimize the structure and form a “graph” based on the layout form of points and lines before analysis. Among multiple evaluation indices, index α, index β, index γ, and the Cost Ratio are often used to evaluate the connectivity and effectiveness of ecological networks [48]. Among them, index α is used to express the degree of network closure and describe the degree of loop occurrence in the network, that is, the ratio of the actual number of loops in the network to the maximum number of loops that may exist in the network. Index β is also called the line point ratio, which is a simple measure of network complexity, that is, the average number of connections per node in the network. Index γ is used to measure the degree of network connectivity and describe the degree to which all nodes in the network are connected, that is, the ratio of the number of corridors to the maximum possible number of corridors in a network (Table 2).
The cost ratio is based on the landscape conditions and socio-economic realities and is calculated by following formula:
where l is the number of corridors and d is the length of corridors [49]. Cost ratio is a measure of efficiency and will inevitably have to return to concrete measures to account for cost differentials of alternative green space networks [50].
Cost Ratio = 1 − (l/d)
3. Result
3.1. Evolution Analysis of Street Integration in the Central Area of Fuzhou City
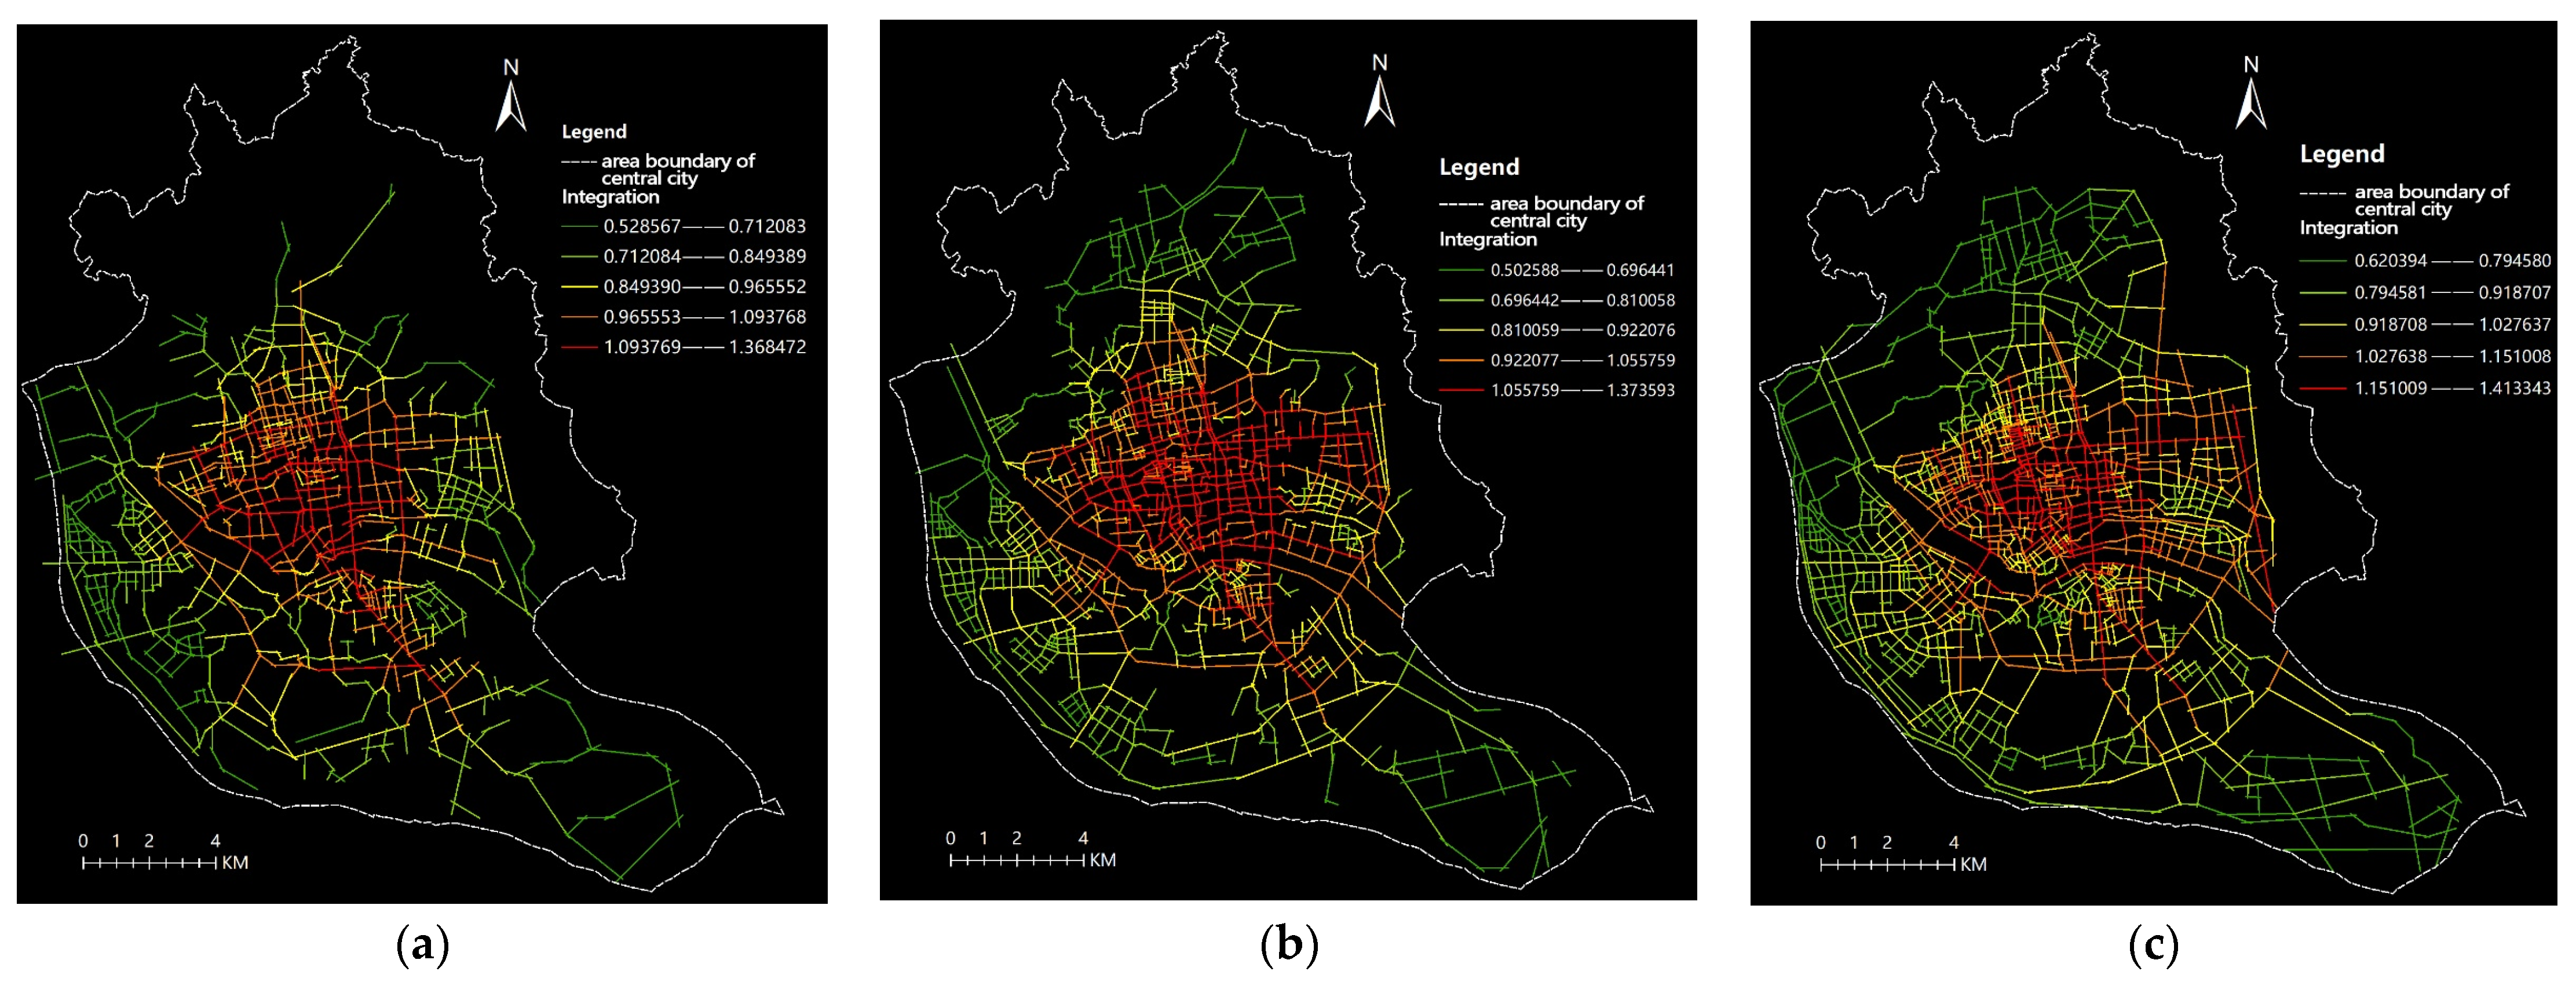
Based on the Map of Fuzhou city center, the spatial syntax theory was applied, and Depth Map X software was used to calculate the street integration degree map of Fuzhou in 2000, 2010, and 2021 (Figure 3). The red line is the most integrated street and the green line is the least integrated street. We conducted descriptive statistics (Table 3). From the data, we can clearly see that, in addition to the continuous improvement of the number of streets, the average street integration degree also shows an upward trend.
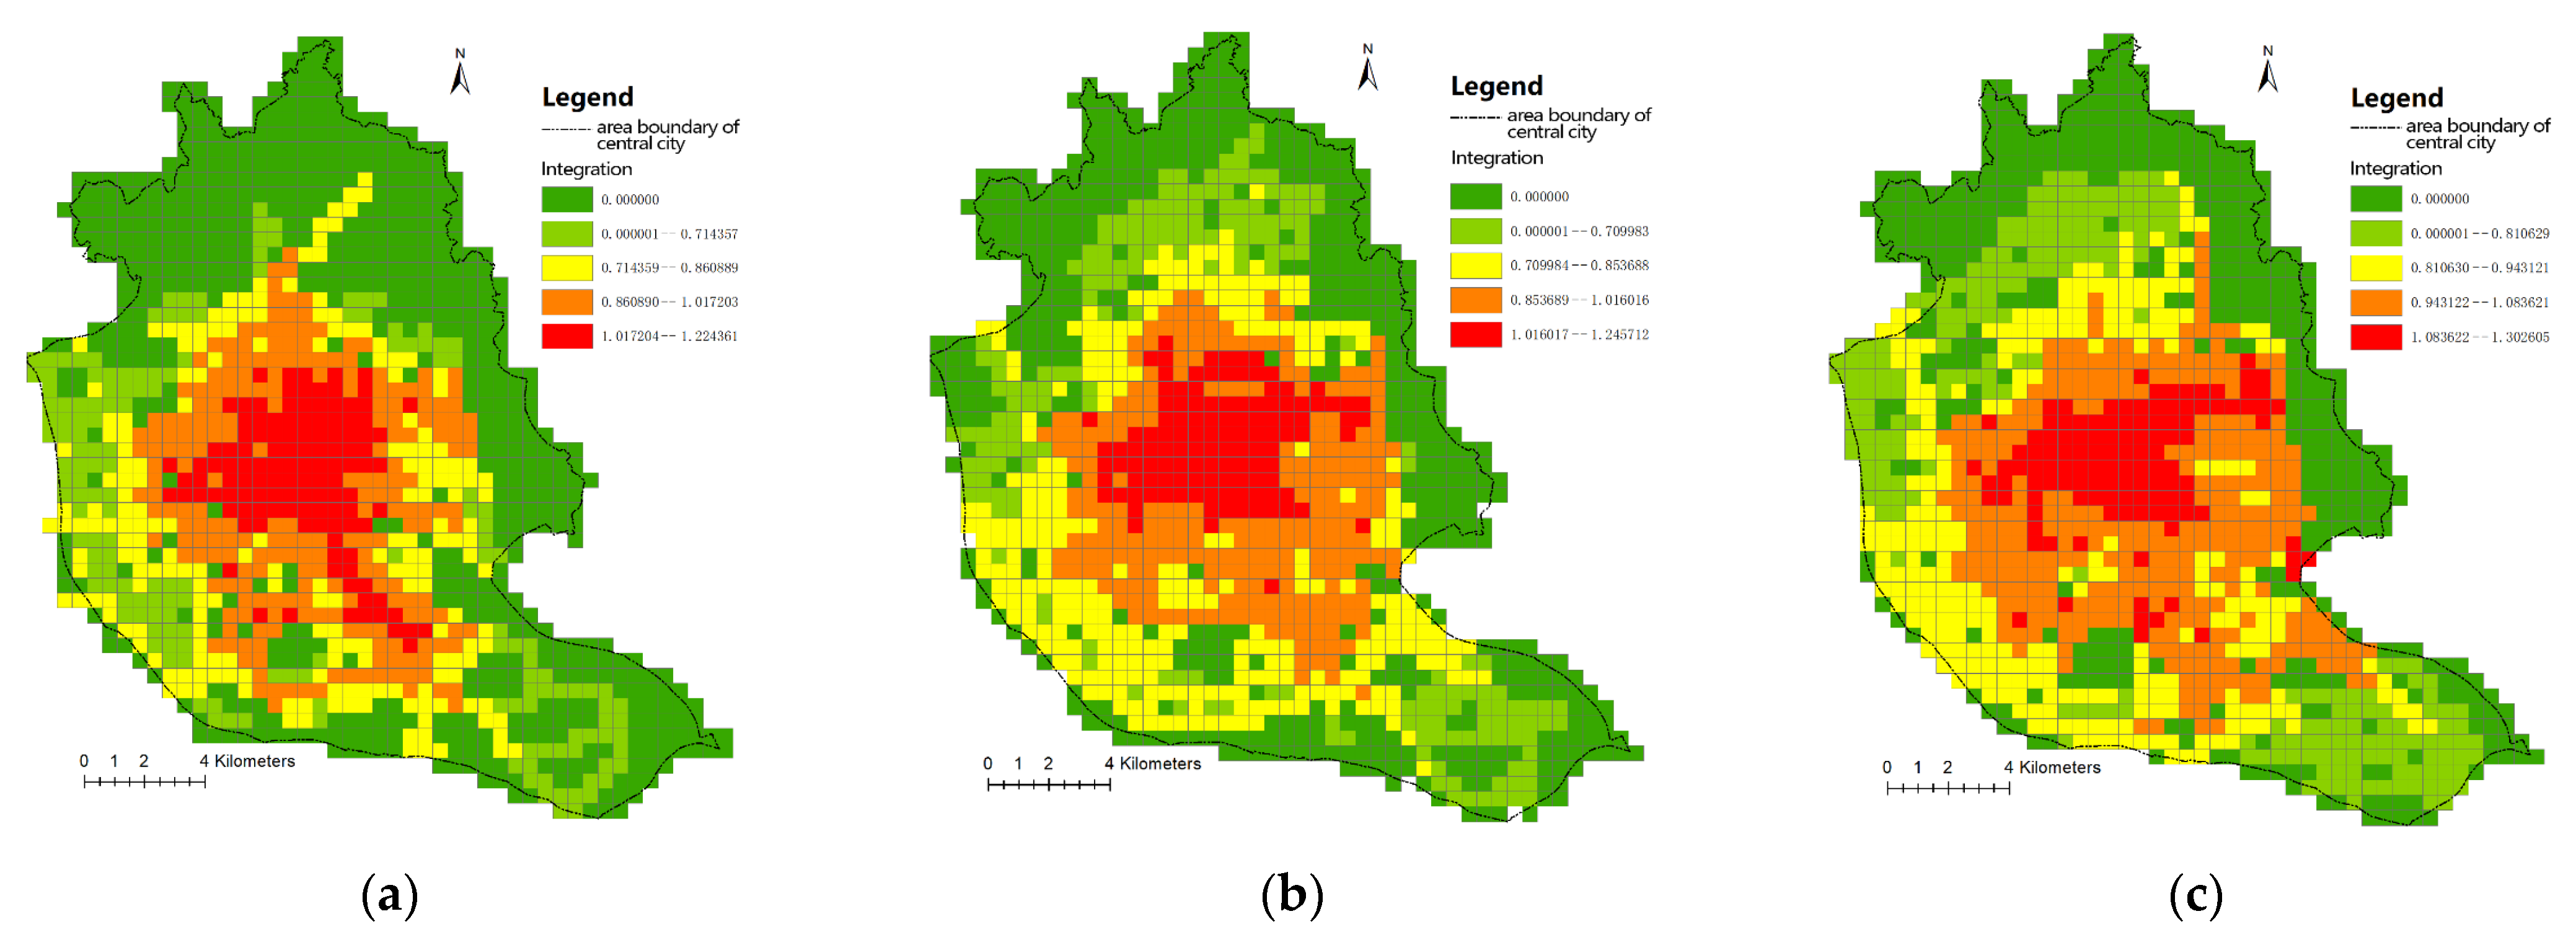
To present the data more clearly, we converted the consolidation graph to a raster graph. The “Create a fishnet” tool in ArcMap was used to divide the axis graph with the degree of integration into a 500 m × 500 m grid. Figure 4 shows the changes in urban street global integration, meaning the evolution of urbanization intensity. Red represents the highest level of integration, and green represents the lowest. The street integration in 2000 indicates that high integration is mainly concentrated in the city center, which covers Gulou District, Jin’an District, and Cangshan District. These areas are the old districts of the city, and during this period, urbanization centered around them, with the red areas showing the range. In 2010, the street integration changed, with the red part decreasing and the orange and yellow parts increasing, indicating that the center of the old Cangshan District gradually weakened, and urbanization mainly expanded in all directions with Gulou District and Jin’an District at the core. However, the focus of this period remained in the city center and mainly in Gulou District. The integration in 2021 has also changed. As seen in Figure 4c, the yellow part has shrunk, the red part has also decreased, and the orange part has become larger. This illustrates a weakening of the urban center and urbanization intensity expanding in all directions.
3.2. Evolution Analysis of Urban Green Space Fragmentation
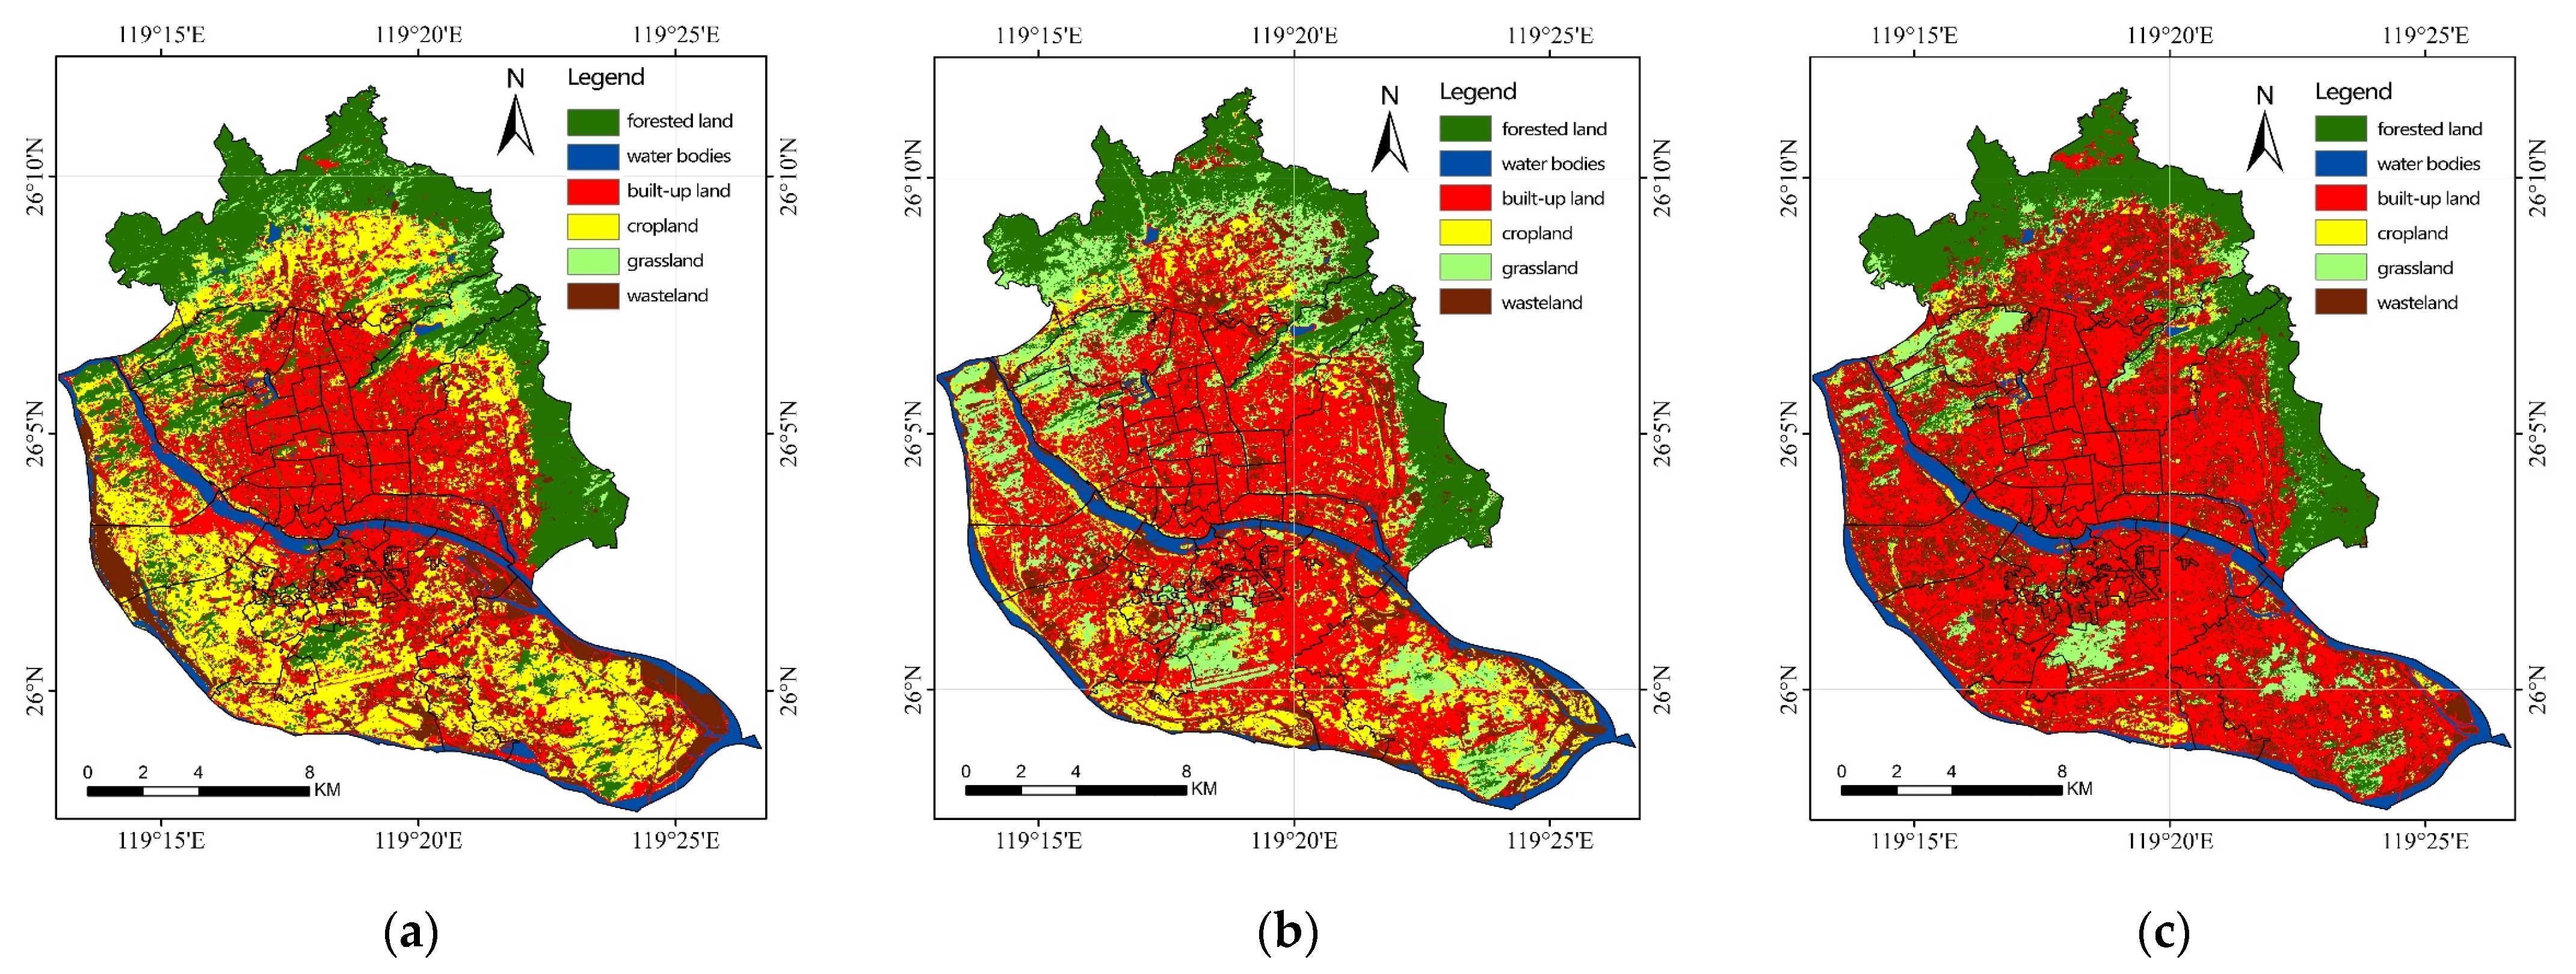
According to the research data and methods described above, the spatial distribution of land use in Fuzhou downtown area in 2000, 2010, and 2021 are depicted in Figure 5, respectively.
We also obtained the annual statistical table of the quantity of land use in Fuzhou (Table 4), which analyzed the changes in the quantity and spatial characteristics of land use in the central urban area of Fuzhou since 2000 [51].
As the land use area and spatial distribution of Fuzhou City changed during the period 2000–2021, the spatial pattern, and morphology of land use also changed accordingly. This study uses Fragstats 4.2 to calculate LPI and LSI of land use in Fuzhou City and to investigate the characteristics of the changes in LPI and LSI of various land types in the study area. They describe the urban green space fragmentation in terms of patch size and edge complexity. Here, LPI equals the proportion of the largest block of a particular block type to the entire landscape area. Its value determines ecological characteristics such as the dominant species in the landscape and the abundance of internal species; a variation in the value can change the intensity and frequency of disturbance, reflecting the direction and intensity of human activities. LSI is used to determine the complexity of a landscape, with higher values indicating more fragmented and more complex landscapes.
3.2.1. Largest Patch Index
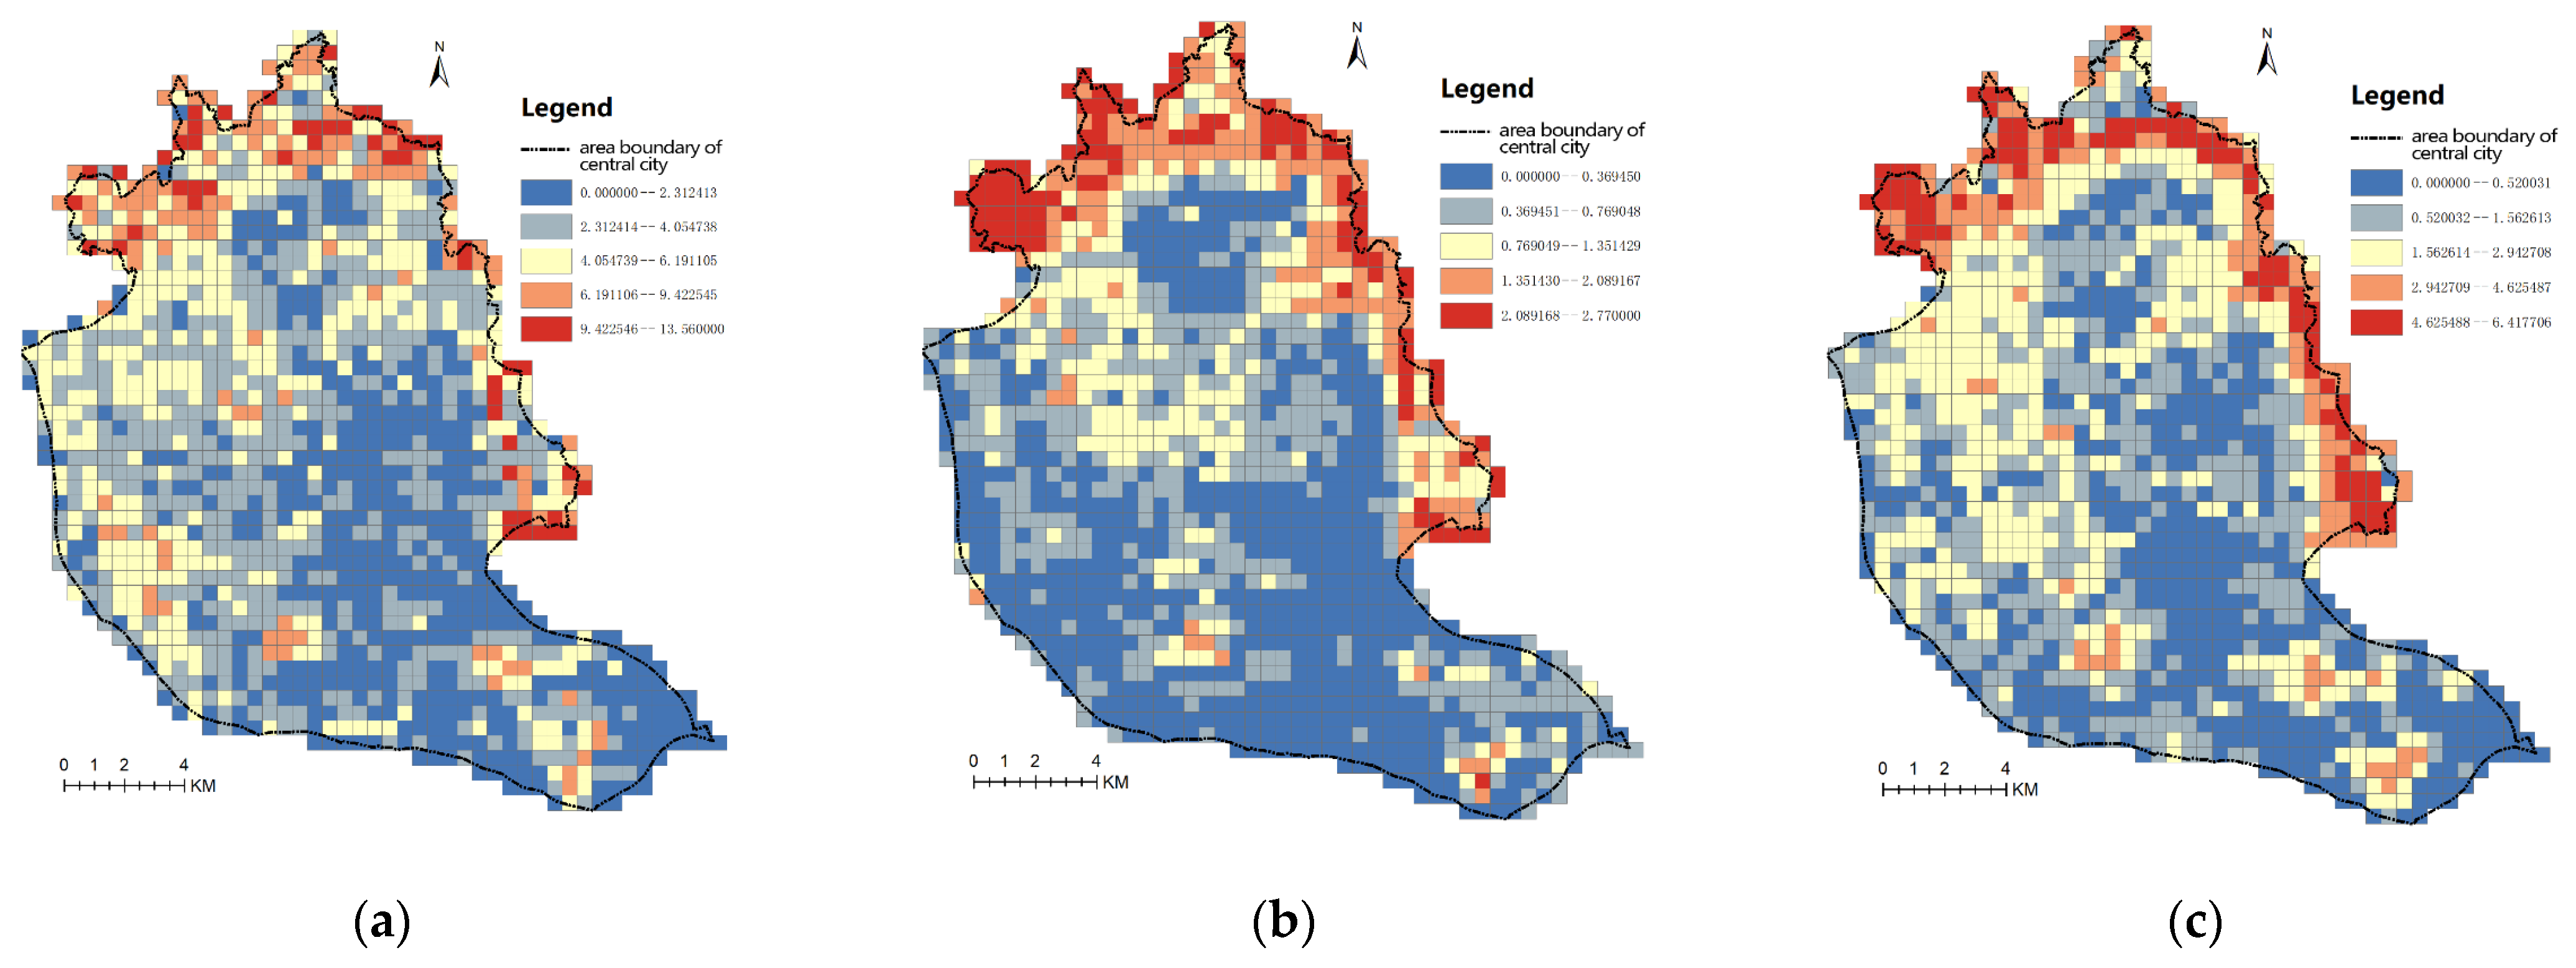
The values of LPI changed during this research period. LPI of farmland and forested land decreased sharply from 7.97 and 13.56 in 2000 to 0.17 and 6.59 (Table 5) in 2021, respectively. The LPI value of water bodies decreased from 1.43 to 0.42, while that of grassland increased from 1.06 in 2000 to 3.83 in 2021. This phenomenon indicates that the former dominance of farmland in the city center is gradually decreasing. A large number of urban green space is being transformed into construction land, which is greatly affected by human activities. At the landscape scale, LPI has been increasing year by year. This demonstrates that land use fragmentation in the study area has increased significantly in the context of increased urbanization.
In order to understand the change of Fuzhou City’s urban green land during 2000–2021, ArcGIS was used to calculate spatial metrics (Figure 6). During this period, there was a general decrease of LPI values in the western part of the city center, while in the central location, the LPI values rose. This phenomenon shows that from 2000 to 2021, this area has undergone a major change, with most farmland being converted into construction land and green space in the city center. From 2010 to 2021, urbanization advanced, and the LPI value of the western area increased, mainly due to the increase in the green space areas and the spread of the central area towards the west and south, indicating greater urban green space fragmentation.
3.2.2. Landscape Shape Index
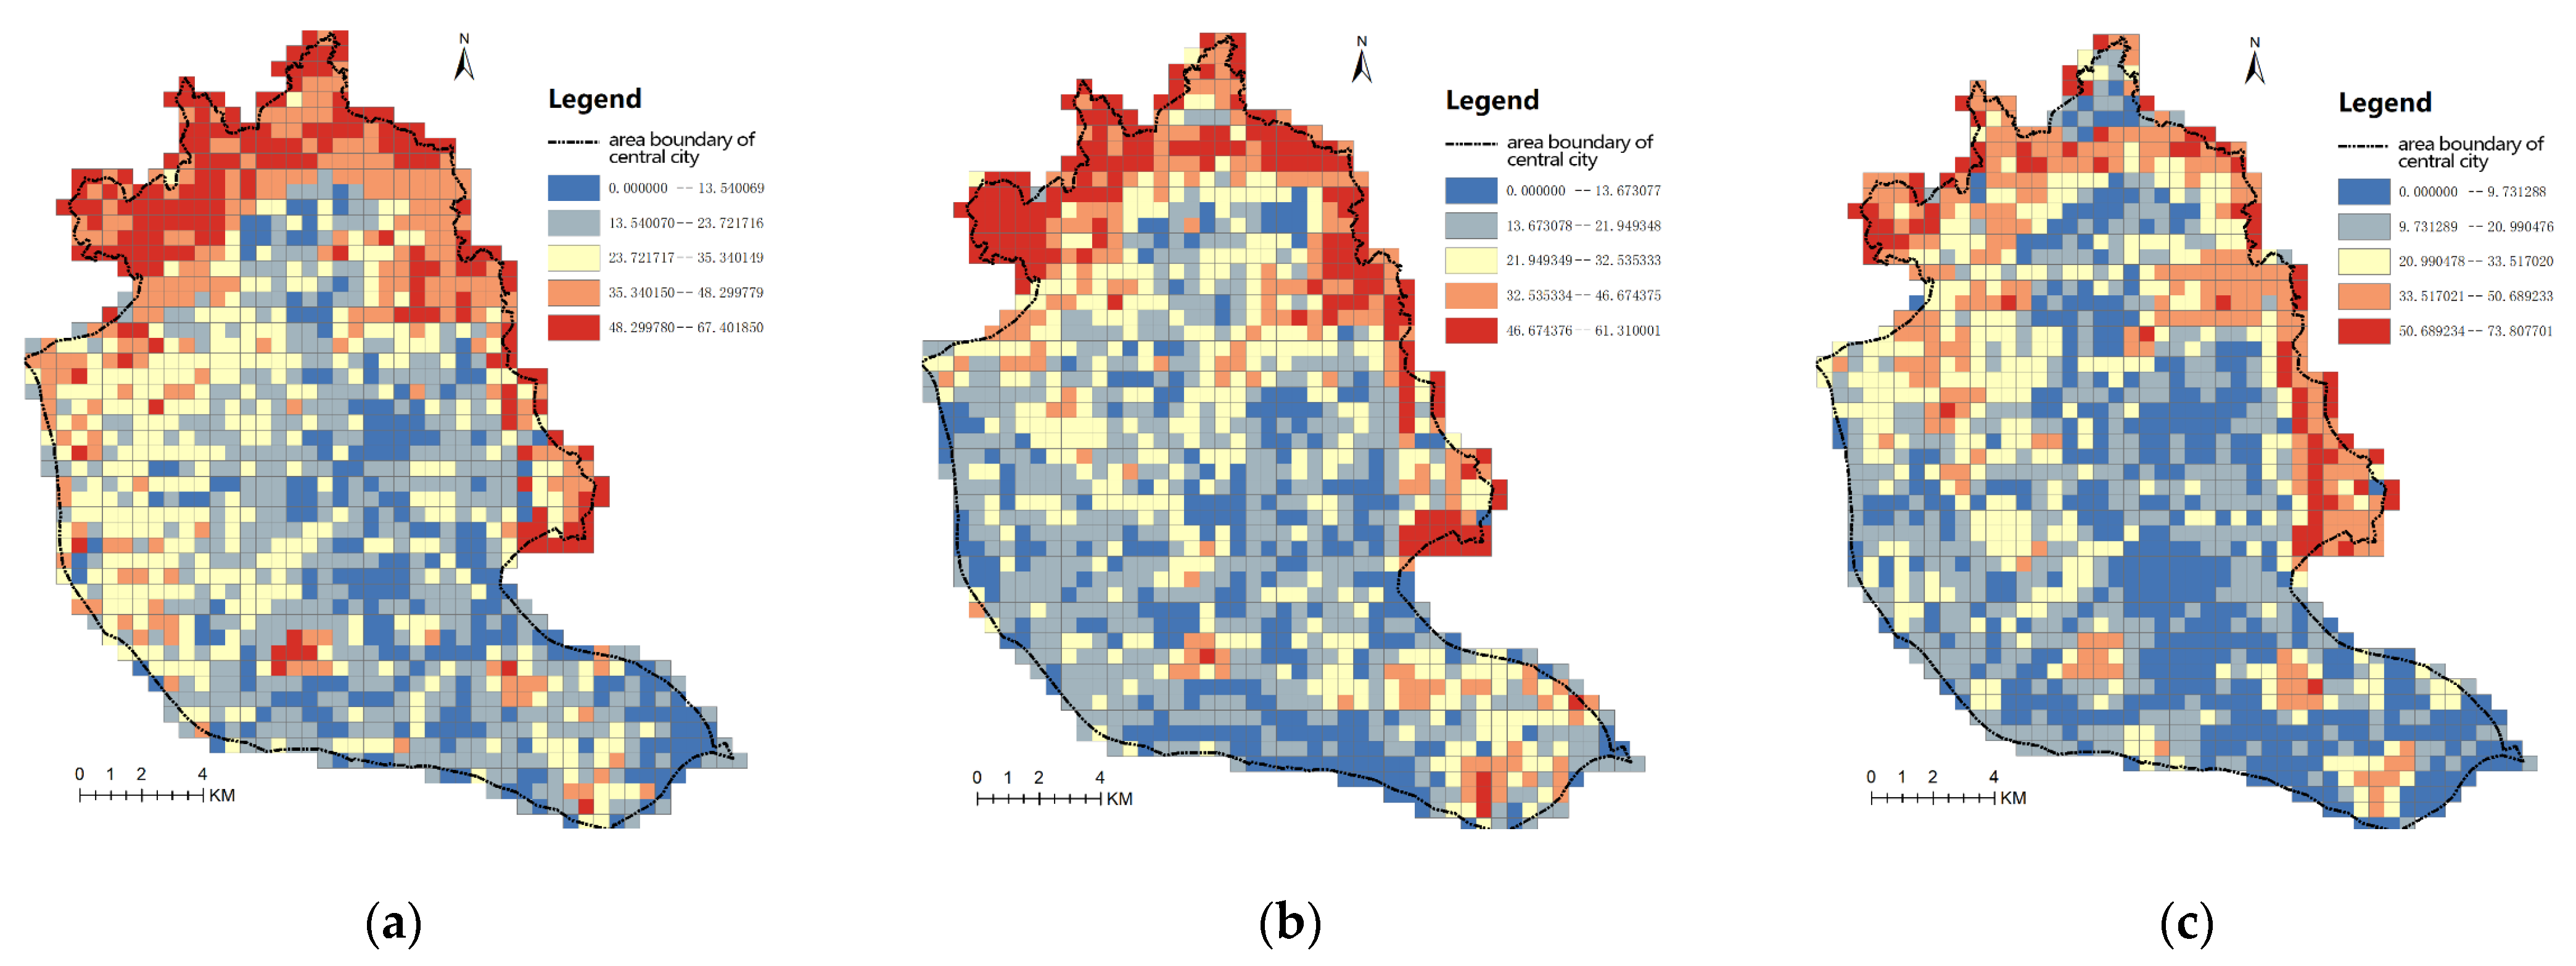
LSI (Table 6) showed that forested land, water bodies, and farmland in the center of Fuzhou City decreased, while that of grassland increased during the research period. The LSI value of landscape increased from 79.53 in 2000 to 111.69 in 2021. The LSI value of forested land and farmland registered more significant decreases during the period 2000–2021, with a decline from 62.95 to 36.05 for forested land and from 72.21 to 42.21 for farmland. The LSI value of water bodies also decreased slightly from 18.40 to 16.58, while the LSI value of grassland increased from 41.48 to 73.81. The results show that the simplification of woodland, farmland, and water body shape and the increase of complexity of green landscape shape are all caused by human factors.
Figure 7 shows the evolution of the LSI values of urban green space in the central urban area of Fuzhou City from 2000 to 2021. During this period, the LSI values of the urban green space were distributed in a patchy pattern. The western part of the city showed a decrease in its LSI value, indicating that the urban green space was less fragmented in that area. However, the LSI value of the central urban areas increased, and the urban green spaces there were more complex and fragmented. From 2010 to 2021, the LSI values decreased in most areas, with a downward trend in the northern, central, and eastern regions, while the LSI values increased in the western and southern regions. These findings reveal the complexity and fragmentation of the urban green space shape throughout the study period.
Through the above analysis, from the evolution process of urban street Integration and landscape pattern index (LPI, LSI), it is found that in the process of urbanization in Fuzhou, the fragmentation of green space in the city center has changed a lot. Based on the results of this study, we will continue to use more detailed landscape pattern index to understand the evolution of urban landscape pattern index. Using network analysis method, the paper constructs the ecological network of urban green space in Fuzhou. Finally, the ecological network was evaluated by the corridor structure analysis.
3.3. Optimization of Green Space Ecological Network
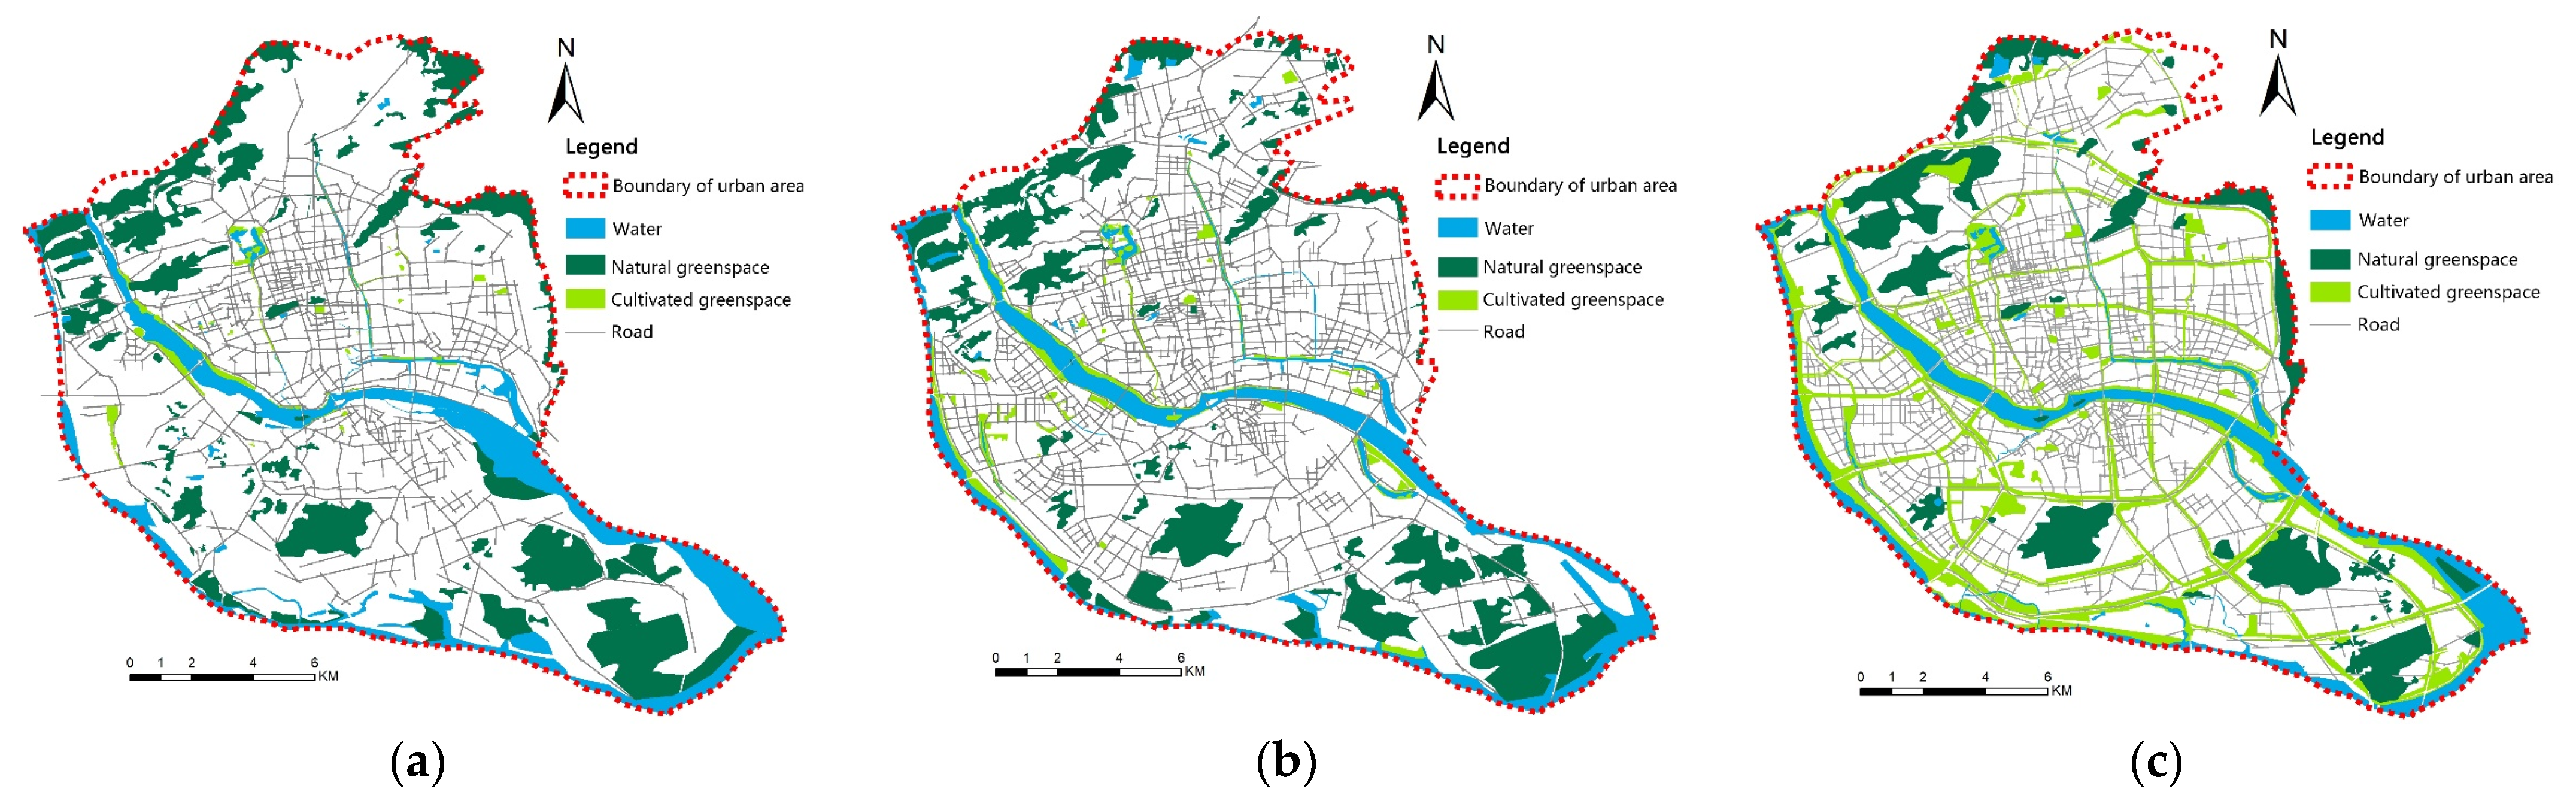
On the basis of the above research, we divide the green space in the downtown area of Fuzhou into natural green space and designed green space. Natural green space is mainly semi-open, natural, and undeveloped land; for example, parts of the ecological green space, landscape forest land, waterfront green land as natural green spaces; while public gardens, workplace-related green spaces, and other shelter green spaces are classified as artificial green spaces (Figure 8). The purpose of adopting this simplified land use classification scheme is to better evaluate the spatial characteristics of land use and understand the general interaction mode between natural green space and artificial green space.
3.3.1. Landscape Pattern Analysis
Class-Level Metrics
In order to observe the changes of green spaces in Fuzhou City in a more intuitive manner, this study conducted comparative analysis of the data of the four administrative districts, respectively. The order of analysis was Cang Shan District, Gu Lou District, Jin An District, and Tai Jiang District (Appendix A: Table A1, Table A2, Table A3 and Table A4).
Compared with planning in 2021, the green systems applied in 2000 and 2005 have decreased, while the artificial green space has increased gradually in the four urban areas after the implementation of the plans. The area of natural green space in Cang Shan District decreased by 697.53 ha, while the area of artificial green space increased by 1011.5 ha. Cang Shan District is a new district, and in the early days, it was dominated by agriculture and most of its land was cultivated land. However, by 2010, due to the rapid development of Fuzhou City, the cultivated land area decreased rapidly, and most of the land was turned into urban construction areas, and the natural green land decreased by 485.31 ha, while the artificial green land increased by 665.84 ha. Moreover, the patch density of natural green spaces and artificial green spaces showed an increasing trend from 2000 to 2021, as natural green space increased by 0.44 per 100 ha, and the artificial green space increased by 1.01 per 100 ha. In terms of edge density and the average patch fractal dimension index, while the natural green space remained unchanged, the edge density of artificial green space increased by 33.93. Regarding the average patch size index, the natural green space decreased by 9.24 ha, and the natural green space decreased by 2.42 (Table A1).
The natural green space area of Gu Lou District decreased by 428.33 ha, while the artificial green space area increased by 744.98 ha. Gu Lou District is located in the old urban area, and in the process of urbanization, most of the open spaces and old houses were planned as urban construction areas, thus, due to the limited land area, the natural green space is seriously reduced. The changes in patch density, average patch size, and edge density index between natural green spaces and artificial green spaces run in opposite directions, while the fractal dimension of the average patch seldom changes (Table A2).
The natural green space area of Jin An District decreased by 340.69 ha, while the artificial green space area increased by 253.85 ha. Jin An District is also located in the old urban area, and in the process of urbanization, most of its vacant land and old houses were planned as urban construction areas, thus, both natural green space and artificial green space show an increasing trend in PD. From 2000 to 2021, the natural green space increased by 0.42 per 100 ha, and the artificial green space increased by 0.39 per 100 ha. ED shows that natural green spaces decrease and then increase, while artificial green spaces show an upward trend; however, the change of MPFD is not obvious. From MPS, it can be seen that the values of natural green space and artificial green space both show a downward trend (Table A3).
Tai Jiang District, which is also in the old urban area, saw changes in its various landscape Metrics; however, due to its small area, the changes are small. Like Gu Lou District, the PD and MPS indices of natural green spaces and artificial green spaces change in opposite directions. Moreover, while the ED increases, the MPFD shows little change (Table A4).
Landscape-Level Metrics
In order to compare the present situation of green space in 2000 and 2010 with the green system planned in 2021, the green is integrated into a patch type, and the landscape pattern is analyzed. and the results are, as follows:
In terms of CA, Cang Shan District shows an increasing trend, while the other three districts all show an initial decreasing trend, followed by an increasing trend. Cang Shan District and Gu Lou District saw increases in PD, ED, LSI, SHDI, SHEI, and CONNECT, and decreases in MPS and ENN. The ENN of Cang Shan District and Gu Lou District decreased by 37.12 and 30.99, respectively, while the MPFD changed slightly. Tai Jiang District and Jin An District also present similar situations, meaning they saw decreases in MPS and ENN, but increases in all other values (Table A5).
3.3.2. Ecological Corridor Analysis
Analysis of Ecological Corridors in Fuzhou City
In the face of such great pressure on the urban environment, Fuzhou City must first establish an effective ecological barrier around the periphery to ensure ecological security. According to the existing corridors in Fuzhou, proper subjects were selected from the known corridors, and defined as ecological corridors, in order to be included in the green space ecological network. The existing county parks are located within the first planned green isolation area and are distributed in a ring shape in the suburbs of Fuzhou City; thus, they have high potential connectivity value, are important nodes for forming landscape connectivity lines and biological corridors, and for constructing ring-band connectivity. In addition, the northern and eastern peripheries of Fuzhou City are surrounded by mountains, while the western and southern parts feature waterfront landscapes, including nature reserves, scenic spots, forest parks, and wetland landscapes with excellent landscape value and extremely high ecological value. If corridor connectivity can be established from relatively concentrated scenic spots, it will promote the protection of the natural landscapes and biodiversity of the scenic spots, and improve the efficiency of landscape recreation, promote the development of tourism, and improve the quality of life in urban and rural areas; for example, connecting the carrier features of the riverside landscape belt with the Gu Shan Scenic Area, National Forest Park, Minjiang River, Wu Long River, etc. can take advantage of natural features.
Site Selection of Ecological Corridor in Fuzhou City
By comprehensively considering the landscape unit characteristics of the green spaces, the green space patches that have been repeatedly considered are removed, and the main ecological green space patches are selected, such as Xi Hu, Wuyi Square, Riverside Park, Jin Niu Shan, etc. This study extracted 99 ecological nodes, including 50 in Cang Shan District, 15 in Gu Lou District, 8 in Tai Jiang District, and 26 in Jin An District. In the construction of ecological corridor, buildings and roads should be avoided as far as possible. Considering the Fuzhou City Master Plan (2011–2021) (Figure 9), some linear roads and rivers were redefined as green spaces, and converted into connective sections to facilitate the integrity of the ecological network. Finally, the common network form, as proposed by Hellmund, was taken as the model, and attention was paid to efficiency, the importance of ecological nodes, and the distance between nodes. After repeated comparisons and deliberations, four green space ecological network plans were put forward.
First, taking the Minjiang River as the boundary, large patches from 99 ecological nodes were selected to construct green space ecological network I, which consists of important screened ecological areas with large patches featuring good ecological benefits, which can provide vast habitats for wildlife.
Peripheral ecological nodes were selected to construct green space ecological network I (Figure 10a), with Minjiang River as the boundary, and to form a ring network with common network d as the model. Network I consist of two ring networks, as a ring network structure can provide a good foundation for the interaction of materials, information, and the capabilities of organisms in the overall ecological network.
Second, on the basis of ring network I, the corridors were connected, and such connectivity fully considers the importance and distance factors of ecological nodes and takes the common network b as the model for the branch network, namely, network II (Figure 10b). Due to different connectivity modes, there may be many networks formed, and the network form in the figure is only one.
Thirdly, based on network II, the common network f was taken as a model to balance the contradictions among the many issues. On the basis of considering the node distance factor, this study tried to avoid corridor crossing, and used potential ecological corridors to connect all possible ecological nodes to form network III (Figure 10c), which has higher complexity. The ring structure can enable organisms in the network to interact with each other in matter, information, and energy.
3.3.3. Analysis of Corridor Structure and Network Structure
Corridors have great influence on the landscape ecological process, and their structure is key to the construction of the entire green space ecological network. Analysis of ecological nodes and ecological corridors in the network model is the basic work to realize network optimization. The structural form of ecological corridors shows the complexity of its structure; the more complex the corridor structure, the more conducive it is to play the role of corridor connectivity and separation. According to the schematic diagram of the green space ecological network plan of Fuzhou City, the numbers of ecological nodes and ecological corridors of the three networks are counted, as follows. According to the numbers of ecological corridors of the three networks and the basic form of network connectivity, it is shown that the network III corridor structure is the most complex, indicating the network has obvious advantages in corridor function.
According to the network structure analysis method, this study calculated the network correlation indices of plans I-III of the green space ecological network of Fuzhou City. The α indices of networks I and II are all zero, indicating that there is no loop in the network. The α index of network III is the largest, which indicates the most loops in the network and that the network has the largest network closure; the larger the network closure, the more conducive to the circulation of energy, material, and information within the network. The β index of network III is also greater than that of networks I and II, which indicates that the number of corridors on the nodes of network III is the largest, reflecting that the connectivity of this network is better than that of the other networks. The γ index of network III is the largest among the three networks, which indicates that the node connectivity degree of network III is the highest among the three networks (Table 7).
Based on the above comparative analysis of the corridor structure and network structure of the three network plans, the number of ecological nodes and ecological corridors in network III is the largest, indicating that network III has the most complex corridor structure, and thus, better corridor functions. In terms of network structure, index α, index β, and index γ of network III are the largest among the three networks, which indicates that network III has the most closed loops and better connectivity than the other three networks. Therefore, the green space ecological network of Fuzhou City should adopt the network III structure mode for further concrete construction.
3.3.4. Scheme of Green Space Ecological Network in Fuzhou
According to the overall urban plan (2016–2021), area size, boundary shape, and geographical location of ecological nodes, as well as the length, direction, and connectivity orientation of potential corridors, the generated network III plan is adjusted to obtain the final network plan (Figure 11), and the ecological network planning scheme of “one city and two rings” in Fuzhou City was put forward.
A total of 155 corridors were built, including 71 corridors in Cang Shan District, 34 corridors in Gu Lou District, 16 corridors in Tai Jiang District, and 34 corridors in Jin An District. The corridor densities of the ecological network are 1.16 km/km2, 1.62 km/km2, 1.33 km/km2 and 1.05 km/km2, respectively, in Cang Shan District, Gu Lou District, Tai Jiang District, and Jin An District. The index α, index β, and index γ of the ecological networks in Gu Lou District and Tai Jiang District are higher than those in Cang Shan District and Jin An District, and have the lower cost ratio, which indicates that the ecological networks in Gu Lou District and Tai Jiang District have higher connectivity, while the ecological networks in Cang Shan District and Jin An District have higher cost efficiency and are more economically flexible (Table 8).
According to the above-mentioned planning scheme, using satellite maps and the Fuzhou City Master Plan (2011–2021) as the basic data source, the natural green spaces and artificial green spaces were merged into “green space patches” (Figure 12), and the landscape pattern index was calculated by software. Compared with the green planned for 2021, the landscape index of Fuzhou City has changed significantly (Table 9). With the high connectivity of GU Lou District and Tai Jiang District, the patch density decreased from 0.55 to 0.42 and 0.48 to 0.43, respectively, and the Euclidean nearest neighbor distance decreased from 51.04 m to 45.67 m and 93.78 to 86.42, respectively, while the MPS, LSI, MPFD, CONNECT, SHDI, SHEI were all improved.
In Cang Shan District and Jin An District, the patch density decreased from 1.03 to 0.82 and 0.63 to 0.46, respectively, and the ENN decreased from 62.88 m to 56.32 m and 70.48 to 65.67, respectively. On the contrary, the MPS, LSI, MPFD, CONNECT, SHDI, SHEI were increased (Table 10).
4. Discussion
Green space plays an essential role in maintaining a healthy urban ecosystem [52]. At the same time, it can also meet the social and psychological needs of the urban population [53,54]. The lack of effective and comprehensive planning, however, has led to urban expansion that is out of control. Consequentially, a lot of natural green land has been converted into construction land. Natural green space is inevitably occupied in the process of urban development, which is one of the reasons for its decline. This study shows, however, that if green space system planning is initiated, the total area of artificial green space and green space patches could be expanded in the four districts of Fuzhou. This would offset the loss of natural green space due to urban construction. In this sense, green space system planning can improve the existing green space system. As mentioned above, similar results were found by evaluating the construction and optimization of a green space ecological network in the urban fringe of Tongzhou District, Beijing [42].
This study demonstrates that street integration of space syntax can reflect the process of urbanization very well. At the same time, it can identify and reflect the differences in urbanization in the study area, while the impact of urbanization on urban green space fragmentation has temporal variation and spatial heterogeneity [23]. Generally speaking, the urbanization of the central area of Fuzhou City has been very distinct since 2000. Under the guidance of different green planning policies, the temporal and spatial relationship between green space fragmentation and urbanization shows different characteristics. Although the government tries to control the encroachment of urban development on green space, it has failed to achieve its goal. The fragmentation of green space has occurred throughout time as a result of the conflict between the goal of real estate development and the goal of the government’s green space protection. The fragmentation of urban green spaces will not only reduce the health of the urban ecosystem [55], but also adversely affect the quality of life and working environments of the people living there, thereby threatening the sustainability of cities, especially the crowded ones [56]. The decline of the overall landscape index and the increasing fragmentation and complexity of spatial patterns also indicate other problems of green planning in the central area of Fuzhou City, such as the uneven distribution of green spaces and irrational planning.
At the landscape level, the patch density of the four districts in Fuzhou showed an increasing trend, which indicated that the overall green space was highly fragmented. The fragmentation of city green spaces not only reduces the health of the urban ecosystem, but also affects the living and working environment to a certain extent, which is not conducive to the sustainable development of the city, especially in the crowded city. From this point of view, green space system planning has little effect on the improvement of green space. However, as reflected by the increased Shannon’s diversity index of connectivity and the decreased Euclid’s nearest neighbor distance, the green space system planned for 2021 can actually improve the diversity of the landscape. Previous studies have shown that the spatial pattern of urban green space can be improved by focusing on the nature of the green space, the diversity of vegetation morphology, the complexity of shape [57], connecting green spaces to form a green network of multi-functional greenways and green corridors, and strengthening the proximity of nature, human beings, and ecosystem services [58,59]. Therefore, in the process of urbanization, green space system planning has defects, but it plays an important role in the overall ecological of the city.
The plans of city green ecological networks are a response to urban expansion and the reduction of natural areas [53]. These plans include protecting existing green spaces, creating new spatial forms, and restoring and maintaining connectivity between different green spaces [12]. Therefore, after the construction of a green space ecological network, the density of landscape patches in the four districts of Fuzhou City will decrease, which indicates that the degree of landscape fragmentation will also decrease correspondingly. This shows that ecological networks can greatly enhance the connectivity of landscapes. Similar studies have shown that the higher the connectivity of the ecological network, the more beneficial it is to the material cycle and energy flux [23]. Generally speaking, the proper planning of green ecological networks can significantly increase the quantity and quality of the existing green system in Fuzhou City’s urban areas. Further, the existing green patches can become larger, more complex, closer together, and more ecologically diverse. Compared with previous national and international research, this study analyzed urbanization and green space fragmentation in more detail and designed a more reasonable and feasible green space ecological network for Fuzhou City.
5. Conclusions
We first calculated the landscape index of urban space and the degree of road integration and studied the impact of urbanization on the spatial and temporal changes of green space fragmentation in Fuzhou City Center. This study adopts a spatiotemporal perspective, which is helpful to comprehensively understand the spatiotemporal heterogeneity between urban green space patterns and urbanization, which has rarely been discussed in previous literature. Through the research, we draw the following conclusions:
- (1)
- From 2000 to 2020, a large amount of green space is occupied in the process of urbanization, which creates fragmentation;
- (2)
- Analysis of landscape index based on LPI and LSI, urbanization begins in the western region, but gradually continues into the southeast region. In fact, in 2010 this development was relatively rapid. In short, the spatial pattern of urban green space has changed greatly during the study period;
- (3)
- Through the qualitative and quantitative analysis of the green space landscape pattern in the study area, the green space ecological network was optimized. Green space ecological network planning can provide an effective method for the development of green space in Fuzhou and a balance between urban construction and the urban ecological environment that form part of the urbanization in Fuzhou. Therefore, the development of a green space ecological network is an effective form of green space planning that meets the needs of urban society. Green space ecological network planning has been widely applied and recognized as a new and effective method of urban green space system planning.
The research on green space ecological network planning is a long-term undertaking. The planning of green space ecological networks is an effective way to develop green ecological spaces in Fuzhou. It is expected that this study will provide a good reference for the future development of China’s urban green space system and allow other urban areas to investigate the feasibility of a green space ecological network in their local area.
Author Contributions
B.-X.H. contributed to the conceptual design of the study, data collection, drafting the article, and final approval. W.-Y.L. contributed to the conceptual design of the study, and data collection. S.-C.C. contributed to the conceptual design of the study, supervision of the progress, and final approval. All authors have read and agreed to the published version of the manuscript.
Funding
This research was funded by 2020 Fuzhou Philosophy and Social Science Planning Project, grant number 2020FZB21.
Institutional Review Board Statement
Not applicable.
Informed Consent Statement
Not applicable.
Data Availability Statement
Not applicable.
Conflicts of Interest
The authors declare no conflict of interest.
Appendix A

Table A1.
The comparison of landscape metrics on class level of Cang Shan district.
| Cang Shan District | ||||||
|---|---|---|---|---|---|---|
| Landscape Metrics | Natural Green Space | Cultivated Green Space | ||||
| 2000 | 2010 | Planning in 2021 | 2000 | 2010 | Planning in 2021 | |
| CA (ha) | 1280.52 | 795.21 | 582.99 | 120.69 | 678.53 | 1024.19 |
| PD (n/100 ha) | 0.09 | 0.16 | 0.53 | 0.32 | 0.85 | 1.33 |
| ED (m/ha) | 34.54 | 30.15 | 32.85 | 15.05 | 38.08 | 48.98 |
| MPS (ha) | 11.13 | 6.57 | 1.89 | 3.17 | 1.17 | 0.75 |
| MPFD | 1.06 | 1.04 | 1.04 | 1.02 | 1.04 | 1.05 |
Table A2.
The comparison of landscape metrics on class level of Gu Lou district.
| Gu Lou District | ||||||
|---|---|---|---|---|---|---|
| Landscape Metrics | Natural Green Space | Cultivated Green Space | ||||
| 2000 | 2010 | Planning in 2021 | 2000 | 2010 | Planning in 2021 | |
| CA (ha) | 609.64 | 266.40 | 181.31 | 147.61 | 367.33 | 892.59 |
| PD (n/100 ha) | 0.39 | 0.36 | 0.33 | 0.39 | 0.46 | 0.57 |
| ED (m/ha) | 68.57 | 53.10 | 34.69 | 30.87 | 65.79 | 85.81 |
| MPS (ha) | 1.46 | 2.77 | 3.02 | 2.55 | 2.17 | 1.75 |
| MPFD | 1.03 | 1.04 | 1.05 | 1.04 | 1.05 | 1.06 |
Table A3.
The comparison of landscape metrics on class level of Jin An district.
| Jin An District | ||||||
|---|---|---|---|---|---|---|
| Landscape Metrics | Natural Green Space | Cultivated Green Space | ||||
| 2000 | 2010 | Planning in 2021 | 2000 | 2010 | Planning in 2021 | |
| CA (ha) | 545.04 | 307.18 | 204.35 | 88.55 | 217.75 | 342.4 |
| PD (n/100 ha) | 0.16 | 0.79 | 0.58 | 0.26 | 0.36 | 0.65 |
| ED (m/ha) | 36.79 | 14.48 | 30.82 | 17.89 | 25.16 | 30.65 |
| MPS (ha) | 6.26 | 1.26 | 1.72 | 3.85 | 2.79 | 1.54 |
| MPFD | 1.04 | 1.04 | 1.05 | 1.04 | 1.04 | 1.05 |
Table A4.
The comparison of landscape metrics on class level of Tai Jiang district.
| Tai Jiang District | ||||||
|---|---|---|---|---|---|---|
| Landscape Metrics | Natural Green Space | Cultivated Green Space | ||||
| 2000 | 2010 | Planning in 2021 | 2000 | 2010 | Planning in 2021 | |
| CA (ha) | 20.16 | 13.15 | 11.49 | 12.32 | 17.94 | 24.25 |
| PD (n/100 ha) | 0.28 | 0.38 | 0.57 | 0.48 | 0.42 | 0.41 |
| ED (m/ha) | 11.15 | 12.10 | 12.98 | 8.41 | 17.44 | 21.41 |
| MPS (ha) | 3.36 | 2.63 | 1.91 | 1.37 | 2.24 | 3.03 |
| MPFD | 1.03 | 1.01 | 1.03 | 1.04 | 1.03 | 1.05 |
Table A5.
Landscape metrics on landscape level of Cang Shan, Gu Lou, Tai Jiang, and Jin An district.
Table A5.
Landscape metrics on landscape level of Cang Shan, Gu Lou, Tai Jiang, and Jin An district.
| Landscape Metrics | Cang Shan District | Gu Lou District | Tai Jiang District | Jin An District | ||||||||
|---|---|---|---|---|---|---|---|---|---|---|---|---|
| 2000 | 2010 | Planning in 2021 | 2000 | 2010 | Planning in 2021 | 2000 | 2010 | Planning in 2021 | 2000 | 2010 | Planning in 2021 | |
| CA (ha) | 1401.21 | 1473.74 | 1607.18 | 757.25 | 633.73 | 1073.90 | 32.48 | 31.09 | 35.74 | 633.59 | 524.93 | 546.75 |
| PD (n/100 ha) | 0.11 | 0.48 | 1.03 | 0.39 | 0.42 | 0.53 | 0.36 | 0.39 | 0.48 | 0.17 | 0.61 | 0.63 |
| ED (m/ha) | 4.73 | 39.3 | 44.25 | 28.06 | 82.3 | 89.72 | 5.65 | 9.25 | 85.44 | 53.98 | 64.35 | 68.71 |
| MPS (ha) | 9.09 | 2.10 | 0.96 | 2.53 | 2.39 | 1.88 | 2.71 | 2.59 | 2.23 | 5.76 | 1.64 | 1.59 |
| LSI | 34.8 | 37.1 | 56.29 | 22.82 | 31 | 42.09 | 32.56 | 16.98 | 19.23 | 25.89 | 31.86 | 39.2 |
| SHDI | 0.06 | 0.29 | 0.69 | 0.21 | 0.55 | 0.68 | 0.26 | 0.46 | 0.63 | 0.57 | 0.63 | 0.68 |
| SHEI | 0.08 | 0.43 | 0.99 | 0.31 | 0.79 | 0.98 | 0.38 | 0.54 | 0.91 | 0.82 | 0.87 | 0.99 |
| MPFD | 1.04 | 1.04 | 1.05 | 1.04 | 1.04 | 1.05 | 1.03 | 1.03 | 1.04 | 1.04 | 1.04 | 1.05 |
| ENN(m) | 100 | 89.5 | 62.88 | 82.03 | 69.7 | 51.04 | 102.56 | 99.12 | 93.78 | 85.58 | 76.8 | 70.48 |
| CONNECT | 1.54 | 1.87 | 2.33 | 1.08 | 2.26 | 2.49 | 4.64 | 5.67 | 6.39 | 1.22 | 1.92 | 2.32 |
References
- McDonnell, M.J.; Pickett, S.; Groffman, P.; Bohlen, P. Ecosystem processes alongan urban-to-rural gradient. Urban Ecol. 1997, 1, 21–36. [Google Scholar] [CrossRef]
- Pickett, S.T.A.; Cadenasso, M.L.; Grove, J.M.; Nilon, C.H.; Pouyat, R.V.; Zipperer, W.C.; Costanza, R. Urban ecological systems: Linking terrestrial ecological, physical, and socioeconomic components of metropolitan areas. Annu. Rev. Ecol. Systemat. 2001, 32, 127–157. [Google Scholar] [CrossRef] [Green Version]
- Luck, M.; Wu, J. A gradient analysis of urban landscape pattern: A case study from the Phoenix metropolitan region, Arizona, USA. Landsc. Ecol. 2002, 17, 327–339. [Google Scholar] [CrossRef]
- Yu, D.; Xun, B.; Shi, P.; Shao, H.; Liu, Y. Ecological restoration planning based on connectivity in an urban area. Ecol. Eng. 2012, 46, 24–33. [Google Scholar] [CrossRef]
- Hillier, B. Space is the Machine: A Configurational Theory of Architecture, 3rd ed.; Yang, T., Wang, X., Zhang, J., Eds.; Architecture & Building Press: Beijing, China, 2008. [Google Scholar]
- He, Z.-Z.; Qiu, G.-C.; Yang, Z. Research of Xiamen urban morphology development based on space syntax analysis urban plan. Landsc. Archit. Virescence 2007, 25, 106–108. [Google Scholar]
- Jose, J.L. Socio Spatial segregation and urban form: Belem at the end of the 1990s. Geoforum 2001, 32, 493–507. [Google Scholar]
- Zhang, R.; Zhang, L.; Zhong, Q.; Zhang, Q.; Ji, Y.; Song, P.; Wang, Q. An optimized evaluation method of an urban ecological network: The case of the Minhang District of Shanghai. Urban For. Urban Green. 2021, 62, 1271. [Google Scholar] [CrossRef]
- Jongman, R.H.G. Ecological network are an issue for all of us. Landsc. Ecol. 2008, 1, 7–13. [Google Scholar] [CrossRef] [Green Version]
- Zhao, S.; Ma, Y.; Wang, J.; Youa, X. Landscape pattern analysis and ecological network planning of Tianjin City. Urban For. Urban Green. 2019, 46, 126479. [Google Scholar] [CrossRef]
- McHugh, A.N.; Thompson, S. A rapid ecological network assessment tool and its use in locating habitat extension areas in a changing landscape. Nat. Conserv. 2011, 19, 236–244. [Google Scholar] [CrossRef]
- Kong, F.; Yin, H.; Nakagoshi, N.; Zong, Y. Urban green space network development for biodiversity conservation: Identification based on graph theory and gravity modeling. Landsc. Urban Plann. 2009, 95, 16–27. [Google Scholar] [CrossRef]
- Kong, F.; Yin, H. Developing green space ecological networks in Jinan City. Acta Ecol. Sin. 2008, 28, 1711–1719. [Google Scholar]
- Yin, H.; Kong, F.; Qi, Y.; Wang, H.; Zhou, Y.; Qin, Z. Developing and optimizing ecological networks in urban agglomeration of Hunan Province, China. Acta Ecol. Sin. 2011, 31, 2863–2874. [Google Scholar]
- George, L.; Sarah, B.; Jonathan, L.A.; Kurt, R.; Elbroch, M. Testing GIS-generated least-cost path predictions for Martes pennanti (Fisher) and its application for identifying mammalian road-crossings in northern New Hampshire. Northeast. Nat. 2012, 19, 147–156. [Google Scholar]
- Chang, X.; Wang, Y.; Li, Z. Landscape pattern optimization based upon the concept of landscape functions network: A case study in Taiwan, China. Acta Ecol. Sin. 2005, 25, 1707–1713. [Google Scholar]
- Zhang, L.; Su, L.; Wang, J.; Chen, M. Establishment of ecological network based on landscape ecology in Anshan. Chin. J. Ecol. 2014, 33, 1337–1343. [Google Scholar]
- Zhou, Y.; Zhang, Q. Impacts of road networks on species migration and landscape connectivity. Chin. J. Ecol. 2014, 33, 440–446. [Google Scholar]
- Chen, C.; Wu, S.; Meurk, C.D.; Lu, M.; Wen, Z.; Jiang, Y.; Chen, J. Effects of changing cost values on landscape connectivity simulation. Acta Ecol. Sin. 2015, 35, 7367–7376. [Google Scholar]
- Hepcan, S.; Hepcana, C.C.; Bouwmab, I.M.; Jongman, R.H.G.; Özkana, M.B. Ecological networks as a new approach for nature conservation in Turkey: A case study of lzmir Province. Landsc. Urban Plan. 2009, 90, 143–154. [Google Scholar] [CrossRef]
- Tian, Y.H.; Jim, C.Y.; Tao, Y.; Shi, T. Landscape ecological assessment of green space fragmentation in Hong Kong. Urban For. Urban Green 2011, 10, 79–86. [Google Scholar] [CrossRef]
- Comber, A.; Brunsdon, C.; Green, E. Using a GIS-based network analysis to determine urban greenspace accessibility for different ethnic and religious groups. Landsc. Urban Plan. 2008, 86, 103–114. [Google Scholar] [CrossRef] [Green Version]
- Zhang, L.Q.; Wang, H.Z. Planning an ecological network of Xiamen Island (China) using landscape metrics and network analysis. Landsc. Urban Plan. 2006, 78, 449–456. [Google Scholar] [CrossRef]
- Alvey, A. Promoting and preserving biodiversity in the urban forest. Urban Urban Green 2006, 5, 195–201. [Google Scholar] [CrossRef]
- Carlier, J.; Moran, J. Landscape typology and ecological connectivity assess ment to inform Greenway design. Sci. Total Environ. 2019, 651, 3241–3252. [Google Scholar] [CrossRef] [PubMed]
- Mõisja, K.; Uuemaa, E.; Oja, T. Integrating small-scale landscape elements into land use/cover: The impact on landscape metrics’ values. Ecol. Indic. 2016, 67, 714–722. [Google Scholar] [CrossRef]
- Weber, T.; Sloan, A.; Wolf, J. Maryland’s green infrastructure assessment: Development of a comprehensive approach to land conservation. Landsc. Urban Plan. 2006, 77, 94–110. [Google Scholar] [CrossRef]
- Li, H.; Chen, W.; He, W. Planning of Green Space Ecological Network in Urban Areas: An Example of Nanchang, China. Int. J. Environ. Res. Public Health 2015, 12, 12889–12904. [Google Scholar] [CrossRef] [Green Version]
- Cook, E.A. Landscape structure indices for assessing urban ecological networks. Landsc. Urban Plan. 2002, 58, 269–280. [Google Scholar] [CrossRef]
- Cai, Y.-B. Study on Spatial Pattern of Urban Green Space in Fuzhou. 2019. Available online: https://www.360kuai.com/pc/99c4965c3f2575f53?cota=4&kuai_so=1&tj_url=so_rec&sign=360_7bc3b157 (accessed on 21 November 2019).
- Chetty, R.; Hendren, N.; Kline, P. Where is The Land of Opportunity? The Geography of Intergenerational Mobility in the United States. Q. J. Econ. 2014, 129, 1553–1623. [Google Scholar] [CrossRef] [Green Version]
- Jiang, B.; Claramunt, C.B. Integration of space syntax into GIS: New perspectives for urban morphology. Trans. GIS 2002, 6, 295–309. [Google Scholar] [CrossRef]
- Kim, H.-K.; Dong, W.-S. An analysis of the relationship between land use density of office configuration. Cities 2002, 19, 409–418. [Google Scholar] [CrossRef]
- Porras, R.; Takeshita, T.; Ikezoe, M. A study on the pedestrian space applying space syntax and the segment unit. J. Asian Archit. Build. Eng. 2002, 1, 197–203. [Google Scholar] [CrossRef]
- Raford, N.; Ragland, D.R. Space Syntax: An Innovative Pedestrian Volume Modeling Tool for Pedestrian Safety; Safe Transportation Research & Education Center: Berkeley, CA, USA, 2003; Available online: https://escholarship.org/uc/item/50m064zp (accessed on 11 December 2003).
- Hillier, B.; Hanson, J. The Social Logic of Space; Cambridge University Press: Cambridge, UK, 1984. [Google Scholar]
- Hillier, B. Space is the machine: A configurational theory of architecture. J. Urban Des. 2007, 3, 333–335. [Google Scholar]
- Geneletti, D. Using spatial indicators and value functions to assess ecosystem fragmentation caused by linear infrastructures. Int. J. Appl. Earth Obs. Geoinf 2004, 5, 1–15. [Google Scholar] [CrossRef]
- Yee, A.M. Space Syntax: A Very Short Introduction; Institute of Architecture Shenzhen University: Shenzhen, China, 3 September 2014. [Google Scholar]
- DepthmapX: Visual and Spatial Network Analysis Software. Available online: https://www.ucl.ac.uk/bartlett/architecture/research/space-syntax/depthmapx (accessed on 21 November 2019).
- Geospatial Data Cloud. Available online: http://www.gscloud.cn (accessed on 23 May 2021).
- Liu, C.; Jia, W.; Lu, S.; Lv, S. Construction and optimization of green space ecological networks in urban fringe areas: A case study with the urban fringe area of Tongzhou district in Beijing. J. Clean. Prod. 2020, 276, 124266. [Google Scholar]
- Conine, A.; Xiang, W.N.; Young, J.; Whitley, D. Planning for multipurpose greenways in Concord, North Carolina. Landsc. Urban Plan. 2004, 68, 271–287. [Google Scholar] [CrossRef]
- Kong, F.H.; Yin, H.W.; Nakagoshi, N. Using GIS and landscape metrics in the hedonic price modeling of the amenity value of urban green space—A case study in Jinan City, China. Landsc. Urban Plan. 2007, 79, 240–252. [Google Scholar] [CrossRef]
- Garigal, K.M. FRAGSTATS HELP; Department of Environmental Conservation University of Massachusetts: Amherst, MA, USA, 2015. [Google Scholar]
- Xu, J. Graph Theory and Its Application; China University of science and Technology Press: Hefei, China, 2004. [Google Scholar]
- Haggett, P.; Chorley, R.J. Network Analysis in Geography; Edward Arnold: London, UK, 1972. [Google Scholar]
- Wang, H.-Z. Urban Ecological Network Research; East China Normal University Press: Shanghai, China, 2005. [Google Scholar]
- Forman, R.T.T.; Godron, M. Landscape Ecology; Wiley: New York, NY, USA, 1986. [Google Scholar]
- Dalton, R.; Garlick, J.; Minshull, R.; Robinson, A. Networks in Geography; Phillip: London, UK, 1973. [Google Scholar]
- Li, Y.-F.; Liu, G.-H. Characterizing Spatiotemporal Pattern of Land Use Change and Its Driving Force Based on GIS and Landscape Analysis Techniques in Tianjin during 2000–2015. Sustainability 2017, 9, 894. [Google Scholar] [CrossRef] [Green Version]
- Xie, H.L.; Liu, Z.F.; Wang, P.; Liu, G.Y.; Lu, F.C. Exploring the mechanisms of ecological land change based on the spatial autoregressive model: A case study of the Poyang Lake Eco-Economic Zone, China. Int. J. Environ. Res. Public Health 2014, 11, 583–599. [Google Scholar] [CrossRef]
- Ignatieva, M.; Stewart, G.H.; Meurk, C. Planning and design of ecological networks in urban areas. Landsc. Ecol. Eng. 2011, 7, 17–25. [Google Scholar] [CrossRef]
- Hitchings, R. Studying the preoccupations that prevent people from going into green space. Landsc. Urban Plan. 2013, 118, 98–102. [Google Scholar] [CrossRef] [Green Version]
- Zeng, H.; Wu, X.B. Utilities of edge-based metrics for studying landscape fragmentation. Comput. Environ. Urban Syst. 2005, 29, 159–178. [Google Scholar] [CrossRef]
- Jaeger, J.A.G.; Bertiller, R.; Schwick, C.; Müller, K.; Steinmeier, C.; Ewald, K.C.; Ghazoul, J. Implementing landscape fragmentation as an indicator in the Swiss monitoring system of sustainable development (MONET). J. Environ. Manag. 2008, 88, 737–751. [Google Scholar] [CrossRef] [PubMed]
- Tian, Y.; Jim, C.Y. Development potentials of sky gardens in the compact city of Hong Kong. Urban For. Urban Green. 2012, 11, 223–233. [Google Scholar] [CrossRef]
- Tian, Y.H.; Jim, C.Y.; Tao, Y. Challenges and strategies for greening the compact city of Hong Kong. J. Urban Plan. Dev. 2012, 138, 101–109. [Google Scholar] [CrossRef]
- Fuller, R.A.; Irvine, K.N.; Devine-Wright, R.; Gaston, K.J. Psychological benefits of greenspace increase with biodiversity. Biol. Lett. 2007, 3, 390–394. [Google Scholar] [CrossRef]
Figure 1.
Remote sensing image of Fuzhou: (a) district scope of study; (b) scope of study.

Figure 2.
Examples of the common networks (a–f) by Hellmund.

Figure 3.
Street global integration in the central area of Fuzhou City: (a) Street global integration of 2000; (b) Street global integra Table 2010. (c) Street global integration of 2021. The red line is the most integrated street; the green line is the least integrated street.
Figure 3.
Street global integration in the central area of Fuzhou City: (a) Street global integration of 2000; (b) Street global integra Table 2010. (c) Street global integration of 2021. The red line is the most integrated street; the green line is the least integrated street.

Figure 4.
Urbanization intensity in Fuzhou (street global integration: (a) Urbanization intensity in 2000; (b) Urbanization intensity in 2010; (c) Urbanization intensity in 2021. Red represents the highest level of integration; green represents the lowest.
Figure 4.
Urbanization intensity in Fuzhou (street global integration: (a) Urbanization intensity in 2000; (b) Urbanization intensity in 2010; (c) Urbanization intensity in 2021. Red represents the highest level of integration; green represents the lowest.

Figure 5.
land use of Fuzhou: (a) land use of 2000; (b) land use of 2010; (c) land use of 2021.

Figure 6.
Map of LPI change in the central area of Fuzhou City: (a) landscape patch index of 2000; (b) landscape patch index of 2010; (c) landscape patch index of 2021. Red is the high LPI value, blue is the low LPI value.
Figure 6.
Map of LPI change in the central area of Fuzhou City: (a) landscape patch index of 2000; (b) landscape patch index of 2010; (c) landscape patch index of 2021. Red is the high LPI value, blue is the low LPI value.

Figure 7.
LSI change in the central area of Fuzhou City: (a) landscape shape index of 2000; (b) landscape shape index of 2010; (c) landscape shape index 2021. Red is the high LSI value; blue is the low LSI value.
Figure 7.
LSI change in the central area of Fuzhou City: (a) landscape shape index of 2000; (b) landscape shape index of 2010; (c) landscape shape index 2021. Red is the high LSI value; blue is the low LSI value.

Figure 8.
Green space of Fuzhou: (a) green space in 2000; (b) green space in 2010; (c) green space in 2021.
Figure 8.
Green space of Fuzhou: (a) green space in 2000; (b) green space in 2010; (c) green space in 2021.

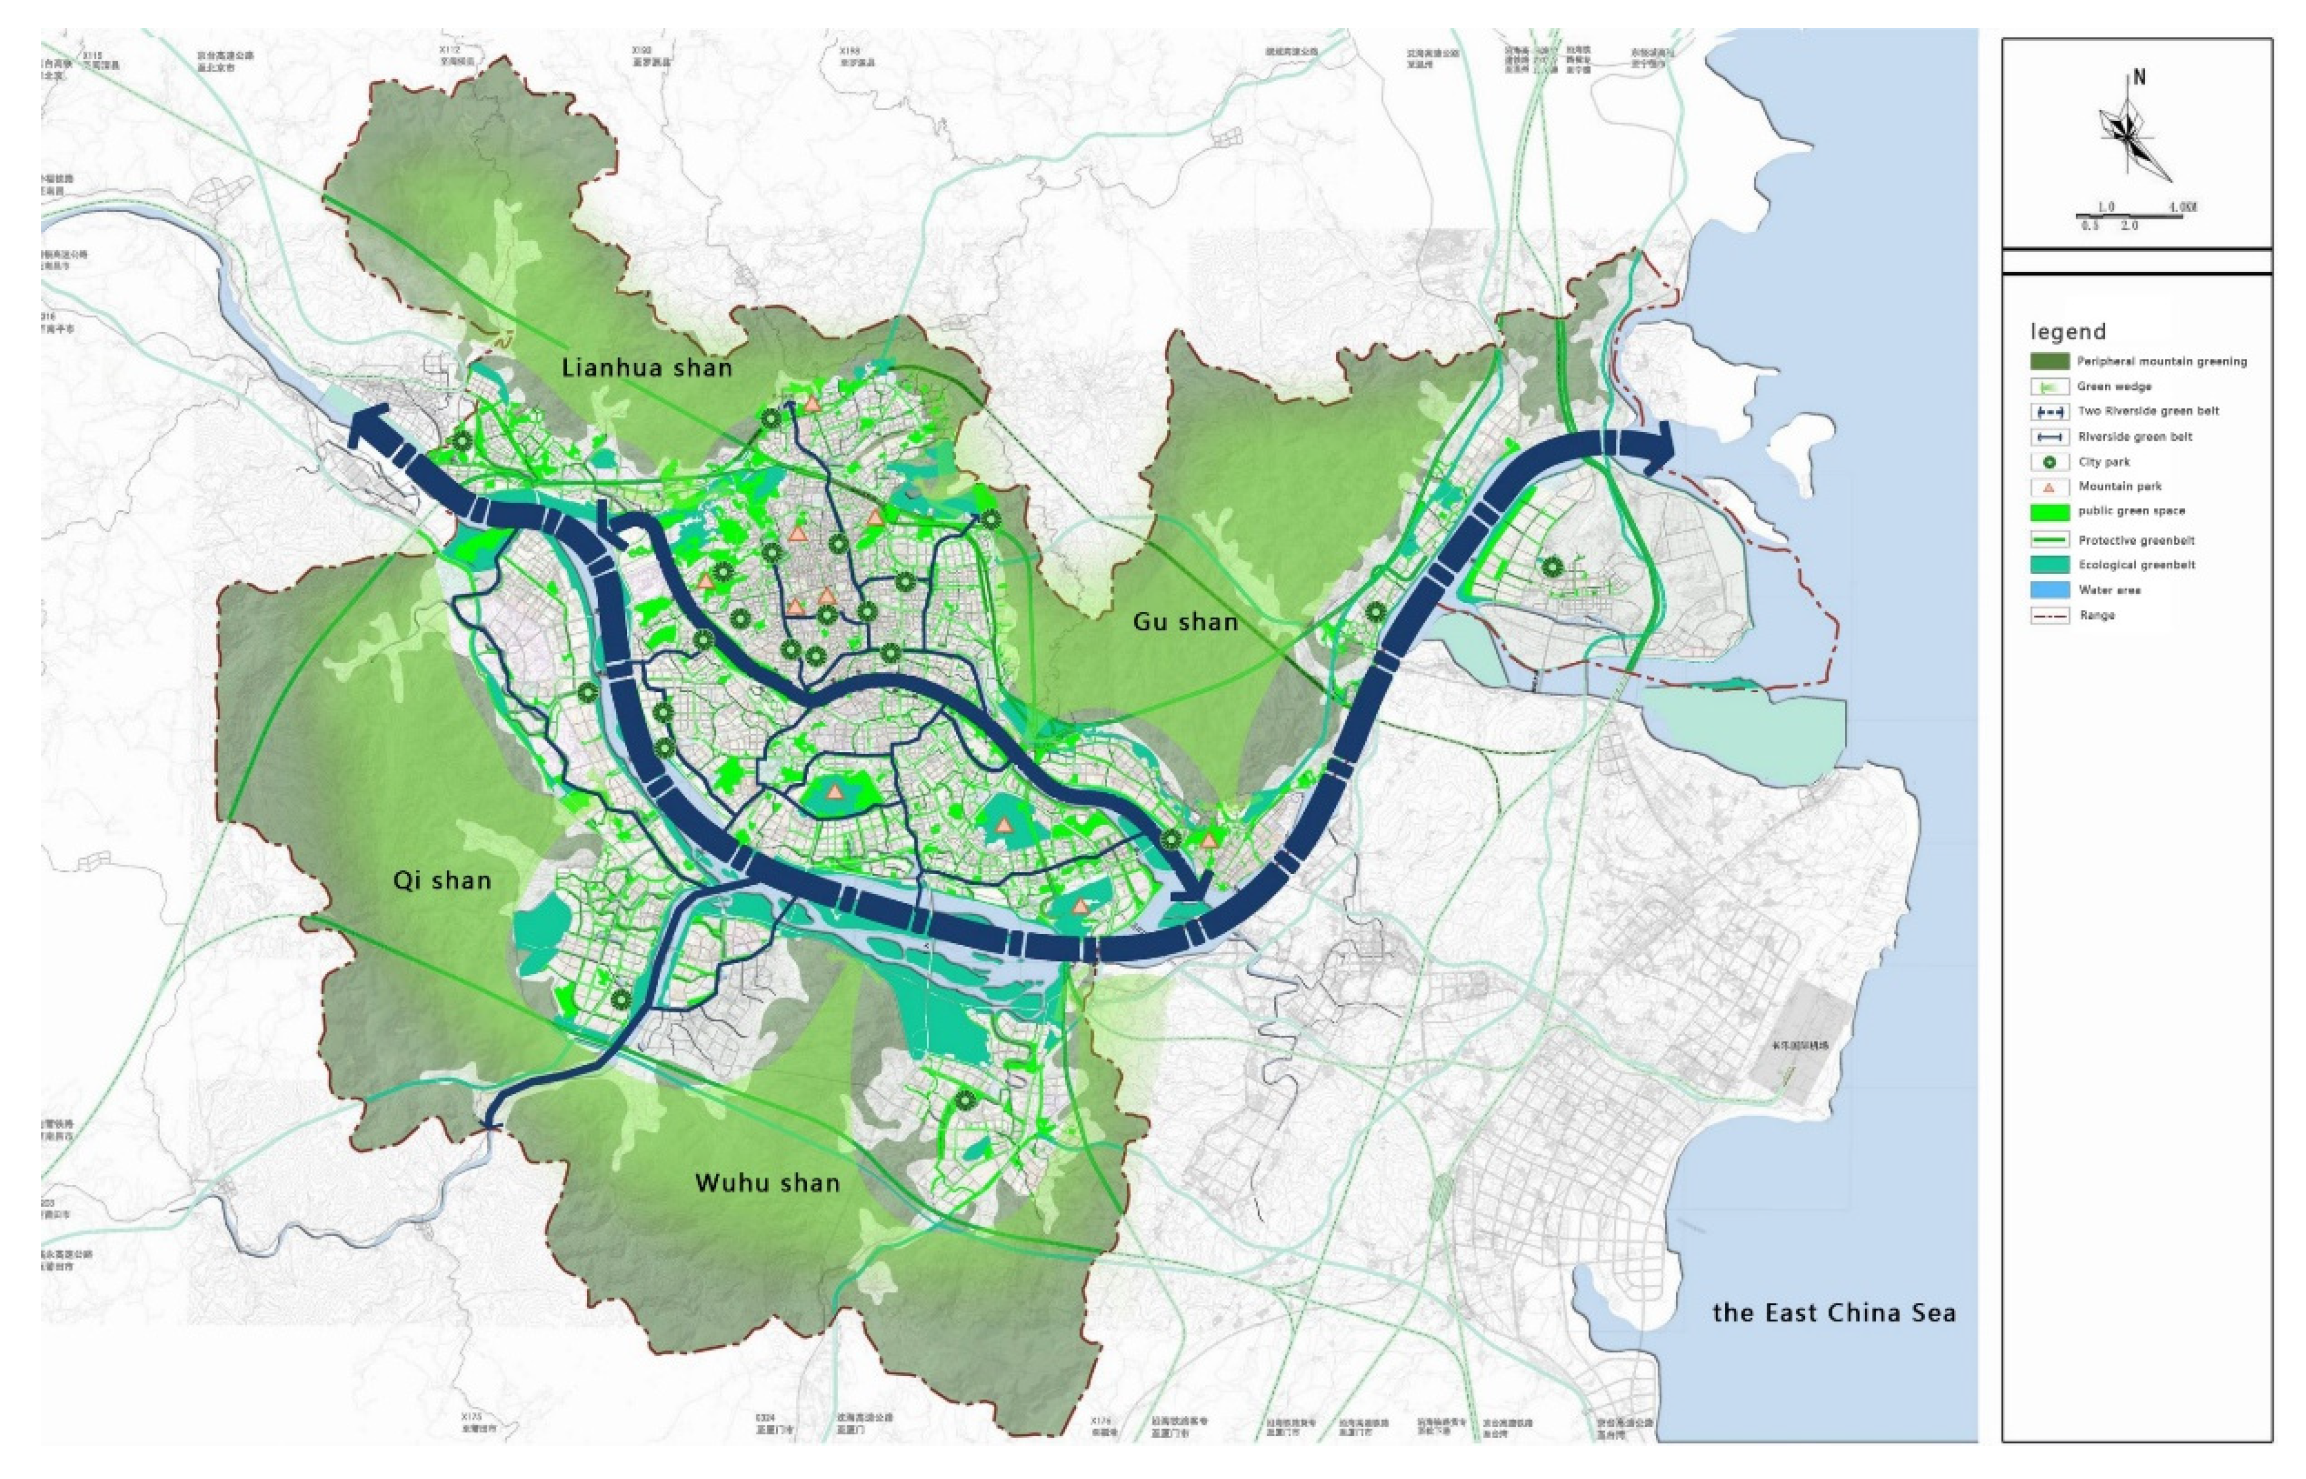
Figure 9.
Planning diagram of green space system in Fuzhou city center (2011–2021).

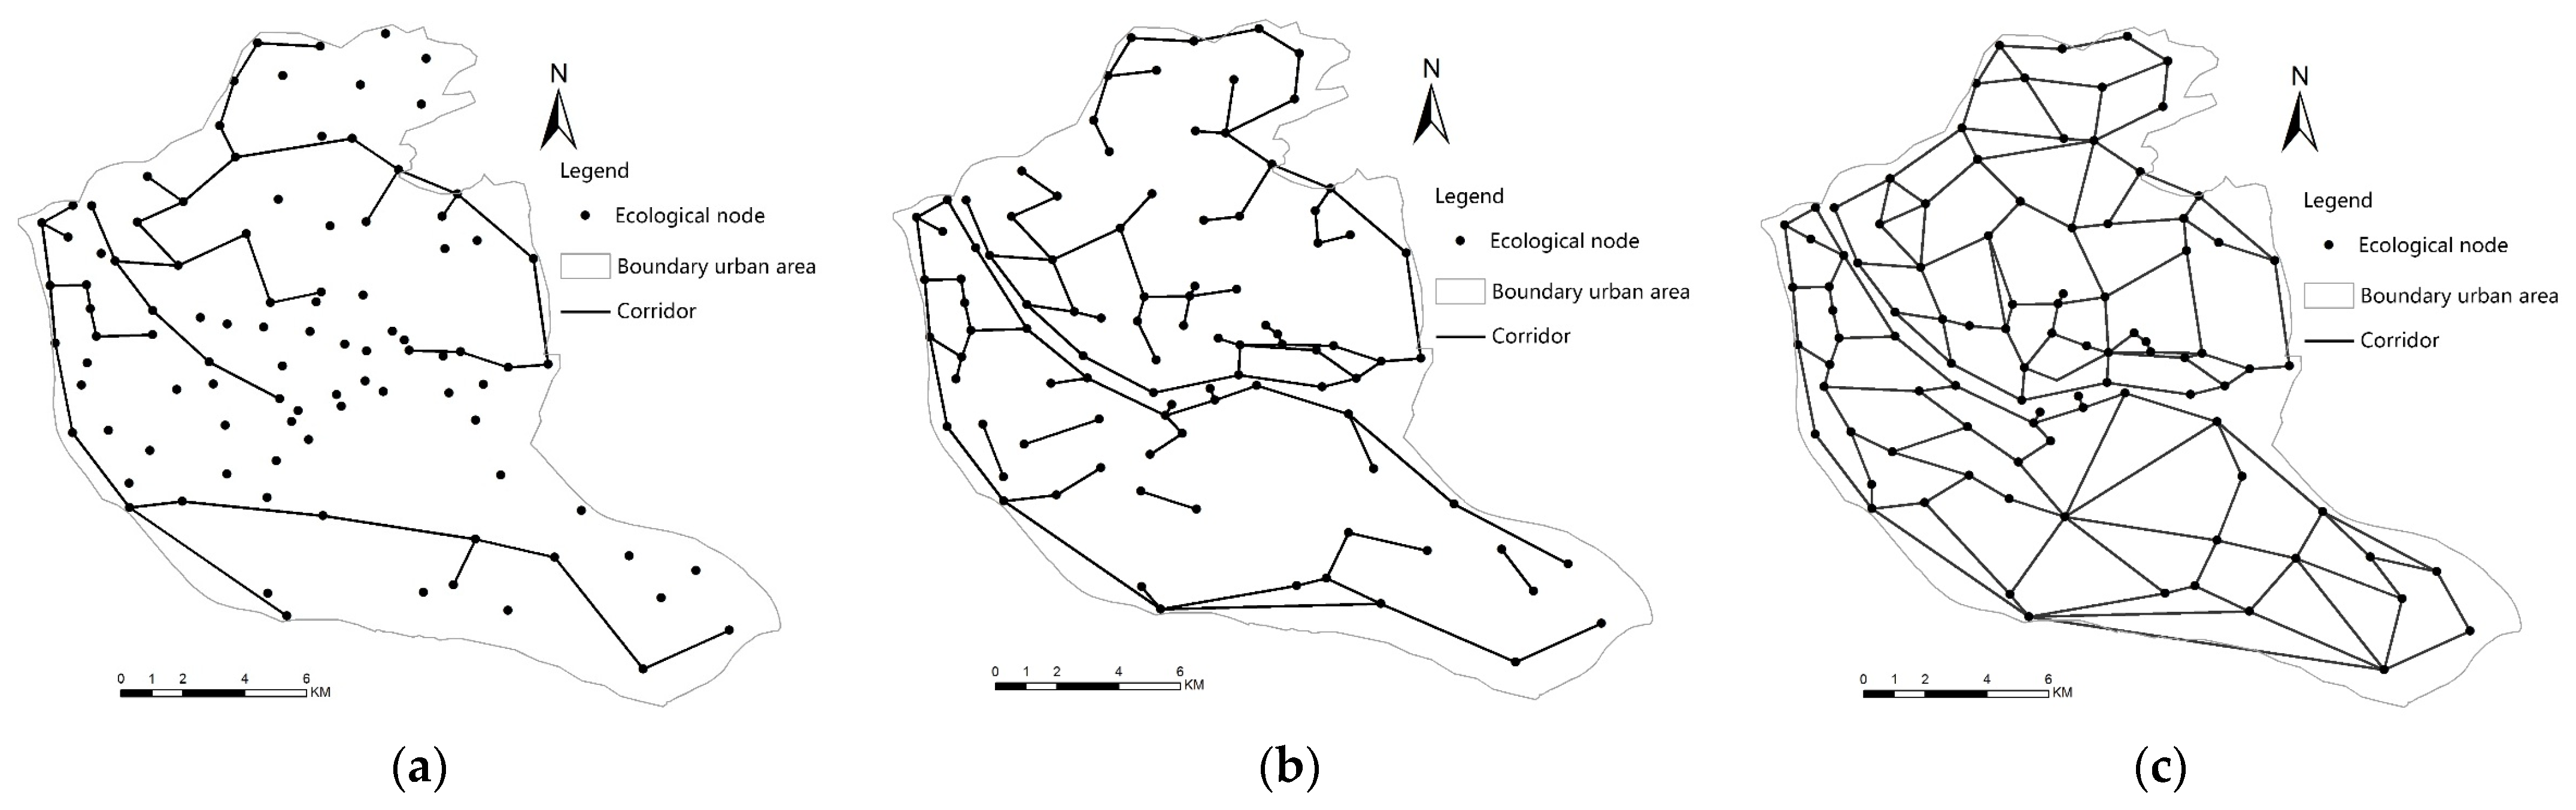
Figure 10.
Fuzhou green space ecological network plan sketch: (a) network I; (b) network II; (c) network III.
Figure 10.
Fuzhou green space ecological network plan sketch: (a) network I; (b) network II; (c) network III.

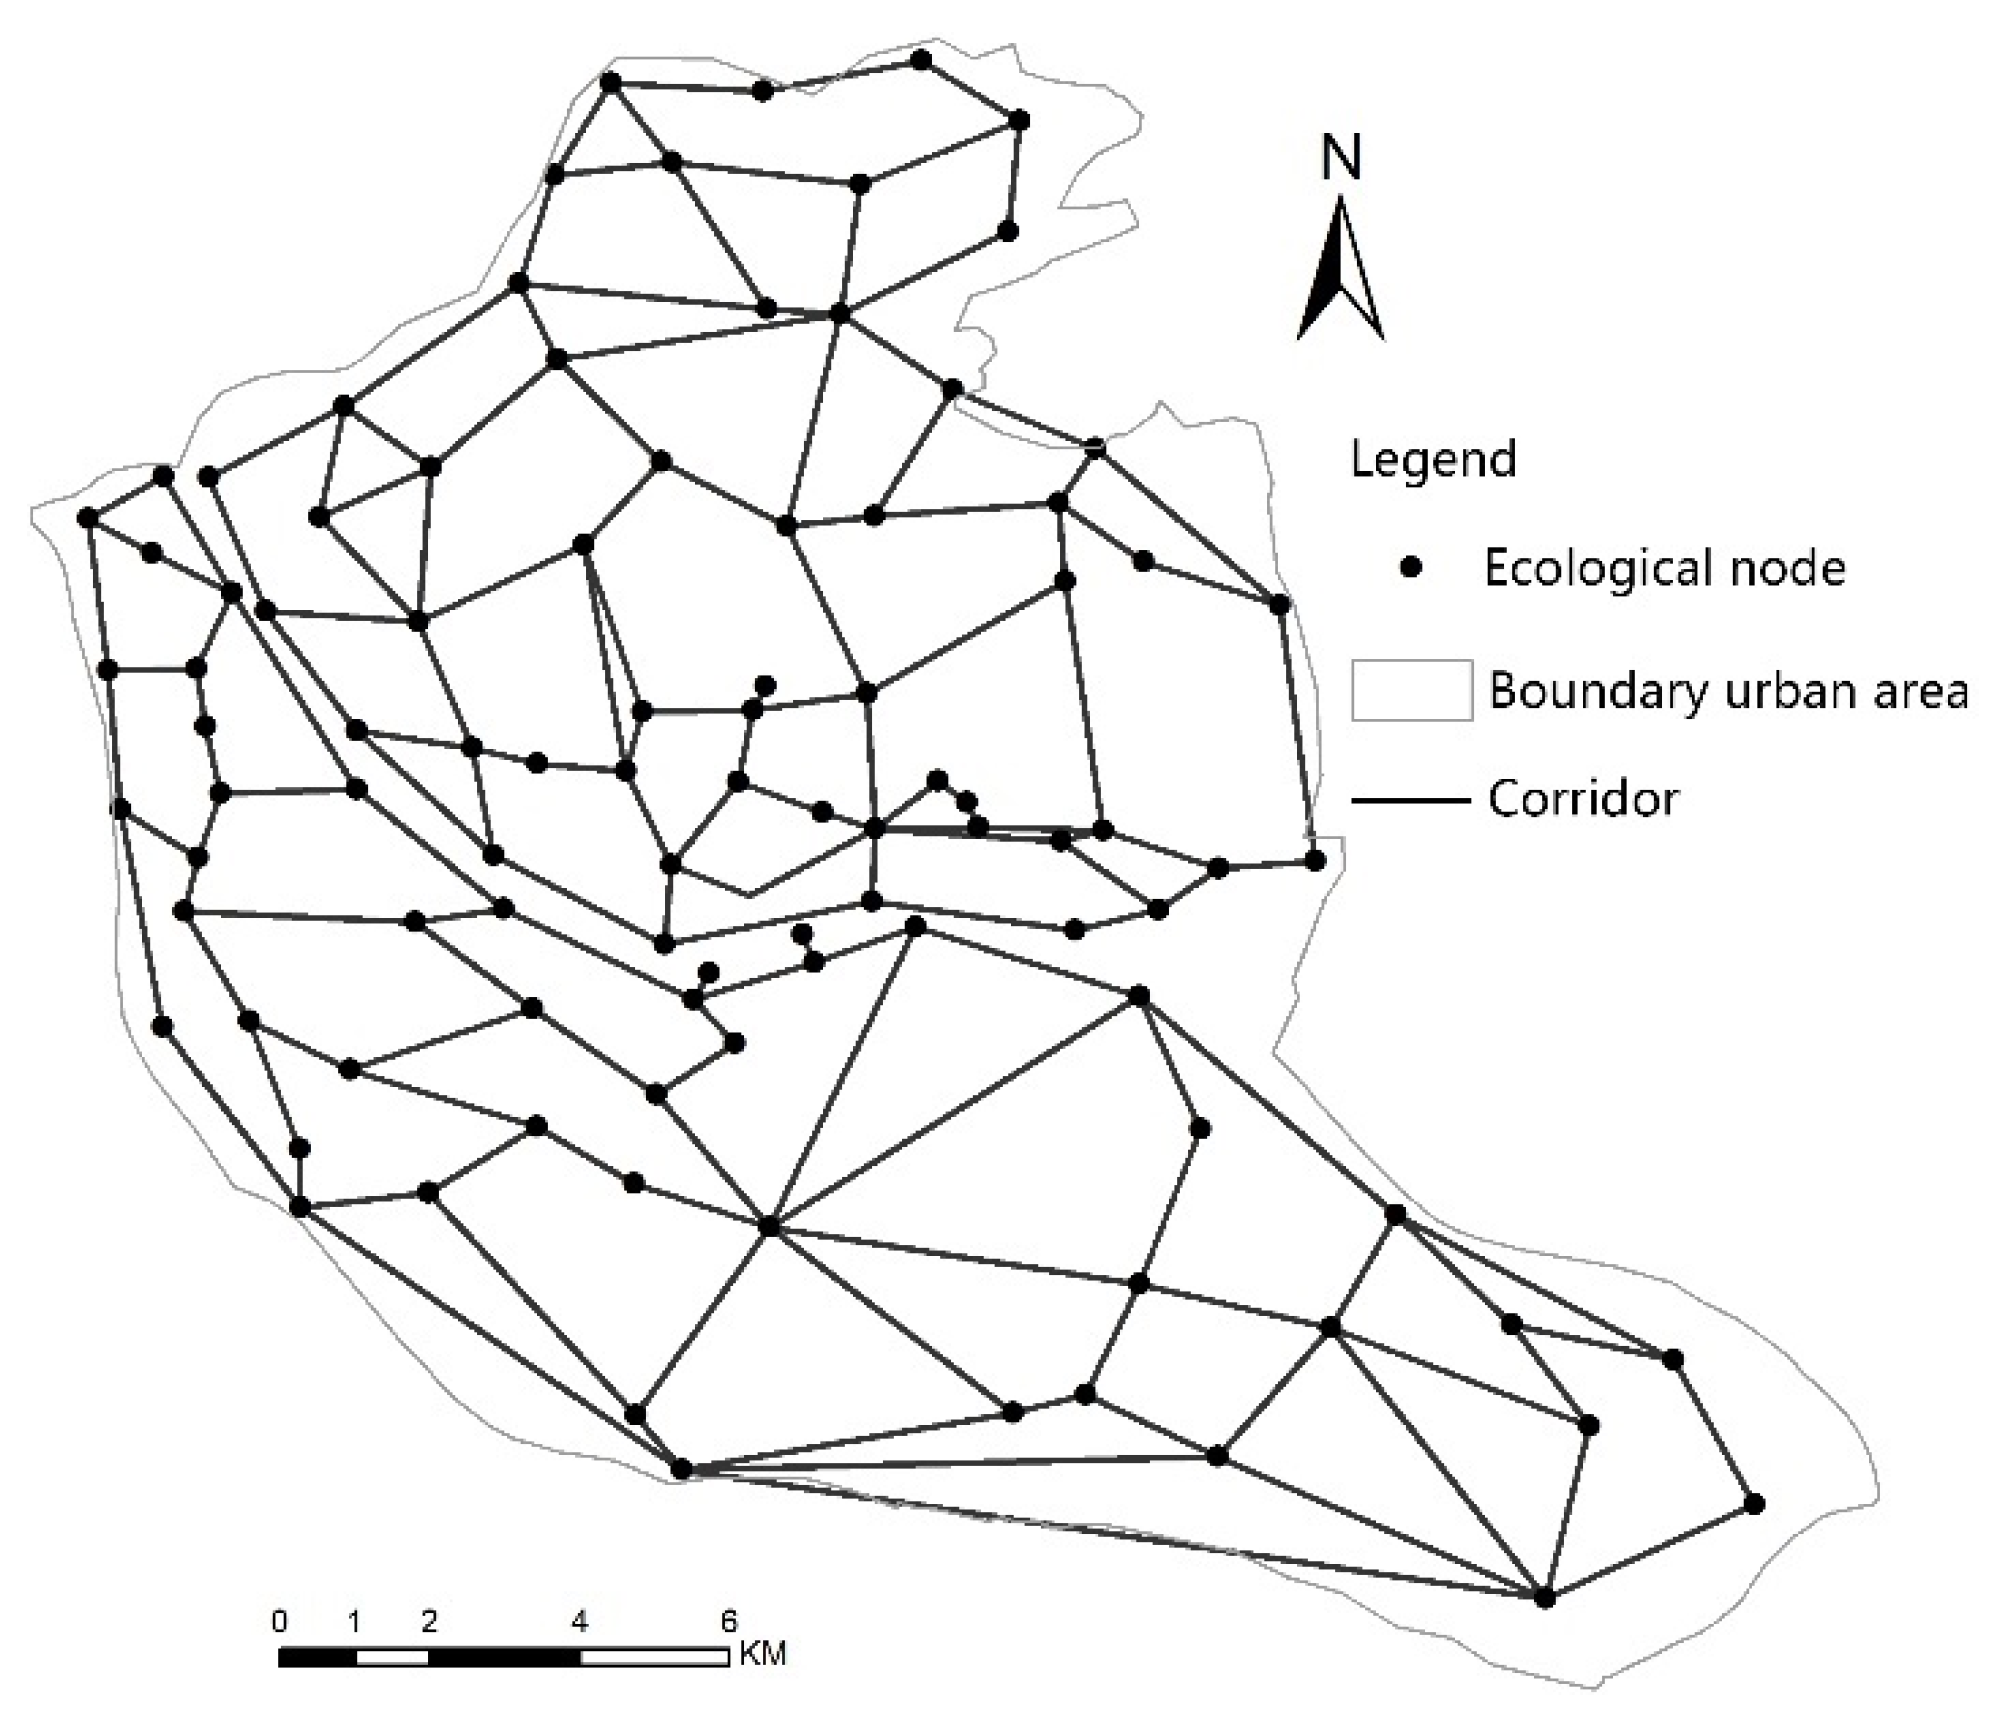
Figure 11.
Distribution of ecological nodes and corridors in Fuzhou City.

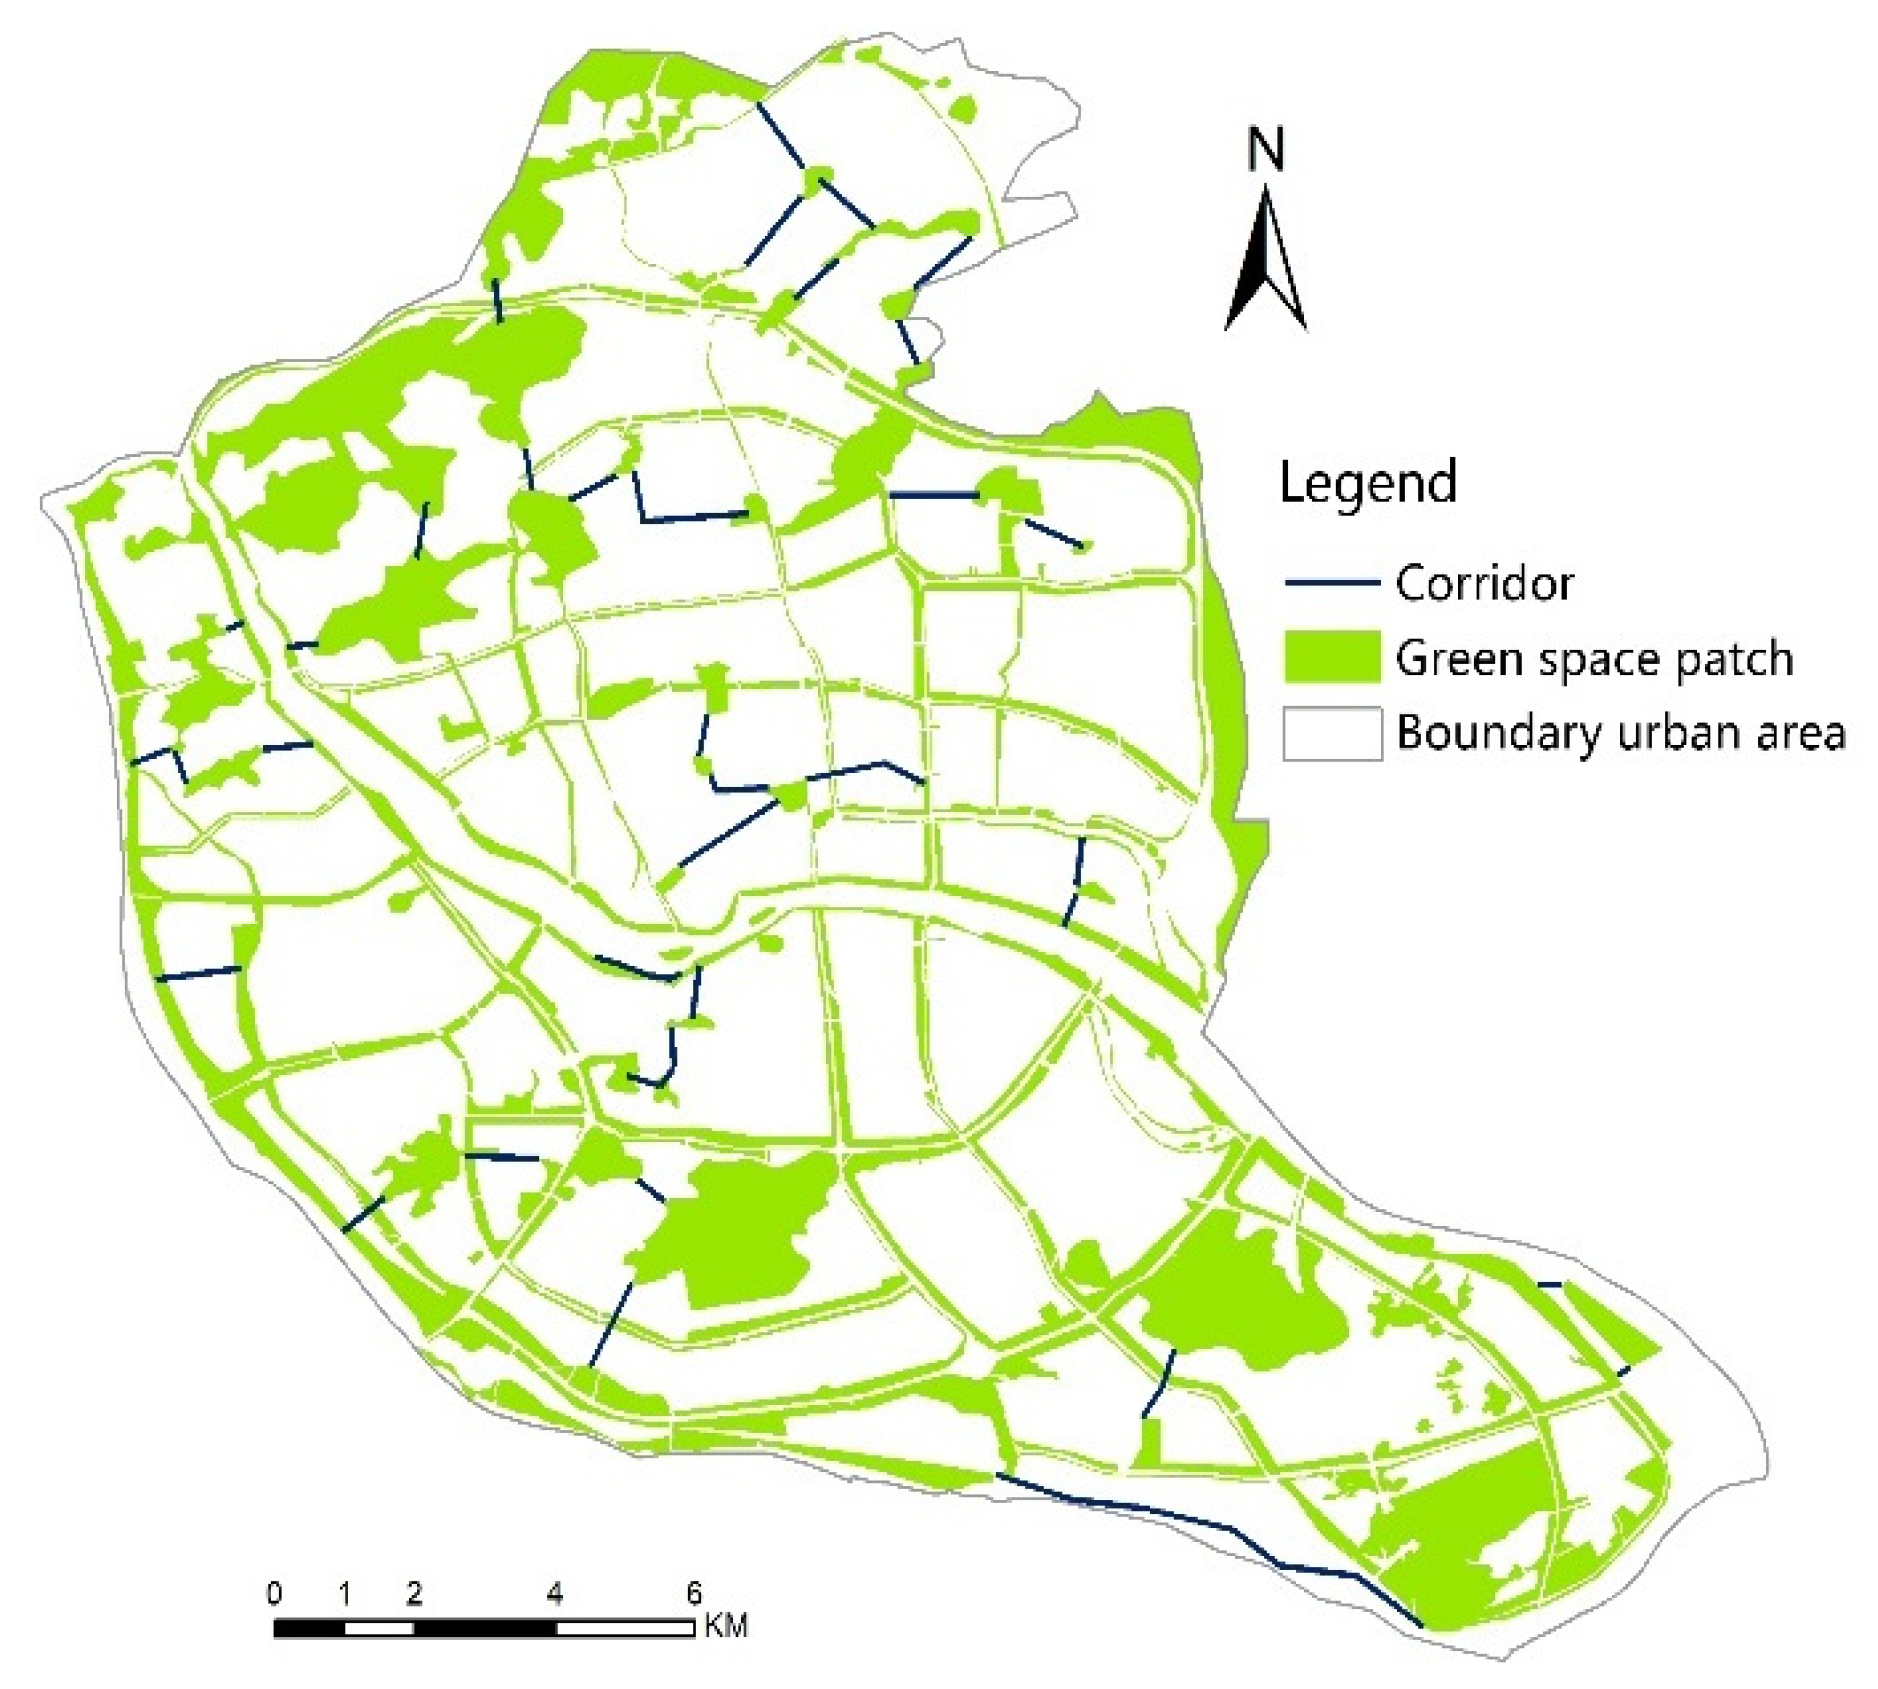
Figure 12.
Network planning of ecological green space in Fuzhou City.

Table 1.
Descriptions of landscape metrics [45].
Table 1.
Descriptions of landscape metrics [45].
| Landscape Metrics (Abbreviation) | Description | Expression |
|---|---|---|
| Class area (CA) | CA equals the sum of the areas (m2) of all patches of the corresponding patch type, divided by 10,000 (to convert to hectares); that is, total class area. | |
| Patch density (PD) | The number of patches per 100 ha. It is a simple measure of the fragmentation of the patch type. | × 1,000,000 |
| Edge density (ED) | ED equals the sum of the lengths (m) of all edge segments in the landscape, divided by the total landscape area (m2), multiplied by 10,000 (to convert to hectares). | × 10,000 |
| Mean patch size (MPS) | The area occupied by a particular patch type divided by the number of patches of that type. It is a simple measure of the fragmentation of the patch type. | |
| Shannon’s diversity index (SHDI) | SHDI equals minus the sum, across all patch types, of the proportional abundance of each patch type multiplied by that proportion. | |
| Shannon’s evenness index (SHEI) | SHEI equals minus the sum, across all patch types, of the proportional abundance of each patch type multiplied by that proportion, divided by the logarithm of the number of patch types. | |
| Landscape Shape Index (LSI) | Landscape shape index provides a standardized measure of total edge or edge density that adjusts for the size of the landscape. | |
| Mean fractal dimension index (MPFD) | In landscape ecological research, patch shapes are frequently characterized via the fractal dimension of the object. | |
| Euclidean Nearest-Neighbor Distance (ENN) | ENN equals the distance (m) to the nearest neighboring patch of the same type, based on shortest edge-to-edge distance. | |
| Connectance Index (CONNECT) | CONNECT equals the number of functional joining between all patches of the corresponding patch type divided by the total number of possible joining between all patches of the corresponding patch type, multiplied by 100 to convert to a percentage. | CONNECT = |
| Largest patch index (LPI) | LPI is calculated as the area of the largest patch divided by the total landscape area, multiplied by 100. | , |
Table 2.
Network structure index calculation.
| Index | Meaning | Calculation Formula | Analysis of Calculation Results | Notes |
|---|---|---|---|---|
| α | network circuitry | α | 0 ≤ α ≤ 1; α = 0, network with no loops; α = 1, network with the maximum possible number of loops present. | L: number of corridors V: number of nodes |
| β | node/line ratio | β | 0 ≤ β ≤ 3; β = 0, no network; β < 1, the network takes on a dendroid pattern; β = 1, single loop in the network; β > 1, more complex connectivity in the network [47]. | |
| γ | network connectivity | γ | 0 ≤ γ ≤ 3; γ = 0, none of the nodes are linked; γ = 1, every node is linked to every other possible node. |
Table 3.
Descriptive analysis of street global integration in the Central Area of Fuzhou City for 2000, 2010, 2021.
Table 3.
Descriptive analysis of street global integration in the Central Area of Fuzhou City for 2000, 2010, 2021.
| 2000 | 2010 | 2021 | ||
|---|---|---|---|---|
| Global Integration | Number | 798 | 1112 | 1243 |
| Mean | 0.729 | 0.889 | 0.962 | |
| Max | 1.368 | 1.374 | 1.413 | |
| Min | 0.529 | 0.503 | 0.62 | |
| Std. deviation | 0.165 | 0.163 | 0.149 |
Table 4.
Land use type structure in Fuzhou.
| Land Type | 2000 | 2010 | 2021 | |
|---|---|---|---|---|
| Forested land | Area (m2) | 7054.59 | 5022.99 | 4844.85 |
| Proportion (%) | 22.73 | 16.19 | 15.61 | |
| Water bodies | Area (m2) | 1924.97 | 1395.09 | 1069.51 |
| Proportion (%) | 6.20 | 4.50 | 3.45 | |
| Built-up land | Area (m2) | 8924.31 | 10,752.03 | 14,344.57 |
| Proportion (%) | 28.76 | 34.65 | 46.22 | |
| Farmland | Area (m2) | 9052.03 | 3802.95 | 1037.29 |
| Proportion (%) | 29.17 | 12.25 | 3.34 | |
| Grassland | Area (m2) | 2131.92 | 4705.20 | 5409.30 |
| Proportion (%) | 6.87 | 15.16 | 17.43 | |
| Unused land | Area (m2) | 6710.22 | 5355.18 | 4327.92 |
| Proportion (%) | 21.62 | 17.26 | 13.95 |
Table 5.
LPI values of green space in central Fuzhou during the period 2000, 2010, 2021.
| Land Use | 2000 | 2010 | 2021 |
|---|---|---|---|
| Forested land | 13.56 | 9.36 | 6.59 |
| Water bodies | 1.43 | 0.92 | 0.42 |
| Farmland | 7.97 | 0.53 | 0.17 |
| Grassland | 1.06 | 1.62 | 3.83 |
| landscape | 18.76 | 29.40 | 41.36 |
Table 6.
LSI values of green spaces in central Fuzhou during the period 2000, 2010, 2021.
| Land Use | 2000 | 2010 | 2021 |
|---|---|---|---|
| Forested land | 62.95 | 51.37 | 36.05 |
| Water bodies | 18.40 | 17.04 | 16.58 |
| Farmland | 72.21 | 59.25 | 42.21 |
| Grassland | 41.48 | 61.31 | 73.81 |
| landscape | 79.53 | 84.11 | 111.69 |
Table 7.
Corridor structure index and network structure index.
| Fuzhuo Green Space Ecological Network Plan Sketch | Nodes | Corridor Number | α Index | β Index | γ Index |
|---|---|---|---|---|---|
| Ⅰ | 46 | 44 | 0.00 | 0.95 | 0.33 |
| Ⅱ | 99 | 98 | 0.00 | 0.98 | 0.34 |
| Ⅲ | 99 | 155 | 0.29 | 1.56 | 0.53 |
Table 8.
The corridor structure metrics for the ecological network planning.
| Nodes | Corridor Number | Corridor Length (km) | Corridor Density (km·km2) | α Index | β Index | γ Index | Cost Ratio | |
|---|---|---|---|---|---|---|---|---|
| Cang Shan District | 50 | 71 | 165.56 | 1.16 | 0.23 | 1.42 | 0.49 | 0.57 |
| Gu Lou District | 15 | 34 | 56.93 | 1.62 | 0.80 | 2.26 | 0.87 | 0.40 |
| Tai Jiang District | 8 | 16 | 23.94 | 1.33 | 0.82 | 2.00 | 0.88 | 0.33 |
| Jinan District | 26 | 34 | 60.71 | 1.05 | 0.19 | 1.31 | 0.47 | 0.45 |
Table 9.
Landscape metrics in different plans of Gu Lou and Tai Jing district.
| Landscape Metrics | Gu Lou District | Tai jiang District | ||
|---|---|---|---|---|
| Green Space System Planning in 2021 | Ecological Network Planning | Green Space System Planning in 2021 | Ecological Network Planning | |
| PD (n/100 ha) | 0.53 | 0.42 | 0.48 | 0.43 |
| ED (m/ha) | 89.72 | 94.74 | 85.44 | 89.52 |
| MPS (ha) | 1.88 | 2.53 | 2.23 | 3.32 |
| LSI | 42.09 | 45.14 | 19.23 | 23.43 |
| SHDI | 0.68 | 0.83 | 0.63 | 0.72 |
| SHEI | 0.98 | 1.34 | 0.91 | 0.98 |
| MPFD | 1.05 | 1.06 | 1.04 | 1.05 |
| ENN(m) | 51.04 | 45.67 | 93.78 | 86.42 |
| CONNECT | 2.49 | 3.36 | 6.39 | 6.91 |
Table 10.
Landscape metrics in different plans of Cang Shan and Jin An district.
| Landscape Metrics | Cang Shan District | Jin An District | ||
|---|---|---|---|---|
| Green Space System Planning in 2021 | Ecological Network Planning | Green Space System Planningin 2021 | Ecological Network Planning | |
| PD (n/100 ha) | 1.03 | 0.82 | 0.63 | 0.46 |
| ED (m/ha) | 44.25 | 46.34 | 68.71 | 71.28 |
| MPS (ha) | 0.96 | 1.65 | 1.59 | 2.78 |
| LSI | 56.29 | 58.93 | 39.2 | 42.37 |
| SHDI | 0.69 | 0.75 | 0.68 | 0.82 |
| SHEI | 0.99 | 1.23 | 0.99 | 1.35 |
| MPFD | 1.05 | 1.06 | 1.05 | 1.07 |
| ENN (m) | 62.88 | 56.32 | 70.48 | 65.67 |
| CONNECT | 2.33 | 3.88 | 2.32 | 3.92 |
Publisher’s Note: MDPI stays neutral with regard to jurisdictional claims in published maps and institutional affiliations. |
© 2021 by the authors. Licensee MDPI, Basel, Switzerland. This article is an open access article distributed under the terms and conditions of the Creative Commons Attribution (CC BY) license (https://creativecommons.org/licenses/by/4.0/).
Share and Cite
MDPI and ACS Style
Huang, B.-X.; Chiou, S.-C.; Li, W.-Y. Landscape Pattern and Ecological Network Structure in Urban Green Space Planning: A Case Study of Fuzhou City. Land 2021, 10, 769. https://0-doi-org.brum.beds.ac.uk/10.3390/land10080769
AMA Style
Huang B-X, Chiou S-C, Li W-Y. Landscape Pattern and Ecological Network Structure in Urban Green Space Planning: A Case Study of Fuzhou City. Land. 2021; 10(8):769. https://0-doi-org.brum.beds.ac.uk/10.3390/land10080769
Chicago/Turabian StyleHuang, Bo-Xun, Shang-Chia Chiou, and Wen-Ying Li. 2021. "Landscape Pattern and Ecological Network Structure in Urban Green Space Planning: A Case Study of Fuzhou City" Land 10, no. 8: 769. https://0-doi-org.brum.beds.ac.uk/10.3390/land10080769
Note that from the first issue of 2016, this journal uses article numbers instead of page numbers. See further details here.