
Chinese Pattern of Urban Development Quality Assessment: A Perspective Based on National Territory Spatial Planning Initiatives

School of Land Science and Technology, China University of Geoscience, 29 Xueyuan Road, Haidian District, Beijing 100083, China
*
Author to whom correspondence should be addressed.
Land 2021, 10(8), 773; https://0-doi-org.brum.beds.ac.uk/10.3390/land10080773
Submission received: 17 June 2021
/
Revised: 11 July 2021
/
Accepted: 20 July 2021
/
Published: 23 July 2021
(This article belongs to the Section Urban Contexts and Urban-Rural Interactions)
Abstract
:The State Council of the People’s Republic of China issued the National Territory Spatial Planning Outline (2016–2030), which is a fundamental guide and blueprint for China to achieve its Sustainable Development Goals (SDGs). Based on its sustainable-city initiatives, this paper establishes a “four-space (4S)” assessment framework, and measured the urban development quality (UDQ) of 336 cities in China. Then we analyzed the spatial patterns of UDQ, and identified the main obstacles. Our results show that there is considerable room for improvement in UDQ in China. The spatial pattern of UDQ shows that the eastern economic zone score is higher than the western score and the northern lower than the southern. The spatial efficiency, structure, and quality in Chinese cities have significant hierarchical structure, while the form pattern is complicated. The most important obstacle to China’s high-quality development is spatial efficiency. The most significant limiting indicator is the industrial structure, followed by land output level and land consumption per unit GDP. Our findings help enhance the effectiveness of National Territory Spatial Planning policy implementation and guide China’s urban planning and management to achieve sustainability.
1. Introduction
According to the World Development Indicators (WDI) database published by the World Bank, the proportion of urban population reached 55.72% in 2019 [1] and is expected to reach 68% in 2050 [2]. Rapid urbanization has led to many ‘urban diseases’ such as environmental problems, energy shortages, traffic congestion, social inequalities, inadequate public services, and land loss [3,4]. Cities have become an important part of human civilization and urban high-quality development is a key issue for sustainable development [5]. In 2015, the United Nations (UN) adopted Changing the World: The 2030 Agenda for Sustainable Development, which identified 17 universal sustainable development goals to address the pressing environmental, political, and economic challenges facing our world (UN 2015). It has since established a global indicator framework of nearly 200 indicators, including 15 for urban development [6]. However, urbanization is a complex systems problem, and a fixed framework cannot solve the problem of differentiation in each region [7,8,9]. In order to better assess the level of urban development under various scenarios, we need a more focused framework to evaluate UDQ. This can also help policy makers to formulate feasible development plans [10,11].
The evaluation of UDQ has attracted widespread attention from policy makers and academics [10,12,13,14,15]. Over the past decade, the need for UDQ assessment studies has increased due to the concentration of urban populations [16,17,18]. Many urban evaluation indicators have been proposed by international and local organizations and governments at the city scale in previous studies. These indicators can be used as a reference for the development of sustainable city indicators. Typical examples include the City Prosperity Index [19], the Sustainable Cities Index [20], Mercer Quality of Life Rankings [21], the Monocle Quality of Life Survey [22], the European Green City Index, the Quality of Life Index, the Global Cities Index [23], the Blueprint for Cities, and the EIU global livability rankings [24]. These studies benchmark several global or regional cities based on various dimensions of urban sustainability. They use a variety of weighting and aggregation methods to select indicators ranging from 17 to 77 [25]. These indicators for assessing urban sustainability focus on the measurement and enhancement of individual urban elements. For example, infrastructure development, transportation, employment, education, carbon dioxide emissions, health, environment, innovation, technology, and culture. The assessment systems lack a holistic perception and measurement of the sustainability of urban systems [26,27].
Since the reform and opening up, China’s urbanization has made brilliant achievements in terms of sustained and rapid socioeconomic development and large-scale urban population growth [28]. China has gradually become an urbanized country with predominantly urban areas. With the advancement of reform and opening up, China’s urban population increased from 172.45 million in 1978 to 848.43 million in 2019, with an average annual growth rate of 16.48 million. The urbanization rate increased from 19.72% to 60.60% [29]. In addition, China’s GDP per capita began to exceed $8000 in 2015. According to the World Bank’s classification criteria, China is already an upper-middle-income country. According to Channery’s theory of the stages of industrialization, China has entered the later stages of industrialization. In recent decades, China’s extensive economic development model has contributed to the rapid development of the urban economy, but it has also brought about a series of problems and challenges. For example, resource consumption is high and utilization efficiency is low. Pollutant emissions are rapidly increasing and the environment is deteriorating due to explosive and disorderly expansion of construction land, unreasonable urban scale, and structural systems. The gap between urban and rural development is obvious. Urban construction lacks local characteristics and neglects cultural heritage [30,31,32].
In 1994, in response to the Rio de Janeiro Conference, China established the Center for Agenda 21 Management (CAM), which was the first to publish the Agenda 21 [33]. In 1996, it is clearly stated that “implementing sustainable development and promoting all-round social development” is a national strategy. Subsequently, the 16th National Congress of the Communist Party of China (CPC) on 15 March 2002 stated that improving sustainability was one of the goals of building a moderately prosperous society [34]. There are already at least 11 national-level sustainable city campaigns in China. There are also 189 national sustainable development pilot zones and 6 innovation demonstration zones. Furthermore, 230 prefecture-level cities have proposed to build eco-cities, and 133 have initiated low-carbon city planning [30]. China’s five-year plan for economic and social development states sustainable development as a core goal and arranges related tasks. Bryan et al. [35] reviewed 16 sustainable development projects in China since the reform and opening up to respond to sustainability contingencies in the national land system. They include the Sanbei Protected Forest Development Plan, the National Soil and Water Conservation Plan, the Protected Forest Development Plan, the comprehensive agriculture development plans, arable land quality planning, etc. The results show that China’s integrated sustainable development projects have achieved considerable success and have brought measurable benefits to sustainable well-being. Jiang et al. [36] used empirical analysis to investigate the changing characteristics of the ecological niche of China’s complex socioeconomic natural ecosystems during the Eleventh and Twelfth Five-Year Plan periods. They found that the development of natural and socioeconomic complex sustainable ecosystems has been a major success. The concept of sustainable development has been incorporated into planning and used to guide local policies and assessment criteria for regional development. It is undeniable that in the historical process of China’s sustainable development, policies, especially planning, have significantly advanced China’s sustainable development.
In order to meet the challenges of sustainable development at this stage, China has promoted the preparation of “multiple regulations in one” land and spatial planning. It means the organic integration of the original various planning principles, ideas, and methods based on holistic thinking. The State Council of the People’s Republic of China issued the National Territory Spatial Planning Outline [37], which has the same effective implementation period as the UN’s Change the World: 2030 Agenda for Sustainable Development, as an important guide and spatial blueprint for China to achieve its sustainable development goals [38]. The National Territory Spatial Planning Outline (2016–2030) is a macro guide of China’s development. It is further implemented through policies including “the Opinions on Establishing a Land and Spatial Planning System and Supervising its Implementation”. It positions land and space as a carrier, carrying the whole system of human and natural elements and spatial and temporal evolution, and advocates “high-quality economic development”. It is guided by the concept of “ecological civilization construction”, and its core is “people-oriented”. It is an initiative that advocates promoting the sustainable development of China’s cities by improving the quality of the land, increasing utilization efficiency, and optimizing the spatial structure and layout. The initiative goals are gradual improvement of the human habitat environment, significant improvement in the level of resource conservation and intensive use, control of the intensity of land development, and control of urban spatial expansion. This paper establishes an index system for evaluating UDQ in China based on the perspective of National Territory Spatial Planning initiatives. Secondly, we analyze the level of UDQ and the spatial heterogeneity by combining geographic economic subregions. Finally, we identify the key obstacle factors affecting UDQ in China. The rest of the paper is structured as follows. The next section briefly introduces the research methodology and data sources. Section 3 gives the evaluation results and identifies the obstacles. Section 4 discusses the policy and practice options to address the spatial disparities and obstacles to urban development quality in China. Moreover, we add a discussion on UDQ in different regions and give policy guidelines for optimizing the spatial pattern of cities. Finally, a conclusion is given.
2. Materials and Methods
2.1. Building a Framework for UDQ Assessment Based on the National Territory Spatial Planning Initiative
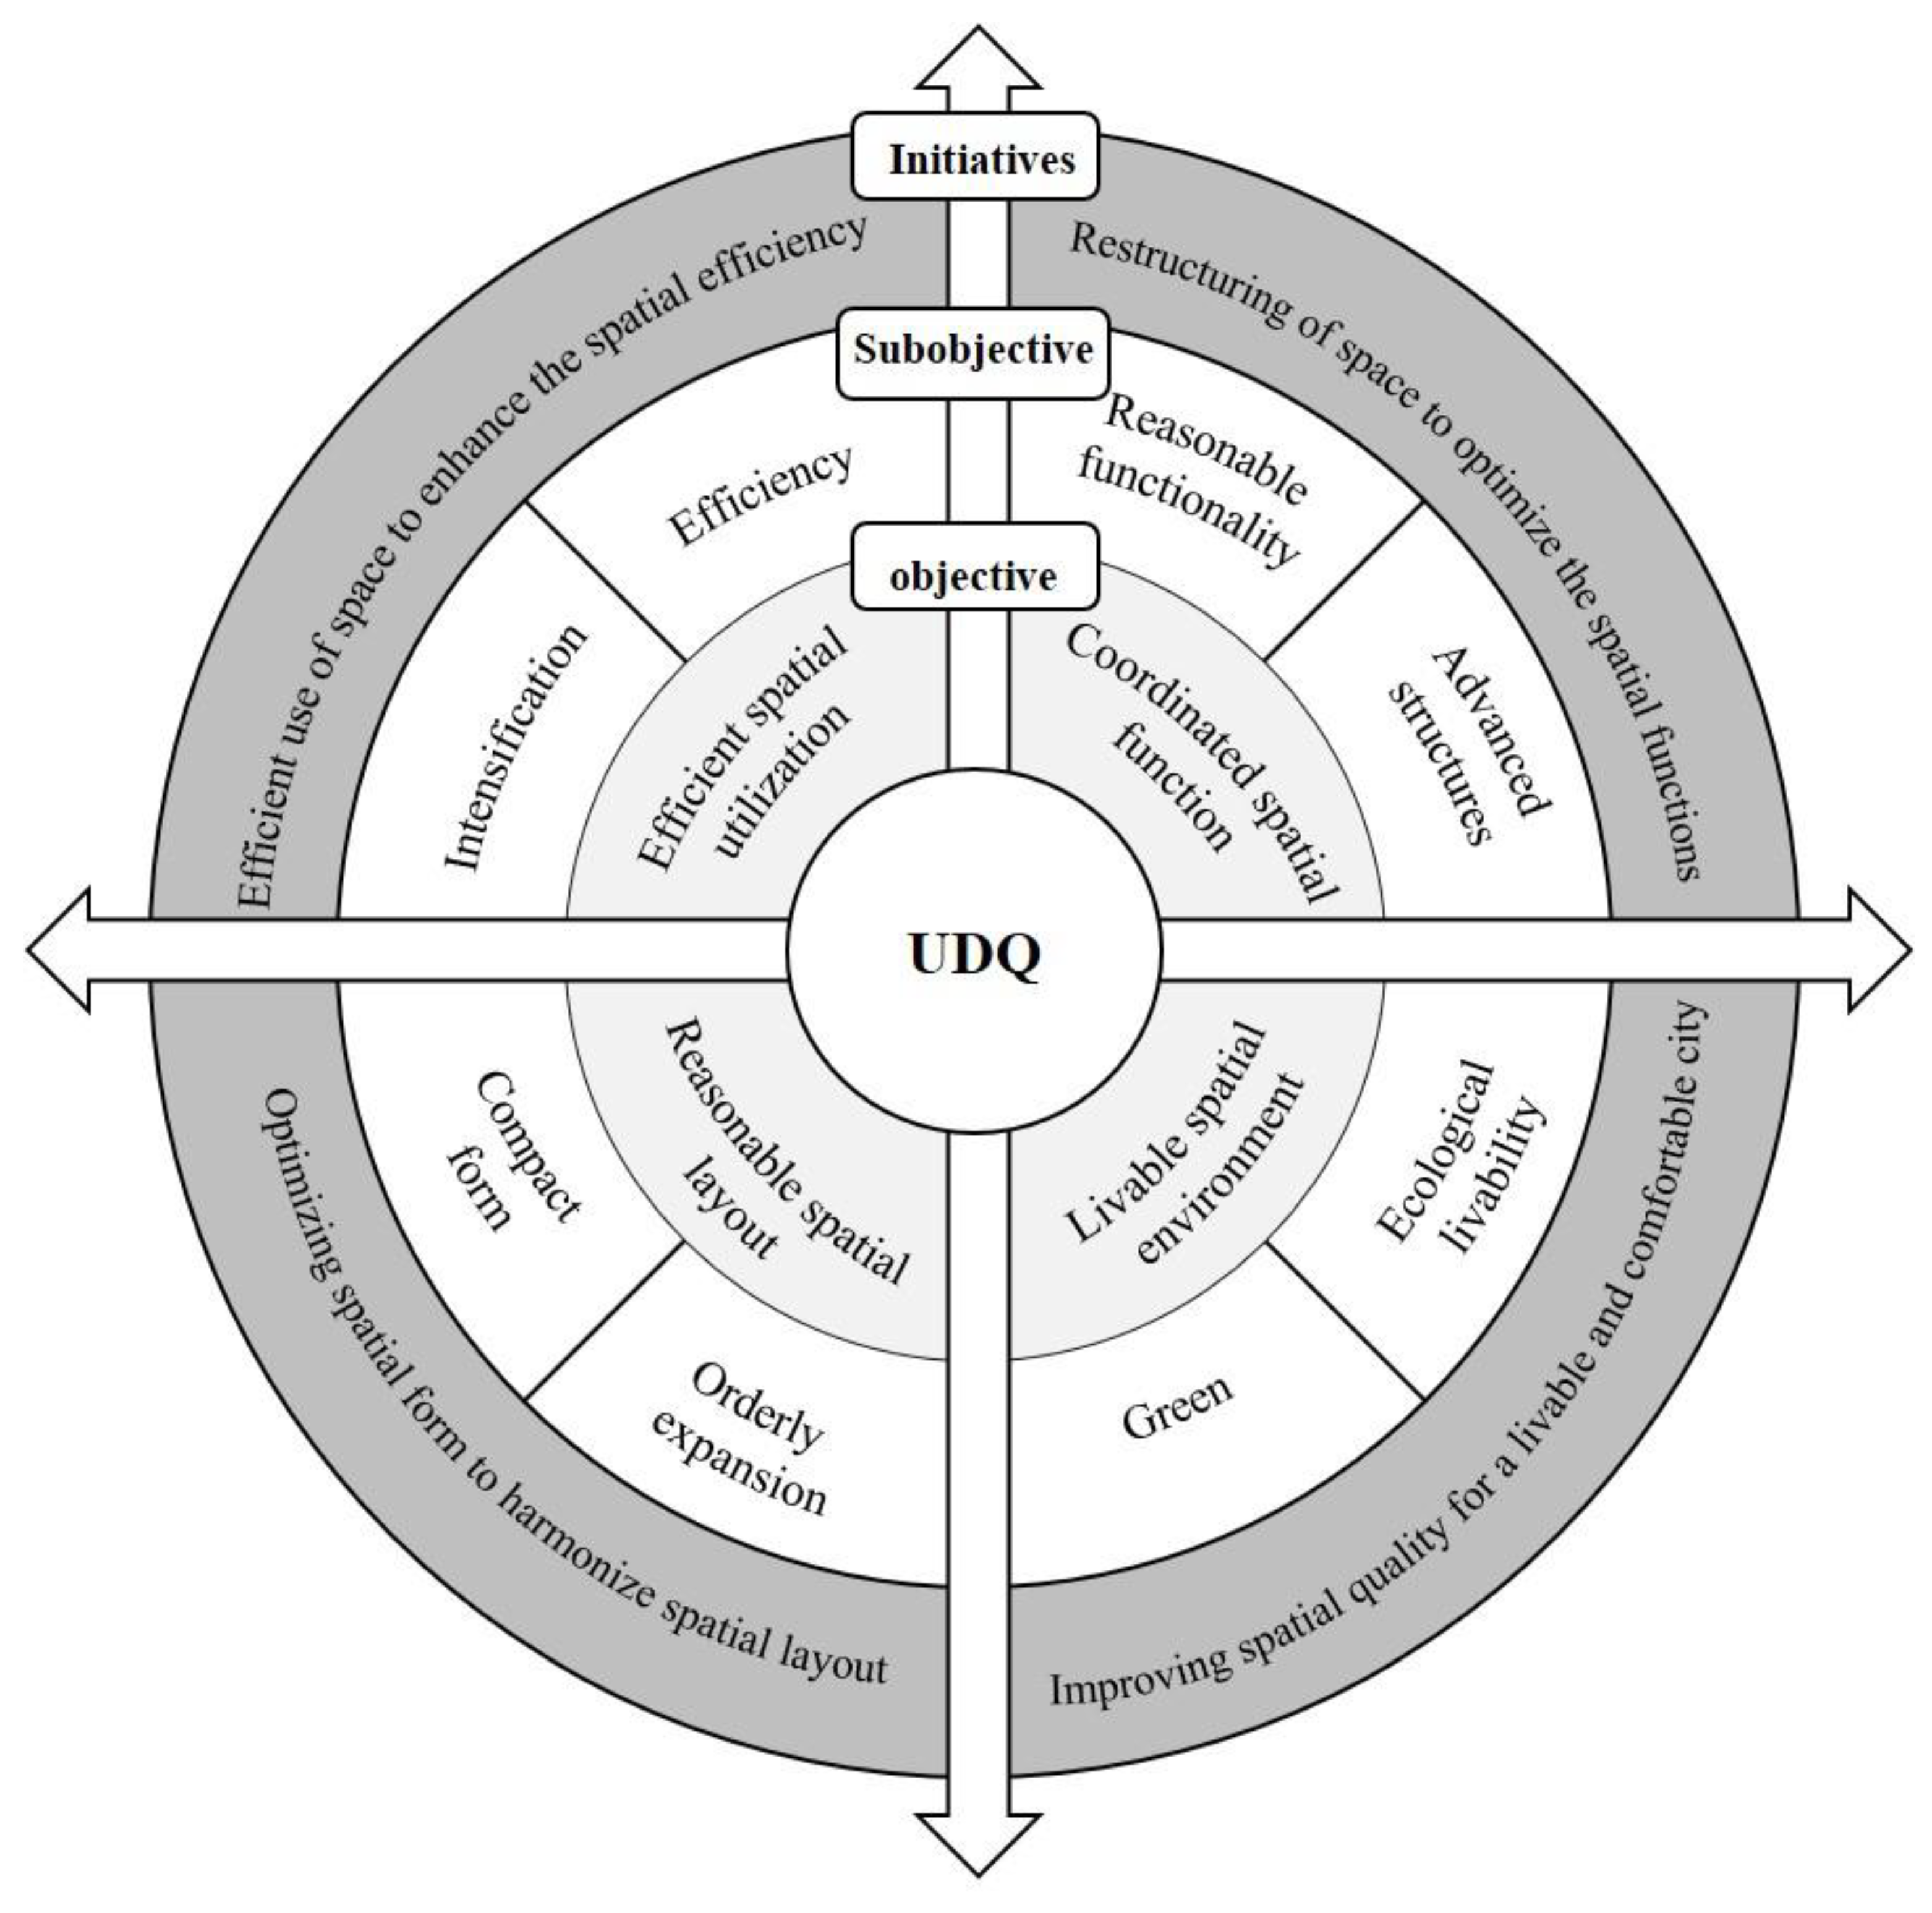
Before studying the level of UDQ, it is important to first sort out the territorial spatial planning initiatives as a guide to clarify the important goals of UDQ. To promote urban high-quality development, the Chinese government has launched several urban high-quality development initiatives. For example, low-carbon cities, eco-cities, low-carbon eco-cities, smart cities, harmonious societies, forest cities, sponge cities, climate-resilient cities, etc. These city theory initiatives provide a holistic practical goal and direction for addressing urban economic, social, and environmental issues. Facing current urban issues and challenges, China’s National Territory Spatial Planning puts forward the initiative of constructing high-quality cities. Using Nvivo11’s word frequency statistics, it was found that the word “space” appears 88 times in the National Territorial Planning Framework. This also reflects the attention to the spatial character of cities that characterizes the Territorial Spatial Planning Initiative. With a focus on “space”, we have identified the elements of the Territorial Spatial Planning Initiative that relate to UDQ. This identifies the key objectives of urban development as “spatial intensification and efficiency, coordination of spatial functions, reasonable spatial layout, and livability and comfort of space”. On this basis, our study evaluates UDQ using four dimensions, forming a “four-space (4S)” assessment framework (Figure 1). The dimensions are “whether space utilization is efficient, whether space function is coordinated, whether space layout is reasonable, and whether space is livable and comfortable”.
Initiative goal a: Efficient use of space to enhance spatial efficiency of the national territory. Initiatives related to enhancing spatial efficiency proposed in the plan include: “Comprehensively enhancing the level of economical and intensive land use”. “Orderly promotion of the redevelopment of low-utility land in urban areas”. “Actively revitalizing the stock of construction land”. “Increasing the intensity of utilization of national land”. “Promoting urban renewal and industrial transformation and upgrading”.
Initiative goal b: Restructuring of space to optimize spatial functions of the national territory. Initiatives related to the optimization of spatial functions proposed in the plan include: “Rational optimization of spatial structure”. “Adjustment and optimization of the spatial structure of towns and cities in accordance with the general requirement of promoting intensive and efficient production space, livable and moderate living space, and ecological space with beautiful mountains and clear water”. “Guiding the layout of different industrial land uses in cities”. “Rational optimization of spatial structure and optimization of the spatial function zoning of cities”.
Initiative goal c: Optimizing spatial form to harmonize spatial layout of the national territory. The initiatives proposed in the plan to optimize spatial patterns include: “Controlling the intensity of land development”. “Scientifically guiding the flow of population to make the concentration and distribution of population more orderly”. “Enhancing the compactness of urban construction and improving the rationality of internal urban forms”. “Building a safe, harmonious, competitive, and sustainable territorial spatial pattern”.
Initiative goal d: Improving spatial quality for a livable and comfortable city. Initiatives related to improving spatial quality proposed in the plan include: “Establishing a green, low-carbon and people-oriented urban development concept”. “Building a resource-saving and environment-friendly society and improving the city’s capacity for sustainable development”; “Completing infrastructure systems such as roads, water supply, and heating”; “Improving the coverage of urban domestic sewage and rubbish treatment facilities and enhancing the comprehensive quality of the human living environment”.
2.2. Measuring UDQ
Based on the initiatives of National Territory Spatial Planning, the evaluation system of UDQ is constructed from four perspectives of spatial efficiency, structure, form, and quality. The system contains 21 indicators, which measured the efficiency of space utilization, the coordination of spatial functions, the rationality of spatial layout, and the livability and comfort of space (Table 1). Spatial efficiency reflects the input–output level of land and economy. Spatial structure reflects the rational structure of urban land use and the structure of industry. Spatial form reflects compactness of the various land forms and the orderly expansion of the city. Spatial quality reflects the livability and comfort of the city.
We calculated UDQ scores using arithmetical means. This is an aggregate score that consists of individual scores for 4 initiative goals and represents China’s overall performance in achieving all 4 initiative goals. Each initiative goal is equally weighted, Indicators under a particular initiative objective are also given the same weight. Each indicator is standardized; the formula for normalizing indicators is as follows:
where is the normalized value, is the indicator value of evaluation indicator i, is the maximum value of evaluation indicator , and is the minimum value of evaluation indicator . After standardization, the values were between 0 and 1.
2.3. Measuring Spatial Heterogeneity
The 336 cities were divided into groups to examine the heterogeneity in the levels of UDQ. The classification criteria we used are based on the partitioning of China’s economic geography, which divides the country’s cities into eight economic zones (Table 2). Based on the natural economic and social development characteristics of China, the State Council of China divided the Chinese mainland into four zones in 2005, namely the eastern, central, western, and northeastern zones. It was further divided into eight comprehensive economic zones based on their geographical location. This division has also been used so far. Among them, the northeastern economic zone faces problems such as depleted resources and an industrial structure in need of upgrading. The coastal region has a superior geographical location, convenient transportation, and better development advantages. The central region is densely populated and strategically important. The western region has a harsh natural environment, poor soil, and the least developed economy. In 2017, the GDP per capita was RMB 108,888 in the eastern coastal economic zone (EC), RMB 69,082 in the northern coastal economic zone (NC), RMB 82,335 in the southern coastal economic zone (SC), RMB 51,937 in the Middle Yellow River economic zone (MYRN), RMB 58,372 in the Middle Yangtze River economic zone (MYRS), RMB 42,955 in the northwest economic zone (NW), RMB 48,225 in the southwest economic zone (SW), and RMB 47,130 in the northeast economic zone (NE).
2.4. Obstacle Diagnosis Model
In order to analyze the disadvantages of Chinese UDQ more effectively, an obstacle diagnosis model was constructed to explore the obstacle factors affecting Chinese UDQ [43,49]. At present, researchers commonly use obstacle degree diagnosis models based on index deviation [50].The formula is as follow:
where is deviation between indicators and development goals, is the standardized value of each individual indicator j, is the weight of indicator j, is the obstacle degree of indicator j, n is the number of indicators.
2.5. Data Source and Processing
This study conducted an evaluation of 336 cities at the prefecture level or above within 31 provinces in China. Due to the availability of data, Taiwan, Hong Kong, Macau, and some cities with missing data were excluded. Two forms of data were used in this research, namely spatial data and statistical data.
Statistical data: The social and economic data were mainly from the China Urban Statistical Yearbook 2017, the China Statistical Yearbook of Urban Construction 2017 and the China Environment Statistical Yearbook 2017. The time nodes of the above data were both 2016. Some of the evaluation indicator data were obtained from calculations of the original data. Land consumption per unit GDP and land consumption per unit fixed investment were calculated based on data from the China Urban Statistical Yearbook 2016 and the 2017 edition. The total number of national forest parks and national geoparks are from the national list of areas banned from development in the National Main Functional Area Plan.
Spatial data: The proportion of ecological land, the degree of construction land disturbance, and the compactness of construction land were calculated using GIS technology in combination with China’s land-use map.
3. Results
3.1. Analysis of UDQ at the National Level
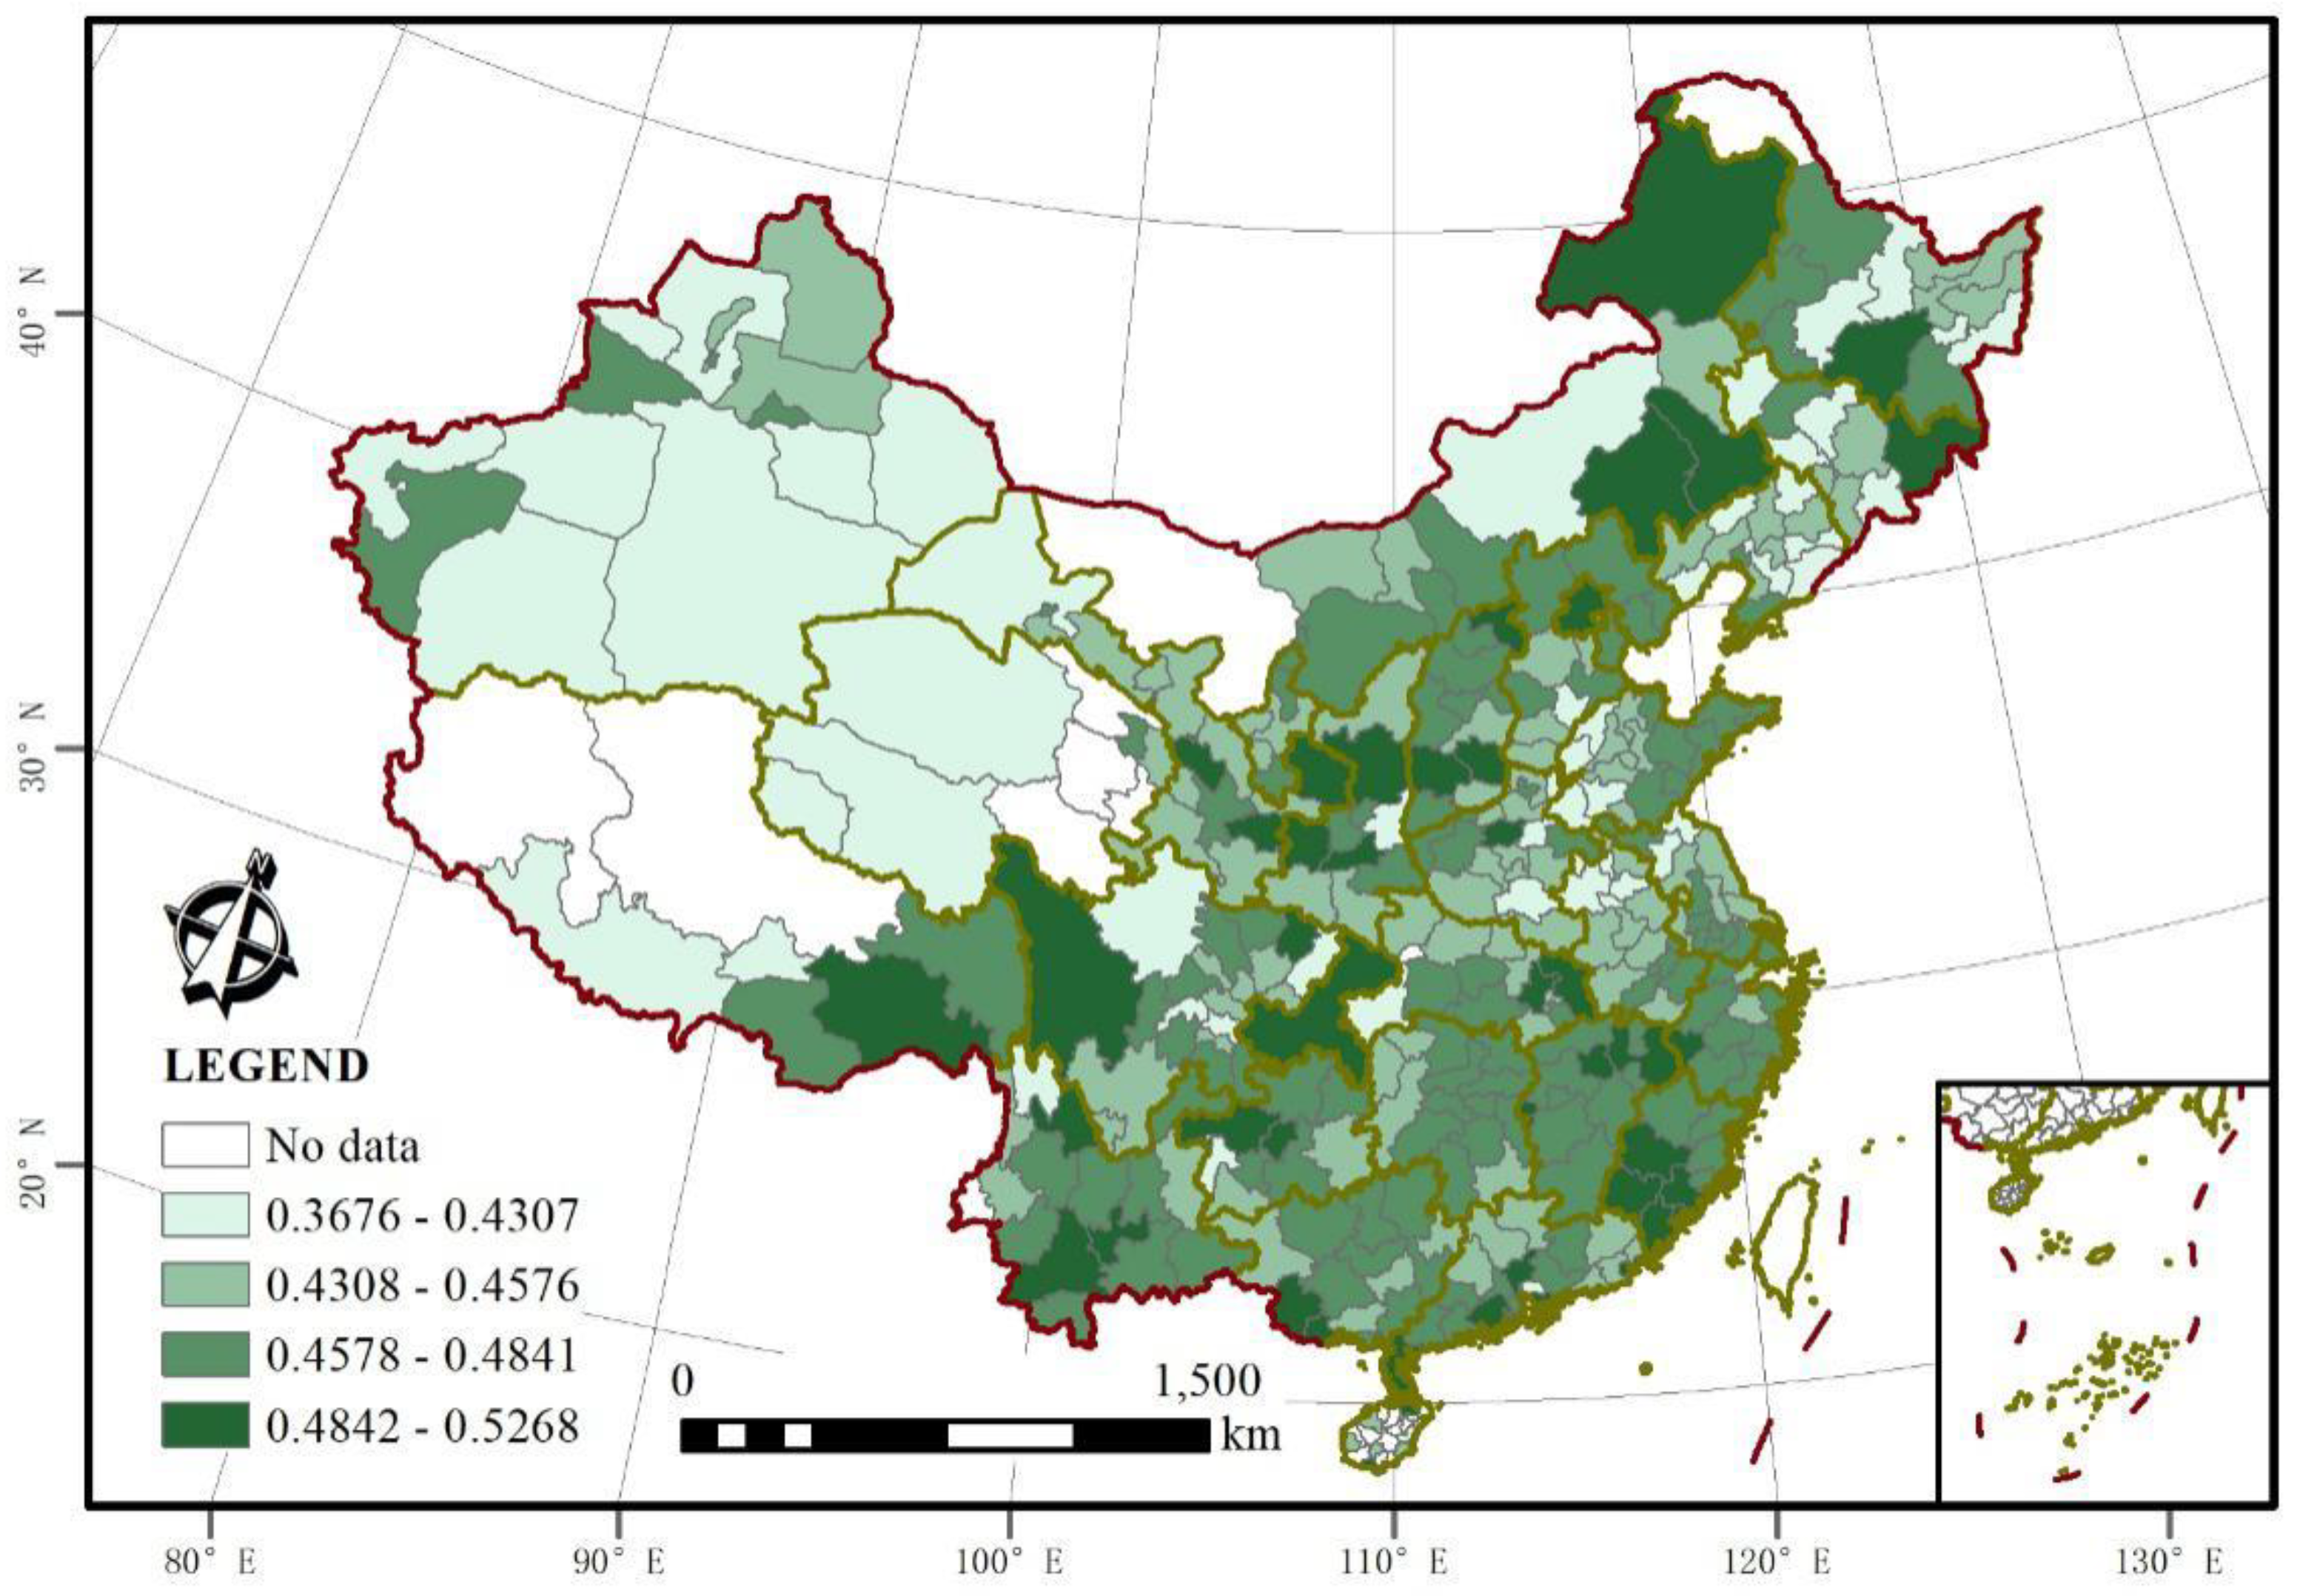
Overall, there is still much room for improvement in the level of UDQ, with significant differences between cities. The average UDQ is 0.4577. According to Jenks’ best natural fracture method to classify the index (Figure 2), 70.33% of the cities are at the medium level, and only 13.35% of the cities are at the high level, so there is still much room for improvement. From the perspective of individual cities, Sanya (0.5268), the city with the highest quality of development, is 1.43 times higher than Zhoushan (0.3676). The difference between cities is obvious, and the coefficient of variation of UDQ is 5.89%.
In terms of the spatial distribution, China’s UDQ shows a remarkable zonal gradient, manifested in a gradual decline from the southeastern coastal region to the northwestern region. Cities with high or relatively high levels of UDQ are mainly distributed in the eastern coastal areas as well as in the eastern and central urban agglomerations. High-value clustering is a distinctive feature, with most coastal cities having a high level of UDQ. The western UDQ is generally low, with concentrations in Xinjiang, Tibet, western Qinghai, and northwestern Shaanxi Province, where there are usually large obstacles.
3.2. Analysis of UDQ at the Regional Level
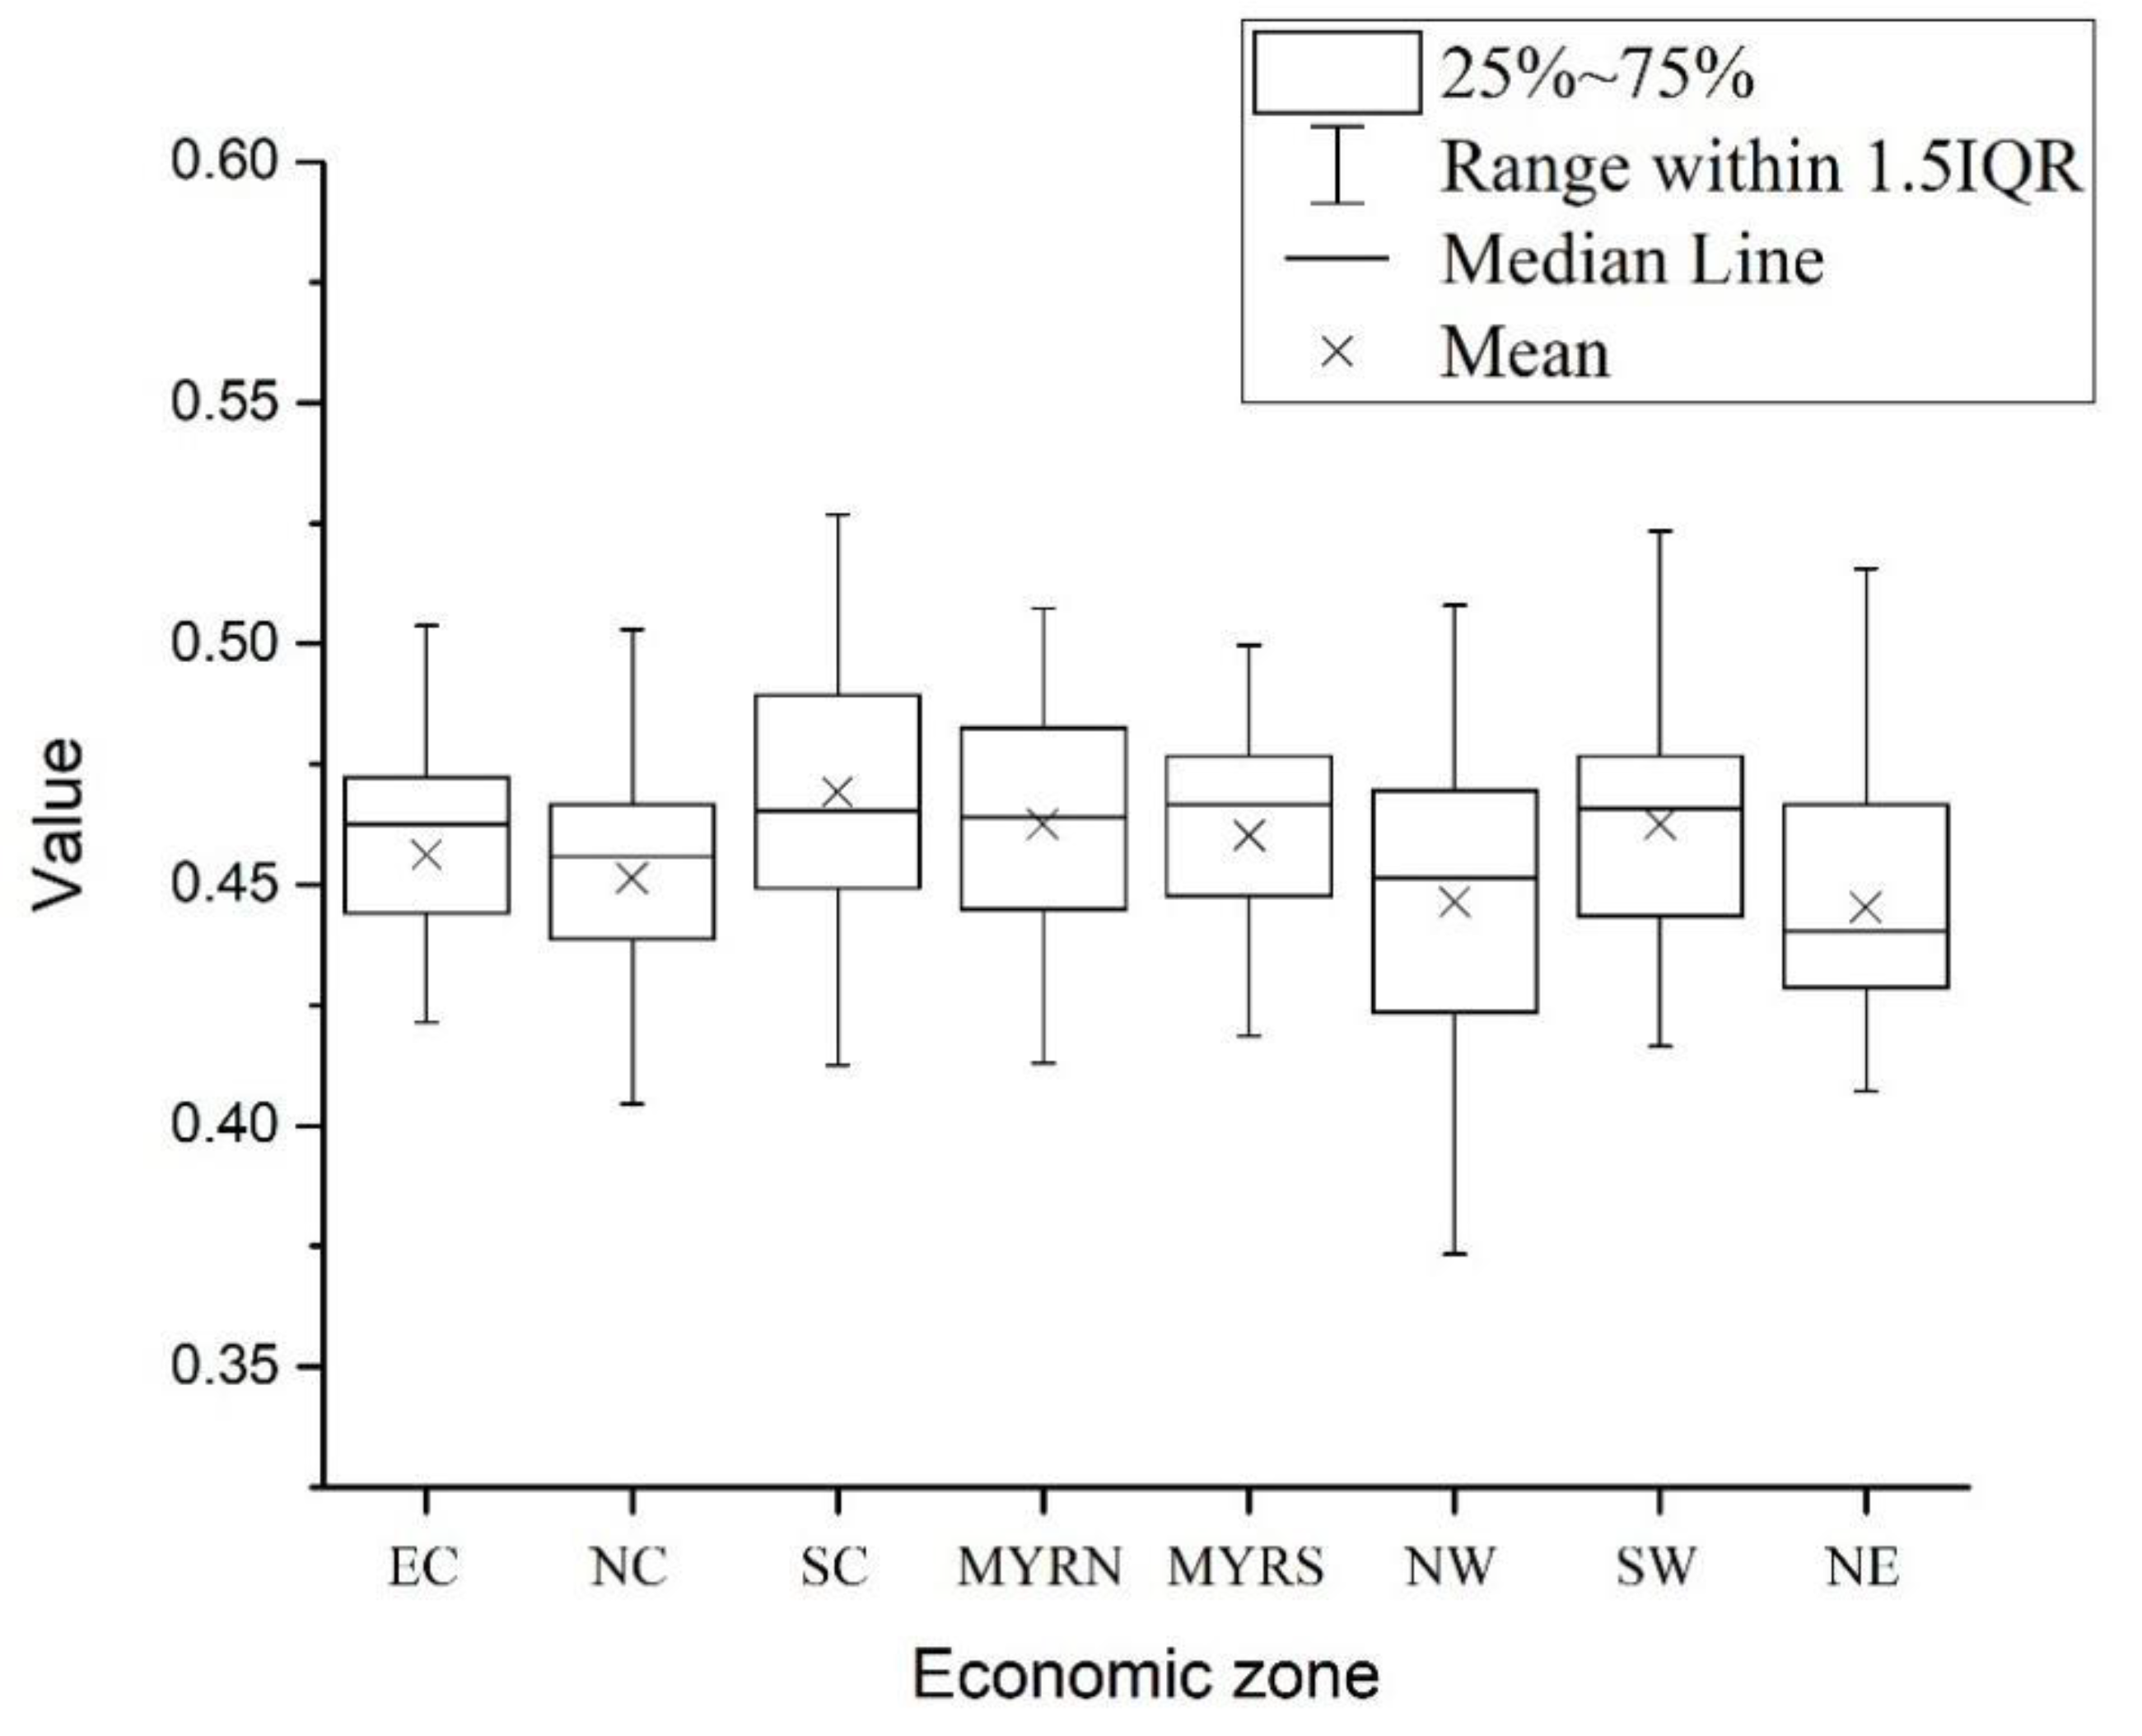
Using the classification statistics of the eight major economic regions of China (Figure 3), the spatial pattern and regional differences in UDQ were further studied. Based on the statistical map analysis of sustainable urban spatial development by subregion, it was found that the eastern region has the highest score in UDQ. The UDQ in the northern coastal region is significantly lower than that of the southern coastal region and the eastern coastal region. The central region performs well, with a slightly lower score than the eastern region, and the Middle Yellow River economic zone is significantly lower than the Middle Yangtze River economic zone. The overall score in the western region is lower, the southwest region and the northwest region show a big difference, and the score in the southwest region is significantly higher than that in the northwest region. The score in the northwest economic zone and the northeast is poor, which has a significant negative pull on the UDQ in China. Overall, the spatial pattern of UDQ shows that the eastern economic zone score is higher than the western zone score, and the northern lower than the southern. The northeast economic region has the lowest UDQ score. This shows that there are still large regional differences in the UDQ in China, which is consistent with the pattern of China’s economic development. It is noteworthy that northeast and northwest economic zones are the “depressions” in China’s UDQ. Therefore, it is necessary to continue to carry out the Northeast Revitalization Strategy and the Western Development Strategy to promote and develop inland cities.
3.3. Characteristics Analysis of the Subdimensions
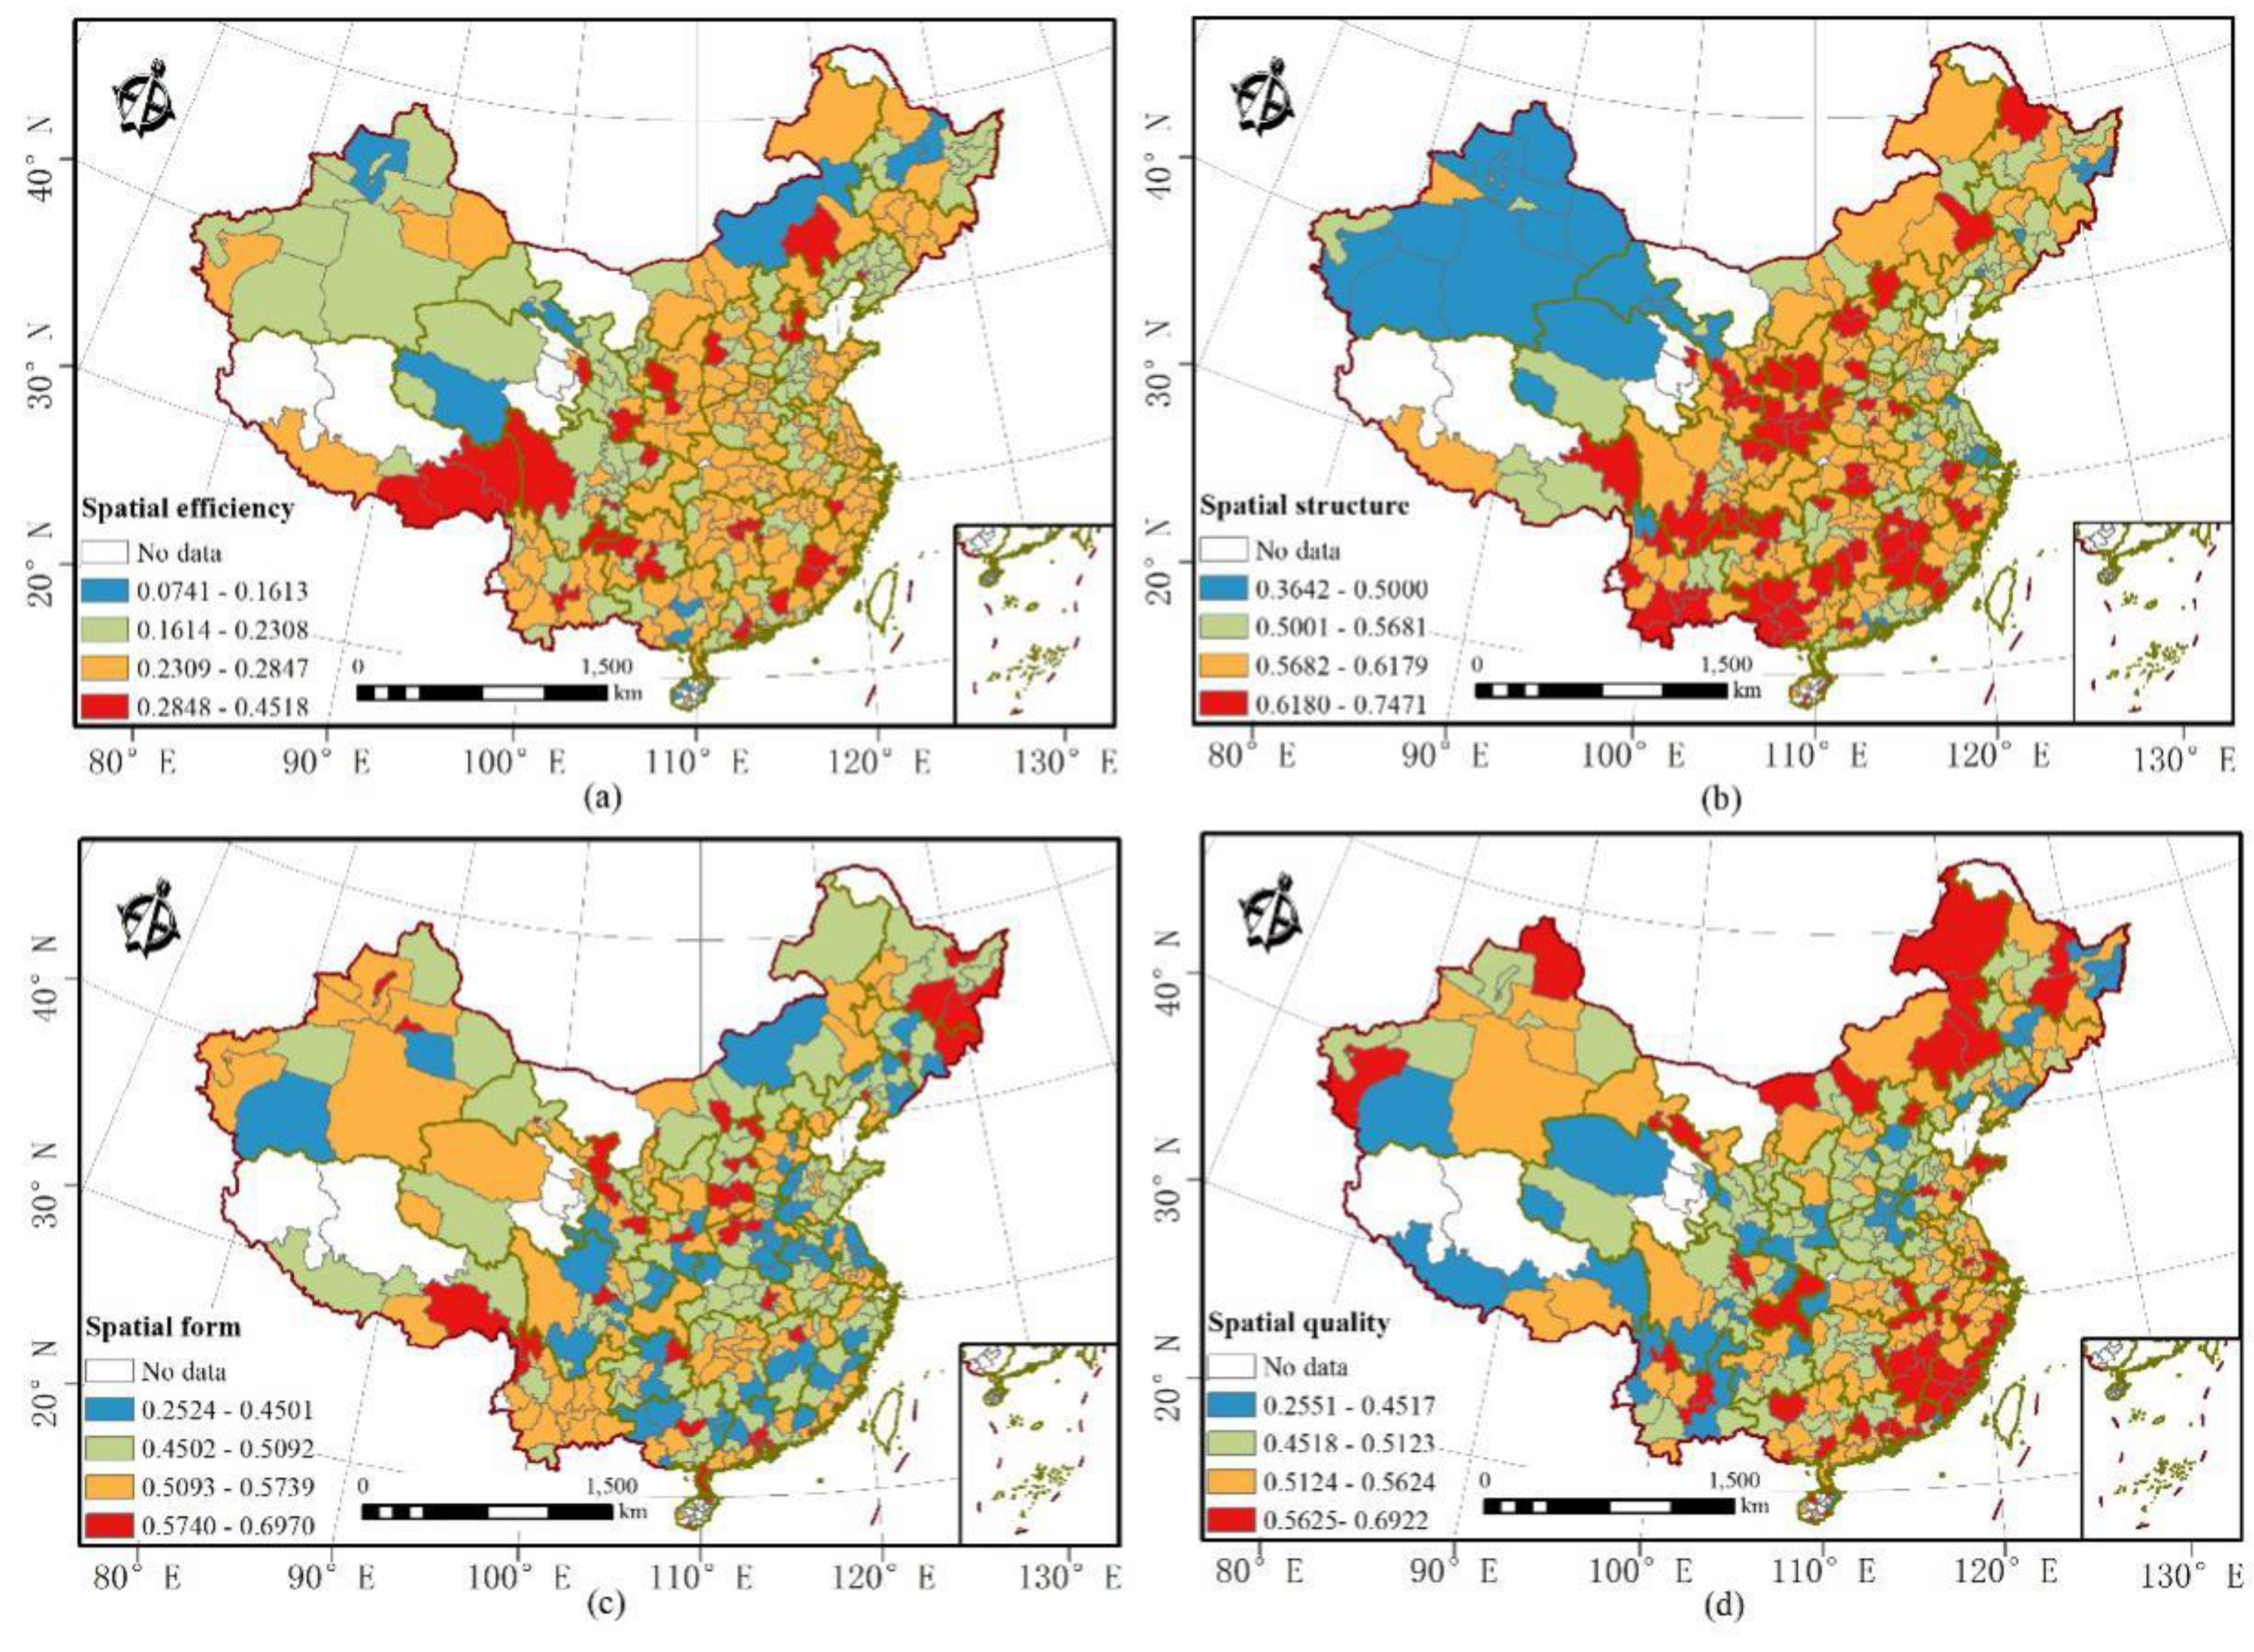
The results show the hot spots of spatial efficiency, structure, and quality are distributed regularly, forming an obvious hierarchical structure. The distribution of form is complex (Figure 4).
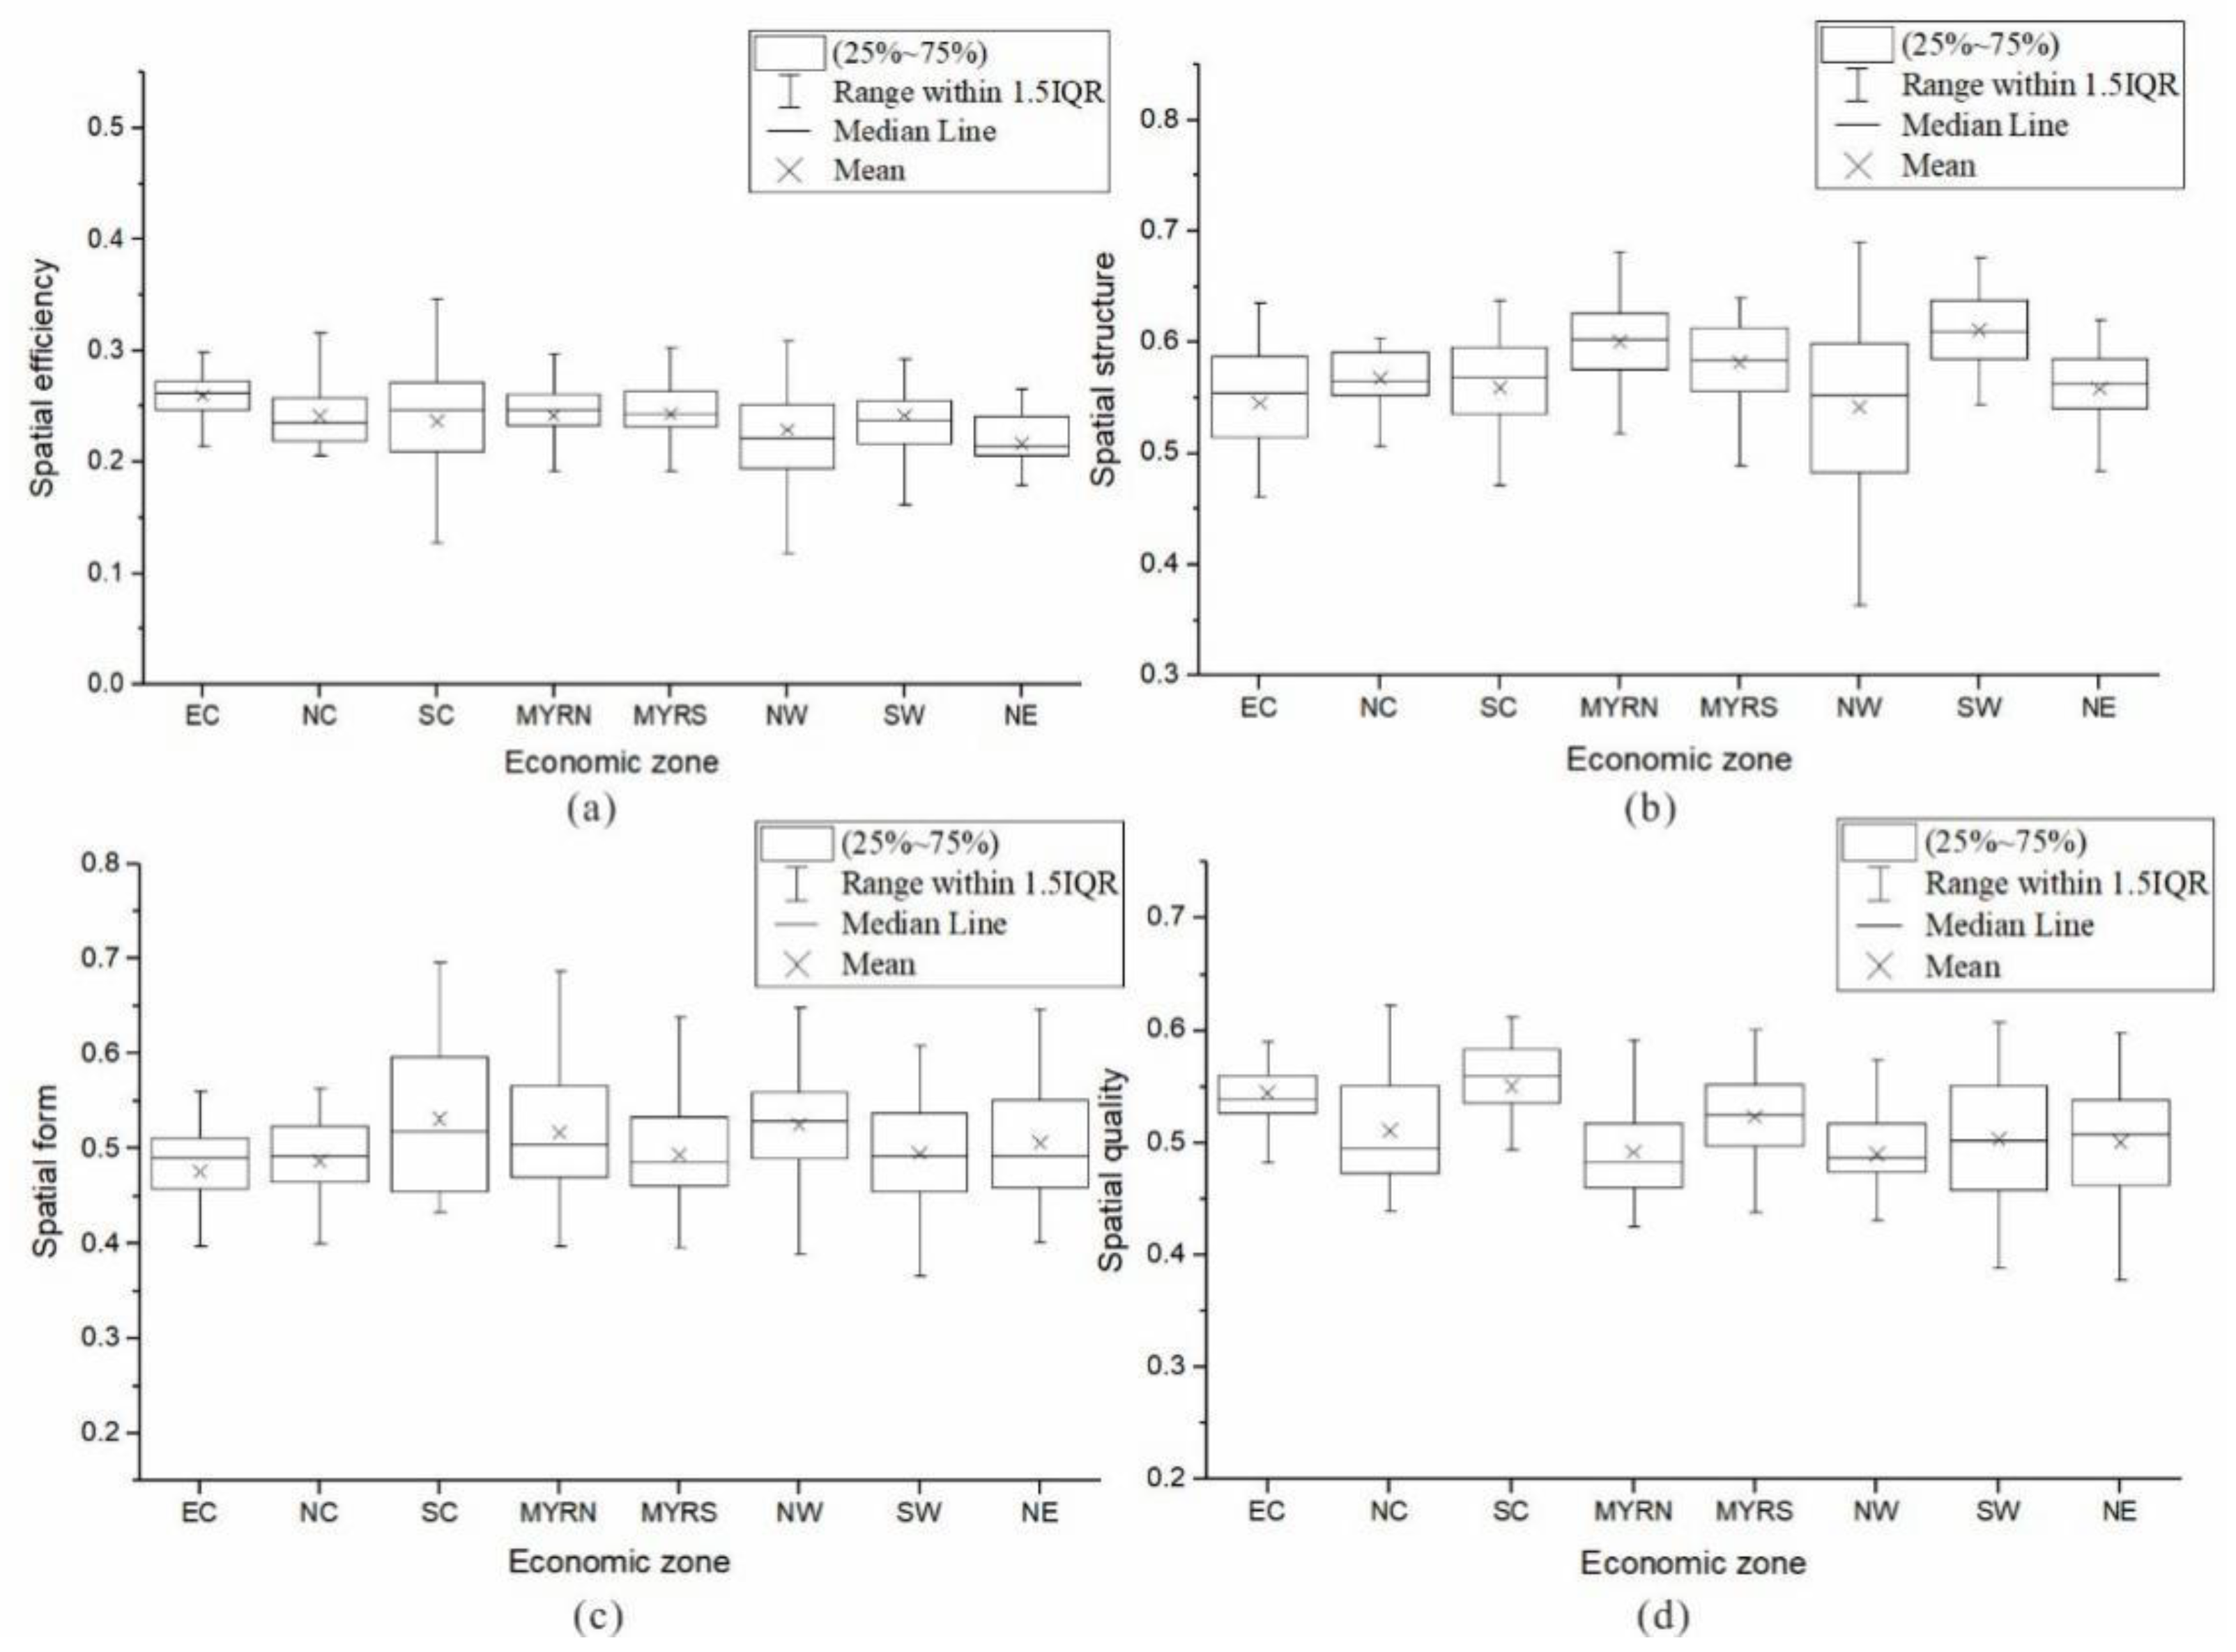
The score of urban space efficiency is the lowest of the initiative goals; the overall characteristic is that scores decrease from the southeast coast to the northwest and northeast regions. Among them, the northeast and northwest regions have the lowest scores (Figure 5a). This points out that the spatial efficiency level of the south is better than the north, and east is better than the central and western. The eastern coastal area formed a hot spot of agglomeration, with the eastern coastal economic zone efficiency scoring level best performance, followed by the southern coastal economic zone. The efficiency levels of the Yangtze River Delta city cluster and the Pearl River Delta city cluster played an important pulling role, while the northern coastal economic zone performed relatively poorly. The northwest and northeast regions show a continuous low-value clustering, reflecting that the efficiency level in the region is in serious trouble, in line with the practical knowledge.
The pattern of urban spatial structure is a three-layer structure from the eastern coastal area to the western area of low–high–low. This pattern is characterized by a low spatial structure in the coastal region, a coherent structure in the central region, and a serious structural imbalance in the western region. Combined with the subregional statistical map of each factor (Figure 5b), the spatial structure of the Middle Yellow River economic zone and southwest economic zones show excellent performance. The eastern region has a low level of functional coordination, and its spatial structure is its relative constraint factor.
There are significant differences among the patterns of urban spatial form. In the eastern and northern coastal economic zones and central areas, there is still room for improvement in their spatial form. This indicates that the layout of various types of urban land still needs to be adjusted (Figure 5c). The spatial form of cities with high values is mainly distributed in the western region. Compared to the country, the northwest economic zone has the highest average score of spatial form and the most reasonable compactness.
The urban spatial quality has the most significant characteristic of clustering, with the southeast coastal area showing high-value clustering. The eastern coastal economic zone and southern coastal economic zone have the highest quality scores, with high levels of livability and comfort. The northwest economic zone and the Middle Yellow River economic zone have the lowest quality performance (Figure 5d).
3.4. Diagnosis of Obstacles to UDQ in China
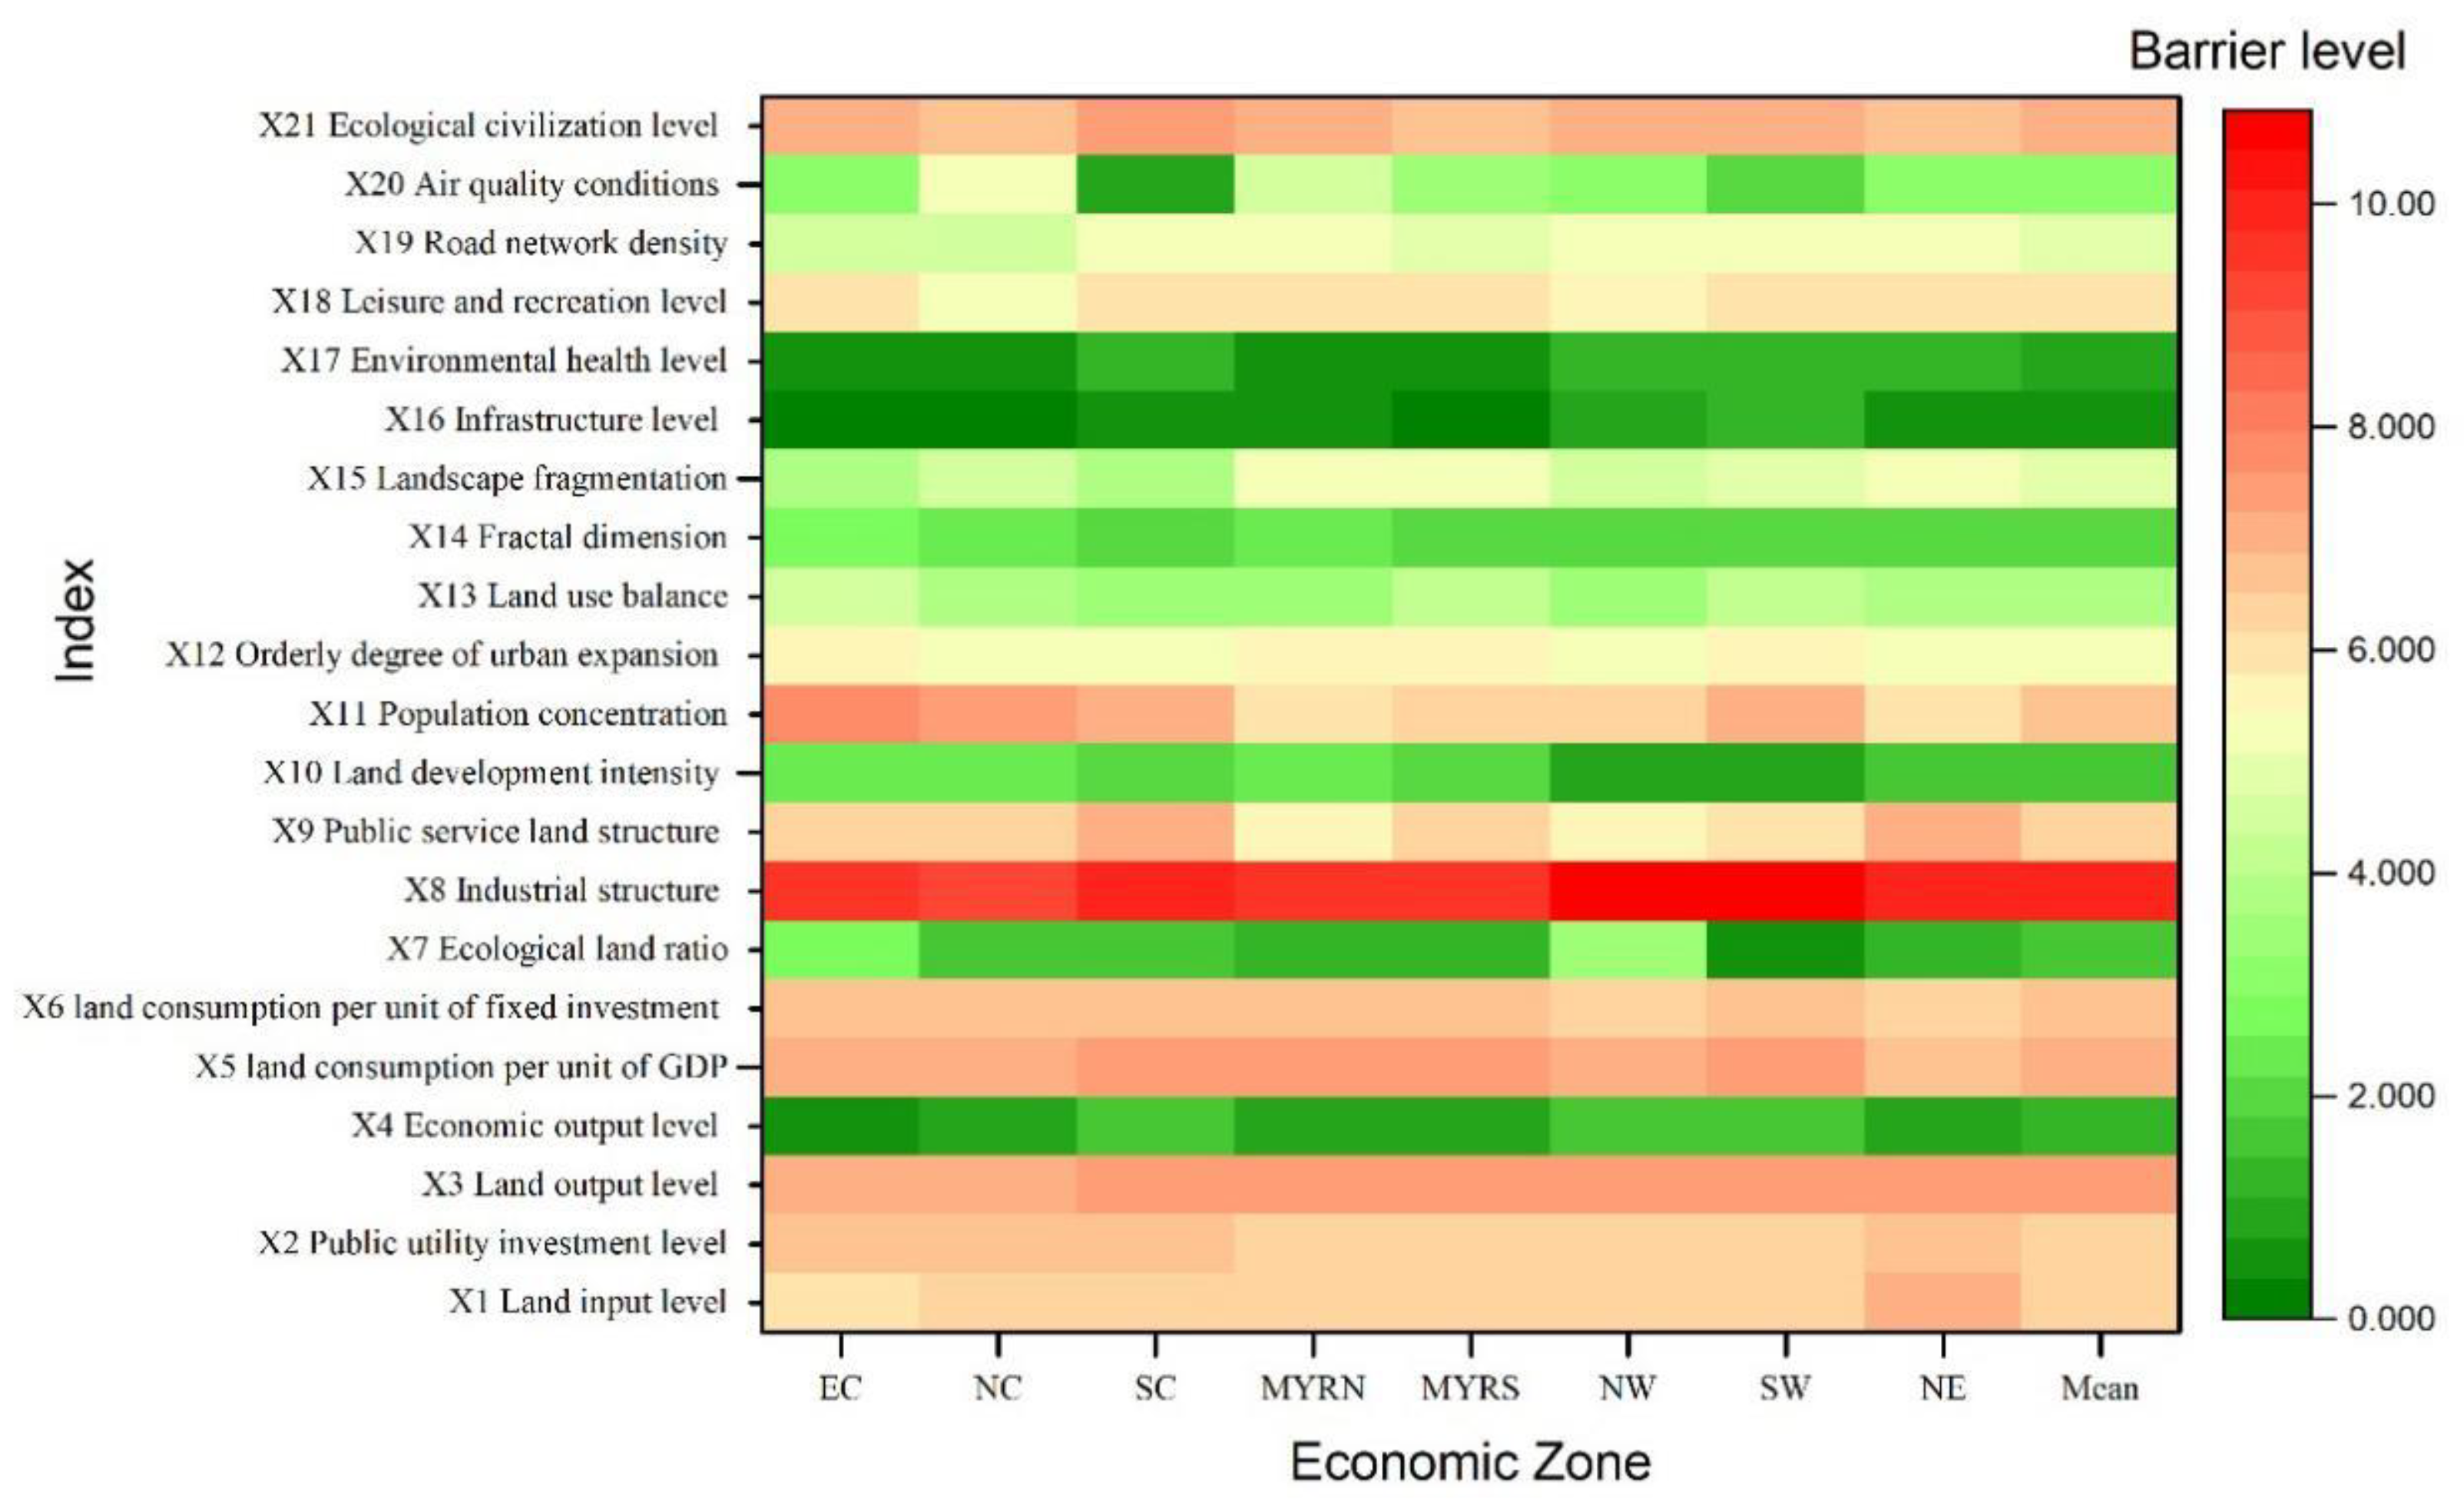
The obstacle diagnosis model was used to calculate the degree of each individual obstacle indicator to identify the important obstacles that limit China’s UDQ. The results show that the degree of different indicators exhibit significant differences. According to the average of all the studied cities, the obstacles are, in descending order, spatial efficiency > spatial form > spatial quality > spatial structure. The obstacles to each goal are high, with spatial efficiency having the highest obstacle degree (35.15%). The most significant limiting indicator is the industrial structure, followed by land output level, and land consumption per unit GDP. All three indicators have a barrier level above 7%, with a combined barrier level of up to 24.57%. The degree of obstacle for industrial structure is 10.03%. Moreover, X1 land input level, X2 public utility investment level, X6 land consumption per unit fixed-asset investment, X9 public service land structure, X11 population concentration, and X21 ecological civilization level also show a strong degree of obstruction, with obstacle degrees of more than 6%. Based on the different economic regions, the indicator obstacle degrees were summarized according to each subobjective to further analyze the different obstacles to each goal (Figure 6).
In terms of spatial efficiency, the obstacles to economic output are generally small. The input level of public utilities and the land economy is average. The obstacles to land output and the level of economic output and land consumption are relatively high. There is an urgent need to improve the efficiency of land use and output. According to the indicator obstacle degrees of each region, China’s economic output level obstacle is relatively small (1.25%). The ratio of secondary and tertiary industries reached 92.63%. Notably, in the eastern coastal economic zone, the obstacle is only 0.63%. In terms of land input level, the eastern coastal economic zone has the lowest obstacle degree. The southwest economic zone’s fixed investment amount ranks second. It is worth noting that the northeast economic zone has the highest level of land input obstacles: the land input level is much lower than the national average (accounting for 35.19% of the eastern coastal economic zone). The public utility investment level obstacle is relatively high, and the northeast economic zone has the highest obstacles. The average regional public expenditure is only 284,536,300 RMB/km2, about 74.32% of the southwest economic zone (382,873,300 RMB/km2). China’s economic input and output consumption of land level is generally high, while the southwest economic zone and the northeast output land consumption obstacle degree is relatively small. China’s land output level is the most important obstacle to urban spatial efficiency and needs to be improved first.
In terms of spatial structure, the degree of obstruction in ecological function space is the lowest. The level of obstruction in public service space is moderate. The level of obstruction in construction land function space is high. The level of obstruction in tertiary industry function space is the highest, and still needs to be further improved. China needs to continue to adjust its spatial structure, coordinate spatial functions, expand public service space and tertiary industry functional space, and strictly control the expansion of urban construction land space. According to the indicators of each region, the degree of obstruction of ecological function space is low, with an average degree of 1.55%. The proportion of ecological land such as cultivated land, forest land, and grassland reach 84.95%. In the southwest economic zone, the proportion of ecological land accounted for more than 95%. The northwest economic zone and the eastern coastal economic zone have the highest degree of ecological function impairment, with the proportion of ecological space being less than 80%. Public service functional space has an average level as an obstacle. The public service space in the southwest economic zone and northwest economic zone in Western China accounted for a large proportion. The southern coastal economic zone and the northeast economic zone accounted for a relatively small proportion. The functional space of tertiary industry is the highest obstacle indicator in China. There is a general need to further enhance the functional space of tertiary industry throughout the country, especially in the northwest and southwest economic zones. Land development intensity is relatively high, indicating that China’s cities are still facing the problem of large spatial expansion and insufficient land resources. Land development intensity is significantly higher in the eastern and central regions than in the western and northeastern regions. The northwestern and southwestern economic regions have the lowest land development intensity, at 3.08% and 3.54%, respectively. Particularly noteworthy is the fact that the northern and eastern coastal economic zones have a land development intensity of more than 9.20%, about three times that of the eastern zone.
In terms of spatial form, the fractal dimension obstacle of China’s urban construction land is generally low. It shows that the layout of construction land is compact, and land use is not susceptible to external interference. Landscape fragmentation of construction land varies greatly, the degree of construction land concentration in the eastern region being significantly higher than the average. The degree of obstacle this creates to the central and northeastern regions relatively high, where the layout of construction land is fragmented. The balance of land use layout performs well, but the eastern coastal economic zone performs the worst, with unreasonable proportions of various types of land structure layout. China has a high degree of obstacles to orderly urban expansion in the process of rapid urbanization. The eastern coastal economic zone performs the worst, followed by the middle reaches of the Yangtze River, and the southwest economic zone. The degree of population distribution and concentration is moderate, the highest population density being in the central region. The average population density in the Middle Yellow River economic zone reaches 4814.66 person/km2, and the average urban population density in the middle Yangtze River economic zone reaches 4177.58 person/km2.
In terms of spatial quality, the infrastructure level is well-developed, and environmental health level performance is good. Air quality varies greatly in different regions, with relatively high levels of obstruction in road network density, leisure and recreation, and ecological civilization. According to the indicator obstacle degrees of each region, China’s infrastructure is less obstructive, with a gas coverage rate of more than 90%. The western region is relatively backward, with only 87.79% in the northwest and more than 99% in the northern coastal economic zone. The overall health conditions are good, although the degree of obstacles in the western and northeastern regions is relatively high compared to the average. Air quality conditions vary widely. The northern coastal economic zone has the lowest average number of good air days: only 162 days a year. This is followed by the Middle Yellow River economic zone, with 197 days. The southern coastal economic zone has the best air quality, with an average of more than 300 days of good air in a year. Road network density, leisure and recreation level, and ecological civilization are the main indicators of obstacles to livability and comfort. The western region and the Middle Yellow River economic zone have the minimum density of road network. The leisure and recreation level in the southwestern and northeastern economic zones is the lowest. The southern coastal economic zone and the northwestern economic zone have the fewest national forests and geoparks.
4. Discussion
4.1. Unbalanced Spatial Distribution
The Chinese government has proposed the two centennial goals of “building a moderately prosperous society in an all-round way” and “building a modernized socialist country”. This not only underlines the large-scale accumulation of social wealth, but also implies a profound “equity orientation” in wealth distribution. The first, foremost task of urban development in China is to achieve balance, coordination, and sustainability”. Equity orientation reflected in the spatial dimension is the requirement to achieve common regional development. The identification of regional development imbalance characteristics is the primary task to achieve the balance, coordination, and sustainability of China’s urban development. The results show that UDQ in China shows an obvious zonal gradient, with a decreasing hierarchy from the southeast coastal region to the northwest region. Spatial efficiency, spatial structure, and spatial quality also exhibit an east–west hierarchical difference in space. Such spatial differences are largely determined by the natural resource endowments between regions and China’s regional development policies. Since 1985, China’s regional development strategy (“The CPC Central Committee’s Proposal for the Seventh Five-Year Plan for National Economic and Social Development”) has emphasized the advancement of the eastern region. However, this has led to a growing disparity between China’s regions, especially between east and west. Since the Ninth Five-Year Plan, the Central Government has proposed to reduce regional disparities through coordinated regional development. It calls for “active support for the pace of reform and opening up in the central and western regions”, “priority arrangements for resource development and infrastructure construction projects in the central and western regions”, and “guiding resource-processing and labor-intensive enterprises in the eastern region to move to the central and western regions”. The gap between regions has shown a narrowing trend, especially due to the rise of the central region. The results show that the central region exhibits a level of UDQ second only to the southern coastal economic zone, which also confirms the rise of the central region. The development of the northeast and northwest regions remains a key challenge in achieving UDQ in China. The spatial heterogeneity characteristic of the southern region, where the value of UDQ is higher than that of the north, also needs to be focused on. Policy makers can learn from the Western Development Strategy and the Rise of Central China. They need to consider additional strategies to promote development in northern China to narrow the sustainable development gap between northern and southern China.
4.2. Key Obstacle Indicators to Increasing the Level of UDQ in Chinese Cities
All systemic obstacles to UDQ in China’s cities are high, telling us that there is still much room for progress towards sustainable development in China’s cities. The Chinese government can prioritize removing obstacles that have a high impact on UDQ, such as industrial structure, land output level, and land consumption per unit of GDP. Integrated policy actions can remove barriers and promote quality urban development. China should continue to promote policies for the redevelopment of inefficient urban land, and use policies to guide the revitalization of stock land and optimization of incremental land. Efforts should be made to improve the level of input and output of urban space, increase the intensity of use, and enhance the carrying capacity of population and industry. The “retreating two into three” transformation and redevelopment projects, which represent withdrawing land for secondary industries and increasing land for tertiary industries, continue to be implemented, increasing the public service functions of cities to promote urban renewal and industrial transformation and upgrading. The Government should strengthen the top-level design of its policies. Through the preparation of special plans for the redevelopment of low-utility land in cities, it should clarify the objectives and tasks, the nature of the uses, the scale and layout, the timing, and the safeguards, consequently improving the spatial efficiency of China’s cities. At the same time, each region should formulate differentiated urbanization strategies based on the characteristics of its own indicators. For example, the northeastern economic region should focus on raising the level of land investment and public utility investment, while the eastern and central regions should focus on limiting the expansion of urban construction land and controlling the intensity of land development.
4.3. A Comparison of UDQ under Different Development Strategies
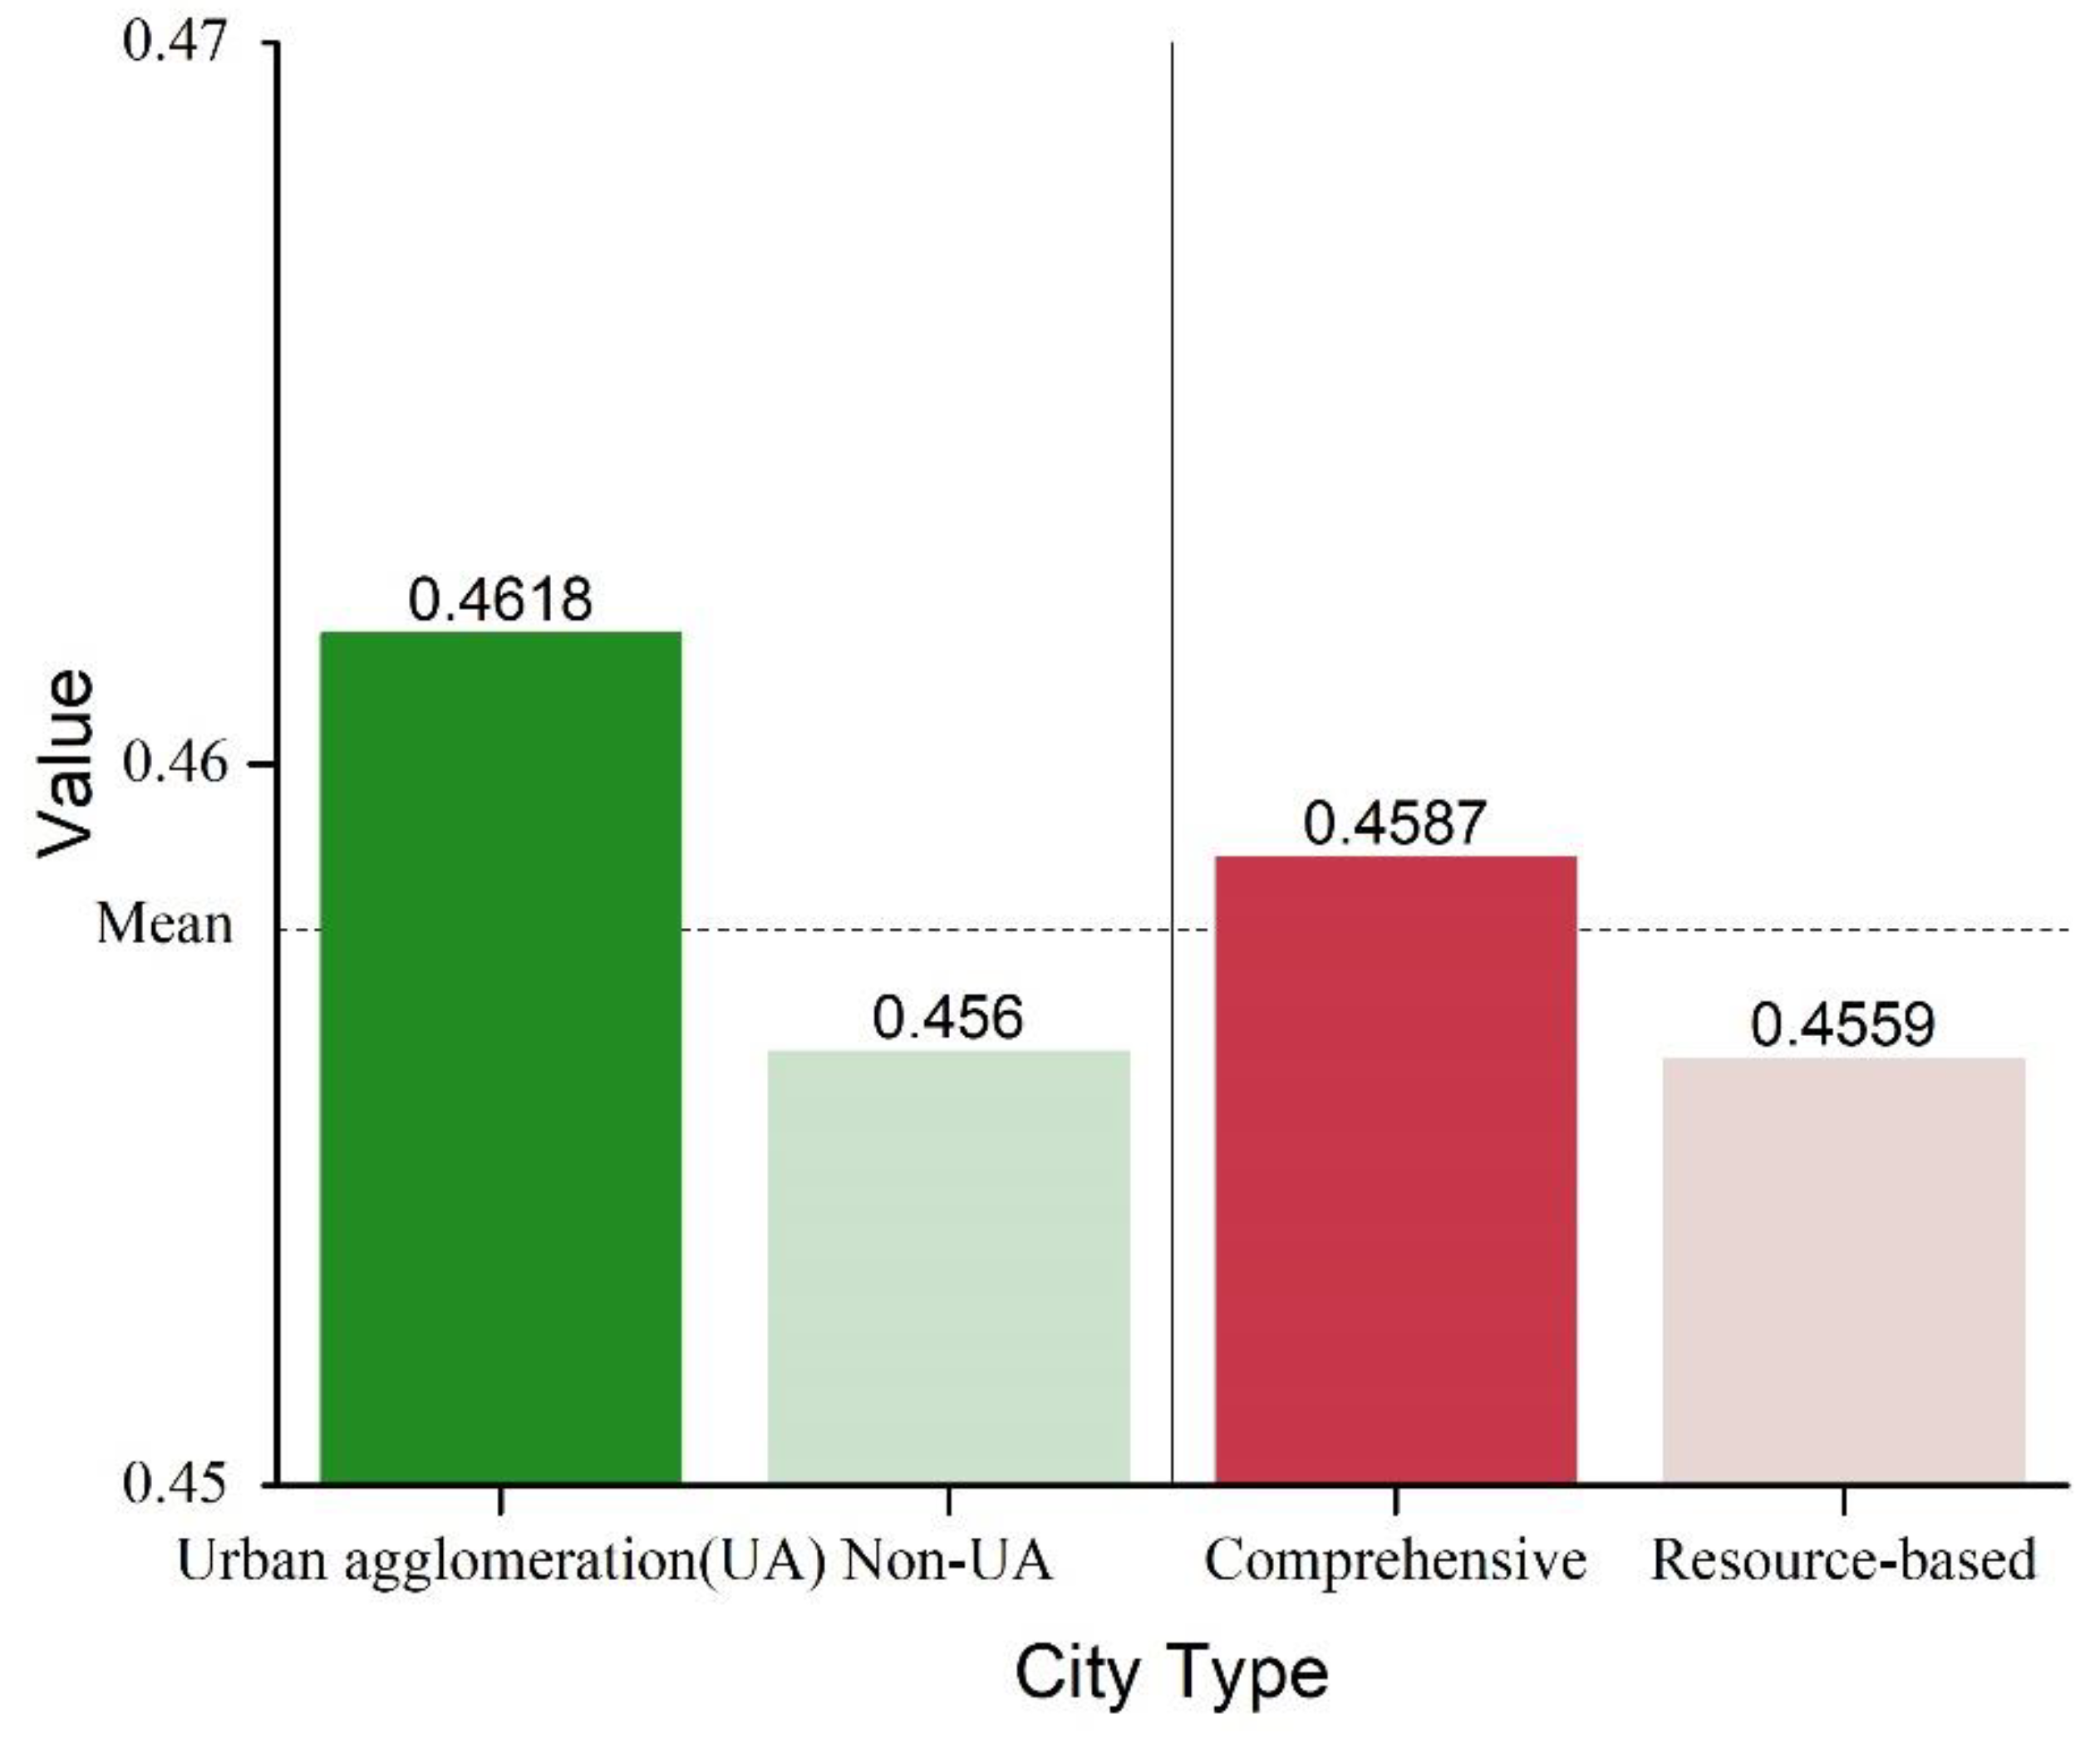
The National Territorial Planning Outline mentions that “the construction of land development clusters should be promoted, with urban agglomerations as the main form, to promote rational division of labor, complementary functions, and synergistic development of large, medium, small, and medium-sized cities and small towns.” In order to verify whether urban agglomerations contribute to China’s high-quality development, this paper measures the differences between urban agglomerations and non-urban areas. The results (Figure 7) show that the UDQ of non-urban clusters (0.4560) is lower than the national average, while the UDQ of urban clusters (0.4618) is significantly higher than that of non-urban clusters. It is noteworthy that the Central Plains urban agglomerations and the northeast Liaozhongnan urban agglomerations performed relatively poorly. Further breakdown of the index shows that the spatial efficiency, structure, and quality scores of urban agglomerations are all higher than those of non-urban agglomerations, with the advantage of spatial efficiency being the most significant. This indicates that the policy of urban agglomerations as the main spatial carrier of urbanization is generally appropriate, and using urban agglomerations as a development carrier can help improve the high-quality development of Chinese cities. In addition, the National Territorial Planning Outline also mentions “promoting coordinated regional development”, “supporting the transformation and development of resource-based regions”, and “promoting regional dislocation and synergistic development”. In order to further verify whether the dislocated synergistic development of prefecture-level cities contributes to their UDQ, this paper further compares the differences in UDQ levels between resource-based cities and integrated cities. Based on the National Sustainable Development Plan for Resource-Based Cities (2013–2020), it includes 127 cities at the prefecture level and above (according to the 2017 Chinese city administrative hierarchy). Accordingly, the Chinese cities above prefecture level in this study’s sample are classified into two categories: resource-based cities and comprehensive cities, of which 127 are resource-based cities and 209 are integrated cities. The results show that UDQ of integrated cities is significantly better than that of resource-based cities, and the average value of the index of integrated cities (0.4587) is higher than that of resource-based cities (0.4559). It also indicates that the development of functional synthesis as well as mismatched and coordinated functions of cities are more conducive to the sustainable development of cities. The structural analysis shows that the advantages of functionally integrated cities are mainly reflected in the relatively higher level of spatial quality.
4.4. Policy Guideline for Optimizing China’s Urban Space Use Pattern
The most significant change in National Territory Spatial Planning from previous planning is the integration of spatial planning, one of the core elements of which is the management and control of urban space. It provides a good solution to the current uneven sustainable development and high level of overall development obstacles in China; namely, to optimize the current pattern and mode of urban space utilization in China. Under the constraints of resource endowment, regional geography location and other characteristics, as well as path-dependence effects, it is difficult to eliminate the regional gap in China’s urban development. The original scale of urban space is no longer sufficient to meet the development requirements. There is a need to further promote the scale of key regions and expand from the original urban space to urban agglomerations. Leveraging on national strategies such as the Belt and Road, Beijing–Tianjin–Hebei collaborative development, and the Yangtze River Economic Belt, the construction of large scale and cross-regional key regions will be required to achieve greater economies of scale and agglomeration. At the same time, regional elements should be coordinated to give full play to their advantages and stimulate their intrinsic development potential. It is important to promote sustainable, coordinated, and healthy regional economic and social development, and to strengthen the sharing of development results among and within regions. Relying on major transport arteries and comprehensive transport networks, and focusing on the “two horizontal and three vertical” development axes, the Government will promote the intensive development of national land. Managers should guide the free and orderly movement and efficient concentration of production factors to transport arteries and connecting corridors, and promote the efficient allocation of resources and the deep integration of markets.
5. Conclusions
Based on the perspective of China’s territorial spatial planning and its sustainable development initiatives, we have developed the “four space” assessment framework. Focusing on “space”, it measures the UDQ in terms of four dimensions: whether space is efficiently used, whether space is functionally coherent, whether space is reasonably laid out, and whether space is livable and comfortable. UDQ evaluation based on policy initiatives will help to enhance the effectiveness of this policy implementation. Based on the regional heterogeneity of China’s UDQ and the identified barriers, we can better understand how urbanization policies and programs affect the quality of urbanization, and thus tailor policy guidance strategies to local conditions. This can also further guide China’s urban planning and management towards urban sustainability. From a methodological point of view, the introduction of the “four space” UDQ evaluation index system opens a new window for evaluating the quality of urbanization systems. In the foreseeable future, new urbanization will become the engine of China’s economic growth. This also suggests that more research will be conducted to study the high-quality development of cities and to explore the integrated coordination of efficiency, structure, function, and quality of urban space. We provide a framework for such studies to be assessed. In addition, China, as the largest developing country, is experiencing rapid urbanization and sustainable development challenges. It is necessary to explore sustainable spatial development paths in China under specific national conditions. China’s development pathways and models can also provide a reference point for policy makers in other developing countries to achieve sustainable development goals.
Author Contributions
Conceptualization, all authors; data collection, R.S. and M.L.; methodology, R.S.; formal analysis and writing—original draft, R.S.; writing—review and editing, all authors; funding acquisition, Y.H.; supervision, all authors. All authors have read and agreed to the published version of the manuscript.
Funding
This research was funded by the National Natural Science Foundation of China, grant number 41877034, and the Fundamental Research Funds for the Central Universities, grant number 2652018036&2652019311.
Data Availability Statement
The data presented in this study are available on request from the author.
Conflicts of Interest
The author declares no conflict of interest.
References
- World Bank. Available online: https://data.worldbank.org.cn/indicator/SP.URB.TOTL.IN.ZS?view=chart (accessed on 5 May 2021).
- United Nations. World Urbanization Prospects: The 2018 Revision. Available online: https://population.un.org/wup/Publications/Files/WUP2018-Report.pdf (accessed on 5 May 2021).
- Mori, K.; Christodoulou, A. Review of sustainability indices and indicators: Towards a new City Sustainability Index (CSI). Environ. Impact Assess. Rev. 2012, 32, 94–106. [Google Scholar] [CrossRef]
- Neirotti, P.; De Marco, A.; Cagliano, A.C.; Mangano, G.; Scorrano, F. Current trends in Smart City initiatives: Some stylised facts. Cities 2014, 38, 25–36. [Google Scholar] [CrossRef] [Green Version]
- Miao, L.; Zhu, F.; He, B.; Ferrat, M.; Liu, Q.; Cao, X.; Cui, X. Synthesis of China’s land use in the past 300 years. Glob. Planet. Chang. 2013, 100, 224–233. [Google Scholar] [CrossRef] [Green Version]
- United Nations. Transforming Our World: The 2030 Agenda for Sustainable Development. Available online: https://sustainabledevelopment.un.org/post2015/transformingourworld/publication (accessed on 4 May 2021).
- Bibri, S.E. A foundational framework for smart sustainable city development: Theoretical, disciplinary, and discursive dimensions and their synergies. Sustain. Cities Soc. 2018, 38, 758–794. [Google Scholar] [CrossRef]
- Wang, X.; Wan, G. China’s Urban Employment and Urbanization Rate: A Re-estimation. China World Econ. 2014, 22, 30–44. [Google Scholar] [CrossRef]
- McManamay, R.A.; DeRolph, C.R.; Surendran-Nair, S.; Allen-Dumas, M. Spatially explicit land-energy-water future scenarios for cities: Guiding infrastructure transitions for urban sustainability. Renew. Sustain. Energy Rev. 2019, 112, 880–900. [Google Scholar] [CrossRef]
- Zhang, P.; Yuan, H.; Tian, X. Sustainable development in China: Trends, patterns, and determinants of the “Five Modernizations” in Chinese cities. J. Clean. Prod. 2019, 214, 685–695. [Google Scholar] [CrossRef]
- Lindsey, T.C. Sustainable principles: Common values for achieving sustainability. J. Clean. Prod. 2011, 19, 561–565. [Google Scholar] [CrossRef]
- Feng, Z.; Jiang, H.; Lu, Y. China’s Economic -environment Comprehensive Zoning Based on Big Data Method and SOFM Clustering. Sci. Geogr. Sin. 2019, 39, 242–251. [Google Scholar] [CrossRef]
- Ganebnykh, E.; Burtseva, T.; Mironova, N.; Feoktistova, O. Quality assessment of urban environment. In Proceedings of the International Science Conference Spbwosce-2018: Business Technologies for Sustainable Urban Development, E3S Web of Conferences, EDP Sciences, St. Petersburg, Russia, 9 August 2019; Volume 110. [Google Scholar] [CrossRef]
- Li, W.; Yi, P.; Zhang, D.; Zhou, Y. Assessment of coordinated development between social economy and ecological environment: Case study of resource-based cities in Northeastern China. Sustain. Cities Soc. 2020, 59. [Google Scholar] [CrossRef]
- Pan, Y.; Zhang, B.; Wu, Y.; Tian, Y. Sustainability assessment of urban ecological-economic systems based on emergy analysis: A case study in Simao, China. Ecol. Indic. 2021, 121. [Google Scholar] [CrossRef]
- Nakamura, H. Relationship among land price, entrepreneurship, the environment, economics, and social factors in the value assessment of Japanese cities. J. Clean. Prod. 2019, 217, 144–152. [Google Scholar] [CrossRef]
- Akande, A.; Cabral, P.; Gomes, P.; Casteleyn, S. The Lisbon ranking for smart sustainable cities in Europe. Sustain. Cities Soc. 2019, 44, 475–487. [Google Scholar] [CrossRef]
- Scipioni, A.; Mazzi, A.; Mason, M.; Manzardo, A. The Dashboard of Sustainability to measure the local urban sustainable development: The case study of Padua Municipality. Ecol. Indic. 2009, 9, 364–380. [Google Scholar] [CrossRef]
- UN-HABITAT. The City Prosperity Initiative. Available online: http://newurbanagenda.org/reports-and-publications (accessed on 4 May 2021).
- Arcadis. Sustainable Cities Index 2018. Available online: https://www.arcadis.com/en/united-kingdom/our-perspectives/sustainable-cities-index-2018/united-kingdom/ (accessed on 4 May 2021).
- Mercer. Quality of Living Rankings. Available online: https://mobilityexchange.mercer.com/Insights/quality-of-living-rankings (accessed on 4 May 2021).
- Monocle. Quality of Life Survey. Available online: https://monocle.com/magazine/issues/125/quality-of-life-survey/ (accessed on 4 May 2021).
- Kearney, A.T. Global Cities Indexs. Available online: https://www.kearney.com/global-cities/2019 (accessed on 4 May 2021).
- The Economist Intelligence Unit. The Global Liveability Index 2019. Available online: https://www.eiu.com/public/topical_report.aspx?campaignid=liveability2019 (accessed on 4 May 2021).
- Phillis, Y.A.; Kouikoglou, V.S.; Verdugo, C. Urban sustainability assessment and ranking of cities. Comput. Environ. Urban Syst. 2017, 64, 254–265. [Google Scholar] [CrossRef]
- Xu, X.; Gao, J.; Zhang, Z.; Fu, J. An Assessment of Chinese Pathways to Implement the UN Sustainable Development Goal-11 (SDG-11)-A Case Study of the Yangtze River Delta Urban Agglomeration. Int. J. Environ. Res. Public Health 2019, 16, 2288. [Google Scholar] [CrossRef] [Green Version]
- Barnett, C.; Parnell, S. Ideas, implementation and indicators: Epistemologies of the post-2015 urban agenda. Environ. Urban. 2016, 28, 87–98. [Google Scholar] [CrossRef] [Green Version]
- Guan, X.; Wei, H.; Lu, S.; Dai, Q.; Su, H. Assessment on the urbanization strategy in China: Achievements, challenges and reflections. Habitat Int. 2018, 71, 97–109. [Google Scholar] [CrossRef]
- National Bureau of Statistics of China (NBSPRC). Statistical Bulletin on National Economic and Social Development of the People’s Republic of China 2019. Available online: http://www.stats.gov.cn/tjsj/zxfb/202002/t20200228_1728913.html (accessed on 5 May 2021).
- Huang, L.; Yan, L.; Wu, J. Assessing urban sustainability of Chinese megacities: 35 years after the economic reform and open-door policy. Landsc. Urban Plan. 2016, 145, 57–70. [Google Scholar] [CrossRef]
- Xu, F.; Huang, Q.; Yue, H.; He, C.; Wang, C.; Zhang, H. Reexamining the relationship between urbanization and pollutant emissions in China based on the STIRPAT model. J. Environ. Manag. 2020, 273. [Google Scholar] [CrossRef]
- Liu, Q.; Wang, S.; Li, B.; Zhang, W. Dynamics, differences, influencing factors of eco-efficiency in China: A spatiotemporal perspective analysis. J. Environ. Manag. 2020, 264. [Google Scholar] [CrossRef]
- The State Council of the People’s Republic of China. China’s 21st Century Agenda White Paper on China’s Population, Environment and Development in the 21st Century; Environmental Science Press: Beijing, China, 1995.
- Tan, Y.; Xu, H.; Zhang, X. Sustainable urbanization in China: A comprehensive literature review. Cities 2016, 55, 82–93. [Google Scholar] [CrossRef]
- Bryan, B.A.; Gao, L.; Ye, Y.; Sun, X.; Connor, J.D.; Crossman, N.D.; Stafford-Smith, M.; Wu, J.; He, C.; Yu, D.; et al. China’s response to a national land-system sustainability emergency. Nature 2018, 559, 193–204. [Google Scholar] [CrossRef]
- Jiang, Y.; Sun, S.; Wang, Y.; Zheng, S. Niche Evolution of China’s Provincial Social-Economic-Natural Complex Ecosystems, 2005–2015. Sustainability 2018, 10, 2824. [Google Scholar] [CrossRef] [Green Version]
- The State Council of the People’s Republic of China. The Outline of the National Territory Planning (2016–2030). Available online: http://www.gov.cn/zhengce/content/2017-02/04/content_5165309.htm (accessed on 4 May 2021).
- The State Council of the People’s Republic of China. Opinions of the Central Committee of the Communist Party of China and the State Council on the Establishment of National Territory Spatial Planning System and Supervision of Its Implementation. Available online: http://www.gov.cn/zhengce/2019-05/23/content_5394187.htm (accessed on 4 May 2021).
- Zhang, W.; Wang, M.Y. Spatial-temporal characteristics and determinants of land urbanization quality in China: Evidence from 285 prefecture-level cities. Sustain. Cities Soc. 2018, 38, 70–79. [Google Scholar] [CrossRef]
- Tang, Y.; Yuan, Y.; Zhong, Q. Evaluation of Land Comprehensive Carrying Capacity and Spatio-Temporal Analysis of the Harbin-Changchun Urban Agglomeration. Int. J. Environ. Res. Public Health 2021, 18, 521. [Google Scholar] [CrossRef] [PubMed]
- Cui, X.; Fang, C.; Liu, H.; Liu, X. Assessing sustainability of urbanization by a coordinated development index for an Urbanization-Resources-Environment complex system: A case study of Jing-Jin-Ji region, China. Ecol. Indic. 2019, 96, 383–391. [Google Scholar] [CrossRef]
- Liu, J.; Hou, X.; Wang, Z.; Shen, Y. Study the effect of industrial structure optimization on urban land-use efficiency in China. Land Use Policy 2021, 105, 0264–8377. [Google Scholar] [CrossRef]
- Chen, Y.; Zhu, M.; Lu, J.; Zhou, Q.; Ma, W. Evaluation of ecological city and analysis of obstacle factors under the background of high-quality development: Taking cities in the Yellow River Basin as examples. Ecol. Indic. 2020, 118. [Google Scholar] [CrossRef]
- Fu, Y.; Zhou, T.; Yao, Y.; Qiu, A.; Wei, F.; Liu, J.; Liu, T. Evaluating efficiency and order of urban land use structure: An empirical study of cities in Jiangsu, China. J. Clean. Prod. 2021, 283. [Google Scholar] [CrossRef]
- Liu, J.; Jiao, L.; Zhang, B.; Xu, G.; Yang, L.; Dong, T.; Xu, Z.; Zhong, J.; Zhou, Z. New indices to capture the evolution characteristics of urban expansion structure and form. Ecol. Indic. 2021, 122. [Google Scholar] [CrossRef]
- Lan, T.; Shao, G.; Xu, Z.; Tang, L.; Sun, L. Measuring urban compactness based on functional characterization and human activity intensity by integrating multiple geospatial data sources. Ecol. Indic. 2021, 121. [Google Scholar] [CrossRef]
- Duque, J.C.; Lozano-Gracia, N.; Patino, J.E.; Restrepo, P. Urban form and productivity: What shapes are Latin-American cities? Environ. Plan. B-Urban Anal. City Sci. 2021. [Google Scholar] [CrossRef]
- De Montis, A.; Serra, V.; Ganciu, A.; Ledda, A. Assessing Landscape Fragmentation: A Composite Indicator. Sustainability 2020, 12, 9632. [Google Scholar] [CrossRef]
- Guo, M.; Bu, Y.; Cheng, J.; Jiang, Z. Natural Gas Security in China: A Simulation of Evolutionary Trajectory and Obstacle Degree Analysis. Sustainability 2019, 11, 96. [Google Scholar] [CrossRef] [Green Version]
- Wang, Q.; Xu, Z.; Yuan, Q.; Yuan, X.; Zuo, J.; Song, Y.; Wang, M. Evaluation and countermeasures of sustainable development for urbanenergy-economy-environmentsystem: A case study of Jinan in China. Sustain. Dev. 2020, 28, 1663–1677. [Google Scholar] [CrossRef]
Figure 1.
Urban development quality (UDQ) goals and initiatives based on National Territory Spatial Planning in China.
Figure 1.
Urban development quality (UDQ) goals and initiatives based on National Territory Spatial Planning in China.

Figure 2.
Comprehensive score of UDQ in China.

Figure 3.
Subregional statistics on the score of UDQ in China.

Figure 4.
The scores of UDQ in China of subdimensions. ((a). Spatial efficiency; (b). Spatial structure; (c). Spatial form; (d). Spatial quality).
Figure 4.
The scores of UDQ in China of subdimensions. ((a). Spatial efficiency; (b). Spatial structure; (c). Spatial form; (d). Spatial quality).

Figure 5.
Subregional statistics of scores in China by subobjective. ((a). Spatial efficiency; (b). Spatial structure; (c). Spatial form; (d). Spatial quality).
Figure 5.
Subregional statistics of scores in China by subobjective. ((a). Spatial efficiency; (b). Spatial structure; (c). Spatial form; (d). Spatial quality).

Figure 6.
Heat map of indicator obstacles to UDQ system in China.

Figure 7.
Comparison of UDQ in different types of cities in China.


Table 1.
System for evaluating the level of UDQ (+ (−)) indicates that the higher (lower) the indicator, the better the level of UDQ.
Table 1.
System for evaluating the level of UDQ (+ (−)) indicates that the higher (lower) the indicator, the better the level of UDQ.
| Initiative Goals | Indicator | Units | Calculation Method | References |
|---|---|---|---|---|
| Spatial efficiency | X1 Land input level (+) | Yuan/km2 | Fixed-asset investment/Construction land | [39] |
| X2 Public utility investment level (+) | Yuan/km2 | Regional public expenditure/Construction land | [40] | |
| X3 Land output level (+) | Yuan/km2 | GDP/Construction land | [39,41] | |
| X4 Economic output level (+) | % | Percentage of the secondary and tertiary industry | [39,41] | |
| X5 Land consumption per unit GDP (−) | km2/Yuan | New construction land/GDP growth | [42] | |
| X6 Land consumption per unit fixed-asset investment (−) | km2/Yuan | New construction land/Fixed-asset investment growth | [42] | |
| Spatial structure | X7 Ecological land ratio (+) | % | Cultivated, forested, and grassland areas/Total area | [41,43] |
| X8 Industrial structure (+) | % | Tertiary industry land/Construction land | [42] | |
| X9 Public service land structure (+) | % | Public service land/Tertiary industry land | [42] | |
| X10 Land development intensity (−) | % | Built-up land/Total area | [39,41] | |
| Spatial form | X11 Population concentration (+) | Person/km2 | Population density | [39] |
| X12 Orderly degree of urban expansion (−) | % | New construction land/Construction land | [39] | |
| X13 Land use balance (+) | / | I = A: total area; N: Number of land use type; : (i = 1; 2 …; n) each type of land use area | [44] | |
| X14 Fractal dimension (−) | / | DI = 2 ln(P/4)/ln(A) P: the perimeter of construction land; A: the area of construction land | [45,46,47] | |
| X15 Landscape fragmentation (−) | / | C = F/A F: Number of patches of construction land; A: construction land area | [48] | |
| Spatial quality | X16 Infrastructure Level (+) | % | Gas coverage rate | [39,43] |
| X17 Environmental health level (+) | % | Waste water treatment rate | [39,43] | |
| X18 Leisure and recreation level (+) | m2 | Public green space per capita | [39] | |
| X19 Road network density (+) | km/km2 | Density of road network in built-up area | [39,40] | |
| X20 Air quality conditions (+) | % | Proportion of days with good air quality | [13] | |
| X21 Ecological civilization level (+) | / | Total number of national forest parks and geoparks | [41] |
Table 2.
Grouping of cities based on the partitioning of China’s economic geography.
| Economic Zone | Four Plates | Study Cities |
|---|---|---|
| Eastern coastal economic zone (EC) | Eastern China | 25 |
| Northern coastal economic zone (NC) | 30 | |
| Southern coastal economic zone (SC) | 38 | |
| Middle Yellow River economic zone (MYRN) | Central China | 50 |
| Middle Yangtze River economic zone (MYRS) | 55 | |
| Northwest economic zone (NW) | Western China | 43 |
| Southwest economic zone (SW) | 60 | |
| Northeast economic zone (NE) | Northeast China | 35 |
Publisher’s Note: MDPI stays neutral with regard to jurisdictional claims in published maps and institutional affiliations. |
© 2021 by the authors. Licensee MDPI, Basel, Switzerland. This article is an open access article distributed under the terms and conditions of the Creative Commons Attribution (CC BY) license (https://creativecommons.org/licenses/by/4.0/).
Share and Cite
MDPI and ACS Style
Song, R.; Hu, Y.; Li, M. Chinese Pattern of Urban Development Quality Assessment: A Perspective Based on National Territory Spatial Planning Initiatives. Land 2021, 10, 773. https://0-doi-org.brum.beds.ac.uk/10.3390/land10080773
AMA Style
Song R, Hu Y, Li M. Chinese Pattern of Urban Development Quality Assessment: A Perspective Based on National Territory Spatial Planning Initiatives. Land. 2021; 10(8):773. https://0-doi-org.brum.beds.ac.uk/10.3390/land10080773
Chicago/Turabian StyleSong, Rong, Yecui Hu, and Mengqi Li. 2021. "Chinese Pattern of Urban Development Quality Assessment: A Perspective Based on National Territory Spatial Planning Initiatives" Land 10, no. 8: 773. https://0-doi-org.brum.beds.ac.uk/10.3390/land10080773
Note that from the first issue of 2016, this journal uses article numbers instead of page numbers. See further details here.