1. Introduction
Biodiversity is defined as the diversity of organisms arising from land, aquatic, and other complex ecosystems and includes the diversity within species, diversity between species, and ecosystem diversity [
1]. Healthy biodiversity is a source of various resources and services necessary to support human survival, prosperity, and well-being [
2,
3]. Biodiversity is, however, declining globally at a historically fast rate, as a consequence of continued human population and economic growth [
4,
5,
6]. International societies have recognized the rapid rate of anthropogenic-induced ecological degradation and have encouraged ecosystem-based approaches, scientifically credible assessments of biodiversity, and nature-based solutions [
6,
7]. Accordingly, individual countries, including parties to the Convention on Biodiversity, aim to assess biodiversity comprehensively and systematically for supporting decision-making based on these assessment results and to prompt public and private actions to ensure that current and future generations are able to use biological resources [
6].
Biodiversity is affected by habitat change, presence of invasive species, climate change, overfishing, deforestation, disease, nutrient loading, and pollution [
8,
9,
10]. A habitat is defined as “the resources and conditions present in an area that produce occupancy—including survival and reproduction—by a given organism” [
11], and habitat change is the most prominent factor causing the deterioration of biodiversity [
10,
12,
13,
14]. Conserving habitats quantitatively and qualitatively is a highly effective way of securing the sustenance of biodiversity [
15,
16,
17,
18]. Habitat quantity can be regarded as the area of a habitat, and habitat quality as the ability of a habitat to provide conditions that facilitate the persistence of a species, a population, or a community in terms of the resources available within a given ecosystem [
11]. Habitat quality determines the composition, reproduction, distribution, behavior, and movement of the habitat’s species, as well as its maintenance, as it affects the acquisition and usage of resources essential for survival [
19,
20]. Therefore, the enhancement of habitat quality is as necessary as increasing the habitat quantity [
21].
However, habitat quality is rarely accounted for sufficiently, when devising biodiversity-focused strategies and action plans, due to the following reasons: limited investigation of habitat quality within specific spaces such as protected areas, insufficient data on factors determining habitat quality, difficulty in quantification by the lack of standard measurement units for habitat quality, complex assessment process of habitat quality, and verification shortage of assessment results. Nevertheless, new approaches [
22,
23,
24,
25,
26,
27,
28,
29,
30,
31,
32,
33] that evaluate biodiversity in terms of habitat quality have recently been established. Nelson et al. [
22], Polasky et al. [
23], Terrado et al. [
24], Ntshane et al. [
25], and Salata et al. [
26] assessed and mapped habitat quality. Xu et al. [
27] monitored the temporal and spatial evolution of habitat quality. Based on the assessment of habitat quality, Terrado et. al. [
28] and Nematollahi et al. [
29] identified vulnerable habitats, and Wang et al. [
30] and Duarte et al. [
31] prioritized habitats for protection. Zhu et al. [
32] evaluated the impact of urbanization and landscape pattern on habitat quality. Gibson and Quinn [
33] assessed habitat quality using land development scenarios and utilized them for landscape planning. Thus, the authors of the aforementioned studies (1) assessed habitat quality; (2) identified, in advance, significant or vulnerable zones of biodiversity, particularly in relation with development plans; and (3) assisted decision makers in formulating actions to be prioritized for the protection and restoration of biodiversity, as well as for mitigation and adaption to biodiversity loss.
South Korea is under severe developmental pressure, propelled by national, local, and infrastructure development projects designed to meet the needs of its large population, as well as by the prioritization of economic growth. This has resulted in physical changes to habitats and continuous deterioration to their quantity and quality [
34]. The country has implemented various policies for the enhancement of biodiversity-containing habitats, such as expanding protected areas, securing habitats, and restoring ecological networks. However, the qualitative improvements in habitats are yet to be realized, principally because of the lack of accurate assessment and proper management of habitat quality. Therefore, we aimed to: (1) examine the land-cover changes having the largest relative negative impact on habitat [
6], which occurred between 1989 and 2019 on Jeju Island, South Korea, where rich ecosystems and development pressures coexist; (2) assess the change in habitat quality over 30 years; and (3) propose management plans to improve biodiversity by connecting policy alternatives and application target zones based on these assessment results.
2. Materials and Methods
2.1. Study Area
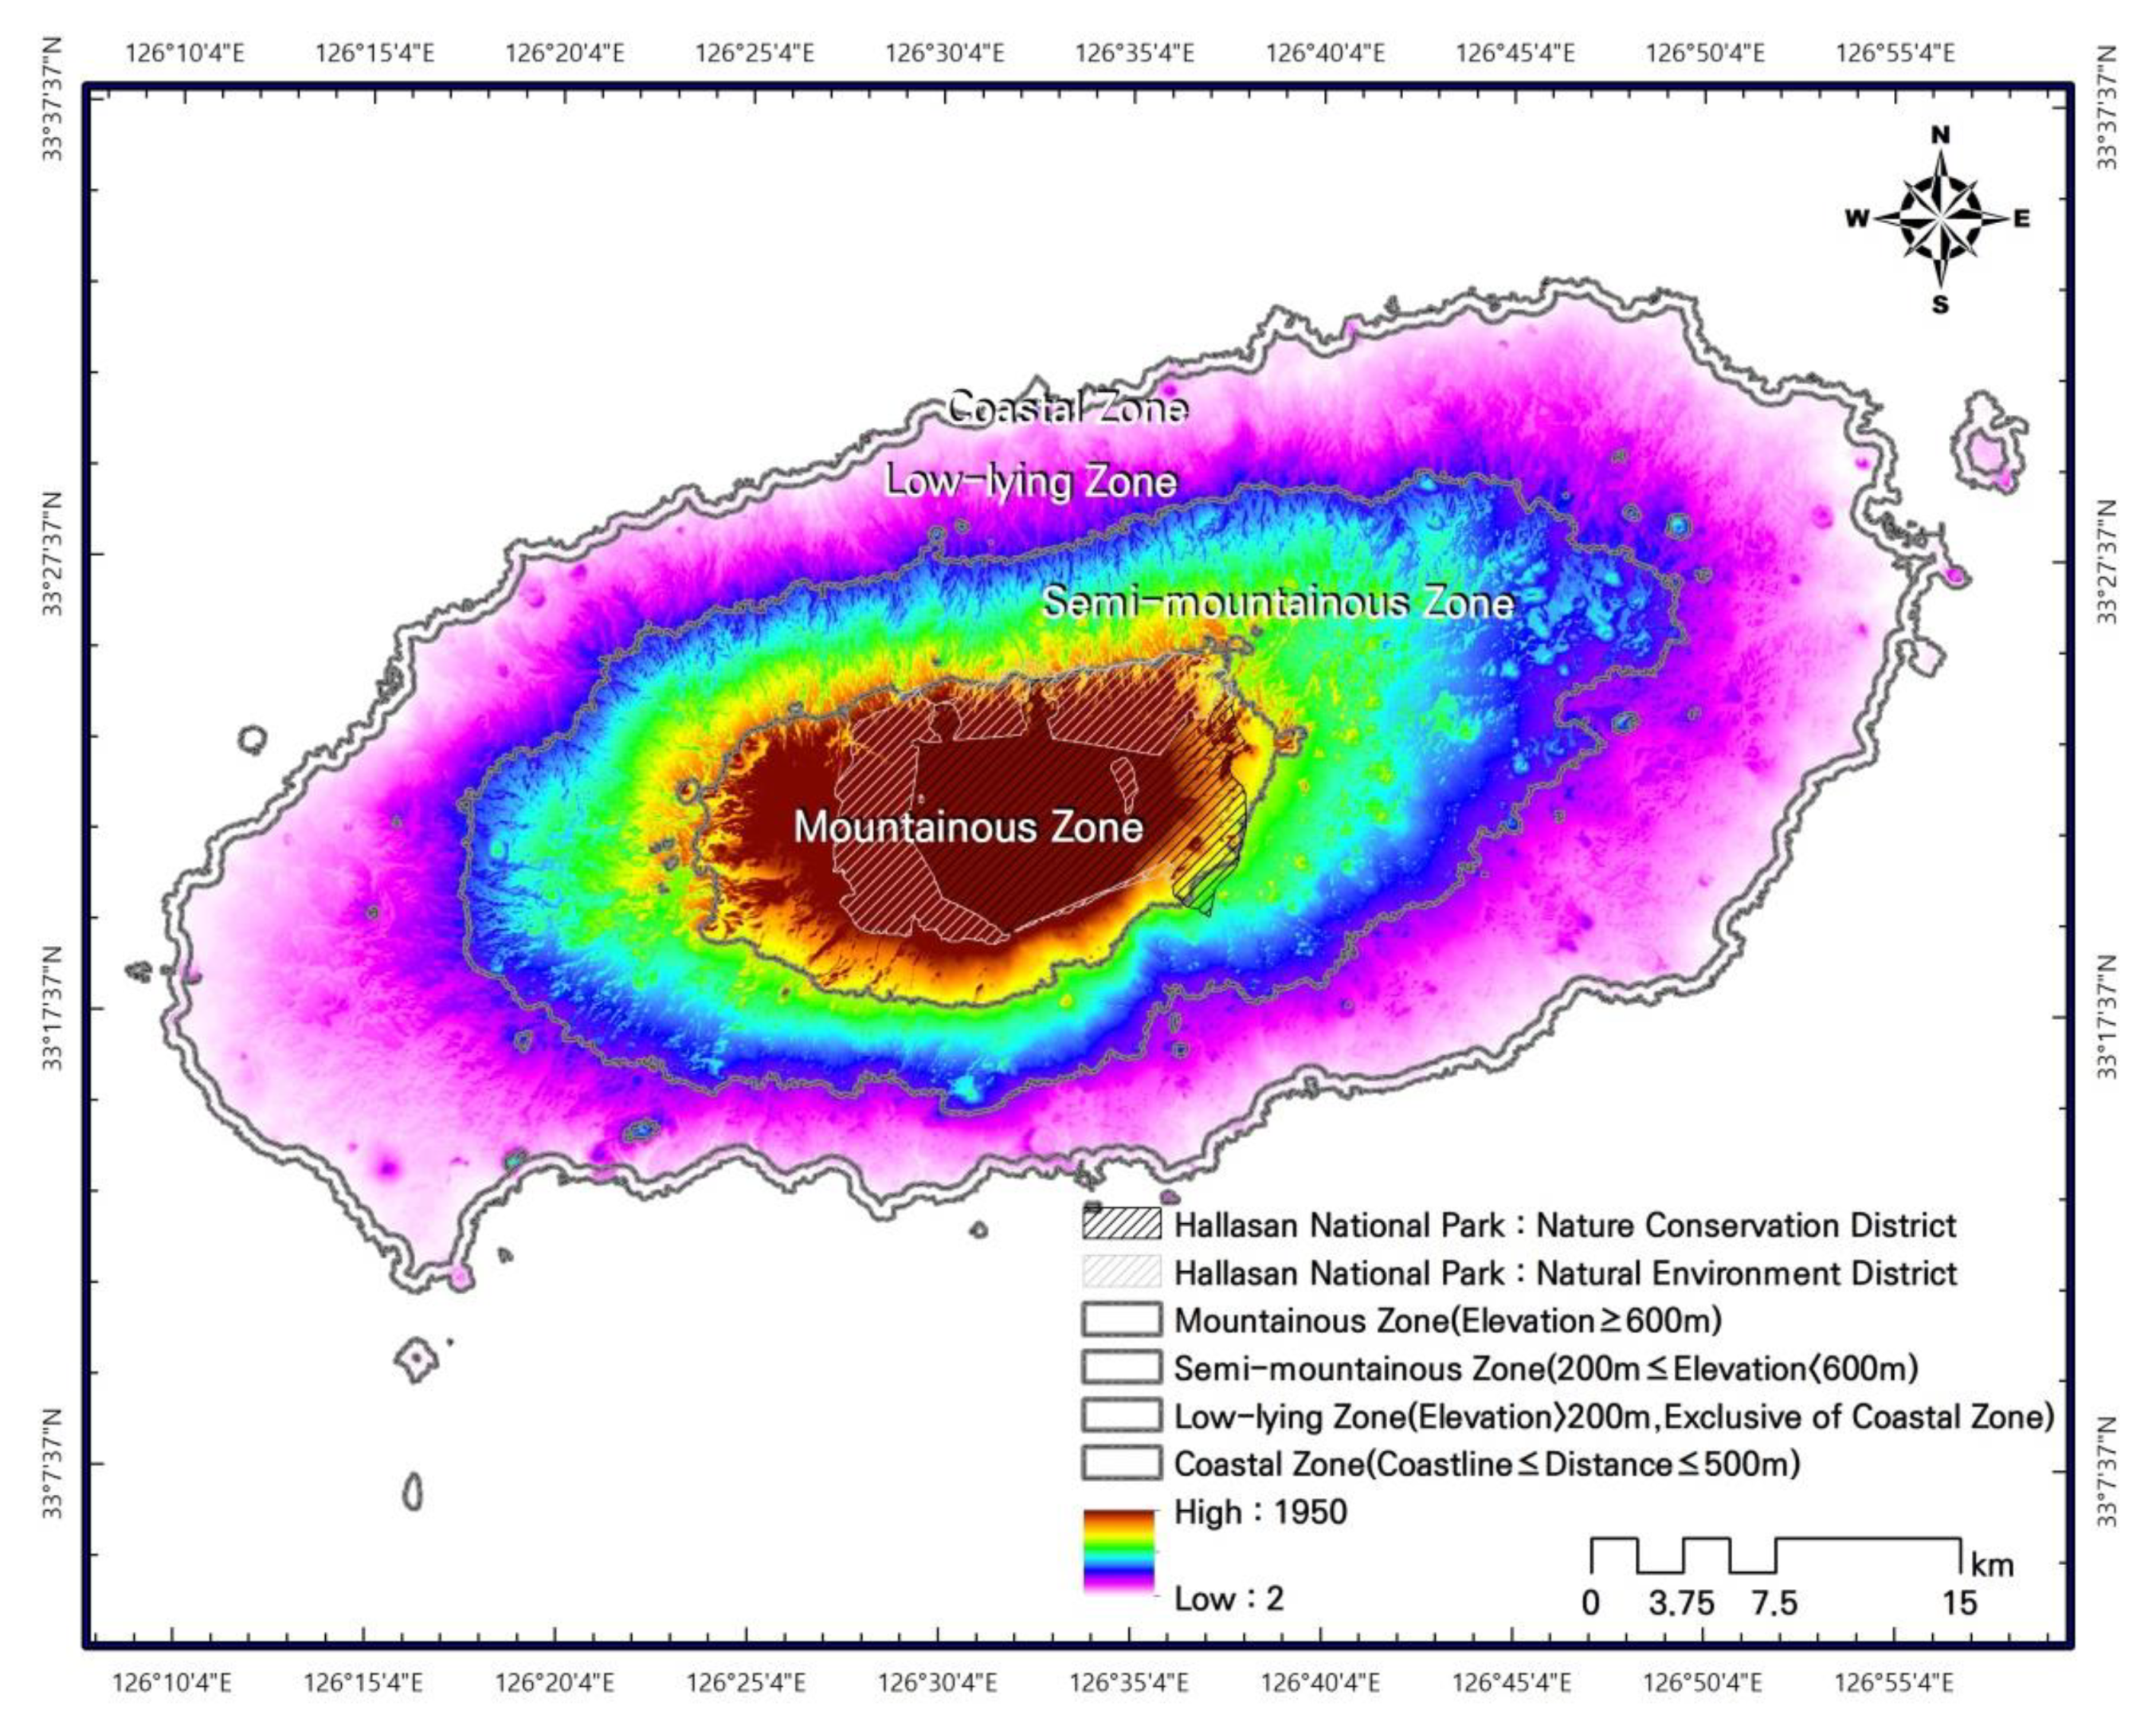
Jeju is a volcanic island in South Korea and has a rich natural heritage. It is the only area in the world where various internationally designated protected areas are located within the same location: World Heritage, Biosphere Reserve, Global Geopark, and RAMSAR Wetland. Jeju is inhabited by approximately 4600 species and was recently voted as a Wonder of Nature [
35]. Jeju is composed of (1) mountainous, (2) semi-mountainous, (3) low-lying, and (4) coastal zones. Halla Mountain is located in the mountainous zone (from 600 to 1950 m) and contains a national park. The national park is surrounded by the semi-mountainous zone (between 200 and 600 m) that connects the protected area to the urban district, a low-lying zone (below 200 m; excluding the coastal zone) that predominantly encompasses residential and business districts and a coastal zone that is composed of a tourism and business district (with a standard 500 m coastline buffer zone) (
Figure 1).
The biodiversity of Jeju is subject to social and economic pressures from development that have already adversely affected habitats and damaged biodiversity. This has been exacerbated by the release of green belts that had once prevented urban sprawl and ensured a healthy living environment for citizens through the conservation of the biodiversity surrounding cities [
36]. This pressure on biological resources is being intensified by large-scale projects and related real estate development in the semi-mountainous, low-lying, and coastal zones. These developments cause a major influx of tourists and immigrants. The resulting demand for biological resources threatens the sustainability of the biodiversity of Jeju.
2.2. InVEST Habitat Quality Model
The Natural Capital Project has developed a decision-making support software model, named InVEST (Integrated Valuation of Environmental Services and Tradeoffs; copyright by Natural Capital Project; version 3.9.0), which is based on the assessment of the services provided by ecosystems and biodiversity [
37]. InVEST assesses habitat quality within a spatial context by combining habitat types with threat factors, to evaluate the spatial extent and degradation of a habitat. We used a corresponding model for habitat quality assessment governed by Equation (1), where habitat suitability (H
j) was converted to a numerical value (
Qxj) using a half-saturation function, thereby scoring the degree of the threat of habitat degradation (
Dxj).
where
Qxj represents the habitat quality in grid cell
x with land use/land cover (LULC) type
j;
Hj represents the habitat suitability with LULC type
j for survivability of a species, a population, or a community;
Dxj represents the impact of threats on habitat in grid cell
x with LULC type
j;
z represents the scaling constant (2.5); and
k represents the half-saturation constant (0.5).
2.3. Construction of Input Data
Habitat quality is affected by habitat type, habitat suitability, factors threatening habitat quality, habitat sensitivity to threat factors, and habitat accessibility [
28,
33,
34]. Habitat type was categorized as water, urban land, barren land, wetland, grassland, forest land, and agricultural land. Habitat suitability (0.00 (uninhabitable)–1.00 (ideally habitable)) for each habitat type was set based on literature review [
24,
38,
39] and local conditions (
Table 1). We set the habitat suitability to consider characteristics of Jeju based on a field survey and an interview with local experts, while ensuring, as much as possible, that the range of values used in existing research is not exceeded. The habitat suitability of forest land, habitable for wildlife due to the presence of various resources, and that of urban land, uninhabitable for wildlife due to the predominance of human activities, was set at 0.86 and 0.00, respectively. Agricultural land provides habitat space and food for wildlife. In South Korea, however, agricultural practices are typically intensive, and generally, have a detrimental effect on ecosystems and biodiversity. Accordingly, the suitability of agricultural land was set at 0.30, which was lower than that of grassland.
Habitats are altered by farming, urbanization, development, deforestation, natural disasters, and pollution [
12]. We selected agriculture, urbanization, building of roads, forest fragmentation, vulnerability to natural disasters, and pollution treatment facilities as the elements threatening habitat quality and constructed these as spatial data. Agricultural land, urban land, and roads were identified from a land-cover map (issued by the Ministry of Environment, South Korea). Fragmented forests were constructed by extracting fragmented areas of less than 10 ha from the forest patches that were previously larger than 10 ha in area, based on a time-series analysis of land-cover maps (1989, 2019). In South Korea, forest patches 10 ha in area do not act as base habitats for the stable inhabitation of wildlife, but they serve as ecological stepping stones where wildlife rest while migrating or where they come to for food [
40,
41]. Areas that have been designated as districts requiring improvements to prevent natural disasters or have a history of flooding were selected as areas vulnerable to disasters. We selected sewage treatment plants, wastewater disposal plants, wastewater treatment plants, filtration plants, waste disposal facilities, and landfills as pollution treatment facilities. As in the case of habitat suitability, we established the properties (relative intensity, maximum impact distance, and type of decay based on distance) of threats to habitat sensitivity, to decisively analyze the impact on habitat sensitivity of these threats, based on literature review [
24,
38,
39] and assessment of the local condition (
Table 1).
Protected areas in South Korea are designated in keeping with laws specific to the area of interest. Wetland protection areas, specified islands, natural parks, natural monument designation areas, absolute preservation areas, ecosystem preservation areas, river zones, water source protection areas, green zones, and preserved mountainous areas are public interest areas for the conservation of biodiversity. Habitat accessibility for these areas can be categorized according to the level of acceptable activity and restricted access, as stipulated in the area-specific laws. We set the accessibility value of each protected area based on individually categorized levels of protection and usage intensity. We set the accessibility of strictly protected areas as 0.1 and that of non-protected areas as 1.0.
2.4. Habitat Quality Assessment
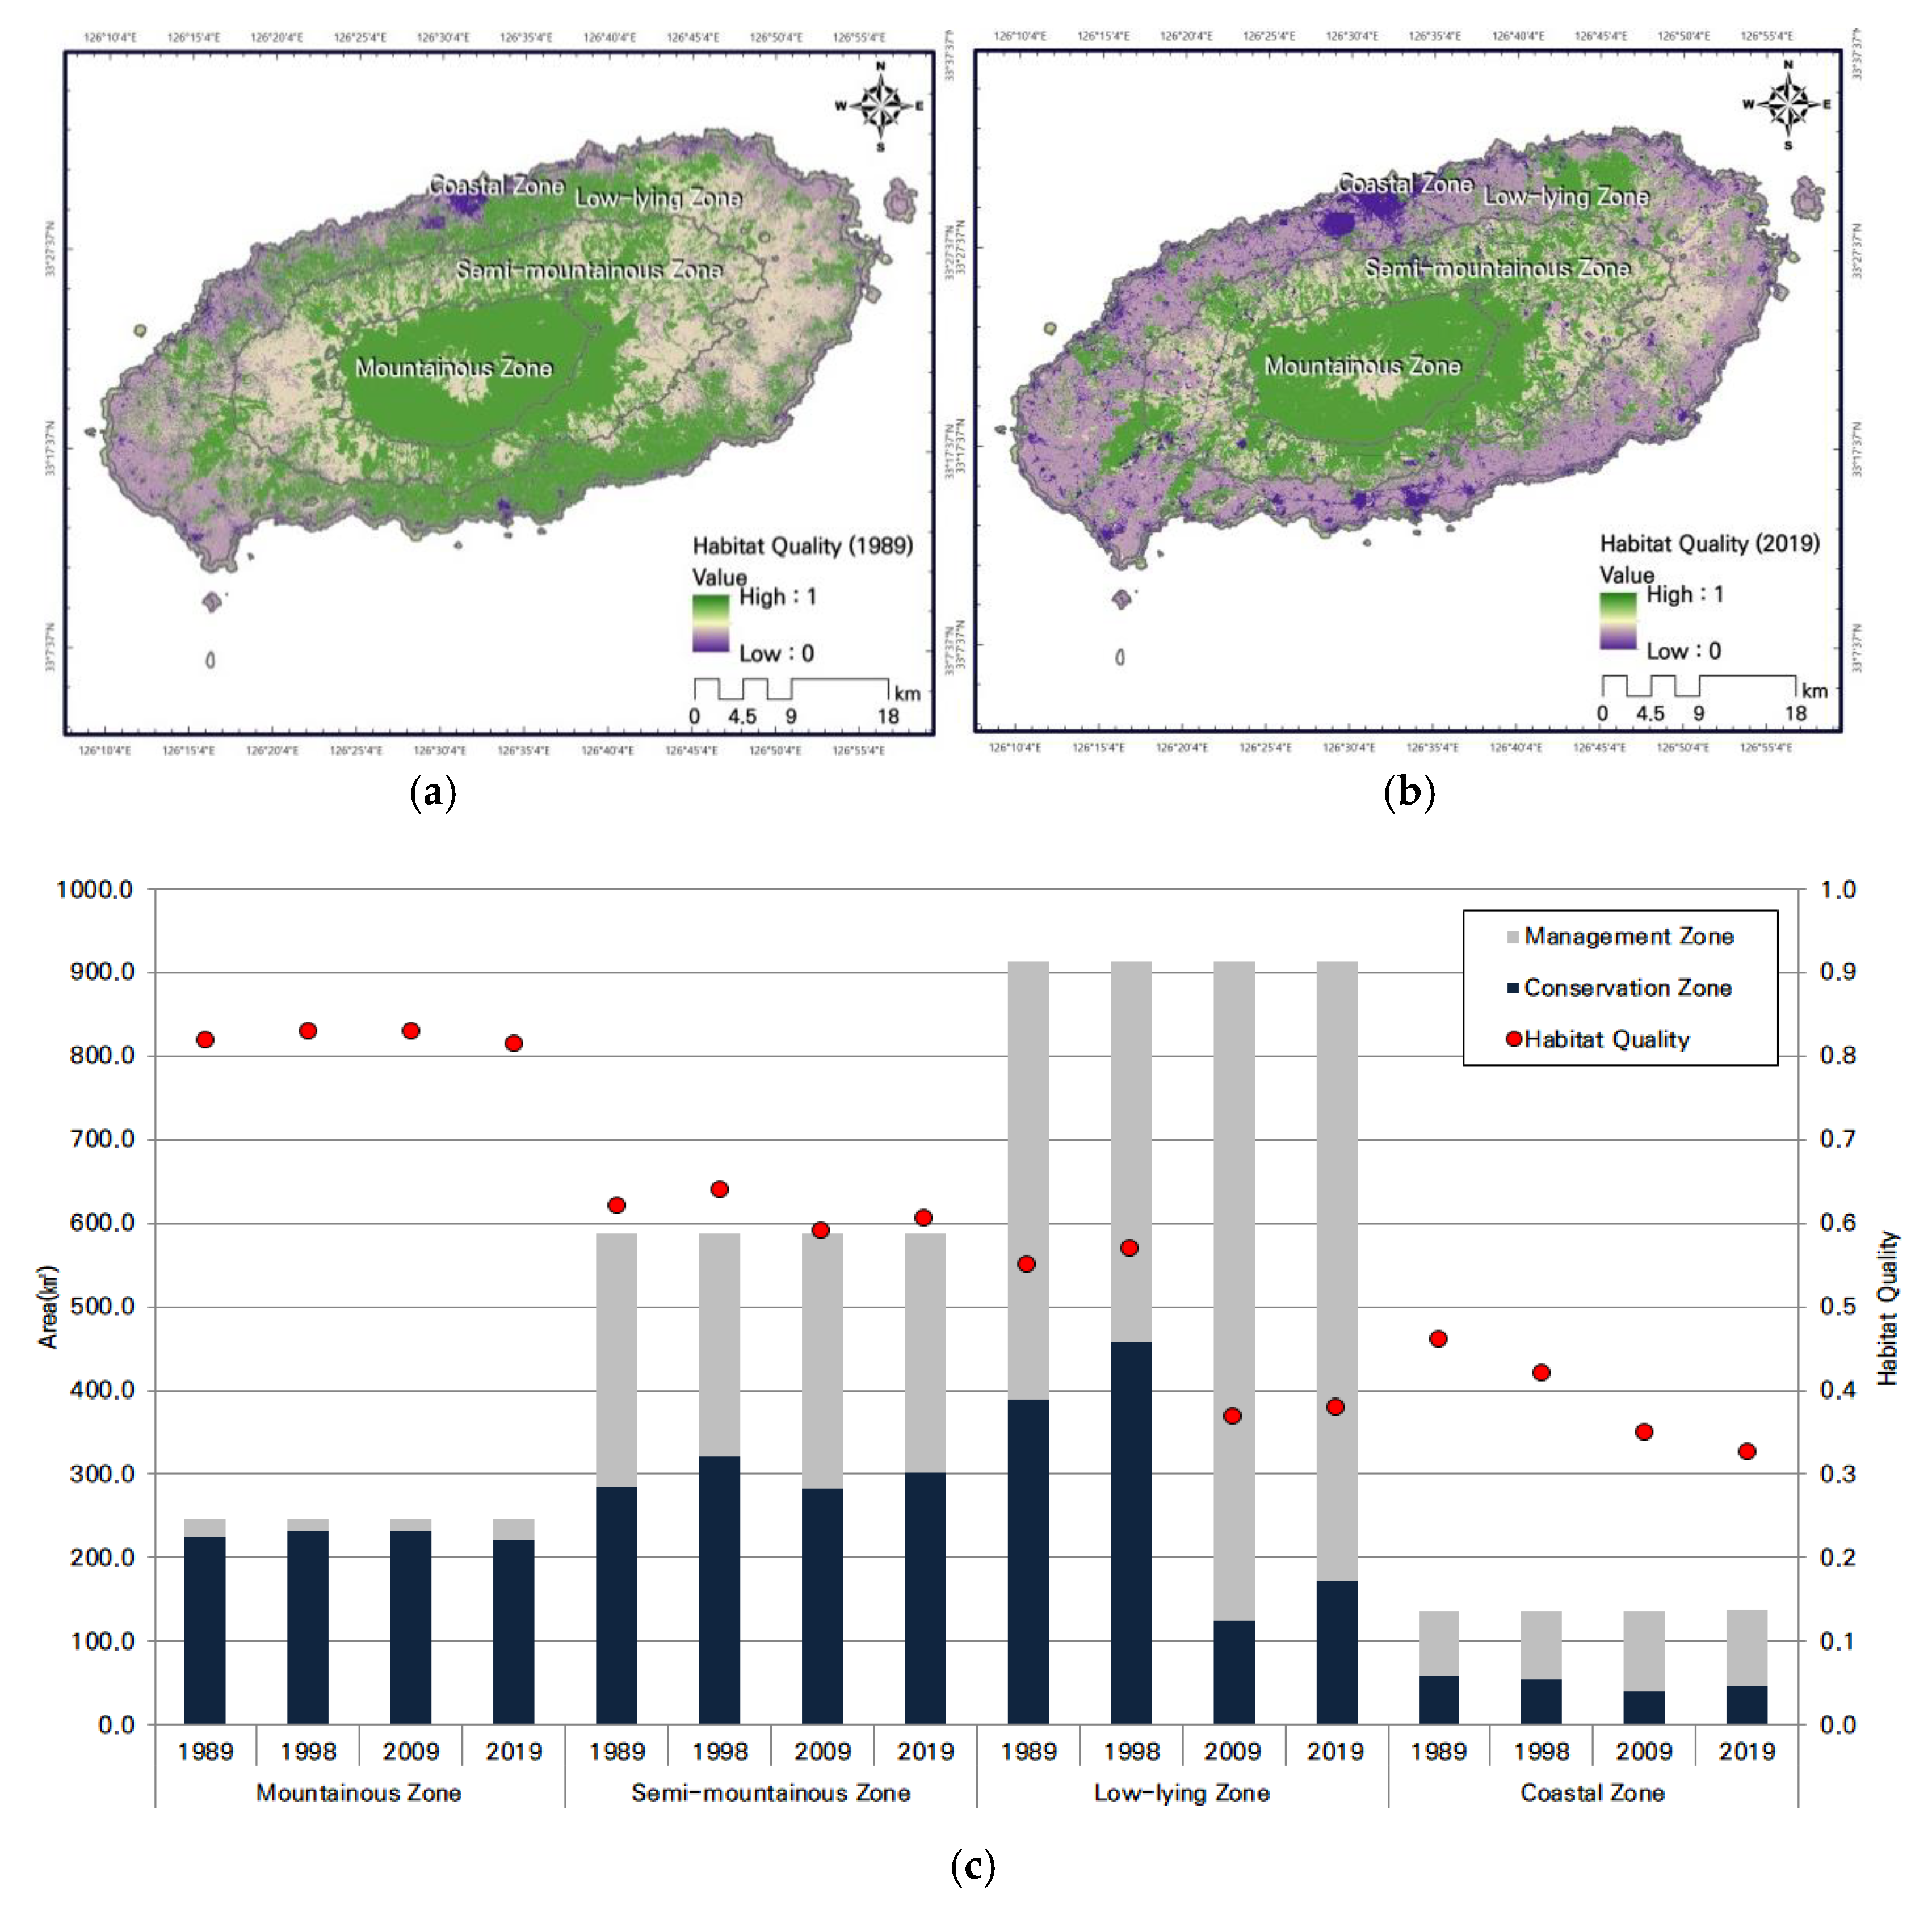
We assessed habitat quality throughout Jeju by running the model using our input data. As biodiversity of Jeju has different characteristics according to elevation, we categorized the physical geography of the island into mountainous, semi-mountainous, low-lying, and coastal zones according to altitude (
Figure 1) and analyzed the habitat quality for each zone.
The Ministry of Environment, South Korea conducted a field investigation of topography, geology, natural landscapes, green zones, vegetation, and soil, as a part of efforts toward the conservation of biodiversity. This investigation involved a demarcation of the spots where wildlife, including mammals, birds, reptiles, amphibians, fish, insects, and benthic invertebrates, was found. We used the average habitat quality of locations where wildlife was found as a criterion for designating habitats with high quality or low quality. We categorized Jeju based on the average (reference) value of habitat quality in identified sites as follows: areas with habitat quality above 0.56 had favorable habitat quality and were categorized as “conservation zones”, whereas areas with habitat quality below 0.56 required improvements to prevent a decline in biodiversity and were categorized as “management zones”.
2.5. Habitat Quality Verification
An environmental conservation value assessment map (issued by Ministry of Environment, South Korea) rates land according to its environmental value. It is based on assessments of nationally integrated environmental information and the ranking of items (protected area, diversity, natural characteristics, richness, rarity, fragility, stability, and connectivity) in natural (ecosystem, natural scenery, etc.), living (air, water, soil, etc.), and human/social environments. It is primarily used for land management. First-grade zones on this map are marked as top priority conservation areas, where no development activities are permitted, and only ecological restoration projects can be implemented. Second-grade zones are marked as priority conservation areas, where only small-scale development activities can be implemented. Third-grade zones are marked as main conservation areas, where conditional development is permitted. Fourth-grade zones are marked as already developed or developing areas, where conservation is accomplished partially. Fifth-grade zones are permitted development areas.
An ecological and natural map (issued by Ministry of Environment, South Korea) rates the natural environment of a region, detailing mountains, rivers, inland wetlands, lakes, farmland, and cities according to the ecological, natural, and landscape values. It is generated through field investigation assessments and the ranking of items (vegetation, endangered wildlife, wetlands, and topography) in the natural environment and is used for planning and implementing national/local land use. Separately managed zones on this map are protected areas that have historical, cultural, or landscape significance, or are designated for the conservation of urban green spaces. First-grade zones, which become the major habitats, ecological networks, or ecological corridors for endangered wildlife, require the protection and restoration of natural environments. Second-grade zones, which are areas outside first-grade zones, are required to protect first-grade zones, and use of the natural environment within these zones is permitted for conservation activities or controlled development activities. Third-grade zones comprise all other areas and development activities are permitted in these zones.
We used these maps to verify the reliability of habitat quality assessment results in pixel units (30 × 30 m). We derived Spearman correlation coefficients between model assessment results and these verification maps issued officially by the central government using R software (version 4.1.0). Based on these coefficients, we analyzed the extent to which the conservation zones and the management zones corresponded spatially with the first-, second-, and third-grade zones and with the fourth- and fifth-grade zones, respectively, on the environmental conservation value assessment map. For the additional verification of the habitat quality of the conservation zones, a comparative analysis was conducted based on the separately managed zones and the first- and second-grade zones of the ecological and natural map.
4. Discussion
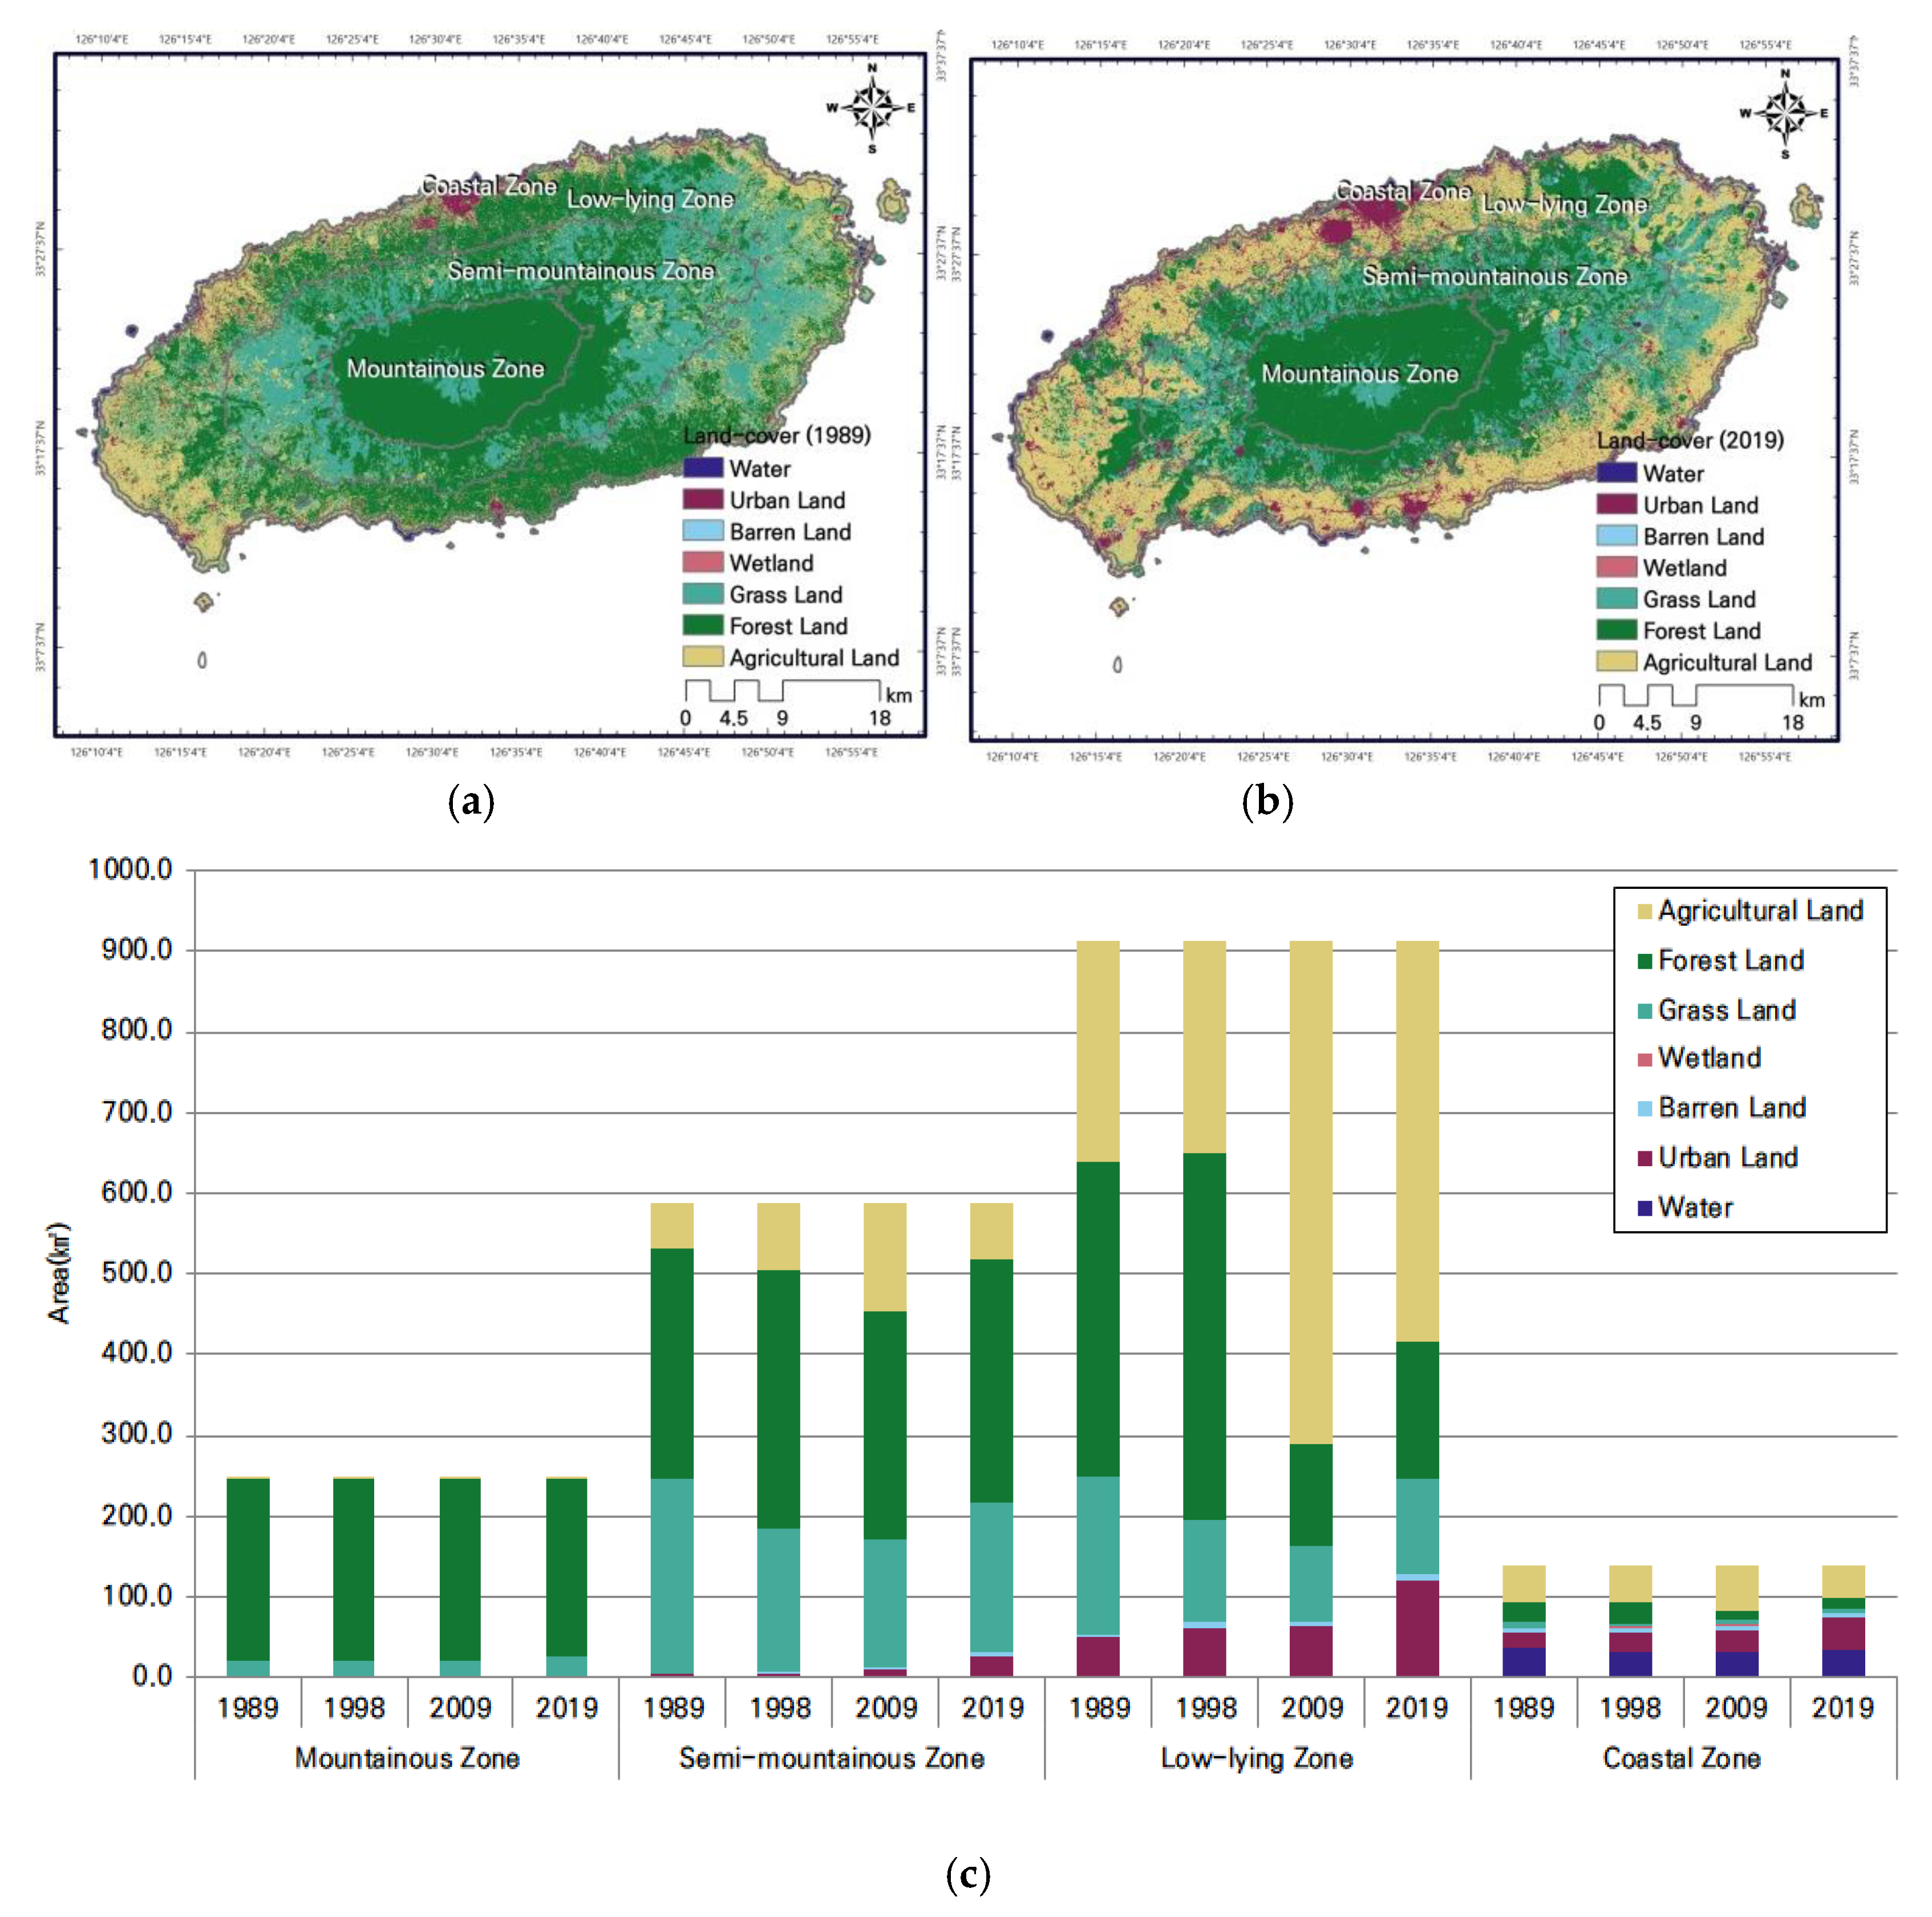
Jeju was found to have a higher habitat quality, compared to other spots where wildlife has been found. This insight triggered rapid land-use changes related to development and tourism (
Figure 2). The presence of man-made habitats, including agricultural land, barren land, and urban land, has rapidly increased in extent over the last 30 years, whereas that of natural habitats, including forest land, grassland, wetland, and water, has rapidly decreased. These might be the primary drivers associated with damage to biodiversity on the island (
Figure 3). Local residents are also wary of the increasing scale of the aforementioned social and environmental effects due to economic development and support the need for the sustainable management of biodiversity. In a survey conducted among Jeju’s residents (September 2015; 120 respondents), 60.2% of the respondents agreed that natural resources need to be protected by immediately implementing appropriate measures, rather than maintaining the status quo through the continuation of existing policies (29.6%), or development for the sake of economic growth (10.2%) [
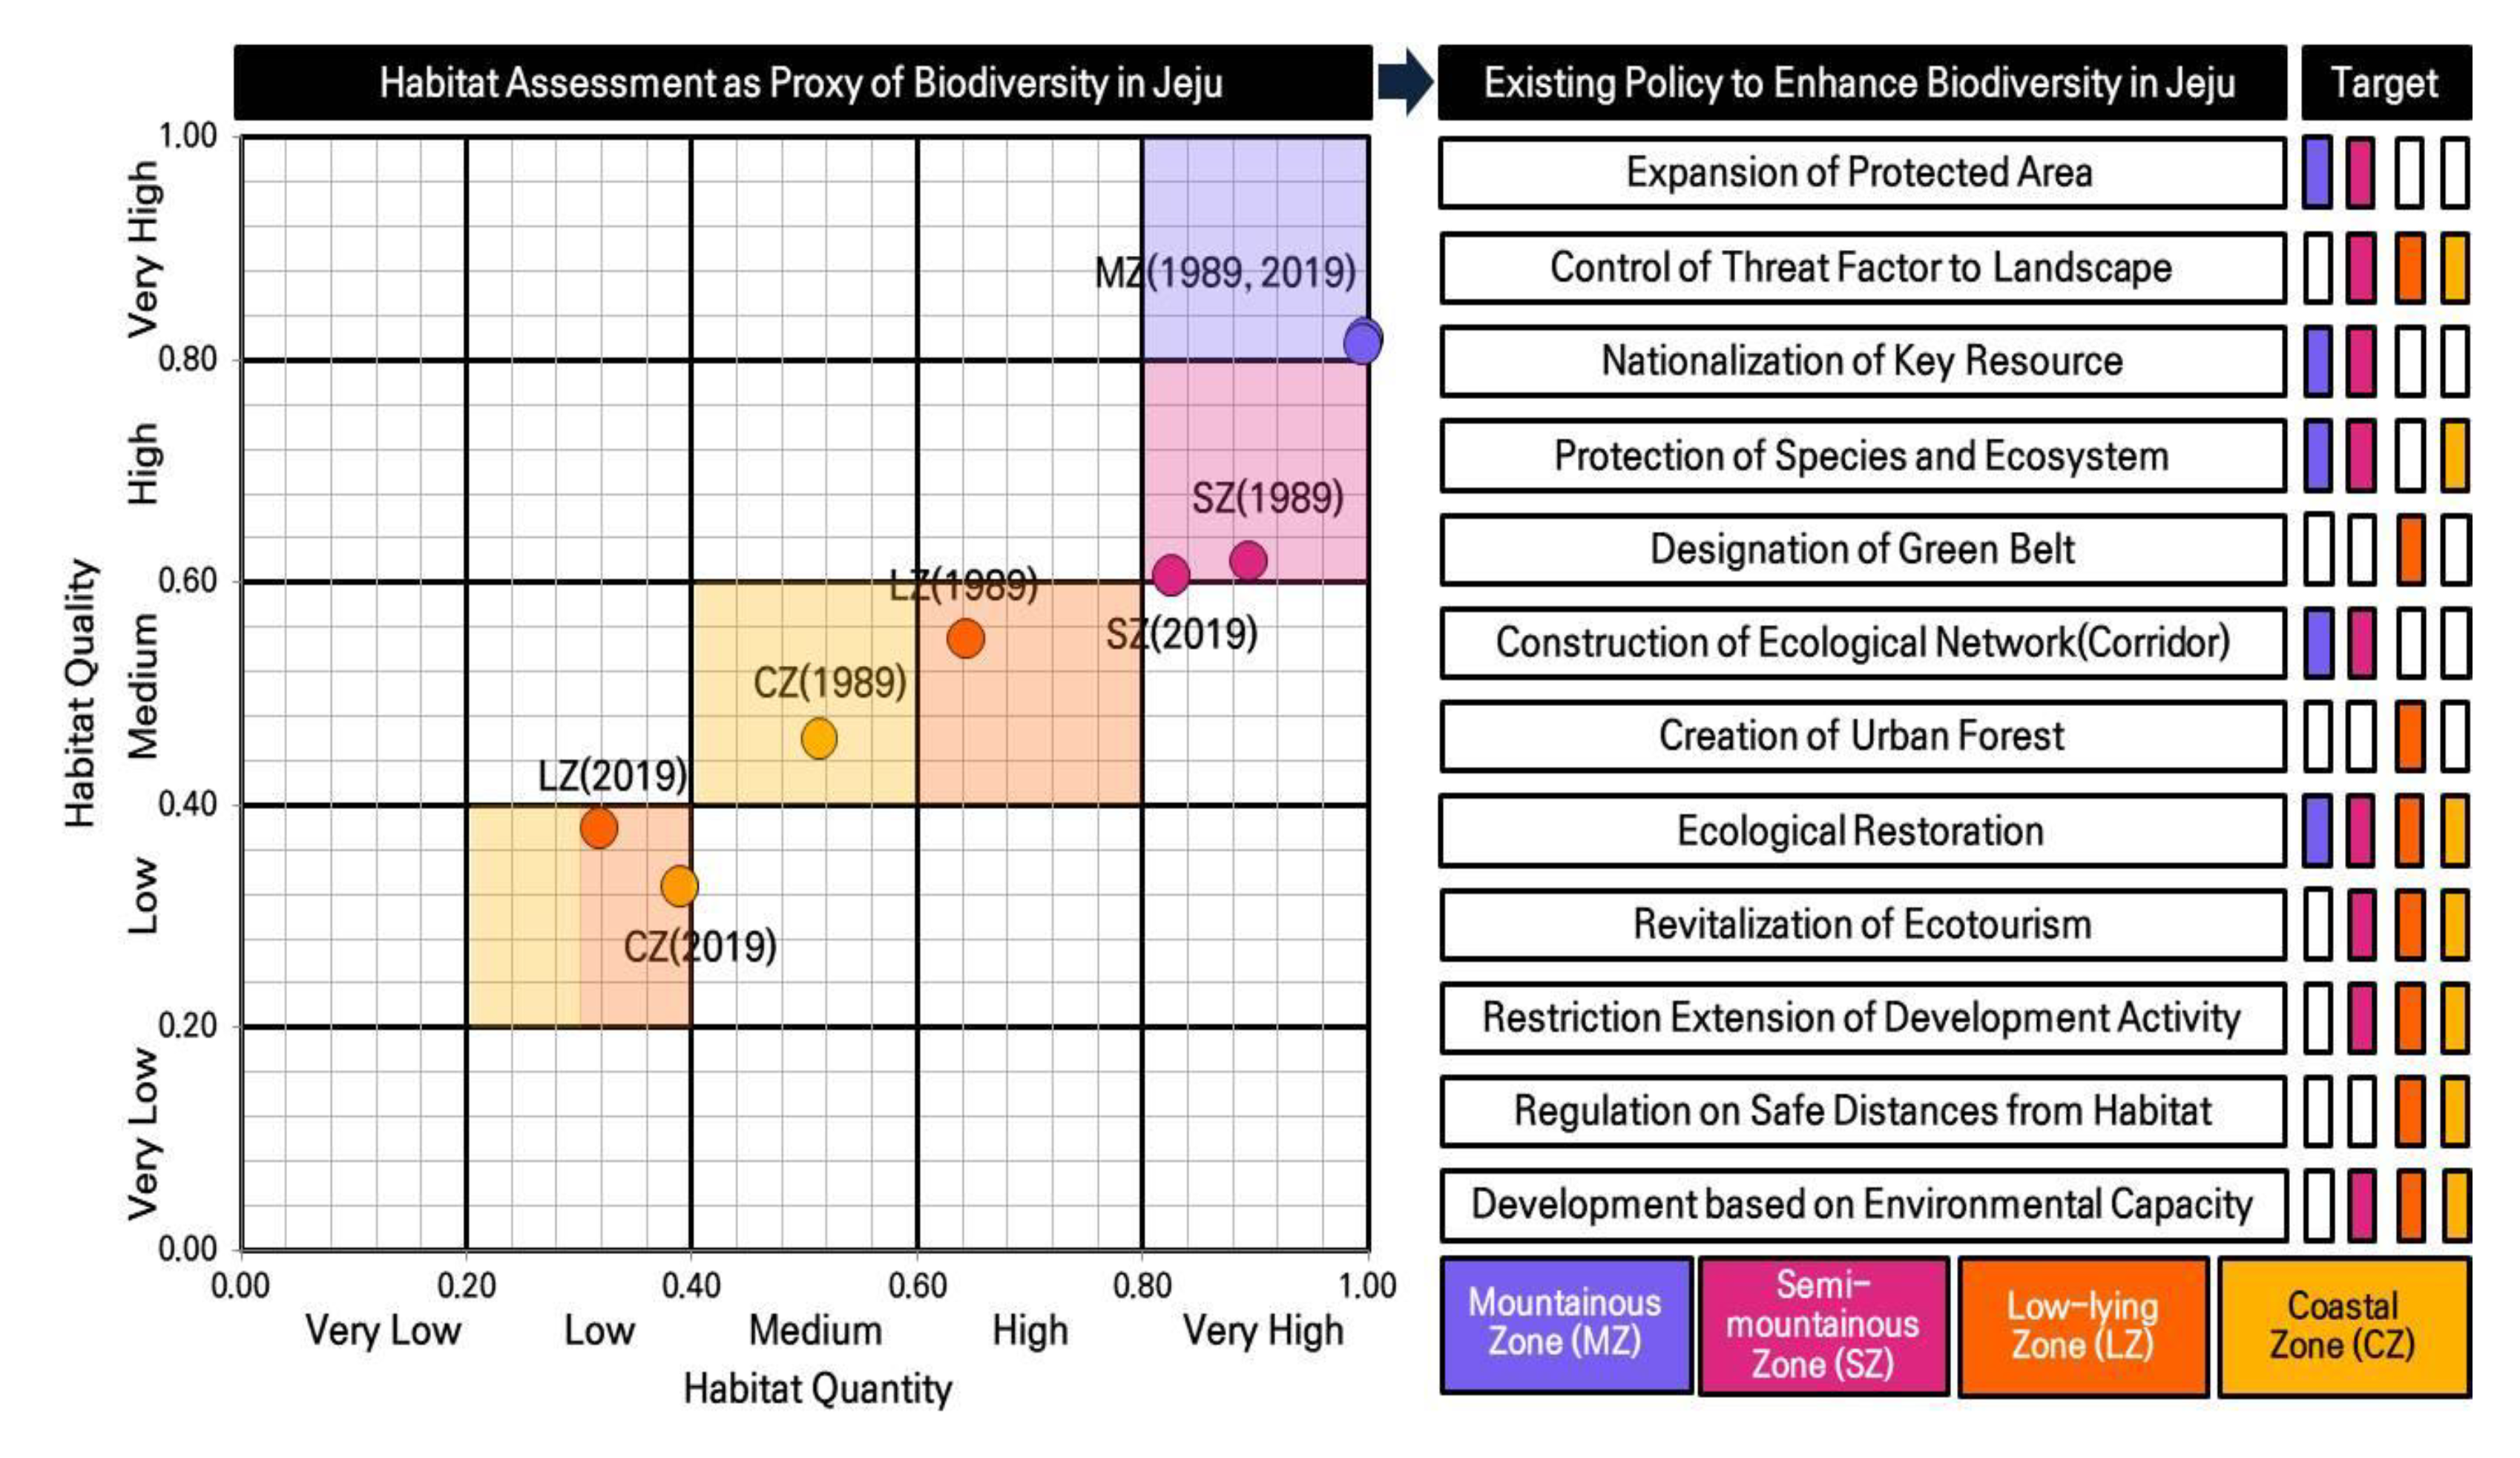
44]. The local government is devising and executing various policies to enhance biodiversity, reflecting the local residents’ demands; survey, protection, conservation, expansion, restoration, control, restriction, nationalization, monitoring, research, education, ecotourism, and collaboration [
45] (
Figure 4).
Despite these efforts by the local government, policy effect has not been achieved due to the disconnection between policy alternatives and their application target zones based on scientific assessments and monitoring. International societies have encouraged policy decision-making based on scientific assessments for habitat, landscape, ecosystem, and biodiversity management [
6,
7]. However, this has yet to be realized at the local level in South Korea, owing to the lack of personnel, budget, skill, and experience. The identification of excellent or vulnerable spaces for biodiversity [
46,
47] and the establishment of countermeasures to improve biodiversity [
45,
48] have been conducted individually. The only habitats to have been properly linked with policy, considering spatial characteristics, are the specific habitats for natural monuments (cactuses) or endangered species (
Azolla japonica) [
49,
50], or other specific protected areas [
51,
52,
53]. Our study findings can be incorporated systematically in policy decision-making by scientifically quantifying the status of, and change in, habitat quality as a proxy for biodiversity, as well as by spatially connecting these results with policy reform. We suggest the following approaches as potential solutions for the biodiversity management of Jeju, based on habitat quality monitoring (
Figure 4).
The habitat quantity (defined for natural habitats in this; forest land, grassland, wetland, and water) and the habitat quality of the mountainous zone were very high and had not undergone much change, owing to legislation-based strict management. However, over the 30-year period, the habitat quality in the zone had declined to half. Thus, the expansion of protected areas, nationalization of key resources, protection of species and ecosystems, construction of ecological networks, and restoration of ecosystems should be selected as areas requiring stronger conservation policies for biodiversity. Both the habitat quantity and the habitat quality of the semi-mountainous zone were very high and had undergone minimal change. However, the habitat quality had declined over more than 70% of this zone due to the large-scale investment into tourism-related land development and the construction of tourist complexes, golf courses, and amusement parks. Policies must be urgently implemented to consider the expansion of protected area, control of threats to the landscape, nationalization of key resources, protection of species and ecosystems, construction of ecological networks, restoration of ecosystems, revitalization of ecotourism, restriction extension of development activities, and development based on environmental capacity. The habitat quantity and the habitat quality of the low-lying zone were low and had undergone major degradation, with the habitat quality having declined across more than 80% of this zone, owing to intensive developmental activities and rapid increase in land area allocation for residential development, tourism, and economic activity. Policies that can be used to mitigate the effects of increasing developmental activities are as follows: control of threat factors to landscape; designating a green belt; creation of urban forests; restoration of ecosystems; revitalization of ecotourism; restriction extension of development activities; regulation on safe distances from habitat; development based on environmental capacity. The habitat quantity and the habitat quality of the coastal zone were low and had undergone moderate decline, with habitat quality having declined over more than 60% of this zone, owing to the construction of coastal roads and encroachment of the shoreline. Primary policy interventions should focus on the control of threat factors to the landscape, protection of species and ecosystems, restoration of ecosystems, revitalization of ecotourism, restriction extension of development activities, regulation on safe distances from habitat, and development based on the environmental capacity.
The mountainous zone is rich in tropical, temperate, cold temperate, and cold species. Particularly, Halla Mountain National Park is an important habitat of the mountainous zone for protection of its notably rich biodiversity, undamaged natural ecosystem, and spectacular scenery. At this park, only minimal measures are allowed for scientific research or the conservation of nature, as per the Natural Parks Act. Additionally, the construction of park facilities, in accordance with limited standards, is permitted at this park. However, with the abolishment of a park entrance fee and designation of the park as an international protected area, there has been a rapid increase in the number of visitors. Consequently, a portion of it was released from protected status and has been allocated for construction and development, and thus, the biodiversity of the mountain is under growing pressure. Based on the results of the present study, significant evidence supporting critical degradation of the habitat can be provided. Habitat quantity of the park decreased from 99.89% in 1989 to 99.62% in 2019, showing negligible change, while the habitat quality of the park decreased from 0.82 in 1989 to 0.80 in 2019, impacting 8.5% of the park. Given this situation, we propose the following strategies for protecting, conserving, restoring, controlling, and utilizing biodiversity of Halla Mountain Park, based on habitat quality monitoring (
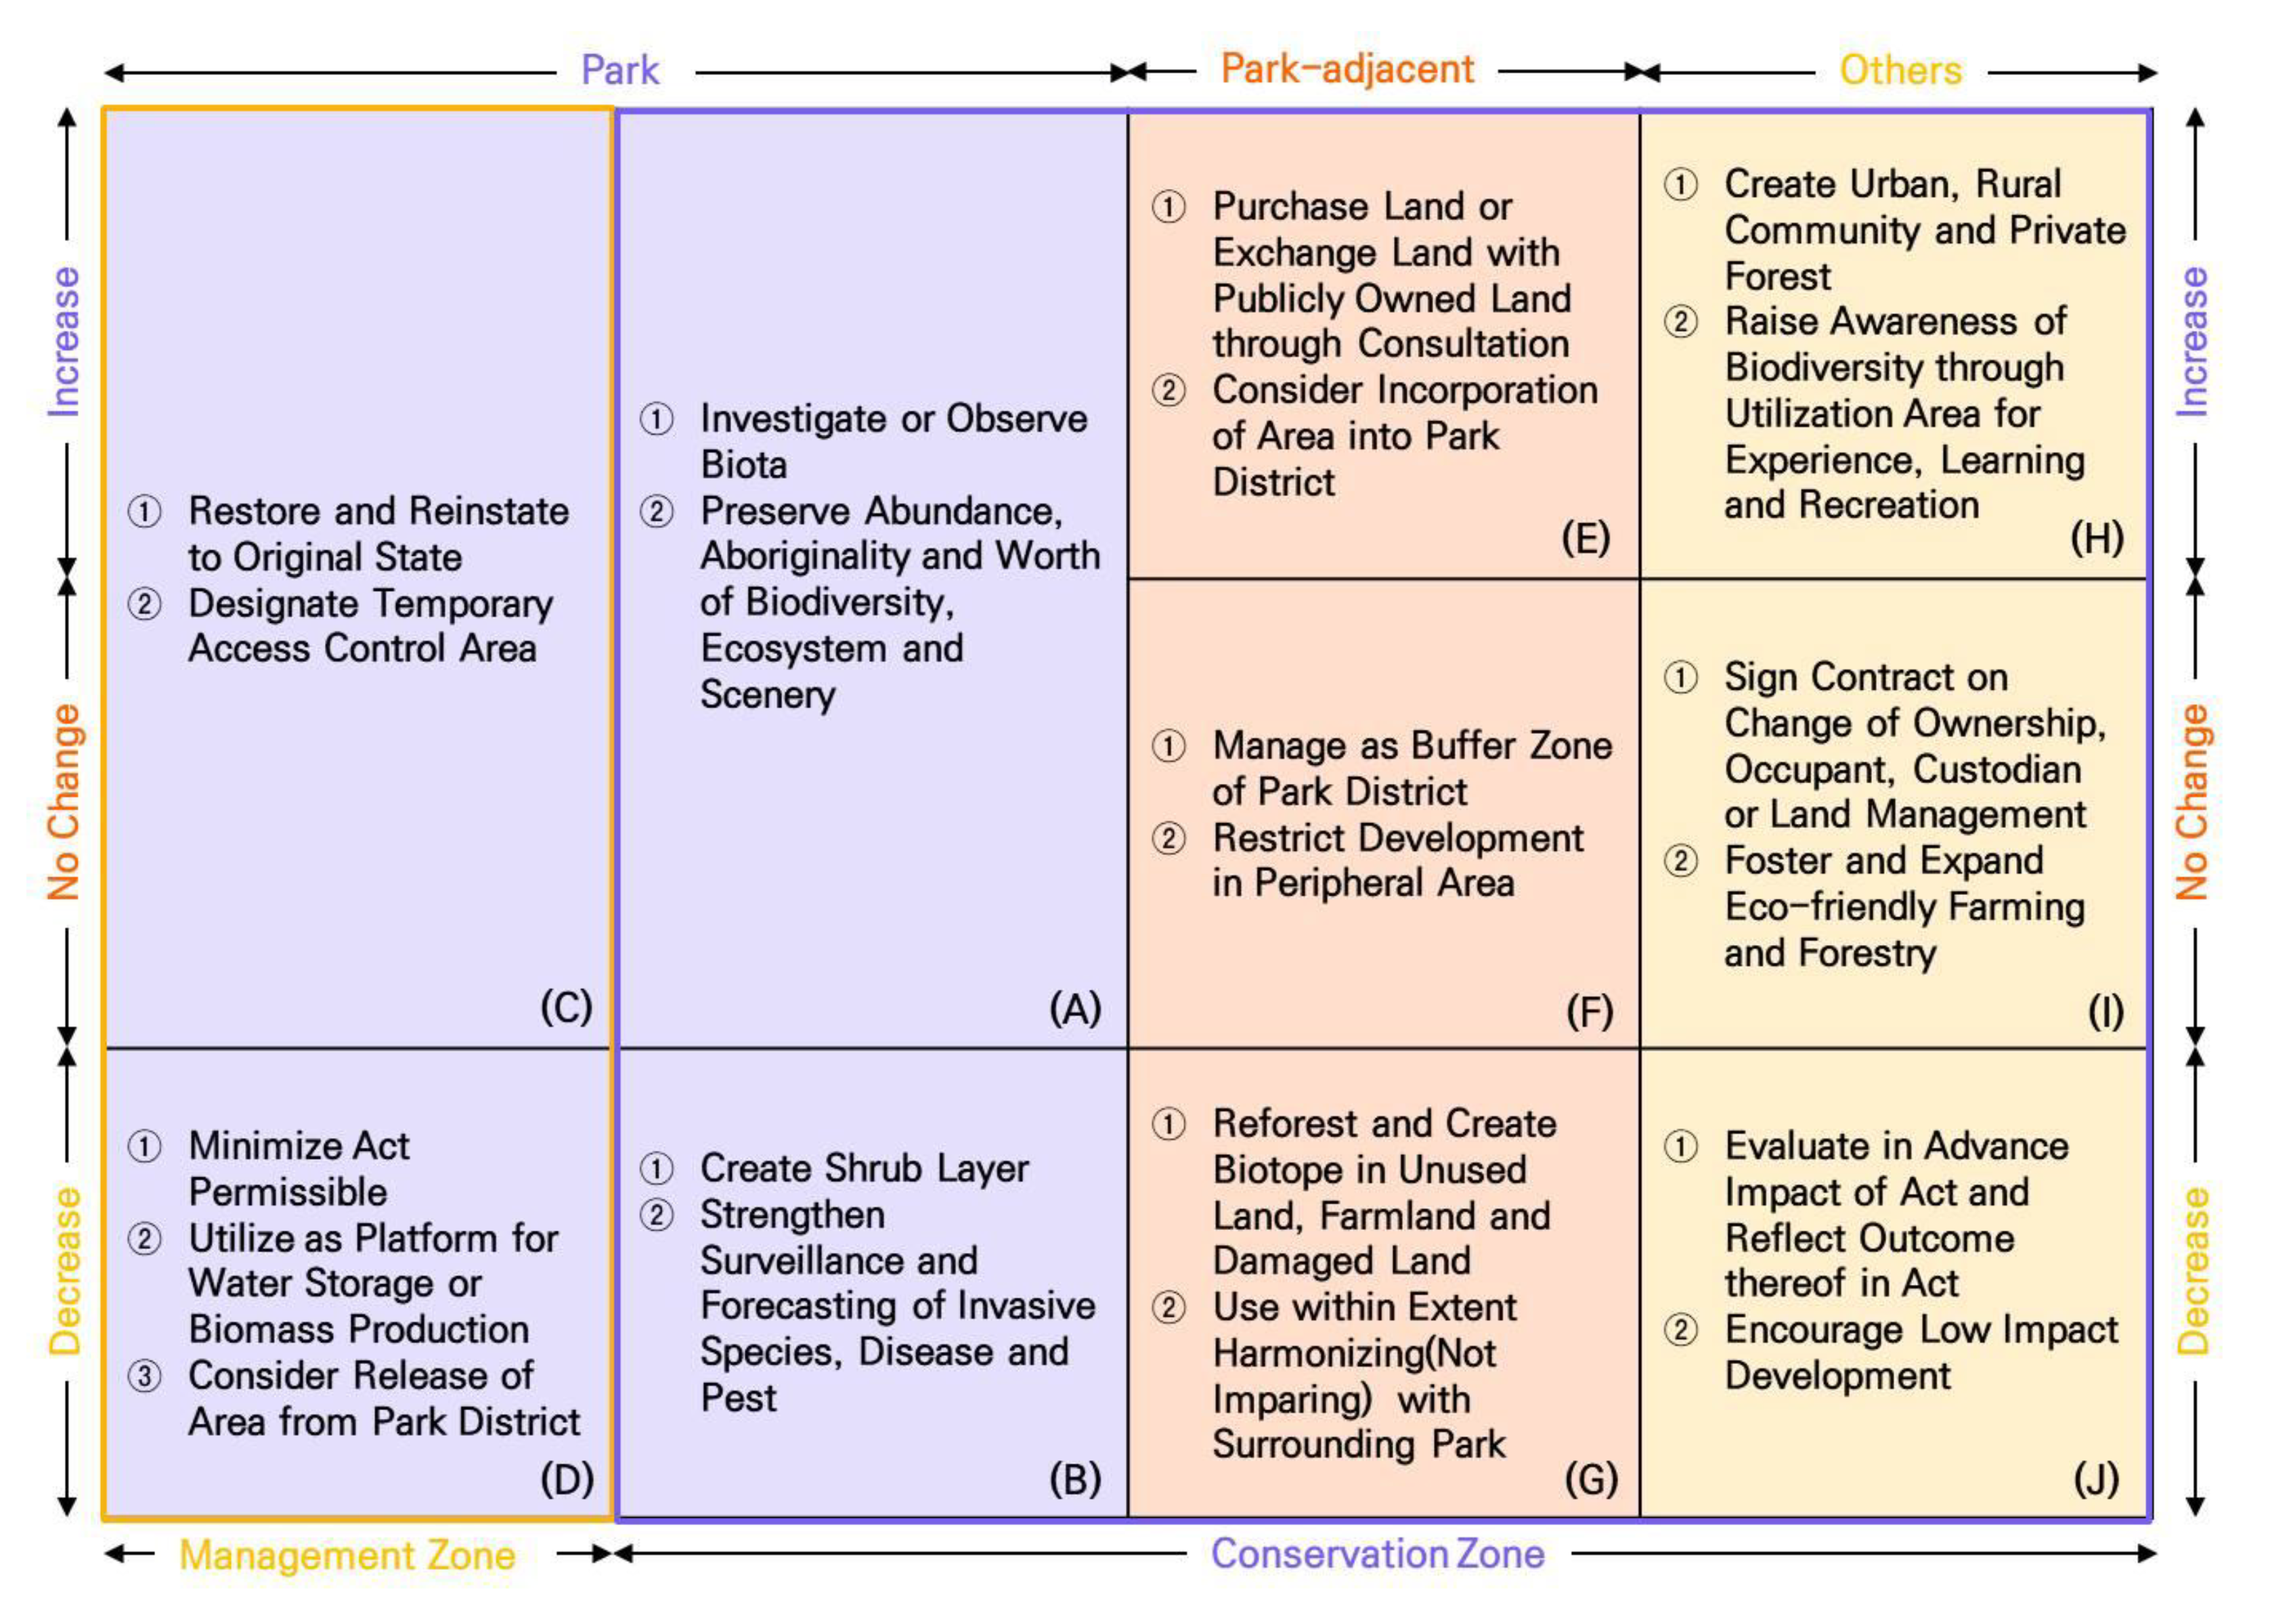
Figure 5).
The management strategies for the Halla Mountain National Park to preserve and promote the sustainable utilization of biodiversity are as follows. First, a scientific and specialized investigation on the status and characteristics of the topography, ecosystem, biodiversity, and scenery should be conducted over a long term in the areas where habitat quality has improved or has subsequently been maintained as conservation zones within the park district (A). The preservation of the abundance, aboriginality, and worth of the ecosystem, biodiversity, and scenery should be implemented for the long term, based on the aforementioned investigations in this area (A). Second, habitat threats should be mitigated by creating a shrub layer and strengthening surveillance for invasive species, disease, and pests, particularly in the conservation zones where habitat quality has diminished within the park district (B). Third, a special protection area or temporary access control area should be designated to prohibit the access of visitors or the passage of vehicles over the area for a fixed period, and the destroyed biodiversity should be restored to its original state in areas where habitat quality has been maintained or increased as management zones within the park district (C). Fourth, the activities permissible in these areas, including the construction of facilities, should be minimized, with retaining activities required for national defense, public interest, and safety of visitors, where habitat quality has diminished, as management zones, including areas bordering the boundary the park (D). In addition, the utilization as a platform for water storage or biomass production, or the release from the park district should be considered in these areas (D).
Potential management strategies for non-park districts or areas neighboring park districts are as follows. First, conservation zones where the habitat quality has improved should be purchased or exchanged with publicly owned land through consultations and land transactions with owners (E). Such areas should be incorporated into a park district when validity is ascertained through examination of the feasibility of the park district (E). Second, in conservation zones where the habitat quality has been maintained, a park buffer zone should be created to restrict development activities in peripheral areas (F). Third, in conservation zones where habitat quality has diminished, the unused, arable, and damaged lands should be reforested to create a designated biotope (G). This area should be used in union with the surrounding park, without impairment of the scenery and the ecological and cultural environments of the park (G).
Management strategies suggested for locations outside of these areas are as follows. First, in conservation zones where habitat quality has improved, urban eco-villages, private forests, and field programs should be created to enhance public awareness on the conservation of biodiversity and on the adoption of environmental-friendly practices (H). Second, conservation zones where habitat quality has been maintained should be protected as wildlife habitats, if necessary, through contracts detailing regulations related to change in the owner, occupant, and custodian, or in the land management methods (the cultivation of land, use of chemical materials, and creation of wetlands) (I). Eco-friendly farming and forestry practices should be instituted and expanded upon in this area (I). Third, in conservation zones where habitat quality has declined, regulations should be implemented to evaluate, in advance, the impact of land use on biodiversity and to only permit low-impact development (J).
5. Conclusions
There has been a significant increase in public awareness on biodiversity, as well as on its importance to the quality of life of human beings. However, biodiversity is still being lost and degraded, and many of nature’s contributions to humans are being compromised [
4,
5,
6]. Policy-making and implementation, based on scientific and systematic assessment of biodiversity, could lead to adoption of best practices, including the conservation, restoration, and sustainable use of biodiversity. This would, in turn, contribute to the achievement of the Sustainable Development Goals and the Aichi Biodiversity Targets, in addition to compliance with the New Deal for Nature and People. Accordingly, international societies intend to provide scientifically credible and independent up-to-date assessments of biodiversity using indices to realize evidence-informed policy decisions and actions [
6,
7]. However, prevalent indices used to assess biodiversity, such as the Mean Species Abundance, Living Planet Index, and National Biodiversity Index, which are used in formulating biodiversity strategies, are not sufficient for the qualitative consideration of biodiversity. Habitat quality assessment allows for complex factors that contribute to long-term biodiversity degradation to be identified and adequately informs policy making, as the habitat quality is defined as the ability of a habitat to provide conditions that facilitate the persistence of a species, a population, or a community with available resources within a given ecosystem [
11]. Therefore, we assessed the status and trends of habitat quality with land-cover change as a proxy for biodiversity, and proposed strategies that should be considered to conserve biodiversity comprehensively and systematically and to use biological resources sustainably.
Jeju, South Korea, where various protected areas are located, includes a national park, a wetland protection area, and a specified island, among others, thereby encompassing a region with both rich biodiversity and rapid development pressures. A habitat-focused scientific study is urgently needed to identify viable solutions and to formulate appropriate biodiversity management schemes. We monitored the change in habitat quality with land-cover change between 1989 and 2019 in Jeju. We provided detailed evidence regarding critical degradation of the habitat over a long period. We found that natural habitats throughout Jeju had rapidly decreased by 24.9%, from 1989 to 2019, and this change contributed to the degradation of the habitat quality by 15.8%. Using this information, we elucidated significant evidence on the critical degradation of biodiversity over a long period and highlighted the urgent need for policies and behaviors to enhance biodiversity. We proposed appropriate policy measures that could prompt people to conserve better, restore effectively, and use biodiversity sustainably, based on the accumulated knowledge gathered through the aforementioned assessment. These findings can also be used to trigger a shift in focus from the quantitative to qualitative aspects, with respect to decision-making on biodiversity management, which could result in improvement of biodiversity.
Detailed analyses of how biodiversity interacts holistically with pressure/status/trends/resilience in habitats, conducted in line with the advice of interdisciplinary expert panels, working groups, and committees, are required for each habitat type. Professional reviews, between habitat quality and factors affecting habitat quality, should be conducted based on the significance test, and the reliability of habitat quality assessments should be enhanced based on various verification data. The prediction of changes to habitat quality based on various scenarios that reflect past, current, and future conditions can assist policy and decision makers in devising more strategic and timely policy-based interventions to sustain biodiversity, which safeguards socio-economic welfare. Based on the aforementioned contributions, we believe that the results of our study can improve international indices used for the quantitative assessment of biodiversity, provide scientific and evidence-based guidance for policy-making on biodiversity enhancement, and support the achievement of the global vision, which is living in harmony with nature.


