
Red-Listed Ecosystem Status of Interior Wetbelt and Inland Temperate Rainforest of British Columbia, Canada

 ,
,
Abstract
:1. Introduction
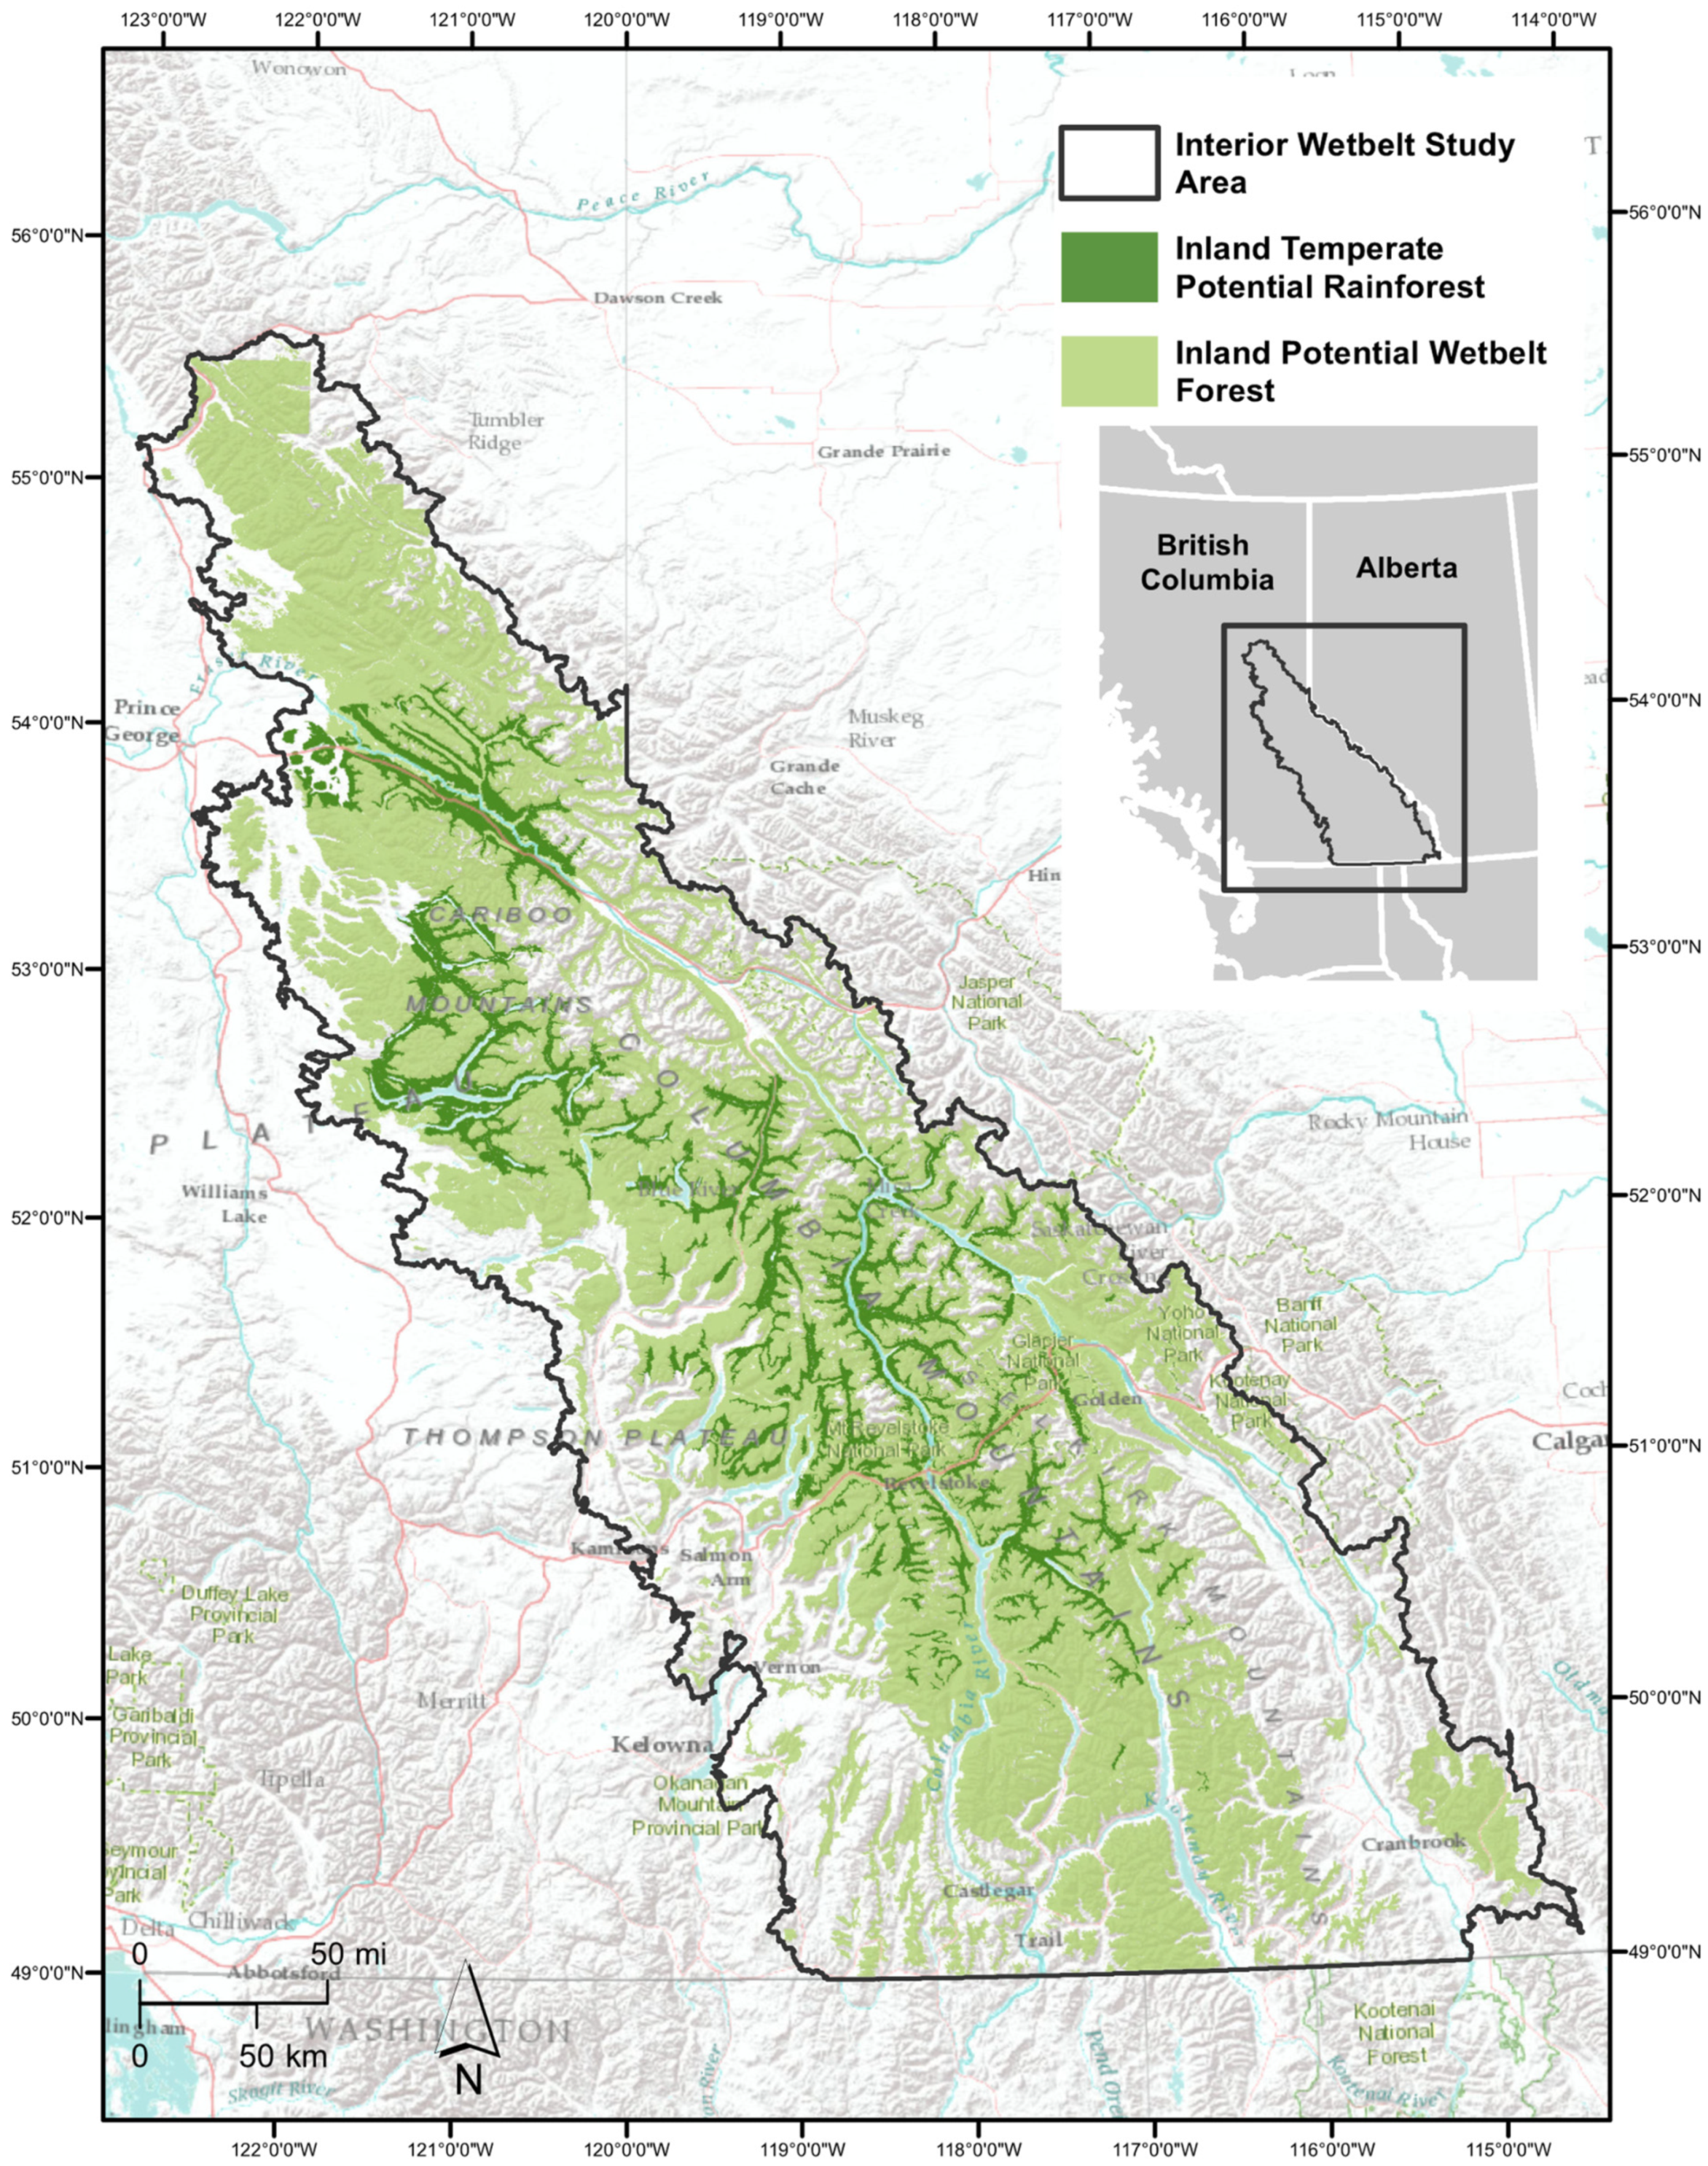
2. Study Area
2.1. Classifications
2.2. Forest Types
2.3. Forest Structure
2.4. Abiotic Factors
2.5. Biotic Factors
3. Methods
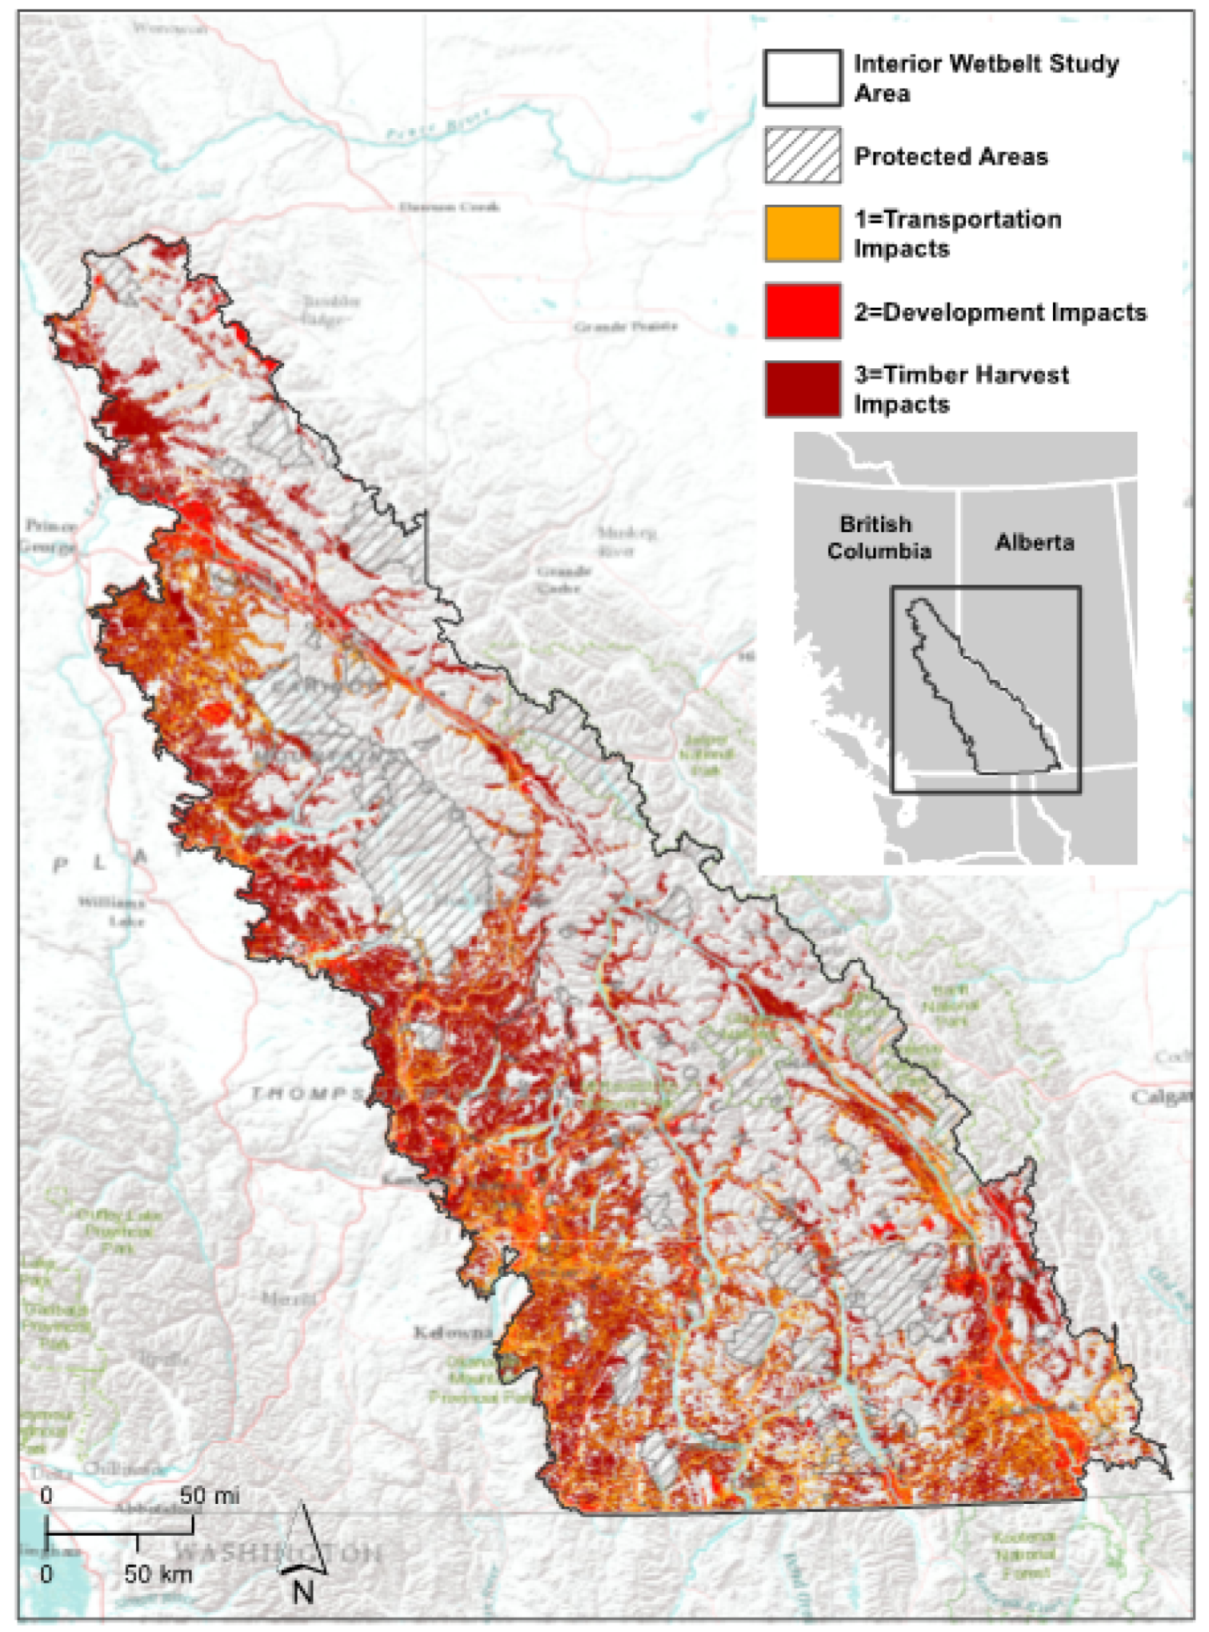
3.1. Anthropogenic Disturbances
3.2. Watershed Analysis (Biotic and Abiotic Factors)
3.3. RLE Criteria
4. Results
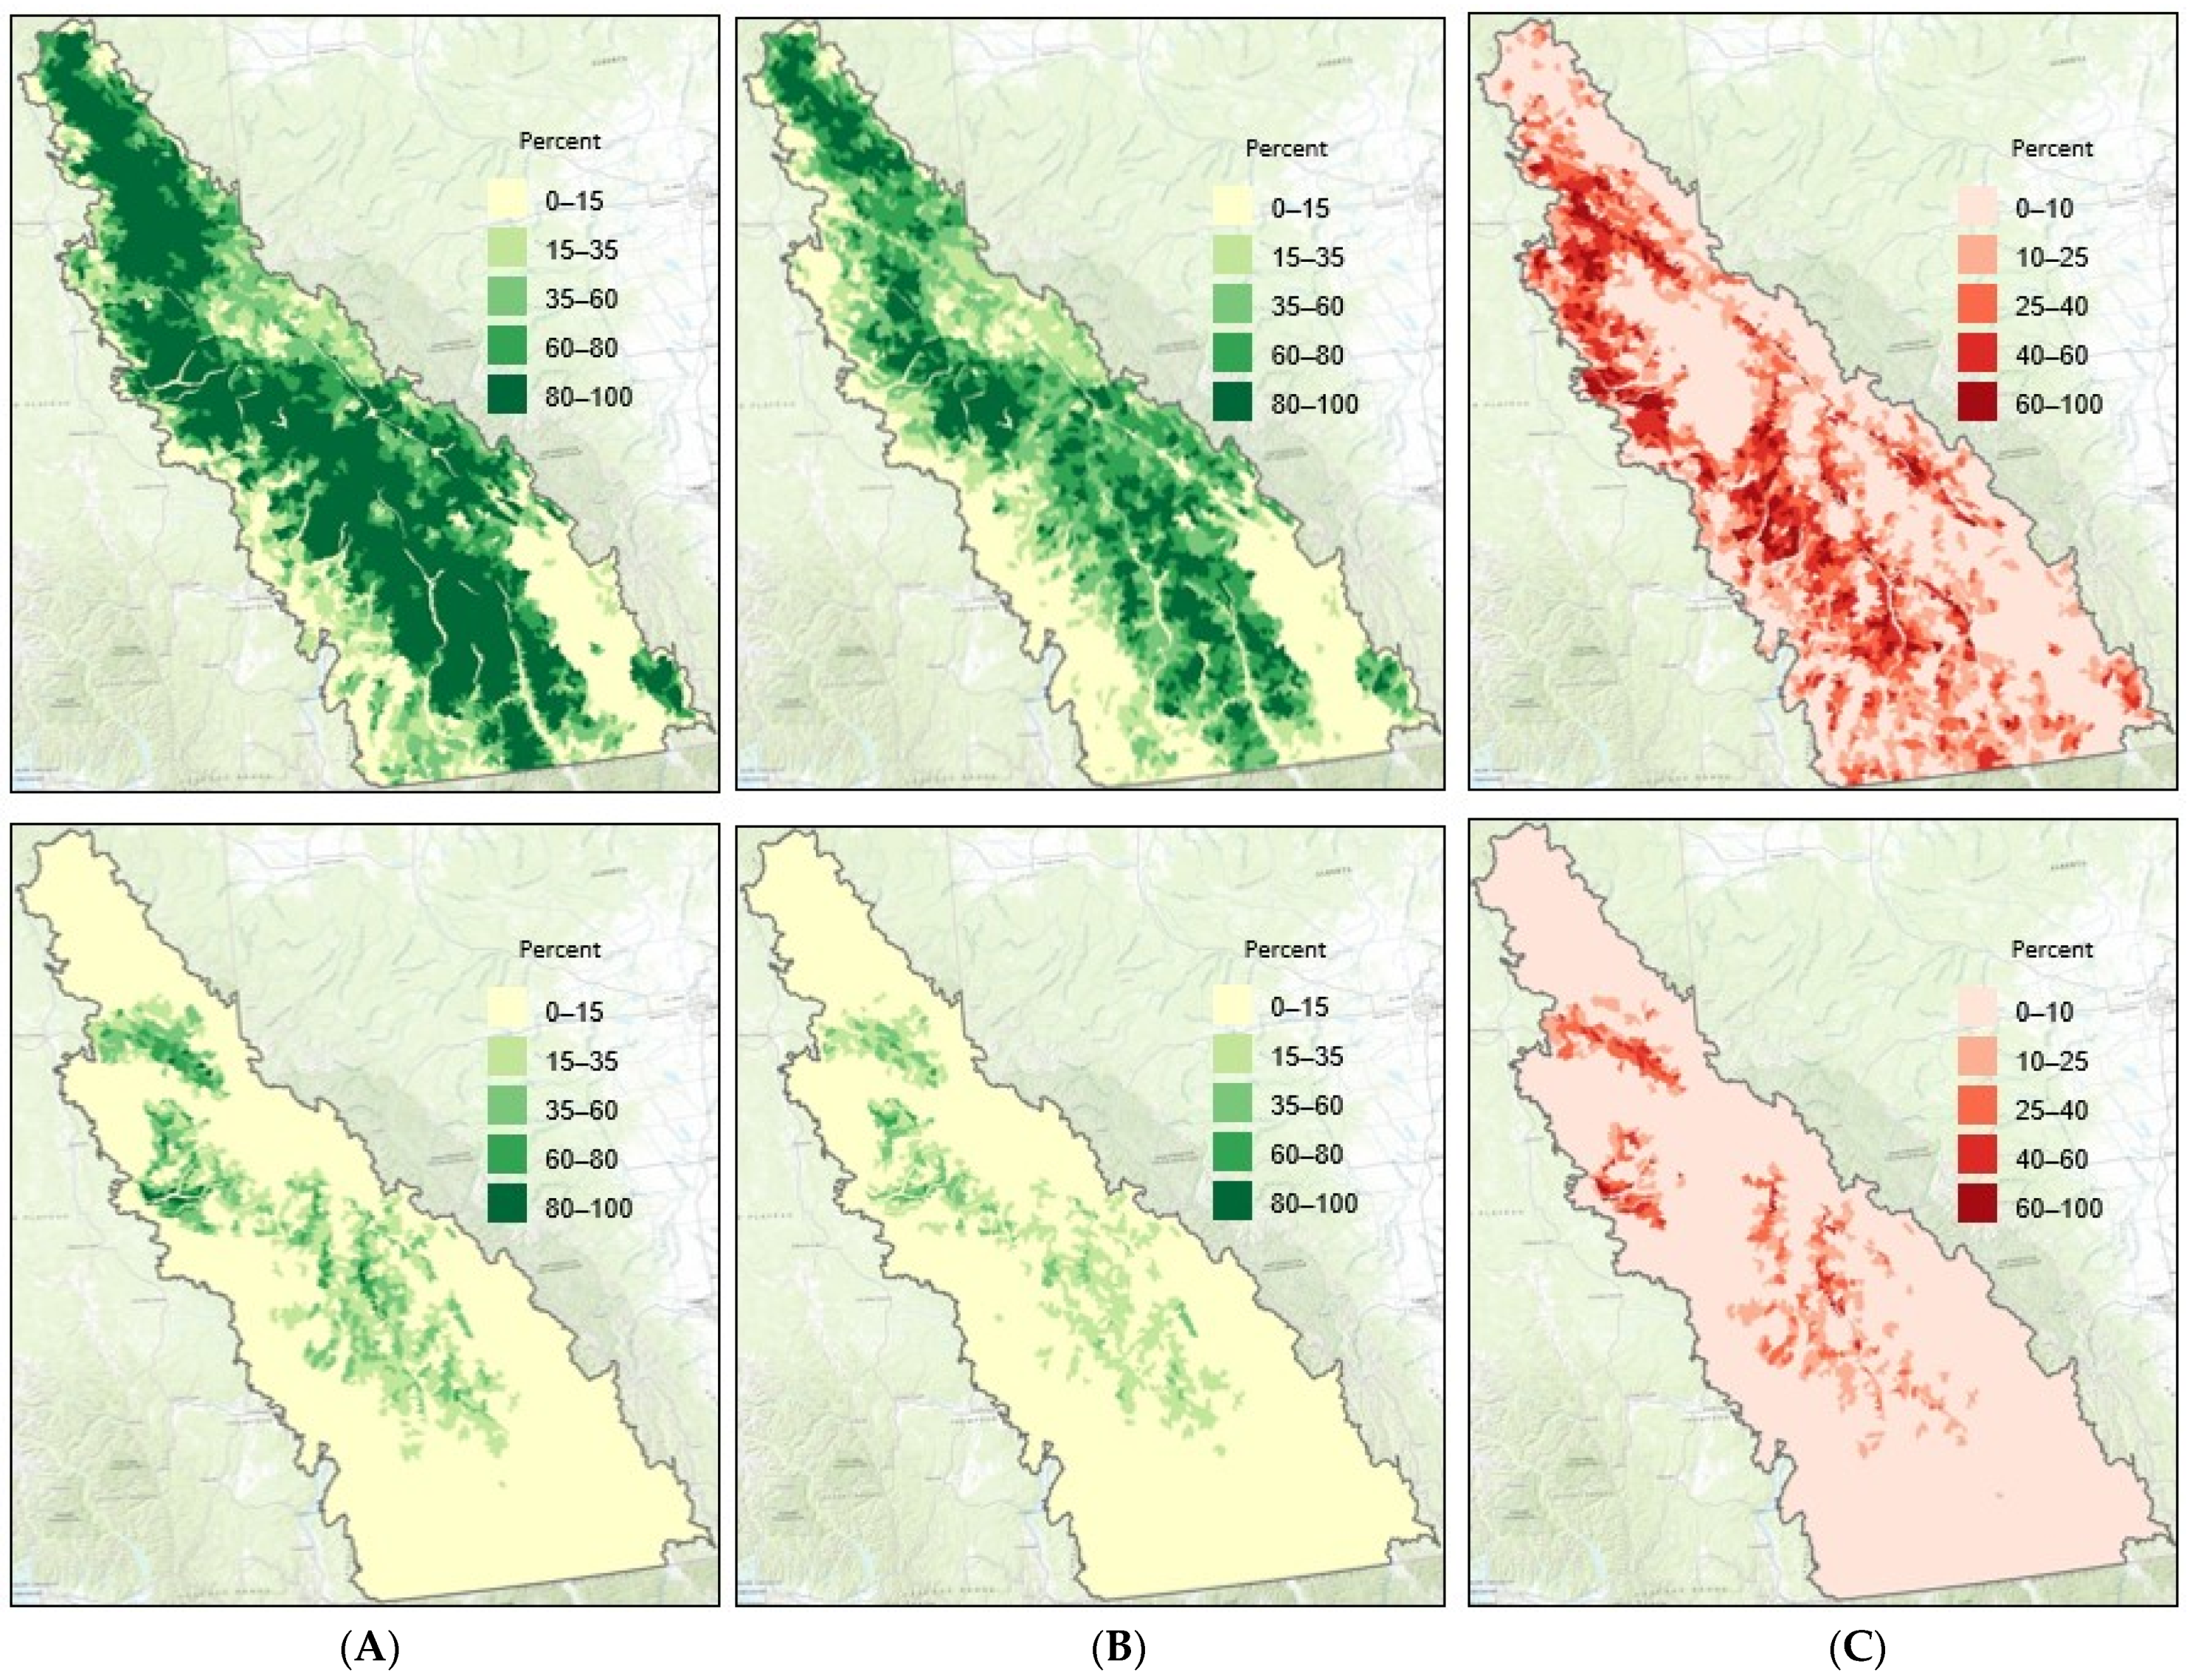
4.1. RLE A1: Reduction in Geographic Distribution (Spatial Analysis)
4.2. RLE A1: Reduction in Geographic Distribution (Temporal Analysis)
4.3. RLE C1: Environmental Degradation Abiotic
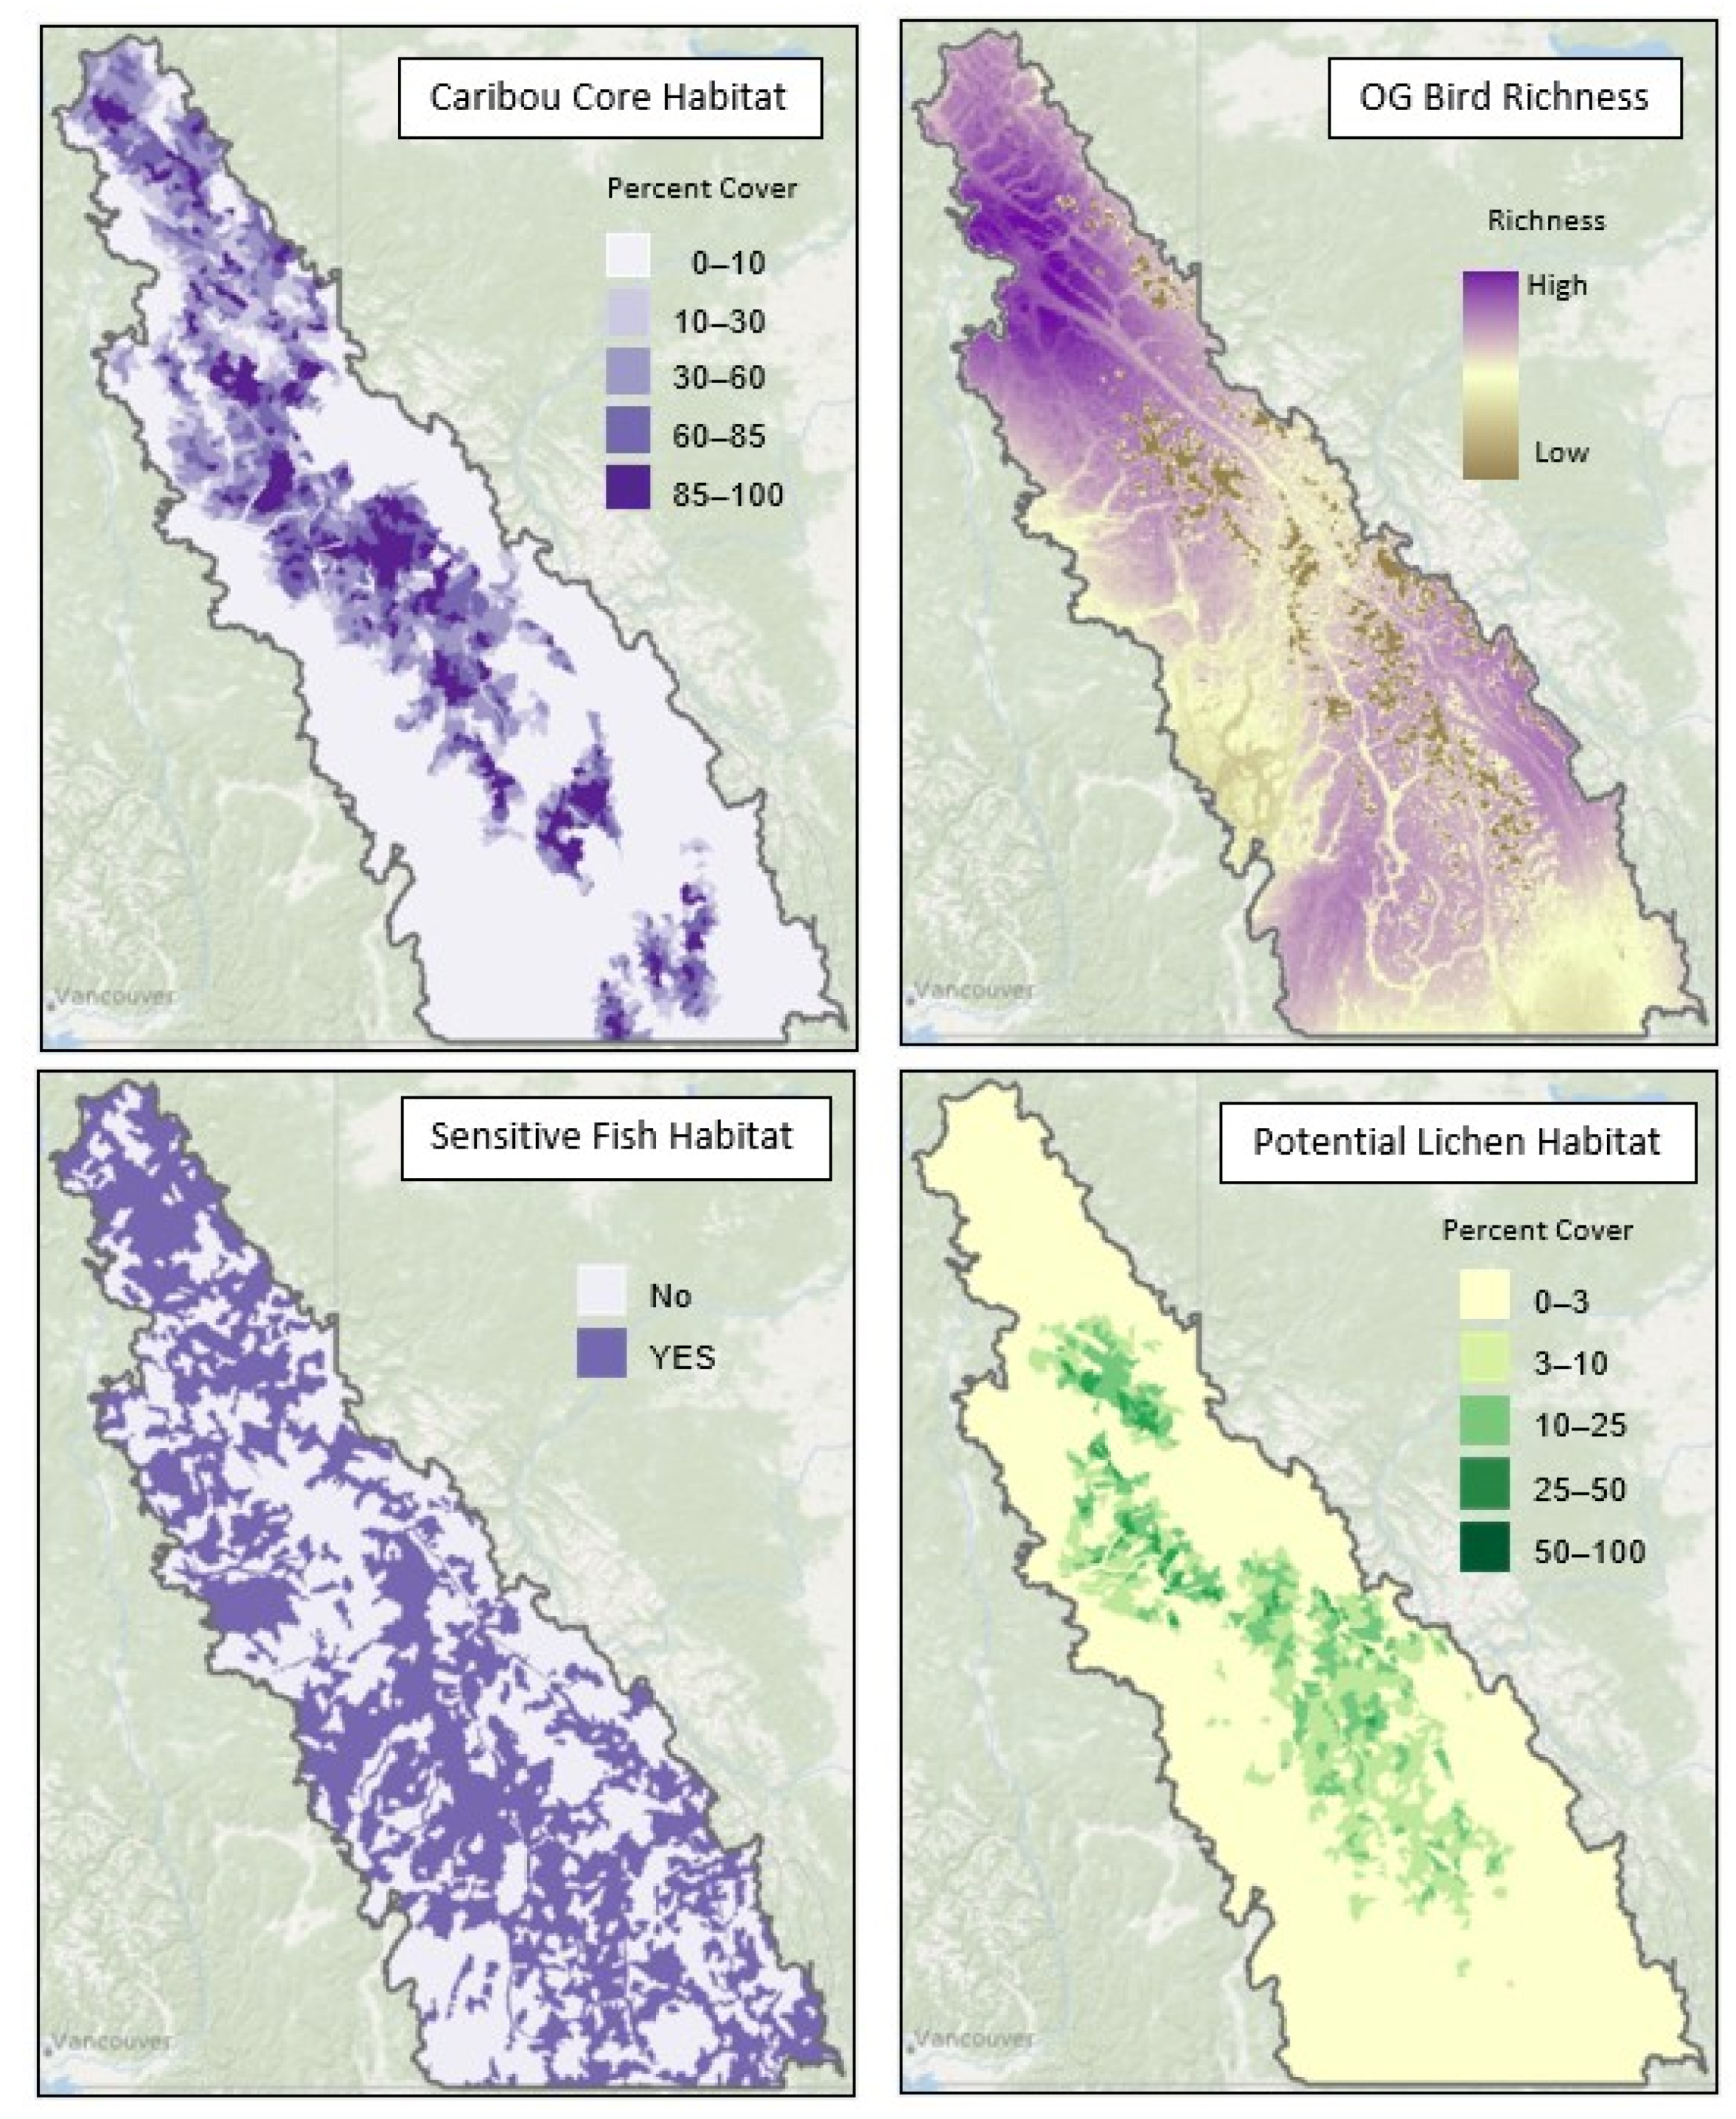
4.4. RLE D1: Environmental Degradation Biotic
4.5. RLE E: Probability of Ecosystem Collapse
4.6. Uncertainties
5. Discussion
6. Conclusions
Supplementary Materials
Author Contributions
Funding
Institutional Review Board Statement
Informed Consent Statement
Data Availability Statement
Acknowledgments
Conflicts of Interest
References
- Hansen, M.C. High-resolution global maps of 21st-century forest cover change. Science 2013, 342, 850–885. [Google Scholar] [CrossRef] [Green Version]
- Mackey, B.; DellaSala, D.A.; Kormos, C.; Lindenmayer, D.; Kumpel, N.; Zimmerman, B.; Hugh, S.; Young, V.; Foley, S.; Arsenis, K.; et al. Policy options for the world’s primary forests in multilateral environmental agreements. Conserv. Lett. 2015, 8, 139–147. [Google Scholar] [CrossRef] [Green Version]
- FAO. Forest Resource Assessment Working Paper 180. Terms and Definitions; Food and Agriculture Organisation of the United Nations: Rome, Italy, 2015; Available online: http://www.fao.org/3/ap862e/ap862e00.pdf (accessed on 10 June 2021).
- IUCN. IUCN Policy Statement on Primary Forests Including Intact Forest Landscapes. In Proceedings of the 98th Meeting of the IUCN Council, Gland, Switzerland, 8–11 February 2020. Annex to Decision C98. [Google Scholar]
- Myers, N.; Mittermeier, R.; Mittermeier, D.G.; da Fonseca, G.A.B.; Kent, J. Biodiversity hotspots for conservation priorities. Nature 2000, 403, 853–858. [Google Scholar] [CrossRef]
- Olson, D.M.; Dinerstein, E. The global 200: Priority ecoregions for global conservation. Ann. Missouri Bot. Gard. 2002, 89, 199–224. [Google Scholar] [CrossRef]
- Ibisch, P.L.; Hoffman, M.T.; Kreft, S.; Pe’er, G.; Kati, V.; Biber-Freudenberger, L.; DellaSala, D.A.; Vale, M.M.; Hobson, P.R.; Selva, N. A global map of roadless areas and their conservation status. Sci. Dec. 2016, 354, 1423–1427. [Google Scholar] [CrossRef]
- Watson, J.E.M.; Fuller, R.A.; Watson, A.W.T.; Mackey, B.G.; Wilson, K.A.; Grantham, H.S.; Turner, M.; Klein, C.J.; Carwardine, J.; Joseph, L.N.; et al. Wilderness and future conservation priorities in Australia. Divers. Distrib. 2009, 15, 1028–1036. [Google Scholar] [CrossRef]
- Watson, J.E.M. The exceptional value of intact forest ecosystems. Nat. Ecol. Evol. 2018, 2, 599–610. [Google Scholar] [CrossRef]
- Eken, G.; Bennun, L.; Brooks, T.M.; Darwall, W.; Fishpool, L.D.C.; Fostre, M.; Knox, D.; Langhammer, P.; Matiku, P.; Raford, E. Key Biodiversity Areas as site conservation targets. Bio. Sci. 2005, 54, 1110–1118. [Google Scholar] [CrossRef] [Green Version]
- DellaSala, D.A.; Alaback, P.; Craighead, L.; Goward, T.; Paquet, P.; Spribille, T. Temperate and boreal rainforests of Inland Northwestern North America. In Temperate and Boreal Rainforests of the World: Ecology and Conservation; DellaSala, D.A., Ed.; Island Press: Washington, DC, USA, 2011; pp. 82–110. [Google Scholar]
- Bland, L.M.; Keith, D.A.; Miller, R.M.; Murray, N.J.; Rodriguez, J.P. Guidelines for the Application of IUCN Red List of Ecosystems Categories and Criteria. Version 1.1. 2017. Available online: https://portals.iucn.org/library/sites/library/files/documents/2016-010-v1.1.pdf (accessed on 3 June 2021).
- Burns, E.L.; Lindenmayer, D.B.; Stein, J.; Blanchard, W.; McBurney, L.; Blair, D.; Banks, S.C. Ecosystem assessment of mountain ash forest in the Central Highlands of Victoria, south-eastern Australia. Austral. Ecolog. 2014, 40, 386–399. [Google Scholar] [CrossRef]
- Holt, R.F.; Bio, R.P.; Kehm, G.; Larch, M. Conservation and Adaptation in British Columbia: Strategic Opportunities in a Climate Changing World. Unpublished Report. 2014. Available online: https://veridianecological.files.wordpress.com/2010/11/report_final_april2014.pdf (accessed on 3 June 2021).
- Price, K.; Holt, R.F.; Daust, D. Conflicting portrayals of remaining old growth: The British Columbia case. Can. J. For. Res. 2021, 51, 5. [Google Scholar] [CrossRef]
- Nature Canada. 2019. Available online: https://naturecanada.ca/news/blog/federal-government-promises-landmark-nature-protection/ (accessed on 3 June 2021).
- Matsuzaki, E.; Sanborn, P.; Fredeen, A.L.; Shaw, C.H.; Hawkins, C. Carbon stocks in managed and unmanaged old-growth western red cedar and western hemlock stands of Canada’s inland temperate rainforests. For. Ecol. Manag. 2013, 297, 108–119. [Google Scholar] [CrossRef]
- Goward, T.; Arsenault, A. Cyanolichens and conifers. Implications for global conservation. For. Snow Landsc. Res. 2001, 75, 303–318. [Google Scholar]
- Coxson, D.S.; Stevenson, S.K. Retention of canopy lichens after partial-cut harvesting in we-belt Interior Cedar-Hemlock forests, British Columbia, Canada. For. Ecol. Manag. 2005, 204, 99–114. [Google Scholar] [CrossRef]
- Bois, C.H.; Janzen, D.T.; Sanborn, P.T.; Fredeen, A.L. Contrasting total carbon socks between ecological site series in a sub-boreal spruce research forest in central British Columbia. Can. J. For. Res. 2009, 39, 897–907. [Google Scholar] [CrossRef]
- Ricketts, T.H. Terrestrial Ecoregions of North. America a Conservation Assessment; Island Press: Washington, DC, USA, 1999. [Google Scholar]
- NatureServe Explorer. Ecosystems. 2020. Available online: https://www2.gov.bc.ca/gov/content/environment/plants-animals-ecosystems/conservation-data-centre/explore-cdc-data/species-and-ecosystems-explorer (accessed on 3 June 2021).
- Meidinger, D.V.; Pojar, J. Ecosystems of British Columbia. 1991. Available online: https://www.for.gov.bc.ca/hfd/pubs/docs/srs/srs06.htm (accessed on 3 June 2021).
- Biogeoclimatic Ecosystem Classification Codes and Names BECdb. Version 10. 2016. Available online: https://www.for.gov.bc.ca/hre/becweb/resources/codes-standards/standards-becdb.html#_Download_Biogeoclimatic_or_Site_Ser (accessed on 3 June 2021).
- Freshwater Atlas of British Columbia. 2009. Available online: https://www2.gov.bc.ca/gov/content/data/geographic-data-services/topographic-data/freshwater (accessed on 3 June 2021).
- Coxson, D.; Goward, T.; Werner, J.R. The inland temperate rainforest and interior wetbelt biomes of western North America. In Encyclopedia of the World’s Biomes; Goldstein, M.I., DellaSala, D.A., Eds.; Elsevier: Amsterdam, The Netherlands, 2019. [Google Scholar] [CrossRef]
- Gavin, D.G.; Hu, F.S.; Walker, I.R.; Westover, K. The northern inland temperate rainforest of British Columbia: Old forests with a young history? Northwest. Sci. 2009, 83, 709–778. [Google Scholar] [CrossRef]
- Stevenson, S.K.; Armleder, H.M.; Arsenault, A.; Coxson, D.; DeLong, S.C.; Jull, M. British Columbia’s Inland Rainforest Ecology, Conservation and Management; UBC Press: Toronto, ON, Canada, 2011. [Google Scholar]
- Ministry of Forests Research Branch. Karst Inventory Standards and Vulnerability Assessment Procedures for British Columbia. 2003. Available online: https://www2.gov.bc.ca/assets/gov/environment/natural-resource-stewardship/nr-laws-policy/risc/karst_risc.pdf (accessed on 3 June 2021).
- Björk, C.R.; Goward, T. New records and range extensions of rare lichens from waterfalls and sprayzones in Inland British Columbia, Canada. Evansia 2011, 26, 219–224. [Google Scholar] [CrossRef]
- Sanborn, P.; Geertsema, M.; Jull, A.J.T.; Hawkes, B. Soil and sedimentary charcoal evidence for Holocene forest fires in an inland temperate rainforest, east-central British Columbia, Canada. J. Index. Metr. 2006, 16, 415–427. [Google Scholar] [CrossRef]
- Klenner, W.; Walton, R.; Arsenault, A.; Kremsater, L. Dry forests in the southern interior of British Columbia: Historic disturbances and implications for restoration and management. For. Ecol. Manag. 2008, 256, 1711–1722. [Google Scholar] [CrossRef]
- Spribille, T.; Björk, C.R.; Ekman, S.; Elix, J.A.; Goward, T.; Printzen, C.; Tonsberg, T.; Wheeler, T. Contributions to an epiphytic lichen flora of northwest North America. I. Eight new species from British Columbia inland rainforests. Bryologist 2009, 112, 109–137. [Google Scholar] [CrossRef]
- Goward, T.; Spribille, T. Lichenological evidence for the recognition of inland rainforests in western North America. J. Biogeogr. 2005, 32, 1209–1210. [Google Scholar] [CrossRef]
- Radies, D.N.; Coxson, D.S.; Johnson, C.J.; Konwicki, K. Predicting canopy macrolichen diversity and abundance within old-growth inland temperate rainforests. For. Ecol. Manag. 2009, 259, 86–97. [Google Scholar] [CrossRef]
- Terry, E.L.; Mclellan, B.N.; Watts, G.S. Winter habitat ecology of mountain caribou in relation to forest management. J. Appl. Ecol. 2000, 37, 589–602. [Google Scholar] [CrossRef]
- COSEWIC. COSEWIC Assessment and Status Report on the Caribou Rangifer Tarandus, Northern Mountain Population, Central Mountain Population and Southern Mountain Population in Canada; Committee on the Status of Endangered Wildlife in Canada: Ottawa, ON, Canada, 2014. [Google Scholar]
- Trombulak, S.C.; Frissell, C.A. Review of ecological effects of roads on terrestrial and aquatic communities. Conserv. Biol. 2000, 14, 18–30. [Google Scholar] [CrossRef]
- BC (British Columbia) Ministry of Forests. Watershed assessment procedure guidebook. In Forest Practices Code of British Columbia Guidebook, 2nd ed.; Version 2.1; Forest Practices Board, Ministry of Forests: Victoria, BC, USA, 2001. [Google Scholar]
- United States Fish and Wildlife Service. Bull Trout Recovery: Monitoring and Evaluation Guidelines; USFWS: Vancouver, WA, Canada, 2008. [Google Scholar]
- Environment Canada. Recovery Strategy for the Woodland Caribou, Southern Mountain population (Rangifer tarandus caribou) in Canada. In Species at Risk Act Recovery Strategy Series; Environment Canada: Ottawa, ON, Canada, 2014. [Google Scholar]
- Consolidated Cutblocks. 2020. Available online: https://www.for.gov.bc.ca/ftp/HTS/external/!publish/consolidated_cutblocks/About%20Consolidated%20Cut%20Blocks%202020.pdf (accessed on 3 June 2021).
- Results-Openings svw. 2020. Available online: https://catalogue.data.gov.bc.ca/dataset/results-openings-svw (accessed on 3 June 2021).
- Forest Tenure Cutblock Polygons FTA 4.0. 2020. Available online: https://catalogue.data.gov.bc.ca/dataset/forest-tenure-cutblock-polygons-fta-4-0 (accessed on 3 June 2021).
- McGarigal, K.; Cushman, S.A.; Ene, E. FRAGSTATS v4: Spatial Pattern Analysis Program for Categorical and Continuous Maps. Computer Software Program Produced by the Authors at the University of Massachusetts, Amherst. 2012. Available online: http://www.umass.edu/landeco/research/fragstats/fragstats.html (accessed on 3 June 2021).
- Leonard, J. Protected Areas-IW Study Area. 2019. Available online: https://databasin.org/datasets/a74b1b785b424ec798f4013f9dc70943/ (accessed on 3 June 2021).
- COSEWIC. COSEWIC Assessment and Status Report on the Northern Goshawk Accipiter Gentilis Laingi in Canada; Committee on the Status of Endangered Wildlife in Canada: Ottawa, ON, Canada, 2013. [Google Scholar]
- Baxter, C.V.; Frissell, C.A.; Hauer, F.R. Geomorphology, logging roads, and the distribution of bull trout spawning in a forested river basin: Implications for management and conservation. Trans. Am. Fish. Soc. 1999, 128, 854–867. [Google Scholar] [CrossRef]
- Canadian Science Advisory Secretariat Science Advisory Report. Recovery Potential Assessment for 11 Designatable Units of Fraser River Chinook Salmon, Oncorhynchus Tshawytcha, Part 1: Elements 1 to 11. 2020. Available online: http://publications.gc.ca/collections/collection_2020/mpo-dfo/fs70-6/Fs70-6-2020-023-eng.pdf (accessed on 3 June 2021).
- Wilderness Committee. New Mapping Shows Huge Increase in Old-Growth Logging in Year after Old-Growth Strategic Review. 2021. Available online: https://www.wildernesscommittee.org/news/new-mapping-shows-huge-increase-old-growth-logging-year-after-old-growth-strategic-review (accessed on 3 June 2021).
- Forest Planning and Practices Regulation. 2021. Available online: https://www.bclaws.gov.bc.ca/civix/document/id/complete/statreg/14_2004#division_d2e11896 (accessed on 10 June 2021).
- Bezzola, A.; Coxson, D. Management areas provide viable future habitat for temperate rainforest lichens? Can. J. Forest Res. 2020, 50, 774–787. [Google Scholar] [CrossRef]
- Canada Target 1 Challenge Government of Canada. 2020. Available online: https://www.canada.ca/en/environment-climate-change/services/nature-legacy/canada-target-one-challenge.html (accessed on 3 June 2021).
- Price, K.; Daust, D. Climate Change Vulnerability of BC’s Fish and Wildlife: First Approximation. 2016. Available online: https://www2.gov.bc.ca/assets/gov/environment/natural-resource-stewardship/nrs-climate-change/adaptation/climate20change20vulnerability20of20bcs20fish20and20wildlife20final20june6.pdf (accessed on 10 June 2021).


| Subcriteron/ Criterion | Extent (%) | Severity ≥80% | Severity ≥50% | Severity ≥30% | Critical (CR) | Endangered (EN) | Vulnerable (VU) |
|---|---|---|---|---|---|---|---|
| A1: Reduction in geographic distribution over the past 50 years | ≥80% | ≥50% | ≥30% | ||||
| C1: The past 50 years, based on change in an abiotic variable affecting a fraction of the extent of the ecosystem and with relative severity, as indicated by the status columns | ≥80 ≥50 ≥30 | CR EN VU | EN VU | VU | |||
| D1: The past 50 years, based on change in a biotic variable affecting a fraction of the extent of the ecosystem and with relative severity, as indicated in the status columns | ≥80 ≥50 ≥30 | CR EN VU | EN VU | VU | |||
| E: Quantitative analysis that estimates the probability of ecosystem collapse within 50 years | ≥50% in 50 years | ≥20% in 50 years | ≥10% in 100 years |
| Type | Potential Primary Forest (ha) | Remaining Primary Forest (ha) | Reduction (%) | Status | Remaining Primary Core Forest (ha) | Reduction (%) | Status |
|---|---|---|---|---|---|---|---|
| Interior Wetbelt | 9,430,236 | 6,747,906 | 28 | None | 2,828,200 | 70 | EN |
| Inland Temperate Rainforest | 1,330,198 | 806,195 | 39 | VU | 59,810 | 95 | CR |
| Decade | Number of Cut Blocks | Mean Cutblock Area (ha) | Logged Area (ha) | Percent of Forest Area Logged |
|---|---|---|---|---|
| unknown (null) | 4921 | 139,414 | ||
| 1930s | 7 | 47.4 | 332 | 0.00 |
| 1940s | 59 | 53.3 | 3142 | 0.03 |
| 1950s | 252 | 58.9 | 14,849 | 0.16 |
| 1960s | 3991 | 49.6 | 198,057 | 2.14 |
| 1970s | 14,065 | 34.2 | 480,727 | 5.30 |
| 1980s | 19,879 | 31.4 | 623,791 | 7.30 |
| 1990s | 27,194 | 18.2 | 494,608 | 6.20 |
| 2000s | 35,560 | 21.4 | 762,416 | 10.20 |
| 2010s | 19,889 | 23.8 | 472,893 | 7.04 |
| Biotic Factor & Original Extent (ha) | Extent Remaining Intact (ha) | Extent Impacted (ha) (%) | Severity Index † (%) | Ranking |
|---|---|---|---|---|
| Woodland Caribou Core Habitat 10.2 M ha | 1,177,470 | 9,022,530 (88) | 59 | EN |
| Old-Growth Bird Species 10.2 M ha | 2,213,820 | 7,986,180 (78) | 59 | VU |
| Sensitive Fish 10.2 M ha | 546,840 | 9,653,160 (95) | 60 | EN |
| Old-Growth Lichens (ITR only) 1.33 M ha | 154,350 | 1,145,650 (88) | 81 | CR |
| Subcriterion/Criteria | Interior Wetbelt | Core Interior Wetbelt | Inland Temperate Rainforest | Core Inland Temperate Rainforest |
|---|---|---|---|---|
| A1 | None | EN | VU | CR |
| C1 | NA | NA | VU | NA |
| E | EN-CR † | NA | Collapse | NA |
| D1: Biotic Factor | Ranking | |||
| Caribou | EN | |||
| Old-Growth Birds | VU | |||
| Sensitive Fish | EN | |||
| Old-Growth Lichens | CR | |||
Publisher’s Note: MDPI stays neutral with regard to jurisdictional claims in published maps and institutional affiliations. |
© 2021 by the authors. Licensee MDPI, Basel, Switzerland. This article is an open access article distributed under the terms and conditions of the Creative Commons Attribution (CC BY) license (https://creativecommons.org/licenses/by/4.0/).
Share and Cite
DellaSala, D.A.; Strittholt, J.R.; Degagne, R.; Mackey, B.; Werner, J.R.; Connolly, M.; Coxson, D.; Couturier, A.; Keith, H. Red-Listed Ecosystem Status of Interior Wetbelt and Inland Temperate Rainforest of British Columbia, Canada. Land 2021, 10, 775. https://0-doi-org.brum.beds.ac.uk/10.3390/land10080775
DellaSala DA, Strittholt JR, Degagne R, Mackey B, Werner JR, Connolly M, Coxson D, Couturier A, Keith H. Red-Listed Ecosystem Status of Interior Wetbelt and Inland Temperate Rainforest of British Columbia, Canada. Land. 2021; 10(8):775. https://0-doi-org.brum.beds.ac.uk/10.3390/land10080775
Chicago/Turabian StyleDellaSala, Dominick A., James R. Strittholt, Rebecca Degagne, Brendan Mackey, Jeffery R. Werner, Michelle Connolly, Darwyn Coxson, Andrew Couturier, and Heather Keith. 2021. "Red-Listed Ecosystem Status of Interior Wetbelt and Inland Temperate Rainforest of British Columbia, Canada" Land 10, no. 8: 775. https://0-doi-org.brum.beds.ac.uk/10.3390/land10080775