
Evolution of Agricultural Production in Portugal during 1850–2018: A Geographical and Historical Perspective


1
Centre for Geographical Studies, Institute of Geography and Spatial Planning, Universidade de Lisboa, Rua Branca Edmée Marques, 1600-276 Lisboa, Portugal
2
Faculty of Economics, University of Coimbra, CEIS20, 3004-531 Coimbra, Portugal
*
Author to whom correspondence should be addressed.
Land 2021, 10(8), 776; https://0-doi-org.brum.beds.ac.uk/10.3390/land10080776
Submission received: 11 June 2021
/
Revised: 16 July 2021
/
Accepted: 22 July 2021
/
Published: 23 July 2021
(This article belongs to the Section Land Systems and Global Change)
Abstract
:Agricultural statistical data enable the detection and interpretation of the development of agriculture and the food supply situation over time, which is essential for food security evaluation in any country. Based on the historical agricultural statistics, this study produces a long spatial time-series with annual production values of three cereals relevant to global food security—wheat, maize, and rice, aiming to provide geographical and historical perspectives. Therefore, we reconstructed past and current production patterns and trends at the district level over 169 years, which supported a space–time cross-reading of the general characteristics of the regional agricultural production value distributions and relative densities in Portugal. Particularly, the production trends of wheat, maize, and rice showed three different situations: growth (maize), stability (rice), and decline (wheat). For decades, maize and wheat production alternated, depending on agricultural years and political aspects, such as the Wheat Campaign (1929–1938). The changes over time presented a pattern that, in the case of these three cereals, enabled a clear division of the country into major regions according to cereal production. Overall, maize and rice, both grown on irrigated croplands, presented a similar pattern in some regions of Portugal, mainly the central region. In this study, a preliminary analysis was presented and related to successive public policies; however, notably, there are more lessons to be learned from this long spatial time-series.
1. Introduction
Since at least the first half of the nineteenth century, agricultural statistics have been collected and reported by most countries in Western Europe [1,2]. These data play an important role in academic discussions and in planning a sustainable future as they provide insights into the development of agriculture and the food supply situation over time [3,4,5], which is essential for food security evaluation in any country. However, the agricultural statistics data of many countries present limitations due to the variations in administrative units (i.e., geographic boundary changes for the attribution of data), which hampers in-depth long-term interpretations of agricultural development and also prevents comparison in terms of the evolution of regional production, that is, what was produced, in which locations and in which amount.
Considering the example of Portugal, public administration services have been collecting data every year since the mid-1850s. In terms of quantitative data, currently there are 140 years (1850–1989) of agricultural production information available at the district level. However, agricultural statistical data for the period after 1989 were collected and published linked to two different administrative units: from 1990 to 2005 at the agrarian region level, and since 2006 at the Nomenclature of Territorial Units for Statistics (NUTS) II level. Due to the incompatibility of these administrative units, a long-term analysis that also includes the last 30 years, reflecting regional production dynamics and oscillations, was not possible to reach. To date, several authors have been conditioned to use aggregated statistical series at the national level [6,7,8,9].
As phenomena occur at multiple spatial and temporal scales, the creation of a long spatial time-series is essential, and can strengthen the ability to assess past occurrences via scientific analysis and provide insights in order to form more effective solutions for current and future phenomena faced by society [10,11,12]. Therefore, for different scientific subjects, it is crucial to contour the limitations of statistical data that hamper the creation of a long-time series, and the ability of cross-timescale analysis to detect spatiotemporal patterns and trends, as well as to forecast future events [10,11,13]. Accordingly, considering the importance of agricultural statistical data in reinterpreting both past and current agriculture and food supply situations, this study focused on the Portuguese agricultural statistics data to find solution in order to homogenize the data at the upper scales and to create a long spatial time-series to provide geographical and historical perspectives.
Why analyze the Portuguese context? Because Portugal was one of the first European countries to published reliable agricultural statistical data since at least the last century and a half, at regular intervals, and linked only to three different administrative units. In addition, agriculture was the most important economic sector in Portugal until the 1960s, and despite being a relatively small European country, the presence of very distinct edaphoclimatic and agroecological conditions in the northern, central, and southern regions enables the cultivation of various agricultural products (e.g., wheat, maize, rice), with each one having an important role in the primary sector. Thus, the main objectives of the present study were threefold: (i) apply a method to overcome the variation in the administrative units of the Portuguese agricultural statistical data to create a long spatial time-series with annual agricultural production values at the district level for three cereal crops (wheat, maize, and rice); (ii) provide geographical and historical perspectives on each cereal production value distribution and relative density from 1850 to 2018; and (iii) analyze the historical spatiotemporal patterns and trends in regional cereal production over 169 years.
2. Materials and Methods
2.1. Study Area
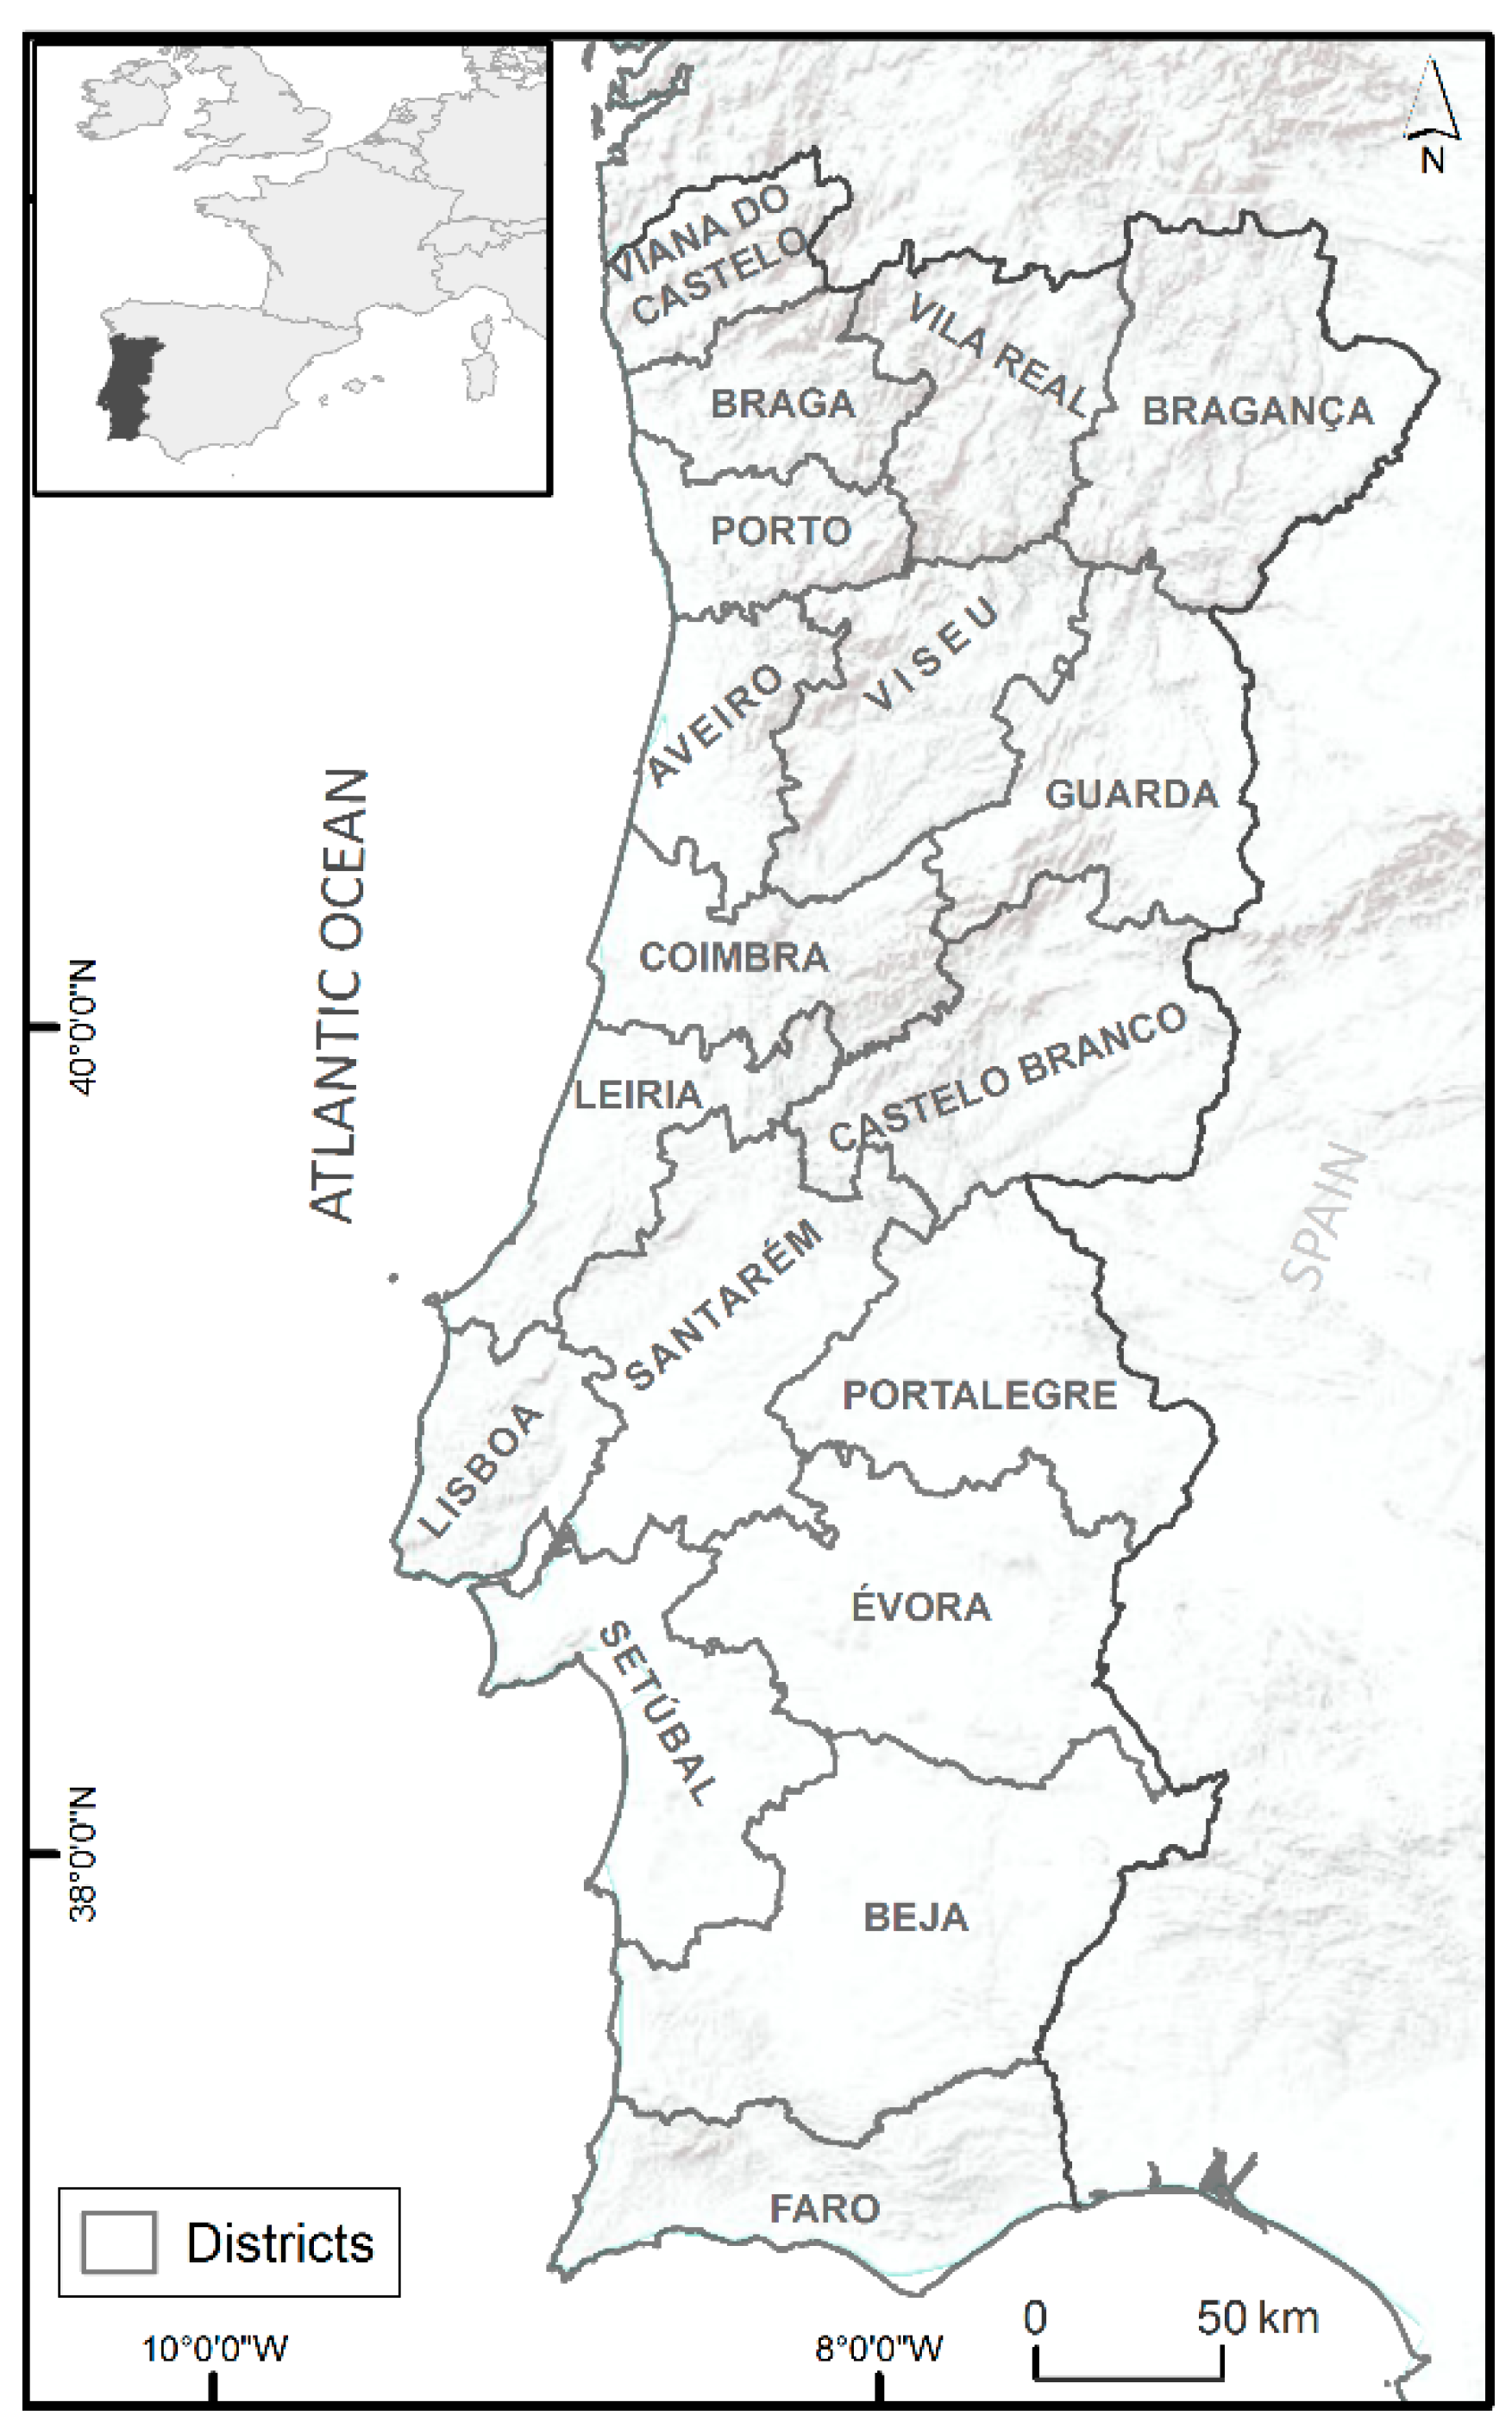
Mainland Portugal is located on the western coast of continental Europe, sharing its North and East borders with Spain and being bounded by the Atlantic Ocean to the West and South. In the territory of Portugal, to the northwest the landscape is mountainous and is characterized by the abundance of water and existence of fertile soils, and property is structured around the minifundium. In the southern interior, in the direction of Algarve, open rolling plains and granite hills characterize the relief, with water scarcity, poor soils, and agriculture that developed around the latifundium [14]. For statistical purposes, the Portuguese government uses the NUTS system (NUTS is a geographical nomenclature subdividing the economic territory of the European Union into three different levels, NUTS I, II, and III, respectively, moving from larger to smaller territorial units) and, informally, the district system (established in 1835 and used until European integration). This study was conducted for the 18 districts of mainland Portugal (Figure 1).
A considerable part of mainland Portugal is dedicated to agriculture, although the importance of agriculture varies between the different regions due to the edaphoclimatic and agroecological conditions (climate, soil fertility, water availability, and land structure, among others). In terms of the main products, the northern region is known for vineyards in the Douro Valley, while the southern region, specifically in Alentejo, developed an extensive monoculture of cereals and olive trees. Other important production includes fruits, namely oranges from Algarve, cherries from the Central region, and pêra rocha from the Oeste region, and a wide variety of crops, namely green vegetables, oilseeds, nuts, and cork. Nonetheless, the primary sector in Portugal was the most important until the 1960s, when the population working in agriculture fell rapidly from 42% in 1960 to 32% in 1970. This decline continues to the present day, with just 12% in agriculture [15].
2.2. Portuguese Agricultural Statistical Data
From the second half of the nineteenth century until the mid-1960s the Portuguese Civil Governors started annually reporting quantitative information on agriculture statistical data. Thereafter, the Statistics Office, and subsequent organizations, were responsible for the publication of an official statistics repository: the Portuguese Statistical Yearbook. In 1935 Statistics Portugal (INE) was founded and assumed these functions, and from 1943 to now the INE has published quantitative information on agriculture statistical data annually in the Agricultural Statistics book. Thus, when consulting various Portuguese statistical yearbooks and the annual Agricultural Statistics, it is possible to gather about 70 years of long-term continuous time-series data at the district level (1916 to 1989) [8].
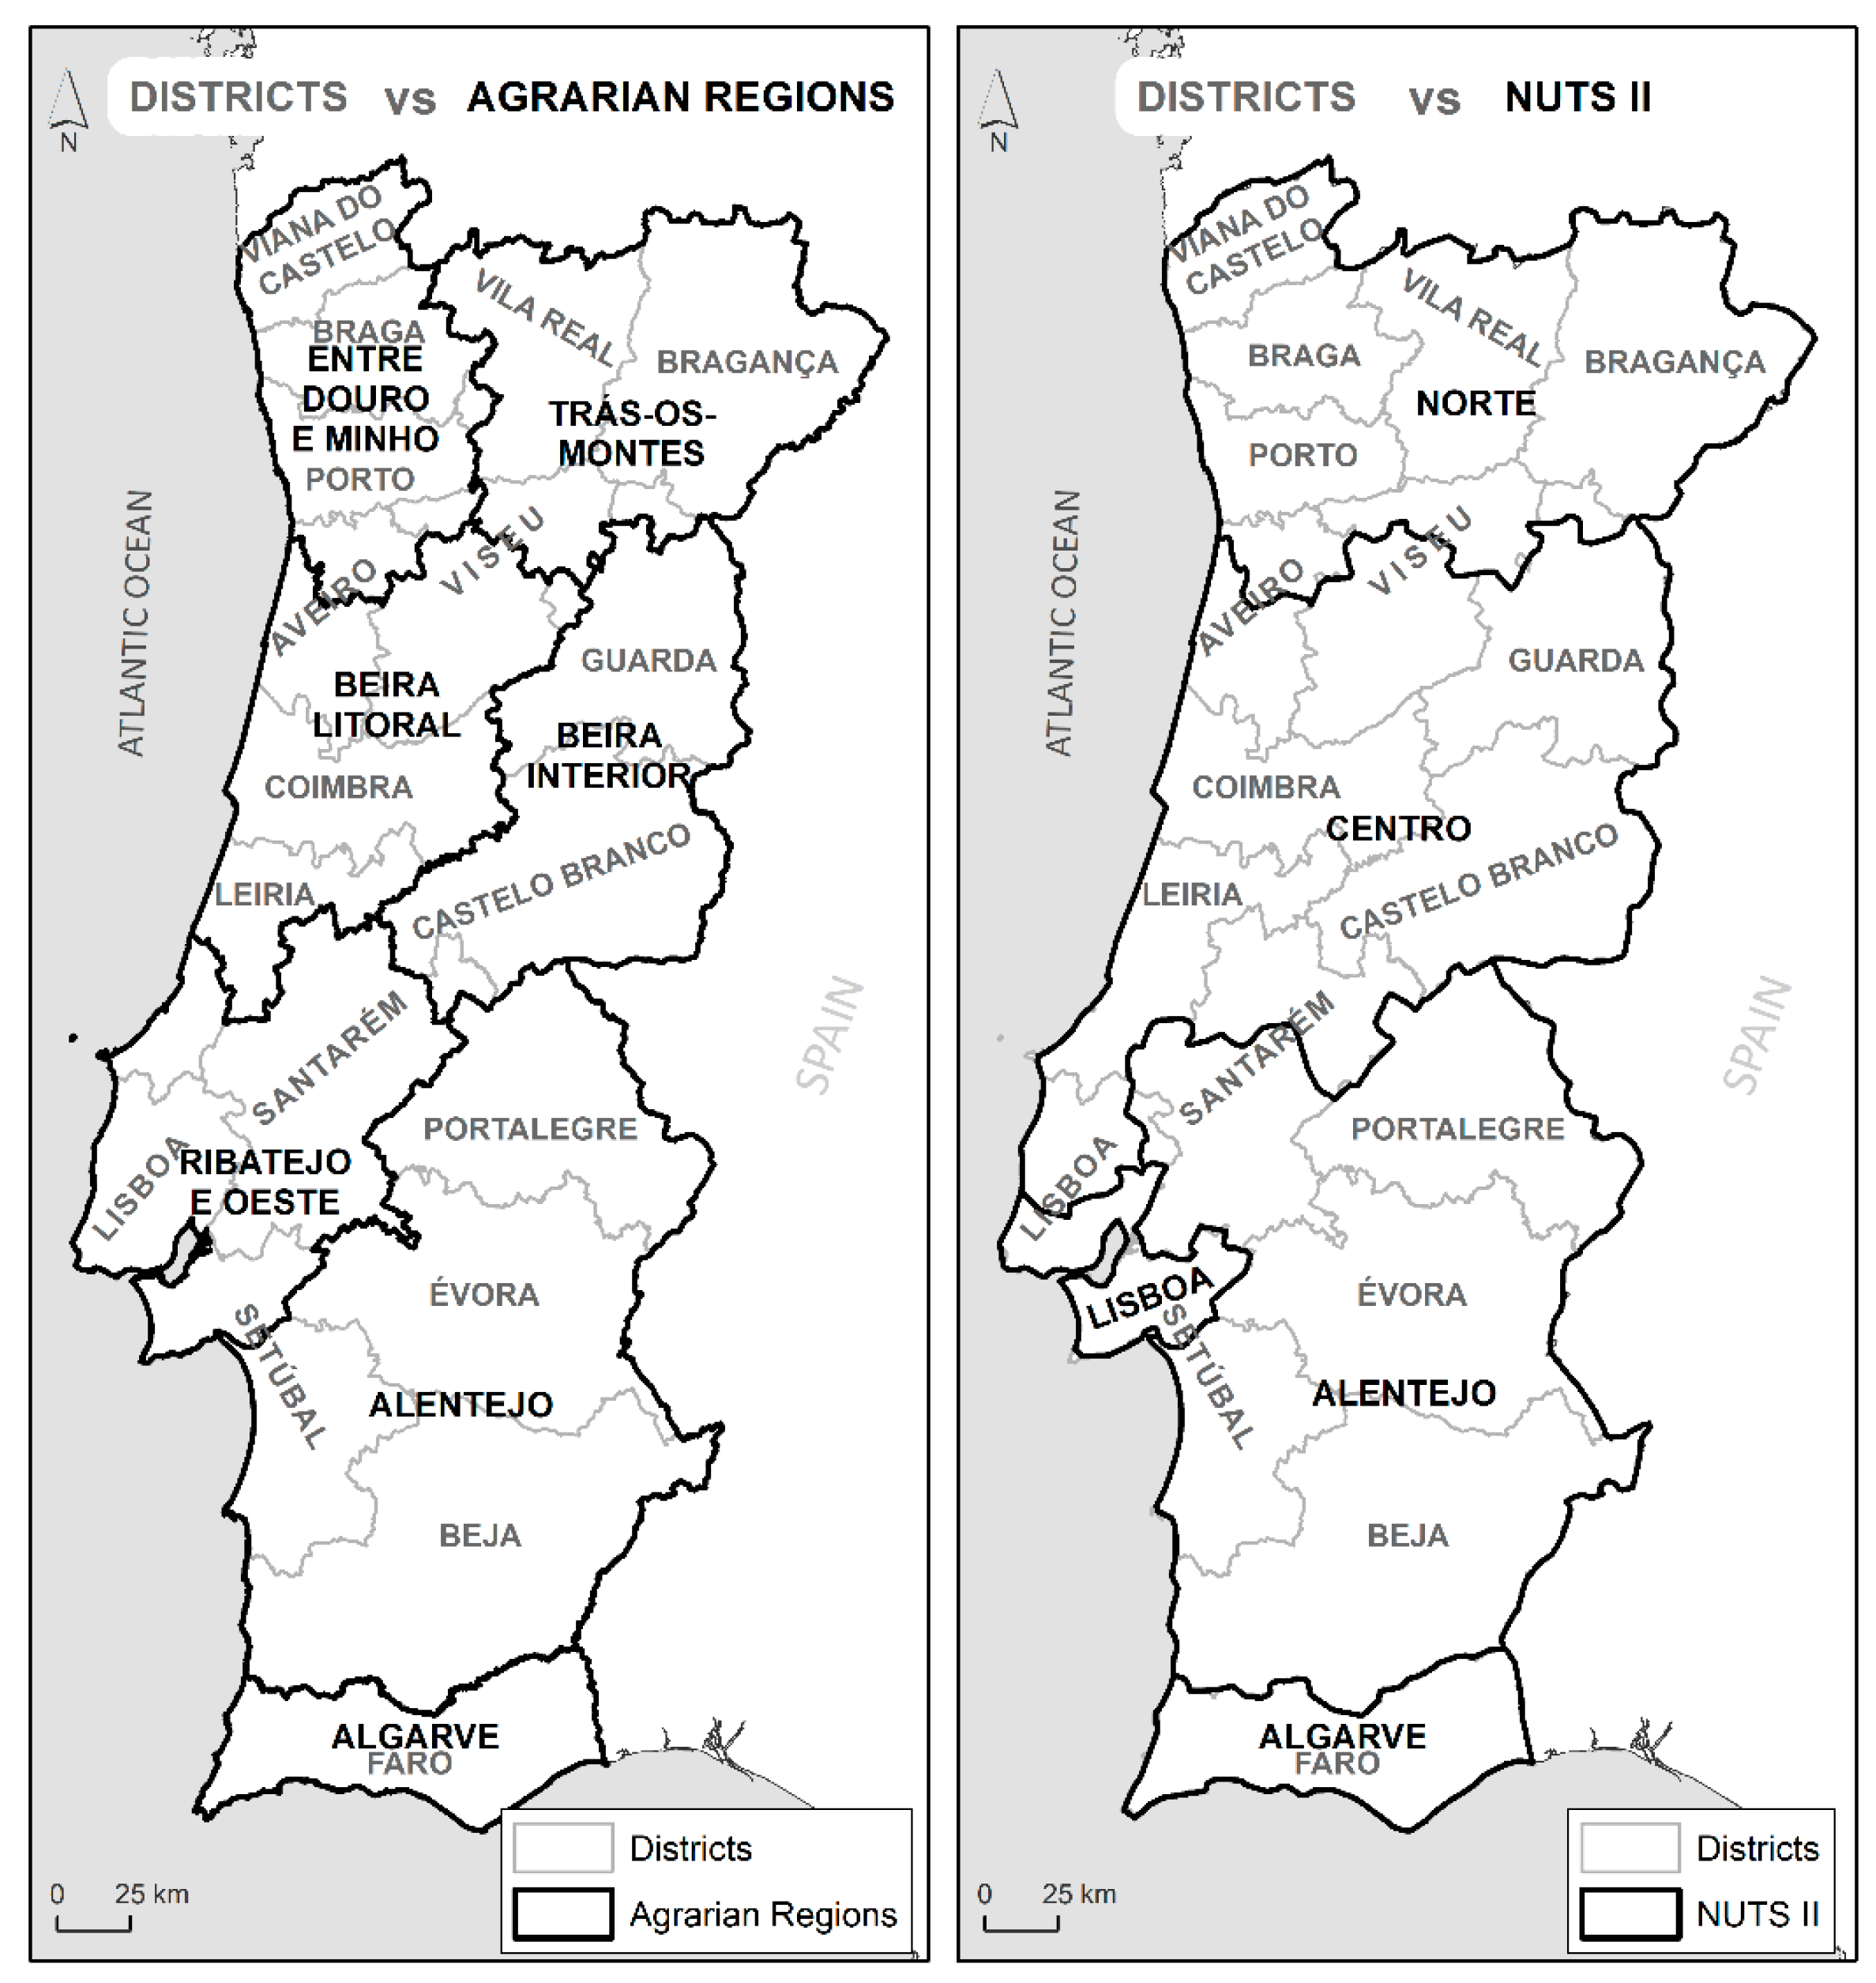
However, agricultural statistical data for the period before 1916 and for the period after 1989 present two distinct problems: firstly, the data before 1916 were scattered across the central and regional Portuguese public archives. As such, to gather the data, an interdisciplinary research team of the ‘Agriculture in Portugal: food, development, and sustainability (1870–2010)’ project, funded by the Portuguese Foundation for science and technology (FCT), had to work for three years by looking at thousands of documents deposited in the National Archives of Torre do Tombo (formerly known as the General Archive of the Kingdom, an organic nucleus of the General Directorate of Books, Archives and Libraries, which has been the central archive of the Portuguese State since the Middle Ages, being more than 600 years old), and the Arquivos Distritais (the Arquivos Distritais of Portugal has the mission of preserving and valuing the archival heritage of historical interest). The research team was able to gather agricultural data at the district level with annual production values from 1850 to 1915 for different agricultural products. It should be noted that the first version of the database had an absence of certain annual production values for specific products. Since the database had a sufficient temporal continuity, which allowed a decrease in the margin of error and did not affect the attributes of the data [16,17], the team applied the linear interpolation technique to fill the gaps. Secondly, the agricultural statistical data for the period after 1989 were published by different administrative units over the years: from 1990 to 2005 at the agrarian region level (AR) (the agrarian regions are agricultural statistical regions, and there are seven agrarian units in Portugal mainland), and from 2006 until 2018 (the last year with agricultural statistics data already published) at the NUTS II level (Figure 2).
In summary, we used two different data sources to gather agricultural statistics from 1850 to 2018. The first source is the data exploited by the ‘Agriculture in Portugal…’ project at the district level from 1850 to 1915, being freely available for download on the project website (http://www.ruralportugal.ics.ul.pt/ (accessed on 10 June 2021)). The second source is the Statistical Yearbooks and Agricultural Statistics published by the statistics public administration services (INE) at the district level (1916 to 1989), at the agrarian level (1990 to 2005), and at the NUTS II level (2006 forwards), being freely available for download on the INE website (https://ine.pt/ (accessed on 10 June 2021)).
Data Homogenization
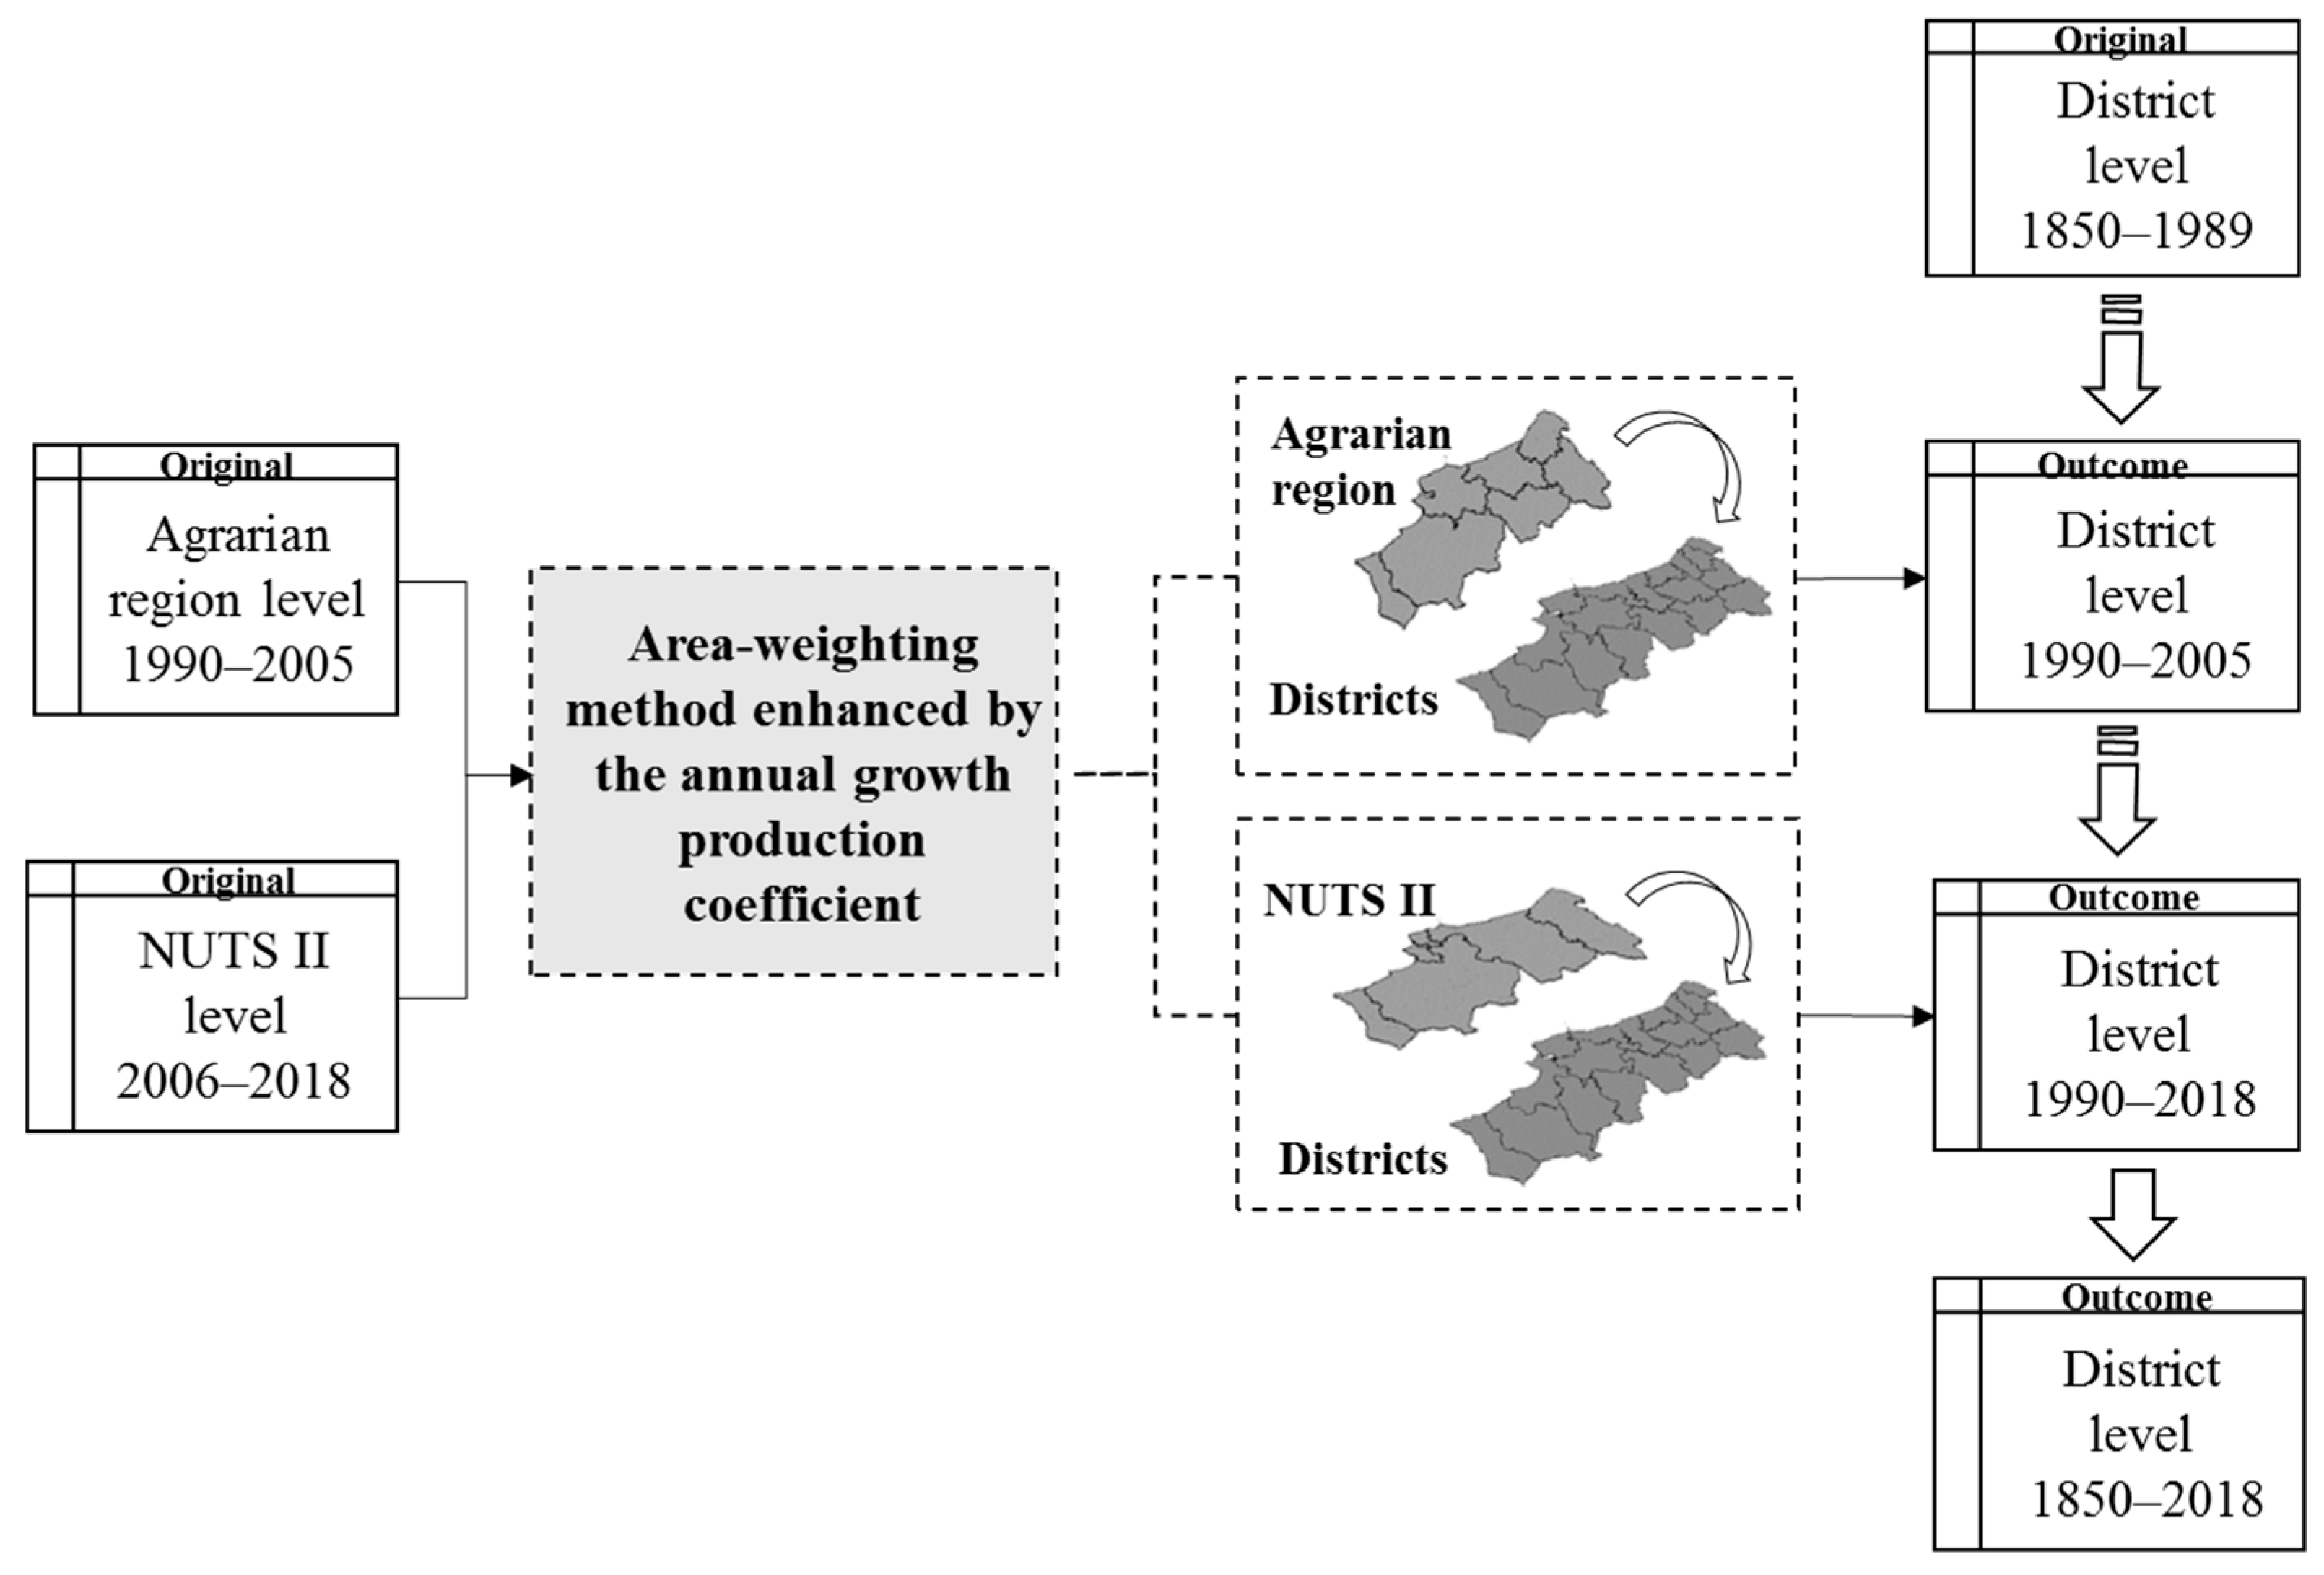
To create a continuous time-series database of the annual agricultural production at the district level from 1850 to 2018 it was necessary to overcome the administrative unit variation of data from 1990 to 2018 (at the agrarian and NUTS II levels). Therefore, we proposed the use of the traditional method of areal weighting enhanced by an annual growth production coefficient to disaggregate the statistical data to the district level (Figure 3). The district level was used because it was the smallest administrative unit which can consistently compare the available official space–time data. In addition, for the three administrative levels, this was the level with the longest reporting.
The GIS-based technique of area-weighting has been applied in many studies because it enables different geographical units of analysis containing attributed data to be standardized [18,19,20]. Ref. [21] define the area-weighting as a ‘transfer of data from one set (source units) to a second set (target units) of overlapping, non-hierarchical, areal units’. Thus, the collected variable (source unit) is interpolated onto a target unit (the unit the analyst requires for the analysis) weighted by each source unit area within the target unit area [10,22,23]. Accordingly, in this study, the area-weighting method is as follows:
where is the estimated variable of the target zone, is the variable of the source zone, is the area of the source zone, and is the area of the zone of intersection between the source and target zones [23]. This method assumes a spatially homogeneous relationship between the source and target units, which means that the variable is equally distributed across the source unit. However, this assumption is unrealistic in the real world [24,25]. Thus, to overcome the spatially homogeneous relationship and improve the areal interpolation accuracy, we applied the annual growth production coefficient:
where corresponds to the first known agricultural production value at the agrarian region level for the period from 1990 to 2005 and at the NUTS II level for the period from 2006 to 2018 (N1), and corresponds to the sum of the agricultural production value of each district unit area that overlaps with the AR level or the NUTS II level (N1*). Thus, the evolution of agricultural production in each district is given by the annual production growth of the AR or NUTS II, where the district mainly overlaps.
We adopted this approach for three main reasons: (1) we were unable to use ancillary data due to their scarcity [22,26,27,28]; (2) we could not simply assume the source unit area as the spatial conversion criterion to disaggregate the data, as there is no spatially homogeneous relationship between the source and target units, that is, both administrative units (agrarian regions and NUTS II) have large areas regarding each district level unit (Figure 2); and (3) we aimed to control for significant increases in annual production values (suspicious spike values) (for more information regarding spike values see [29]).
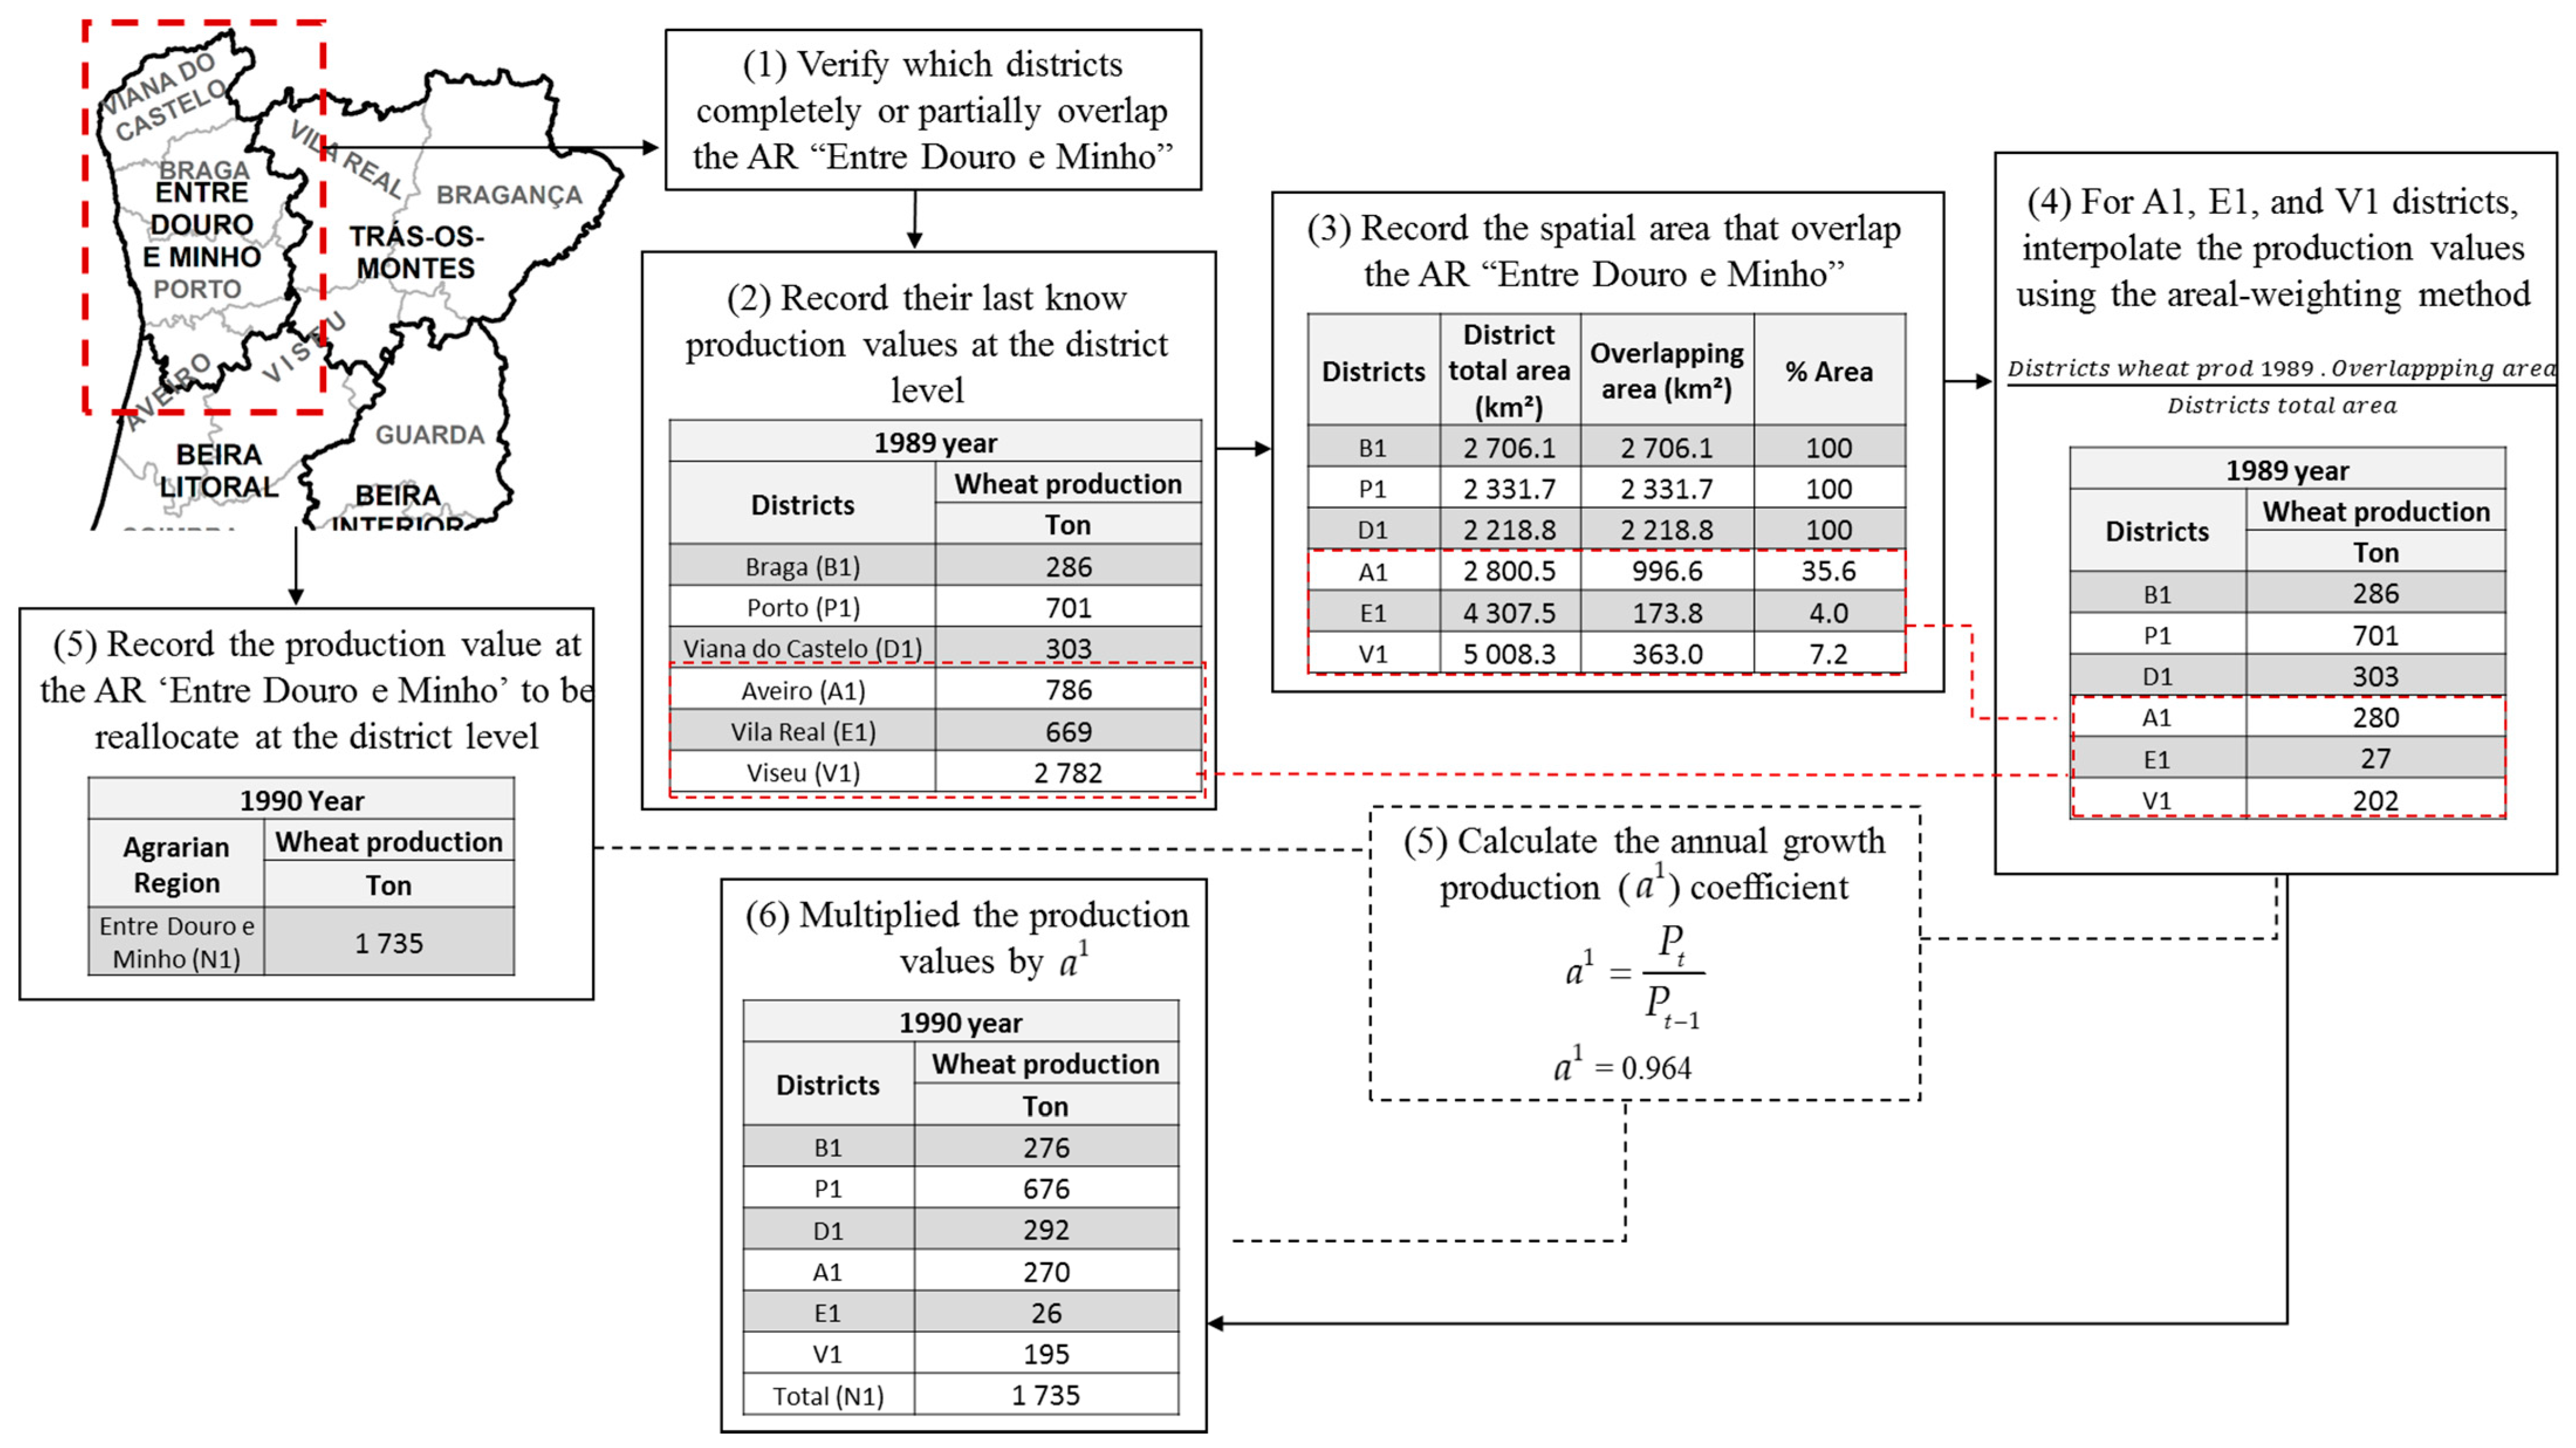
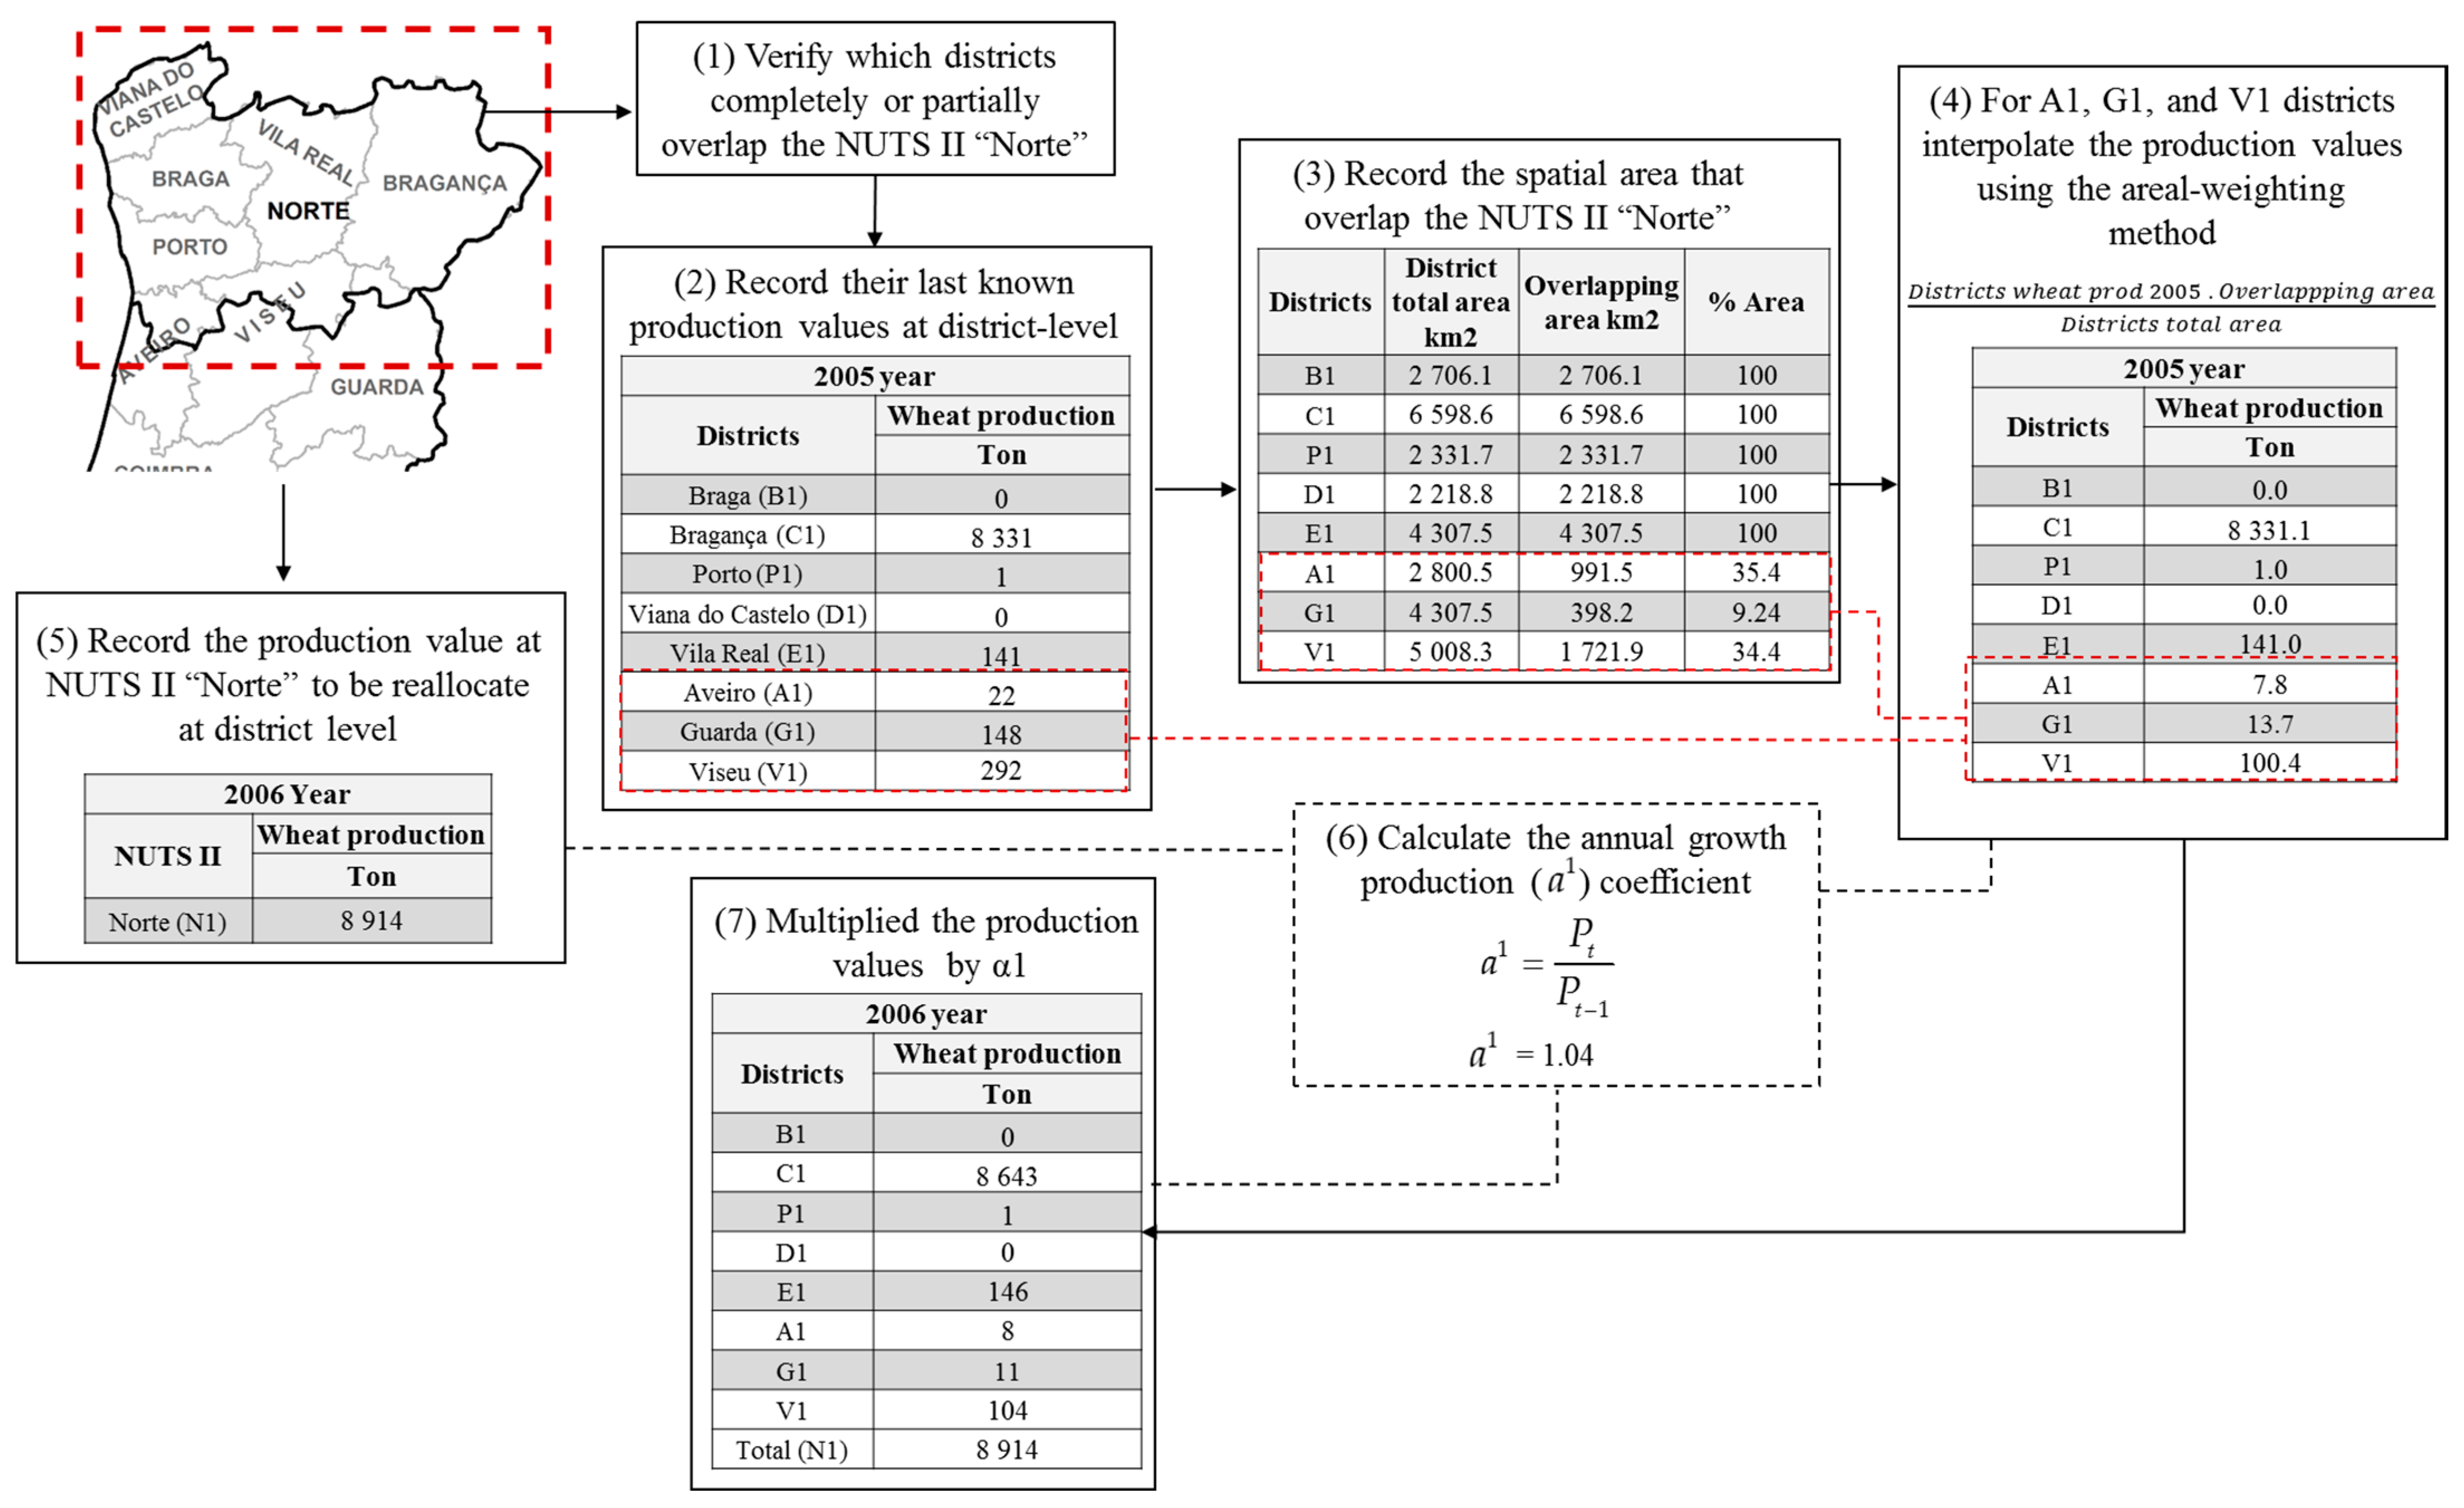
Therefore, the proposed method disaggregates the statistical data based on the geometric intersection of the source unit and target unit weighted by the production annual growth of the original collected data. As such, the evolution of production in each district is given by the production annual growth of the original collected data. Figure 4 presents an example of homogenized statistical data of the wheat production values from 1990 at the AR “Entre Douro e Minho”. Thus, to disaggregate the wheat production values in 1990 at the district level, we first selected all the districts that completely or partially overlaid the AR “Entre Douro e Minho” and recorded their last known production values (at district-level, 1989). There were six districts that overlaid this region, but only three of them were spatially completely contained inside, namely “Viana do Castelo”, “Braga”, and “Porto”. The other three districts (“Aveiro”, “Vila Real”, and “Viseu”) areas overlapped not only with the AR “Entre Douro e Minho” but also the AR “Trás os Montes” and “Beira Litoral”. For these three districts, a GIS overlay operation was performed in order to obtain the areas that overlapped each agrarian region, and, accordingly, the production values of these three districts were interpolated using the areal-weighting method. Then, we calculated the annual growth production coefficient. Lastly, the production values were multiplied by the annual growth production coefficient. This procedure was applied for each AR (“Entre Douro e Minho”, “Trás os Montes”, “Beira Litoral”, “Beira Interior”, “Ribatejo e Oeste”, “Alentejo”, and “Algarve”) from 1990 to 2005 and for the three cereals. Finally, the same procedure was applied for each NUTS II (“Norte”, “Centro”, “Lisboa”, “Alentejo”, and “Algarve”) from 2006 to 2018 for the three cereals. Figure 5 presents an example of standardized statistical data for wheat production values from 2006 at the NUTS II “Norte” that were disaggregated at the district level.
2.3. Long-Term Spatiotemporal Interpretation and Trend Analysis
To provide a long-term spatiotemporal analysis of the annual agricultural production, we created annual maps by rescaling the values within a range of 0 to 100 using linear min–max normalization [30]. This procedure was necessary because the range of agricultural production varied widely. The normalized production value (PNV) is presented as a percentage as follows:
where is the original production value in district (i) at a given time (t); and are the overall minimum and maximum production values at a given time, respectively. An index of 100 indicates the district that produced the most in each year. This procedure was applied for the production values of wheat, maize, and rice cereals from 1850 to 2018.
Thereafter, to identify the spatiotemporal trends over 169 years, we explored the ‘Emerging Hot Spot Analysis’ tool from ArcGIS Pro software. This tool combines two statistical measures, namely the Mann–Kendall (MK) trend test [31] and the Getis–Ord Gi statistic [32], and aggregates the data into a time cube to identify the trends over time by generating space-time intervals for every location with data. The MK test searches for a trend in a time series without specifying whether it is linear or non-linear [33]. In this study, the partition of data across time was defined in one-year intervals, from 1850 to 2018, for each Portugal district and for the absolute values. The hot and cold spot trends were evaluated using the MK trend test for each location, and one of eight categories was identified: new, consecutive, intensifying, persistent, diminishing, sporadic, oscillating, and historical hot and cold spots (https://pro.arcgis.com/en/pro-app/latest/tool-reference/space-time-pattern-mining/learnmoreemerging.htm (accessed on 10 June 2021)).
The number of time-step periods that determine which features are analyzed together to assess local space–time clustering was set to 20 years, which was considered as the most appropriate regular interval considering the evolutionary phases of regional agricultural production in Portugal (e.g., wheat campaign phase from 1929 to 1938 and world wars) [6]. Therefore, the final analysis provides the general trend of the 20-year cluster in recent time, revealing the latest production tendency for wheat, maize, and rice.
3. Results
3.1. Overview of Wheat, Maize, and Rice National Production
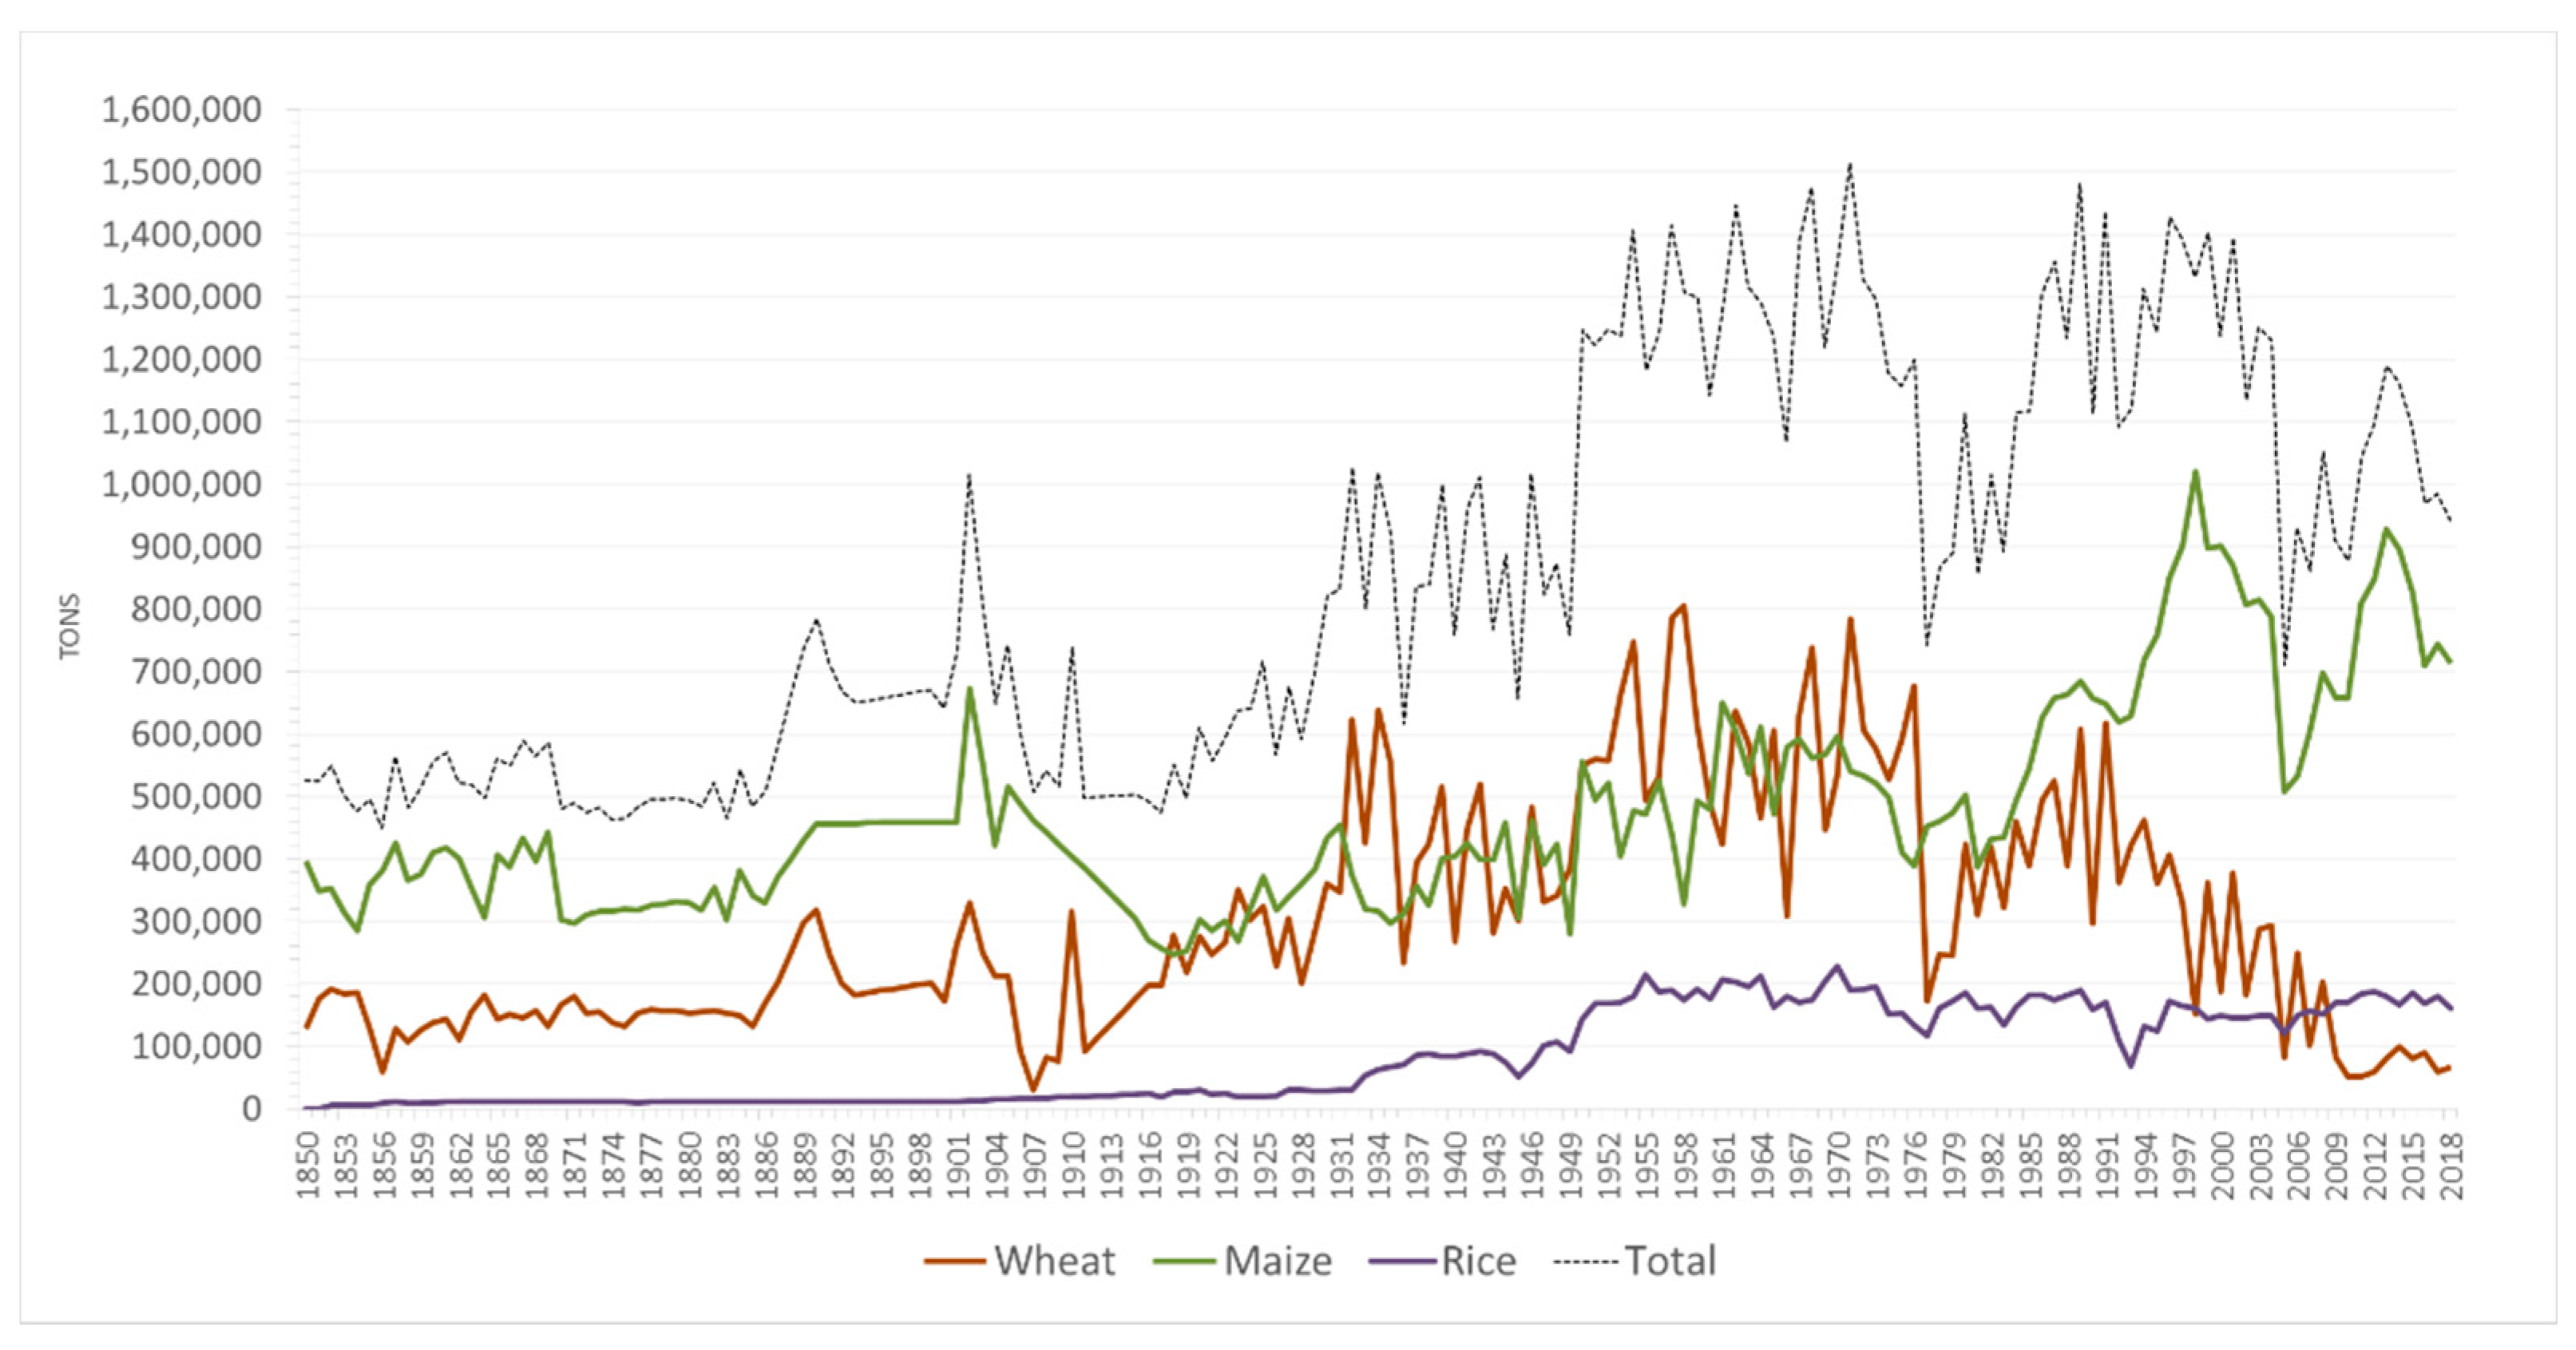
From a national perspective, the production trends of wheat, maize, and rice showed three different situations: growth (maize), stability (rice), and decline (wheat) (Figure 6). The distinct amount of production for the three cereals is also clear. Overall, the largest production of cereals occurred in the 1950–1970 period, followed by a major production crisis in the 1970s and 1980s. Notably, for decades, maize and wheat production has alternated. In fact, maize production was only lower than wheat in some years of the 1930s, 1950s, and 1970s. In addition, higher wheat production occurred in 1958, with approximately 805,000 tons produced. However, since the 1980s, maize production has increased compared to that of the other two cereals, registering an accelerated growth and reaching its absolute maximum production value in 1998 (>1,000,000 tons). Simultaneously, wheat started to present smaller production values, and only in the 1990s did wheat production increase. Since the 1940s, rice production has presented a growing trend, in which higher production occurred in 1970, but only to approximately 227,000 tons.
3.2. Regional Long-Term Spatiotemporal Analysis
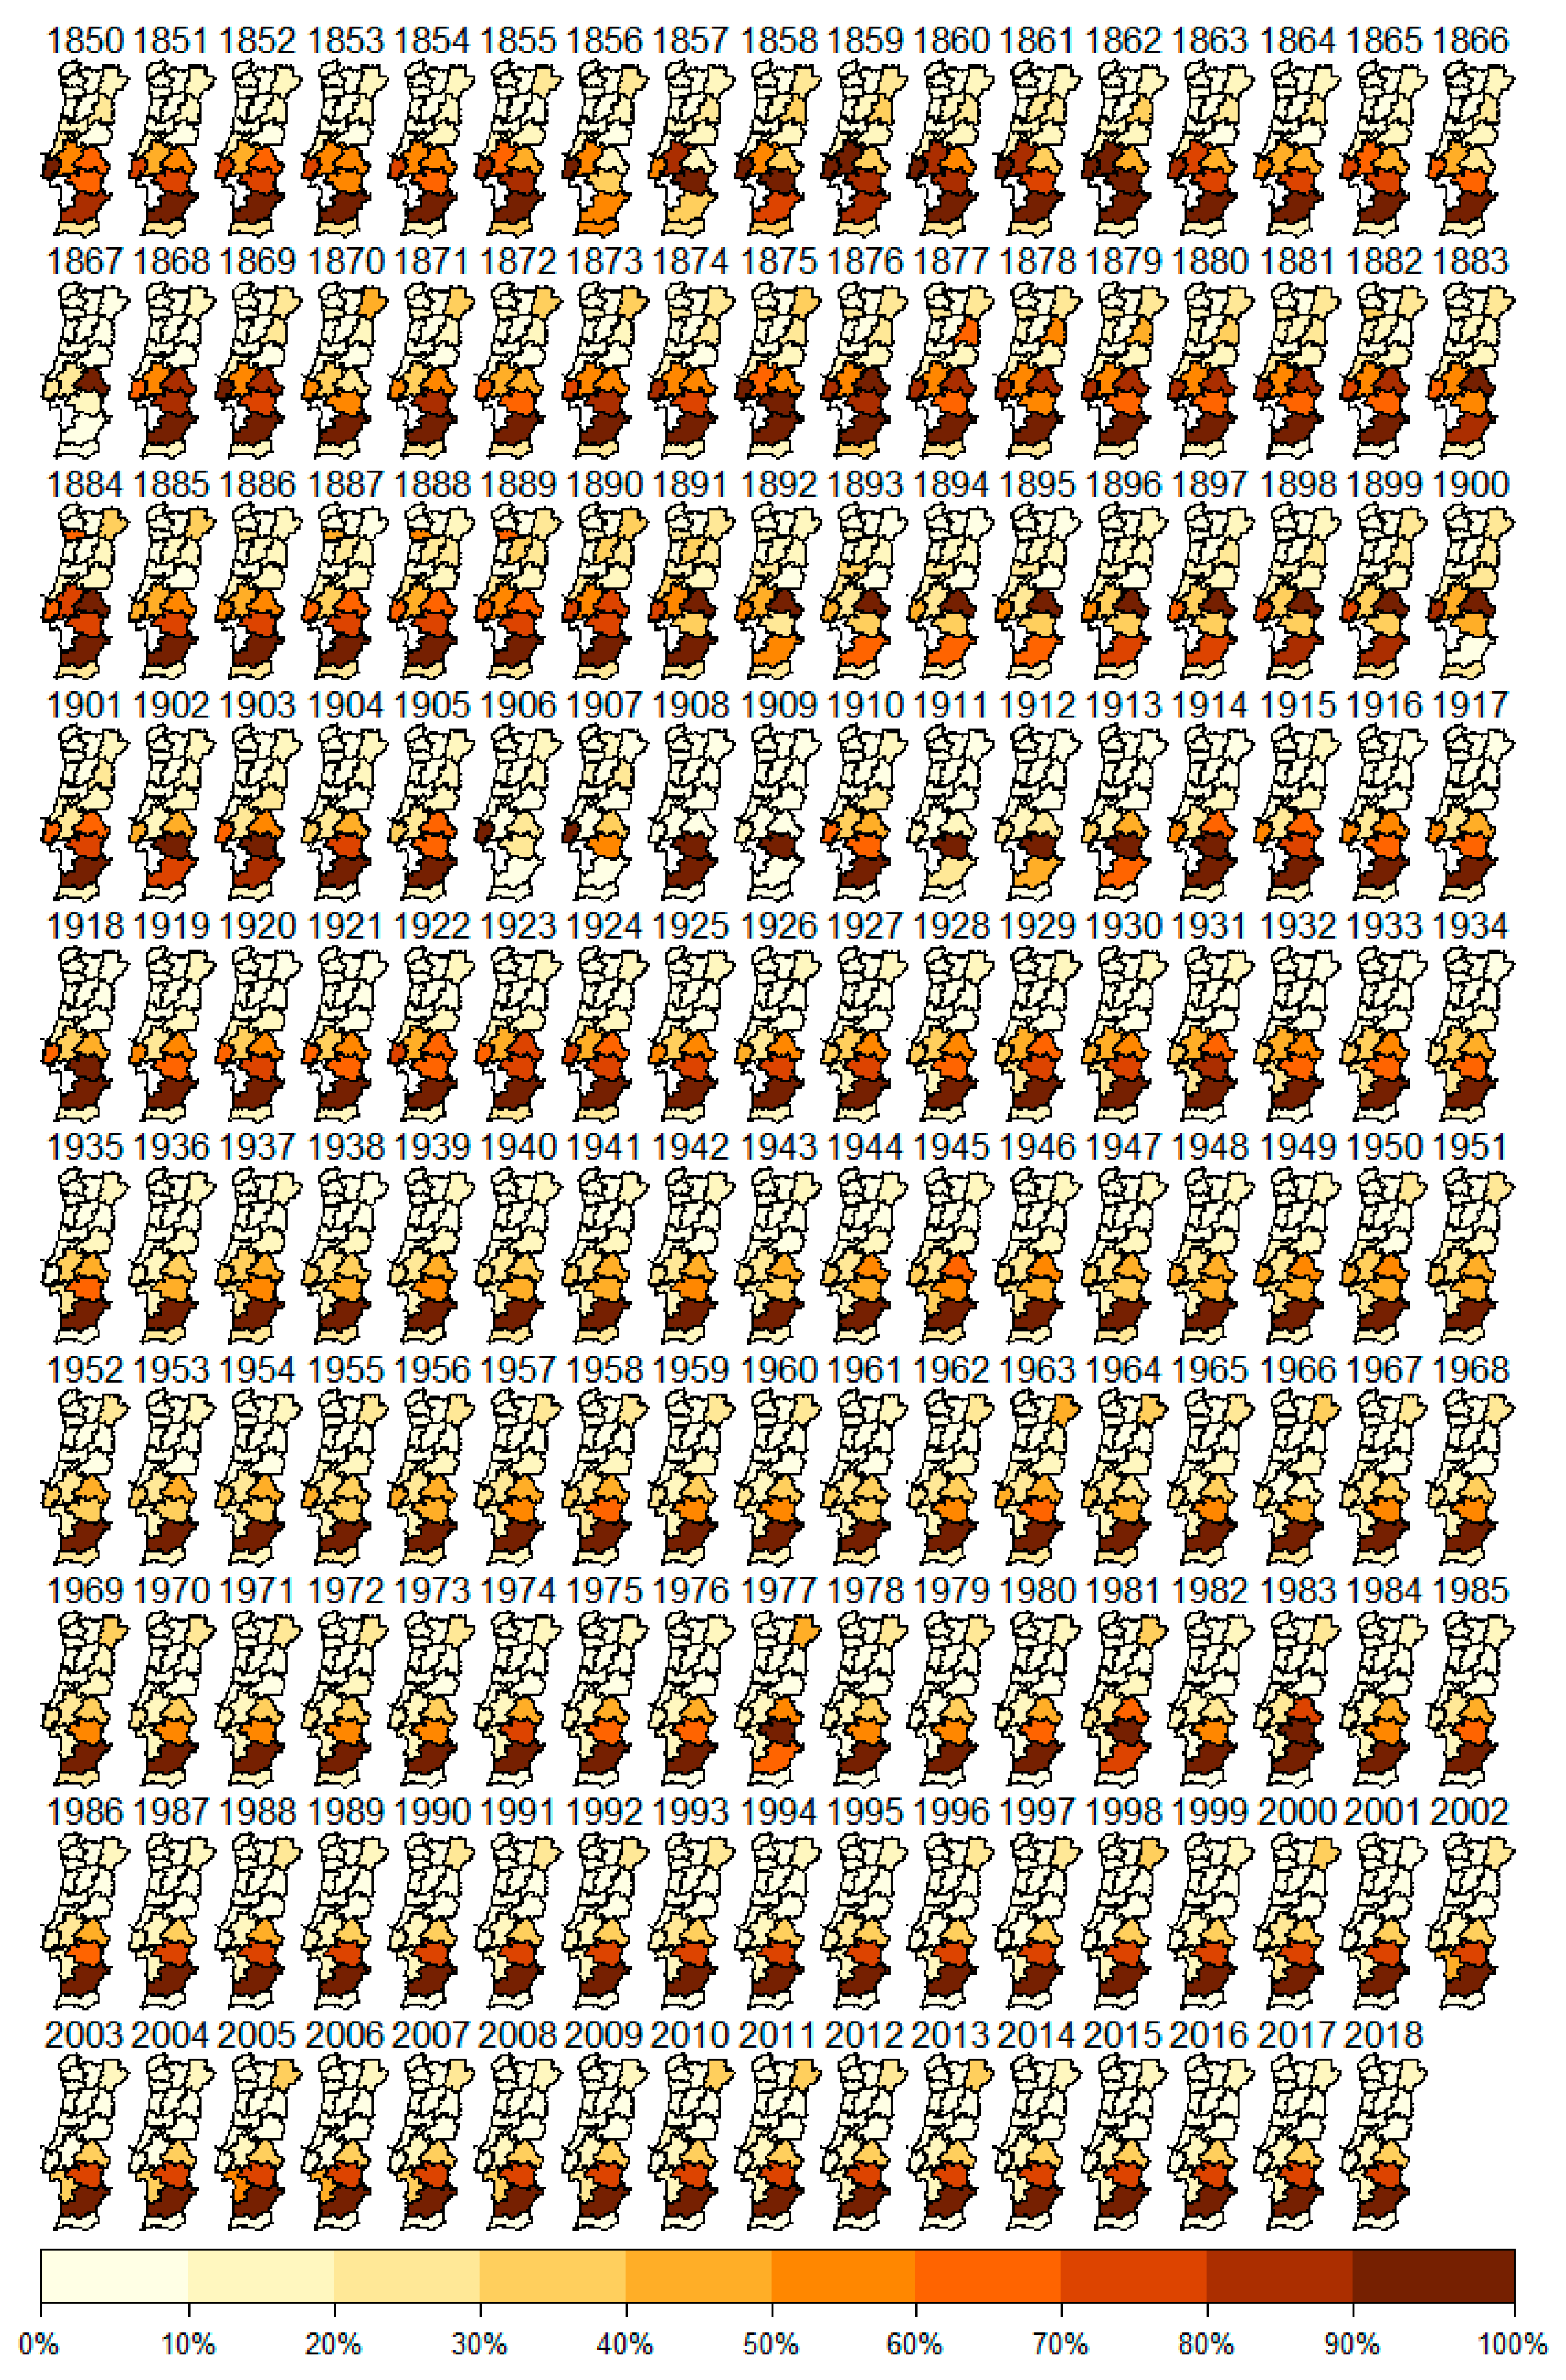
Chronologically, wheat was mainly cultivated in the southern region of the country, more specifically in the Alentejo region (Figure 7). Over the 169-year period under study, the importance of the districts that are part of the Alentejo region (Portalegre, Évora, Beja) to wheat production is remarkable. Since 1984, the spatial pattern remains, and Beja and Évora are the districts that produce the most wheat in Portugal, followed by Portalegre. In particular, Beja consistently produced more wheat between 1850 and 2018, except for 1977 and 1981, in which Évora produced more wheat than Beja.
Figure 7 shows the existence of two other regions situated in the south-central part of Portugal, with a strong impact on wheat production. The first is the Lisbon District, which has a relevant role in wheat production. During poor wheat production in the Alentejo region (1906 and 1907), the production in Lisbon was significant. However, in the following years, the Lisbon District started to lose importance in wheat production and became irrelevant from a regional perspective. Historically, the Lisbon district heavily lost wheat production due to urban development that took the good land used to produce this cereal.
Another prominent region is the Ribatejo and Lezíria do Tejo, which mainly incorporates the municipalities of the Santarém District. Specifically, wheat production presented several oscillations over the 169-year period under study, with a strongly decreasing trend after 1936. It is also particularly relevant that the northwest of the country always had a low tendency for wheat production, which will be better explained in the analysis of maize production in mainland Portugal. Lastly, we emphasize the oscillating relevance over the 169 years of the Bragança District, which is situated in the northeast region.
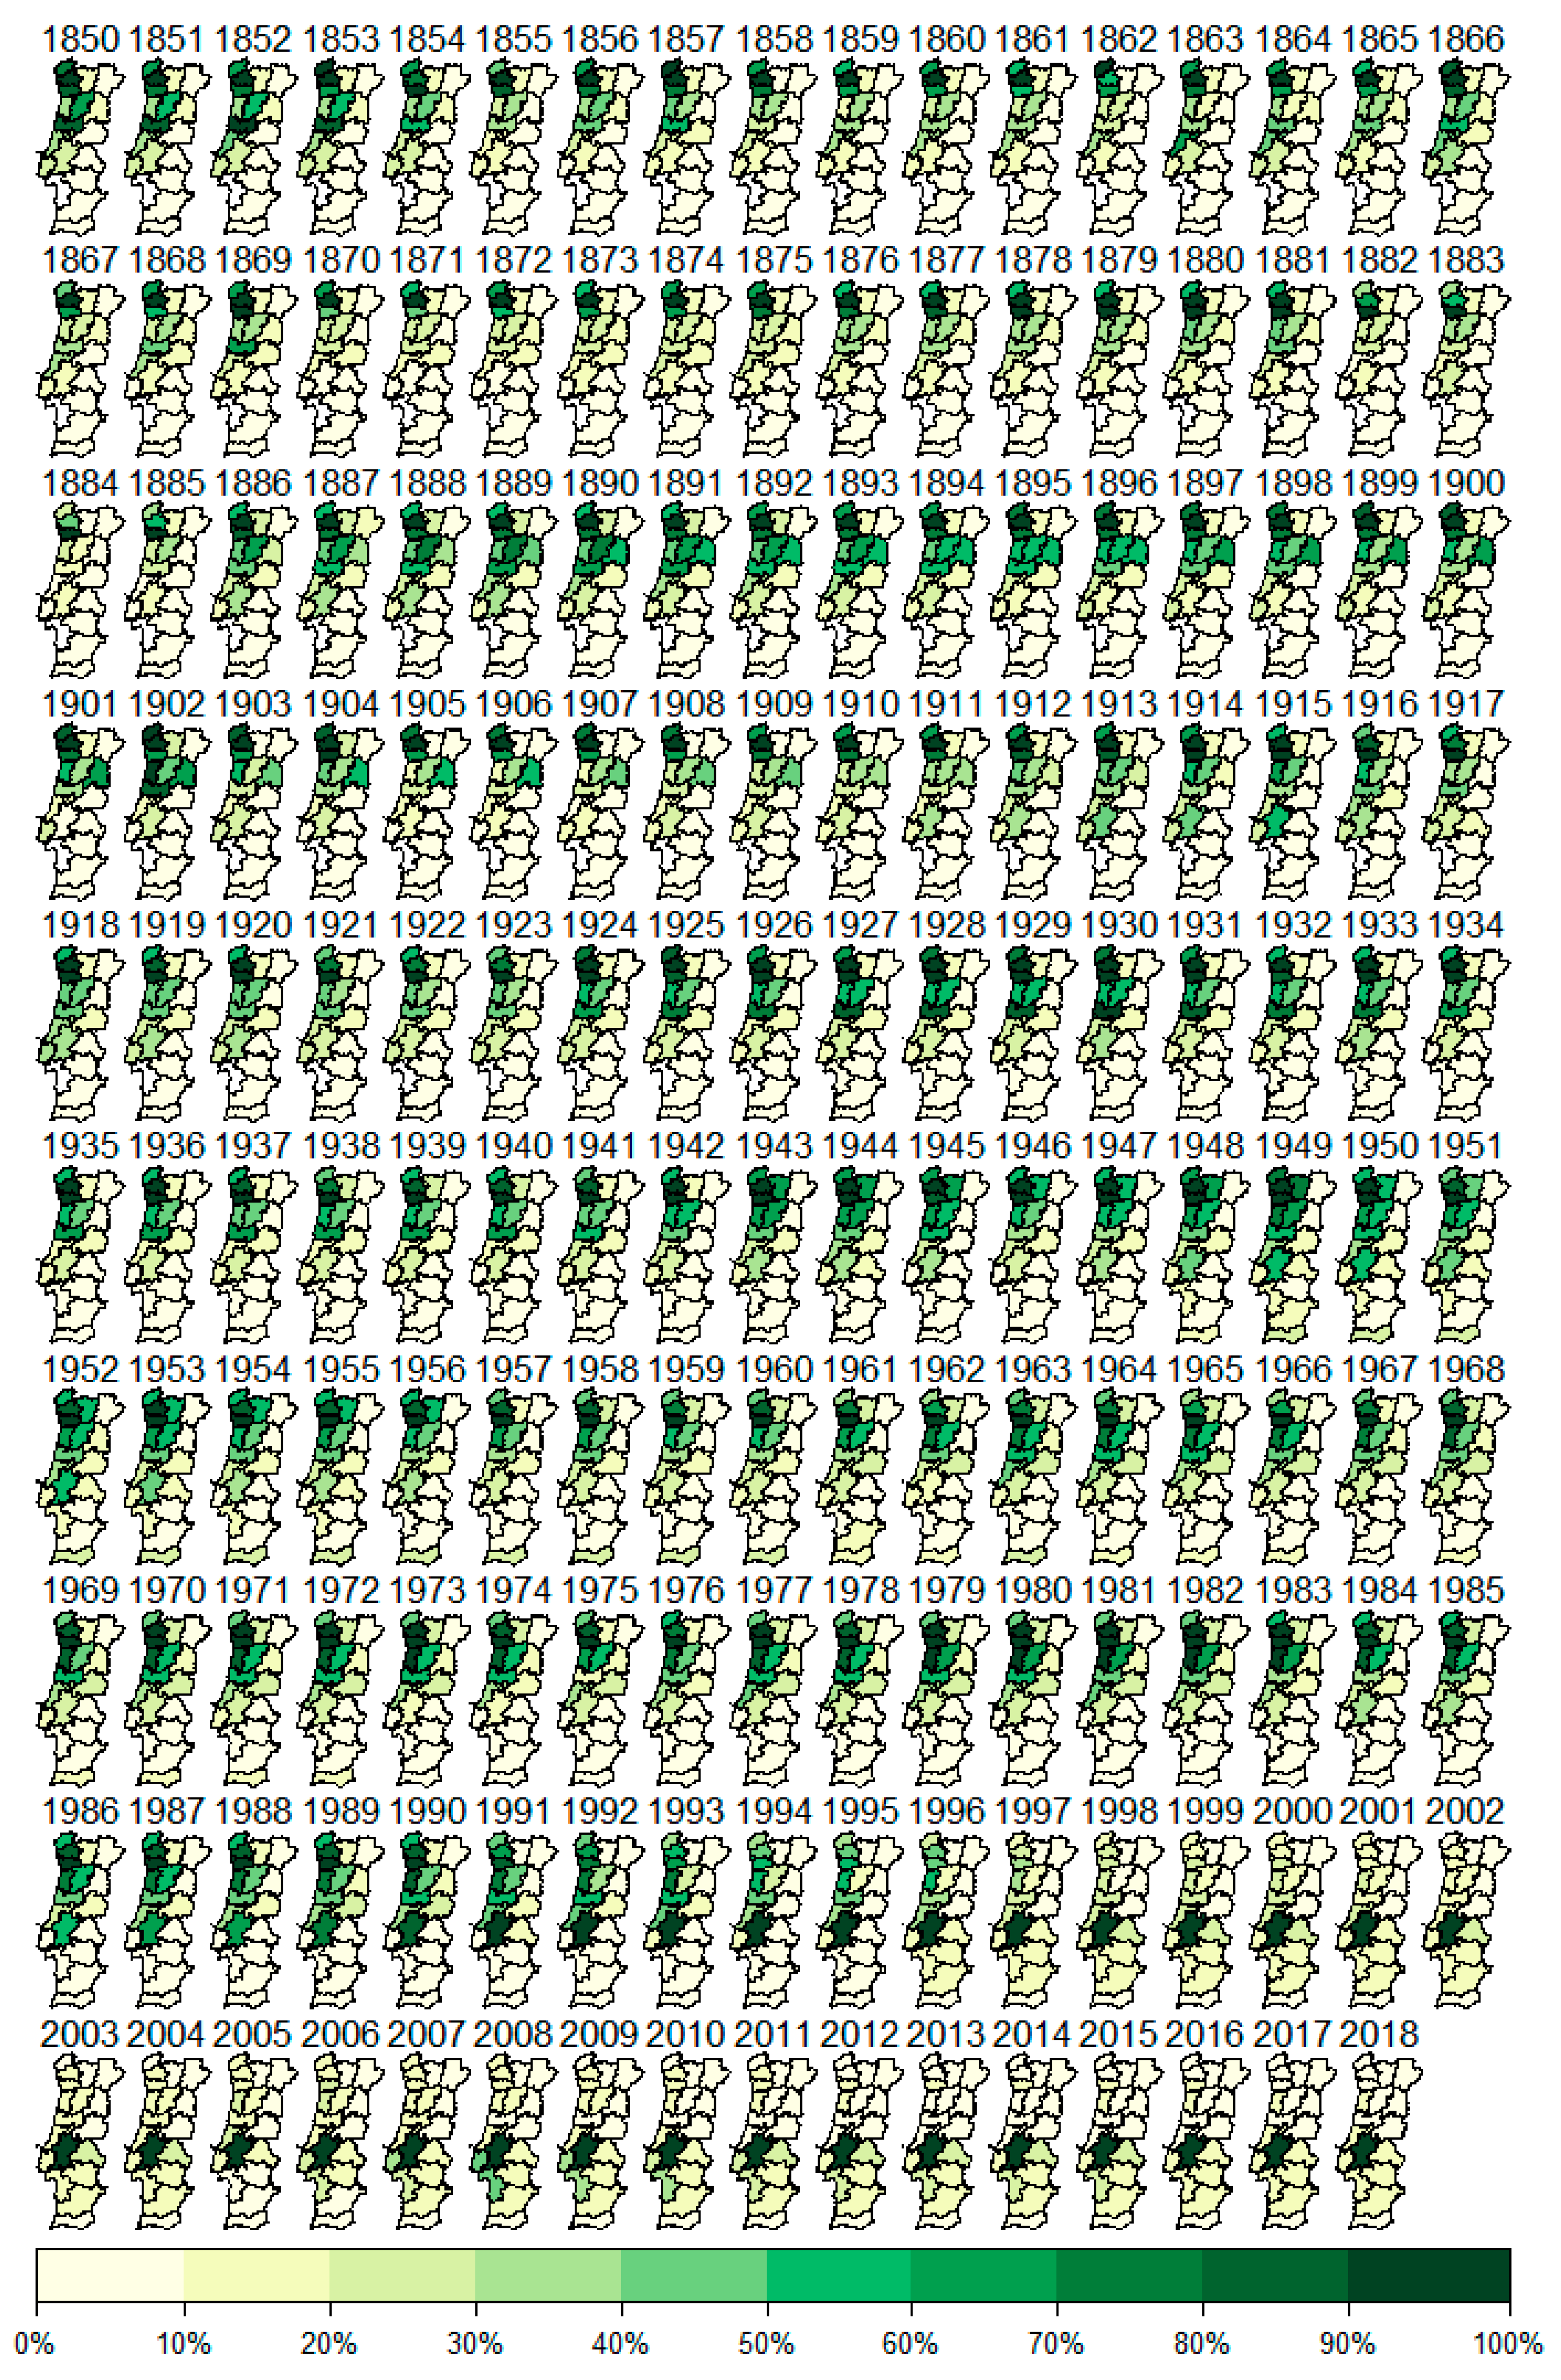
Figure 8 shows that regions which produce wheat do not produce maize. In the 19th century, maize production was concentrated in the opposite direction of wheat production, particularly in the northern and coastal regions. This cereal expanded from northwest to south along the coastal regions of small agricultural parcels. By the beginning of the 20th century, maize production reached its maximum expansion in the Portuguese territory.
However, during the late 1980s, with the entry of Portugal into the European Economic Community (in 1986), maize production moved to the south-central part of the country. Presently, the main maize production region is the south-central region of the country, more specifically the Ribatejo zone (Santarém District), which has emphasized maize production since 1991. In fact, for the last 25 years, Santarém has consistently produced more maize in the national context. Cereal production has also increased slowly in the Alentejo region. Notably, the regions historically associated with maize production are no longer focused on this crop.
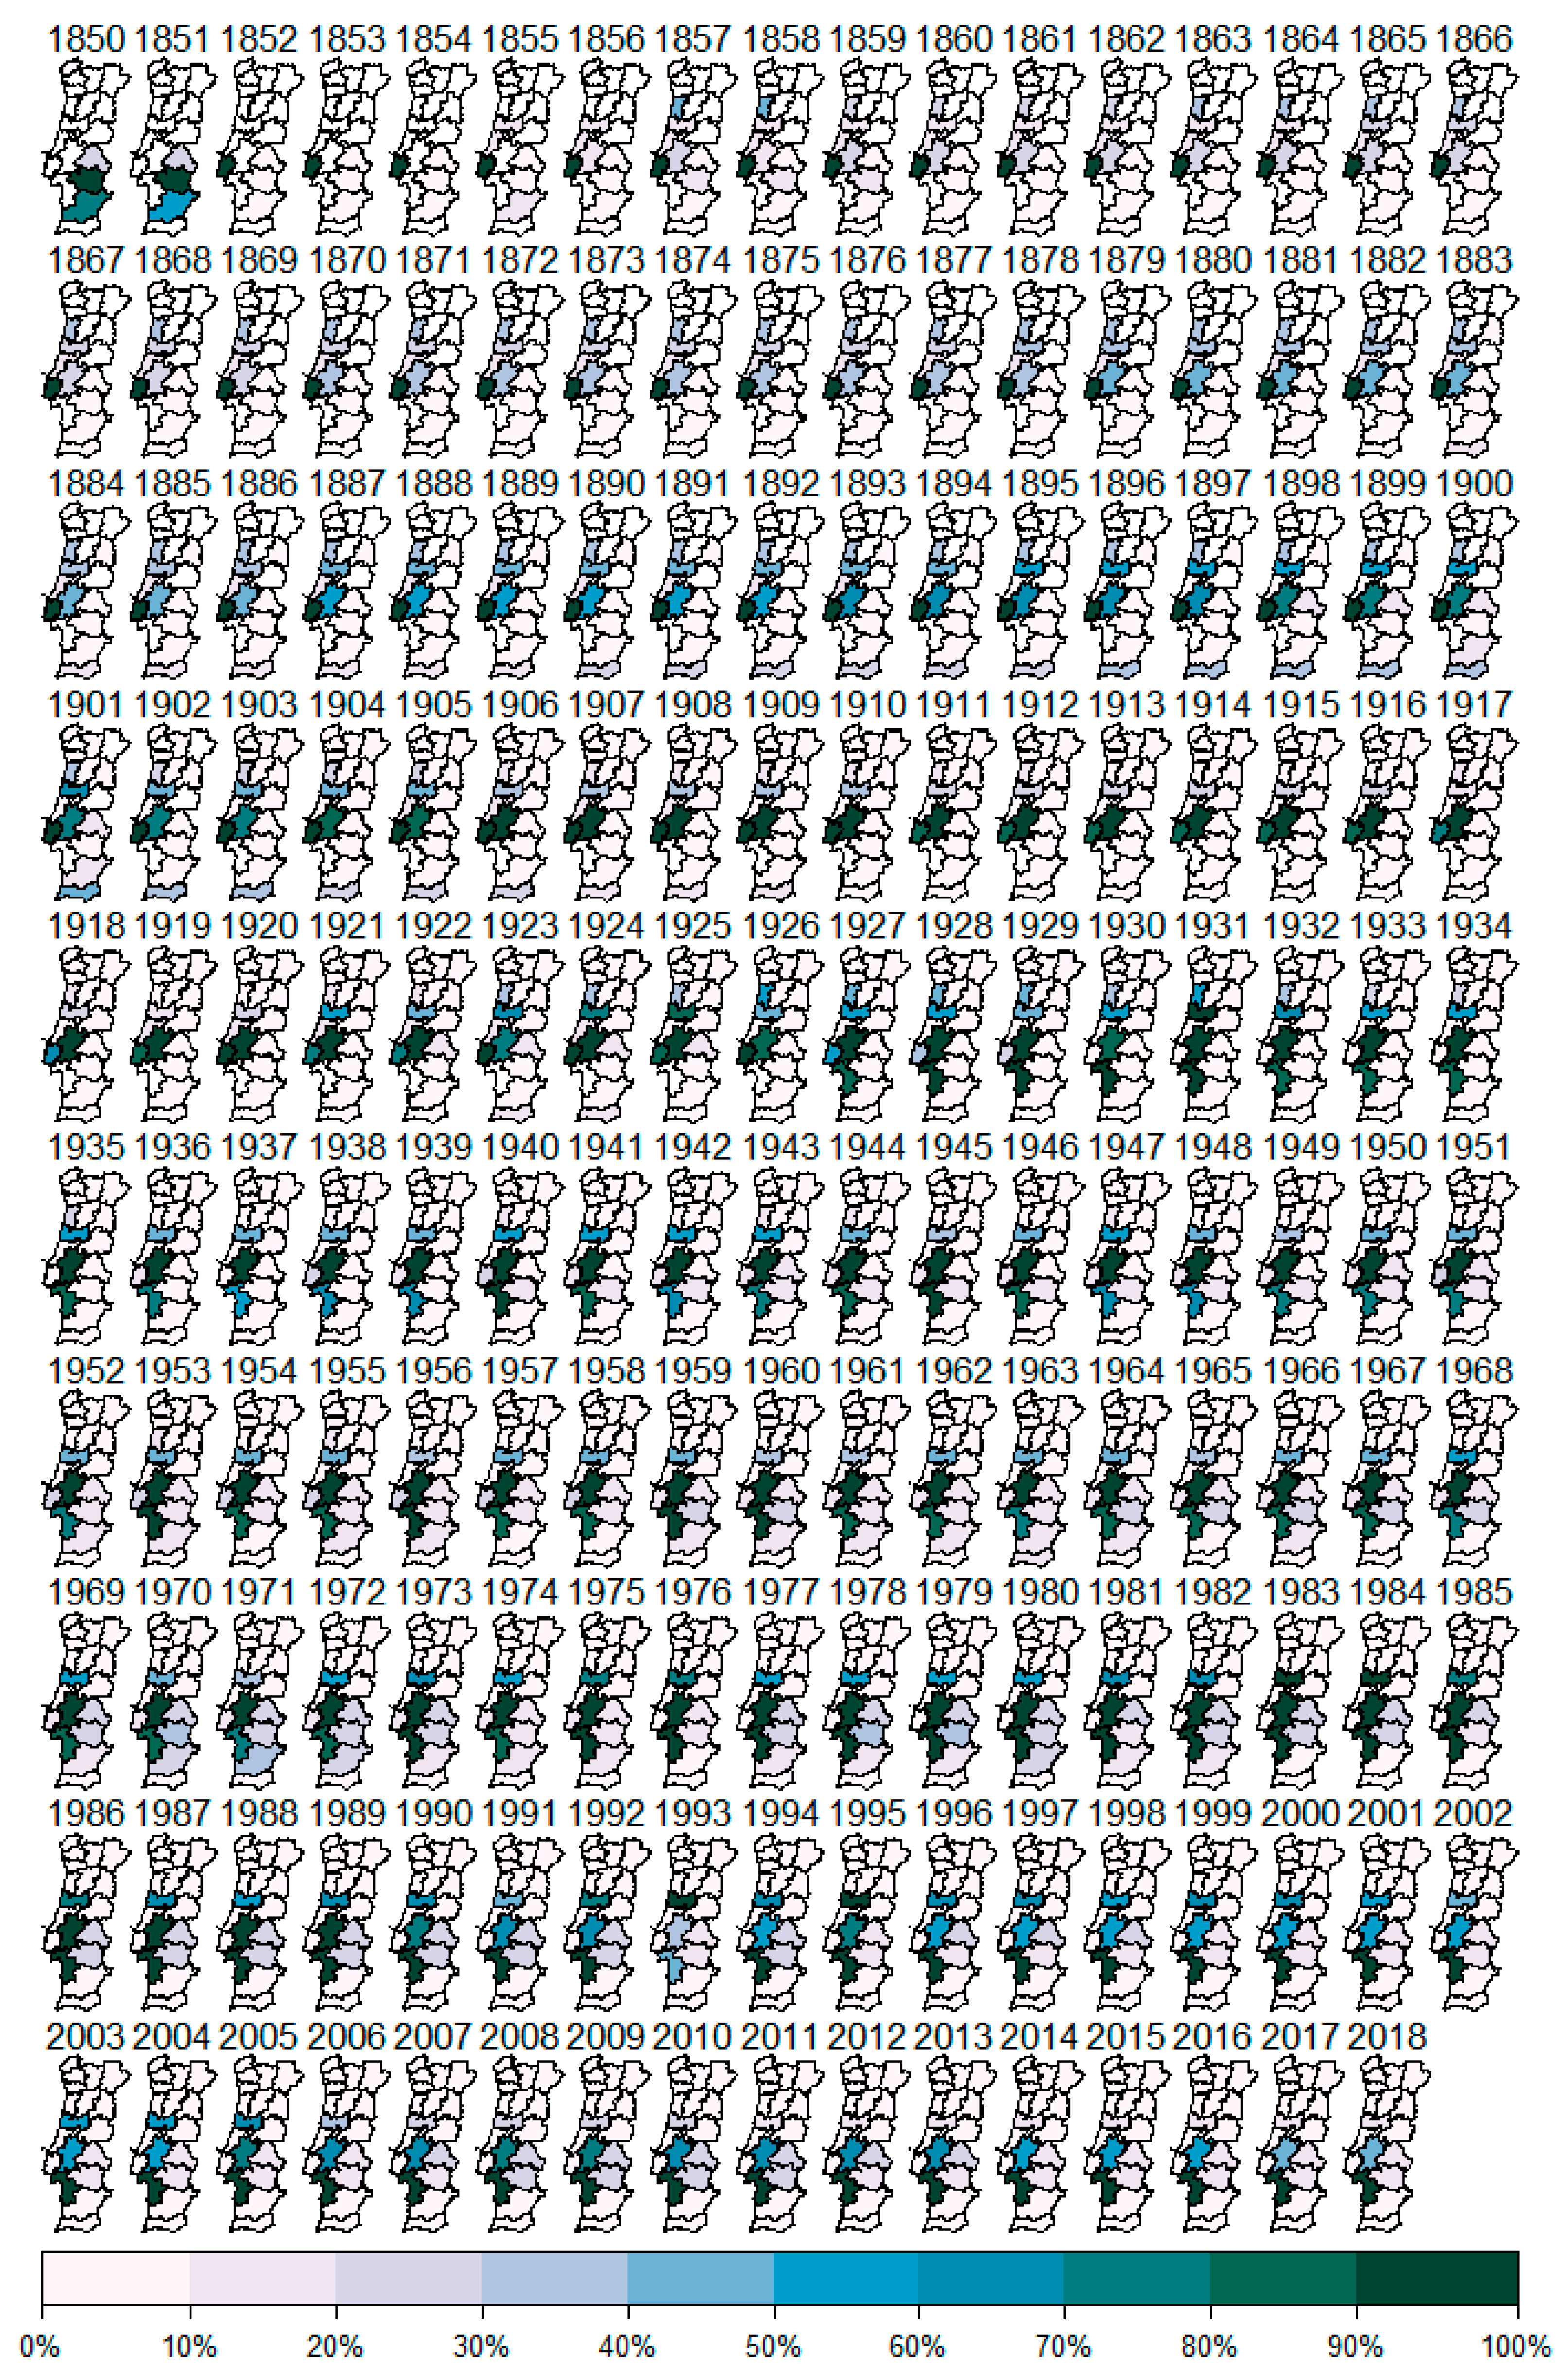
In the second half of the 19th century, the main rice-producing regions were the districts of Beja, Évora, and Portalegre (Figure 9). However, the rice production distribution rapidly changed, turning the emphasis to different regions, such as the districts of Lisbon, Santarém, and Aveiro. The main production regions of this cereal shifted to the coastal area north of Lisbon District up to the area of Aveiro District (Vagos), passing through the Coimbra and Mondego valleys. This distribution continued until the beginning of the 20th century. In addition, in the 1970s, rice reached its maximum expansion in the Portuguese territory, reaching Alentejo. Recent decades highlight the importance of Setúbal and Santarém regions.
3.3. Spatiotemporal Pattern and Trends Analysis
The three cereals exhibited distinct production evolution trends (Figure 10). In the case of wheat production patterns, two main regions can be identified: the north center and the south of Portugal. The first is a cold area that includes the central (Lisboa, Santarém, Leiria, Coimbra, and Castelo Branco) and northern regions (Viana do Castelo, Braga, Porto, Aveiro, Viseu, Guarda, Vila Real, and Bragança). Most of these districts’ production was statistically significant cold spots for 90% of the time-step periods, including the final time step. The sporadic cold spot districts indicated an on-again off-again production trend, as <90% of the time-step periods consisted of statistically significant cold spots, and none was considered a hot spot of statistical significance. Coimbra is of particular interest because it is the only district that presented a persistent production trend among cold spots, which indicates that this region has no discernible production trend, showing a rise or fall in the magnitude of the clustering of counts over time. The oscillating pattern of Lisboa and Santarém shows that the production trend was significantly cold at the last time-step period, but was also a statistically significant hot spot during previous time steps. The second main region was the southern region (Setúbal, Évora, Beja, and Faro). These district productions exhibited continuous hot spot bins with statistical values in the last time-step periods. Finally, no pattern was observed for the Portalegre District.
The results of the maize production trend presented distinct patterns in the north of Portugal. On the northern coastline, the production of three districts (Viana do Castelo, Braga, and Porto) in the most recent time period was not hot; however, in at least 90% of the time-step periods, there have been important hot spots. Guarda was considerably cold during the last time-step period but was considered a hot spot of statistical significance in previous time steps. In contrast, Vila Real and Bragança presented cold spot patterns. In the first case, a new cold spot was statistically significant in the most recent period; however, no statistically significant cold spot occurred before then. In the second case, this district was an important cold spot for 90% of the time-step periods, considering also the final one.
In contrast, the production trend of Aveiro increased overall, and this increase was statistically significant for 90% of the time-step periods, considering also the last one. We observed two different production hotspots in the central and southern parts of Portugal. One is the Leiria District, which exhibited continuous hot spot bins with statistical significance in the last time-step periods. The second is marked by an oscillating hot spot, which indicates that, although these districts (Lisboa, Santarém, Portalegre, Setúbal, and Évora) were not hot production spots in the most recent period, they were important hot spots for at least 90% of the time-step periods. In contrast, for half of the central region (Viseu, Coimbra, and Castelo Branco), no pattern was observed. Finally, in the most recent period, the southern region of Portugal (Faro and Beja) exhibited no cold spots; however, at least 90% of the time-step periods were statistically significant cold production spots.
The trend pattern for rice production allows us to divide Portugal into four main regions: two hot spots and two cold spots. The first is the north (Viana do Castelo, Braga, Porto, Vila Real, Bragança, and Guarda), which presents a consistent production pattern as a statistically significant cold spot for 90% of the time-step periods, considering also the final one. The second is half of the central and southern regions (Castelo Branco, Santarém, Leiria, Setúbal, Évora, and Portalegre). Similar to the maize pattern of production regions, these districts in the most recent period were not hot; however, they were statistically significant hot spots in at least 90% of the time-step periods. The Lisbon District is distinguished for having continuous hot spot bins with statistical significance in the last time-step periods. Finally, Beja and Faro presented a sporadic pattern, which means that these districts were on-again off-again cold production spots, with <90% of the time-step periods being statistically significant cold spots, with no statistically significant hot spots in previous time-step periods.
4. Discussion
4.1. Visualisation, Description, and Interpretation of the Regional Productions
Historically, the Portuguese agricultural sector has had different regional specializations because of the considerable diversity of natural and economic–social conditions, which produced different reactions to the impacts of public policies, markets, and technological changes over time [6,34]. In this study, notably, for decades maize and wheat production alternated, depending on agricultural years and political aspects such as the Wheat Campaign (an initiative launched during 1929–1938 in order to achieve productive self-sufficiency) [6]. In fact, we were able to confirm that regional production was influenced by two types of public policies, with different incentives that impacted the rural areas and agricultural activities and affected cereals. One of the policy orientations was to stimulate the production of specific dryland (non-irrigated) crops. In the group of cereals, wheat benefited most.
Specifically, in Portugal, wheat production, typically in dryland, was introduced by the Romans (in the years before Christ). Therefore, wheat is one of the most important cereals in Portugal, and historically there was a goal to extend its production to all regions of the country. However, from an agroecological or economic perspective, this was not viable in some regions [35]. In particular, wheat production only increased in regions in which there was an intersection of public policies (the wheat campaign with the 1889 legislation, and the wheat policy that started in 1929 and ended in the 1960s) with agroecological and biophysical conditions, such as the Alentejo, Ribatejo, Lezíria do Tejo (most fertile lands in the country), and Lisbon regions [36].
Chronologically, wheat was mainly cultivated in the southern region of the country, more specifically in the Alentejo region, due to not only ecological and biophysical conditions, but also the parcel structures. It is a cereal that grows well in large parcels, exactly the type of field geometry of this region. However, Beja was the district that consistently produced more wheat, mainly explained by the type of soil existing in this district, ‘Barros de Beja’ (Beja clays), which is clayey soil rich in humus and very fertile, and so particularly suitable for wheat production. In the minifundium districts in the northern part of the country, wheat production has only been marginally altered, and in contrast, Évora, Beja, Portalegre, and Santarém districts of great exploitation (latifundium) saw their production substantially increase [37].
Historically, the Lisbon district heavily lost wheat production due to the urban development of the city that took the land used to produce this cereal. In addition, wheat production in the Ribatejo and Lezíria do Tejo regions had several oscillations over the 169-year period, with a strong decreasing trend after 1936, mainly because in the late 19th century these agricultural fields began to be exploited for other production such as wine [36]. In this period, wine competed greatly for the same resources as wheat. The reason why the spreading of vineyards and other crops did not occur in the great region of Alentejo was only because of public policies that gave special attention to the protection of wheat in this region until the 20th century [37]. In summary, when the campaign finished, due to the poor monetary credit conditions and the manner in which the land was being exploited (e.g., left alone, tenancy agreement, trading partnership), large wheat production imbalances occurred, and only in the 1990s did they increase due to the exceptional weather conditions.
The other set of public policies that supported crops enabled irrigation production through the development of infrastructure. However, at first, this set of public policies positively impacted the production of rice, as the first interventions in irrigated land were initially implemented in regions where rice was already produced. Therefore, in the 1970s, rice reached its maximum expansion in the Portuguese territory, reaching the Alentejo region, due to the public work interventions in this region. Recent decades have highlighted the importance of the Setúbal and Santarém regions, which considerably benefited from public investment in irrigation infrastructures. Overall, mainly because of the manner in which it was collected by the public agencies, the evolution of rice production has not been thoroughly documented from the perspective of historical knowledge, which opens a set of questions that forces us to seek a more in-depth analysis of this cereal.
In the second stage, since the 1960s, public policies have benefited dryland regions that were liable to be converted to irrigated land through water dam construction [36]. Therefore, the abrupt change in maize production in the Ribatejo zone (Santarém District) started when the protection measures regarding wheat stopped, and the focus turned to the irrigation of crop production, which benefited from the developed irrigation infrastructures in the previous years. Since the second half of the 1970s, maize production predominantly increased due to the construction of irrigation systems by the state. It is interesting to see that this cereal, which was only introduced in the 16th century after the first Cristóvão Colombo trip (in 1492), has always had more importance in the agriculture context than wheat.
Historically, maize has been a recent cereal in the Iberian Peninsula, and it progressed from 1905 due to the biophysical conditions that the Portuguese territory offered. This cereal expanded from northwest to south along the coastal regions of small agricultural parcels, particularly since at least the second half of the 19th century until the 1930s [9]. In fact, maize production was lower than wheat only in some years of the 1930s, 1950s, and 1970s, when there was a combination of strong political wheat protectionism with ‘good’ agricultural years.
Chronologically, the distributions of wheat and maize in Portugal since at least the mid-19th century were evidently regional. Maize was confined to the northern regions of Portugal, which are more humid and have higher availability of water, whereas wheat was grown mainly in Alentejo [35]. Notably, the regions historically associated with maize production ceased to be so, mainly due to irrigation policy incentives. In fact, our results provide some clues to solve questions that have not yet been clarified, stimulating geographical and historical cross-knowledge and providing a national overview and a regional prospect that was lacking.
Finally, the space–time pattern trend analysis enabled the interpretation of complex trends that occurred over 169 years. The changes over time presented a pattern that, in the case of these three cereals, enabled the clear division of the country into its main regions according to cereal production. The identification of hot and cold spots helped to determine which regions are facing increasing or decreasing threats to agricultural production. Maize and rice, both irrigated croplands, presented a similar pattern in some regions of Portugal, mainly the central region. The differences we observed between both crops were mainly related to the agroecological conditions. The wheat production trend presented a completely different pattern when compared to the other two cereals, mainly because this cereal is a dryland crop. Thus, considering the size of the statistical series, we suggest it would be important to select different parameters in the future that can also provide good results and explain different trends present in the data [38].
4.2. Data Homogenisation
Currently, in terms of quantitative information on agriculture production for the period prior to 1916, there was a major advance when the interdisciplinary research team of the “Agriculture in Portugal…” project collected many of the scattered data stored in the central and regional Portuguese public archives. These data, together with the data published by INE, gave 140 years (1850–1989) of agriculture production information at the district level. While at this stage we already had absolute production values from 1850 to 2018 at the national level, we continued to struggle to obtain a clear understanding of the individual dynamics and oscillations of regional agriculture production over the last 30 years. Accordingly, in this study, we used a GIS-based spatial analytical approach to homogenize the Portuguese agricultural statistical data, with the purpose of creating a long spatial time-series with annual and regional agricultural production during 1850–2018.
Although the use of the area-weighting GIS-based technique to homogenize the different system data units has long been recognized in the literature [10,22,39,40,41], errors may exist in our proposed methodology. Thus, a major limitation of this study is that we could not attest the veracity of the interpolated production values. Nonetheless, quantifying the error using real-world data is typically challenging, particularly with regard to historical data [26,29]. In the future, an alternative solution should be developed to evaluate the interpolation error of the proposed methodology in order to attest the data accuracy (e.g., the approaches of [42,43]). Ultimately, the developed methodology avoids time-consuming and/or computationally intensive complex GIS-based methods, and can be tested for agricultural statistics data from other countries or other statistical data with administrative unit variations, such as demographic census data [22].
4.3. Data Inconsistencies
The long spatial time-series presented two inconsistencies. One is regarding rice production data, as there were some value gaps in the first years for the period under study, specifically from 1850 to 1900 for 7 of the 18 districts (Braga, Bragança, Castelo Branco, Guarda, Porto, Vila Real, and Viseu). Nevertheless, we decided to use the rice production data because, although these districts only had available data starting around the 1900s, the production values of the following years were zero. Hence, we assumed that the gap in data would not affect the findings.
The second limitation of our statistical data are the production values of Lisbon and Setúbal districts. Until 1927, Setúbal District was an administrative part of the Lisbon District, that is, both districts were a single administrative unit, which means the values of Lisbon from 1850 to 1926 are a sum of the Lisbon and Setúbal productions. This event is, however, explained by the way data were collected until 1927. Thus, the description and interpretation of the production values of Lisbon and Setúbal districts until 1926 should be made with caution, specifically for rice production, as the Setúbal District emerged as the main producer of this cereal, particularly after 1927, whereas Lisbon ceased to be an important producer, a conclusion that was hidden in the maps until 1927. It is particularly important for future studies to disaggregate the production values of Lisbon from 1850 to 1926 into two administrative units to allow a more thorough analysis.
5. Conclusions
This study advances understanding and analysis of past and current regional agricultural production patterns and trends in Portugal of three cereal crops (wheat, maize and rice). Although we acknowledge that there may be some precautions taken regarding the use of these data due to the limitations associated with the absence of the possible error identification caused by our proposed methodology and how some partial data were collected, this was a qualitative advance for Portuguese modern economical historiography. The analysis of Portuguese agriculture now has a new contemporary quantitative dimension, allowing comprehensive space–time cross-reading of the general characteristics of the regional distribution of agricultural production for a 169-year period. Additionally, we can now consolidate important historic information on Portuguese agriculture with how it has developed to date, articulating spatial and temporal aspects of certain events and historical conjunctures in the Portuguese agriculture field.
In this study, a preliminary analysis was presented and related to successive public policies; however, notably, there are more lessons to be learned from this long spatial time-series. Furthermore, we have the opportunity to expand the discussion relating to European and global trends by including the Portuguese case in academic discussions, and further contribute to the integration of long spatial time-series in scientific analysis that can strengthen the ability to assess past and current regional food production situations, essential for a country’s food security evaluation. One major benefit of having such data is the possibility of conducting an in-depth analysis of the past to truly understand the present [10] and forecast probable future events [11]. A direction for future work would be to combine these statistical data with long-term meteorological data (e.g., ECWMF or GLDAS), as climate change is known to directly affect the variation of crop cultivation. Furthermore, the proposed methodological approach is a direct solution that further contributes to the integration of long spatial time-series in scientific analysis to evaluate past and current changes.
Author Contributions
Conceptualization, C.M.V., D.F., P.A. and J.R.; Data curation, C.M.V.; Formal analysis, C.M.V.; Investigation, C.M.V.; Methodology, C.M.V.; Software, C.M.V. and J.R.; Supervision, D.F., P.A. and J.R.; Validation, C.M.V.; Visualization, C.M.V.; Writing—original draft, C.M.V.; Writing—review & editing, C.M.V. All authors have read and agreed to the published version of the manuscript.
Funding
This work was supported by the Portuguese Foundation for Science and Technology (FCT) under Grant [number SFRH/BD/115497/2016]; Centre for Geographical Studies—Universidade de Lisboa and FCT under Grant [number UIDB/00295/2020 + UIDP/00295/2020].
Acknowledgments
We acknowledge the “Portuguese Agriculture: food, development and sustainability (1870–2010) [FCT-PTDC/HIS-HIS/122589/2010]” project research team, and the GEOMODLAB-Laboratory for Remote Sensing, Geographical Analysis and Modelling—of the Center of Geographical Studies/IGOT for providing the required equipment and software. We would also like to thank to the editor and the four anonymous reviewers that contributed to the improvement of this paper.
Conflicts of Interest
The authors declare no conflict of interest.
References
- Mitchell, B.R. International Historical Statistics; Palgrave Macmillan: London, UK, 1998. [Google Scholar]
- Mitchell, B.R. British Historical Statistics; Cambridge University Press: Cambridge, MA, USA, 2011; ISBN 9781107402447. [Google Scholar]
- Westlund, H.; Nilsson, P. Agriculture’s transformation and land-use change in a post-urban world: A case study of the Stockholm region. J. Rural Stud. 2019. [Google Scholar] [CrossRef]
- Calleja, E.J.; Ilbery, B.; Mills, P.R. Agricultural change and the rise of the British strawberry industry, 1920–2009. J. Rural Stud. 2012, 28, 603–611. [Google Scholar] [CrossRef]
- Eurostat. Regional Yearbook: 2020 Edition; Publications Office of the European Union: Luxembourg, 2020; ISBN 978-92-76-20729-0. [Google Scholar]
- Freire, D.; Lains, P. An Agrarian History of Portugal, 1000–2000: Economic Development on the European Frontier; Freire, D., Lains, P., Eds.; Brill: Leiden, The Netherlands, 2017. [Google Scholar]
- Justino, D. A Formação do Espaço Económico Nacional. Portugal: 1810–1913; Vega: Lisboa, Portugal, 1988; Volume 2. [Google Scholar]
- Lains, P.; Silveira E Sousa, P. Estatística e Produção Agrícola em Portugal, 1848–1914***. Análise Soc. 1998, XXXIII, 935–968. [Google Scholar]
- Pereira, M.H. Livre-Câmbio e Desenvolvimento Económico; Sá da Costa: Lisboa, Portugal, 1983. [Google Scholar]
- Gregory, I.; Ell, P. Breaking the boundaries: Geographical approaches to integrating 200 years of the census. J. R. Stat. Soc. Ser. A Stat. Soc. 2005, 168, 419–437. [Google Scholar] [CrossRef]
- Murrieta-Flores, P.; Martins, B. The geospatial humanities: Past, present and future. Int. J. Geogr. Inf. Sci. 2019, 33, 2424–2429. [Google Scholar] [CrossRef] [Green Version]
- Boivin, N.; Crowther, A. Mobilizing the past to shape a better Anthropocene. Nat. Ecol. Evol. 2021, 5, 273–284. [Google Scholar] [CrossRef]
- Gregory, I.; Dorling, D.; Southall, H. A century of inequality in England and Wales using standardized geographical units. Area 2001, 33, 297–311. [Google Scholar] [CrossRef]
- Ribeiro, O.; Lautensach, H.; Daveau, S. Geografia de Portugal; Sá da Costa: Lisboa, Portugal, 1988; ISBN 9789729230158. [Google Scholar]
- Lains, P. Os Progressos do Atraso: Uma Nova História Económica de Portugal, 1842–1992; Instituto Ciencias Sociais da Universidade de Lisboa: Lisboa, Portugal, 2003; ISBN 9789726711094. [Google Scholar]
- Van Zanden, J.L.; van Leeuwen, B. Persistent but not consistent: The growth of national income in Holland 1347–1807. Explor. Econ. Hist. 2012, 49, 119–130. [Google Scholar] [CrossRef]
- Thomas, R.W. Modelling in Geography: A Mathematical Approach; Harper & Row: Manhattan, NY, USA, 1980; ISBN 9780063180604. [Google Scholar]
- Comber, A.; Zeng, W. Spatial interpolation using areal features: A review of methods and opportunities using new forms of data with coded illustrations. Geogr. Compass 2019, 13, 1–23. [Google Scholar] [CrossRef] [Green Version]
- Penghui, J.; Dengshuai, C.; Manchun, L. Farmland landscape fragmentation evolution and its driving mechanism from rural to urban: A case study of Changzhou City. J. Rural Stud. 2021, 82, 1–18. [Google Scholar] [CrossRef]
- Gale, H.F. Age cohort analysis of the 20th century decline in U.S. farm numbers. J. Rural Stud. 1996, 12, 15–25. [Google Scholar] [CrossRef]
- Langford, M.; Maguire, D.; Unwin, D.J. The areal interpolation problem: Estimating population using remote sensing in a GIS framework. In Handling Geographical Information: Methodology and Potential Applications; Masser, I., Blakemore, B., Eds.; Longman Scientific & Technical: Essex, UK, 1991; pp. 55–77. [Google Scholar]
- Gregory, I. The accuracy of areal interpolation techniques: Standardising 19th and 20th century census data to allow long-term comparisons. Comput. Environ. Urban Syst. 2002, 26, 293–314. [Google Scholar] [CrossRef]
- Goodchild, M.F.; Lam, N. Areal Interpolation: A Variant of the Traditional Spatial Problem. Geo-Processing 1980, 1, 297–312. [Google Scholar]
- Fisher, P.F.; Langford, M. Modelling the Errors in Areal Interpolation between Zonal Systems by Monte Carlo Simulation. Environ. Plan. A Econ. Space 1995, 27, 211–224. [Google Scholar] [CrossRef]
- Langford, M. Obtaining population estimates in non-census reporting zones: An evaluation of the 3-class dasymetric method. Comput. Environ. Urban Syst. 2006, 30, 161–180. [Google Scholar] [CrossRef]
- Hallisey, E.; Tai, E.; Berens, A.; Wilt, G.; Peipins, L.; Lewis, B.; Graham, S.; Flanagan, B.; Lunsford, N.B. Transforming geographic scale: A comparison of combined population and areal weighting to other interpolation methods. Int. J. Health Geogr. 2017, 16, 29. [Google Scholar] [CrossRef] [PubMed] [Green Version]
- Gregory, I.; Southall, H. The Great Britain Historical GIS. Hist. Geogr. 2005, 33, 132–134. [Google Scholar]
- Schroeder, J.P. Target-Density Weighting Interpolation and Uncertainty Evaluation for Temporal Analysis of Census Data. Geogr. Anal. 2007, 39, 311–335. [Google Scholar] [CrossRef]
- Gregory, I.; Ell, P. Error-sensitive historical GIS: Identifying areal interpolation errors in time-series data. Int. J. Geogr. Inf. Sci. 2006, 20, 135–152. [Google Scholar] [CrossRef]
- Han, J.; Kamber, M.; Pei, J. Data Mining: Concepts and Techniques; Elsevier Inc.: Amsterdam, The Netherlands, 2012; ISBN 9780123814791. [Google Scholar]
- Yue, S.; Pilon, P.; Cavadias, G. Power of the Mann-Kendall and Spearman’s rho tests for detecting monotonic trends in hydrological series. J. Hydrol. 2002, 259, 254–271. [Google Scholar] [CrossRef]
- Getis, A.; Ord, J.K. The Analysis of Spatial Association by Use of Distance Statistics. Geogr. Anal. 2010, 24, 189–206. [Google Scholar] [CrossRef]
- Khaliq, M.N.; Ouarda, T.B.M.J.; Gachon, P.; Sushama, L.; St-Hilaire, A. Identification of hydrological trends in the presence of serial and cross correlations: A review of selected methods and their application to annual flow regimes of Canadian rivers. J. Hydrol. 2009, 368, 117–130. [Google Scholar] [CrossRef]
- Avillez, F. A Agricultura Portuguesa; Fundação Francisco Manuel dos Santos: Lisbon, Portugal, 2015; ISBN 9789898819000. [Google Scholar]
- Pais, J.M.; De Lima, A.M.V.; Baptista, J.F.; de Jesus, M.F.M.; Gameiro, M.M. Elementos para a história do fascismo nos campos: A «Campanha do Trigo»: 1928-38 (I). Análise Soc. 1976, 12, 401–473. [Google Scholar]
- Rosas, F. Rafael Duque e a política agrária do Estado Novo (1934–1944). Análise Soc. 1991, 26, 771–790. [Google Scholar]
- Jones, N.; de Graaff, J.; Rodrigo, I.; Duarte, F. Historical review of land use changes in Portugal (before and after EU integration in 1986) and their implications for land degradation and conservation, with a focus on Centro and Alentejo regions. Appl. Geogr. 2011, 31, 1036–1048. [Google Scholar] [CrossRef]
- Harris, N.L.; Goldman, E.; Gabris, C.; Nordling, J.; Minnemeyer, S.; Ansari, S.; Lippmann, M.; Bennett, L.; Raad, M.; Hansen, M.; et al. Using spatial statistics to identify emerging hot spots of forest loss. Environ. Res. Lett. 2017, 12, 024012. [Google Scholar] [CrossRef]
- Murakami, D.; Tsutsumi, M. A New Areal Interpolation Method Based on Spatial Statistics. Procedia Soc. Behav. Sci. 2011, 21, 230–239. [Google Scholar] [CrossRef] [Green Version]
- Kounadi, O.; Ristea, A.; Leitner, M.; Langford, C. Population at risk: Using areal interpolation and Twitter messages to create population models for burglaries and robberies. Cartogr. Geogr. Inf. Sci. 2018, 45, 205–220. [Google Scholar] [CrossRef]
- Huyen Do, V.; Thomas-Agnan, C.; Vanhems, A. Spatial reallocation of areal data—Another look at basic methods. Rev. d’Économie Rég Urbaine 2015, 1–2, 27–58. [Google Scholar] [CrossRef]
- Geddes, A.; Elston, D.A.; Hodgson, M.E.A.; Birnie, R.V. Stochastic model-based methods for handling uncertainty in areal interpolation. Int. J. Geogr. Inf. Sci. 2013, 27, 785–803. [Google Scholar] [CrossRef]
- Thevenin, T.; Mimeur, C.; Schwartz, R.; Sapet, L. Measuring one century of railway accessibility and population change in France. A historical GIS approach. J. Transp. Geogr. 2016, 56, 62–76. [Google Scholar] [CrossRef]
Figure 1.
The study area (Portuguese districts).

Figure 2.
Differences between each administrative level (district vs. agrarian regions and district vs. NUTS II).
Figure 2.
Differences between each administrative level (district vs. agrarian regions and district vs. NUTS II).

Figure 3.
Flowchart of the statistical data homogenization methodology.

Figure 4.
Conceptual diagram of wheat production values interpolation (1990) from the AR “Entre Douro e Minho” to the district level.
Figure 4.
Conceptual diagram of wheat production values interpolation (1990) from the AR “Entre Douro e Minho” to the district level.

Figure 5.
Conceptual diagram of wheat production values interpolation (2006) from NUTS II “Norte” to the district level.
Figure 5.
Conceptual diagram of wheat production values interpolation (2006) from NUTS II “Norte” to the district level.

Figure 6.
Wheat, maize, and rice national production during 1850–2018.

Figure 7.
Spatiotemporal pattern of wheat production (1850–2018).

Figure 8.
Spatiotemporal pattern of maize production (1850–2018).

Figure 9.
Spatiotemporal pattern of rice production (1850–2018).

Figure 10.
Wheat (A), maize (B), and rice (C) production trend patterns.

Publisher’s Note: MDPI stays neutral with regard to jurisdictional claims in published maps and institutional affiliations. |
© 2021 by the authors. Licensee MDPI, Basel, Switzerland. This article is an open access article distributed under the terms and conditions of the Creative Commons Attribution (CC BY) license (https://creativecommons.org/licenses/by/4.0/).
Share and Cite
MDPI and ACS Style
Viana, C.M.; Freire, D.; Abrantes, P.; Rocha, J. Evolution of Agricultural Production in Portugal during 1850–2018: A Geographical and Historical Perspective. Land 2021, 10, 776. https://0-doi-org.brum.beds.ac.uk/10.3390/land10080776
AMA Style
Viana CM, Freire D, Abrantes P, Rocha J. Evolution of Agricultural Production in Portugal during 1850–2018: A Geographical and Historical Perspective. Land. 2021; 10(8):776. https://0-doi-org.brum.beds.ac.uk/10.3390/land10080776
Chicago/Turabian StyleViana, Cláudia M., Dulce Freire, Patrícia Abrantes, and Jorge Rocha. 2021. "Evolution of Agricultural Production in Portugal during 1850–2018: A Geographical and Historical Perspective" Land 10, no. 8: 776. https://0-doi-org.brum.beds.ac.uk/10.3390/land10080776
Note that from the first issue of 2016, this journal uses article numbers instead of page numbers. See further details here.