Article

Observed Methane Uptake and Emissions at the Ecosystem Scale and Environmental Controls in a Subtropical Forest

1
Center for Ecological Forecasting and Global Change, College of Forestry, Northwest A&F University, Yangling 712100, China
2
Faculty of Architecture and Urban Planning, Chongqing University, Chongqing 400045, China
3
State Key Laboratory of Subtropical Silviculture, Zhejiang A&F University, Hangzhou 311300, China
4
International Institute for Earth System Science, Nanjing University, Nanjing 210023, China
5
Department of Biology Sciences, Institute of Environment Sciences, University of Quebec at Montreal, Montreal, QC H3C 3P8, Canada
*
Author to whom correspondence should be addressed.
Submission received: 28 July 2021 / Revised: 2 September 2021 / Accepted: 10 September 2021 / Published: 16 September 2021
(This article belongs to the Special Issue Feature Papers for Land–Climate Interactions Section)

Abstract

:
Methane (CH4) is one of the three most important greenhouse gases. To date, observations of ecosystem-scale methane (CH4) fluxes in forests are currently lacking in the global CH4 budget. The environmental factors controlling CH4 flux dynamics remain poorly understood at the ecosystem scale. In this study, we used a state-of-the-art eddy covariance technique to continuously measure the CH4 flux from 2016 to 2018 in a subtropical forest of Zhejiang Province in China, quantify the annual CH4 budget and investigate its control factors. We found that the total annual CH4 budget was 1.15 ± 0.28~4.79 ± 0.49 g CH4 m−2 year−1 for 2017–2018. The daily CH4 flux reached an emission peak of 0.145 g m−2 d−1 during winter and an uptake peak of −0.142 g m−2 d−1 in summer. During the whole study period, the studied forest region acted as a CH4 source (78.65%) during winter and a sink (21.35%) in summer. Soil temperature had a negative relationship (p < 0.01; R2 = 0.344) with CH4 flux but had a positive relationship with soil moisture (p < 0.01; R2 = 0.348). Our results showed that soil temperature and moisture were the most important factors controlling the ecosystem-scale CH4 flux dynamics of subtropical forests in the Tianmu Mountain Nature Reserve in Zhejiang Province, China. Subtropical forest ecosystems in China acted as a net source of methane emissions from 2016 to 2018, providing positive feedback to global climate warming.

1. Introduction

Methane (CH4) is an important greenhouse gas and accounts for approximately 32% of the global radiative forcing. It has 28–32 times higher global warming potential over a 100-year time horizon than does carbon dioxide (CO2) [1,2]. The atmospheric CH4 concentration has been increasing and has more than doubled since preindustrial times, showing a rapid increase until 1999, after which it remained nearly constant until 2006. From 2007, the atmospheric CH4 concentration again began increasing, likely due to a combination of anomalously high temperatures in the Arctic region and more precipitation in tropical regions [3]. Although major CH4 sources (e.g., wetlands, rice paddies, biomass burning, and fossil fuels) have been identified [4], we still lack a complete understanding of ecosystem-specific information on CH4 sinks and sources that could be significant factors contributing to global variations in CH4 sinks and sources [2,5,6].
Upland forest soils are the main biological CH4 sink [6,7]; however, forests may produce and emit CH4, especially in wet, warm climates [8], and forest soil CH4 uptake may decline with increases in precipitation [9]. Subtropical forests, as an important part of forest ecosystems, are rich in tree species, characterized by complex stand structures and various environmental conditions [10,11,12], and they play an important role in the global greenhouse gas budget [2,5,11]. To date, investigations on the dynamics of CH4 fluxes in subtropical upland forests and their controlling factors at the ecosystem scale are still lacking [13]. Therefore, it is important to understand CH4 sinks and sources in subtropical forest ecosystems and CH4 exchange between the atmosphere and forests.
Many studies have identified mechanisms controlling methane emissions and uptake, including the water table [13,14,15,16], soil temperature [13,17], soil redox potential [8], atmospheric pressure [8,13], water vapor deficiency [17], ecosystem respiration [15,18], photosynthesis [19,20], ecosystem disturbances [13] and management practices [13]. In fact, soil temperature [21,22,23,24] and soil water content [22,23,24,25,26] appear to be the primary factors controlling CH4 emissions. Methane production, which is a microbial-mediated reaction, can be accelerated by higher temperatures. High temperatures increase not only CH4 production by increasing the metabolic activities of microorganisms and plants [27,28] but also conductance for methane diffusion and plant-mediated transport [29], which enhances release processes and can lead to higher methane emissions. In addition, methanotrophs in the soil can consume CH4 by microbial oxidation [30]. Although temperature has an effect on both methanogens and methanotrophs, methanogenesis seems to be more sensitive than methanotrophy to soil temperature [31]. Water content has been one of the most important drivers of CH4 flux, as it can regulate the oxygen availability and the relative thickness of the aerobic and anaerobic zones for CH4 oxidation and production, respectively [32]. In both temperate mixed forest ecoregions and alpine meadow and forest ecoregions, it was found that secondary forests had relatively lower CH4 uptake than did natural forests in the corresponding area due to the lower soil water content in natural forests [33,34,35]. To date, we still lack ecosystem-scale in-depth studies about the influence mechanism of temperature and soil water content on CH4 sinks and sources in subtropical forests.
Many previous investigations and analyses on upland forest soil CH4 were based on the results of experiments carried out using the manual static chamber method [13,36,37,38,39]. The focus on soil fluxes reflects the difficulty of enclosing whole trees in static chambers. However, the coverage area of the static chamber method is small (from cm−2 to m−2), and the measurement frequency of this method is very low. The eddy covariance (EC) technique, which is based on the micrometeorological method and continuously measures the vertical concentration gradients of gases, provides a cutting-edge method to continuously measure and quantify key ecosystem greenhouse gas fluxes (such as CO2 and CH4) with detailed information on short-term variations in flux at the ecosystem scale [13,40,41]. To date, the EC technique has been applied in the investigation of CH4 flux and the annual budget for a variety of different ecosystems, including wetlands [42,43,44], peatlands [45,46,47], rice paddies [48,49] and forests [38,50,51,52]. Although more than 200 EC sites have been established worldwide with CH4 flux measurements [51], there is no study that reports CH4 flux in subtropical forests in China using the EC method [13].
In this study, we conducted and observed three years of EC measurements of ecosystem-scale CH4 flux from a subtropical forest in Zhejiang Province, China. The main objectives of this study were to (1) investigate and analyze the diurnal and seasonal variations in the characteristics of CH4 fluxes; (2) quantify the annual budget of CH4 fluxes and the contribution of different seasonal CH4 fluxes to the annual budget; and (3) explore the controlling factors of subtropical forest CH4 emissions and uptake at the ecosystem scale.

2. Materials and Methods

2.1. Site Description

The studied subtropical forest was located in the Tianmu Mountain Nature Reserve, northwest of Lin’an District, Zhejiang Province, China (30°20′34.951″ N, 119°26′08.671″ E, Figure 1). This area has a subtropical monsoon climate, with an elevation of 1152 m. The annual mean temperature and the annual total precipitation were 11.9 °C and 1715 mm from 2016 to 2018, respectively. The region is covered by 140-year-old natural evergreen and deciduous broad-leaved forests. The dominant plants are Cyclobalanopsismyrsinifolia, Daphniphyllummacropodum and Pterostyraxcorymbosus. The canopy height, forest density and forest crown closure were 15–20 m, 3125 hm−2 and 0.7, respectively.

2.2. Eddy Covariance System

The eddy covariance (EC) technique was used to measure and quantify CH4 flux from 2016 to 2018. The EC system was installed in a relatively flat region. Sensors were mounted 38 m above the soil surface. Sensor height was determined to ensure that the EC system was mounted at least twice the height of the plant canopy (15–20 m) during the peak growing season. The EC system included an open-path CH4 infrared gas analyzer (LI-7700, LI-COR Biosciences, Lincoln, NE, USA), an open-path CO2/H2O infrared gas analyzer (LI-7500A, LI-COR) and a sonic anemometer (WindMaster, Gill instruments, Lymington, UK). All raw data were collected at a frequency of 10 Hz and stored by a data logger (LI-7550, LI-COR). Data between 27 February and 30 June in 2016 were missing due to a lack of electrical power supply.

2.3. Data Processing

The CH4 flux of 30-min block averages was calculated by EddyPro software (version 6.2.0, LI-COR Biosciences, Lincoln, NE, USA). We used several advanced settings during processing. The angle of attack corrections for Gill WindMaster Pro firmware were used [53] and the block average method was used for detrending raw data. The time lag detection method we used was covariance maximization with default. The double coordinate rotation method was used to ensure that the mean vertical wind speed was zero, averaged over 30 min. The compensation of density fluctuations (WPL terms) was implemented according to Webb et al. [54]. The steady state test and the well-developed turbulence test provided a quality flag (1~9) [55]. We applied spike detection of raw data after Vickers and Mahrt [56].
After data processing by EddyPro, we further filtered the dataset to ensure data quality. We discarded the data when rainfall occurred. CH4 flux was used only when the relative signal strength indicator (RSSI) was >20%. In addition, we filtered the CH4 flux using a threshold of u* > 0.3 m s−1 to ensure well-developed atmospheric mixing conditions [57]. According to the study of Foken et al. [55], the quality of fluxes was classified by the quality flags of “0”, “1” and “2”, which represent high-quality data, intermediate-quality fluxes and poor-quality fluxes, respectively. Data with quality flags of “2” were not used for further analysis. These quality criteria occasionally caused equipment failures, resulting in data intervals of different durations.
After the quality check, 31.8% of the raw data were left for analyses. We obtained the daily CH4 flux by averaging the quality-controlled half-hourly CH4 flux for each day. Because of quality control, the amount of data remaining varied greatly from day to day. For reliable daily averaged CH4 flux, only the days with more than 6 data points were used for analyses.
To estimate the budget of the CH4 flux, missing data needed to be interpolated. The random forest (RF) method was used to fill the gaps in the data. The RF algorithm introduced by Breiman [58] is an ensemble method of regression trees. Kim et al. [59] tested RF for eddy flux gap filling at several sites and found that it outperformed other techniques for all sites and all gap conditions. Thus, we used the RF exactly following Kim et al. [59]. The following variables were used as potential drivers of CH4 to train the RF: sensible heat flux (H), net ecosystem exchange (NEE), latent heat flux (LE), gross ecosystem product (GEP), soil temperature at 10 cm deep (Tsoil 10), air temperature (Ta), relative humidity (RH), pressure (P), vapor pressure deficit (VPD), Ustar, soil moisture at 10 cm deep (Msoil 10) and precipitation. The gap-filling performance of RF method in our study was also very good (R2 = 0.85). Then, the gap-filled flux was used for the calculation of the budget. The annual flux was the sum of the daily average flux of the year.
The uncertainties of the CH4 flux include the random uncertainty and uncertainty of gap-filling for the CH4 flux. The random uncertainty for each half-hourly CH4 flux was estimated through the empirical models described by Finkelstein and Sims [60]. The uncertainty of gap-filling for CH4 flux was also estimated following Kim et al. [59].
Meteorological and hydrological conditions were also measured by related sensors, including Ta (WUSH-TW100), RH (DHC2), precipitation (SL3-1), Tsoil 10 (ZQZ-TW) and Msoil 10 (DZN3).

3. Results

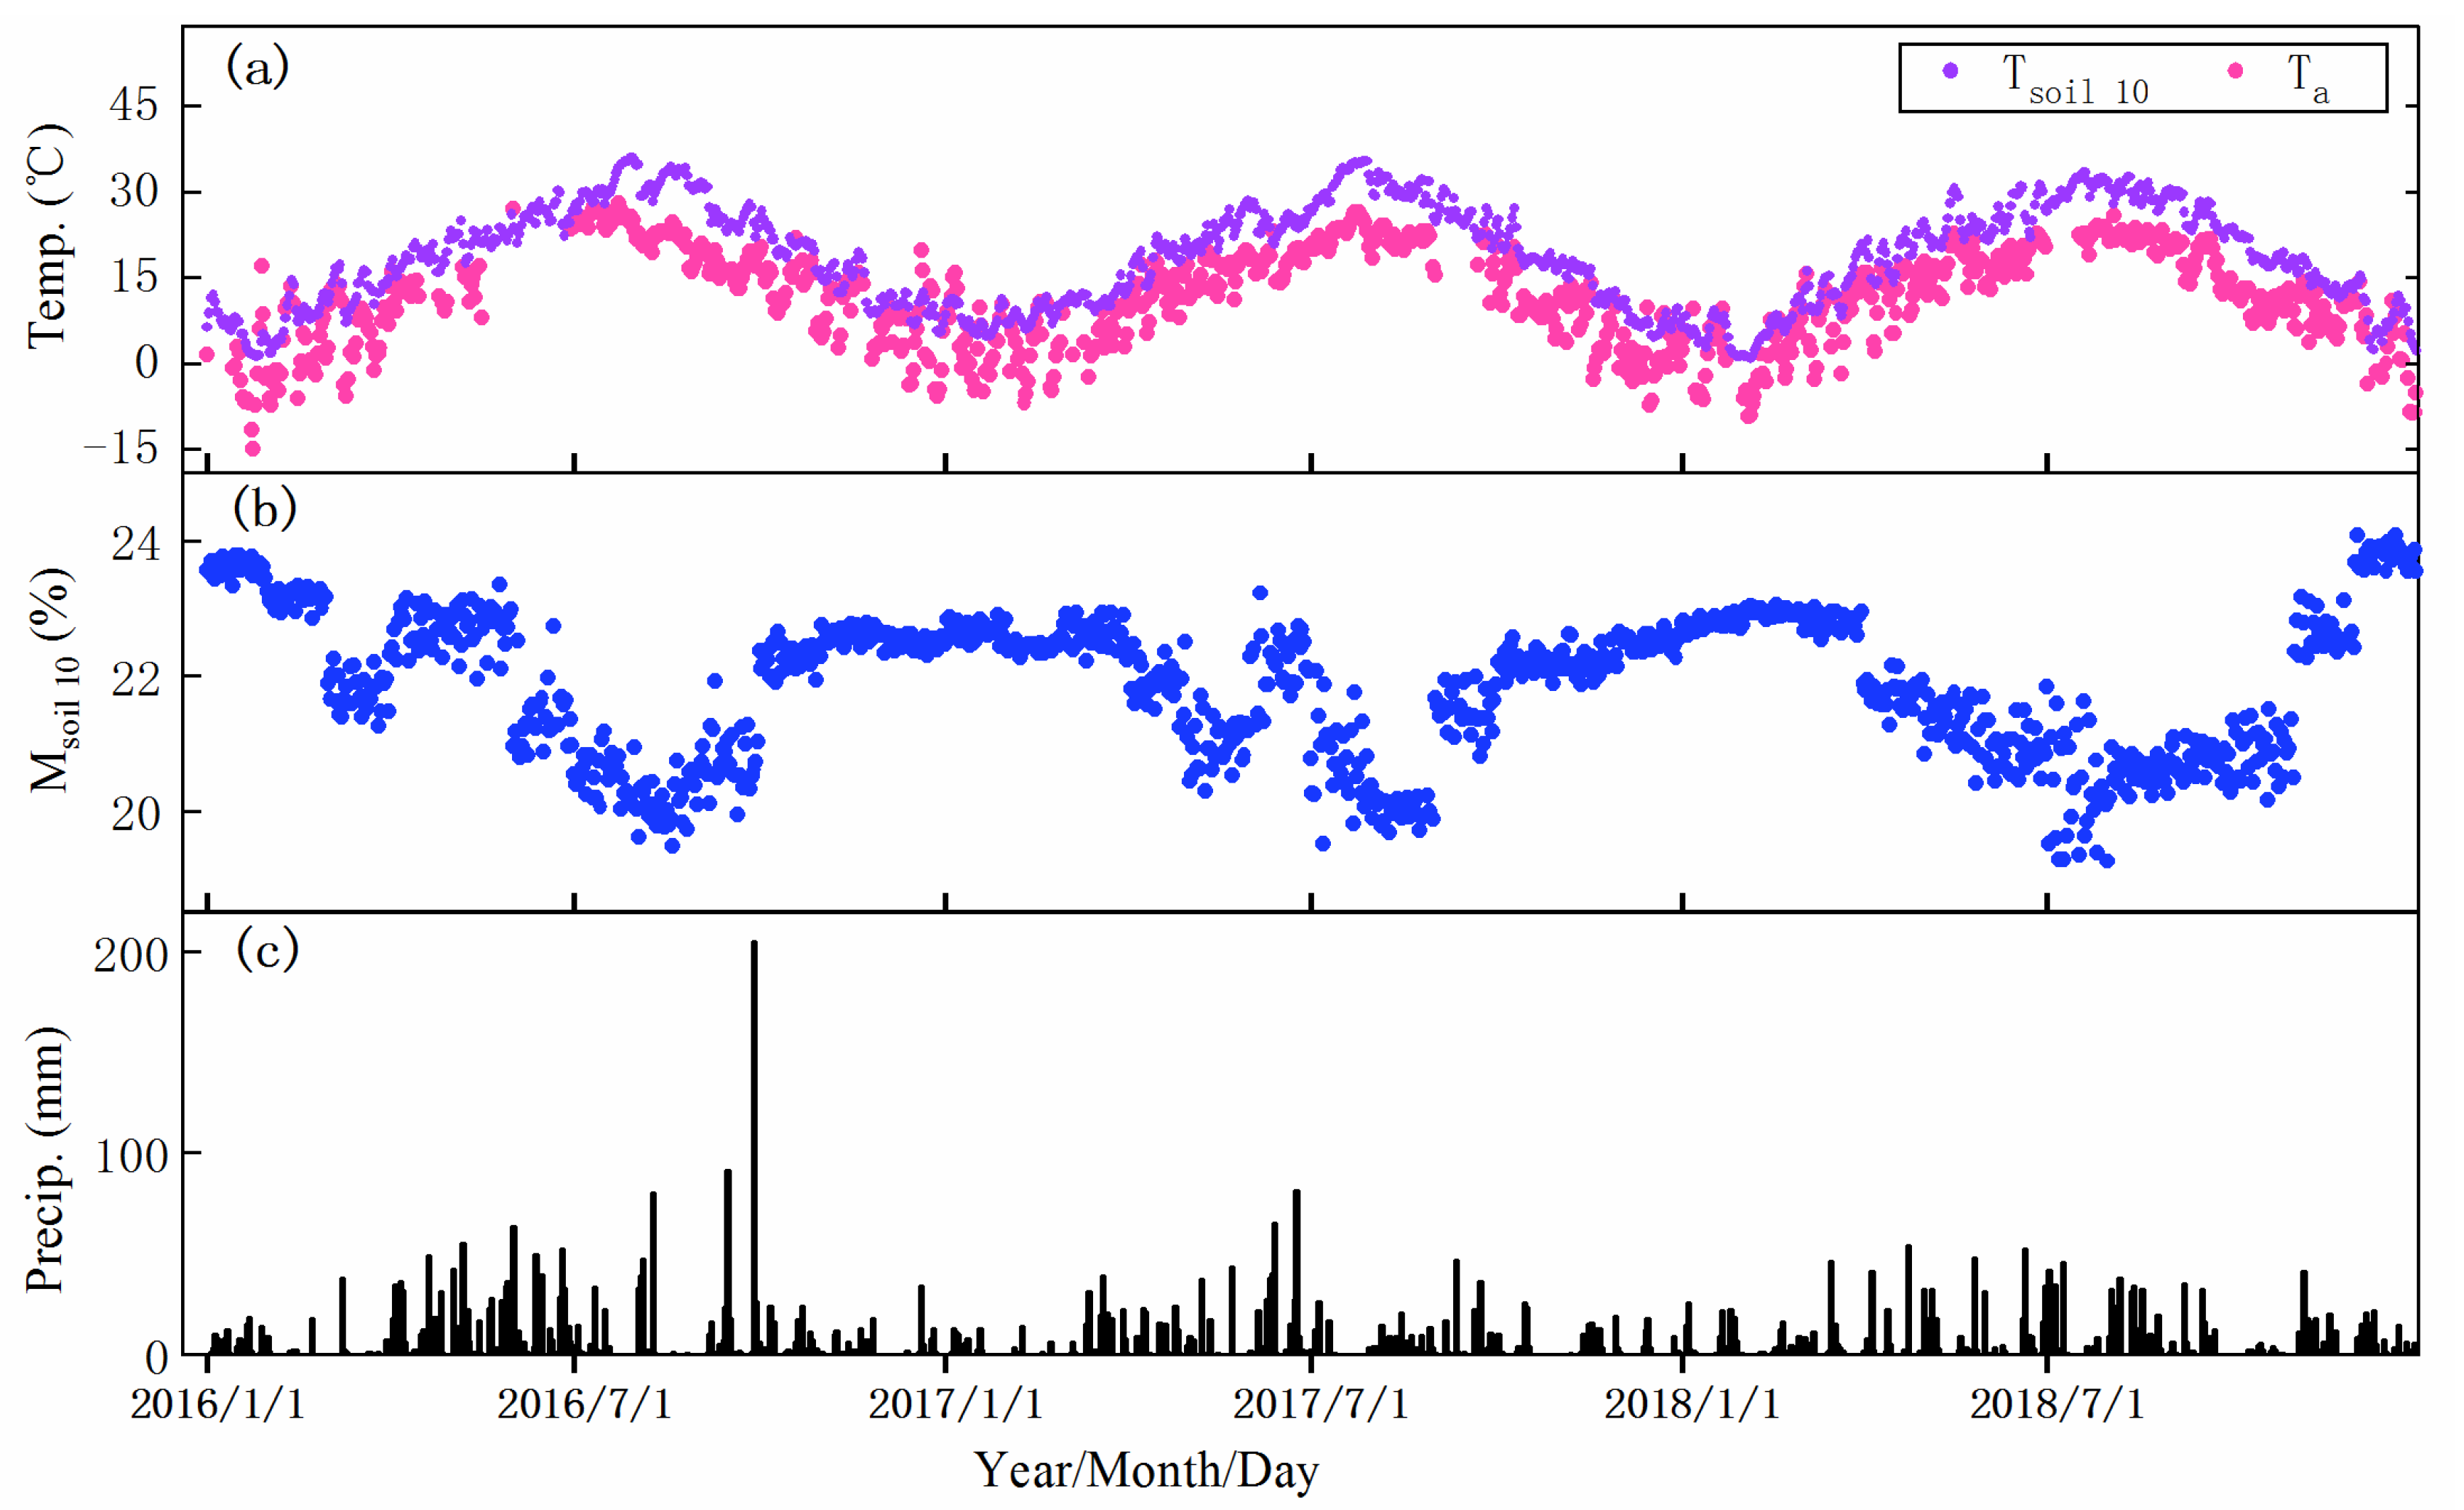
3.1. Temporal Variations in Environmental Variables

Both soil temperature and soil moisture showed distinct seasonal variations (Figure 2a,b). Daily soil temperature also showed a distinct seasonal variation, with a minimum temperature of 0.9 °C in winter and a maximum temperature of 35.9 °C in summer. The annual mean soil temperature showed small interannual variability ranging from 18.5 to 18.9 °C. In contrast to soil temperature, soil moisture was low in summer and high in winter during the three-year measurement period. For example, daily soil moisture decreased from June and reached the lowest value of 19.5% in August 2016. Then, it increased until October to about 2.5% and maintained a relatively steady state. Most of the rainfall occurred in summer during the measurement period. Annual rainfall was highest in 2016 and lowest in 2017. The annual rainfall totals in 2016, 2017 and 2018 were 2088, 1381 and 1677 mm, respectively.

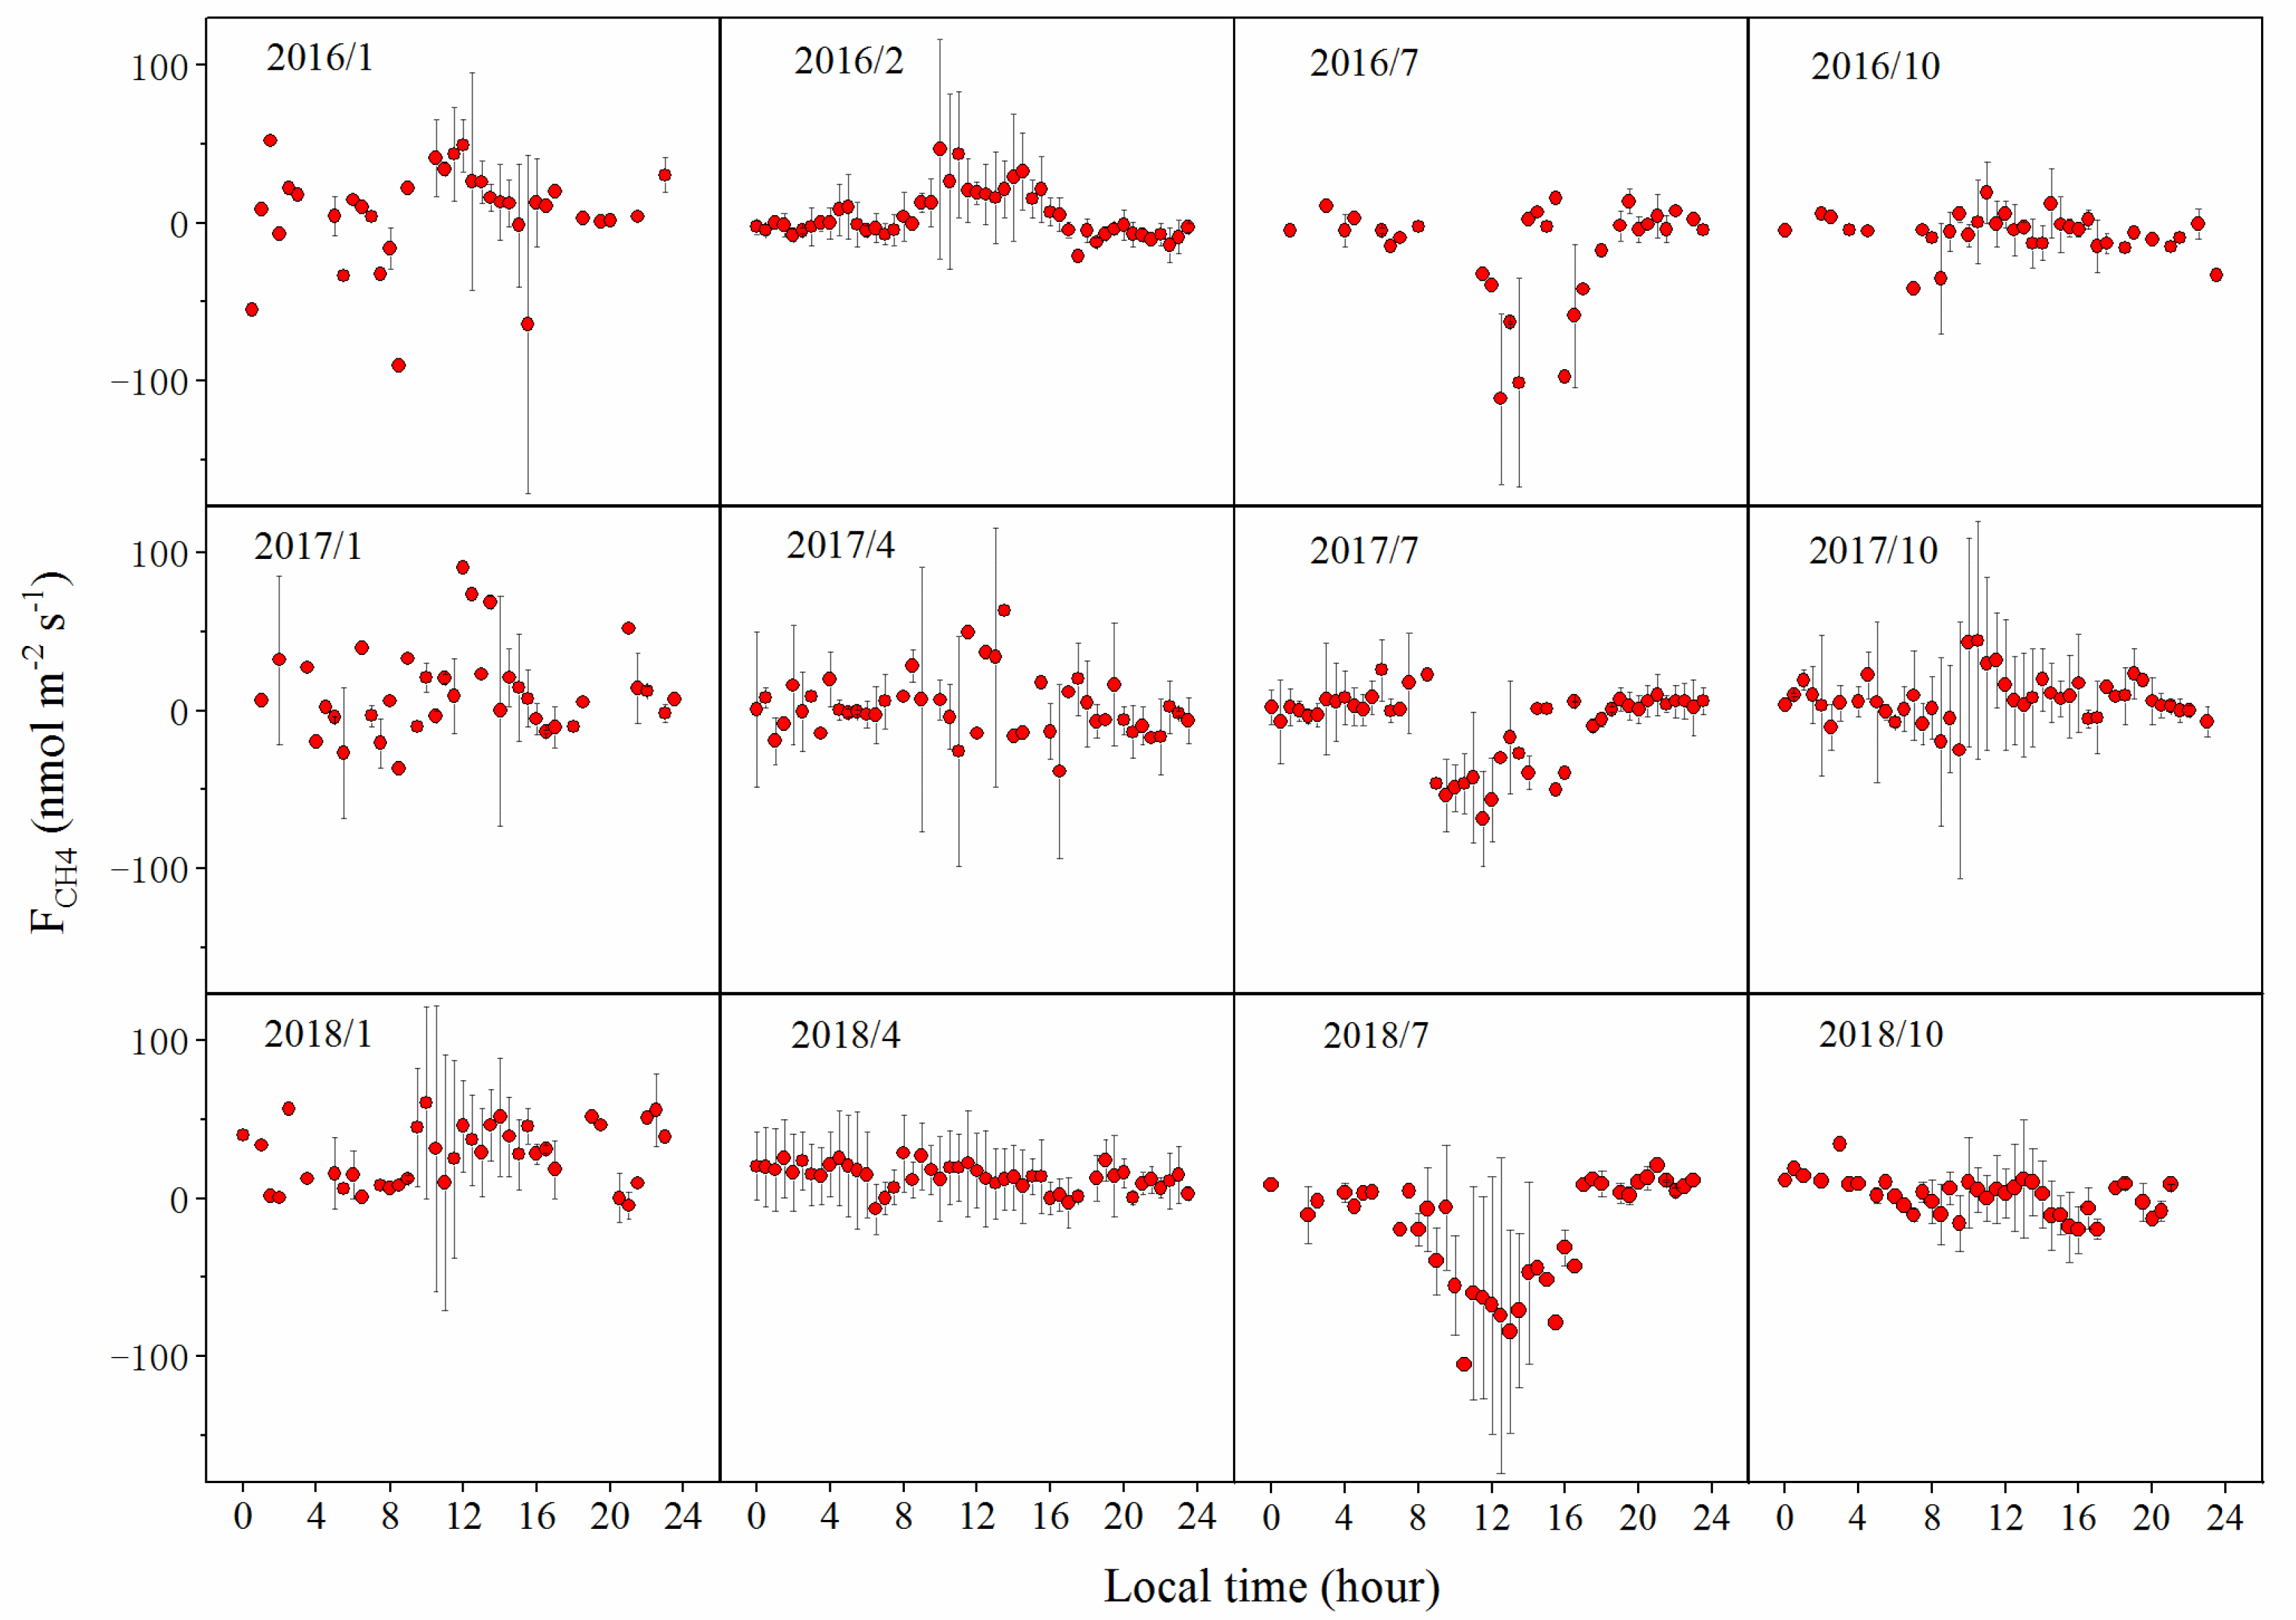
3.2. Diurnal Variationsin CH4 Flux

Diel patterns of CH4 flux varied among different seasons (Figure 3). The diurnal patterns between winter and summer obviously showed a contrast, although there was no consistent diurnal pattern during spring and fall. In winter, the CH4 flux started to increase after sunrise (7:30) and reached peaks (0.0492, 0.0907 and 0.0606 μmol m−2 s−1 in 2016–2018, respectively) at 10:00–12:00. The diurnal pattern with a noon peak in winter was generally consistent for each year. In contrast to the winter values, the CH4 flux at noon in summer had the lowest daily values. After 8:00 am, the CH4 flux gradually decreased to negative and reached uptake peaks (−0.112, −0.0685 and −0.1053 μmol m−2 s−1 in 2016–2018, respectively) at noon (11:30–13:00).

3.3. Seasonal Variations in CH4 Flux

Large seasonal variations in daily CH4 flux were observed (Figure 4). The daily averaged CH4 flux ranged from −0.142 to 0.145 g m−2 day−1. The CH4 flux started to decrease in winter (emission) each year and reached the minimum (uptake) in summer. Then, the CH4 flux continuously increased from negative to positive and reached the maximum emissions in winter. The maximum emissions were 0.045 g m−2 day−1 on 16 January 2016, 0.092 g m−2 day−1 on 27 November 2017 and 0.145 g m−2 day−1 on 4 September 2018. Overall, the CH4 flux showed uptake in summer and emission in winter (Figure 4).

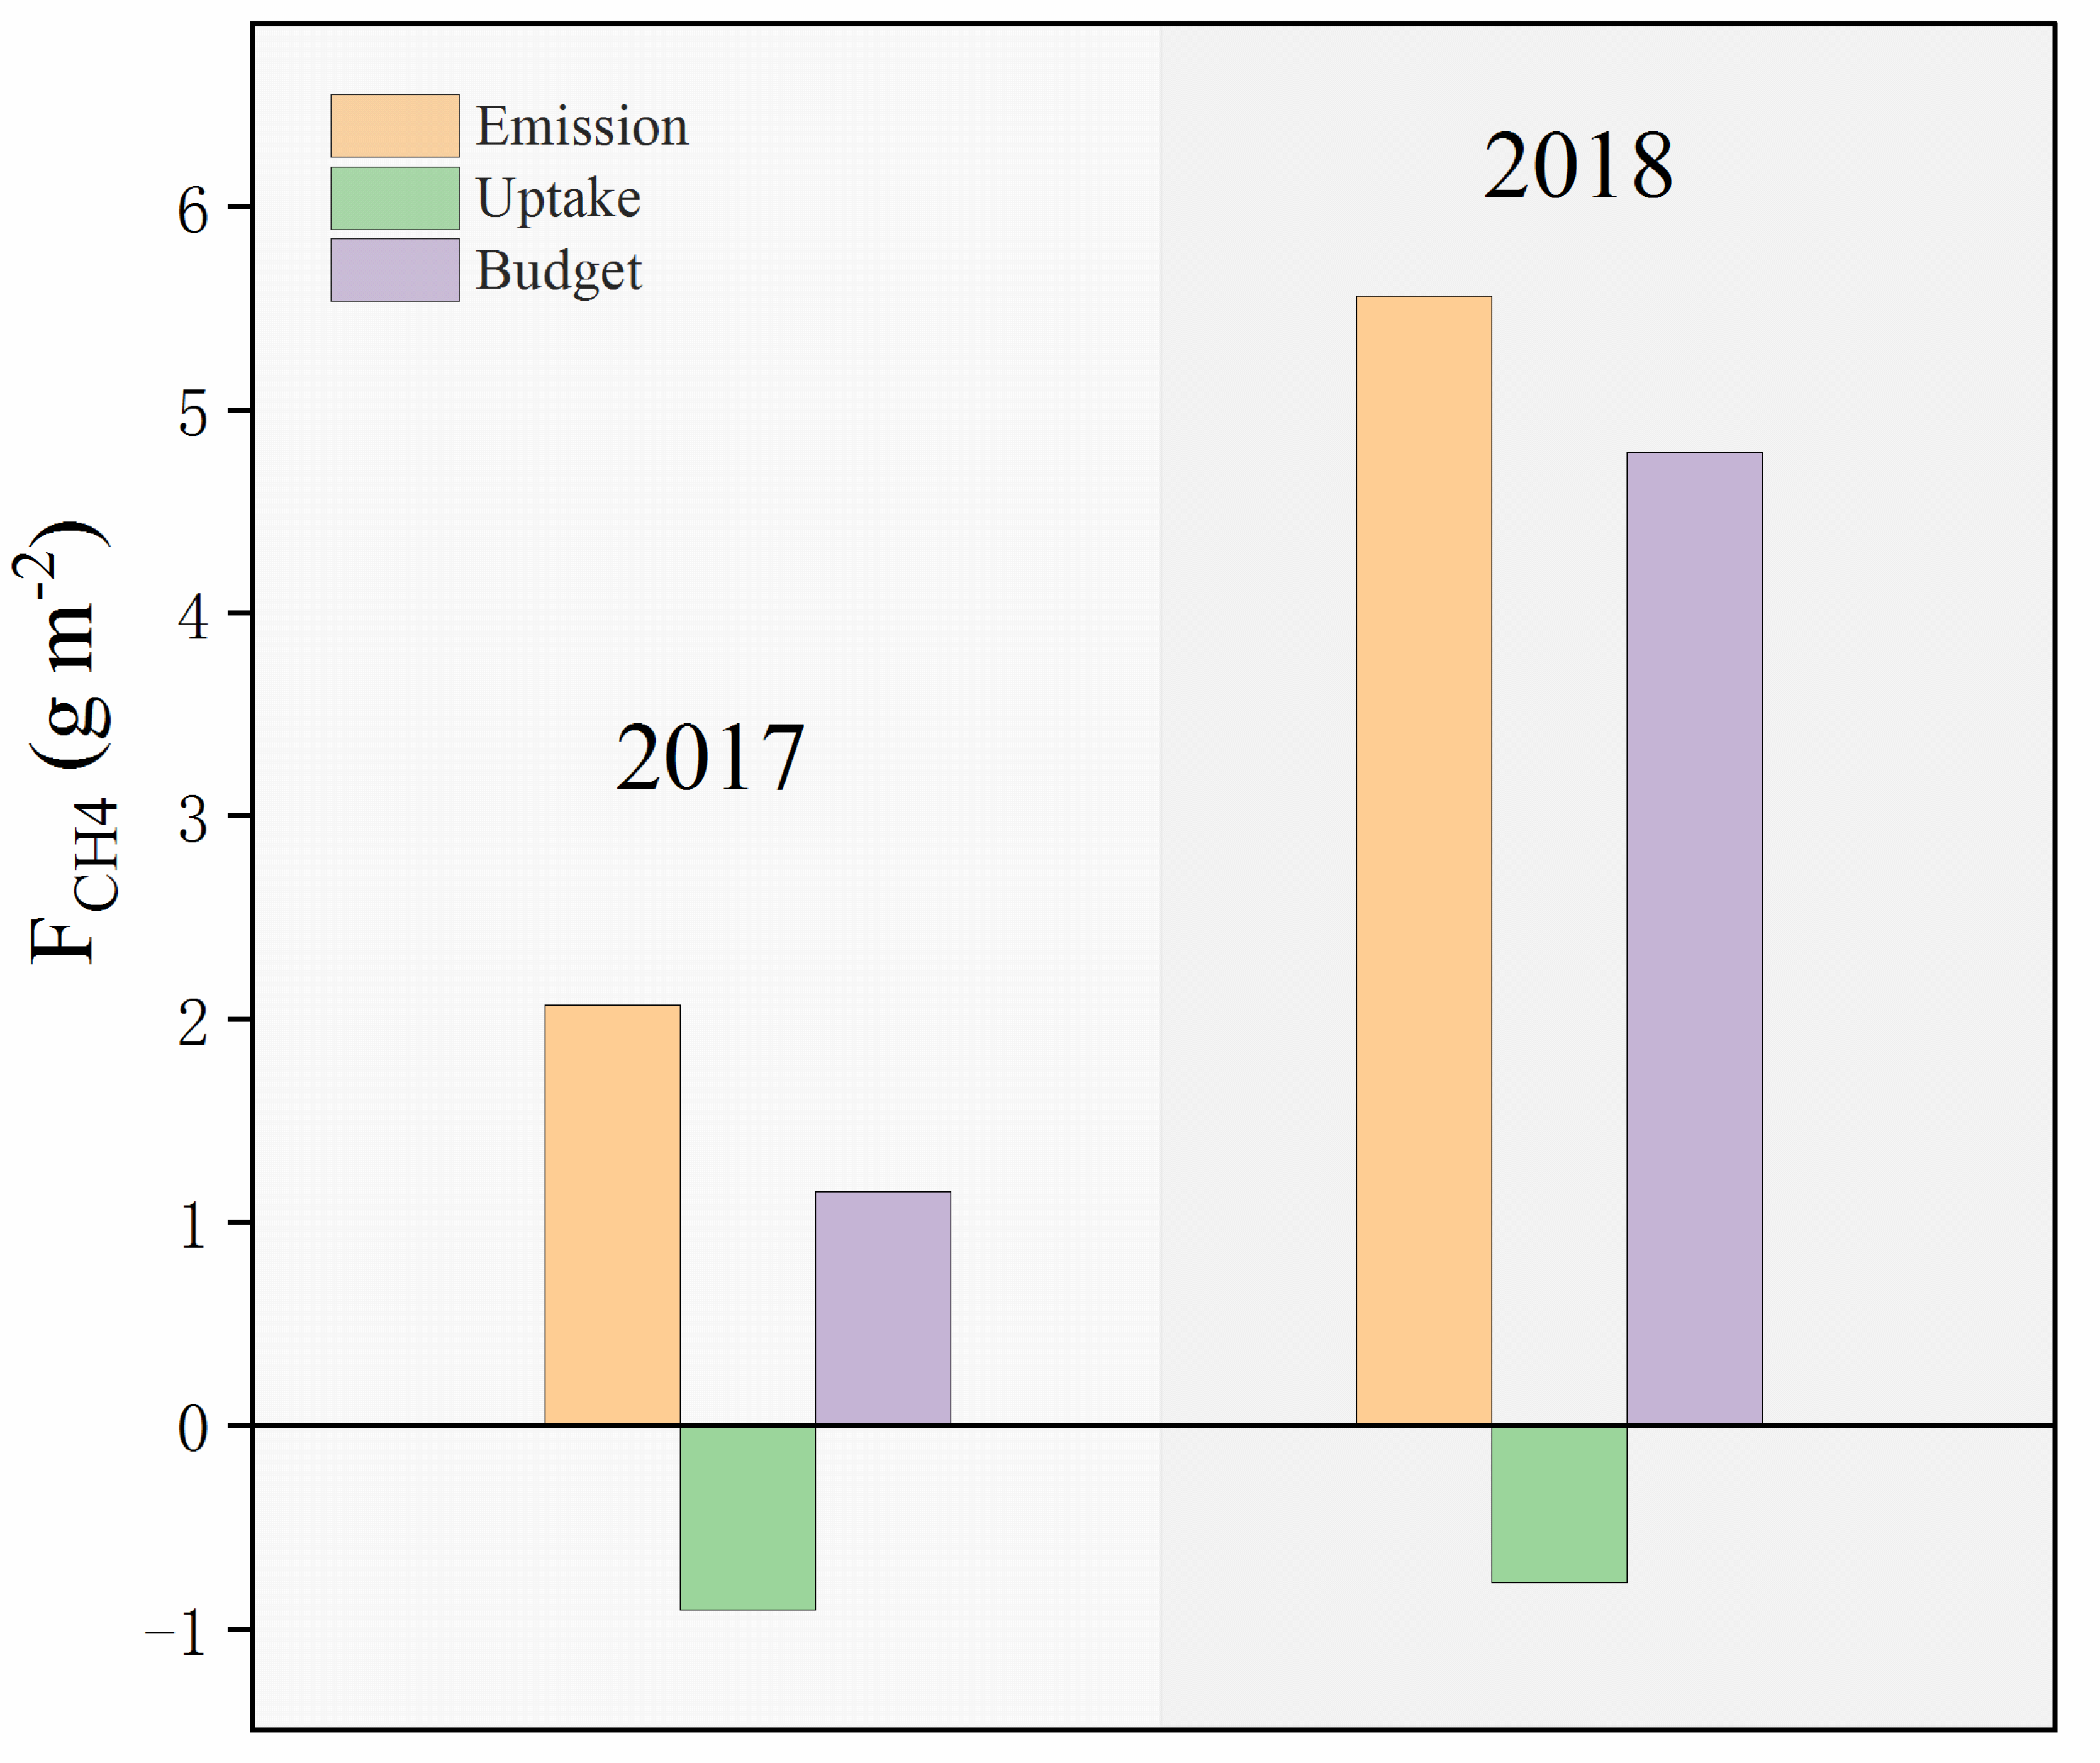
3.4. Annual Budget of CH4 Flux

The study site acted as a net source of CH4 during the measurement period of 2017–2018 (Figure 5). Although the CH4 flux in summer was negative in 2017 and 2018, the net budget of the CH4 flux was still positive each year due to the larger contribution of total emissions in winter surpassing the uptake of CH4 in summer. The emissions in 2017 and 2018 accounted for 69.31% and 87.84%, respectively, while the uptake of CH4 in 2017 and 2018 was only 30.69% and 12.16%, respectively. In total, the annual budgets of the CH4 flux for 2017 and 2018 were 1.15 ± 0.28 and 4.79 ± 0.49 g CH4 m−2 year−1, respectively (Figure 5).

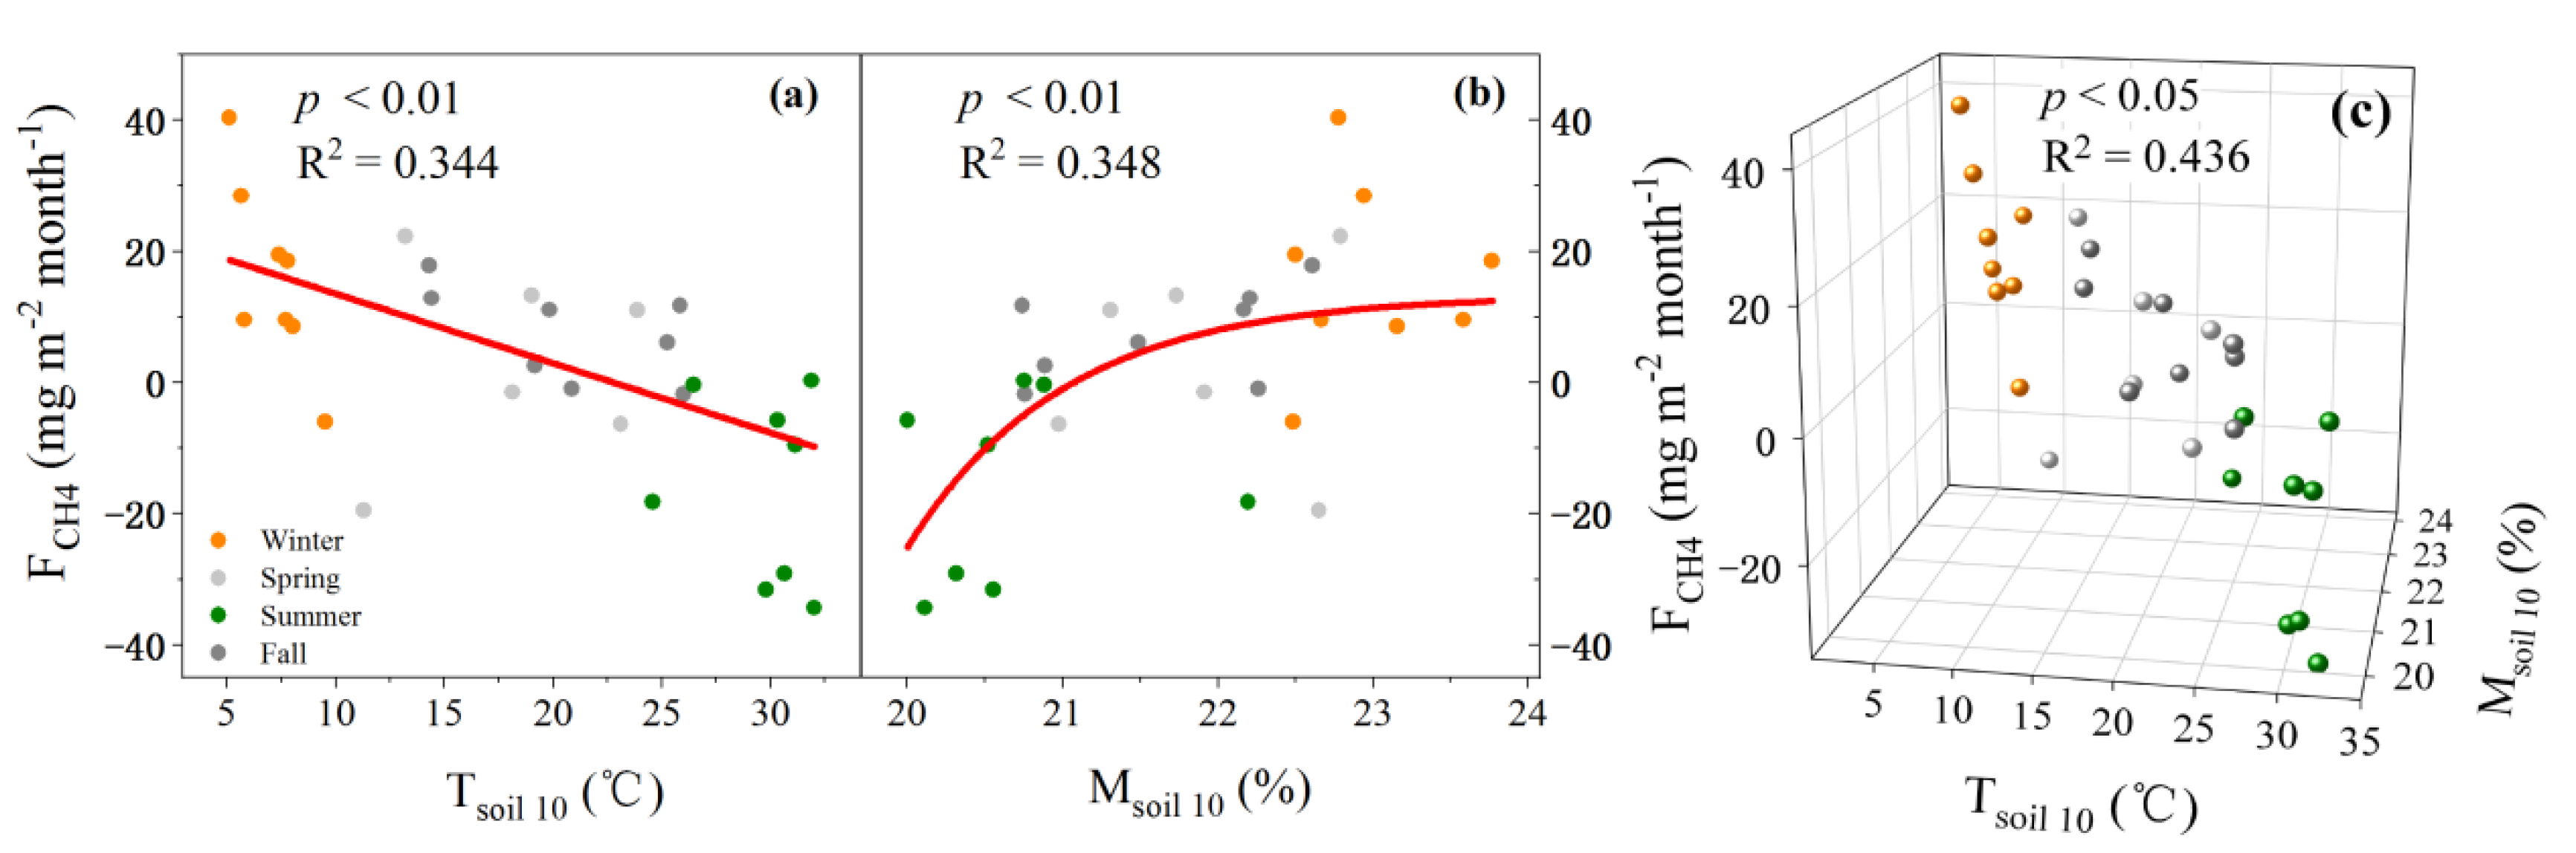
3.5. Environmental Controls on CH4 Flux

The linear relationship between daily CH4 flux and all environmental factors (including: Ta, RH, precipitation, VPD, Tsoil 10, Msoil 10) we measured was not significant. The monthly averaged CH4 flux exhibited a significant negative linear correlation with soil temperature (Figure 6a, p < 0.01, R2 = 0.34) but increased exponentially with soil moisture (Figure 6b, p < 0.01, R2 = 0.35). Regression models for the monthly averaged FCH4 and soil temperature (Tsoil 10) and soil moisture (Msoil 10) are as follows:
FCH4 = 0.024 − 0.001 × Tsoil 10
FCH4 = 0.013 − 1.5 × 10^(−7) × e^(−0.99 × Msoil 10)
The combination of Tsoil 10 and Msoil 10 explained more of the variation in the CH4 flux (Figure 6c, R2 = 0.44). The three-dimensional fitting equation for the combined effect (c) of soil temperature and moisture on CH4 flux is as follows:
FCH4 = 10648 × (11389 − 483 × Tsoil 10) × [1.52 + 10981 × e^(−1.54 × Msoil 10)]
With the increase in soil temperature and the synchronous decrease in soil moisture, the CH4 flux gradually decreased from positive (emissions) in winter (Figure 6c, yellow points) to negative (uptake) in summer (Figure 6c, green points).

4. Discussion

4.1. Temporal Variations and Annual Budget of CH4 Flux

The diurnal patterns with a single uptake peak and emissions peak, which all appeared at noon, occurred in summer and winter, respectively, each year in this study. A diurnal pattern of CH4 flux with an uptake peak occurring around noon (10:00 am–14:00 pm) in summer has often been observed in upland forests [61,62,63]. Another diurnal pattern of emission peaks occurring in winter has rarely been reported for upland forests [64] but has been well reported for wetlands [44,65,66]. Additionally, a phenomenon similar to that in this study, where both of the two diurnal patterns occurred in summer and winter respectively each year, has not been reported in upland forests. Meanwhile, both diurnal variations can randomly or sporadically occur in an ecosystem [65,67].
The seasonal variation pattern of CH4 uptake in summer and emission in winter was also found for the first time in upland forests in this study. Even u* threshold filtering was not used, the seasonal dynamic was similar to the original result. The range of daily CH4 flux in this study was −142~145 mg m−2 day−1. The uptake range was approximately 10 times higher than that measured in other forest ecosystems [68,69], mainly because those studies measured only CH4 flux in the soil but not at the ecosystem scale. The pattern of CH4 uptake in summer has often been observed. Wang et al. [63] measured CH4 fluxes from June to October in a temperate forest that reached an uptake peak in September with a range from −0.002 to −0.006 g m−2 d−1. In addition to the temperate forest system research, a similar pattern of CH4 flux with uptake in summer has been reported in mixed deciduous forests [69], broad-leaved/Korean pine forests [61] and spruce-fir forests [70]. Unlike the uptake pattern in summer, an emissions pattern in winter has rarely been reported. Only Sakabe et al. [67] reported that CH4 emissions occurred in the summer, fall and winter in 2009 in a coniferous forest, mainly due to the increase in precipitation. Except for this example, we did not find a similar pattern in other ecosystems.
The annual budgets of the CH4 flux for 2017 and 2018 were estimated to be 1.15 ± 0.28 and 4.79 ± 0.49 g CH4 m2 year1 in this study, respectively. When u* threshold filtering was not used, the annual budgets was 0.22~2.68 g CH4 m−2 year−1. The range of the annual budget was different from that of other subtropical or tropical ecosystems (Table 1) based on the eddy covariance technique [44,52,71]. Shoemaker et al. [52] reported that the budget in spruce-fir forests was an order of magnitude smaller than that in this study. However, in alpine grasslands and mangrove forests [44,71], the budgets were an order of magnitude higher than that in this study. Except for the eddy covariance technique, we compared the range (−142~145 mg m−2 d−1) of CH4 daily average flux with other subtropical upland forests (Table 1) in China and found that the range was higher than that of other ecosystems [35,72,73]. Except for subtropical or tropical ecosystems, we compared the range (−0.218 to −142 mg m−2 day−1) of CH4 uptake (sink) at our site with that in temperate forests [74,75] and found that it was higher than that in temperate forests. Smith et al. [75] reported that CH4 uptake ranged from −0.05 to −3.6 mg m−2 day−1 in forests located in six countries of northern Europe. Morishita et al. [74] found that CH4 uptake ranging from −0.05 to −4.3 mg C m−2 day−1 was observed across 26 forest sites in Japan. According to these comparisons, we found that the subtropical forest can act as a significant CH4 source in upland forests.

4.2. Control Factors of CH4 Flux

The annual CH4 budget (net ecosystem exchange) depends on the balance of the CH4 sink (uptake) and source (emissions). Methane uptake and emissions are a combination of biochemical and physical processes [77]. It is widely recognized that CH4 flux dynamics in forest ecosystems are controlled by multiple environmental factors, including soil temperature, soil moisture, soil nutrients, natural disturbances such as droughts and fires, and forest management practices (such as thinning and understorey removal) [13].
Temperature, as a primary driver, plays an important role in affecting CH4 production, oxidation and emissions in various forest ecosystems [47,78,79,80]. Changes in soil temperature affect not only the activities of soil microbes [81], but also the transport of CH4 flux from soil to the atmosphere [29,82]. Numerous studies have indicated that the temporal variation in the CH4 flux is mainly determined by temperature, and the CH4 flux increases with increasing temperature [83,84]. At our study site, there was a negative correlation (Figure 6, p < 0.01, R2 = 0.34) between Tsoil 10 and the CH4 flux, which was different from the results of many previous studies [42,80,85,86]. That is because, in winter, despite the lower soil temperature, the soil moisture in the study was highest, and the relatively favorable wet conditions were suitable for enhancing CH4 production. In summer, a higher soil temperature may result in more CH4 consumption, forming an enhanced sink of CH4 (Figure 5).
There is general agreement among mainstream scientists that soil moisture plays an important role in ecosystem CH4 exchange [13,84,87]. Soil moisture can directly affect oxygen availability, gas diffusion rate and microbial activity, and that significantly alters CH4 oxidation and production [28,88,89]. In our study, Msoil 10 had a significant positive effect on the CH4 flux (Figure 6b, p < 0.01) and accounted for approximately 34.8% of the variation in the daily CH4 flux (Figure 6b). During the winter, the higher soil moisture should have created more anaerobic conditions for methanogens and thus increased CH4 emissions. However, in the summer, the lower soil moisture due to the higher temperature could form aerobic soil conditions to promote the uptake of CH4 via CH4 oxidation (Figure 7).
In addition, CH4 flux dynamics are affected by many other factors [15,17,19,20,90,91,92]. All of the abovementioned factors eventually combined and interacted to affect the processes and activities of methanotrophs and methanogens (Figure 7). In summer, the effect of soil temperature on methanotrophs may be more dominant than that of methanogens. Meanwhile, soil moisture decreased due to higher evapotranspiration. Adequate oxygen may weaken the activity of methanogens. However, in winter, due to high soil moisture, soil oxygen is relatively low, and anaerobic conditions may increase methane emissions (Figure 7).
Although both soil temperature and moisture are important factors influencing the sources and sinks of CH4, it was obvious in this study that the effect of soil moisture on the CH4 flux played a dominant role in the annual CH4 budget during the winter. Therefore, the CH4 emissions in winter were higher than the uptake in summer. It is likely that the reason for the higher soil moisture in winter may be due to snow cover [14,93,94,95]. On the one hand, the melting of snow water led to higher soil moisture and lower oxygen content, resulting in the reduction was more than that in summer, thus reducing the proportion of CH4 oxidation. On the other hand, snow cover can also keep the soil warm, thereby maintaining the activity of soil methanogens, increasing the production of CH4. Consequently, this may result in a positive CH4 annual budget (a net source of CH4), which provides direct evidence to support the previous model simulation study by Tian et al. [5].
Obviously, our current understanding, measurement data and analysis are still limited. First, several data gaps in the CH4 flux observations existed during the measurements because of instrument failure and a lack of electrical supply. For example, the data from March to June 2016 were missing due to a break in the electrical power supply. Although we used the random forest (RF) approach to gap-fill data, this gap-filling may have introduced some artificial bias and errors for annual budget estimation. Second, additional auxiliary measurements on soil microbial activities, soil oxygen, tree species, ages, tissue types and site characteristics are needed to improve our understanding of the mechanisms of CH4 uptake and emissions [8].

5. Conclusions

This study provides a first attempt to use the eddy covariance technique to continuously measure and quantify CH4 uptake, emissions and annual budget and to investigate its control factors in a subtropical forest of Zhejiang Province, China. Our results suggested that natural evergreen and deciduous broad-leaved forests in the study area acted as CH4 sinks (uptake of −0.84 g m−2 year−1) in summer and CH4 sources (emissions of 3.815 g CH4 m−2 year−1) in winter. The net annual budget (net source) of CH4 was approximately 1.15–4.79 g m−2 year−1 during 2017–2018, which provides positive feedback to global climate warming. We also observed a clear diurnal and seasonal pattern of CH4 flux. At the daily scale, there was a significant emission peak in winter and a significant uptake peak in summer. The peaks of emissions and uptake both occurred at noon. At the seasonal scale, the studied forest region acted as a CH4 source during winter and a sink in summer. Soil temperature and moisture are the most important and dominant factors affecting the CH4 dynamics of subtropical forests in China. In addition, this study filled the research gap of CH4 flux observations of upland forests at the ecosystem scale, providing unique field observation data for informing and validating simulations of process-based CH4 dynamic models for global upland forest CH4 budgets.

Author Contributions

Conceptualization, H.W., Z.L. and H.L.; methodology, H.W. and H.L.; software, H.W. and H.L.; validation, C.P. and H.L.; formal analysis, H.W.; investigation, H.W., Q.L. and J.L.; resources, C.P., X.S. and H.J.; data curation, H.W.; writing—original draft preparation, H.W.; writing—review and editing, C.P. and H.L.; project administration, C.P.; funding acquisition, C.P. All authors have read and agreed to the published version of the manuscript.

Funding

This research was funded by the National Key R&D Program of China, grant number: 2016YFC050020.

Data Availability Statement

The data presented in this study are available on reasonable request from the corresponding author. The data are not publicly available due to privacy.

Acknowledgments

We wish to acknowledge the Tianmu Mountain Nature Reserve Administration for help in field investigations.

Conflicts of Interest

The authors declare no conflict of interest.

References

  1. Etminan, M.; Myhre, G.; Highwood, E.J.; Shine, K.P. Radiative forcing of carbon dioxide, methane, and nitrous oxide: A significant revision of the methane radiative forcing. Geophys. Res. Lett. 2016, 43, 12614–12623. [Google Scholar] [CrossRef]
  2. Myhre, G.; Shindell, D.; Bréon, F.-M.; Collins, W.; Fuglestvedt, J.; Huang, J.; Douglas Dounald Koch, M.D.; Lamarque, J.-F.; Lee, D.; Mendoza, B.; et al. Anthropogenic and Natural Radiative Forcing. In Climatechange 2013: The Physical Science Basis. Contribution of Working Group I to the Fifth Assessment Report of the Intergovernmental Panel on Climate Change; Stocker, T.F., Qin, D., Eds.; Cambridge University Press: Cambridge, UK; New York, NY, USA, 2013; pp. 659–740, 1535. [Google Scholar]
  3. Dlugokencky, E.J.; Bruhwiler, L.; White, J.W.C.; Emmons, L.K.; Novelli, P.C.; Montzka, S.A.; Masarie, K.A.; Lang, P.M.; Crotwell, A.M.; Miller, J.B.; et al. Observational constraints on recent increases in the atmospheric CH4 burden. Geophys. Res. Lett. 2009, 36, L18803. [Google Scholar] [CrossRef] [Green Version]
  4. Kirschke, S.; Bousquet, P.; Ciais, P.; Saunois, M.; Canadell, J.G.; Dlugokencky, E.J.; Bergamaschi, P.; Bergmann, D.; Blake, D.R.; Bruhwiler, L.; et al. Three decades of global methane sources and sinks. Nat. Geosci. 2013, 6, 813–823. [Google Scholar] [CrossRef]
  5. Tian, H.Q.; Lu, C.Q.; Ciais, P.; Michalak, A.M.; Canadell, J.G.; Saikawa, E.; Huntzinger, D.N.; Gurney, K.R.; Sitch, S.; Zhang, B.W.; et al. The terrestrial biosphere as a net source of greenhouse gases to the atmosphere. Nature 2016, 531, 225–228. [Google Scholar] [CrossRef] [Green Version]
  6. Saunois, M.; Stavert, A.R.; Poulter, B.; Bousquet, P.; Canadell, J.G.; Jackson, R.B.; Raymond, P.A.; Dlugokencky, E.J.; Houweling, S.; Patra, P.K.; et al. The Global Methane Budget 2000–2017. Earth Syst. Sci. Data 2020, 12, 1561–1623. [Google Scholar] [CrossRef]
  7. Dlugokencky, E.J.; Nisbet, E.G.; Fisher, R.; Lowry, D. Global atmospheric methane: Budget, changes and dangers. Philos. Trans. R. Soc. A Math. Phys. Eng. Sci. 2011, 369, 2058–2072. [Google Scholar] [CrossRef] [Green Version]
  8. Covey, K.R.; Megonigal, J.P. Methane production and emissions in trees and forests. New Phytol. 2019, 222, 35–51. [Google Scholar] [CrossRef] [PubMed]
  9. Ni, X.Y.; Groffman, P.M. Declines in methane uptake in forest soils. Proc. Natl. Acad. Sci. USA 2018, 115, 8587–8590. [Google Scholar] [CrossRef] [Green Version]
  10. Xiang, W.H.; Zhou, J.; Ouyang, S.; Zhang, S.L.; Lei, P.F.; Li, J.X.; Deng, X.W.; Fang, X.; Forrester, D.I. Species-specific and general allometric equations for estimating tree biomass components of subtropical forests in southern China. Eur. J. For. Res. 2016, 135, 963–979. [Google Scholar] [CrossRef]
  11. Xu, L.; Shi, Y.J.; Fang, H.Y.; Zhou, G.M.; Xu, X.J.; Zhou, Y.F.; Tao, J.X.; Ji, B.Y.; Xu, J.; Li, C.; et al. Vegetation carbon stocks driven by canopy density and forest age in subtropical forest ecosystems. Sci. Total Environ. 2018, 631–632, 619–626. [Google Scholar] [CrossRef]
  12. Ouyang, S.; Xiang, W.H.; Wang, X.P.; Xiao, W.F.; Chen, L.; Li, S.G.; Sun, H.; Deng, X.W.; Forrester, D.I.; Zeng, L.X.; et al. Effects of stand age, richness and density on productivity in subtropical forests in China. J. Ecol. 2019, 107, 2266–2277. [Google Scholar] [CrossRef]
  13. Feng, H.L.; Guo, J.H.; Han, M.H.; Wang, W.F.; Peng, C.H.; Jin, J.X.; Song, X.Z.; Yu, S.Q. A review of the mechanisms and controlling factors of methane dynamics in forest ecosystems. For. Ecol. Manag. 2020, 455, 117702. [Google Scholar] [CrossRef]
  14. Blanc-Betes, E.; Welker, J.M.; Sturchio, N.C.; Chanton, J.P.; Gonzalez-Meler, M.A. Winter precipitation and snow accumulation drive the methane sink or source strength of Arctic tussock tundra. Glob. Chang. Biol. 2016, 22, 2818–2833. [Google Scholar] [CrossRef]
  15. Kim, Y. Effect of thaw depth on fluxes of CO2 and CH4 in manipulated Arctic coastal tundra of Barrow, Alaska. Sci. Total Environ. 2015, 505, 385–389. [Google Scholar] [CrossRef] [PubMed]
  16. Wang, H.; Yu, L.F.; Zhang, Z.H.; Liu, W.; Chen, L.T.; Cao, G.M.; Yue, H.W.; Zhou, J.Z.; Yang, Y.F.; Tang, Y.H.; et al. Molecular mechanisms of water table lowering and nitrogen deposition in affecting greenhouse gas emissions from a Tibetan alpine wetland. Glob. Chang. Biol. 2017, 23, 815–829. [Google Scholar] [CrossRef] [Green Version]
  17. Morin, T.H.; Bohrer, G.; Frasson, R.; Naor-Azreli, L.; Mesi, S.; Stefanik, K.C.; Schafer, K.V.R. Environmental drivers of methane fluxes from an urban temperate wetland park. J. Geophys. Res. Biogeosci. 2014, 119, 2188–2208. [Google Scholar] [CrossRef] [Green Version]
  18. Wu, J.J.; Lu, M.; Fenga, J.; Zhang, D.D.; Chen, Q.; Li, Q.X.; Long, C.Y.; Zhang, Q.F.; Cheng, X.L. Soil net methane uptake rates in response to short-term litter input change in a coniferous forest ecosystem of central China. Agric. Forest Meteorol. 2019, 271, 307–315. [Google Scholar] [CrossRef]
  19. Hatala, J.A.; Detto, M.; Baldocchi, D.D. Gross ecosystem photosynthesis causes a diurnal pattern in methane emission from rice. Geophys. Res. Lett. 2012, 39, L06409. [Google Scholar] [CrossRef] [Green Version]
  20. Whiting, G.J.; Chanton, J.P. Plant-dependent CH4 emission in a subarctic canadian fen. Glob. Biogeochem. Cycle 1992, 6, 225–231. [Google Scholar] [CrossRef]
  21. Bergman, I.; Svensson, B.H.; Nilsson, M. Regulation of methane production in a Swedish acid mire by pH, temperature and substrate. Soil Biol. Biochem. 1998, 30, 729–741. [Google Scholar] [CrossRef]
  22. Suyker, A.E.; Verma, S.B.; Clement, R.J.; Billesbach, D.P. Methane flux in a boreal fen: Season-long measurement by eddy correlation. J. Geophys. Res. Atmos. 1996, 101, 28637–28647. [Google Scholar] [CrossRef]
  23. Updegraff, K.; Bridgham, S.D.; Pastor, J.; Weishampel, P.; Harth, C. Response of CO2 and CH4 emissions from peatlands to warming and water table manipulation. Ecol. Appl. 2001, 11, 311–326. [Google Scholar] [CrossRef]
  24. Weiss, R.; Shurpali, N.J.; Sallantaus, T.; Laiho, R.; Laine, J.; Alm, J. Simulation of water table level and peat temperatures in boreal peatlands. Ecol. Model. 2006, 192, 441–456. [Google Scholar] [CrossRef]
  25. Funk, D.W.; Pullman, E.R.; Peterson, K.M.; Crill, P.M.; Billings, W.D. Influence of water-table on carbon-dioxide, carbon-monoxide, and methane fluxes from taiga bog microcosms. Glob. Biogeochem. Cycle 1994, 8, 271–278. [Google Scholar] [CrossRef]
  26. Moore, T.R.; Knowles, R. The influence of water table levels on methane and carbon dioxide emissions from peatland soils. Can. J. Soil Sci. 1989, 69, 33–38. [Google Scholar] [CrossRef]
  27. Davidson, E.A.; Belk, E.; Boone, R.D. Soil water content and temperature as independent or confounded factors controlling soil respiration in a temperate mixed hardwood forest. Glob. Chang. Biol. 1998, 4, 217–227. [Google Scholar] [CrossRef] [Green Version]
  28. Le Mer, J.; Roger, P. Production, oxidation, emission and consumption of methane by soils: A review. Eur. J. Soil Biol. 2001, 37, 25–50. [Google Scholar] [CrossRef]
  29. Hosono, T.; Nouchi, I. The dependence of methane transport in rice plants on the root zone temperature. Plant. Soil 1997, 191, 233–240. [Google Scholar] [CrossRef]
  30. Kallistova, A.Y.; Merkel, A.Y.; Tarnovetskii, I.Y.; Pimenov, N.V. Methane Formation and Oxidation by Prokaryotes. Microbiology 2017, 86, 661–683. [Google Scholar] [CrossRef]
  31. Koh, H.S.; Ochs, C.A.; Yu, K.W. Hydrologic gradient and vegetation controls on CH4 and CO2 fluxes in a spring-fed forested wetland. Hydrobiologia 2009, 630, 271–286. [Google Scholar] [CrossRef]
  32. Lai, D.Y.F. Methane Dynamics in Northern Peatlands: A Review. Pedosphere 2009, 19, 409–421. [Google Scholar] [CrossRef]
  33. Dong, Y.S.; Qi, Y.C.; Luo, J.; Liang, T.; Luo, K.L.; Zhang, S. Experimental study on N2O and CH4 fluxes from the dark coniferous forest zone soil of the Gongga Mountain, China. Sci. China Ser. D Earth Sci. 2003, 46, 285–295. [Google Scholar] [CrossRef]
  34. Liu, X.; Yang, Z.; Lie, J.; Yi, L.; Yang, Y. Effects of Forest Conversion on CH4 Oxidation Rates in Mid-Subtropics. Sci. Silvae Sin. 2012, 48, 7–12. [Google Scholar] [CrossRef]
  35. Werner, C.; Zheng, X.H.; Tang, J.W.; Xie, B.H.; Liu, C.Y.; Kiese, R.; Butterbach-Bahl, K. N2O, CH4 and CO2 emissions from seasonal tropical rainforests and a rubber plantation in Southwest China. Plant. Soil 2006, 289, 335–353. [Google Scholar] [CrossRef]
  36. Yang, X.T.; Wang, C.M.; Xu, K. Response of soil CH4 fluxes to stimulated nitrogen deposition in a temperate deciduous forest in northern China: A 5-year nitrogen addition experiment. Eur. J. Soil Biol. 2017, 82, 43–49. [Google Scholar] [CrossRef]
  37. Lohila, A.; Aalto, T.; Aurela, M.; Hatakka, J.; Tuovinen, J.P.; Kilkki, J.; Penttila, T.; Vuorenmaa, J.; Hanninen, P.; Sutinen, R.; et al. Large contribution of boreal upland forest soils to a catchment-scale CH4 balance in a wet year. Geophys. Res. Lett. 2016, 43, 2946–2953. [Google Scholar] [CrossRef] [Green Version]
  38. Savi, F.; Di Bene, C.; Canfora, L.; Mondini, C.; Fares, S. Environmental and biological controls on CH4 exchange over an evergreen Mediterranean forest. Agric. For. Meteorol. 2016, 226, 67–79. [Google Scholar] [CrossRef]
  39. Whiting, G.J.; Chanton, J.P. Primary production control of methane emission from wetlands. Nature 1993, 364, 794–795. [Google Scholar] [CrossRef]
  40. Baldocchi, D.; Falge, E.; Gu, L.H.; Olson, R.; Hollinger, D.; Running, S.; Anthoni, P.; Bernhofer, C.; Davis, K.; Evans, R.; et al. FLUXNET: A new tool to study the temporal and spatial variability of ecosystem-scale carbon dioxide, water vapor, and energy flux densities. Bull. Am. Meteorol. Soc. 2001, 82, 2415–2434. [Google Scholar] [CrossRef]
  41. Baldocchi, D.D. How eddy covariance flux measurements have contributed to our understanding of Global Change Biology. Glob. Chang. Biol. 2020, 26, 242–260. [Google Scholar] [CrossRef] [PubMed]
  42. Li, H.; Dai, S.Q.; Ouyang, Z.T.; Xie, X.; Guo, H.Q.; Gu, C.H.; Xiao, X.M.; Ge, Z.M.; Peng, C.H.; Zhao, B. Multi-scale temporal variation of methane flux and its controls in a subtropical tidal salt marsh in eastern China. Biogeochemistry 2018, 137, 163–179. [Google Scholar] [CrossRef]
  43. Petrescu, A.M.R.; Lohila, A.; Tuovinen, J.P.; Baldocchi, D.D.; Desai, A.R.; Roulet, N.T.; Vesala, T.; Dolman, A.J.; Oechel, W.C.; Marcolla, B.; et al. The uncertain climate footprint of wetlands under human pressure. Proc. Natl. Acad. Sci. USA 2015, 112, 4594–4599. [Google Scholar] [CrossRef] [Green Version]
  44. Song, W.M.; Wang, H.; Wang, G.S.; Chen, L.T.; Jin, Z.N.; Zhuang, Q.L.; He, J.S. Methane emissions from an alpine wetland on the Tibetan Plateau: Neglected but vital contribution of the nongrowing season. J. Geophys. Res. Biogeosci. 2015, 120, 1475–1490. [Google Scholar] [CrossRef]
  45. Deshmukh, C.S.; Julius, D.; Evans, C.D.; Susanto, A.P.; Page, S.E.; Gauci, V.; Lauren, A.; Sabiham, S.; Agus, F.; Asyhari, A.; et al. Impact of forest plantation on methane emissions from tropical peatland. Glob. Chang. Biol. 2020, 26, 2477–2495. [Google Scholar] [CrossRef] [PubMed] [Green Version]
  46. Sakabe, A.; Itoh, M.; Hirano, T.; Kusin, K. Ecosystem-scale methane flux in tropical peat swamp forest in Indonesia. Glob. Chang. Biol. 2018, 24, 5123–5136. [Google Scholar] [CrossRef]
  47. Yu, X.Y.; Song, C.C.; Sun, L.; Wang, X.W.; Shi, F.X.; Cui, Q.; Tan, W.W. Growing season methane emissions from a permafrost peatland of northeast China: Observations using open-path eddy covariance method. Atmos. Environ. 2017, 153, 135–149. [Google Scholar] [CrossRef]
  48. Knox, S.H.; Matthes, J.H.; Sturtevant, C.; Oikawa, P.Y.; Verfaillie, J.; Baldocchi, D. Biophysical controls on interannual variability in ecosystem-scale CO2 and CH4 exchange in a California rice paddy. J. Geophys. Res. Biogeosci. 2016, 121, 978–1001. [Google Scholar] [CrossRef]
  49. Li, H.; Guo, H.Q.; Helbig, M.; Dai, S.Q.; Zhang, M.S.; Zhao, M.; Peng, C.H.; Xiao, X.M.; Zhao, B. Does direct-seeded rice decrease ecosystem-scale methane emissions?-A case study from a rice paddy in southeast China. Agric. For. Meteorol. 2019, 272, 118–127. [Google Scholar] [CrossRef]
  50. Fest, B.; Hinko-Najera, N.; von Fischer, J.C.; Livesley, S.J.; Arndt, S.K. Soil Methane Uptake Increases under Continuous Throughfall Reduction in a Temperate Evergreen, Broadleaved Eucalypt Forest. Ecosystems 2017, 20, 368–379. [Google Scholar] [CrossRef]
  51. Knox, S.H.; Jackson, R.B.; Poulter, B.; McNicol, G.; Fluet-Chouinard, E.; Zhang, Z.; Hugelius, G.; Bousquet, P.; Canadell, J.G.; Saunois, M.; et al. FLUXNET-CH4 Synthesis Activity: Objectives, Observations, and Future Directions. Bull. Amer. Meteorol. Soc. 2019, 100, 2607–2632. [Google Scholar] [CrossRef] [Green Version]
  52. Shoemaker, J.K.; Keenan, T.F.; Hollinger, D.Y.; Richardson, A.D. Forest ecosystem changes from annual methane source to sink depending on late summer water balance. Geophys. Res. Lett. 2014, 41, 673–679. [Google Scholar] [CrossRef]
  53. Nakai, T.; Shimoyama, K. Ultrasonic anemometer angle of attack errors under turbulent conditions. Agric. For. Meteorol. 2012, 162, 14–26. [Google Scholar] [CrossRef] [Green Version]
  54. Webb, E.K.; Pearman, G.I.; Leuning, R. Correction of flux measurements for density effects due to heat and water vapour transfer. Q. J. R. Meteorol. Soc. 1980, 106, 85–100. [Google Scholar] [CrossRef]
  55. Foken, T.; Göockede, M.; Mauder, M.; Mahrt, L.; Amiro, B.; Munger, W. Post-Field Data Quality Control. In Handbook of Micrometeorology: A Guide for Surface Flux Measurement and Analysis; Lee, X., Massman, W., Eds.; Springer: Dordrecht, The Netherlands, 2005; pp. 181–208. [Google Scholar]
  56. Vickers, D.; Mahrt, L. Quality control and flux sampling problems for tower and aircraft data. J. Atmos. Ocean. Technol. 1997, 14, 512–526. [Google Scholar] [CrossRef]
  57. Reichstein, M.; Falge, E.; Baldocchi, D.; Papale, D.; Aubinet, M.; Berbigier, P.; Bernhofer, C.; Buchmann, N.; Gilmanov, T.; Granier, A.; et al. On the separation of net ecosystem exchange into assimilation and ecosystem respiration: Review and improved algorithm. Glob. Chang. Biol. 2005, 11, 1424–1439. [Google Scholar] [CrossRef]
  58. Breiman, L. Random forests. Mach. Learn. 2001, 45, 5–32. [Google Scholar] [CrossRef] [Green Version]
  59. Kim, Y.; Johnson, M.S.; Knox, S.H.; Black, T.A.; Dalmagro, H.J.; Kang, M.; Kim, J.; Baldocchi, D. Gap-filling approaches for eddy covariance methane fluxes: A comparison of three machine learning algorithms and a traditional method with principal component analysis. Glob. Chang. Biol. 2020, 26, 1499–1518. [Google Scholar] [CrossRef]
  60. Finkelstein, P.L.; Sims, P.F. Sampling error in eddy correlation flux measurements. J. Geophys. Res. Atmos. 2001, 106, 3503–3509. [Google Scholar] [CrossRef]
  61. Dong-mei, X.; Miao, W.; Yue-si, W.; Lan-zhu, J.; Shi-jie, H. Fluxes of soil carbon dioxide, nitrous oxide and firedamp in broadleaved/Korean pine forest. J. For. Res. 2004, 15, 107–112. [Google Scholar] [CrossRef]
  62. Ma, X.Z.; Zhang, Q.L.; Li, C.S.; Chen, G.W.; Wang, F. Temporal variation of soil greenhouse gases fluxes in a cold-temperate Larix gmelinii forest in Inner Mongolia, China. Chin. J. Appl. Ecol. 2012, 23, 2149–2156. [Google Scholar] [CrossRef]
  63. Wang, J.M.; Murphy, J.G.; Geddes, J.A.; Winsborough, C.L.; Basiliko, N.; Thomas, S.C. Methane fluxes measured by eddy covariance and static chamber techniques at a temperate forest in central Ontario, Canada. Biogeosciences 2013, 10, 4371–4382. [Google Scholar] [CrossRef] [Green Version]
  64. Querino, C.A.S.; Smeets, C.; Vigano, I.; Holzinger, R.; Moura, V.; Gatti, L.V.; Martinewski, A.; Manzi, A.O.; de Araujo, A.C.; Rockmann, T. Methane flux, vertical gradient and mixing ratio measurements in a tropical forest. Atmos. Chem. Phys. 2011, 11, 7943–7953. [Google Scholar] [CrossRef] [Green Version]
  65. Chen, H.; Liu, X.W.; Xue, D.; Zhu, D.; Zhan, W.; Li, W.; Wu, N.; Yang, G. Methane emissions during different freezing-thawing periods from a fen on the Qinghai-Tibetan Plateau: Four years of measurements. Agric. For. Meteorol. 2021, 297, 108279. [Google Scholar] [CrossRef]
  66. Morin, T.H.; Bohrer, G.; Naor-Azrieli, L.; Mesi, S.; Kenny, W.T.; Mitsch, W.J.; Schafer, K.V.R. The seasonal and diurnal dynamics of methane flux at a created urban wetland. Ecol. Eng. 2014, 72, 74–83. [Google Scholar] [CrossRef]
  67. Sakabe, A.; Hamotani, K.; Kosugi, Y.; Ueyama, M.; Takahashi, K.; Kanazawa, A.; Itoh, M. Measurement of methane flux over an evergreen coniferous forest canopy using a relaxed eddy accumulation system with tuneable diode laser spectroscopy detection. Theor. Appl. Climatol. 2012, 109, 39–49. [Google Scholar] [CrossRef] [Green Version]
  68. Sundqvist, E.; Molder, M.; Crill, P.; Kljun, N.; Lindroth, A. Methane exchange in a boreal forest estimated by gradient method. Tellus Ser. B Chem. Phys. Meteorol. 2015, 67, 26688. [Google Scholar] [CrossRef] [Green Version]
  69. Borken, W.; Davidson, E.A.; Savage, K.; Sundquist, E.T.; Steudler, P. Effect of summer throughfall exclusion, summer drought, and winter snow cover on methane fluxes in a temperate forest soil. Soil Biol. Biochem. 2006, 38, 1388–1395. [Google Scholar] [CrossRef]
  70. Castro, M.S.; Steudler, P.A.; Melillo, J.M.; Aber, J.D.; Millham, S. Exchange of N2O and CH4 between the atmosphere and soils in spruce-fir forests in the northeastern United-States. Biogeochemistry 1992, 18, 119–135. [Google Scholar] [CrossRef]
  71. Liu, J.; Zhou, Y.; Valach, A.; Shortt, R.; Kasak, K.; Rey-Sanchez, C.; Hemes, K.S.; Baldocchi, D.; Lai, D.Y.F. Methane emissions reduce the radiative cooling effect of a subtropical estuarine mangrove wetland by half. Glob. Chang. Biol. 2020, 26, 4998–5016. [Google Scholar] [CrossRef]
  72. Mo, J.M.; Fang, Y.T.; Li, D.J.; Lin, E.D.; Li, Y.E. Soil CO2 emission and CH4 uptake in the main forests of Dinghushan in subtropical China. Guihaia 2006, 26, 142–147. [Google Scholar] [CrossRef]
  73. Tang, X.L.; Liu, S.G.; Zhou, G.Y.; Zhang, D.Q.; Zhou, C.Y. Soil-atmospheric exchange of CO2, CH4, and N2O in three subtropical forest ecosystems in southern China. Glob. Chang. Biol. 2006, 12, 546–560. [Google Scholar] [CrossRef]
  74. Morishita, T.; Sakata, T.; Takahashi, M.; Ishizuka, S.; Mizoguchi, T.; Inagaki, Y.; Terazawa, K.; Sawata, S.; Igarashi, M.; Yasuda, H.; et al. Methane uptake and nitrous oxide emission in Japanese forest soils and their relationship to soil and vegetation types. Soil Sci. Plant. Nutr. 2007, 53, 678–691. [Google Scholar] [CrossRef]
  75. Smith, K.A.; Dobbie, K.E.; Ball, B.C.; Bakken, L.R.; Sitaula, B.K.; Hansen, S.; Brumme, R.; Borken, W.; Christensen, S.; Prieme, A.; et al. Oxidation of atmospheric methane in Northern European soils, comparison with other ecosystems, and uncertainties in the global terrestrial sink. Glob. Chang. Biol. 2000, 6, 791–803. [Google Scholar] [CrossRef]
  76. Dalmagro, H.J.; de Arruda, P.H.Z.; Vourlitis, G.L.; Lathuilliere, M.J.; Nogueira, J.D.; Couto, E.G.; Johnson, M.S. Radiative forcing of methane fluxes offsets net carbon dioxide uptake for a tropical flooded forest. Glob. Chang. Biol. 2019, 25, 1967–1981. [Google Scholar] [CrossRef]
  77. Tveit, A.T.; Hestnes, A.G.; Robinson, S.L.; Schintlmeister, A.; Dedysh, S.N.; Jehmlich, N.; von Bergen, M.; Herbold, C.; Wagner, M.; Richter, A.; et al. Widespread soil bacterium that oxidizes atmospheric methane. Proc. Natl. Acad. Sci. USA 2019, 116, 8515–8524. [Google Scholar] [CrossRef] [Green Version]
  78. Bubier, J.L.; Moore, T.R. An ecological perspective on methane emissions from northern wetlands. Trends Ecol. Evol. 1994, 9, 460–464. [Google Scholar] [CrossRef]
  79. Euskirchen, E.S.; Edgar, C.W.; Turetsky, M.R.; Waldrop, M.P.; Harden, J.W. Differential response of carbon fluxes to climate in three peatland ecosystems that vary in the presence and stability of permafrost. J. Geophys. Res. Biogeosci. 2014, 119, 1576–1595. [Google Scholar] [CrossRef]
  80. Keppler, F.; Hamilton, J.T.G.; Brass, M.; Rockmann, T. Methane emissions from terrestrial plants under aerobic conditions. Nature 2006, 439, 187–191. [Google Scholar] [CrossRef]
  81. Rinne, J.; Riutta, T.; Pihlatie, M.; Aurela, M.; Haapanala, S.; Tuovinen, J.P.; Tuittila, E.S.; Vesala, T. Annual cycle of methane emission from a boreal fen measured by the eddy covariance technique. Tellus Ser. B Chem. Phys. Meteorol. 2007, 59, 449–457. [Google Scholar] [CrossRef]
  82. Deng, Y.C.; Liu, P.F.; Conrad, R. Effect of temperature on the microbial community responsible for methane production in alkaline NamCo wetland soil. Soil Biol. Biochem. 2019, 132, 69–79. [Google Scholar] [CrossRef]
  83. Schimel, J.P.; Gulledge, J. Microbial community structure and global trace gases. Glob. Chang. Biol. 1998, 4, 745–758. [Google Scholar] [CrossRef]
  84. Song, C.C.; Xu, X.F.; Tian, H.Q.; Wang, Y.Y. Ecosystem-atmosphere exchange of CH4 and N2O and ecosystem respiration in wetlands in the Sanjiang Plain, Northeastern China. Glob. Chang. Biol. 2009, 15, 692–705. [Google Scholar] [CrossRef]
  85. Wille, C.; Kutzbach, L.; Sachs, T.; Wagner, D.; Pfeiffer, E.M. Methane emission from Siberian arctic polygonal tundra: Eddy covariance measurements and modeling. Glob. Chang. Biol. 2008, 14, 1395–1408. [Google Scholar] [CrossRef] [Green Version]
  86. Helbig, M.; Chasmer, L.E.; Kljun, N.; Quinton, W.L.; Treat, C.C.; Sonnentag, O. The positive net radiative greenhouse gas forcing of increasing methane emissions from a thawing boreal forest-wetland landscape. Glob. Chang. Biol. 2017, 23, 2413–2427. [Google Scholar] [CrossRef] [Green Version]
  87. Hommeltenberg, J.; Mauder, M.; Drosler, M.; Heidbach, K.; Werle, P.; Schmid, H.P. Ecosystem scale methane fluxes in a natural temperate bog-pine forest in southern Germany. Agric. For. Meteorol. 2014, 198, 273–284. [Google Scholar] [CrossRef]
  88. Ding, W.X.; Cai, Z.C.; Tsuruta, H.; Li, X.P. Key factors affecting spatial variation of methane emissions from freshwater marshes. Chemosphere 2003, 51, 167–173. [Google Scholar] [CrossRef]
  89. Bender, M.; Conrad, R. Effect of CH4 concentrations and soil conditions on the induction of CH4 oxidation activity. Soil Biol. Biochem. 1995, 27, 1517–1527. [Google Scholar] [CrossRef]
  90. Ge, H.X.; Zhang, H.S.; Zhang, H.; Cai, X.H.; Song, Y.; Kang, L. The characteristics of methane flux from an irrigated rice farm in East China measured using using the eddy covariance method. Agric. For. Meteorol. 2018, 249, 228–238. [Google Scholar] [CrossRef]
  91. Wagner, D.; Lipski, A.; Embacher, A.; Gattinger, A. Methane fluxes in permafrost habitats of the Lena Delta: Effects of microbial community structure and organic matter quality. Environ. Microbiol. 2005, 7, 1582–1592. [Google Scholar] [CrossRef] [Green Version]
  92. Metje, M.; Frenzel, P. Methanogenesis and methanogenic pathways in a peat from subarctic permafrost. Environ. Microbiol. 2007, 9, 954–964. [Google Scholar] [CrossRef] [PubMed]
  93. Moore, T.R.; Dalva, M. The influence of temperature and water-table position on carbon-dioxide and methane emissions from laboratory columns of peatland soils. J. Soil Sci. 1993, 44, 651–664. [Google Scholar] [CrossRef]
  94. Brandt, A.C.; Zhang, Q.Q.; Caceres, M.L.L.; Murayama, H. Soil temperature and soil moisture dynamics in winter and spring under heavy snowfall conditions in North-Eastern Japan. Hydrol. Process. 2020, 34, 3235–3251. [Google Scholar] [CrossRef]
  95. West, A.E.; Brooks, P.D.; Fisk, M.C.; Smith, L.K.; Holland, E.A.; Jaeger, C.H.; Babcock, S.; Lai, R.S.; Schmidt, S.K. Landscape patterns of CH4 fluxes in an alpine tundra ecosystem. Biogeochemistry 1999, 45, 243–264. [Google Scholar] [CrossRef]
Figure 1. (A) Site location on a map of China. (B) Topography of the study region. (C) Eddy covariance system of the study site including (a) LI-7500A-an open-path CO2/H2O infrared gas analyzer, (b) WindMaster-a sonic anemometer and (c) LI-7700-an open-path CH4 infrared gas analyzer.
Land 10 00975 g001
Figure 2. Daily average of environmental variables at the subtropical forest site during the study period, including air temperature ((a), Ta, pink), soil temperature at 10 cm depth ((a), Tsoil 10, purple), soil moisture ((b), Msoil 10, blue) at 10 cm depth and precipitation ((c), mm).
Land 10 00975 g002
Figure 3. The diurnal pattern of ecosystem-scale CH4 flux from the subtropical forest in different seasons during 2016–2018. The red points show the average half-hourly flux at the same time in the month. January, April, July and October of each year represent the four seasons of spring, summer, autumn and winter. The data in February were used for spring 2016, as data from March to June were missing due to a lack of electrical power supply.
Land 10 00975 g003
Figure 4. Time series of half-hourly (gray circles), daily (red lines), weekly (blue lines) and monthly (dotted line) CH4 fluxes from 2016 to 2018.
Land 10 00975 g004
Figure 5. Annual emissions, uptake and net budget (g m−2) of CH4 flux in 2017 and 2018. Emissions represent the sum of all positive fluxes in the year, and uptake represents the sum of all negative fluxes. The net budget is the sum of emissions and uptake.
Land 10 00975 g005
Figure 6. Correlations between monthly CH4 flux (mg m−2 month−1) and (a) soil temperature at 10 cm of soil depth (Tsoil 10) and (b) soil moisture at 10 cm soil depth (Msoil 10) and the three-dimensional scatter plot (c) between monthly CH4 flux and Tsoil 10 and Msoil 10.
Land 10 00975 g006
Figure 7. Mechanisms of methane uptake and emissions between summer (a) and winter (b). “+”, positive contribution or stimulation; “−”, negative contribution or suppression. Since no measurement was made, the dotted line represents the possible effects.
Land 10 00975 g007
Table 1. Comparison of CH4 budgets in different ecosystems.
CountryLatitude/LongitudeClimateEcosystem TypeMethodsSampling PeriodDaily Average Flux (mg CH4 m−2 d−1)Annual Flux (g CH4 m−2 year−1)References
China21°57′ N, 101°12′ ETropicalPrimary rainforestChamberDry to wet season−0.944 ± 0.0096NA[35]
China21°55′ N, 101°16′ ETropicalSecondary forestChamberDry to wet season−0.8192 ± 0.0416[35]
China21°54′ N, 101°16′ ETropicalRubber plantationChamberDry to wet season−0.182.4 ± 0.016[35]
China23°11′ N, 112°33′ ETropicalForestChamberOne year−1.24201 ± 0.3287[73]
China23°10′ N, 112°33′ ESubtropicalPine-broadleaf forestChamberEvery quarter−0.44 ± 0.2133[72]
China30°20′ N, 119°26′ ESubtropicalevergreen and deciduous broad-leaved mixed forestECAll year−142~1451.15 ± 0.28~4.79 ± 0.49This study
USA45°15′ N, 68°44′ WSub-borealSpruce-fir forestECAll year0.329 ± 0.3230.12 ± 0.118[52]
China37°35′ N, 101°20′ ETibetan plateauAlpine grasslandECAll year61.826.4~33.8[44]
China31°31′ N, 121°57′ ESubtropicalSalt marshECAll year64.383 ± 10.95923.5 ± 4.0[42]
China22°29′ N, 114°01′ ESubtropicalMangroveECAll year32.055 ± 1.09611.7 ± 0.4[71]
Brazilian16°29′ S, 120°23′ ETropicalFlooded forestECAll year74.24627.1[76]
Publisher’s Note: MDPI stays neutral with regard to jurisdictional claims in published maps and institutional affiliations.

