
How Does Low-Density Urbanization Reduce the Financial Sustainability of Chinese Cities? A Debt Perspective


1
College of Urban Economics and Public Administration, Capital University of Economics and Business, Beijing 100070, China
2
School of Government, Central University of Finance and Economics, Beijing 100081, China
3
Key Laboratory of Geographic Information Science (Ministry of Education), East China Normal University, Shanghai 200241, China
4
School of Geographic Sciences, East China Normal University, Shanghai 200241, China
*
Author to whom correspondence should be addressed.
Land 2021, 10(9), 981; https://0-doi-org.brum.beds.ac.uk/10.3390/land10090981
Submission received: 9 August 2021
/
Revised: 2 September 2021
/
Accepted: 16 September 2021
/
Published: 17 September 2021
(This article belongs to the Special Issue Cities' Spatial Structure and Drivers of its Transformation)
Abstract
:Low-density urbanization threatens urban social and ecological sustainability not only directly by excessively encroaching on suburban farmland and ecological space, but may also indirectly do so by undermining the financial basis of sustainable urban development. To address this relationship, this study empirically examines the effect of low-density urbanization on local government debt by using panel data of prefecture-level cities in China from 2006 to 2015. Results show that the scale of local government debt increases significantly with a rise in urban expansion. Furthermore, this study found that low-density urbanization affects local government debt in two ways. First, low-density urban expansion reduces the land output efficiency, which decreases potential fiscal revenue and thus increases local government debt. Second, low-density urban expansion raises the construction and maintenance expenditure of urban infrastructure, which increases the demand for urban construction financing and thus pushes up the scale of debt. The results of the heterogeneous study indicate that low-density urbanization significantly affects local government debt mainly in Central/Western regions, small and medium-sized cities, cities with high fiscal stress and development pressure, and residentially expanding cities. On the contrary, low-density urbanization has no significant effect on the Eastern regions, large cities, cities with low fiscal stress and development pressure, and spatially expanding cities. This study theoretically explored and empirically verified a critical indirect effect of low-density urbanization on urban sustainability by increasing fiscal risks, which is, and will continue to be, a common and vital challenge faced by cities in China and other rapidly urbanizing developing countries.
1. Introduction
Urbanization is currently a prevalent phenomenon and a will be a dominant trend in the future globally [1,2,3,4]. According to the United Nations’ 2018 “World Urbanization Prospects”, the global level of urbanization was only 30% in 1950, which increased to 55% by 2018 and will continue to rise to 68% by 2050 [5]. In particular, China, India, and Nigeria are expected to contribute 35% of the urban population growth between 2018 and 2050. Urbanization is critical to urban economic growth and national wealth and can bring enormous benefits in terms of employment, education, innovation, welfare, and social structure [6,7,8,9,10]. However, rapid urbanization also imposes enormous human costs, such as environmental degradation, climate change, poverty, and inequality [11,12,13,14,15]. Therefore, how to achieve sustainable urbanization has become an important topic of concern for scholars and policymakers [16,17].
High- and low-density urbanizations exist. The latter is generally accompanied by low-density development, low land-use efficiency, a single urban function, and a very low intensity of human activity [18,19,20,21]. Research showed that low-density urban expansion and sprawl have become a dominant pattern of urban spatial growth worldwide [22,23,24,25,26]. In this regard, Asia and Africa have become the main areas of accelerated urban sprawl and expansion [27]. For this reason, low-density urbanization has attracted considerable attention from scholars and policymakers not only because of its intensity of progress but also its great environmental, social, and economic effects [18,28,29,30]. Examples of such effects include sharp declines in arable land, wildlife habitats, biodiversity [21,29], air pollution [31], the urban heat island effect [32], longer commuting distances, congestion [33], low rates of upward mobility [34], and wealth disparities [35].
Low-density urbanization has also become a common phenomenon in the urban development of China [26,36,37,38]. Since economic reform has opened China to the world market, China’s urbanization process has advanced rapidly. However, the growth rate of the urban population has been much slower than the expansion rate of the urban construction land area. From 1981 to 2018, the average annual growth rate of China’s urban population was 3.0%, whereas the average annual growth rate of urban construction land area reached 5.9%, which is nearly twice as large as the former. In the process of rapid urbanization, many Chinese cities have developed a crude expansion pattern [26,38,39]. Large-scale, low-density land development has met the demand for space for urban economic development to some extent during the period of rapid urbanization, but this brings with it a series of problems [29,40,41]. In particular, local government debt has become a widespread concern for policymakers and scholars. Local government debt has also further triggered an in-depth consideration of whether low-density expansion is a sustainable spatial growth model.
Compared to the high-density mode of urbanization, low-density urbanization is a considerably stronger driver of the rising local government debt. First, low-density expansion makes exploiting the externalities of economies of scale and agglomeration difficult. This case not only leads to the lower productivity of firms [42] but also reduces the efficiency of public finance spending [43,44]. Second, low-density expansion can significantly increase expenditure on urban infrastructure construction, management, and maintenance. Low-density urbanization expands the urban development skeleton and thus requires massive additional infrastructure, such as roads, networks, water, electricity, and sewer lines, to meet the needs of residents and firms far from the city center [45]. In addition, different regions in China still differ significantly in terms of development stage and policy orientation. Thus, the impact of low-density urbanization on local government debt varies across cities with different development stages, city sizes, and incentive levels.
This study takes rapidly urbanizing China as a case study to assess the impact of low-density urbanization on financial sustainability and explore the underlying mechanism from the perspective of local government debt. Specifically, the study aims to answer the following three questions: (1) Is low-density urbanization an important explanation for the increasing government debt of Chinese cities? (2) If this relationship exists, what is its underlying mechanism? (3) How does the impact of low-density urbanization on local government debt vary across cities? For example, is there any difference among cities with different development stages, population sizes, and fiscal pressures? The answers to these questions would be helpful to better understand the relationship between low-density urbanization and financial sustainability.
Based on this, using the panel data of prefecture-level cities in China from 2006 to 2015, this study empirically tests the relationship between low-density urbanization and local government debt. In addition, the study further analyzes the heterogeneity of the relationship between the two from the perspective of the development stage, city size, fiscal stress, development pressure, and urban expansion mode. The rest of the paper is organized as follows. Section 2 presents the background and analytical framework. Section 3 presents the research methodology and data sources. Section 4 presents the empirical regression results. Finally, Section 5 presents the conclusion and discussion.
2. Background and Analytical Framework
To understand the relationship between low-density urbanization and local government debt, the role of land should be understood. Unlike urban expansion driven by suburbanization in Western countries, China’s urban expansion is typically government-led and tightly tied to land development [37,46,47]. Due to rapid urbanization in China, cities require considerable new infrastructure to meet the needs of the inflowing population and industries. However, after the tax-sharing reform, a mismatch is observed between revenue and expenditure responsibilities for local governments, and they do not have enough revenue to support infrastructure construction [48,49,50]. Unlike Western cities, Chinese laws and regulations stipulate that local governments cannot directly issue bonds or take loans from banks. Under this background, Chinese local governments have found alternative ways to finance urban construction through integrated land development and operation [51,52,53]. On the one hand, local governments earn considerable revenues by directly granting the right to use state-owned land [54,55,56]. On the other hand, local governments inject land into Local Government Financing Platforms (LGFPs) to leverage funds to finance urban construction [51], and urban investment bonds are created in this process.
Urban investment bonds, also known as “quasi-municipal bonds”, are issued by the LGFP mainly for local infrastructure construction or public welfare projects [57,58]. The rapid growth of urban investment bonds in China has been driven by economic and population growth during the period of rapid urbanization to some extent. However, land development and the resulting urban expansion are also important reasons for the growth of urban investment bonds [59]. Most urban investment bonds are financed by mortgaging land. The general operation process of LGFP is that local governments initially allocate undeveloped land for free or lease land at low prices to the LGFP. The asset size of LGFP can be expanded, and then, they can use assets, mainly land, as collateral for financing [52,56,60]. The financing received by the LGFP is mainly used for land development, which generally requires the construction of roads, water supplies, power facilities, communication and drainage facilities, and gas and heating facilities. The local governments then buy back the developed land and put up for sale in the market. In this way, the model of “land injection–land mortgage–urban investment bonds–urban construction–land appreciation–land transfer–debt repayment” has become the most basic operation model for local governments to raise debt and finance infrastructure investment through LGFPs [55].
The rapid growth of urban investment bonds has its specific growth and demand-driven reasons, but land development is an important background for the growth of urban investment bonds. LGFPs usually use land-use rights as collateral or promise to repay bonds through land transfer fees when issuing urban investment bonds. According to a survey conducted by the National Audit Office in 2013, among the investigated municipal governments, the percentage of those promising to repay bonds with land transfer revenue was as high as 81%. Therefore, land as collateral is inevitably affecting the issuance of urban investment bonds for local governments. Although low-density urbanization can finance urban construction, this urban development model also exacerbates the expansion of local government debt and brings with it a series of risks.
First, compared to high-density urbanization, low-density urbanization dilutes the economic density of cities and weakens the economies of agglomeration and scale among industries, which in turn leads to lower urban productivity and lower tax revenues [42]. Then, local governments will undoubtedly seek alternative sources of revenue, resulting in higher municipal government debt. Local governments build industrial parks and new towns on a large scale in urban fringe areas [61,62]. However, the vast majority of development parks and new towns cannot attract the inflow of capital and population, which decreases the efficiency of infrastructure utilization, forms ineffective investment, and further leads to a waste of resources and worsens local debt [40,41]. Even when certain industrial parks can attract some investment, the construction density is often lower than that of the central city. Low-density urban expansion leads to a significant reduction in suburban land-use intensity, homogenization of land function, and decentralization of the layout of urban industrial activities [63,64]. As the economic density of cities is diluted, the agglomeration and spillover effects between industries are reduced. On the one hand, low-density urban expansion leads to increased commuting distances and costs, which raises the cost of face-to-face exchanges and thus reduces the resulting knowledge spillovers [65,66]. On the other hand, low-density urban expansion reduces the probability of matching production factors and the ability of division of labor and collaboration, which increases transaction costs and thus inhibits economic growth [42]. All of the above will result in lower fiscal revenues available to local governments, which in turn will seek to issue bonds to compensate for the decreased revenue. In contrast, high-density urbanization can further promote agglomeration economies, which can boost economic efficiency, generate considerable tax revenues, and thus reduce the reliance of local governments on debt.
Second, the low-density mode of urban expansion has increased the expenditure costs of municipal infrastructure construction and management and maintenance, further pushing up local government debt. On the one hand, urban expansion has led to an excessive increase in urban infrastructure. In the process of land development and construction, a large amount of new infrastructure, such as roads, networks, water, electricity, and sewer lines, need to be added at the urban fringe to meet the needs of residents and firms far from the city center [45]. To some extent, low-density urban expansion implies longer commuting distances and road miles, requiring more infrastructure investment. On the other hand, low-density urban expansion cannot effectively exploit the effects of agglomeration economies in the supply of public goods, which will raise the cost of public service provision [43,44]. Research has shown that urban expansion raises the average annual cost of public services by approximately 8% [67]. Conversely, the compact urban development pattern contributes to lower costs of public service provision and maintenance [68]. Therefore, compared to high-density urbanization, low-density urbanization further increases urban maintenance and construction costs, which in turn pushes up local government debt.
Notably, different regions in China vary significantly in terms of their development stage, policy bias, incentive level, and development mode. Thus, the effect of low-density urbanization on local government debt varies across cities at different development levels, scales, incentive degrees, and expansion patterns. From the perspective of heterogeneity of the development stage, some cities have better development foundations and relatively mature infrastructure construction. On the contrary, some cities are relatively lagging and need to build a large amount of new infrastructure, which leads to a higher demand for construction funds. In terms of policy bias, some cities have relatively abundant urban construction land quotas, making the use of land-based financing strategies easier. By contrast, some cities are extremely constrained by urban construction land quotas, making carrying out land-based financing strategies more difficult [69]. In terms of the incentive level, some cities face greater fiscal stress or development pressure and have stronger incentives to raise debt to relieve fiscal stress or promote development. In terms of development modes, some urban expansion is dominated by the construction of industrial parks and industrial suburbanization, whereas others are dominated by residential suburbanization. These differences can lead to heterogeneity in the effect of low-density urbanization on local government debt.
Based on the above discussion, three working hypotheses were proposed to test the impact of low-density urbanization on the financial sustainability of Chinese cities.
H1.
Low-density urbanization is positively associated with local government debt.
H2.
The impact of low-density urbanization on local government debt is heterogeneous across cities with different development stages, population sizes, and fiscal stresses.
H3.
Low-density urbanization increases local government debt mainly by reducing land output efficiency and increasing urban construction and maintenance expenditure.
3. Research Methods and Data Sources
3.1. Model and Variables
To test the effect of low-density urbanization on local government debt, the following model is constructed:
where is the local government debt situation of city c in year t. In this study, we refer to Pan et al. who measured local government debt on the scale of urban investment bonds [51]. represents the degree of low-density urbanization of city c in year t. Earlier scholars mostly used population density in built-up areas or the speed of urban land expansion to measure urban expansion. However, they can only approximately measure the general situation of low-density urban expansion but cannot reflect the spatial variability of population distribution within cities. In this study, we use the following indicator to measure urban expansion. This measure is a very commonly used method of defining the level of low-density urbanization [42,70].
where L and H represent the proportion of the urban population in the built-up area where population density is below and above the national average, respectively. We call this proportion of the urban population the residential expansion index and denote it by UE_pop. Unlike urban expansion in Western countries where residential suburbanization is the main driver, industrial suburbanization in China, led by industrial park development, is another important form of urban expansion. Therefore, this study applies the above formula and further calculates the spatial expansion index based on the area, where L and H represent the proportion of the urban built-up area with population density below and above the national average, respectively. We call this proportion the spatial expansion index and denote it by UE_area. Finally, based on the residential and spatial expansion indices calculated above, the square root of the product of the two indices is calculated to reflect the comprehensive expansion of the city. There is no specific threshold to distinguish whether a city experienced high-density urbanization or low-density urbanization. However, it is reasonable to say that the larger the value of the indices in a city, the more area of the city is below the national average urban population density, and we consider the city to have more low-density urbanization. represents other socio-economic characteristics of the city. is the city fixed effect, is the year fixed effect, and is the random disturbance term.
In addition, this study controls for the effects of the following socio-economic characteristics on local government debt: (1) GDP per capita, which represents the level of industrialization and urbanization of a city. There is no reliable indicator of urbanization levels with annually accessible and comparable data in China. However, it has been widely recognized that GDP per capita shows a high positive correlation with the level of urbanization and is a proper proxy for the latter [71,72]. Therefore, this paper uses GDP per capita as indicators reflecting not only the level of economic development, but also the process of urbanization. (2) Population size, which is measured using the urban residential population [73]. (3) Urban industrial structure, which is measured using the proportion of secondary and tertiary industries. (4) Land finance, which is measured using the ratio of land transfer fees to local public budget revenue [74]. Table 1 shows the variables and definitions.
To test the regional heterogeneity of low-density urbanization on local government debt, this study divides the sample into Eastern cities and Central/Western cities. To test the heterogeneity of city size, this study defines cities with a residential population of more than 1 million in the city’s municipal district in 2006 as large cities and those with less than 1 million as small and medium-sized cities according to the State Council’s classification standards for cities. To test the heterogeneity of fiscal stress, this study adopts (fiscal expenditure − fiscal revenue)/fiscal revenue as an indicator of fiscal stress [75] and divides the sample into cities with higher fiscal stress and cities with lower fiscal stress according to the average fiscal stress of cities during the sample period. To test the heterogeneity of development pressure, this study divides the sample into cities with high development pressure and cities with low development pressure. If the per capita GDP of a city is less than the average value of all cities within the province, then the city is classified as having higher development pressure, and lower development pressure if otherwise. To test the heterogeneity of expansion mode, this study classifies urban expansion modes into residential and spatial expansion modes and uses the ratio of UE_area to UE_pop as indicators of urban expansion modes. As the ratio increases, the urban expansion mode tends more towards spatial expansion, whereas as the ratio decreases, the urban expansion mode tends more towards residential expansion. Taking the average value of this indicator as the dividing line, this study divides the sample cities into residential and spatial expansion-dominated cities.
3.2. Data Sources
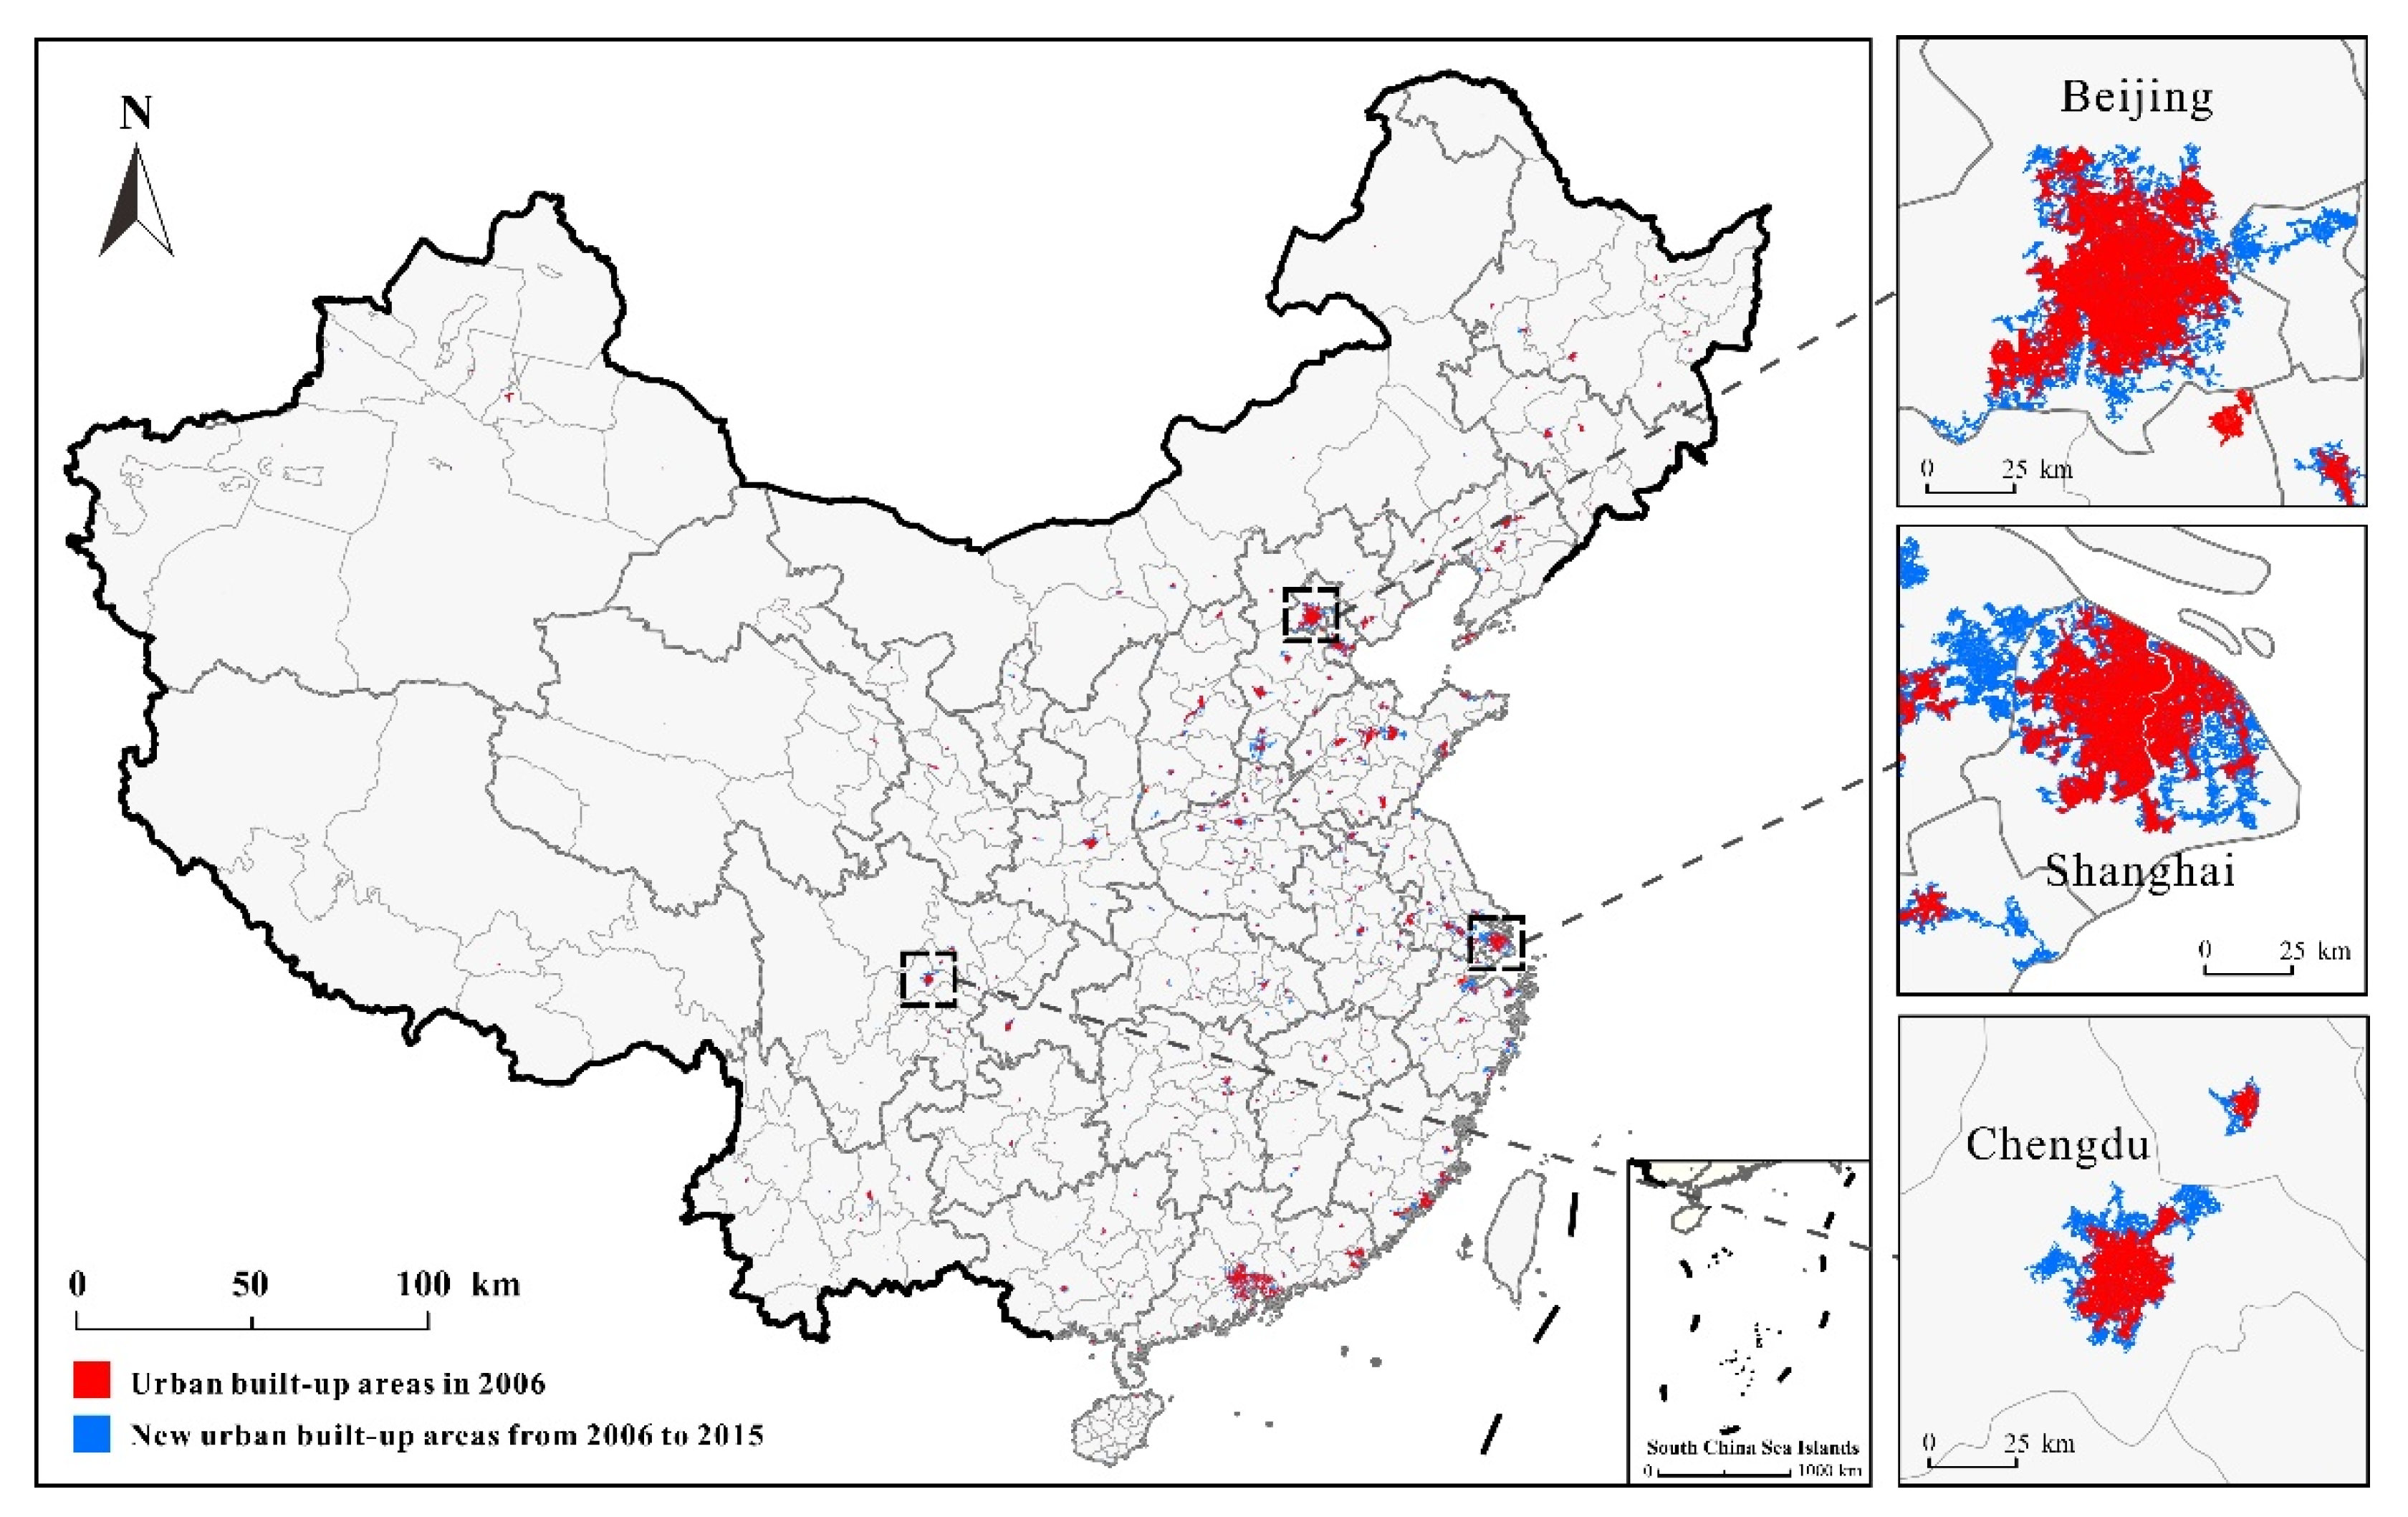
This study takes 281 prefecture-level cities over a total of 10 years from 2006 to 2015 as the research object (Figure 1). Chinese cities are defined from an administrative perspective, which makes them inconsistent with cities in Western countries. Unlike Western countries, Chinese cities have a much larger administrative territory than their physical territory. To promote the coordinated development of surrounding urban areas, China implemented a system of cities leading counties (shidaixian) or cities administering counties (shiguanxian), which can be traced back to the 1950s [76,77]. This system requires prefecture-level cities to manage suburban counties, which are characterized by rural land and agricultural populations [77,78]. Therefore, Chinese prefecture-level cities include urban and rural areas within their administrative jurisdiction, and the proportion of urban building land is very low [79]. Several empirical studies of urban expansion in China have also shown that the administrative territories of Chinese cities are much larger than their physical territories [79,80]. In addition, the administrative jurisdiction of prefecture-level cities covers the entire national territory, and each prefecture-level city government manages the spatial expansion of built-up areas within its jurisdiction. Therefore, this study identifies urban built-up areas within the administrative boundaries of prefecture-level cities.
The required data mainly include urban investment bond data, urban expansion data, and other urban socio-economic data. The data of urban investment bonds are extracted from the collation of Cao et al. [81]. Urban socio-economic data are obtained from the China Urban Statistical Yearbook, the China Land and Resources Statistical Yearbook, and the China Urban Construction Statistical Yearbook. To exclude the influence of price factors and make the data comparable, all variables counted in the nominal monetary value are converted to real value using the Consumer Price Index (with 2015 as the base period) in the subsequent empirical analysis, such as urban investment bonds, GDP per capita, and land transfer fee.
The urban expansion index was calculated based on MODIS Global Urban Extent Product (MGUP) data [27] and WorldPop global population density data (http://www.worldpop.org, accessed on 12 February 2021). First, this study uses MGUP data to identify the largest patches within the administrative boundaries of each city as urban built-up areas. Then, the study combines the MGUP with the Worldpop data to calculate the average population density of all urban built-up areas in the country, which was used to delineate the high- and low-density urban areas [27,82,83]. Compared with other urban boundary raster datasets, MGUP has a higher resolution (265 m), which helps to accurately distinguish urban and other land types [27]. MGUP has been validated to be more than 90% accurate in identifying urban boundaries in multiple scenarios [84]. In addition, MGUP can provide long and continuous observation time series (2001–2018), which guarantees the comparability and continuity of the study results. As a class of data reflecting the spatial distribution of populations, Worldpop data have higher estimation accuracy and longer duration than other gridded population spatial distribution data. Moreover, Worldpop data are a better choice for measuring the spatial distribution of urban populations and their evolution [85]. Table 2 shows the descriptive statistics of the main variables.
4. Empirical Analysis
4.1. Benchmark Regression Results
This study uses panel model fixed effects for the regressions. Table 3 reports the results of the benchmark regressions. Columns (1), (3), and (5) show the results of the regressions without the addition of control variables, and columns (2), (4), and (6) present the results of the regressions with the addition of control variables. The coefficient of the effect of low-density urbanization on local government debt is significantly positive in all regressions. This result is consistent with the previous arguments that low-density urban expansion leads to an increase in local government debt.
Population size is significantly and positively correlated with local government debt, which means that local governments issue more bonds as the size of cities increase. GDP per capita, which reflects the level of urban economic development and the process of urbanization, is highly and positively correlated with local government debt. This means that as the level of urbanization rises, local government debt also increases. It is notable that, after controlling for the effect of urbanization, the indicators reflecting low-density urbanization remain significantly positively correlated with local government debt. That is, low-density urbanization can further lead to an increase in local government debt. An increase in the share of the secondary industry significantly reduces the size of local government debt, whereas a rise in the share of the tertiary industry significantly increases the size of local government debt. One possible reason is that cities with a developed tertiary industry have a higher demand for commercial and residential land, which will push up the price for both types of land. Higher land prices enable LGFP to further expand its asset size and obtain more collateral when issuing bonds, which in turn increases the size of the urban investment bonds. The coefficient of land finance is significantly negative. Local governments finance urban development and construction mainly from land transfer fees and urban investment bonds issued by LGFP, so a certain substitution relationship exists between the two. When the scale of land finance is relatively large, local governments do not need to issue additional bonds for financing.
4.2. Robustness Test
To more accurately measure the effect of low-density urbanization on local government debt, we conduct two robustness tests. The first is to exclude the sample of sub-provincial and provincial capital cities. Considering that sub-provincial and provincial capital cities have greater political power in obtaining resources, they are more likely to issue bonds under the same circumstances. In addition, the bonds issued by provincial capital cities may be used throughout the province, so their scale cannot be simply attributed to provincial capital cities. Therefore, we exclude sub-provincial and provincial capital cities from the regressions. Second, we exclude cities that have not issued urban investment bonds in the sample period. Considering that the issuance of urban investment bonds is subject to certain conditions, some cities cannot issue bonds because they do not meet the requirements. For example, the issuance amount cannot exceed 60% of the total project investment. Therefore, we exclude cities that did not issue urban investment bonds during the sample period and conduct further regressions. Table 4 shows the results of the regressions. The results show that no substantial change occurs for the two robustness tests, indicating that low-density expansion has exacerbated government debt.
4.3. Heterogeneity Analysis
4.3.1. Regional Heterogeneity
To test the regional heterogeneity of low-density urbanization on local government debt, this study divides the sample into Eastern and Central/Western regions for regressions separately. Columns (1)–(6) of Table 5 show the regression results. The results show that low-density urban expansion on local government debt is significantly positive only in the Central/Western regions and insignificant in the Eastern region. This has two possible explanations. First, differences exist in the development stages of the Eastern and Central/Western regions. The industrialization and urbanization process in the Eastern region is more advanced, and the construction of urban infrastructure is relatively mature. By contrast, the Central/Western regions are relatively underdeveloped and have a higher demand for the construction of urban infrastructure. Although the Chinese central government has given more transfer payments and special investment to the Central/Western regions for infrastructure, the fiscal revenue is still not enough to sustain such a large amount of construction of infrastructure for the Central/Western regions. Therefore, the Central/Western regions are more likely to carry out land-based financing strategies. Second, land supply policy differs between Eastern and Central/Western regions, leading to differences in the difficulty of implementing land-based financing strategies in the two types of regions. Chinese cities need to obtain an urban construction land quota for land development, so a relatively abundant supply of land is necessary for low-density urbanization. The urban construction land quota is allocated from the top down. However, the central government has implemented a land policy that favors the Central/Western regions since 2003 [69]. Between 2006 and 2015, the proportion of land supply in the Central/Western regions rose from 37% to 66.5%. Adequate land supply in the Central/Western regions provides space for low-density urban expansion.
4.3.2. Heterogeneity of the City Sizes
This study further examines whether the effect of low-density urbanization on local government debt is heterogeneous because of the differences in city size. Based on the classification mentioned above, this study conducts new regressions, and columns (7)–(12) of Table 5 show the results. The effect of low-density urbanization on local government debt is significantly positive in small and medium-sized cities but not in large cities. The possible reasons are similar to the above. Since 2003, the central government’s land policy is heavily tilted toward small and medium-sized cities. Adequate land supply provides the conditions for small and medium-sized cities to implement low-density expanding growth.
4.3.3. Heterogeneity of Fiscal Stress
Numerous studies pointed out that fiscal stress is also an important cause of local government debt. Columns (1)–(6) of Table 6 present the results, indicating that low-density urbanization in cities with higher fiscal stress significantly increases local government debt. On the contrary, low-density urbanization in cities with lower fiscal stress has no significant effect on local government debt. Since the tax-sharing reform, a mismatch exists in the distribution of fiscal revenues and expenditure responsibilities between the central and local governments. Local governments have to face several fiscal expenditures with a smaller amount of fiscal revenues, thereby creating huge fiscal stress. When local governments are under fiscal stress, policymakers often prefer to resort to off-budget revenues. Therefore, the effect of low-density urbanization on local government debt is significant in regions with higher fiscal stress.
4.3.4. Heterogeneity of Development Pressure
Development pressure is also an incentive that affects local government debt. This study divides the sample into two categories. Columns (7)–(12) of Table 6 show the regression results. Low-density urbanization in cities with higher development pressure significantly increases local government debt, whereas low-density urbanization in cities with lower development pressure has no significant effect on local government debt. The economic performance-based promotion mechanism has triggered officials to “compete for growth,” resulting in regional development pressure. Some studies have found that, under developmental pressure, local officials consider not only their own debt size and economic conditions when formulating their own debt financing strategies but also the debt-raising behavior of other regions. This phenomenon is more pronounced in regions with higher development pressure. Therefore, cities with higher development pressure have more incentives to acquire land through urban expansion and facilitate debt issuance.
4.3.5. Heterogeneity of Urban Expansion Mode
This study further examines whether differences in urban expansion modes lead to heterogeneity in the effect of urban expansion on local government debt. Table 7 shows the regression results. That is, low-density urban expansion leads to an increase in local government debt only in residential expansion-dominated cities, whereas the effect of urban expansion on local government debt is not significant in spatial expansion-dominated cities. The possible reason is that residential expanding cities are dominated by commercial and residential land development, whereas spatially expanding cities are dominated by industrial land development. Evidently, the price and the resulting mortgage value of commercial and residential land are much higher than that of industrial land. As LGFP usually pledges land as collateral and commits to using land transfer fees as a source of repayment for urban investment bonds, residential expanding cities can obtain additional financing, and the scale of urban investment bonds is larger.
4.4. Mechanism Analysis
To test the effect of low-density urbanization on land output efficiency, this study uses the output value of non-agricultural GDP per unit of built-up area in cities to measure land output efficiency. This study also empirically tests the effect of low-density urban expansion on land output efficiency. Table 8 presents the regression results. That is, low-density urban expansion significantly reduces the output efficiency of urban land, which is consistent with the previous arguments.
Furthermore, this study verifies the effect of low-density urbanization on urban infrastructure maintenance and construction expenditure. The regressions were conducted using urban maintenance and construction funds and fixed asset investment in municipal facilities as the explanatory variables, respectively. Table 9 shows the results. All types of urban expansion indices significantly increase both types of expenditure. As mentioned in the previous section, the urban expansion process requires considerable new urban roads, electricity, gas, heating networks, water supply and drainage, and other infrastructure. As China’s public budget is mainly used for daily operating expenditure, issuing bonds through LGFP has been an important source for local governments to obtain off-budget urban construction investments.
5. Discussion and Conclusions
Financial support is crucial for urban sustainable development; nevertheless, the prevailing low-density mode of urbanization has been undermining this fiscal basis of urban sustainability across the world. This study empirically examines the influence of low-density urbanization on local government debt by using panel data of prefecture-level cities in China from 2006 to 2015. The results confirmed the correlation, revealed its underlying mechanisms, and illustrated its multi-dimensional heterogeneities across cities. It is firstly found that the scale of local government debt increases significantly with the increase in low-density urban expansion. Moreover, this study found that low-density urban expansion affects local government debt in two ways. On the one hand, low-density urban expansion reduces the land output efficiency, which reduces potential fiscal revenue and thus increases local government debt. On the other hand, low-density urban expansion increases construction and maintenance expenditure of urban infrastructure, which increases the demand for urban construction financing and thus pushes up the scale of debt. Furthermore, the results of the heterogeneous study show that the effect of low-density urbanization on local government debt is significant mainly in the Central/Western regions, small and medium-sized cities, cities with high fiscal stress and development pressure, and residential expanding cities. On the contrary, no significant effect is observed in the Eastern regions, large cities, cities with low fiscal stress and development pressure, and spatially expanding cities. These empirical results enable us to better understand relevant academic and practical issues.
Scholars and policymakers contemplated and tried to answer the question “Is low-density urban expansion sustainable?”. Existing studies mostly investigated the impact of low-density urbanization on sustainability from an ecological perspective [21,29,31,32]. However, finance is the core foundation that underpins urban development, and financial risks can affect the environmental, social, and economic aspects of cities. As emphasized in the New Urban Agenda, sustainable financial support is the key to achieving sustainable urban development [86]. The Urban Sustainability Framework released by the World Bank also lists finance as one of six key dimensions of urban sustainability [87]. This study dealing with the effect of low-density urbanization on fiscal sustainability successfully links the low-density mode of urbanization with urban sustainability through the intermediate logic node of fiscal sustainability measured by local government debt. Two implications are noteworthy for future studies and policy-making. On the one hand, the financial consequences should not be ignored in assessing the impact of low-density urbanization or urban sprawl for its vital role in supporting long-term sustainable development of cities. On the other hand, the density issue of urbanization deserves the continuous attention of researchers and policy-makers for its fundamental role in determining the financial and subsequent social and ecological aspects of sustainable development of cities.
This study reveals that the effect of low-density urbanization on fiscal sustainability varies across different urban development patterns. It indicates that a reasonable and effective configuration of urban functions in the suburb may be as important as the density issue in urban spatial governance. With continuous urbanization, urban expansion has become an important part of urbanization and urban development [18,23,24,26]. To meet the needs of growing urban populations, urban spatial expansion has become an inevitable trend [19,30]. However, the effect of urban expansion on local government debt is highly associated with urban development patterns. Urban spatial expansion led by industrial park construction does not significantly affect local government debt, whereas that led by residential and commercial land development significantly increases the level of local government debt. The results of this case study may not be universally suitable. However, they remind us of the importance of urban functions and their interactions in the suburbs when discussing the density or other spatial issues of urban development. An integrated consideration of urban space and function is very likely to broaden our view and deepen our understanding of urbanization paths. It will also be insightful for urban policymakers faced with various challenges.
The effect of low-density urban sprawl on the fiscal sustainability of cities is heterogeneous, which means that different cities require varying development paths and coping strategies. Land may be the most effective policy instrument in the case of China’s urban governance. In some large and more developed cities, where population and industries continue to cluster now and in the future, the growth of population and economic activities inevitably bring demand for land [19,30]. Therefore, reasonable urban spatial expansion is worthy of recognition, and this trend should be followed by allocating more urban land quotas at the national level to large and developed cities as advocated by many scholars [88]. As for some small and medium-sized cities and less developed cities with continuous outflow of population and industries, blind urban expansion should be strictly controlled. Beyond China, heterogeneity may exist in some aspects while not in others; the most useful tool may also vary significantly. However, two basic principles implied by this study are noteworthy. One is the necessity of the heterogeneity perspective in the entire process of urban policymaking and the other is the need for accurate urban problem identification via theoretical enquires and empirical studies prior to policymaking.
Author Contributions
Conceptualization, Y.Y. and H.L.; methodology, Y.Y., H.L., N.W. and S.Y.; software, N.W. and S.Y.; validation, Y.Y., N.W. and S.Y.; formal analysis, Y.Y. and H.L.; data curation, Y.Y., N.W., and S.Y.; writing—original draft preparation, Y.Y. and H.L.; writing—review and editing, Y.Y. and H.L.; visualization, N.W.; supervision, Y.Y. and H.L.; project administration, Y.Y.; funding acquisition, Y.Y. All authors have read and agreed to the published version of the manuscript.
Funding
This research was funded by the Social Science Foundation of Beijing, China (20JCC019); the Fund of the Peking University-Lincoln Institute Center on Urban Development and Land Policy (F01-20201020-YY); and the Fundamental Research Funds for the Capital University of Economics and Business (QNTD202009).
Institutional Review Board Statement
Not applicable.
Informed Consent Statement
Not applicable.
Data Availability Statement
The data presented in this study are publicly available as explained in the main text.
Conflicts of Interest
The authors declare no conflict of interest.
References
- Antrop, M. Landscape change and the urbanization process in Europe. Landsc. Urban Plan. 2004, 67, 9–26. [Google Scholar] [CrossRef]
- Cohen, B. Urbanization in developing countries: Current trends, future projections, and key challenges for sustainability. Technol. Soc. 2006, 28, 63–80. [Google Scholar] [CrossRef]
- Brenner, N. Theses on urbanization. Public Cult. 2013, 25, 85–114. [Google Scholar] [CrossRef]
- Ritchie, H.; Roser, M. Urbanization. Our World in Data. 2019. Available online: https://ourworldindata.org/urbanization (accessed on 30 May 2021).
- United Nations. World Urbanization Prospects: The 2018 Revision; United Nations: New York, NY, USA, 2019; Available online: https://population.un.org/wup/Publications/Files/WUP2018-Report.pdf (accessed on 25 March 2021).
- Faria, J.R.; Mollick, A. Urbanization, economic growth, and welfare. Econ. Lett. 1996, 52, 109–115. [Google Scholar] [CrossRef]
- Vlahov, D.; Galea, S. Urbanization, urbanicity, and health. J. Urban Health 2002, 79, S1–S12. [Google Scholar] [CrossRef] [PubMed] [Green Version]
- Bertinelli, L.; Black, D. Urbanization and growth. J. Urban Econ. 2004, 56, 80–96. [Google Scholar] [CrossRef]
- Andersson, R.; Quigley, J.M.; Wilhelmsson, M. Urbanization, productivity, and innovation: Evidence from investment in higher education. J. Urban Econ. 2009, 66, 2–15. [Google Scholar] [CrossRef] [Green Version]
- Sato, Y.; Zenou, Y. How urbanization affect employment and social interactions. Eur. Econ. Rev. 2015, 75, 131–155. [Google Scholar] [CrossRef] [Green Version]
- Ravallion, M.; Chen, S.; Sangraula, P. New evidence on the urbanization of global poverty. Popul. Dev. Rev. 2007, 33, 667–701. [Google Scholar] [CrossRef] [Green Version]
- Satterthwaite, D. The implications of population growth and urbanization for climate change. Environ. Urban. 2009, 21, 545–567. [Google Scholar] [CrossRef] [Green Version]
- Shahbaz, M.; Sbia, R.; Hamdi, H.; Ozturk, I. Economic growth, electricity consumption, urbanization and environmental degradation relationship in United Arab Emirates. Ecol. Indic. 2014, 45, 622–631. [Google Scholar] [CrossRef]
- Oleson, K.W.; Monaghan, A.; Wilhelmi, O.; Barlage, M.; Brunsell, N.; Feddema, J.; Hu, L.; Steinhoff, D.F. Interactions between urbanization, heat stress, and climate change. Clim. Chang. 2015, 129, 525–541. [Google Scholar] [CrossRef]
- Capps, K.A.; Bentsen, C.N.; Ramírez, A. Poverty, urbanization, and environmental degradation: Urban streams in the developing world. Freshw. Sci. 2016, 35, 429–435. [Google Scholar] [CrossRef]
- De Jong, M.; Joss, S.; Schraven, D.; Zhan, C.; Weijnen, M. Sustainable–smart–resilient–low carbon–eco–knowledge cities; making sense of a multitude of concepts promoting sustainable urbanization. J. Clean. Prod. 2015, 109, 25–38. [Google Scholar] [CrossRef] [Green Version]
- Tan, Y.; Xu, H.; Zhang, X. Sustainable urbanization in China: A comprehensive literature review. Cities 2016, 55, 82–93. [Google Scholar] [CrossRef]
- Camagni, R.; Gibelli, M.C.; Rigamonti, P. Urban mobility and urban form: The social and environmental costs of different patterns of urban expansion. Ecol. Econ. 2002, 40, 199–216. [Google Scholar] [CrossRef]
- Liu, J.; Zhan, J.; Deng, X. Spatio-temporal patterns and driving forces of urban land expansion in China during the economic reform era. AMBIO A J. Hum. Environ. 2005, 34, 450–455. [Google Scholar] [CrossRef]
- Poelmans, L.; Van Rompaey, A. Complexity and performance of urban expansion models. Comput. Environ. Urban Syst. 2010, 34, 17–27. [Google Scholar] [CrossRef]
- Güneralp, B.; Seto, K.C. Futures of global urban expansion: Uncertainties and implications for biodiversity conservation. Environ. Res. Lett. 2013, 8, 14025. [Google Scholar] [CrossRef]
- Galster, G.; Hanson, R.; Ratcliffe, M.R.; Wolman, H.; Coleman, S.; Freihage, J. Wrestling sprawl to the ground: Defining and measuring an elusive concept. Hous. Policy Debate 2001, 12, 681–717. [Google Scholar] [CrossRef]
- Batisani, N.; Yarnal, B. Urban expansion in Centre County, Pennsylvania: Spatial dynamics and landscape transformations. Appl. Geogr. 2009, 29, 235–249. [Google Scholar] [CrossRef]
- Angel, S.; Parent, J.; Civco, D.L.; Blei, A.; Potere, D. The dimensions of global urban expansion: Estimates and projections for all countries, 2000–2050. Prog. Plan. 2011, 75, 53–107. [Google Scholar] [CrossRef]
- Arribas-Bel, D.; Nijkamp, P.; Scholten, H. Multidimensional urban sprawl in Europe: A self-organizing map approach. Comput. Environ. Urban Syst. 2011, 35, 263–275. [Google Scholar] [CrossRef] [Green Version]
- Zhao, S.; Zhou, D.; Zhu, C.; Sun, Y.; Wu, W.; Liu, S. Spatial and temporal dimensions of urban expansion in China. Environ. Sci. Technol. 2015, 49, 9600–9609. [Google Scholar] [CrossRef] [PubMed]
- Huang, X.; Huang, J.; Wen, D.; Li, J. An updated MODIS global urban extent product (MGUP) from 2001 to 2018 based on an automated mapping approach. Int. J. Appl. Earth Obs. Geoinf. 2021, 95, 102255. [Google Scholar] [CrossRef]
- Redman, C.L.; Jones, N.S. The environmental, social, and health dimensions of urban expansion. Popul. Environ. 2005, 26, 505–520. [Google Scholar] [CrossRef]
- Zhao, S.; Da, L.; Tang, Z.; Fang, H.; Song, K.; Fang, J. Ecological consequences of rapid urban expansion: Shanghai, China. Front. Ecol. Environ. 2006, 4, 341–346. [Google Scholar] [CrossRef]
- Wei, W.Y.D.; Ewing, R. Urban expansion, sprawl and inequality. Landsc. Urban Plan. 2018, 177, 259–265. [Google Scholar] [CrossRef]
- Mou, Y.; Song, Y.; Xu, Q.; He, Q.; Hu, A. Influence of urban-growth pattern on air quality in China: A study of 338 cities. Int. J. Environ. Res. Public Health 2018, 15, 1805. [Google Scholar] [CrossRef] [Green Version]
- Lemonsu, A.; Viguie, V.; Daniel, M.; Masson, V. Vulnerability to heat waves: Impact of urban expansion scenarios on urban heat island and heat stress in Paris (France). Urban Clim. 2015, 14, 586–605. [Google Scholar] [CrossRef]
- Zhao, P. Sustainable urban expansion and transportation in a growing megacity: Consequences of urban sprawl for mobility on the urban fringe of Beijing. Habitat Int. 2010, 34, 236–243. [Google Scholar] [CrossRef]
- Ewing, R.; Hamidi, S.; Grace, J.B.; Wei, Y.D. Does urban sprawl hold down upward mobility? Landsc. Urban Plan. 2016, 148, 80–88. [Google Scholar] [CrossRef] [Green Version]
- Lee, W.H.; Ambrey, C.; Pojani, D. How do sprawl and inequality affect well-being in American cities? Cities 2018, 79, 70–77. [Google Scholar] [CrossRef] [Green Version]
- Ji, C.Y.; Liu, Q.; Sun, D.; Wang, S.; Lin, P.; Li, X. Monitoring urban expansion with remote sensing in China. Int. J. Remote Sens. 2001, 22, 1441–1455. [Google Scholar] [CrossRef]
- Han, S.S. Urban expansion in contemporary China: What can we learn from a small town? Land Use Policy 2010, 27, 780–787. [Google Scholar] [CrossRef]
- Zhang, Q.; Su, S. Determinants of urban expansion and their relative importance: A comparative analysis of 30 major metropolitans in China. Habitat Int. 2016, 58, 89–107. [Google Scholar] [CrossRef]
- Li, G.; Sun, S.; Fang, C. The varying driving forces of urban expansion in China: Insights from a spatial-temporal analysis. Landsc. Urban Plan. 2018, 174, 63–77. [Google Scholar] [CrossRef]
- Yu, H. China’s “ghost cities”. East Asian Policy 2014, 6, 33–43. [Google Scholar] [CrossRef]
- Jin, X.; Long, Y.; Sun, W.; Lu, Y.; Yang, X.; Tang, J. Evaluating cities’ vitality and identifying ghost cities in China with emerging geographical data. Cities 2017, 63, 98–109. [Google Scholar] [CrossRef]
- Fallah, B.N.; Partridge, M.D.; Olfert, M.R. Urban sprawl and productivity: Evidence from US metropolitan areas. Pap. Reg. Sci. 2011, 90, 451–472. [Google Scholar] [CrossRef]
- Hortas-Rico, M.; Solé-Ollé, A. Does urban sprawl increase the costs of providing local public services? Evidence from Spanish municipalities. Urban Stud. 2010, 47, 1513–1540. [Google Scholar] [CrossRef] [Green Version]
- Goodman, C.B. The fiscal impacts of urban sprawl: Evidence from US county areas. Public Budg. Financ. 2019, 39, 3–27. [Google Scholar] [CrossRef] [Green Version]
- Bo, C.; Xu, H.; Liu, Y. Examination of the relationships between urban form and urban public services expenditure in China. Adm. Sci. 2017, 7, 39. [Google Scholar] [CrossRef] [Green Version]
- Feng, J.; Zhou, Y.; Wu, F. New trends of suburbanization in Beijing since 1990: From government-led to market-oriented. Reg. Stud. 2008, 42, 83–99. [Google Scholar] [CrossRef] [Green Version]
- Shen, X.; Wang, L.; Wang, X.; Zhang, Z.; Lu, Z. Interpreting non-conforming urban expansion from the perspective of stakeholders’ decision-making behavior. Habitat Int. 2019, 89, 102007. [Google Scholar] [CrossRef]
- Uchimura, H.; Jütting, J.P. Fiscal decentralization, Chinese style: Good for health outcomes? World Dev. 2009, 37, 1926–1934. [Google Scholar] [CrossRef] [Green Version]
- Shen, C.; Jin, J.; Zou, H.F. Fiscal decentralization in China: History, impact, challenges and next steps. Ann. Econ. Financ. 2012, 13, 1–51. [Google Scholar]
- Jia, J.; Guo, Q.; Zhang, J. Fiscal decentralization and local expenditure policy in China. China Econ. Rev. 2014, 28, 107–122. [Google Scholar] [CrossRef]
- Pan, F.; Zhang, F.; Zhu, S.; Wójcik, D. Developing by borrowing? Inter-jurisdictional competition, land finance and local debt accumulation in China. Urban Stud. 2017, 54, 897–916. [Google Scholar] [CrossRef]
- Ji, Y.; Guo, X.; Zhong, S.; Wu, L. Land financialization, Uncoordinated Development of Population Urbanization and Land Urbanization, and Economic Growth: Evidence from China. Land 2020, 9, 481. [Google Scholar] [CrossRef]
- Feng, Y.; Wu, F.; Zhang, F. Changing roles of the state in the financialization of urban development through chengtou in China. Reg. Stud. 2021, 1–12. [Google Scholar] [CrossRef]
- Cao, G.; Feng, C.; Tao, R. Local “land finance” in China’s urban expansion: Challenges and solutions. China World Econ. 2008, 16, 19–30. [Google Scholar] [CrossRef]
- Zheng, H.; Wang, X.; Cao, S. The land finance model jeopardizes China’s sustainable development. Habitat Int. 2014, 44, 130–136. [Google Scholar] [CrossRef]
- Wu, F. Land financialisation and the financing of urban development in China. Land Use Policy 2019, 104412. [Google Scholar] [CrossRef]
- Li, J.; Chiu, L.H.R. Urban investment and development corporations, new town development and China’s local state restructuring–the case of Songjiang new town, Shanghai. Urban Geogr. 2018, 39, 687–705. [Google Scholar] [CrossRef]
- Liu, Z. Municipal finance and property taxation in China. In Local Public Finance and Capacity Building in Asia, OECD Fiscal Federalism Studies; Kim, J., Dougherty, S., Eds.; OECD Publishing: Paris, France, 2021. [Google Scholar] [CrossRef]
- Zhang, J.; Li, L.; Yu, T.; Gu, J.; Wen, H. Land assets, urban investment bonds, and local governments’ debt risk, China. Int. J. Strateg. Prop. Manag. 2021, 25, 65–75. [Google Scholar] [CrossRef]
- Guo, S.; Shi, Y. Infrastructure investment in China: A model of local government choice under land financing. J. Asian Econ. 2018, 56, 24–35. [Google Scholar] [CrossRef]
- Fang, Y.; Pal, A. Drivers of urban sprawl in urbanizing China—A political ecology analysis. Environ. Urban. 2016, 28, 599–616. [Google Scholar] [CrossRef] [Green Version]
- Tian, L.; Ge, B.; Li, Y. Impacts of state-led and bottom-up urbanization on land use change in the peri-urban areas of Shanghai: Planned growth or uncontrolled sprawl? Cities 2017, 60, 476–486. [Google Scholar] [CrossRef]
- Xiao, J.; Shen, Y.; Ge, J.; Tateishi, R.; Tang, C.; Liang, Y.; Huang, Z. Evaluating urban expansion and land use change in Shijiazhuang, China, by using GIS and remote sensing. Landsc. Urban Plan. 2006, 75, 69–80. [Google Scholar] [CrossRef]
- Ma, Y.; Xu, R. Remote sensing monitoring and driving force analysis of urban expansion in Guangzhou City, China. Habitat Int. 2010, 34, 228–235. [Google Scholar] [CrossRef]
- Koo, J. Agglomeration and spillovers in a simultaneous framework. Ann. Reg. Sci. 2005, 39, 35–47. [Google Scholar] [CrossRef]
- Xu, X.; Wang, Z.; Zhou, B.; Zhang, Z. The empirical analysis of knowledge spillover effect measurement. Knowl. Manag. Res. Pract. 2019, 17, 83–95. [Google Scholar] [CrossRef]
- Burchell, R.W.; Downs, A.; McCann, B.; Mukherji, S. Sprawl Costs: Economic Impacts of Unchecked Development; Island Press: Washington, DC, USA, 2005; Available online: http://worldcat.org/isbn/1559635304 (accessed on 12 February 2021).
- Fernández-Aracil, P.; Ortuño-Padilla, A. Costs of providing local public services and compact population in Spanish urbanized areas. Land Use Policy 2016, 58, 234–240. [Google Scholar] [CrossRef] [Green Version]
- Peng, C.; Lu, M. Governance and new towns: The city construction fever pursuing short-term growth and its consequences. J. Manag. World 2019, 35, 44–57. (In Chinese) [Google Scholar] [CrossRef]
- Venanzoni, G.; Carlucci, M.; Salvati, L. Latent sprawl patterns and the spatial distribution of businesses in a southern European city. Cities 2017, 62, 50–61. [Google Scholar] [CrossRef]
- Davis, J.C.; Henderson, J.V. Evidence on the political economy of the urbanization process. J. Urban Econ. 2003, 53, 98–125. [Google Scholar] [CrossRef]
- Henderson, J.V. Cities and development. J. Reg. Sci. 2010, 50, 515–540. [Google Scholar] [CrossRef]
- Yan, Y.; Reschovsky, A. Fiscal disparities among local governments in Zhejiang Province, China. J. Urban Aff. 2021, 1–22. [Google Scholar] [CrossRef]
- Wu, Q.; Li, Y.; Yan, S. The incentives of China’s urban land finance. Land Use Policy 2015, 42, 432–442. [Google Scholar] [CrossRef]
- Carr, D.A.; Fails, M.D. When Do Natural Resources Harm Fiscal Health? Evidence from the United States. Politics Policy 2018, 46, 878–911. [Google Scholar] [CrossRef]
- Zhou, Y.; Shi, Y. Toward establishing the concept of physical urban area in China. Acta Geogr. Sin. 1995, 50, 289–301. Available online: https://en.cnki.com.cn/Article_en/CJFDTotal-DLXB504.000.htm (accessed on 20 March 2021). (In Chinese).
- Zhang, L.; Zhao, S.X. Re-examining China’s “urban” concept and the level of urbanization. China Q. 1998, 154, 330–381. [Google Scholar] [CrossRef]
- Ma Laurence, J.C.; Cui, G. Administrative changes and urban population in China. Ann. Assoc. Am. Geogr. 1987, 77, 373–395. [Google Scholar] [CrossRef]
- Ma, S.; Long, Y. Identifying spatial cities in China at the community scale. J. Urban Reg. Plan. 2019, 11, 37–50. (In Chinese) [Google Scholar] [CrossRef]
- Qi, W.; Wang, K. City administrative area and physical area in China: Spatial differences and integration strategies. Geogr. Res. 2019, 38, 207–220. (In Chinese) [Google Scholar]
- Cao, J.; Mao, J.; Xue, Y. Why do municipal investment bonds continue to grow? An empirical analysis based on new statistical scope. Financ. Trade Econ. 2019, 40, 5–22. (In Chinese) [Google Scholar]
- Schneider, A.; Friedl, M.A.; Potere, D. Mapping global urban areas using MODIS 500-m data: New methods and datasets based on ‘urban ecoregions’. Remote Sens. Environ. 2010, 114, 1733–1746. [Google Scholar] [CrossRef]
- Mertes, C.M.; Schneider, A.; Sulla-Menashe, D.; Tatem, A.J.; Tan, B. Detecting change in urban areas at continental scales with MODIS data. Remote Sens. Environ. 2015, 158, 331–347. [Google Scholar] [CrossRef]
- Sulla-Menashe, D.; Gray, J.M.; Abercrombie, S.P.; Friedl, M.A. Hierarchical mapping of annual global land cover 2001 to present: The MODIS Collection 6 Land Cover product. Remote Sens. Environ. 2019, 222, 183–194. [Google Scholar] [CrossRef]
- Bai, Z.; Wang, J.; Wang, M.; Gao, M.; Sun, J. Accuracy assessment of multi-source gridded population distribution datasets in China. Sustainability 2018, 10, 1363. [Google Scholar] [CrossRef] [Green Version]
- UN-Habitat. New Urban Agenda. United Nations Conference on Housing and Sustainable Urban Development. 2016. Available online: https://habitat3.org/wp-content/uploads/NUA-English.pdf (accessed on 24 March 2021).
- World Bank. Urban Sustainability Framework; World Bank Group: Washington, DC, USA, 2018; Available online: http://documents.worldbank.org/curated/en/339851517836894370/Urban-Sustainability-Framework-1st-ed (accessed on 20 March 2021).
- Li, P.; Lu, M. Urban Systems: Understanding and Predicting the Spatial Distribution of China’s Population. China World Econ. 2021, 29, 35–62. [Google Scholar] [CrossRef]
Figure 1.
Research area.


Table 1.
Variables and definitions.
| Variable Name | Variable | Set Content |
|---|---|---|
| Debt | Local government debt | Logarithm of (the scale of urban investment bonds + 1) |
| UE_pop | Residential expansion index | 0.5 (proportion of population in low-density areas—proportion of population in high-density areas) + 0.5 |
| UE_area | Spatial expansion index | 0.5 (proportion of area of low-density areas—proportion of area of high-density areas) + 0.5 |
| UE | Comprehensive urban expansion index | Square root of the product of UE_pop and UE_area |
| Lnpop | Population size | Logarithm of the permanent population |
| Lnpgdp | Regional economic development level | Logarithm of per capita GDP |
| Gdp2 | Proportion of the secondary industry | Proportion of the secondary industry in GDP |
| Gdp3 | Proportion of the tertiary industry | Proportion of the tertiary industry in GDP |
| Landfinance | Land finance | Ratio of land transfer fee to local public budget revenue |
Table 2.
Descriptive statistics of the main variables.
| VarName | Obs | Mean | SD | Min | Max |
|---|---|---|---|---|---|
| Debt | 2810 | 1.160 | 1.615 | 0.000 | 6.656 |
| UE_pop | 2810 | 0.345 | 0.183 | 0.027 | 1.000 |
| UE_area | 2810 | 0.736 | 0.146 | 0.164 | 1.000 |
| UE | 2810 | 0.495 | 0.171 | 0.071 | 1.000 |
| Lnczpop | 2810 | 5.823 | 0.655 | 2.964 | 7.282 |
| Lnpgdp | 2810 | 10.226 | 0.711 | 4.595 | 12.456 |
| Gdp2 | 2810 | 0.499 | 0.107 | 0.152 | 0.910 |
| Gdp3 | 2810 | 0.363 | 0.084 | 0.086 | 0.758 |
| Landfinance | 2810 | 0.582 | 0.385 | 0.003 | 2.755 |
Table 3.
Benchmark regression results.
| (1) | (2) | (3) | (4) | (5) | (6) | |
|---|---|---|---|---|---|---|
| UE_pop | 3.045 *** | 0.890 *** | ||||
| (7.53) | (2.67) | |||||
| UE_area | 7.295 *** | 1.018 ** | ||||
| (17.01) | (2.39) | |||||
| UE | 4.797 *** | 0.996 *** | ||||
| (11.34) | (2.70) | |||||
| Lnczpop | 3.267 *** | 3.250 *** | 3.268 *** | |||
| (10.57) | (10.52) | (10.57) | ||||
| Lnpgdp | 1.669 *** | 1.630 *** | 1.652 *** | |||
| (25.78) | (23.87) | (25.22) | ||||
| Gdp2 | −2.135 * | −2.243 * | −2.212 * | |||
| (−1.81) | (−1.88) | (−1.87) | ||||
| Gdp3 | 2.614 * | 2.475 * | 2.526 * | |||
| (1.91) | (1.80) | (1.84) | ||||
| Landfinance | −0.155 ** | −0.158 ** | −0.155 ** | |||
| (−2.18) | (−2.21) | (−2.17) | ||||
| Constant | 0.109 | −35.032 *** | −4.213 *** | −34.872 *** | −1.215 *** | −34.983 *** |
| (0.77) | (−18.06) | (−13.31) | (−17.96) | (−5.76) | (−18.04) | |
| City | Yes | Yes | Yes | Yes | Yes | Yes |
| Year | Yes | Yes | Yes | Yes | Yes | Yes |
| N | 2810 | 2810 | 2810 | 2810 | 2810 | 2810 |
| R2 | 0.022 | 0.380 | 0.103 | 0.379 | 0.048 | 0.380 |
***, **, and * indicate significance at the 1%, 5%, and 10% levels, respectively.
Table 4.
Robustness test regression results.
| Excluding Sub-Provincial and Provincial Capital Cities | Excluding Cities That Have Not Issued Urban Investment Bonds during the Sample Period | |||||
|---|---|---|---|---|---|---|
| (1) | (2) | (3) | (4) | (5) | (6) | |
| UE_pop | 1.006 *** | 0.862 ** | ||||
| (3.06) | (2.48) | |||||
| UE_area | 1.231 *** | 1.002 ** | ||||
| (2.91) | (2.25) | |||||
| UE | 1.178 *** | 0.970 ** | ||||
| (3.23) | (2.53) | |||||
| Control variables | Yes | Yes | Yes | Yes | Yes | Yes |
| City | Yes | Yes | Yes | Yes | Yes | Yes |
| Year | Yes | Yes | Yes | Yes | Yes | Yes |
| N | 2600 | 2600 | 2600 | 2650 | 2650 | 2650 |
| R2 | 0.351 | 0.351 | 0.351 | 0.403 | 0.403 | 0.403 |
*** and ** indicate significance at the 1% and 5% levels, respectively.
Table 5.
Regression results of heterogeneity of regions and sizes of cities.
| Eastern Cities | Central/Western Cities | Large Cities | Small and Medium-Sized Cities | |||||||||
|---|---|---|---|---|---|---|---|---|---|---|---|---|
| (1) | (1) | (1) | (4) | (5) | (6) | (7) | (8) | (9) | (10) | (11) | (12) | |
| UE_pop | 0.208 | 0.890 ** | −0.578 | 1.033 *** | ||||||||
| (0.35) | (2.25) | (−0.55) | (3.08) | |||||||||
| UE_area | −0.426 | 1.770 *** | 0.282 | 1.226 *** | ||||||||
| (−0.54) | (3.56) | (0.28) | (2.72) | |||||||||
| UE | 0.169 | 1.173 *** | −0.315 | 1.204 *** | ||||||||
| (0.26) | (2.68) | (−0.30) | (3.20) | |||||||||
| Control variables | Yes | Yes | Yes | Yes | Yes | Yes | Yes | Yes | Yes | Yes | Yes | Yes |
| City | Yes | Yes | Yes | Yes | Yes | Yes | Yes | Yes | Yes | Yes | Yes | Yes |
| Year | Yes | Yes | Yes | Yes | Yes | Yes | Yes | Yes | Yes | Yes | Yes | Yes |
| N | 980 | 980 | 980 | 1830 | 1830 | 1830 | 1110 | 1110 | 1110 | 1700 | 1700 | 1700 |
| R2 | 0.494 | 0.494 | 0.494 | 0.327 | 0.330 | 0.328 | 0.525 | 0.525 | 0.525 | 0.290 | 0.289 | 0.290 |
*** and ** indicate significance at the 1% and 5% levels, respectively.
Table 6.
Regression results of heterogeneity of fiscal stress and development pressure.
| Cities with Higher Fiscal Stress | Cities with Lower Fiscal Stress | Cities with Higher Development Pressure | Cities with Lower Development Pressure | |||||||||
|---|---|---|---|---|---|---|---|---|---|---|---|---|
| (1) | (2) | (3) | (4) | (5) | (6) | (7) | (8) | (9) | (10) | (11) | (12) | |
| UE_pop | 1.353 *** | −0.063 | 1.482 *** | −0.665 | ||||||||
| (3.04) | (−0.13) | (3.92) | (−0.99) | |||||||||
| UE_area | 2.749 *** | −0.751 | 1.923 *** | −1.162 | ||||||||
| (4.67) | (−1.23) | (3.90) | (−1.44) | |||||||||
| UE | 1.784 *** | −0.220 | 1.769 *** | −0.960 | ||||||||
| (3.59) | (−0.41) | (4.21) | (−1.33) | |||||||||
| Control variables | Yes | Yes | Yes | Yes | Yes | Yes | Yes | Yes | Yes | Yes | Yes | Yes |
| City | Yes | Yes | Yes | Yes | Yes | Yes | Yes | Yes | Yes | Yes | Yes | Yes |
| Year | Yes | Yes | Yes | Yes | Yes | Yes | Yes | Yes | Yes | Yes | Yes | Yes |
| N | 1008 | 1008 | 1008 | 1802 | 1802 | 1802 | 1750 | 1750 | 1750 | 1060 | 1060 | 1060 |
| R2 | 0.219 | 0.230 | 0.222 | 0.442 | 0.442 | 0.442 | 0.314 | 0.314 | 0.315 | 0.477 | 0.478 | 0.477 |
*** indicates significance at the 1% level.
Table 7.
Regression results of heterogeneity of urban expansion modes.
| Residential Expansion-Dominated Cities | Spatial Expansion-Dominated Cities | |||||
|---|---|---|---|---|---|---|
| (1) | (2) | (3) | (4) | (5) | (6) | |
| UE_pop | 0.781 ** | 0.847 | ||||
| (2.28) | (0.92) | |||||
| UE_area | 0.919 * | −0.021 | ||||
| (1.83) | (−0.03) | |||||
| UE | 0.890 ** | 0.500 | ||||
| (2.25) | (0.59) | |||||
| Control variables | Yes | Yes | Yes | Yes | Yes | Yes |
| City | Yes | Yes | Yes | Yes | Yes | Yes |
| Year | Yes | Yes | Yes | Yes | Yes | Yes |
| N | 1660 | 1660 | 1660 | 1150 | 1150 | 1150 |
| R2 | 0.321 | 0.320 | 0.321 | 0.460 | 0.460 | 0.460 |
** and * indicate significance at the 5% and 10% levels, respectively.
Table 8.
Regression results of land output efficiency.
| Land Output Efficiency | |||
|---|---|---|---|
| (1) | (2) | (3) | |
| UE_pop | −0.095 *** | ||
| (−7.31) | |||
| UE_area | −0.172 *** | ||
| (−10.50) | |||
| UE | −0.122 *** | ||
| (−8.59) | |||
| Control variables | Yes | Yes | Yes |
| City | Yes | Yes | Yes |
| Year | Yes | Yes | Yes |
| N | 2810 | 2810 | 2810 |
| R2 | 0.312 | 0.327 | 0.318 |
*** indicates significance at the 1% level.
Table 9.
Regression results of urban construction and maintenance expenditure.
| Urban Maintenance and Construction Funds | Fixed asset Investment in Municipal Facilities | |||||
|---|---|---|---|---|---|---|
| (1) | (2) | (3) | (4) | (5) | (6) | |
| UE_pop | 0.647 *** | 0.287 | ||||
| (2.85) | (1.31) | |||||
| UE_area | 1.080 *** | 0.811 *** | ||||
| (3.73) | (3.13) | |||||
| UE | 0.836 *** | 0.477 ** | ||||
| (3.33) | (1.97) | |||||
| Control variables | Yes | Yes | Yes | Yes | Yes | Yes |
| City | Yes | Yes | Yes | Yes | Yes | Yes |
| Year | Yes | Yes | Yes | Yes | Yes | Yes |
| N | 2810 | 2810 | 2810 | 2810 | 2810 | 2810 |
| R2 | 0.233 | 0.234 | 0.234 | 0.225 | 0.228 | 0.226 |
*** and ** indicate significance at the 1% and 5% levels, respectively.
Publisher’s Note: MDPI stays neutral with regard to jurisdictional claims in published maps and institutional affiliations. |
© 2021 by the authors. Licensee MDPI, Basel, Switzerland. This article is an open access article distributed under the terms and conditions of the Creative Commons Attribution (CC BY) license (https://creativecommons.org/licenses/by/4.0/).
Share and Cite
MDPI and ACS Style
Yan, Y.; Liu, H.; Wang, N.; Yao, S. How Does Low-Density Urbanization Reduce the Financial Sustainability of Chinese Cities? A Debt Perspective. Land 2021, 10, 981. https://0-doi-org.brum.beds.ac.uk/10.3390/land10090981
AMA Style
Yan Y, Liu H, Wang N, Yao S. How Does Low-Density Urbanization Reduce the Financial Sustainability of Chinese Cities? A Debt Perspective. Land. 2021; 10(9):981. https://0-doi-org.brum.beds.ac.uk/10.3390/land10090981
Chicago/Turabian StyleYan, Yan, Hui Liu, Ningcheng Wang, and Shenjun Yao. 2021. "How Does Low-Density Urbanization Reduce the Financial Sustainability of Chinese Cities? A Debt Perspective" Land 10, no. 9: 981. https://0-doi-org.brum.beds.ac.uk/10.3390/land10090981
Note that from the first issue of 2016, this journal uses article numbers instead of page numbers. See further details here.