
Spatial Pattern of Functional Urban Land Conversion and Expansion under Rapid Urbanization: A Case Study of Changchun, China


1
School of Geographical Sciences, Northeast Normal University, Changchun 130024, China
2
Key Laboratory of Geographical Processes and Ecological Security of Changbai Moutains, Ministry of Education, Northeast Normal University, Changchun 130024, China
*
Author to whom correspondence should be addressed.
Land 2022, 11(1), 119; https://0-doi-org.brum.beds.ac.uk/10.3390/land11010119
Submission received: 24 November 2021
/
Revised: 22 December 2021
/
Accepted: 10 January 2022
/
Published: 12 January 2022
(This article belongs to the Special Issue Land Use Change from Non-urban to Urban Areas: Problems, Challenges and Opportunities)
Abstract
:As populations continue to be concentrated in cities, the world will become entirely urbanized, and urban space is undergoing a drastic evolution. Understanding the spatial pattern of conversion and expansion of functional urban land, in the context of rapid urbanization, helps us to grasp the trajectories of urban spatial evolution in greater depth from a theoretical and practical level. Using the ESRI ArcGIS 9.3 software platform, methods, such as overlay analysis, transition matrix, and kernel density estimation, were used in order to analyze the spatiotemporal characteristics of different types of functional urban land conversion and expansion in the central city of Changchun. The results show that different types of functional urban land were often expanded and replaced, and the urban spatial structure was constantly evolving. The conversion and expansion of functional urban land show similar characteristics to concentric zone and sector modes and show dynamic changes in different concentric circles and directions at different periods. Our method can accurately identify the different types of functional urban land, and also explore the evolutionary trajectory of urban spatial structure. This study will help to coordinate the development of different functional urban spaces and to optimize the urban spatial structure in the future.
1. Introduction
As the urban population continues to increase, cities have always been the focus of scholars and policy makers [1]. More than 50% of the world’s population is currently concentrated in urban areas [2] and it is estimated that this will reach 70% by the year 2050 [3]. With the rapid increase in urban population, urban space is constantly expanding [4]. Urban–rural population migration [5], cross-regional population mobility [6], and bidirectional urban flows [7], are considered to be the main driving forces of the increase in the urban population. Changes in the urban land use/cover and their environmental consequences, such as the sustainable development of urban space [8] and the spatial mode of urban land change [9], have become important topics in the field of urban land research. In the context of rapid urbanization, the phenomenon of conversion between different types of functional urban land often occurs in urban built-up areas [10]. However, scholars have not paid enough attention to the phenomenon. Although big data, such as point-of-interest (POI) and vehicle trajectories, have been used to identify functional urban areas, it is difficult to accurately classify the different types of urban land [11,12,13]. Relying on the urban land use maps of the past few years and other auxiliary data, we have obtained a detailed classification of urban construction land based on different uses, which is helpful for analyzing spatial patterns of functional urban land conversion and expansion.
Unlike urban land conversion, the expansion of urban land has become a relatively common phenomenon worldwide and has attracted widespread research attention [14]. Remote sensing and geographic information systems (GIS) facilitate the study of urban land expansion [15,16]. Xiao et al. (2006) used Landsat images and the annual urban growth rate to analyze land use change and urban spatial expansion in Shijiazhuang [17]. López et al. (2001) analyzed and predicted land use change on the fringes of a Mexican city [18]. Polimeni (2005) analyzed the replacement of agricultural land by residential land caused by the expansion of urban land in the Hudson River Valley [19]. The expansion of urban land occupies a large part of non-urban land [20], especially in the metropolitan areas of Southeast Asia [21]. For example, a large area of high-quality farmland has been replaced by urban land in Beijing [22]. In the above studies, the scholars have analyzed the expansion of urban land from a regional perspective. They paid attention to the overall expansion of urban land and did not subdivide the types of urban land. Therefore, our perspective is different from theirs as we are concerned about different types of urban land in the city.
Regarding the study of urban land within a city, scholars have focused on the identification of functional urban areas or land. Big data are often used to identify functional urban space and to analyze the organization of functional urban spaces [23,24,25,26]. Tian et al. (2010) used POI data to divide the functional urban space of Beijing and pointed out that Beijing belongs to an urban spatial structure similar to that of the concentric zone mode [24]. Chen et al. (2020) compared the similarities and differences in the spatial organization of the urban functions in 25 Chinese cities with help of POI data [25]. In contrast to Tian et al.’s conclusions, Liu et al. (2021) used carpooling big data to identify the regional centers and highlighted the polycentric spatial structure of Beijing [26]. In addition, the redevelopment of a certain type of urban land occasionally appears in the existing literature. Under the influence of industrial decentralization, industrial land is constantly being replaced by other urban construction lands [27,28,29,30,31]. Charney (2015) analyzed the conversion between office land and residential land in the central urban area of Tel Aviv [32]. There are many other types of land use in cities, but these have not received enough attention.
The opening to the world in 1978 was the starting point for the rapid development of Chinese urbanization. After 40 years of development, the urbanization rate increased to 59.78% in 2018, which is an increase of 41.68% from 1978 [33]. This rapid urbanization has caused a fast expansion of urban space in most Chinese cities, especially in provincial capitals and cities in east China. From 2003 to 2015, urban development land increased by 22,612.2 km2 [34]. However, the rapid expansion of urban space has not automatically led to high-quality urban construction or stable use of urban land. The conversion of urban land use continued to occur in urban built-up areas [35,36]. According to William Alonso’s bid-rent theory, the price of commercial land is the highest, the price of industrial land is the lowest, and the price of residential land is between the two [35,37]. Land with a lower price will be gradually replaced by land with a higher price. The excessive aspirations of local governments for rapid urban development inevitably led to a lack of vision in urban planning, which intensified the land use conversion in urban built-up areas [35]. Due to the urban land conversion and expansion, the transformation of the urban spatial structure is also happening at the same time. In terms of urban diffusion, Sargolini (2015) pointed out that three different possible scenarios can be profiled [38]. In this work, we consider two scenarios of urban land conversion and expansion. The first scenario is the continuous expansion of urban construction land to replace non-urban construction land. The second scenario is the conversion of one kind of functional urban land to another kind of functional urban land, such as the conversion of industrial land to residential land. This phenomenon is usually caused by the unreasonable arrangement of different kinds of urban construction land in the urban built-up areas due to blind and rapid urban development. In Chinese cities, especially in developing cities, these two scenarios are very common, while the second scenario occurs less frequently in Western cities [35,36].
In China, there is a large gap in the level of development between cities. Cities, such as Beijing and Shanghai, have a high level of development. The intra-urban land use has hardly changed, and the phenomenon of functional urban land replacement is not significant [35]. Land use in developing cities that are undergoing rapid urbanization is changing [10]. The expansion and replacement of urban land coexist. Changchun is a developing city experiencing rapid urbanization and was chosen as the study area here. Therefore, our research methods and conclusions are generally applicable to developing cities, especially in Asia and Africa. Cities in Asia and Africa are still undergoing land use transformation due to rapid urbanization. The rapid urbanization of Asian and African cities will continue, and the urban population will further increase. Therefore, it is necessary to explore the transformation of functional urban land use in the context of rapid urbanization in order to develop a scientific and reasonable urban spatial development strategy.
Based on this, this article will discuss the spatiotemporal evolution of the conversion and expansion of the different types of functional urban land in the central city of Changchun. Functional urban land expansion means transforming non-construction land into urban use at the edge of built-up areas. Functional urban land conversion refers to intra-urban replacement in land use and includes the following two modes: “convert in” and “convert out”. The mode of “convert in” refers to the conversion of other kinds of functional urban land into a certain type. The mode of “convert out” refers to the conversion of a certain kind of functional urban land into other types. For example, the “convert in” of residential land means the conversion of other kinds of functional urban land into residential land; the “convert out” of residential land means the conversion of residential land into other kinds of functional urban land. In other words, the conversion of functional urban land is the sum of “convert in” and “convert out” modes. Once we have understood the concept of functional urban land expansion and conversion, then can the analytical method of combining functional urban land expansion and conversion trace the process of urban spatial evolution? Furthermore, is the spatiotemporal process of expansion and conversion consistent across the different types of functional urban land? As we all know, with the expansion of urban space, the importance of the sustainable development of urban space is self-evident [8]. Our research will help to explore the trajectory of urban space evolution, promote the coordinated development of different urban functions, and thus contribute to the sustainable development of urban space.
The paper is organized into the following sections: In Section 1, the research background and the purpose of the research are discussed. In Section 2, we first introduce the study area, then explain the data source, and finally elaborate the research method in detail. In Section 3, we analyze the conversion and expansion of the four types of functional urban land. In Section 4, we discuss the static and dynamic changes of functional urban land conversion and expansion from the perspective of concentric circles and sector modes. The last section is the conclusion of this study.
2. Materials and Methods
2.1. Study Area
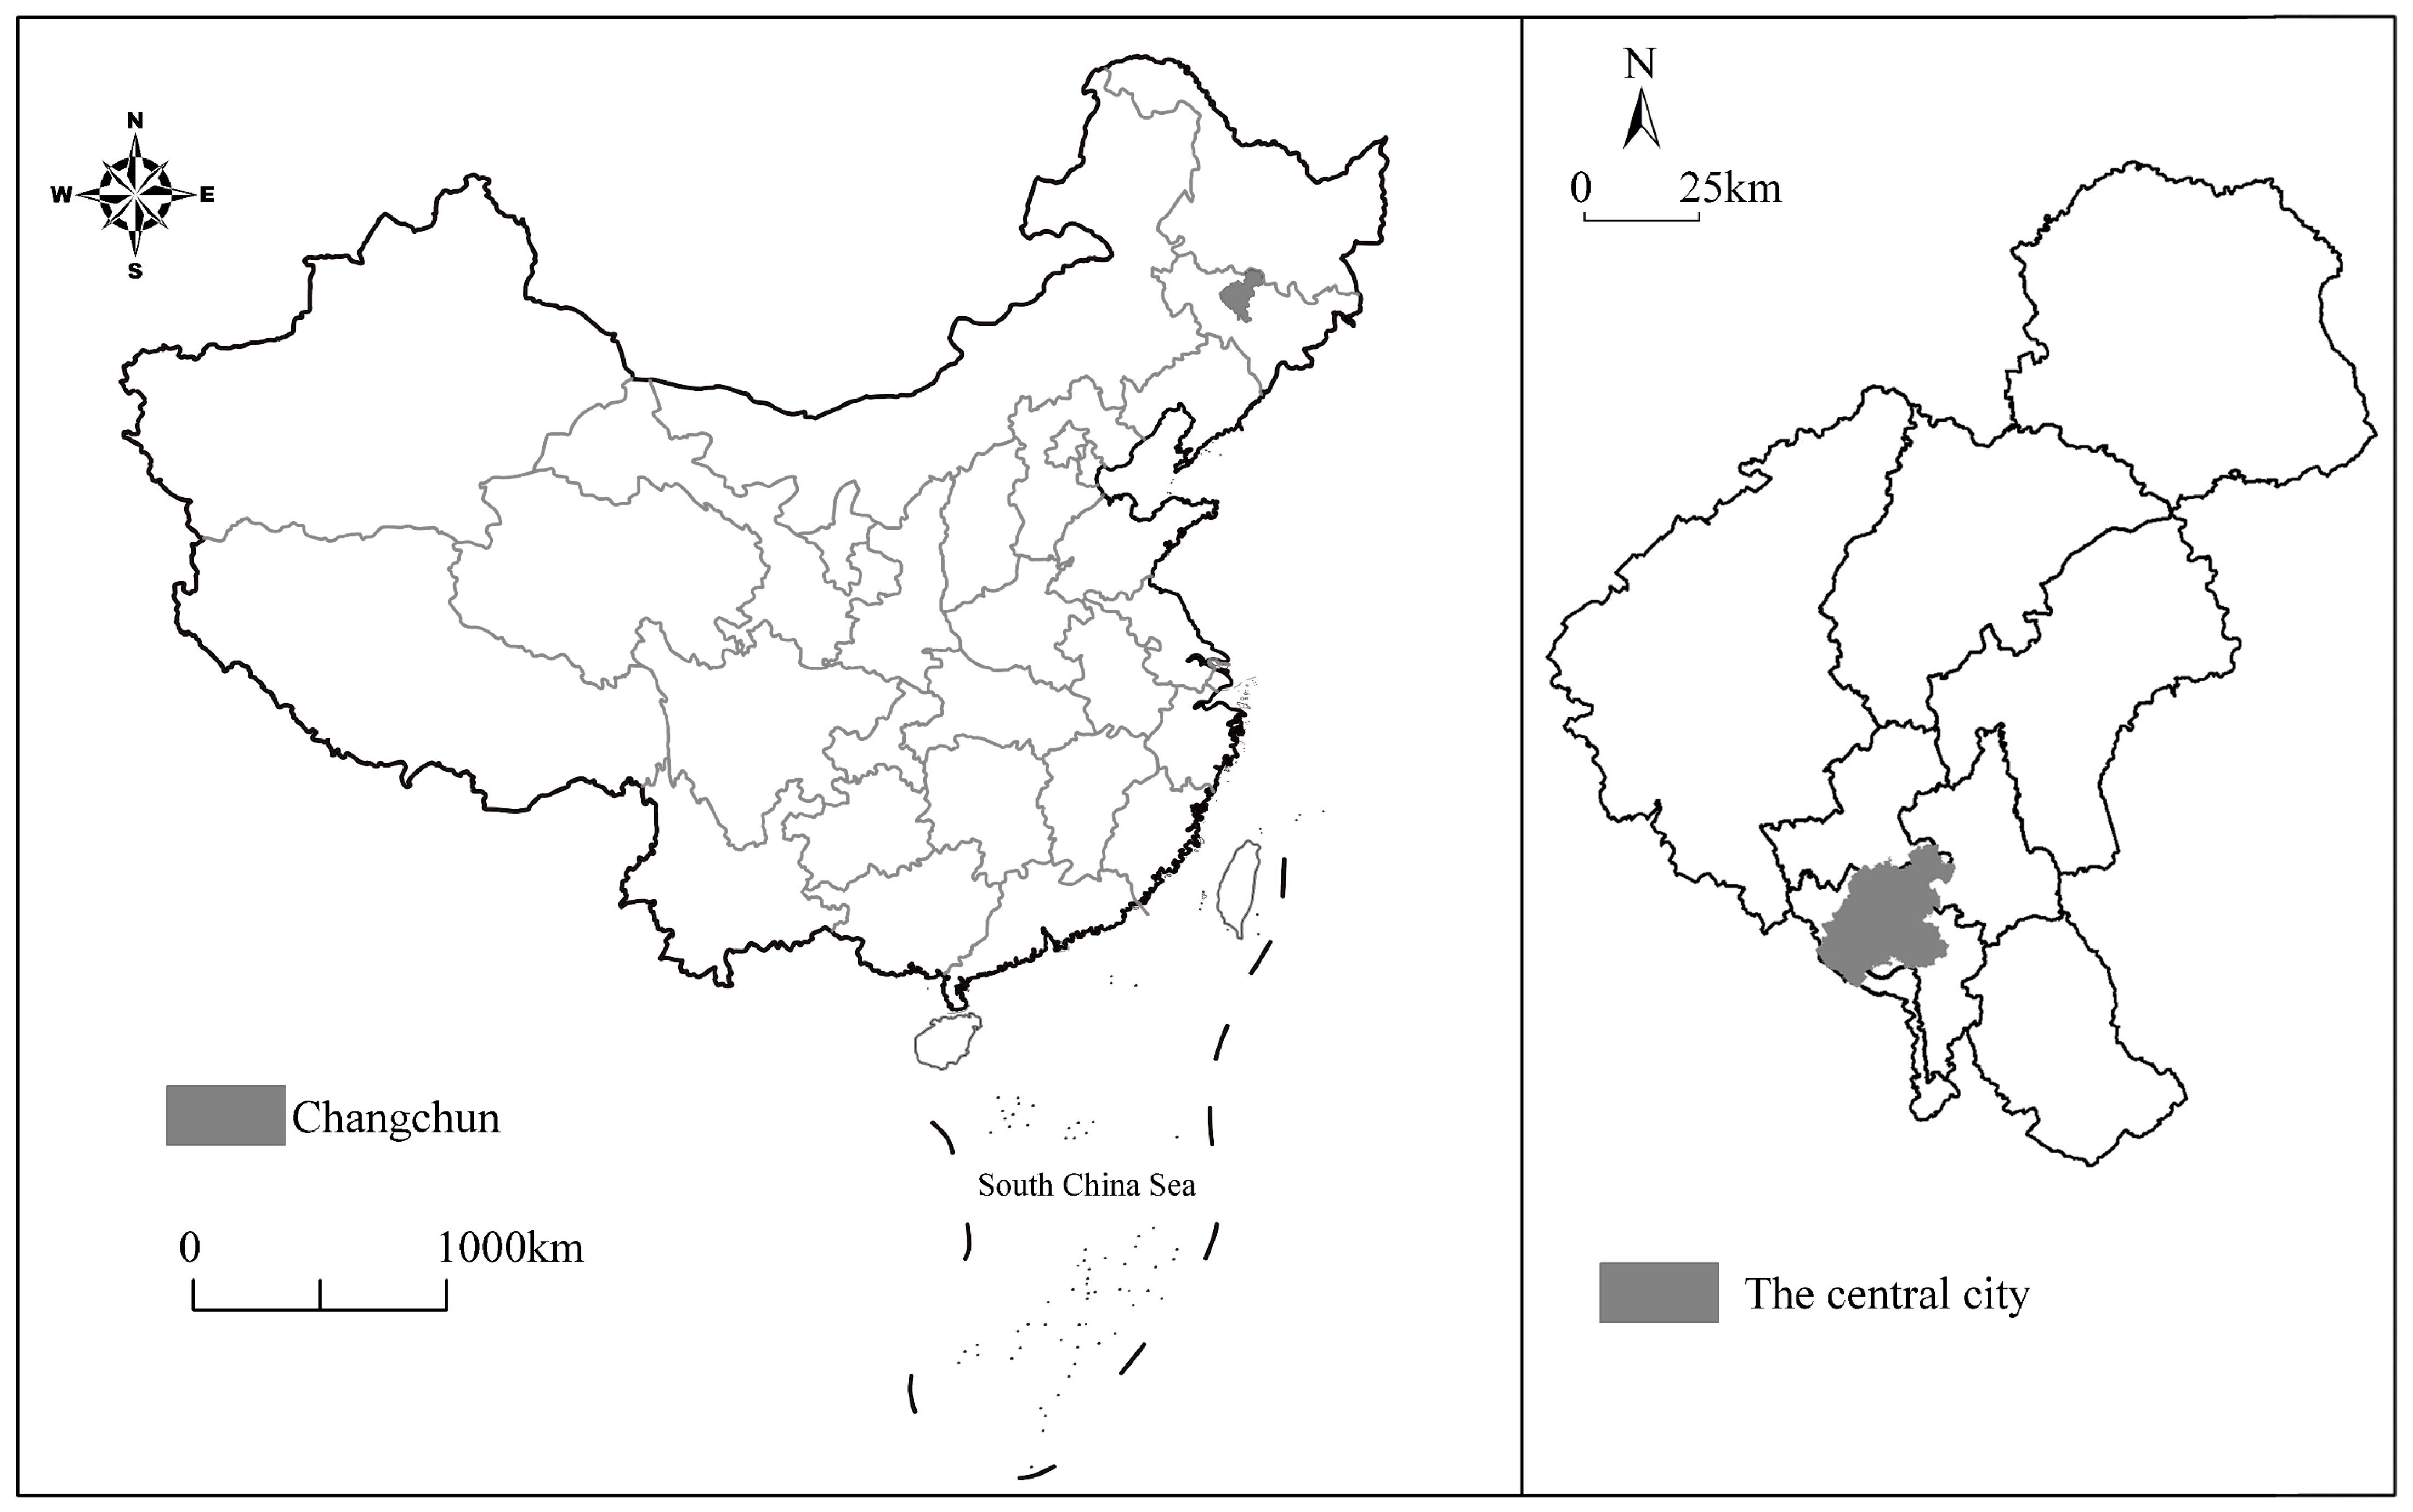
Changchun is a developing city, located in northeast China (Figure 1). The functional urban land is undergoing drastic conversion and expansion, which supports this research. Changchun is the capital of Jilin Province. In 2015, the population of Changchun reached 7.54 million, with a total area of 20,594 km2. The central city, the study area of this article, is the core component of the city and the center of regional economic development, covering an area of 612 km2. The urban construction land of Changchun is mainly distributed in the central city, with an area of 348.6 km2 as of 2015.
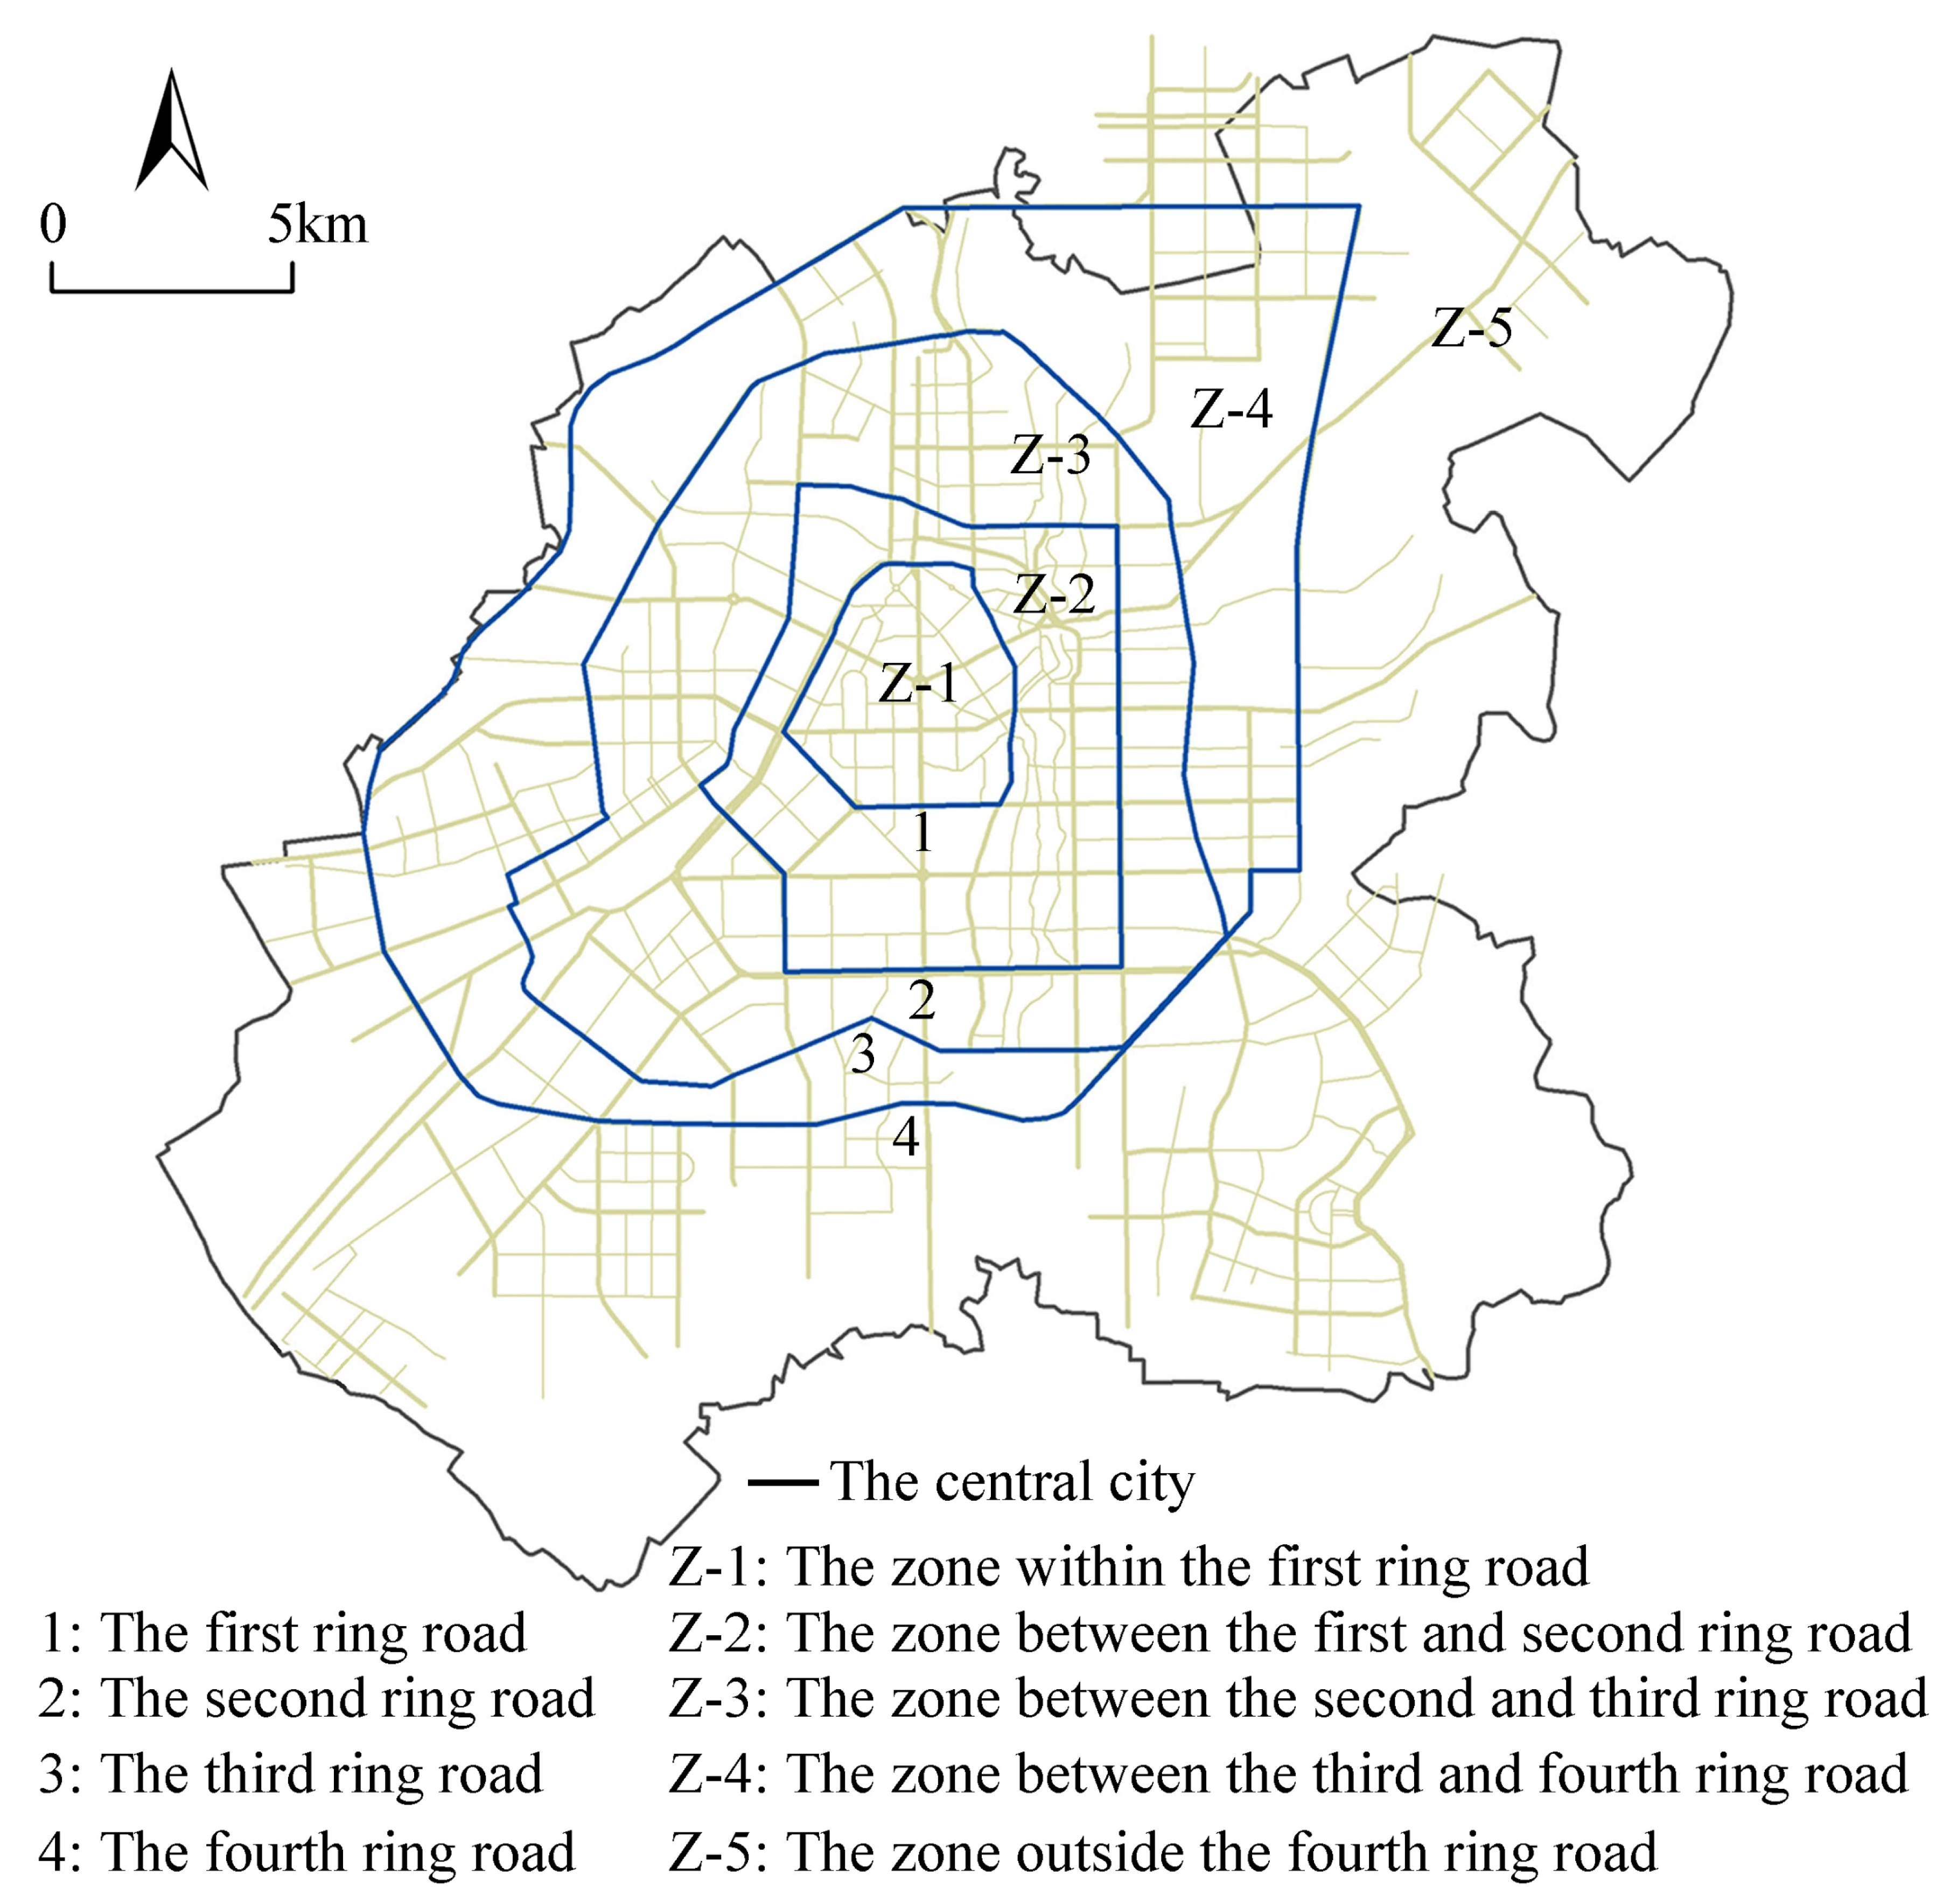
Roads are the “skeleton” of the urban space, especially the ring road, which helps to analyze the concentric circle pattern of the evolution of functional urban land. The four ring roads, namely the first, second, third, and fourth ring road, divide the central city of Changchun into five zones (Figure 2). The areas of the five zones (Z-1, Z-2, Z-3, Z-4, and Z-5) are 19 km2, 52 km2, 99 km2, 128 km2, and 314 km2, respectively. Based on the five sub-zones, we can analyze the concentric features of the conversion and expansion of the functional urban land. In addition to the concentric features, this article also focuses on the sector features of the replacement and expansion of functional urban land, similar to Hoyt’s sector mode. With the People’s Square as the center, the central city can be divided into eight sectors according to different directions (E, W, S, N, NE, SE, SW, and NW).
2.2. Data Sources and Processing
2.2.1. Data Sources
The data used in this article are urban land use maps from 2003, 2007, 2011, and 2015. The source of the urban land use maps is the Changchun city master plan, which can be accessed from the website of Changchun municipal planning and natural resources bureau (http://gzj.changchun.gov.cn, accessed on 25 December 2019). Urban land use maps were the basic data of the Changchun city master plan, and urban planners spent a lot of time creating them based on topographic maps with a scale of 1:100,000 and Google Maps with a spatial resolution of 10 m. Moreover, the urban planners conducted extensive field surveys to identify the dominant uses of parcels that carry multiple functions. Therefore, urban land use maps contain very accurate classification and layout information of functional urban lands. In the maps of urban land use, urban construction land consists of the following eight types of functional urban land: residential land (RL), public service land (PL), commercial land (CL), industrial land (IL), logistic and warehouse land (LWL), road and transport facility land (RTL), green space and square land (GSL), and municipal utility land (MUL). The rest of the Changchun city master plan is also an important support for this paper. In addition, land transaction data obtained from the website of the Changchun planning and natural resources bureau was used to assist in defining the projection of the urban land use maps.
2.2.2. Data Processing
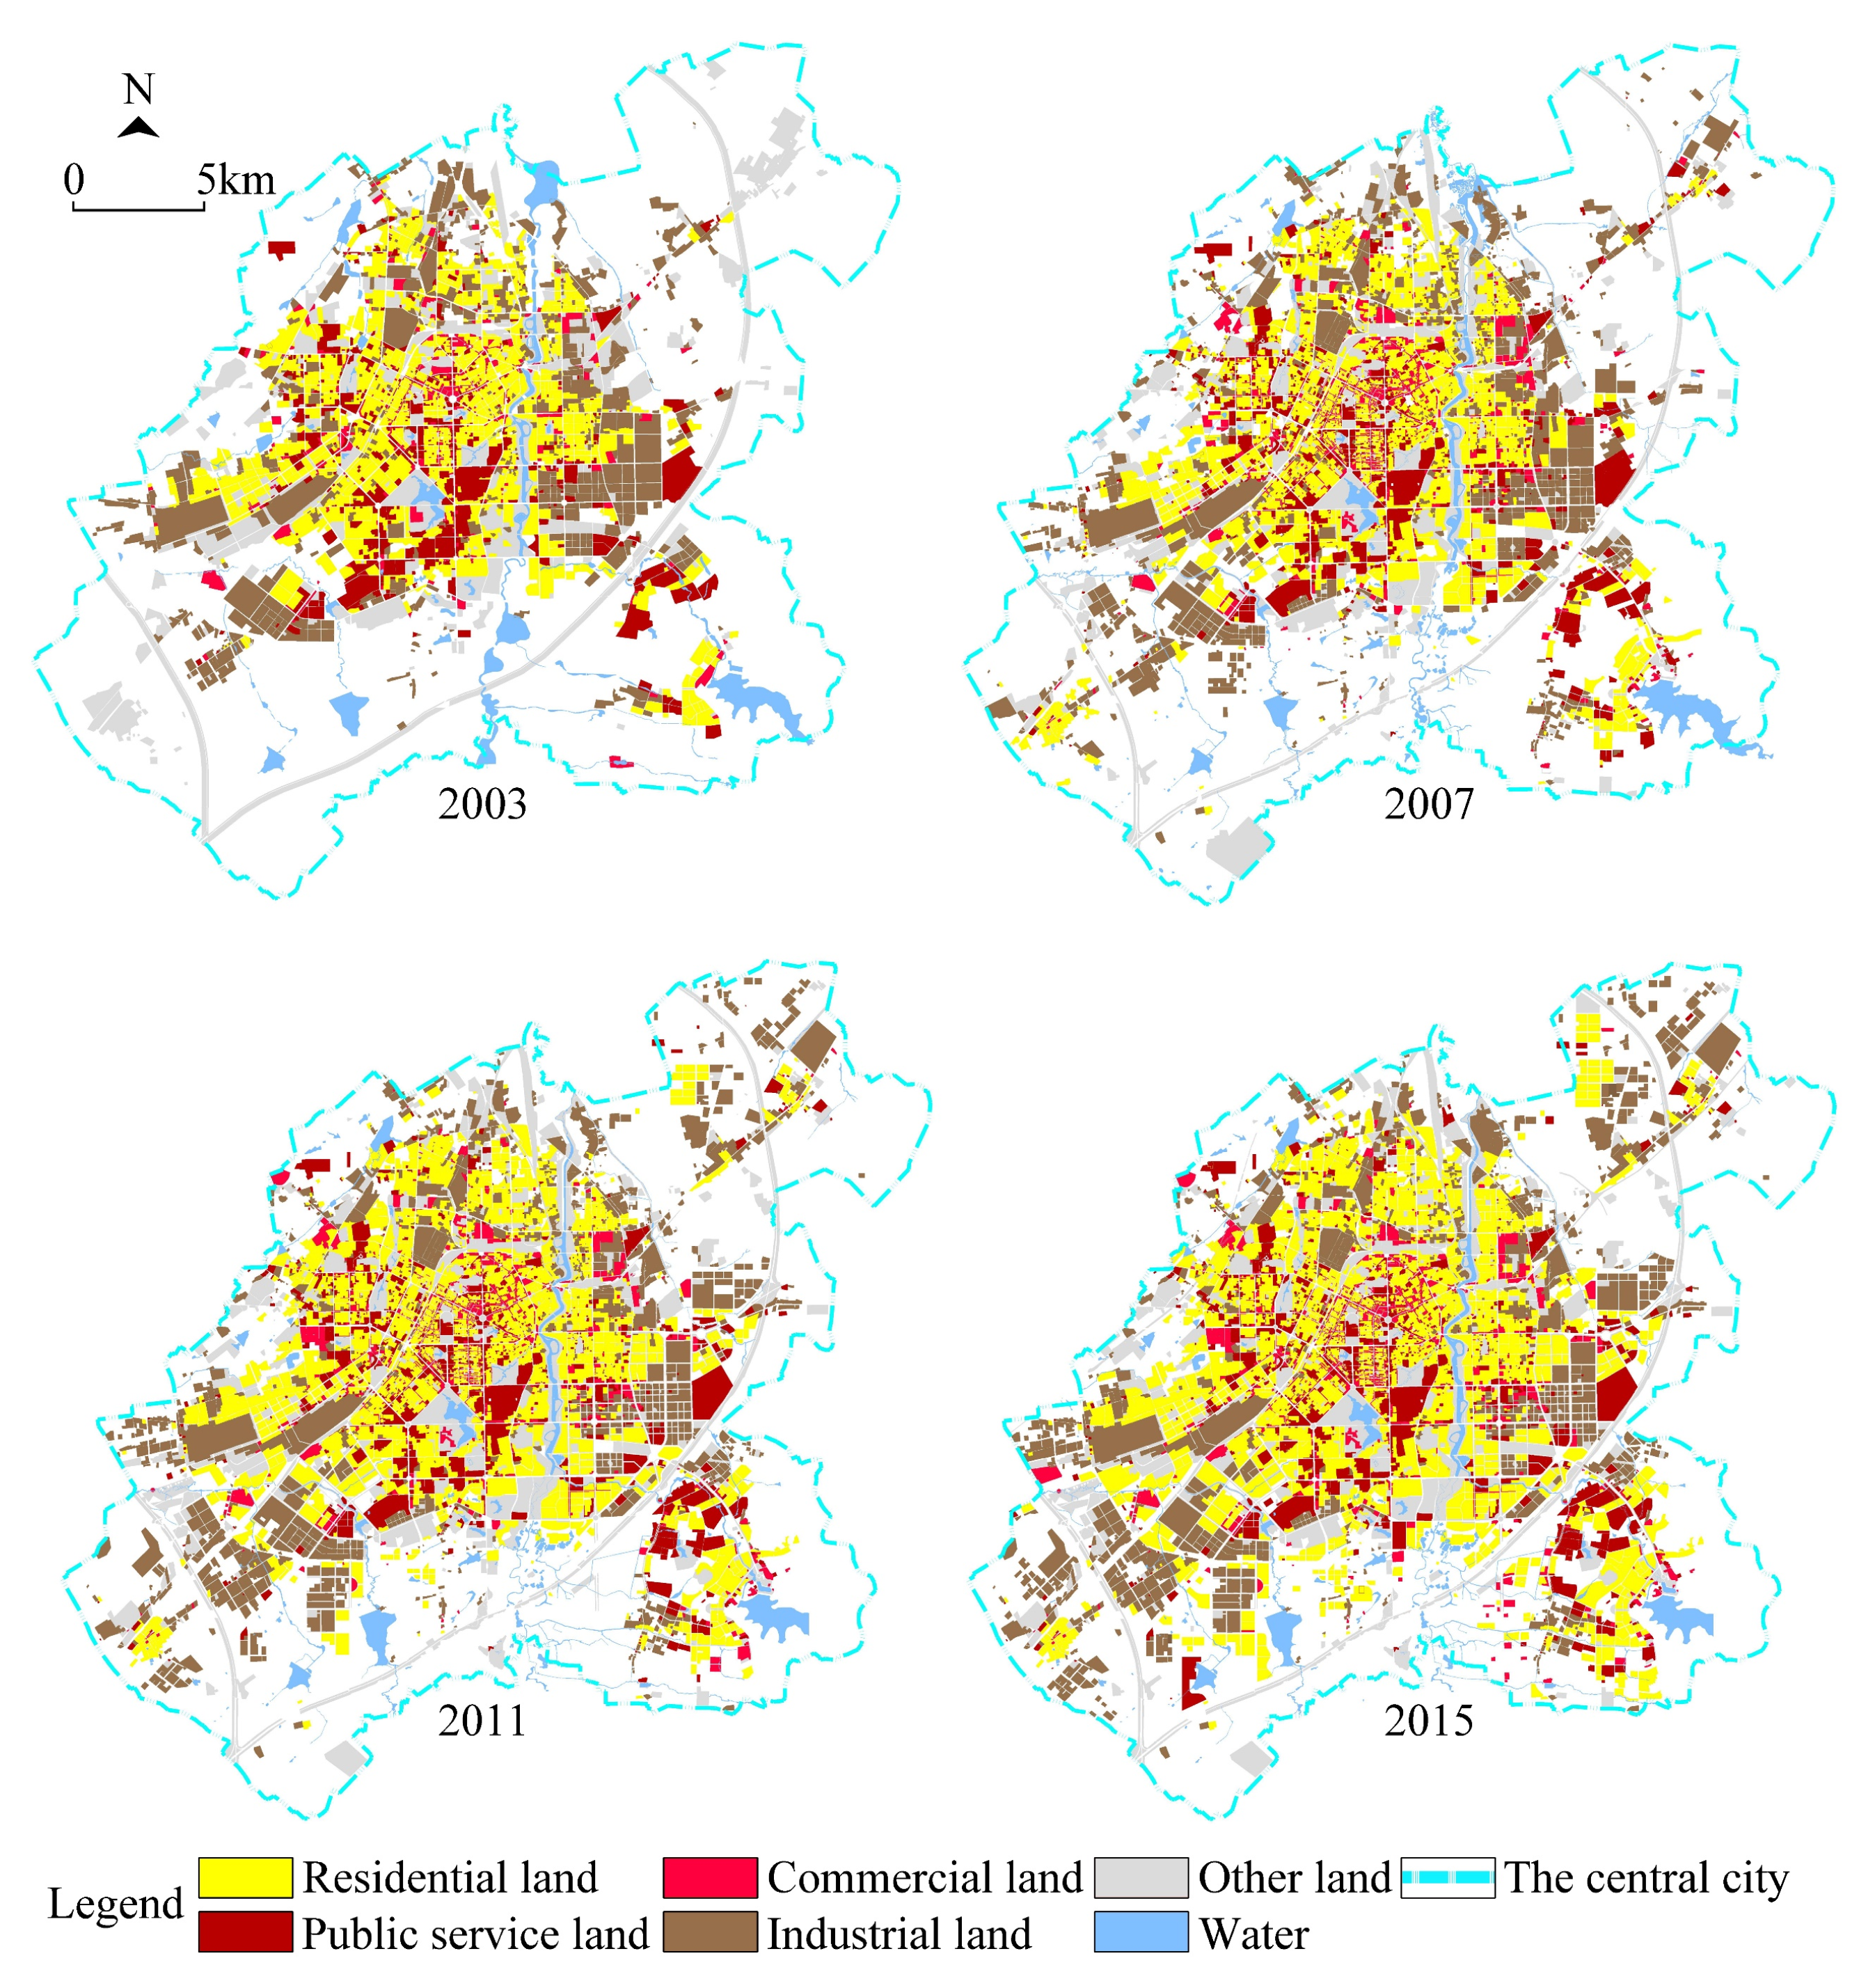
The file format of the urban land use maps we obtained as JPG. Therefore, we needed to vectorize the urban land use maps. First, the urban land use maps in JPG format were imported into ESRI ArcGIS 9.3 to define the projection (ArcToolbox, data management tools, projections and transformations, define projection). Here, the land transaction data obtained from the website of the Changchun planning and natural resources bureau was used to help georeferenced correction. The land transaction data contains detailed location information and can be easily located in the urban land use maps. Moreover, the land transaction data also contains a coordinate system. Combined with the location and coordinates of the land transaction data, the coordinates of the urban land use maps can be accurately corrected. According to the coordinate system of land transaction data, we used the WGS-84 coordinate system to define the projection. We used the coordinate points of ten transaction plots to conduct spatial corrections of the urban land use maps in JPG format. Then, we vectorized the urban land use maps. In this work, the minimum detected unit is the plot enclosed by the urban road network. After that, we used vectorized urban land use maps and the following methods to analyze the expansion and conversion of functional urban lands. In this paper, the top four types of functional urban land (i.e., RL, CL, PL, and IL) are mainly discussed. The other four types of functional urban land (i.e., LWL, RTL, GSL, and MUL) are collectively referred to as “other land” (OL). The urban land use in the central city for the four years (2003, 2007, 2011, and 2015) is shown in Figure 3.
2.3. Methods
2.3.1. Overlay Analysis
Overlay analysis was used to study the expansion of functional urban land. Using the ESRI ArcGIS 9.3 software platform, maps of urban land use of the four years (2003, 2007, 2011, and 2015) were overlapped, and expansions of RL, CL, PL, and IL were obtained through overlay analysis. The following equation was used to calculate the spatial distribution of the expansion of the four types of functional urban land and to analyze the spatial features of urban spatial expansion:
where Pij represents the proportion of the growth area of j-type urban land in zone i to the total growth area of j-type urban land in the central city; ATij represents the area of j-type urban land in zone i in the year T; Atij represents the area of j-type urban land in zone i in the year t; ATj represents the area of j-type urban land in the central city in the year T; Atj represents the area of j-type urban land in the central city in the year t; and t represents the first temporal threshold, while T represents the next temporal threshold.
2.3.2. Transition Matrix
The transition matrix method is an important method for the analysis of functional urban land conversion as it can be used to analyze the number and spatial distribution of conversions between different types of functional urban land [39]. The mathematical expression of the transition matrix is provided in the following equation:
where Sij represents an area converted from urban land type i to urban land type j; and n represents the number of functional urban land types. ESRI ArcGIS 9.3 and Excel 2016 were used to obtain the transition matrix of functional urban land conversion. First, we used overlay analysis to obtain the intersection layer data (ArcMap, ArcToolbox, analysis tools, overlay, intersect), added a new field to the attribute table of the intersection layer data, calculated the area, and exported the attribute table to a file in DBF format. Then, we used the pivot table in Excel to obtain the transition matrix of urban land use. Thus, we can calculate “convert in” and “convert out” values of the central city and the five zones. The value of functional urban land conversion for the five zones was calculated using the following equation:
where ULR is the area of functional urban land replacement; Cin represents the conversion of other kinds of functional urban land into this kind of functional urban land; and Cout is the opposite of Cin.
2.3.3. Kernel Density Estimation
Through the previous overlay analysis and transfer matrix, we have obtained the spatial layout map of functional urban land expansion and conversion. We used the kernel density estimation method for the analysis of the spatial distribution density of functional urban land with the aim of discovering where the land use changes are spatially clustered. The kernel density was calculated as follows:
where represents the nuclear density equation; h is the threshold; n is the number of points within the threshold; and d is the dimension of the data.
3. Results
3.1. General Characteristics of Functional Urban Land Conversion and Expansion
Judging by the composition of the functional urban land in the central city of Changchun, the sum of the proportions of RL, IL, PL, and CL exceeded almost two-thirds. From 2003 to 2015, the area of urban construction land in the central city increased by 111.24 km2, of which the four types of functional urban land increased by 81.39 km2, and their contribution rate reached 73.17%. RL and IL have always been the two largest land types in the central city. The proportion of RL exceeded 30%, while the proportion of IL remained at around 22%.
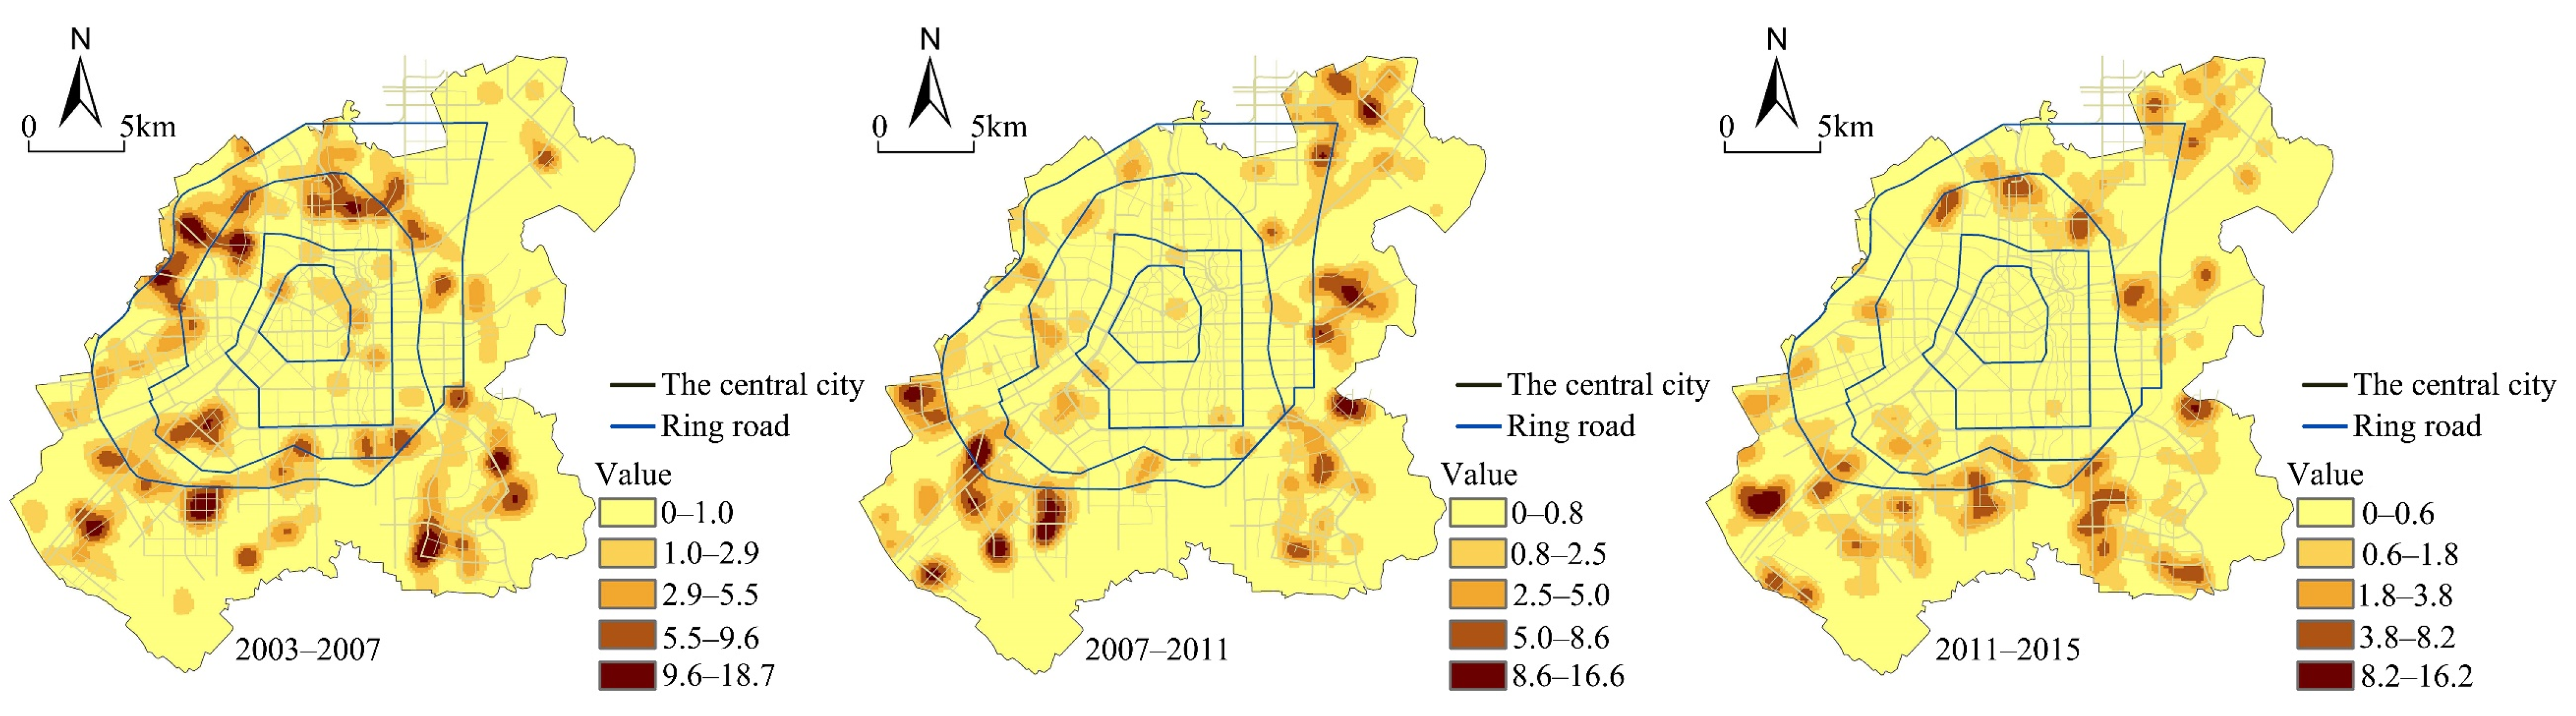
The area of RL, CL, PL and IL in the three stages increased by 31.13 km2, 8.66 km2, 6.88 km2 and 44.48 km2, respectively, through functional urban land expansion. The expansion of the functional urban land gradually shifted from the inner ring to the outer ring (Figure 4), and mostly occurred outside of the second ring road from 2003 to 2007, and outside of the third ring road in the latter two stages. From 2003 to 2007, the expansion of the four kinds of functional urban land outside of the second ring road accounted for 98%, including 26% in Z-3, 20% in Z-4, and 52% in Z-5. From 2007 to 2011, the expansion of the four kinds of functional urban land outside of the third ring road accounted for 86%, including 27% in Z-4 and 59% in Z-5. From 2011 to 2015, the expansion of the four kinds of functional urban land outside of the third ring road accounted for 93%, including 25% in Z-4 and 68% in Z-5. The functional urban land was mainly expanded to the southwest and southeast in the period from 2003 to 2015. Furthermore, from 2003 to 2007, the four kinds of functional urban land also expanded to the northwest and north. In the latter two stages, in addition to the southwest and southeast, the northeast and east were also the main directions for the functional urban land expansion. According to the Changchun city master plan, the government’s urban development strategy guided the direction of the urban spatial expansion.
Similar to the expansion of functional urban land, the area of functional urban land conversion was also very large. RL, CL, and PL increased by replacing other types of functional urban land, while IL decreased (Table 1). RL increased by 1105.17 ha by “convert in” (2109.73 ha) and “convert out” (1004.56 ha) modes, while CL increased by 100.88 ha and PL increased by 220.08 ha. The “convert in” mode of industrial land was much lower than the “convert out” mode, which resulted in a reduction in IL by 2402.06 ha. The conversion of the functional urban land mainly occurred in Z-1 during the first period, and mainly occurred in Z-3 from 2007 to 2015, which showed a trend of expansion from the inner ring to the outer ring. However, the third ring road was the spatial boundary of the conversion of functional urban land (Figure 5).
3.2. Spatiotemporal Analysis of Conversion and Expansion of Residential Land
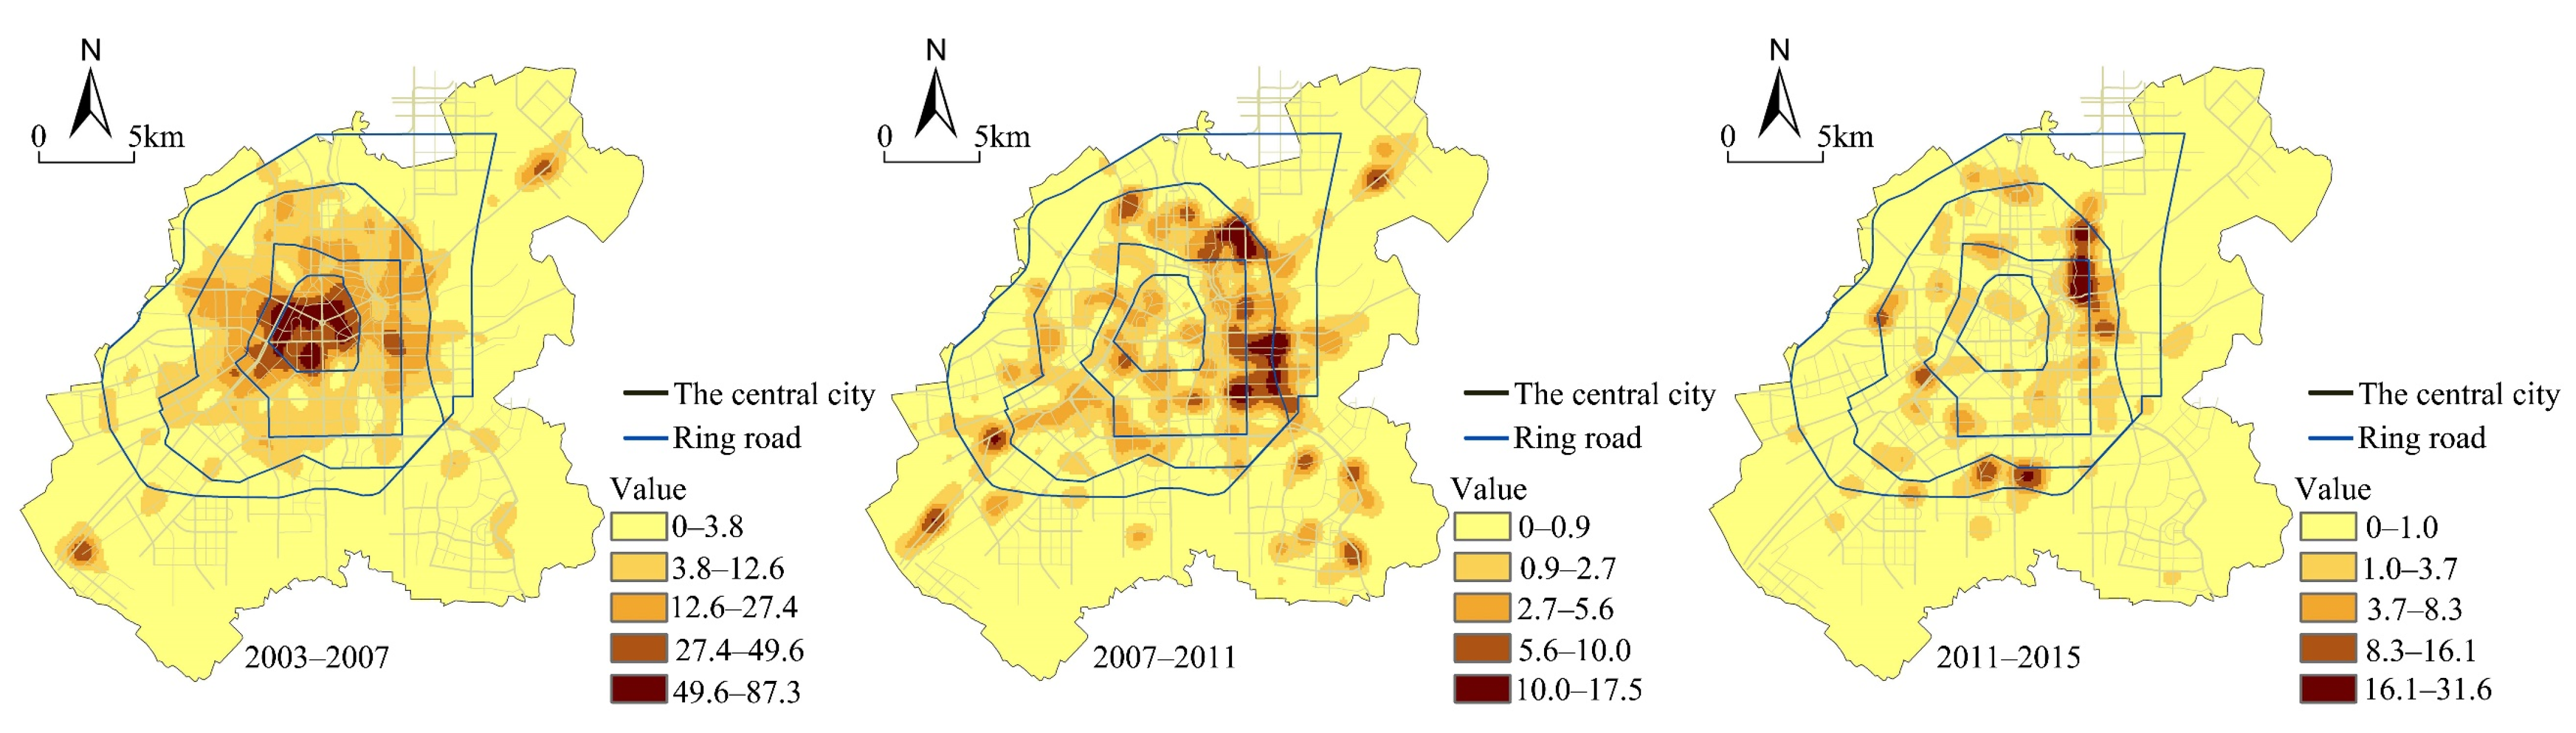
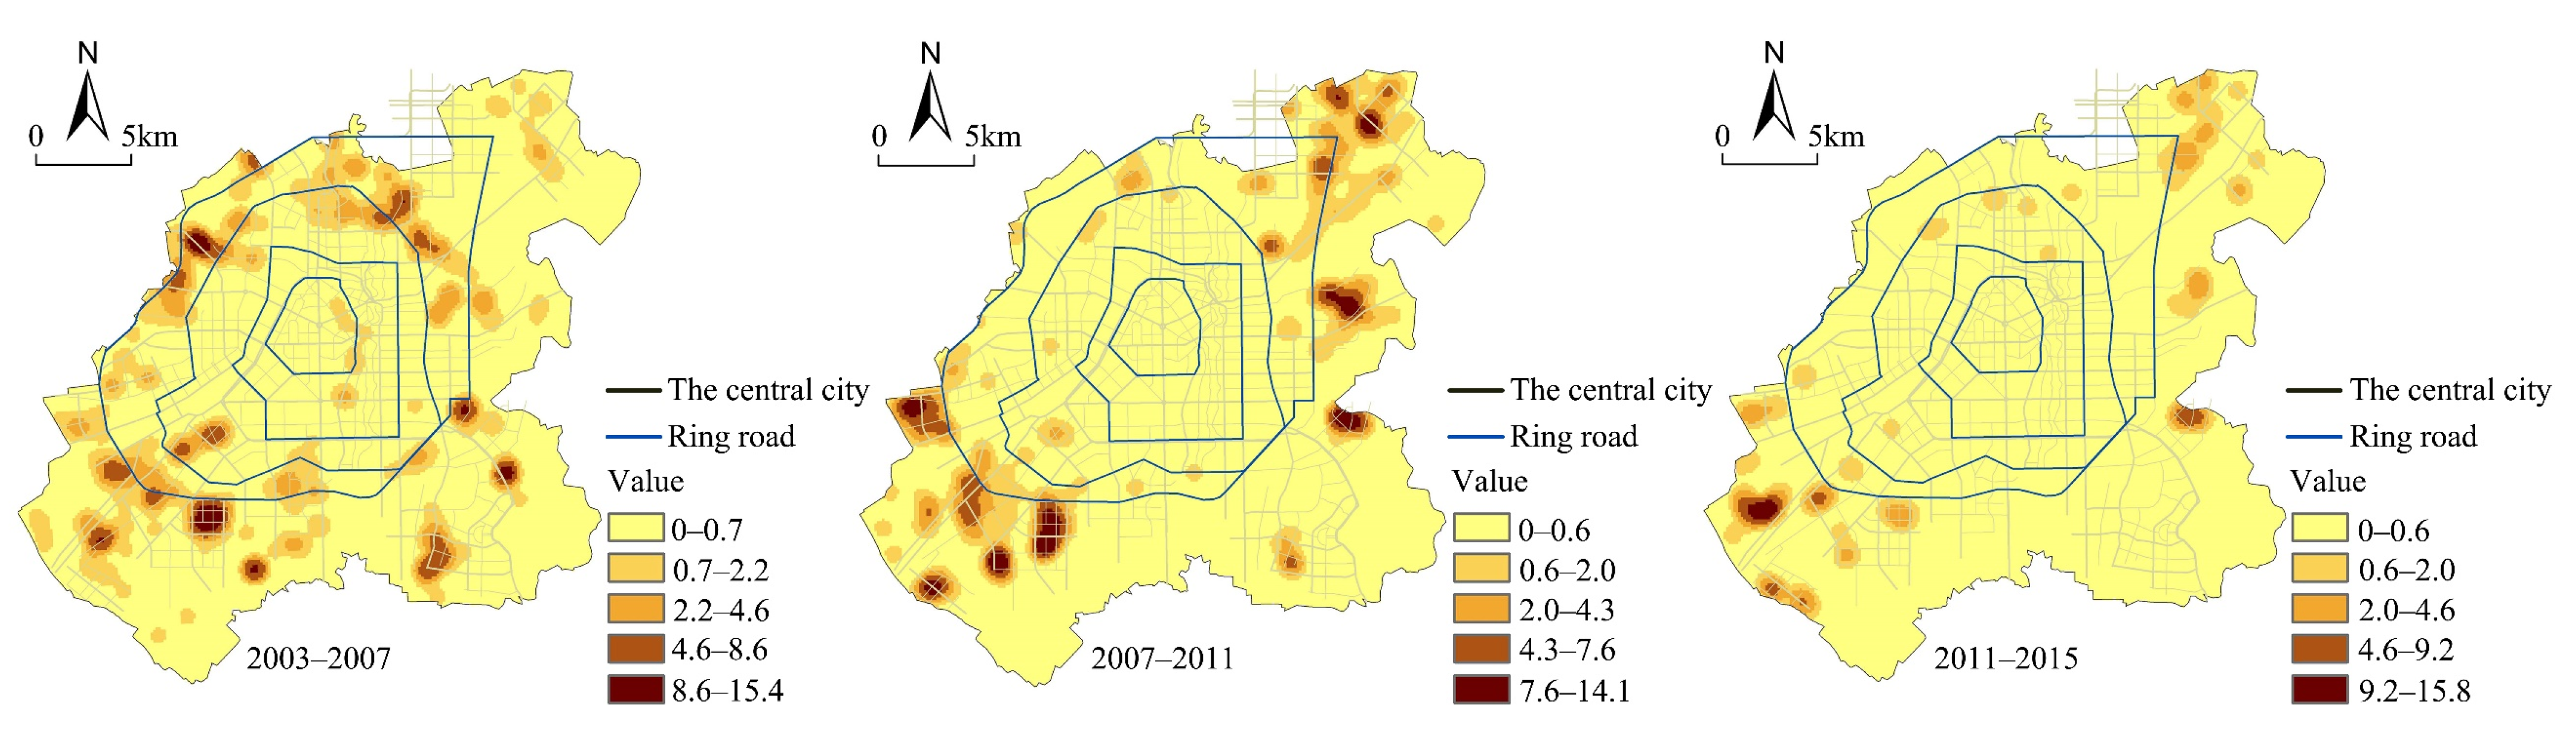
With further development, RL increased by 1357.58 ha between 2003 and 2007, 1851.99 ha between 2007 and 2011, and 1478.21 ha between 2011 and 2015. The expansion of RL mainly occurred outside of the second ring road and continued towards the outer ring road. The proportions of RL expansion beyond the second ring road in the three phases were 98.86%, 95.27%, and 99.72%, respectively; the proportions of RL expansion beyond the third ring road were 53.50%, 73.97%, and 91.64%, respectively; the proportions of RL expansion beyond the fourth ring road were 36.50%, 33.36%, and 62.49%, respectively. The residential space was constantly expanding from the inner circle to the outer circle (Figure 6). The directions of residential land expansion were heterogenous, changing from southeast, northwest, and north in 2003–2007 to southeast and east in 2007–2011, and towards the south, north, and northeast in 2011–2015.
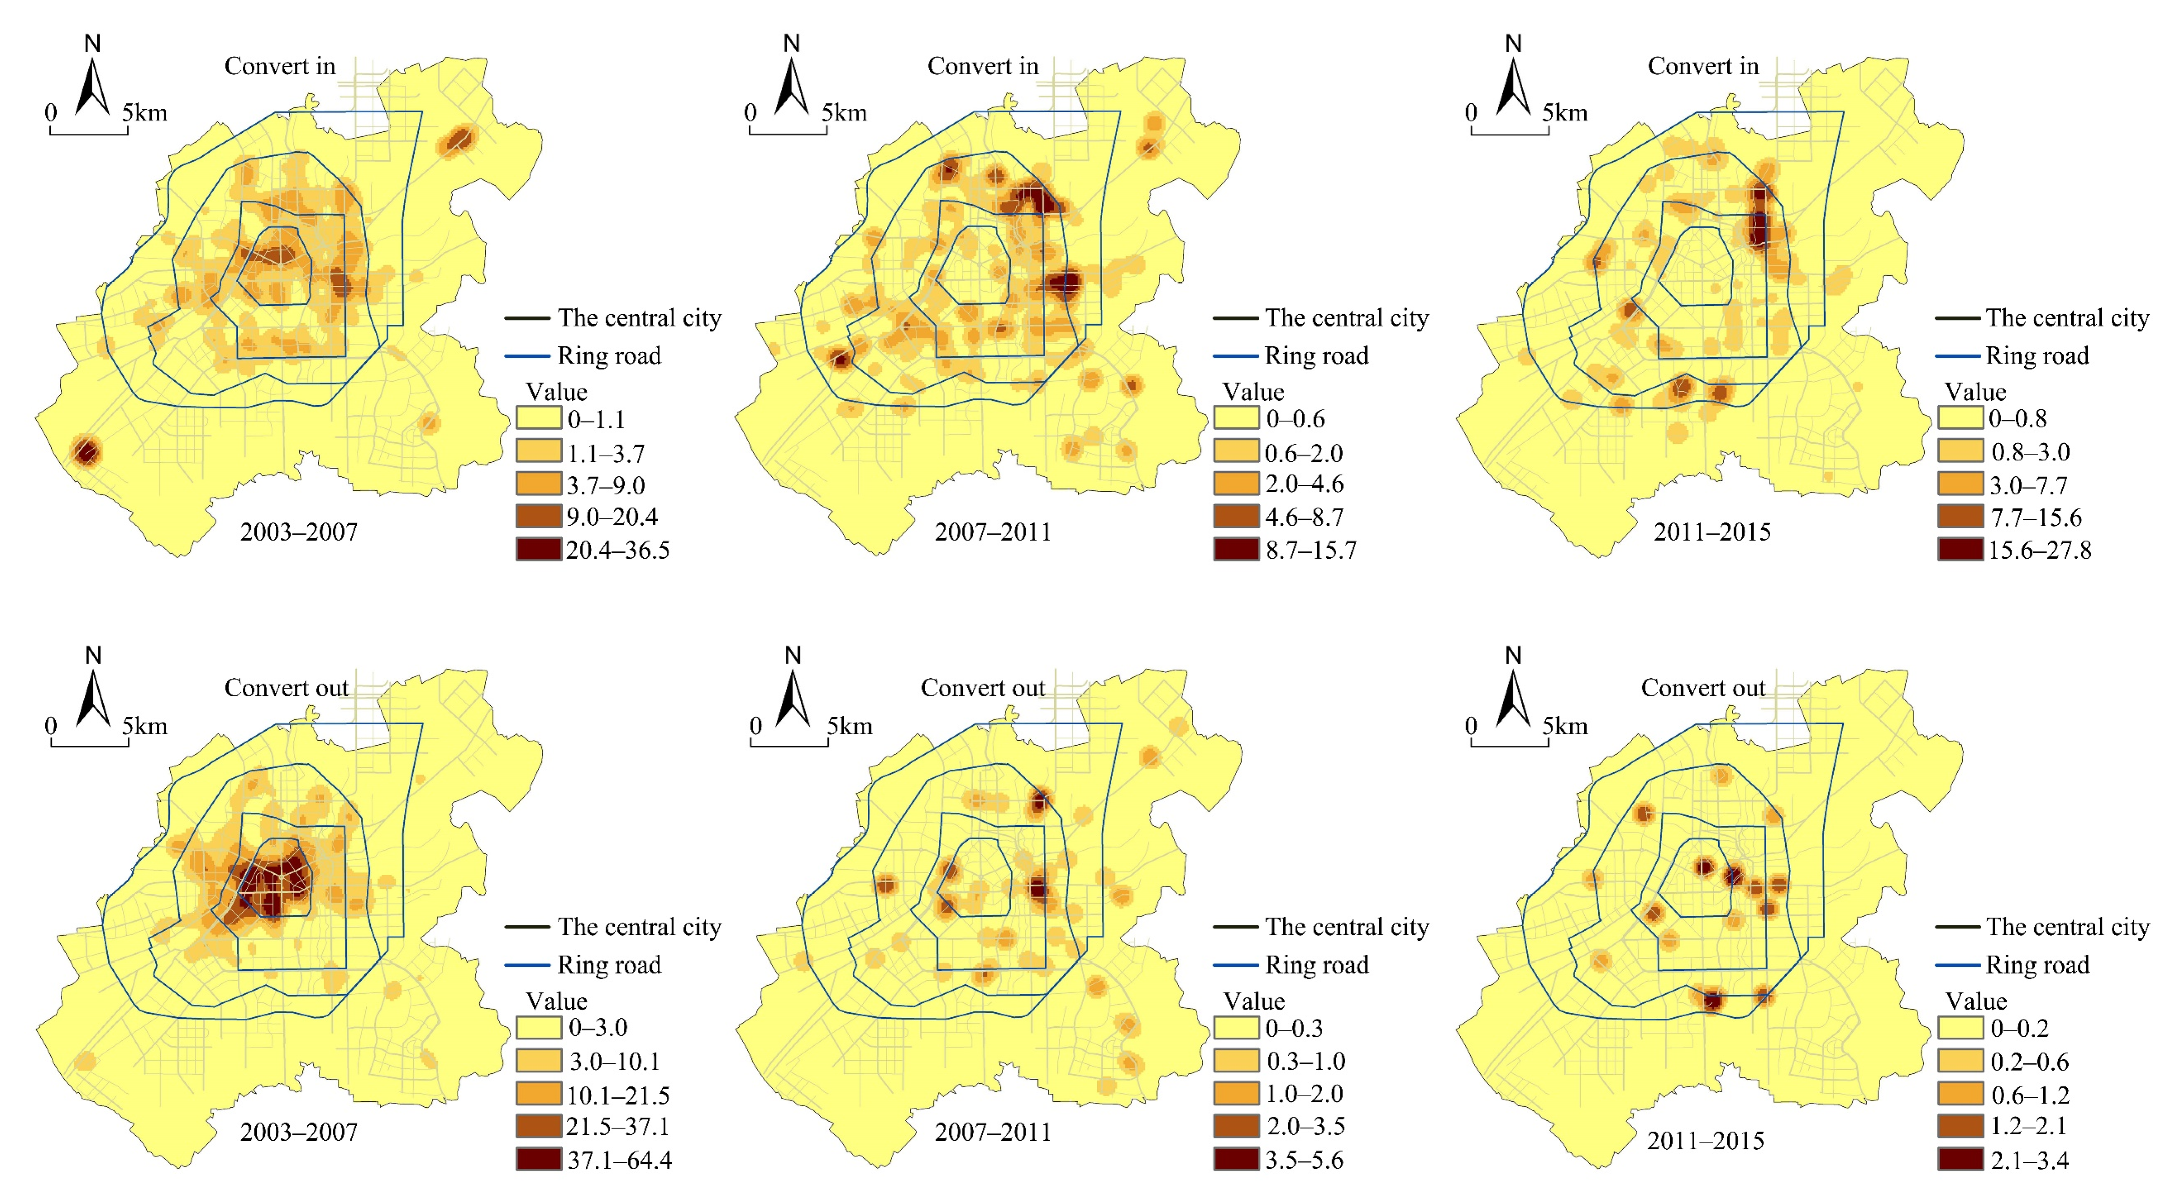
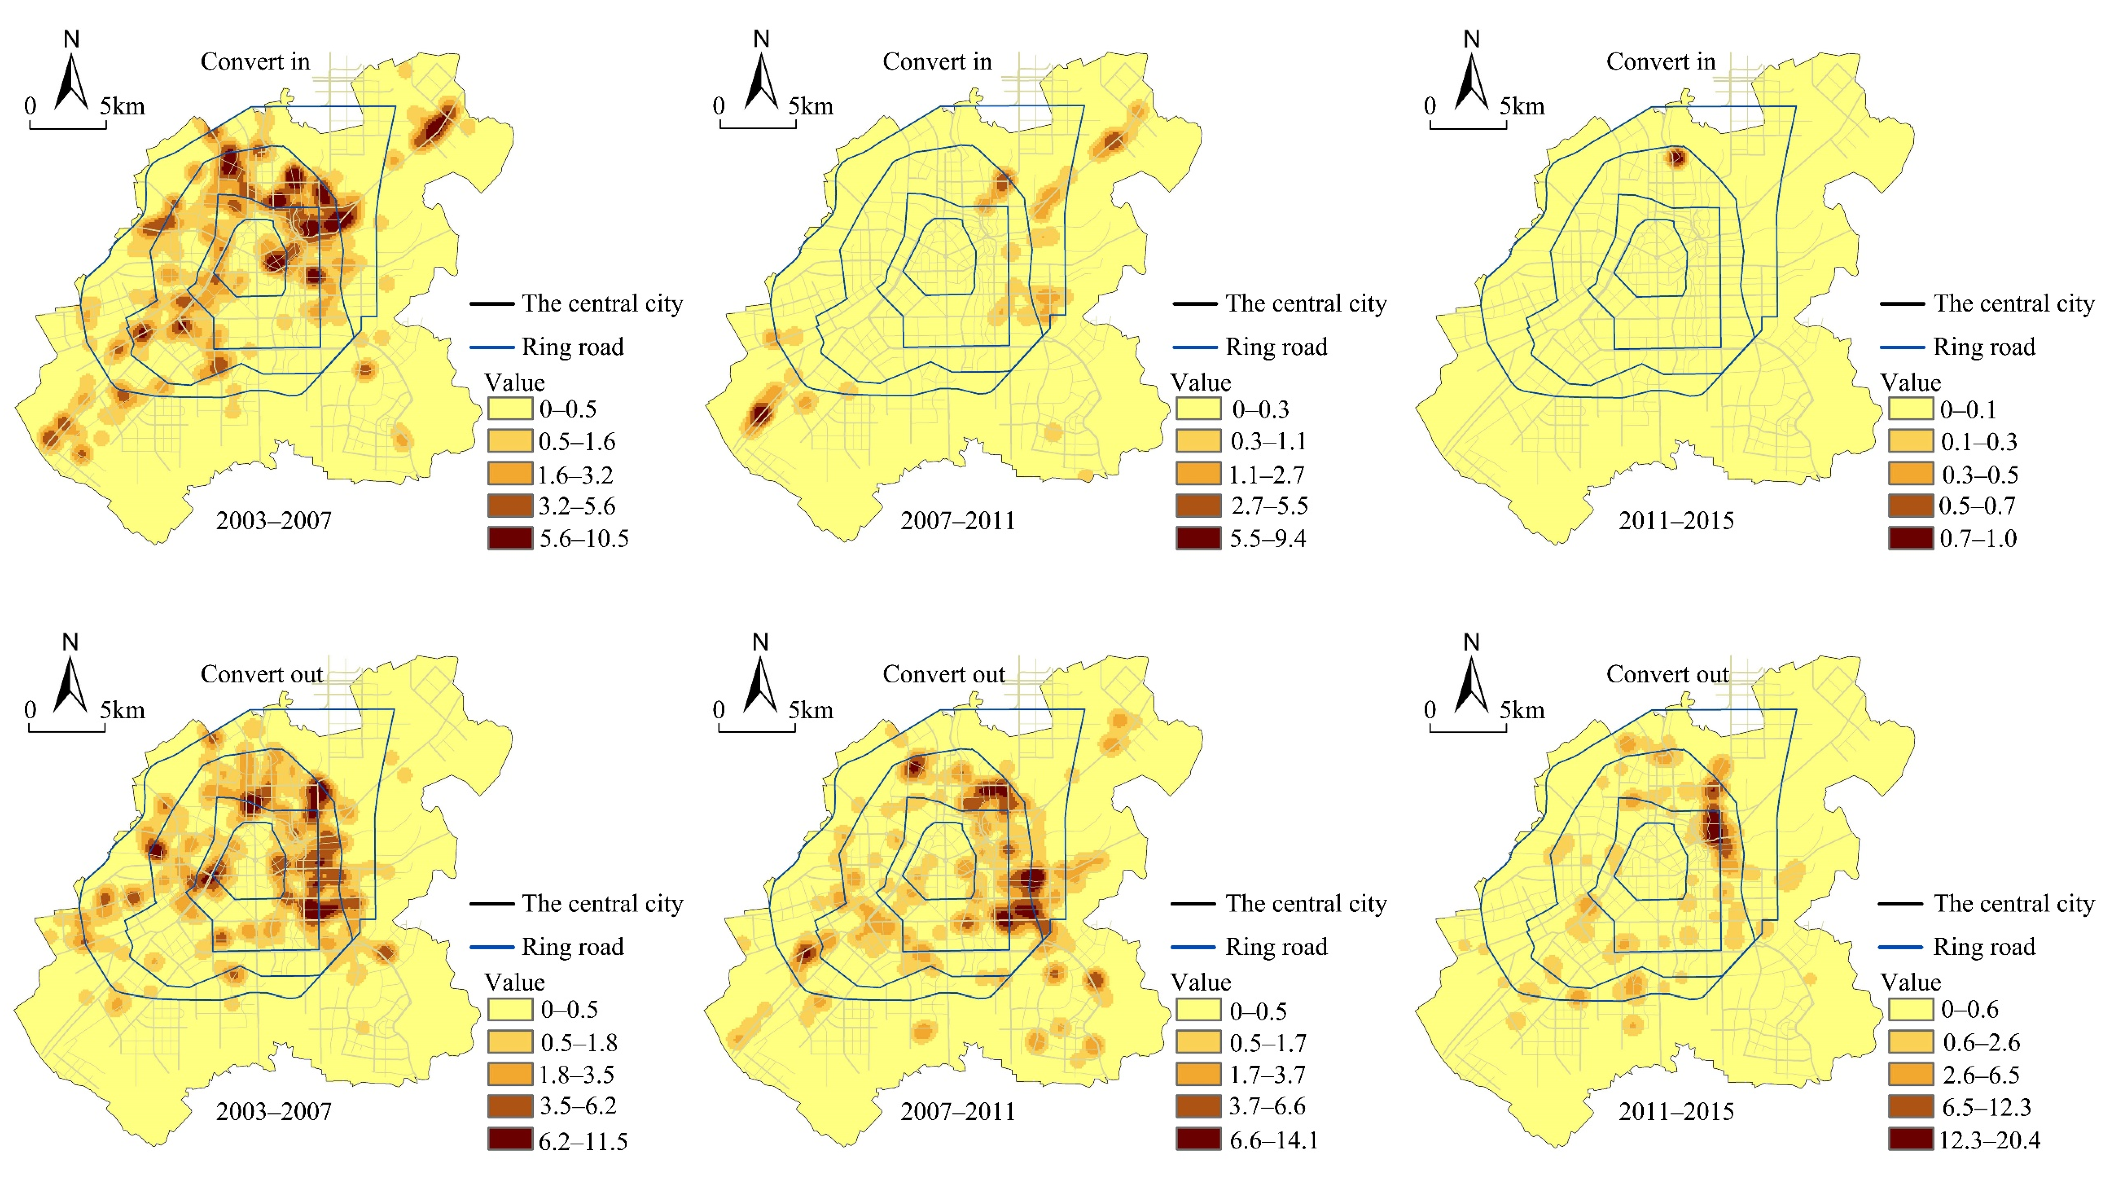
The conversion of RL was intense from 2003 to 2015, and the “convert in” area of RL was significantly larger than the “convert out” area. Through replacement, residential land increased by 127.16 ha between 2003 and 2007, 569.11 ha between 2007 and 2011, and 408.90 ha between 2011 and 2015. The “convert in” mode of RL during the three periods mainly occurred in Z-1, Z-2, and Z-3. (Figure 7). Due to the suburbanization of industry, IL has mainly been replaced by RL in the inner city. In the east and northeast of the central city, a large area of IL has been converted into RL. The “convert out” of RL mainly occurred in Z-1, Z-2, and Z-3 from 2003 to 2011, and in Z-1, Z-2, Z-3, and Z-4 from 2011 to 2015. Overall, the central city’s RL increased continuously from 2003 to 2015.
3.3. Spatiotemporal Analysis of Conversion and Expansion of Commercial Land
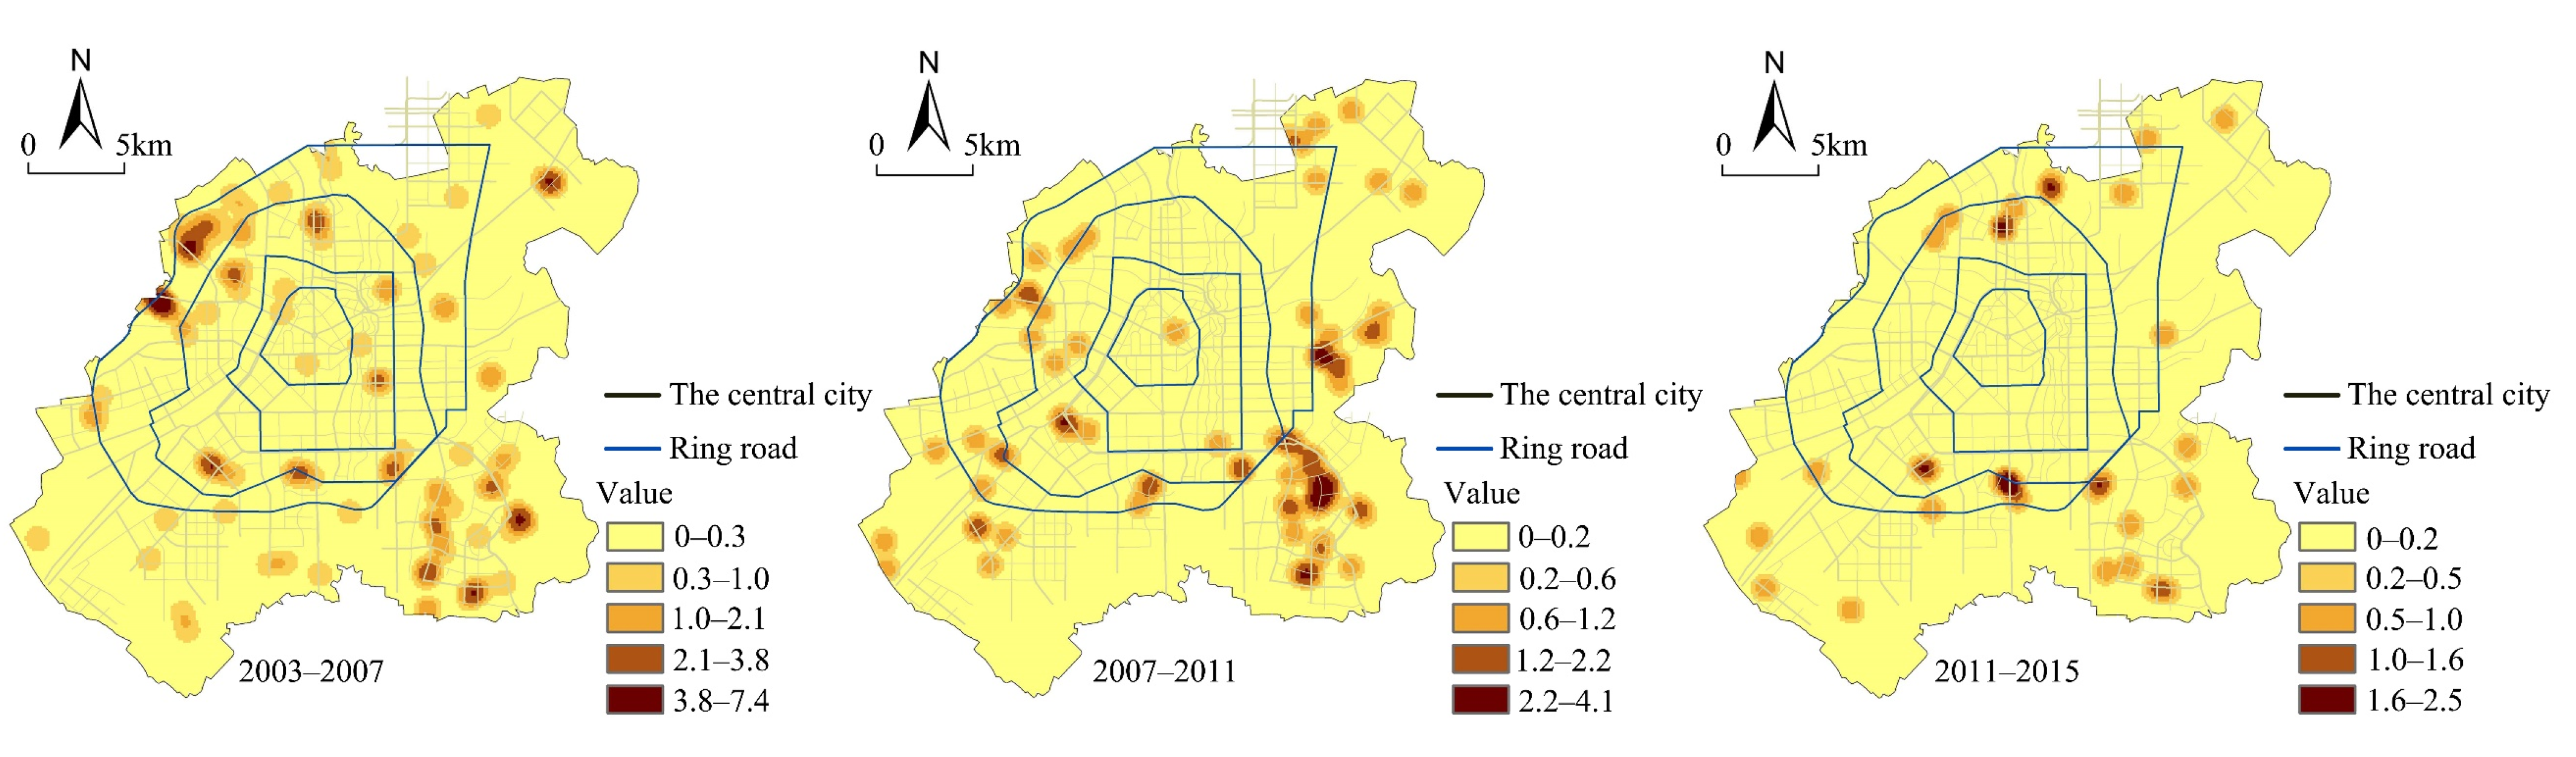
Judging by the average area of the expanding CL plots, the increase in commercial space was greatly influenced by the construction of large-scale flagship projects. Often, the development of flagship projects leads to concentric and directional characteristics of commercial land expansion (Figure 8). Combined with the field investigation, we found that the construction of the automobile trade city (on an area of 40 ha) led to the expansion of CL to the west during 2003–2007. The construction of a number of automobile sale and service shops (4S) led to the expansion of CL to the southwest during 2007–2011. The construction of JingYue CBD led the expansion of CL to the southeast. Since these large commercial facilities cover a large area, they were built on the edge of the central city. Therefore, the commercial space of the central city gradually expanded towards the outer circle, and the proportion of CL expansion outside of the fourth ring road was 34.02%, 58.88%, and 92.00% in the three stages, respectively.
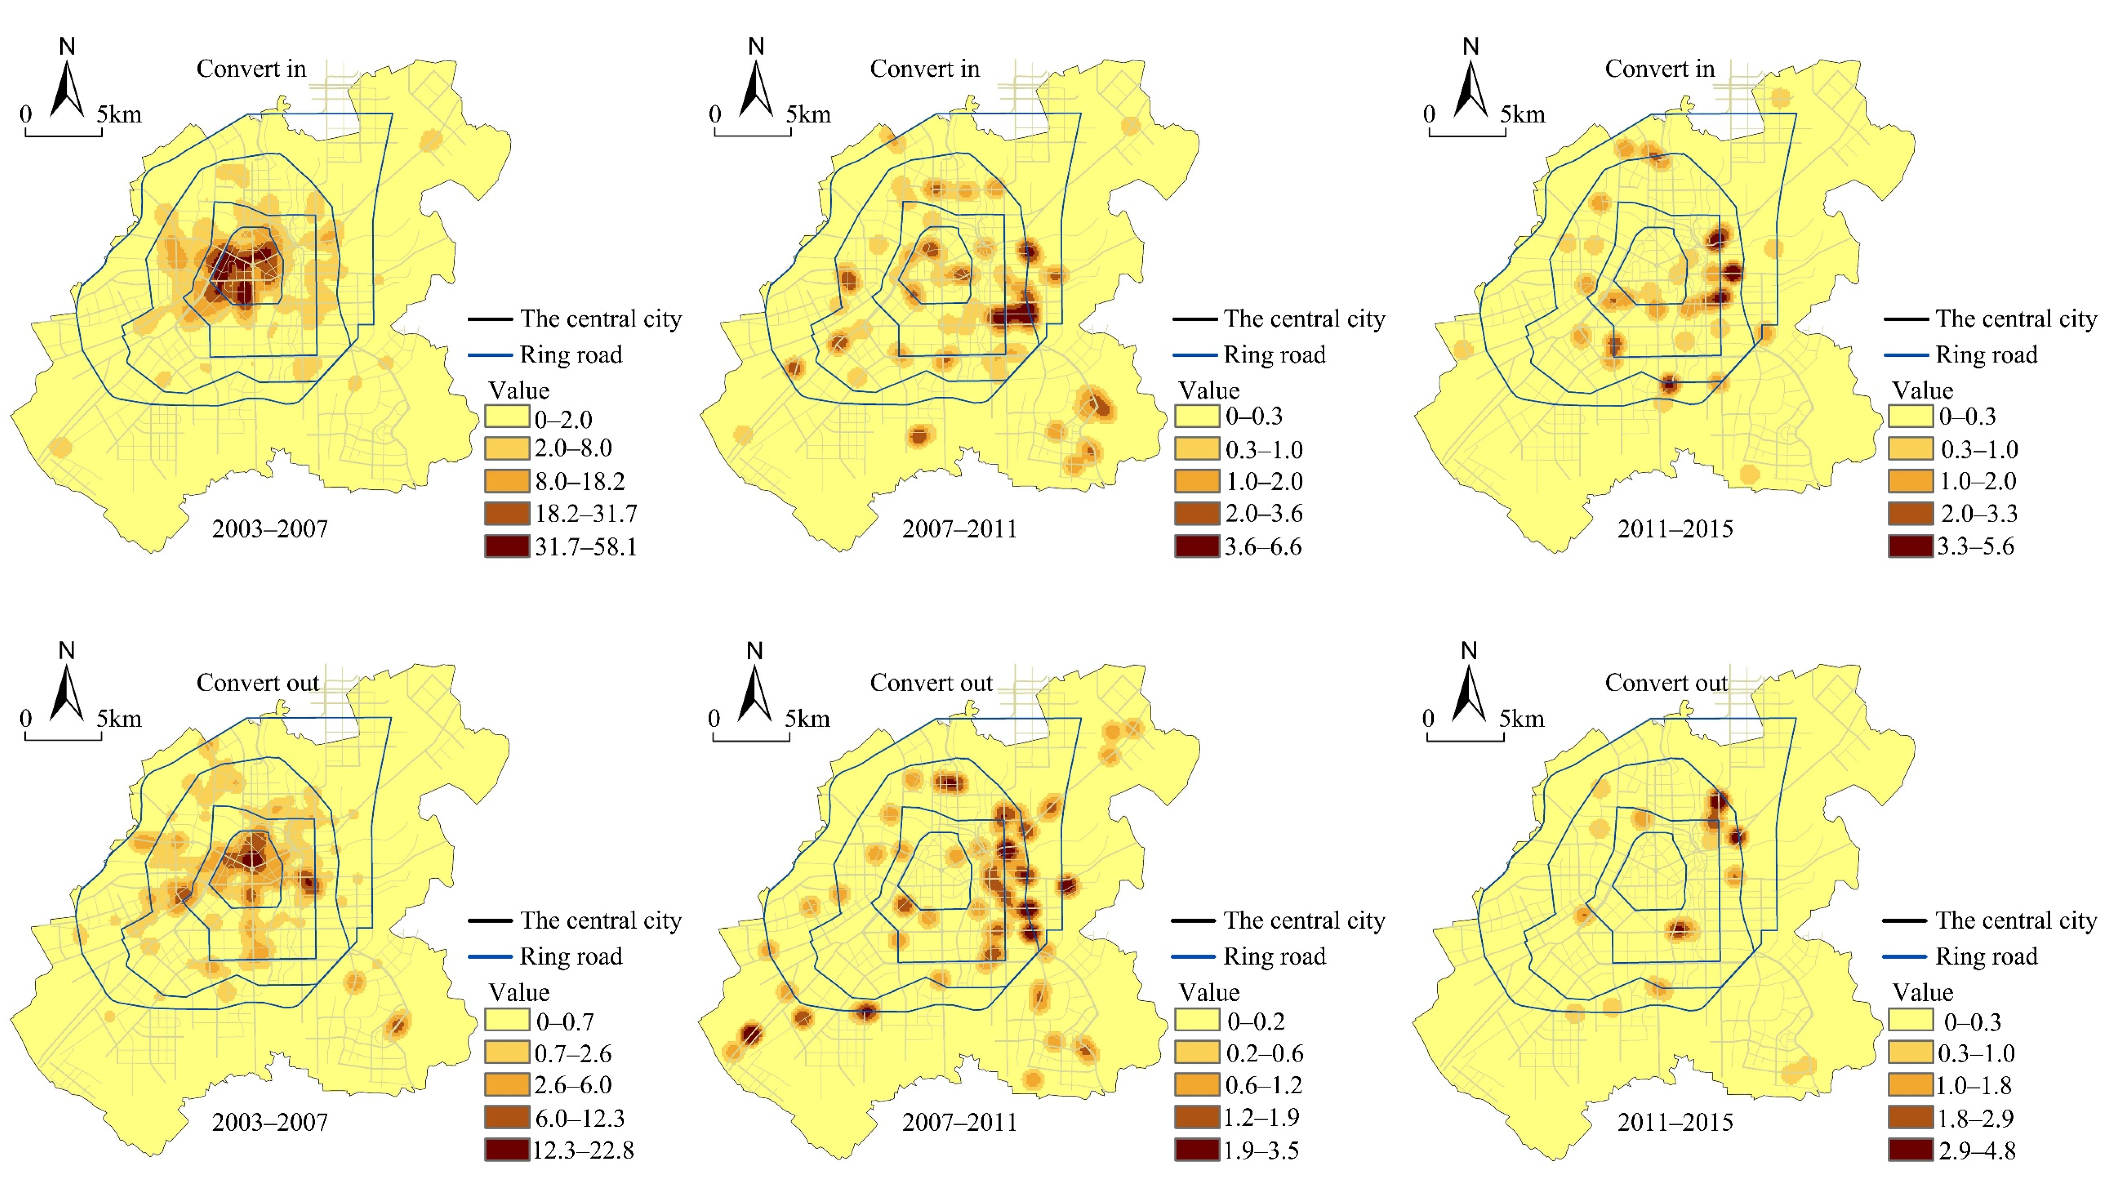
In general, with the replacement of functional urban land, the area of CL continued to expand, increasing by 328.07 ha, 85.91 ha, and 38.42 ha in the three stages, respectively. The “convert in” mode of CL mainly occurred within the first ring road during 2003–2007 and was mostly within the third ring road during 2007–2015. Compared to the first period, the “convert in” mode of CL was expanded in the latter two stages. CL has largely replaced IL, indicating that the process of “suppress the second industry and develop the third industry” is continuing. The price of CL is generally higher than that of the other types of functional urban land. Therefore, it is generally rare to replace CL with other kinds of functional urban land. However, in this study, a large area of CL has been replaced by other kinds of functional urban land, especially RL and PL. Field research has shown that CL, replaced by other urban land types, was usually low-grade commercial facilities with chaotic layout and wasted land. The conversion of the functional urban land has thus promoted the integration of this inefficient land into the surrounding built-up environment. The “convert out” mode of CL mainly occurred in Z-1 and Z-2 from 2003 to 2007 and in Z-3 and Z-4 from 2007 to 2011 (Figure 9). In the third stage, the area of the “convert out” of CL decreased sharply and was concentrated only towards the northeast in Z-3.
3.4. Spatiotemporal Analysis of Conversion and Expansion of Public Service Land
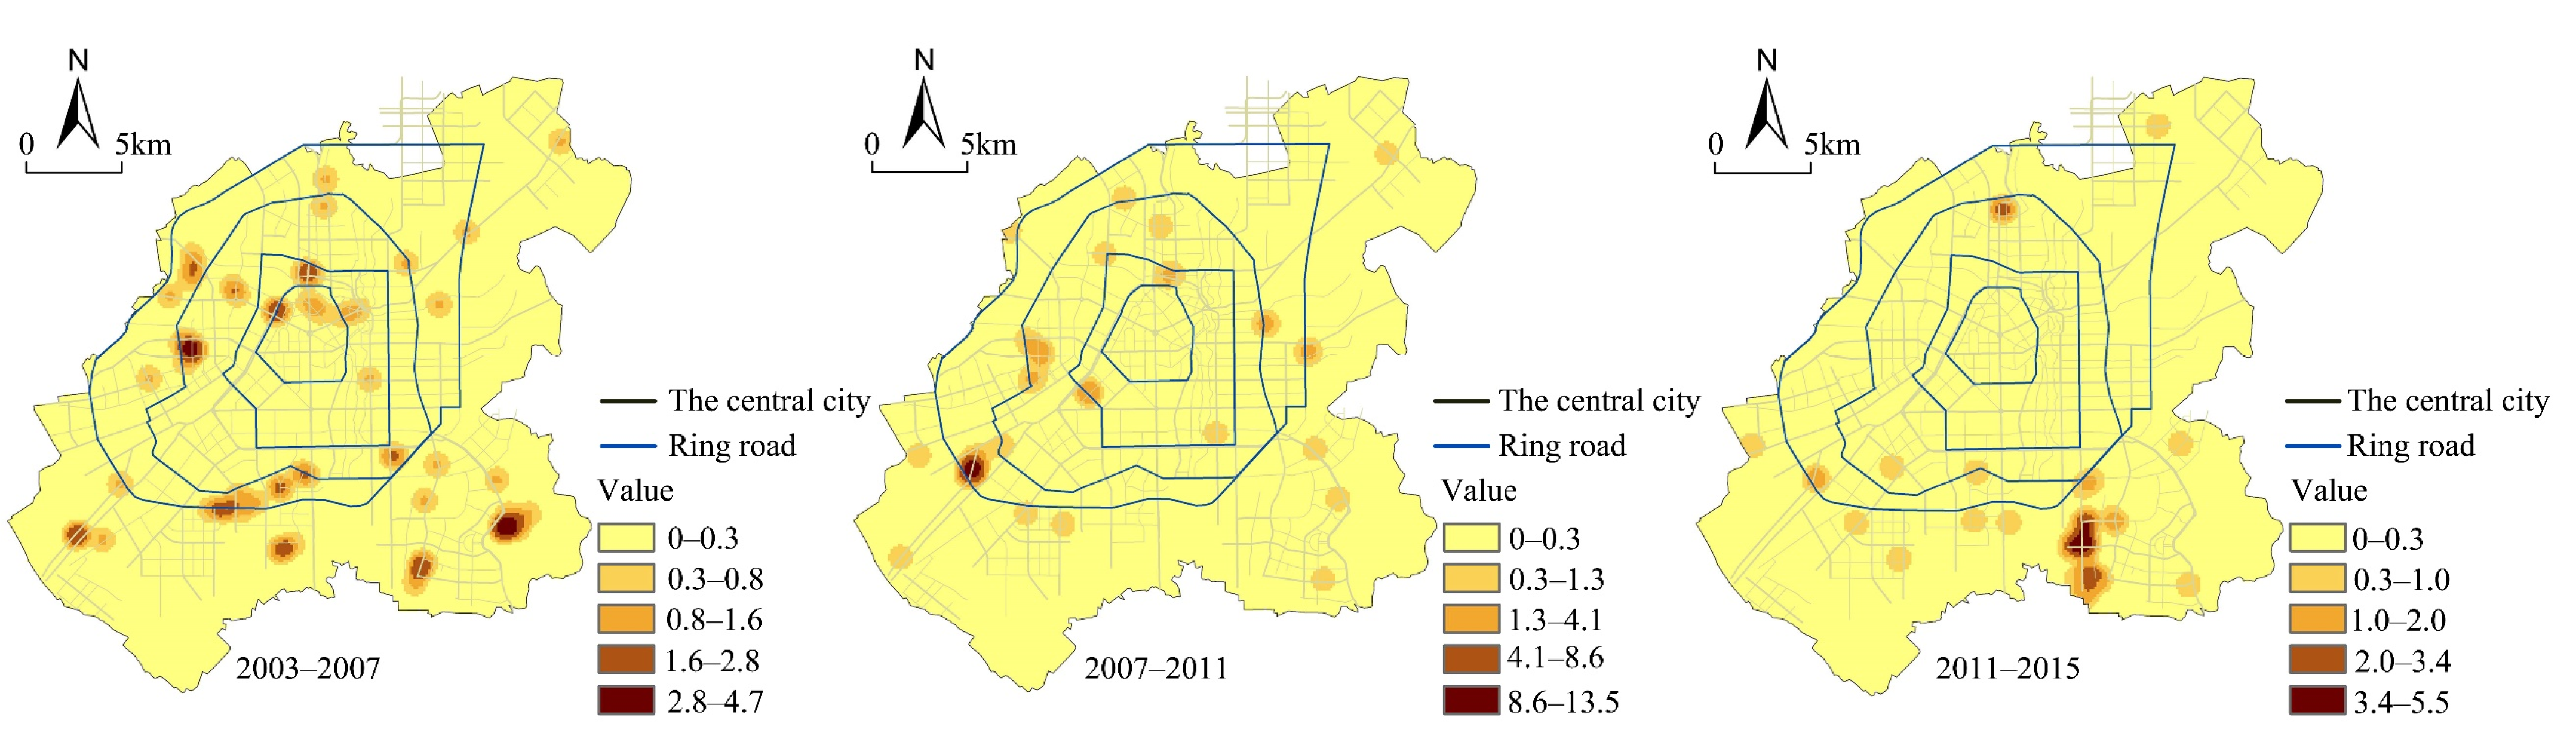
The expansion of PL over the three phases showed that the public service space mainly expanded towards the outside of the southeast in Z-5 (Figure 10). According to the city master plan of Changchun, the ecological environment in the southeast of Changchun is beautiful, and the forest is widespread. The master plan pointed out that the Changchun municipal government has been committed to transforming the area into a “University Town” and a “New Livable Town” since the mid-1990s. Accordingly, universities and exhibition facilities gradually gathered in the area. The relocation of Jilin Jianzhu University and the expansion of Jilin Agricultural University led to this expansion of PL during 2003–2007. In 2007–2011 and 2011–2015, the construction of convention and exhibition facilities, as well as the expansion of universities led to an expansion of PL. The Changchun modern agricultural park, which covers an area of 106 ha, was formally established in 2009. A scientific research institution, the Chinese Academy of Agricultural Sciences, was relocated to the “University Town” in 2011. The educational and exhibition facilities have led to an expansion of PL.
The conversion of PL became less and less frequent from 2003 to 2015. During the period of 2003–2007, an area of 358.97 ha was converted from PL to other urban land types. The area that was converted from the other urban land types to PL was 563.85 ha, resulting in an increase of 204.88 ha in PL. The area of “converted in” was 168.52 ha, and the area of “converted out” was 153.84 ha, indicating an increase of 14.98 ha from 2007 to 2011. From 2011 to 2015, the area of “converted in” was 67.72 ha, and the area of “converted out” was 57.65 ha, indicating an increase of 10.07 ha. The “convert in” and “convert out” modes of PL mainly occurred in Z-1, Z-2, and Z-3 (Figure 11). Similar to the conversion of CL, the replacement of PL has shown that the urban service functions needed to be further improved, especially in Z-1, Z-2, and Z-3. With the continuous improvement of the urban service functions in the inner city, the conversion of PL can be moved from the inner circle to the outer circle. The conversion between residential, commercial and public service lands occurred frequently. From 2003 to 2007, 53.56% of the PL, converted from other urban land types, consisted of RL and CL. However, 75.84% of the PL converted to other urban land types consisted of RL and CL. From 2007 to 2011, 35.25% of the PL, converted from other urban land types, consisted of RL and CL. However, 78.88% of the PL, converted into other urban land types, consisted of RL and CL. From 2011 to 2015, 50.25% of the PL, converted from other urban land types, consisted of RL and CL. However, 99.92% of the PL, converted to other urban land types, consisted of RL and CL.
3.5. Spatiotemporal Analysis of Conversion and Expansion of Industrial Land
The expansion of IL showed predictable spatial characteristics. From 2003 to 2015, there was an expansion of IL mainly towards the southwest in Z-5. The northeast expansion beyond the fourth ring road was added during the latter two stages (Figure 12). It is clear that the southwest and northeast were the main directions of the expansion of IL, while Z-5 was the main circle of IL expansion. Between 2003 and 2007, the proportion of IL expansion in Z-5 accounted for 66.40%. IL expansion in the southwest direction was 44.91%. During the latter two stages, the proportions of IL expansion in Z-5 were 84.19% and 79.95%, respectively. From 2007 to 2011, the proportions of IL expansion in the southwest and northeast were 41.57% and 34.63%, respectively. From 2011 to 2015, the proportions of the expansion of IL in these two directions accounted for 38.68% and 36.80%, respectively. According to the city master plan of Changchun, the automobile industry is the pillar industry of Changchun, and the expansion of the automobile industry in the southwest is the main reason for the observed IL expansion.
From 2003 to 2015, the conversion of IL was very frequent, and IL was continuously replaced by other urban land types (Figure 13). It is clear that IL is constantly being replaced by other urban land types. During all of the three periods, the areas of IL that replaced other urban land types were 834.66 ha, 94.63 ha, and 1.38 ha, respectively; the areas of IL converted into other urban land types were 818.16 ha, 667.46 ha, and 348.03 ha, respectively. The IL “converted out” area exceeded the IL “converted in” area. By replacing IL, it increased by 16.5 ha between 2003 and 2007, decreased by 572.83 ha between 2007 and 2011, and decreased by 346.64 ha between 2011 and 2015. IL was constantly replaced by RL. In all of the three stages, the proportions of the area converted from IL to RL were 38.50%, 75.03%, and 85.52%, respectively. The “convert in” mode of IL mainly occurred in Z-2, Z-3, and Z-4 between 2003 and 2007. In the latter two stages, the “convert in” mode of IL was not obvious. The “convert out” mode of IL in the three periods mainly occurred in Z-1, Z-2, and Z-3. IL in the inner city was gradually moved to the periphery of the city (industrial suburbanization).
4. Discussion
The existing literature on urban space mainly uses urban land expansion data to study urban spatial evolution by comparing the structure of urban space in different years [16,17,18,19,20,21,22]. In this study, we explored the dynamic changes of urban space from two perspectives of functional urban land expansion and conversion. Our research demonstrated that functional urban land conversion, similar to functional urban land expansion, is also very common in developing cities. Urban land use maps have facilitated this work. In fact, scholars have been able to identify the different kinds of functional urban spaces or areas through a variety of data [11,12,13,26]. We suggest that scholars can use the above identified functional urban space or area data to further analyze the replacement between different functional urban land types in order to explore the inherent characteristics of urban spatial evolution. Our work showed that the combination of urban land expansion and conversion can effectively reveal changes in intra-urban space. The structure of urban land use changed slightly from 2003 to 2015. The proportions of RL and CL increased from 27.82% and 3.71% in 2003 to 31.04% and 5.30% in 2015, respectively. The proportions of PL and IL decreased from 11.48% and 23.02% in 2003 to 10.42% and 21.54% in 2015, respectively. The change in urban land use structure is the joint effect of expansion and conversion, but we often ignore the conversion between different types of functional urban land. In addition, using urban land use data at four-year intervals (2003, 2007, 2011, and 2015), our findings prove that functional urban land expansion and conversion in developing cities are very frequent under the process of rapid urbanization. Usually, the topic of urban spatial evolution is studied over a long time period, such as five or ten years [17,18,20,22]. However, our research suggests that for developing cities, the time interval can be shortened, such as the four-year period in this article.
On the basis of the research conducted by Tian et al. (2010) [24], we not only analyzed the concentric characteristics of the functional urban space, but also analyzed the concentration along spatial directions. The concentric characteristics of the expansion of different types of functional urban land are similar, while the directional characteristics are different. RL, CL, PL, and PL have all expanded into the outer circle. RL was mostly expanded into Z-3, Z-4, and Z-5, while CL, PL and IL were mainly expanded into Z-5. RL gradually expanded from the inner circle to the outer circle; the expansion of IL to the periphery was the result of industrial suburbanization, and the construction of large flagship projects has directed the expansion of CL and PL to the periphery. Influenced by urban development strategies and urban planning, the directions of expansion of the four types of functional urban land have shown different characteristics. Southeast, southwest, and south were the main directions for expanding RL; CL expanded in many directions, but there was only one main direction (southeast) for the expansion of PL, and IL has largely expanded to the southwest and northeast.
The conversion of the functional urban land in Z-1, Z-2, and Z-3 showed the characteristics of the transition from the inner circle to the outer circle. The conversion of functional urban land beyond the third ring road was rare. Only the “convert out” mode of RL and CL and the “convert in” mode of IL in a certain period could happen in Z-4. RL, CL, and PL were constantly replacing other types of functional urban land, while IL was constantly being transformed into other types of functional urban land. The conversion area of the four types of functional urban land in Z-1 was large in the first phase and small in the latter two phases. The Z-2 and Z-3 were zones where the area of functional urban land conversion was large in the latter two phases. The “convert in” mode of RL, CL, and PL was mainly located in Z-1, Z-2, and Z-3, which was a process of continuous improvement of the urban functions of the inner city. In the first period, the “convert in” mode of IL was larger than the other three types of functional urban land, and mostly concentrated in Z-2, Z-3, and Z-4. However, in the latter two periods, the “convert in” mode of IL was rare. The “convert out” mode of RL and CL changed from being concentrated in Z-1, Z-2, and Z-3 to being concentrated in Z-1, Z-2, Z-3, and Z-4. The redistribution of public service facilities and the suburbanization of industries have led to the “convert out” mode of PL and IL mainly in Z-1, Z-2, and Z-3.
Our research found that the conversion and expansion of the functional urban land in the central city of Changchun show similar characteristics as the concentric circle and the sector modes. The conversion and expansion of the functional urban land show the obvious characteristics of concentric circles. Influenced by urban planning and urban development policies, the conversion and expansion of functional urban land show predictable fan-shaped (directional) characteristics. The Burgess concentric zone theory and Hoyt’s sector theory are static modes of urban spatial structure [24,40,41]. However, the concentric zone mode and the sector mode are not static for a developing city but are dynamic. In other words, the static layout of urban space exhibits concentric circles and fan-shaped characteristics, and the evolutionary process of urban space also exhibits concentric circles and fan-shaped characteristics for developing cities. The conversion and expansion of the different functional urban lands show different concentric circles and fan-shaped characteristics at different periods. The expansion of RL, CL, PL, and IL shifts from the second ring road to the third ring road. The direction of expansion of RL, CL, PL, and IL in the three stages is different. The conversion of RL, CL, PL, and IL also show dynamic changes in the concentric circles and in the fan-shaped characteristics.
Our research will provide theoretical support for the coordinated development of different types of functional urban space in different areas of a city. The coordinated development of urban space will further contribute to the optimization of urban spatial structure and will promote the sustainable development of urban space. However, this study has one main shortcoming. We only studied urban space from the perspective of functional urban land. Urban space is complex, and apart from land, it also covers other elements such as population, architecture, transportation, society, and culture. In general, it is biased to explore the evolution of urban space using a single criterion rather than multiple criteria. We therefore should consider additional development elements to overcome this shortcoming in future research, rather than only using a single criterion. Moreover, it should also be noted that urban land use is one of the most important indicators of urban space and can effectively decode the geospatial pattern of cities. Our study proves that the phenomenon of intra-urban land transformation brought by rapid urbanization is common and needs to draw the attention of urban policy makers and decision makers to scientifically adjust the strategy of urban spatial development. We hope that this research will be open to other researchers who study urban space from different perspectives in order to obtain inspiration for urban research. In addition, the quantitative methods we used are retrospective tools. We will introduce predictive tools to study the temporal and spatial changes in the replacement and expansion of functional urban spaces in the future in order to better optimize the urban spatial structure.
5. Conclusions
With the help of urban land use maps and other auxiliary data, we analyzed the temporal and spatial characteristics of the replacement and expansion of different types of functional urban land using overlay analysis, transition matrix, and kernel density estimation methods. The results prove that the analysis of the replacement and expansion of functional urban land can reflect the dynamic evolution of urban space in the context of rapid urbanization. This research showed that changing the structure of land use in cities and expanding and replacing the functional urban land can be used to analyze whether the urban spatial structure has stabilized. The conversion and expansion of functional urban land in the central city of Changchun is still very active, which indicates that urban spaces have not yet stabilized and that they still require continuous improvement. When one kind of functional urban land replaces other kinds of functional urban land, there is further replacement by other kinds of functional urban land. This study demonstrated changes between RL, CL, PL, and IL. Combined with changes in the structure of the land use in cities, suggestions can be made for the future layout of urban land, and the urban spatial structure can be adjusted in order to promote sustainable urban spatial development.
The temporal and spatial characteristics of urban spatial evolution are a classic research theme involving multiple disciplines of urban planning, geography, and economics. The spatiotemporal changes in the functional urban land evolution and the path of optimization of urban spatial structure were explored in order to support the reasonable development of urban space. As we mentioned in the Introduction section, our research methods and conclusions are generally applicable to developing cities around the world in order to help urban policy makers propose sound strategies for the scientific development of urban spaces.
Author Contributions
Conceptualization, G.Z. and C.L.; methodology, G.Z. and Y.L.; software, G.Z.; formal analysis, J.Z.; investigation, G.Z. and J.Z.; writing—original draft preparation, G.Z. and J.Z.; writing—review and editing, G.Z., C.L. and Y.L. All authors have read and agreed to the published version of the manuscript.
Funding
This research was funded by the National Natural Science Foundation of China, grant number 42171191, 41771172, 41871158; the China Postdoctoral Science Foundation, grant number 2018M641760; the Education Department of Jilin Province, grant number JJKH20201173KJ.
Acknowledgments
The authors acknowledge the journal editors and guest editors of the Special Issue “Land Use Change from Non-urban to Urban Areas: Problems, Challenges and Opportunities” for their support and the granting of funding covering the fees related to the publishing of this paper.
Conflicts of Interest
The authors declare no conflict of interest.
References
- Li, B.; Yao, R. Urbanization and its impact on building energy consumption and efficiency in China. Renew. Energy 2009, 34, 1994–1998. [Google Scholar] [CrossRef]
- United Nations. World Urbanization Prospects: The 2018 Revision; UN DESA: New York, NY, USA, 2018. [Google Scholar]
- UNICEF. Unicef Urban Population Map. 2017. Available online: https://www.unicef.org/sowc2012/urbanmap/# (accessed on 26 May 2018).
- Hammad, A.W.; Akbarnezhad, A.; Haddad, A.; Vazquez, E.G. Sustainable zoning, land-use allocation and facility location optimisation in smart cities. Energies 2019, 12, 1318. [Google Scholar] [CrossRef] [Green Version]
- Přívara, A.; Rievajová, E.; Barbulescu, A. Attracting high skilled individuals in the EU: The finnish experience. Migr. Lett. 2020, 17, 369–377. [Google Scholar] [CrossRef]
- Paul, S. Characteristics of migrants coming to Europe: A survey among asylum seekers and refugees in Germany about their journey. Migr. Lett. 2020, 17, 825–835. [Google Scholar] [CrossRef]
- Xia, C.; Zhang, A.; Wang, H.; Zhang, B.; Zhang, Y. Bidirectional urban flows in rapidly urbanizing metropolitan areas and their macro and micro impacts on urban growth: A case study of the Yangtze River middle reaches megalopolis, China. Land Use Policy 2019, 82, 158–168. [Google Scholar] [CrossRef]
- Dong, T.; Jiao, L.; Xu, G.; Yang, L.; Liu, J. Towards sustainability? Analyzing changing urban form patterns in the United States, Europe, and China. Sci. Total Environ. 2019, 671, 632–643. [Google Scholar] [CrossRef]
- Vu, T.-T.; Shen, Y. Land-use and land-cover changes in Dong Trieu District, Vietnam, during past two decades and their driving forces. Land 2021, 10, 798. [Google Scholar] [CrossRef]
- Zhou, G.; Li, C.; Liu, Y.; Zhang, J. Complexity of functional urban spaces evolution in different aspects: Based on urban land use conversion. Complexity 2020, 2020, 9741203. [Google Scholar] [CrossRef]
- Gao, S.; Janowicz, K.; Couclelis, H. Extracting urban functional regions from points of interest and human activities on location-based social networks. Trans. GIS 2017, 21, 446–467. [Google Scholar] [CrossRef]
- Tu, W.; Cao, J.; Yue, Y.; Shaw, S.L.; Zhou, M.; Wang, Z.; Chang, X.; Xu, Y.; Li, Q. Coupling mobile phone and social media data: A new approach to understanding urban functions and diurnal patterns. Int. J. Geogr. Inf. Sci. 2017, 31, 2331–2358. [Google Scholar] [CrossRef]
- Gao, Q.; Fu, J.; Yu, Y.; Tang, X. Identification of urban regions’ functions in Chengdu, China, based on vehicle trajectory data. PLoS ONE 2019, 14, e0215656. [Google Scholar] [CrossRef] [Green Version]
- Banzhaf, E.; Kabisch, S.; Knapp, S.; Rink, D.; Wolff, M. Integrated research on land-use changes in the face of urban transformations—An analytic framework for further studies. Land Use Policy 2017, 60, 403–407. [Google Scholar] [CrossRef]
- Hailemariam, S.N.; Soromessa, T.; Teketay, D. Land use and land cover change in the Bale Mountain Eco-Region of Ethiopia during 1985 to 2015. Land 2016, 5, 41. [Google Scholar] [CrossRef] [Green Version]
- Liu, X.; Hu, G.; Chen, Y.; Li, X.; Xu, X.; Li, S.; Pei, F.; Wang, S. High-resolution multi-temporal mapping of global urban land using Landsat images based on the Google Earth Engine Platform. Remote Sens. Environ. 2018, 209, 227–239. [Google Scholar] [CrossRef]
- Xiao, J.; Shen, Y.; Ge, J.; Tateishi, R.; Tang, C.; Liang, Y.; Huang, Z. Evaluating urban expansion and land use change in Shijiazhuang, China, by using GIS and remote sensing. Landsc. Urban Plan. 2006, 75, 69–80. [Google Scholar] [CrossRef]
- López, E.; Bocco, G.; Mendoza, M.; Duhau, E. Predicting land-cover and land-use change in the urban fringe: A case in Morelia city, Mexico. Landsc. Urban Plan. 2001, 55, 271–285. [Google Scholar] [CrossRef]
- Polimeni, J.M. Simulating agricultural conversion to residential use in the Hudson River Valley: Scenario analyses and case studies. Agric. Hum. Values 2005, 22, 377–393. [Google Scholar] [CrossRef]
- Liu, Y.; Yue, W.; Fan, P. Spatial determinants of urban land conversion in large Chinese cities: A case of Hangzhou. Environ. Plan. B Plan. Des. 2011, 38, 706–725. [Google Scholar] [CrossRef]
- Estoque, R.C.; Murayama, Y. Intensity and spatial pattern of urban land changes in the megacities of Southeast Asia. Land Use Policy 2015, 48, 213–222. [Google Scholar] [CrossRef]
- Song, W.; Pijanowski, B.C.; Tayyebi, A. Urban expansion and its consumption of high-quality farmland in Beijing, China. Ecol. Indic. 2015, 54, 60–70. [Google Scholar] [CrossRef]
- Jiang, G.; Ma, W.; Wang, D.; Zhou, D.; Zhang, R.; Zhou, T. Identifying the internal structure evolution of urban built-up land sprawl (UBLS) from a composite structure perspective: A case study of the Beijing metropolitan area, China. Land Use Policy 2017, 62, 258–267. [Google Scholar]
- Tian, G.; Wu, J.; Yang, Z. Spatial pattern of urban functions in the Beijing metropolitan region. Habitat Int. 2010, 34, 249–255. [Google Scholar] [CrossRef]
- Chen, Y.; Chen, X.; Liu, Z.; Li, X. Understanding the spatial organization of urban functions based on colocation patterns mining: A comparative analysis for 25 Chinese cities. Cities 2020, 97, 102563. [Google Scholar] [CrossRef]
- Liu, X.; Yan, X.; Wang, W.; Titheridge, H.; Wand, R.; Liu, Y. Characterizing the polycentric spatial structure of Beijing Metropolitan Region using carpooling big data. Cities 2021, 109, 103040. [Google Scholar] [CrossRef]
- Sousa, C.A.D. Brownfield redevelopment in Toronto: An examination of past trends and future prospects. Land Use Policy 2002, 19, 297–309. [Google Scholar] [CrossRef]
- Lester, T.W.; Kaza, N.; Kirk, S. Making room for manufacturing: Understanding industrial land conversion in cities. J. Am. Plan. Assoc. 2013, 79, 295–313. [Google Scholar] [CrossRef]
- Chapple, K. The highest and best use? Urban industrial land and job creation. Econ. Dev. Q. 2014, 28, 300–313. [Google Scholar] [CrossRef] [Green Version]
- Kotval-K, Z. Brownfield redevelopment: Why public investments can pay off. Econ. Dev. Q. 2016, 30, 275–282. [Google Scholar] [CrossRef]
- Kotval-K, Z.; Meitl, C.; Kotval, Z. Should the public sector play a greater role funding brownfield redevelopment projects? A transatlantic comparison. Int. Plan. Stud. 2017, 22, 366–383. [Google Scholar] [CrossRef]
- Charney, I. Downtown redevelopment and land-use regulation: Can planning policies discipline property development? Land Use Policy 2015, 47, 302–308. [Google Scholar] [CrossRef]
- China, N.B.S. Statistical Communiqué of the People’s Republic of China on the 2018 National Economic and Social Development. Available online: http://www.stats.gov.cn/tjsj/zxfb/201902/t20190228_1651265.html (accessed on 10 August 2021).
- Ministry of Housing and Urban-Rural Development of the People’s Republic of China. China Urban-Rural Construction Statistical Yearbook 2015; China Statistics Press: Beijing, China, 2016. [Google Scholar]
- Zhou, G.; Li, C.; Li, M.; Zhang, J.; Liu, Y. Agglomeration and diffusion of urban functions: An approach based on urban land use conversion. Habitat Int. 2016, 56, 20–30. [Google Scholar] [CrossRef]
- Zhou, G.; Li, C.; Zhang, J.; Luo, F.; Shen, Q. Transition of urban functional land in Changchun from 2003 to 2012. Acta Geogr. Sin. 2015, 4, 539–550. [Google Scholar]
- Alonso, W. Location and Land Use: Toward a General Theory of Land Rent; Harvard University Press: Cambridge, MA, USA, 1964. [Google Scholar]
- Sargolini, M. The View from Urban Planning: New Landscape Scenarios for the Changing City. In Resilience, Resilient Landscape for the Cities of the Future, Proceedings of the UNISCAPE en Route International Seminar, Ascoli Piceno, Italy, 13–14 April 2015; UNISCAPE: Florence, Italy, 2015; pp. 32–43. [Google Scholar]
- Frondoni, R.; Mollo, B.; Capotorti, G. A landscape analysis of land cover change in the Municipality of Rome (Italy): Spatio-temporal characteristics and ecological implications of land cover transitions from 1954 to 2001. Landsc. Urban Plan. 2011, 100, 117–128. [Google Scholar] [CrossRef]
- Burgess, E.W. The Growth of the City: An Introduction to a Research Project; Park, R.E., Burgess, E.W., McKenzie, R., Eds.; University of Chicago Press: Chicago, IL, USA, 1925. [Google Scholar]
- Hoyt, H. The Structure and Growth of Residential Neighborhoods in American Cities; US Federal Housing Administration: Washington, DC, USA, 1939.
Figure 1.
Location of study area.

Figure 2.
Concentric circle division of the central city.

Figure 3.
Urban land use maps of the central city (2003, 2007, 2011, and 2015).

Figure 4.
Overall characteristics of the kernel density of the functional urban land expansion. This figure is the kernel density map of the total expanding area of the four types of functional urban land, so the kernel density value is greater than that of a certain type of functional urban land.
Figure 4.
Overall characteristics of the kernel density of the functional urban land expansion. This figure is the kernel density map of the total expanding area of the four types of functional urban land, so the kernel density value is greater than that of a certain type of functional urban land.

Figure 5.
Overall characteristics of the kernel density of functional urban land conversion. This figure is the kernel density map of the total conversion area of the four types of functional urban land, including the area of “convert in” and “convert out”, so the kernel density value is greater than that of a certain type of functional urban land.

Figure 6.
Kernel density map of residential land expansion in different periods.

Figure 7.
Kernel density map of residential land conversion in different periods.

Figure 8.
Kernel density map of commercial land expansion in different periods.

Figure 9.
Kernel density map of commercial land conversion in different periods.

Figure 10.
Kernel density map of public service land expansion in different periods.

Figure 11.
Kernel density map of public service land conversion in different periods.

Figure 12.
Kernel density map of industrial land expansion in different periods.

Figure 13.
Kernel density map of industrial land conversion in different periods.


Table 1.
Transition matrix of functional urban land replacement from 2003 to 2015. Unit: ha.
| RL | PL | CL | IL | OL | Reduced Area | |
|---|---|---|---|---|---|---|
| RL | - | 261.14 | 328.24 | 210.54 | 204.64 | 1004.56 |
| PL | 272.95 | - | 150.37 | 95.70 | 50.92 | 569.94 |
| CL | 176.78 | 129.40 | - | 42.71 | 393.15 | 742.04 |
| IL | 1113.41 | 187.59 | 198.08 | - | 1833.65 | 3332.73 |
| OL | 546.59 | 211.89 | 166.23 | 581.72 | - | 1506.43 |
| Increased area | 2109.73 | 790.02 | 842.92 | 930.67 | 2482.36 | - |
Publisher’s Note: MDPI stays neutral with regard to jurisdictional claims in published maps and institutional affiliations. |
© 2022 by the authors. Licensee MDPI, Basel, Switzerland. This article is an open access article distributed under the terms and conditions of the Creative Commons Attribution (CC BY) license (https://creativecommons.org/licenses/by/4.0/).
Share and Cite
MDPI and ACS Style
Zhou, G.; Zhang, J.; Li, C.; Liu, Y. Spatial Pattern of Functional Urban Land Conversion and Expansion under Rapid Urbanization: A Case Study of Changchun, China. Land 2022, 11, 119. https://0-doi-org.brum.beds.ac.uk/10.3390/land11010119
AMA Style
Zhou G, Zhang J, Li C, Liu Y. Spatial Pattern of Functional Urban Land Conversion and Expansion under Rapid Urbanization: A Case Study of Changchun, China. Land. 2022; 11(1):119. https://0-doi-org.brum.beds.ac.uk/10.3390/land11010119
Chicago/Turabian StyleZhou, Guolei, Jing Zhang, Chenggu Li, and Yanjun Liu. 2022. "Spatial Pattern of Functional Urban Land Conversion and Expansion under Rapid Urbanization: A Case Study of Changchun, China" Land 11, no. 1: 119. https://0-doi-org.brum.beds.ac.uk/10.3390/land11010119
Note that from the first issue of 2016, this journal uses article numbers instead of page numbers. See further details here.