Article

Research on Regional Differences and Influencing Factors of Chinese Industrial Green Technology Innovation Efficiency Based on Dagum Gini Coefficient Decomposition

1
School of Business and Creative Industries, University of the West of Scotland, Paisley PA1 2BE, UK
2
School of Mathematics and Information Science, Nanchang Normal University, Nanchang 330032, China
3
Graduate School of Management of Technology, Pukyong National University, Busan 48547, Korea
*
Author to whom correspondence should be addressed.
Submission received: 26 November 2021 / Revised: 6 January 2022 / Accepted: 9 January 2022 / Published: 12 January 2022

Abstract

:
Industrial green technology innovation has become an important content in achieving high-quality economic growth and comprehensively practicing the new development concept in the new era. This paper measures the efficiency of industrial green technology innovation and regional differences based on Chinese provincial panel data from 2005 to 2018, using a combination of the super efficiency slacks-based measure (SBM) model for considering undesirable outputs and the Dagum Gini coefficient method, and discusses and analyses the factors influencing industrial green technology innovation efficiency by constructing a spatial econometric model. The results show that: firstly, industrial green technology innovation efficiency in China shows a relatively stable development trend, going through three stages: “stationary period”, “recession period” and “growth period”. However, the efficiency gap between different regions is obvious, specifically in the eastern > central > western regions of China, and the industrial green technology efficiency innovation in the central and western regions is lower than the national average. Secondly, regional differences in the efficiency of industrial green technology innovation in China are evident but tend to narrow overall, with the main reason for the overall difference being regional differences. In terms of intra-regional variation, variation within the eastern region is relatively stable, variation within the central region is relatively low and shows an inverted ‘U’ shaped trend, and variation within the western region is high and shows a fluctuating downward trend. Thirdly, the firm size, government support, openness to the outside world, environmental regulations and education levels contribute to the efficiency of industrial green technology innovation. In addition, the industrial structure hinders the efficiency of industrial green technology innovation, and each influencing factor has different degrees of spatial spillover effects.

1. Introduction

As the “baton” to guide the construction of ecological civilization and green economic development, the new development concept not only demands higher requirements for the current economic structure adjustment and industrial transformation and upgrading, but also adds value to green technology innovation (GTI), the primary driving force to promote the development of green and light industry. As the main battlefield of green innovation development and an important starting point of technological innovation-driven strategy, the industrial industry is an important engine to promote efficient and stable economic growth, and plays an important role in improving the national comprehensive competitiveness [1]. In addition, China is a big industrial country, and industry is an important source of GDP growth, the main battlefield of green innovation and development, an important starting point of technology innovation driving strategy and an important engine for promoting efficient and stable economic growth [2].
In recent years, China’s scientific and technological research and development (R&D) achievements have made major breakthroughs, and the industry has been booming. However, due to the influence of geographical location and historical problems, the imbalance of regional development in the process of innovation has become increasingly prominent, such as the increase of environmental additional cost in the eastern part of China, the low achievement transformation efficiency in the central part of China and the ecological economic imbalance in the western part, which has seriously hindered the development of industrial GTI to a high quality and deep level [3]. At the same time, due to the obvious “gradient difference” in the economic and social development of the eastern, central and western regions of China, it is difficult to implement the transformation of old and new kinetic energy and the innovation of new and old industries, and the obstruction of technology exchange and knowledge dissemination is not conducive to the improvement of the level of GTI. In a word, how to comprehensively improve industrial green technology innovation (GTI) efficiency (GTIE) has become an inevitable choice in promoting economic transformation and implementation. Therefore, the aim is to scientifically measure the efficiency of China’s industrial GTI and to explore the key factors and spatial spillover affecting industrial GTIE, which provides reference theoretical opinions for improving the level of industrial GTI and realizing the high-quality development of China’s economy.
To sum up, previous scholars have conducted fruitful research on GTI, but there is still much room for expansion. Firstly, although the existing research can combine the innovation theory with the environmental concept in the construction of the evaluation system, it ignores the promotion of ecological benefits and policy guidance. In addition, the selection of indicators is too simple to reflect the real level of industrial GTIE. Secondly, previous studies emphasized the industrial GTI and its influencing factors at the country level, ignoring the impact mechanism of driving factors on specific regions, such as China’s east, middle and west regions and different degrees of spatial spillover effects.
Based on the above, this paper includes intellectual property rights, the number of protection projects and environmental protection applications in the evaluation index system as policy input indicators, uses the super-efficiency SBM model considering unexpected output to measure the efficiency of industrial GTI, and tries to answer the following questions combined with the Dagum Gini coefficient and spatial econometric model.

2. Literature Review

Green innovation was first put forward in 1996 [4], and it attracted wide attention. “Dual externality” is a typical feature of green innovation, that is, the positive externality of innovation results coexists with the positive externality of environmental benefits [5]. Early scholars focused on the research of green innovation from a narrow technical perspective, but with the deepening of research, the meaning of green innovation has been greatly broadened, sometimes called ecological innovation, environmental innovation and sustainable innovation [6]. GTI is the core component of green innovation, and the concept of green technological innovation has not yet formed a unified conclusion in the academic circles. Some scholars believe that GTI can effectively reduce product costs from the perspective of a product’s life cycle [7], which is reflected in the whole process from production to promotion and when it is finally marketized. From the perspective of enterprises, some scholars believe that GTI mainly includes two aspects: green product technology R&D and clean energy production technology innovation, which is the main way for enterprises to enhance their core competitiveness. From the perspective of overall cost, some scholars think that the core goal of GTI is to minimize the internal and external comprehensive cost in the product life cycle, also known as ecological technology innovation.
Generally speaking, green technological innovation is a comprehensive concept. At present, it is recognized in the academic circles that any creative behavior conducive to realizing the win-win of economy and environment or the harmonious development of “economy, resources and environment” can be called green technological innovation [8]. As the main body of GTI activities, industry plays an important role in science and technology R&D and achievement transformation etc. Therefore, it is of great practical significance to guide industrial enterprises to vigorously carry out GTI activities and improve GTIE to realize the harmonious coexistence of ecological environment and economic development.
At present, the research topics on GTIE mainly focus on efficiency measurement [9], evaluation system construction [10], spatial-temporal characteristics [11], influencing factor analysis [12], etc. Banker, Charnes and Cooper (BCC) [13] and Charnes, Cooper and Rhodes (CCR) models [14] are usually used to measure GTIE in the early stage. However, the traditional data envelopment analysis (DEA) model ignores the “relaxation” of factors, resulting in the lack of authenticity of the measurement results. In order to solve this problem, Feng [15] introduced the DEA-SBM model to calculate the green innovation efficiency of eight economic zones in China and compared it with the DEA-CCR model to draw a more scientific conclusion of the SBM model. With the deepening of research, the super efficiency SBM model not only solves the problem that the traditional DEA model ignores the unexpected output, but also can further refine the efficiency difference of effective units, and has gradually become the mainstream method for measuring the efficiency of green innovation at this stage [16]. The green technological innovation efficiency evaluation system is a comprehensive evaluation method that includes scientific and technological innovation, resource consumption and environmental pollution. It can effectively measure the green level of innovative activities in the economy. It has evolved from the combination of green total factor productivity and technological innovation efficiency. At the same time, it solves the problems that the former does not consider the R&D input and output, while the latter ignores the influence of resource consumption and environmental pollution on innovation system [17].
At present, most scholars consider the construction of an evaluation system of GTI from three aspects: input, expected output and unexpected output. Among them, the input element is mostly selected from labor, capital and energy [18], the expected output mainly includes economic output and technical output [19], and the unexpected output mainly selects industrial three wastes as the measurement index [20]. The research scale of GTIE mainly includes three levels: firm, industry and region [21], which has experienced the evolution from micro level to macro level. In the initial stage of GTI, previous scholars have done rich research on the GTI mechanism and influencing factors at micro company level and pointed out that incentive policies and capabilities have significant positive effects on corporate GTIE. However, with the development of society, some scholars gradually realized that the improvement effect brought by the research at the micro level had great limitations, then gradually extended the research area to macro fields such as provinces [22] and the whole country [23], and made a detailed explanation on the temporal and spatial characteristics and evolution law of GTIE in different regions. As a typical index with both economic and ecological characteristics, the green technology efficiency innovation is influenced by many factors, mainly focusing on the analysis of influencing factors such as firm size [24], economic development level [25], environmental regulation [26], industrial structure [27] and educational level [28]. The influence mechanism can be roughly divided into three categories: linear [29], nonlinear [30] and threshold effect [31]. Because of different research fields and methods, the research conclusions are different.

3. Research Methods and Index Selection

3.1. Index Selection

3.1.1. Input Indicator

Regarding the input indicators for industrial GTI, four choices were made in terms of manpower, capital, resources and government policies [32].
For manpower input, it is usually expressed by the total number of R&D personnel or the full-time equivalent of R&D personnel [33]. Since both the total employed labor force and the actual hours worked have an impact on industrial GTI activities, the full-time equivalent of R&D personnel was chosen to represent the manpower input level.
For capital investment, previous research mostly used R&D internal expenditure to express it [34], but this expression method does not accurately reflect the accumulation effect and lag effect of capital investment on industrial GTI. Therefore, the perpetual inventory method was used to calculate the R&D internal expenditure of provinces and cities, which represents the capital investment [35].
For resource input, three typical indicators are chosen to represent the total amount of industrial water, construction land and industrial energy consumption. The first two indicators reflect the input level of natural resources in green innovation, and the total amount of construction land can also reflect the effect of regional spatial structure optimization. In addition, total industrial energy consumption was chosen mainly because of the greater contribution of enterprises as innovation agents in innovation activities.
For policy input, previous studies have not taken this indicator into account when measuring the industrial GTIE. In fact, government support is also a key factor in determining the level of industrial GTI. However, as the main body of resource consumption and innovation activities, industrial enterprises make decisions under policy incentives, and the output speed and environmental performance of innovation achievements will be affected by policy promulgation. Therefore, based on the research results of Yuting [36], the number of intellectual property protection projects and the environmental protection applications are taken as indicators to measure policy investment.

3.1.2. Output Indicators

With regard to the output elements of industrial GTI, three perspectives were chosen: economic output, technical output and undesired output.
For economic output, it is usually expressed by economic aggregate or sales revenue of new products. However, new product sales revenue is more reflective of the ability to capture profits from the level of innovation in each province and region.
For technological output, scholars have generally chosen the amount of patent applications granted or the patent applications to represent it. However, due to the uneven quality of the total number patent applications, it is difficult to reflect the difference of innovation benefits, so this paper chooses the authorized amount of patent applications to represent technological output.
For undesired output, previous studies usually used the industrial “three wastes” emissions, mainly including industrial SO2 emissions, industrial smoke (powder) dust emissions, industrial wastewater emissions and industrial solid waste emissions. In addition, considering that the implementation of environmental protection policies may have an obvious effect on environmental improvement, this paper also includes the number of environmental complaints into the unexpected output.

3.1.3. Influence Factor

Referring to the research results of Qiongwen [37] and Medeiros [38], and taking into account the current situation and characteristics of the development of industrial GTI in China, the key factors affecting the efficiency of industrial GTI can be found in the market environment and the regional innovation environment (policy environment). Among them, the influencing factors of market environment mainly include enterprise scale, industrial structure, openness to the outside world and so on. The influencing factors of policy environment mainly include government support, environmental regulation and education level. The following is an explanation of each variable.
Enterprise scale (ES). There are mainly two views on the impact of enterprise scale on industrial GTI: one view holds that the larger the enterprise scale, the more scale returns can be obtained, which is more conducive to GTI, that is, enterprise scale is positively correlated with GTI. Another view is that large-scale enterprises may reduce the industrial GTIE due to there being more levels, a solidified operation system and strong dependence on resources. This paper selected the industrial GDP/number of enterprises of each province and city to represent the enterprise scale.
Industrial structure (INS). The undesired output of the green technology innovation (GTI) system (GTIS) is influenced by the industrial structure, so the proportion of the secondary sector is selected to represent the industrial structure.
Openness (OPEN). It is generally believed that the degree of openness to the outside world is positively correlated with the industrial GTIE. Regions with a high degree of opening up are more closely connected with the outside world, which can bring innovative elements such as advanced production technology, a high-quality labor force and high-level management experience, which is conducive to enterprises making up for their own shortcomings in combination with local advantages. This paper selects the total import and export volume to represent the degree of openness to the outside world.
Government support (GOVE). As the manager of the market, the government is the basic guarantee for enterprises to carry out innovation activities. Appropriate support can stimulate the innovation vitality of enterprises and promote the improvement of industrial GTI. However, excessive government support reduces the enthusiasm of enterprises for innovation, makes them dependent on preferential policies such as innovation subsidies and green loans, and hinders GTI. Therefore, this paper selects the financial expenditure of government science and technology activities to express the degree of government support.
Environmental regulation (ER). The “Porter Hypothesis” holds that appropriate environmental regulation can promote GTI and effectively reduce unexpected output [39], but high-intensity environmental regulation causes enterprises to produce “environmental compliance cost” and occupy the funds originally used for GTI. Therefore, this paper chooses the investment amount of industrial pollution control to represent environmental regulation.
Education level (STU). The level of education has an impact on the manpower input indicator of the GTIS, and the level of high-quality labor force is a guarantee for the development of GTIE. Therefore, this paper selects the number of university students to express the education level.

3.2. Model Selection

3.2.1. A Super Efficiency SBM Model Considering Undesired

Compared with the traditional CCR and BCC models, the super efficiency SBM model can incorporate the relaxation variables into the objective function, so as to solve the problem of variable relaxation. At the same time, it can further decompose the effective units with an efficiency value of 1, realize mutual comparison between effective units and improve the accuracy of calculation results. The specific objective equation model is as follows:
min ρ = 1 m i = 1 m ( x ¯ / x i k ) 1 r 1 + r 2 ( s = 1 r 1 y d ¯ / y s k d + q = 1 r 2 y u ¯ / y q k u ) { x ¯ j = 1 , k n x i j λ j , j = 1 , 2 , , m y d ¯ j = 1 , k n y s j d λ j , s = 1 , 2 , , r 1 y u ¯ j = 1 , k n y q j u λ j , q = 1 , 2 , , r 2 λ j 0 , j = 1 , 2 , , n ; j 0 x ¯ x k , k = 1 , 2 , , m y d ¯ y k d , d = 1 , 2 , , r 1 y u ¯ y k u , u = 1 , 2 , , r 2
In Equation (1), ρ represents the value of industrial GTIE, n is 30 provinces and cities, m is the number of input indicators. r1 and r2 represent the number of expected outputs and unexpected outputs, respectively. x, yd and yu represent the elements in the corresponding input matrix, expected output matrix and unexpected output matrix.

3.2.2. Dagum Gini Coefficient Decomposition Method

The methods to measure regional differences include the Theil index, coefficient of variation, Gini coefficient, etc., but these methods cannot further decompose the regional gap and compare the distribution of sub samples, so they have some limitations. However, the Dagum Gini coefficient method can decompose the study area into several sub-areas and calculate the overall difference, intra-regional difference, inter-regional difference and supervariable density, which effectively solves the above problems. Referring to Robert [40], the specific calculation equation of the Dagum Gini coefficient method is as follows:
G = j = 1 k h = 1 k i = 1 n j r = 1 n h | x j i x h r | 2 n 2 x ¯
In Equation (2), where G represents the Dagum Gini coefficient, n represents 30 provinces and cities in China, and k represents the number of sub-regions in the sample. xji and xhr represent the industrial GTIE values of sub-regions j and h, respectively, nj and nh represent the number of provinces and cities in sub-regions j and h, respectively, and x represents the average value of industrial GTIE in the sample.
Among them, the Dagum Gini coefficient (G) can be decomposed into three parts: intra-regional difference (Gw), inter-regional super variable net value difference (Gnb) and inter-regional transvariation intensity (Gt). See Equation (3):
G = G w + G n b + G t
The specific calculation equation is:
G j j = 1 2 x ¯ j i = 1 n j r = 1 n j | x j i x j r | n j 2
G w = j = 1 k G j j p j s j
G j h = i = 1 n j r = 1 n h | x j i x h r | n j n h ( x ¯ j + x ¯ h )
G n b = j = 2 k h = 1 j 1 G j h ( p j s h + p h s j ) D j h
G t = j = 2 k h = 1 j 1 G j h ( p j s h + p h s j ) ( 1 D j h )
D j h = d j h p j h d j h + p j h
d j h = 0 d F j ( x ) 0 x ( x y ) d F h ( y )
p j h = 0 d F h ( x ) 0 x ( x y ) d F j ( y )
In Equations (3)–(11), Gjj, Gw, Gjh, Gnb and Gt represent Gini coefficient in region j, the internal difference of region j, the coefficient of variation between region j and region h, the difference between region j and region h and transvariation intensity, respectively. pj represents the proportion of the number of samples in area j in the total number of samples. Djh represents the relative impact of industrial GTIE between region j and region h. Djh represents the mathematical expectation of the cumulative summation of industrial GTIE satisfying xji > xhr in region j and region h. pjh represents the mathematical expectation of the cumulative summation of industrial GTIE satisfying xji < xhr in region j and region h. Fj and Fh represent the cumulative density distribution functions of region j and region h.

3.2.3. Spatial Econometric Model

Spatial weight matrix. At present, there is no unified standard for setting the spatial weight matrix in academic circles. This paper refers to the research results of Lesage [41], follows the principle of simplification of spatial weight, and gives priority to the adjacent weight matrix (W) composed of only 0 and 1. The equation is: if i province is adjacent to j province, the weight wij = 1, otherwise wij = 0. In addition, the robustness of the regression results is tested by constructing the inverse distance spatial weight matrix (D) and the economic distance spatial weight matrix (E).
Spatial econometric model. The commonly used models in previous studies mainly include the spatial autoregressive model (SAR), spatial error model (SEM) and spatial Dubin model (SDM). Because the spatial Dubin model (SDM) considers the spatial correlation of dependent variables and independent variables together and has stronger interpretation ability, this paper takes SDM as the starting point of the econometric model analysis. Its general form is as follows:
ln E f f i , t = ρ W ln E f f j , t + γ i W X i , t + β i X i + μ t + η i + ε i , t
Based on the theoretical model derivation, the empirical model of this paper is:
ln E f f i , t = ρ W ln E f f j , t + γ 1 W ln E S + γ 2 W ln I N S + γ 3 W ln O P E N + γ 4 W ln G O V E + γ 5 W ln E R + γ 6 W ln S T U + β 1 ln E S + β 2 ln I N S + β 3 ln O P E N + β 4 ln G O V E + β 5 ln E R + β 6 ln S T U + μ t + η i + ε i , t
In Equation (13), where ρ represents the coefficient of spatial lag term, γi is the spatial autoregressive coefficient of the explanatory variable, μt and ηi represent individual fixed effect and time fixed effect, respectively. εi,t is random interference term.

3.3. Data Sources

The sample of this paper selected the historical data of 30 provinces (cities and autonomous regions) in China from 2005 to 2018. Considering the availability and authenticity of the data, the sample does not include Tibet Autonomous Region, Hong Kong, Macao or Taiwan. The index data of this paper comes from China Statistical Yearbook, China Environmental Statistics Yearbook, annual report of China Patent Statistics, Statistical Yearbooks of provinces and cities and EPS database. Among them, the missing data of the year is supplemented by interpolation.

4. Regional Differences and Decomposition of Industrial Green Technology Innovation Efficiency (GTIE)

Since the reform and opening up and with the continuous development of China’s economy, the development of eastern, central and western regions has appeared as an obvious step-like distribution. The eastern region has the fastest social and economic development, while the central and western regions have successive decreases. Compared with the central and western regions, the eastern region has a higher level of economic development, relatively abundant market resources, better related supporting facilities and a large number of high-quality talents which provide better basic conditions for green innovation. The central and western regions are rich in natural resources, but the infrastructure is not perfect, the industrial base is weak, and the technology is relatively backward, which leads to the lack of motivation for green innovation.
To sum up, according to the differences in geographical location and economic development level and referring to the standards of the National Bureau of Statistics of China, this paper divides 30 provincial-level administrative regions (excluding Tibet, Hong Kong, Macau and Taiwan Province due to policy differences and data continuity) into three major economic regions: east, central and west. The observed objects are divided into three regions so as to realize the driving effect of the eastern provinces on the central and western provinces within the reasonable transfer and transmission cost of green innovation efficiency, promote the balanced development of green innovation in each region, optimize the transmission mechanism of industrial green innovation efficiency among sectors, and promote industrial green innovation and sustainable development in China.
The industrial GTIE of 30 provinces and cities is calculated according to Equation (1). With reference to the standards of the National Bureau of Statistics and combined with factors such as economic development level and geographical location, China is divided into three regions: east, middle and west. Among them, the eastern region includes 11 provinces (cities), including Beijing, Tianjin, Hebei, Liaoning, Shanghai, Jiangsu, Zhejiang, Fujian, Shandong, Guangdong and Hainan. The central region includes 8 provinces: Shanxi, Jilin, Heilongjiang, Anhui, Jiangxi, Henan, Hubei and Hunan. The western region includes 11 provinces (cities and autonomous regions), including inner Mongolia, Guangxi, Chongqing, Sichuan, Guizhou, Yunnan, Shaanxi, Gansu, Qinghai, Ningxia and Xinjiang.
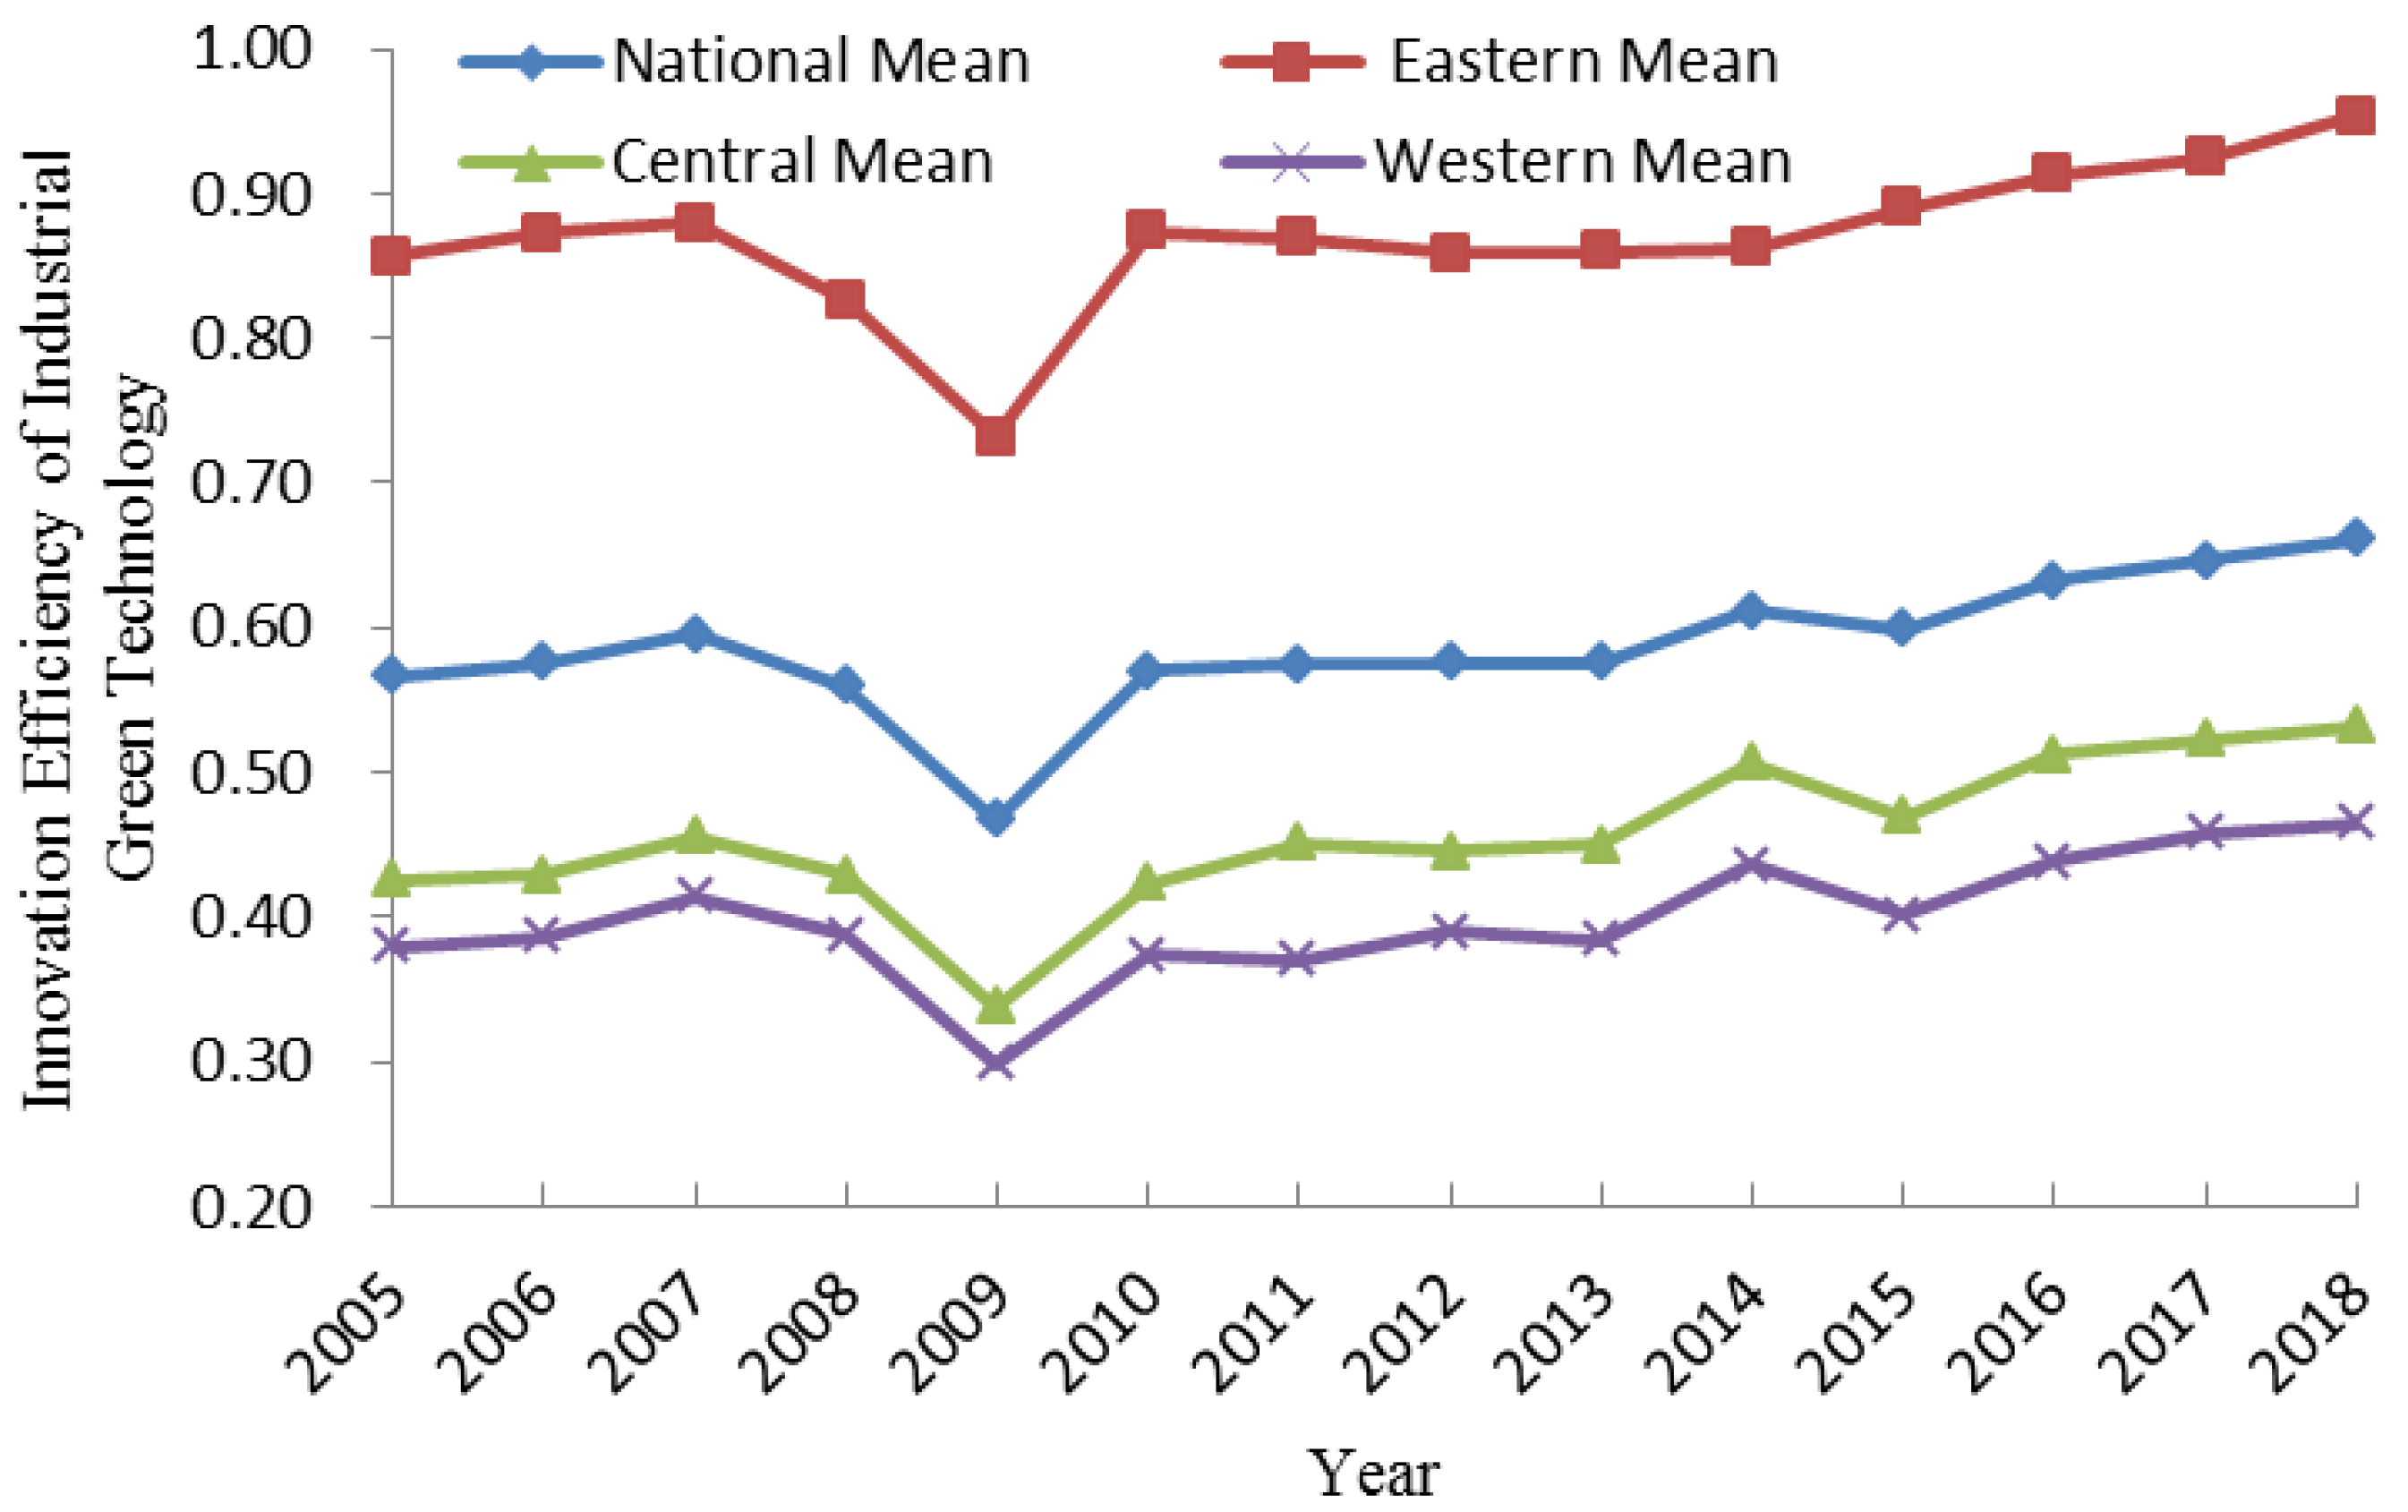
The results show that industrial GTIE shows a trend of “first decline and then increase” (Figure 1); the period from 2005 to 2007 is a stable period, during which the efficiency of industrial green technology innovation always fluctuates around 0.60. In 2009, the industrial GTIE showed a “cliff-like” decline, which indicated that the balance between China’s industrial innovation output and economic development was broken, and the influence of external factors on industrial development was enhanced. The main reason was that the global financial crisis seriously affected the further marketization of industrial technology innovation achievements, the import and export trade of new products was greatly impacted, and the economic benefits of various regions declined to varying degrees, which led to a substantial decline in industrial GTIE. After 2010, the industrial GTIE began to pick up, and the curve changes gradually stabilized.
In terms of regions, industrial GTIE in the eastern region is the highest, showing a fluctuating upward trend from 2010 to 2018, with a gentle curve change and relatively stable development. Industrial GTIE in the central and western regions has always been lower than the national average. It began to rise gradually after the financial crisis, especially after 2013. This change also caused the fluctuation of the national average to rise. The reason is that the environmental protection policies vigorously implemented in the central and western regions have effectively promoted the improvement of industrial green technology innovation efficiency, and the implementation of the “blue sky protection plan” has further clarified that it is an inevitable way for green sustainable development to go hand in hand with the “high beauty” of the ecological environment and the “high quality” of economic development. With the implementation of China’s “Western Development Strategy”, “4 trillion plan” and “the belt and road initiative”, the investment in industrial infrastructure, traditional technological transformation and scientific and technological R&D in the central and western regions has been continuously increased, resulting in different degrees of improvement in economic benefits and innovation output of enterprises, and further promoting the industrial GTIE. In addition, the change rule of industrial GTIE in China’s eastern, central and western regions is similar to that of the whole country, but there is an obvious gap among the three regions, with the highest in the eastern region, the second in the central region and the lowest in the western region. Moreover, the average level of industrial GTIE in the central and western regions is low, which has great room for improvement and potential.
In order to further reveal the regional differences and sources of China’s industrial green technology innovation efficiency, based on the panel data of 30 provinces and cities, this paper uses the Dagum Gini coefficient decomposition method to measure the overall differences, regional differences and intra-regional differences of industrial green technology innovation efficiency from 2005 to 2018. The results are shown in Table 1.
In terms of the overall difference, during the investigation the overall Gini coefficient of industrial GTIE fluctuated and decreased, and the lagging area of technical efficiency gradually formed a “catch-up effect” on the leading area. From 2005 to 2009, the overall gap fluctuated repeatedly, and the fluctuation range was large, from 0.286 in 2005 to 0.272 in 2007, and then rose to a peak of 0.406. Since then, the overall Gini coefficient continued to decline until there was a small “rebound” in 2013. From 2014 to 2018, the Gini coefficient showed a trend of “rise-decline-rise” and repeated jumps, reaching the lowest value of 0.242 in 2016. This change shows that the overall synergy of China’s industrial GTI is weak, and there are great differences in regional development. However, with the implementation of the sustainable development strategy and the introduction of a series of environmental protection policies, industrial enterprises have been greatly encouraged to gradually change from the “three high and one low” production mode to the “resource-saving and environment-friendly” development mode, and the unbalanced efficiency of industrial GTI has been alleviated slightly.
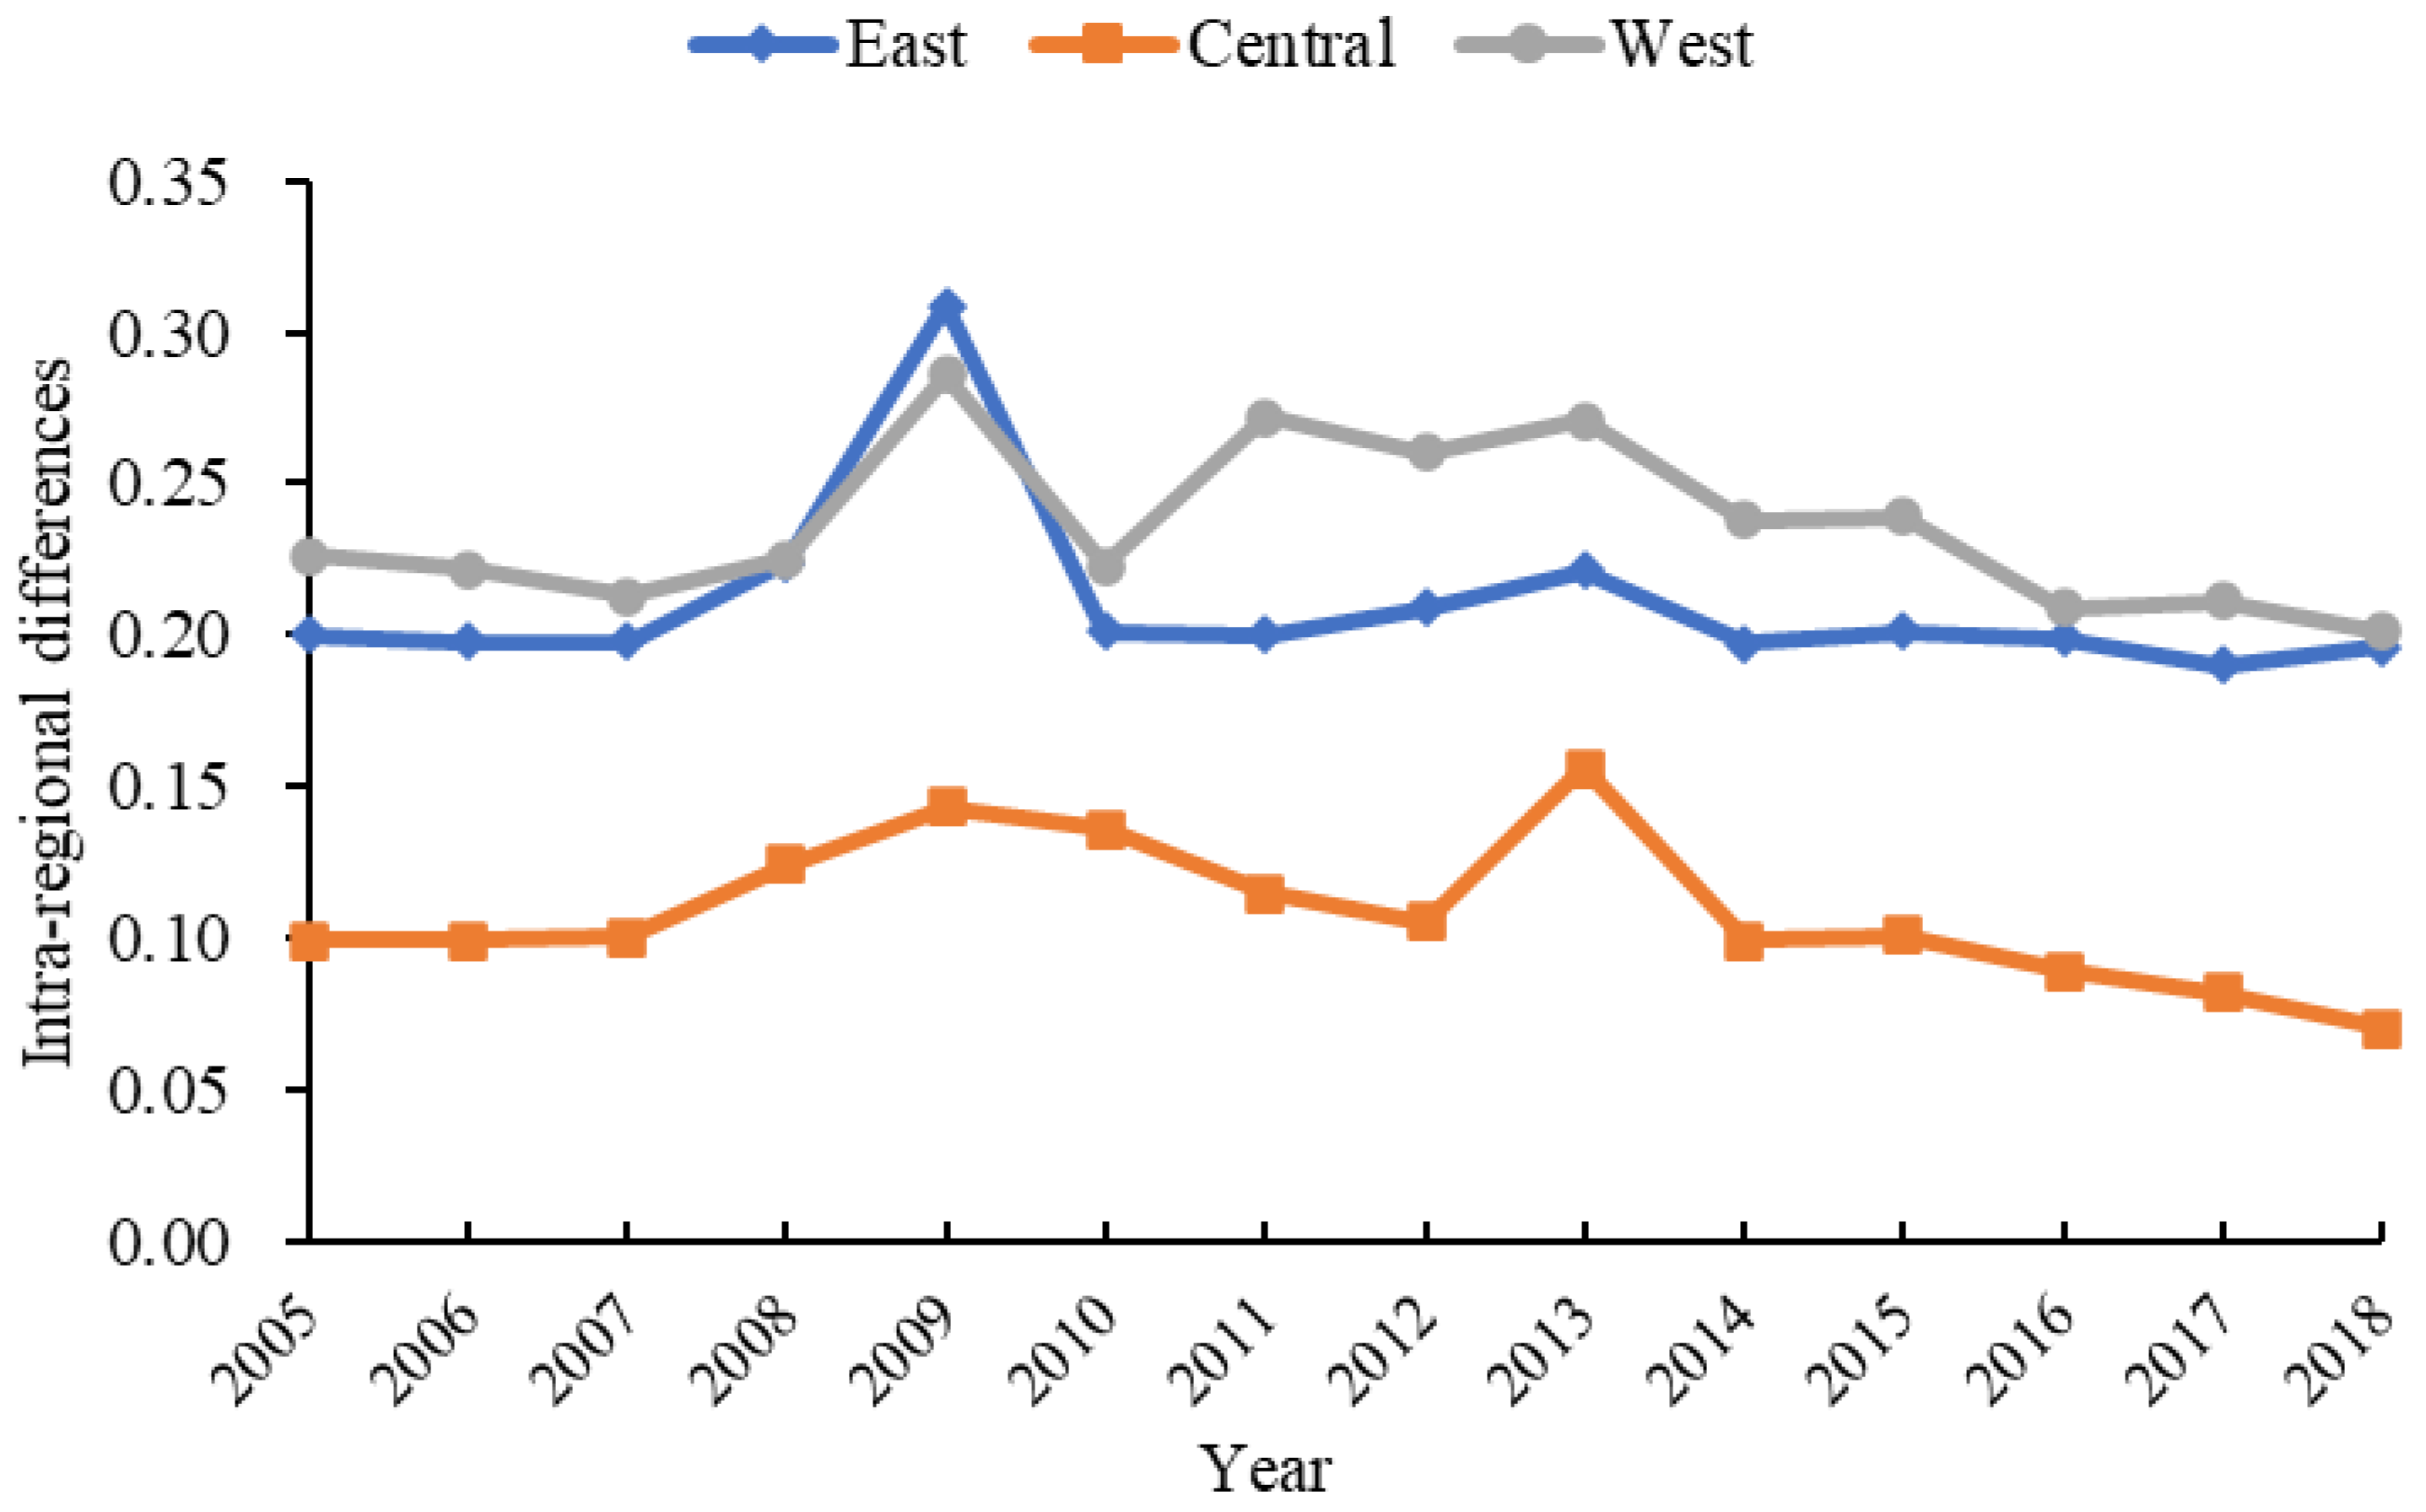
In terms of intra-regional differences (Figure 2), the regional differences of industrial GTIE in the western region are the highest, followed by the eastern region and the central region. Specifically, the Gini coefficient in the eastern region changes gently, always floating up and down at 0.2, which is due to the close technical exchange, excellent development environment, strong industrial foundation, coordinated development strategy and inclusive national policy in the eastern region. The Gini coefficient in the central region shows an inverted “U” trend, with a large fluctuation range and an obvious downward trend, rising from 0.099 in 2005 to 0.156 in 2013, and then it began to fluctuate and decline. This shows that after the country put forward the sustainable development strategy, the central region experienced a period of upgrading the industrial structure, and enterprises narrowed the gap in the industrial GTIE by accelerating the elimination of backward production capacity and promoting technological innovation. The Gini coefficient in the western region is not stable, showing a “wave-like” trend of repeated changes, but the overall difference within the region is decreasing. The reason may be that the implementation of the strategy of developing the western region, the country’s strong support for the infrastructure construction in the western region and the encouragement of the eastern enterprises to move westward have caused the western region to have an economic foundation and technical support. Industrial GTIE has also been improved, and the imbalance of industrial GTIE in the western region has been obviously alleviated.
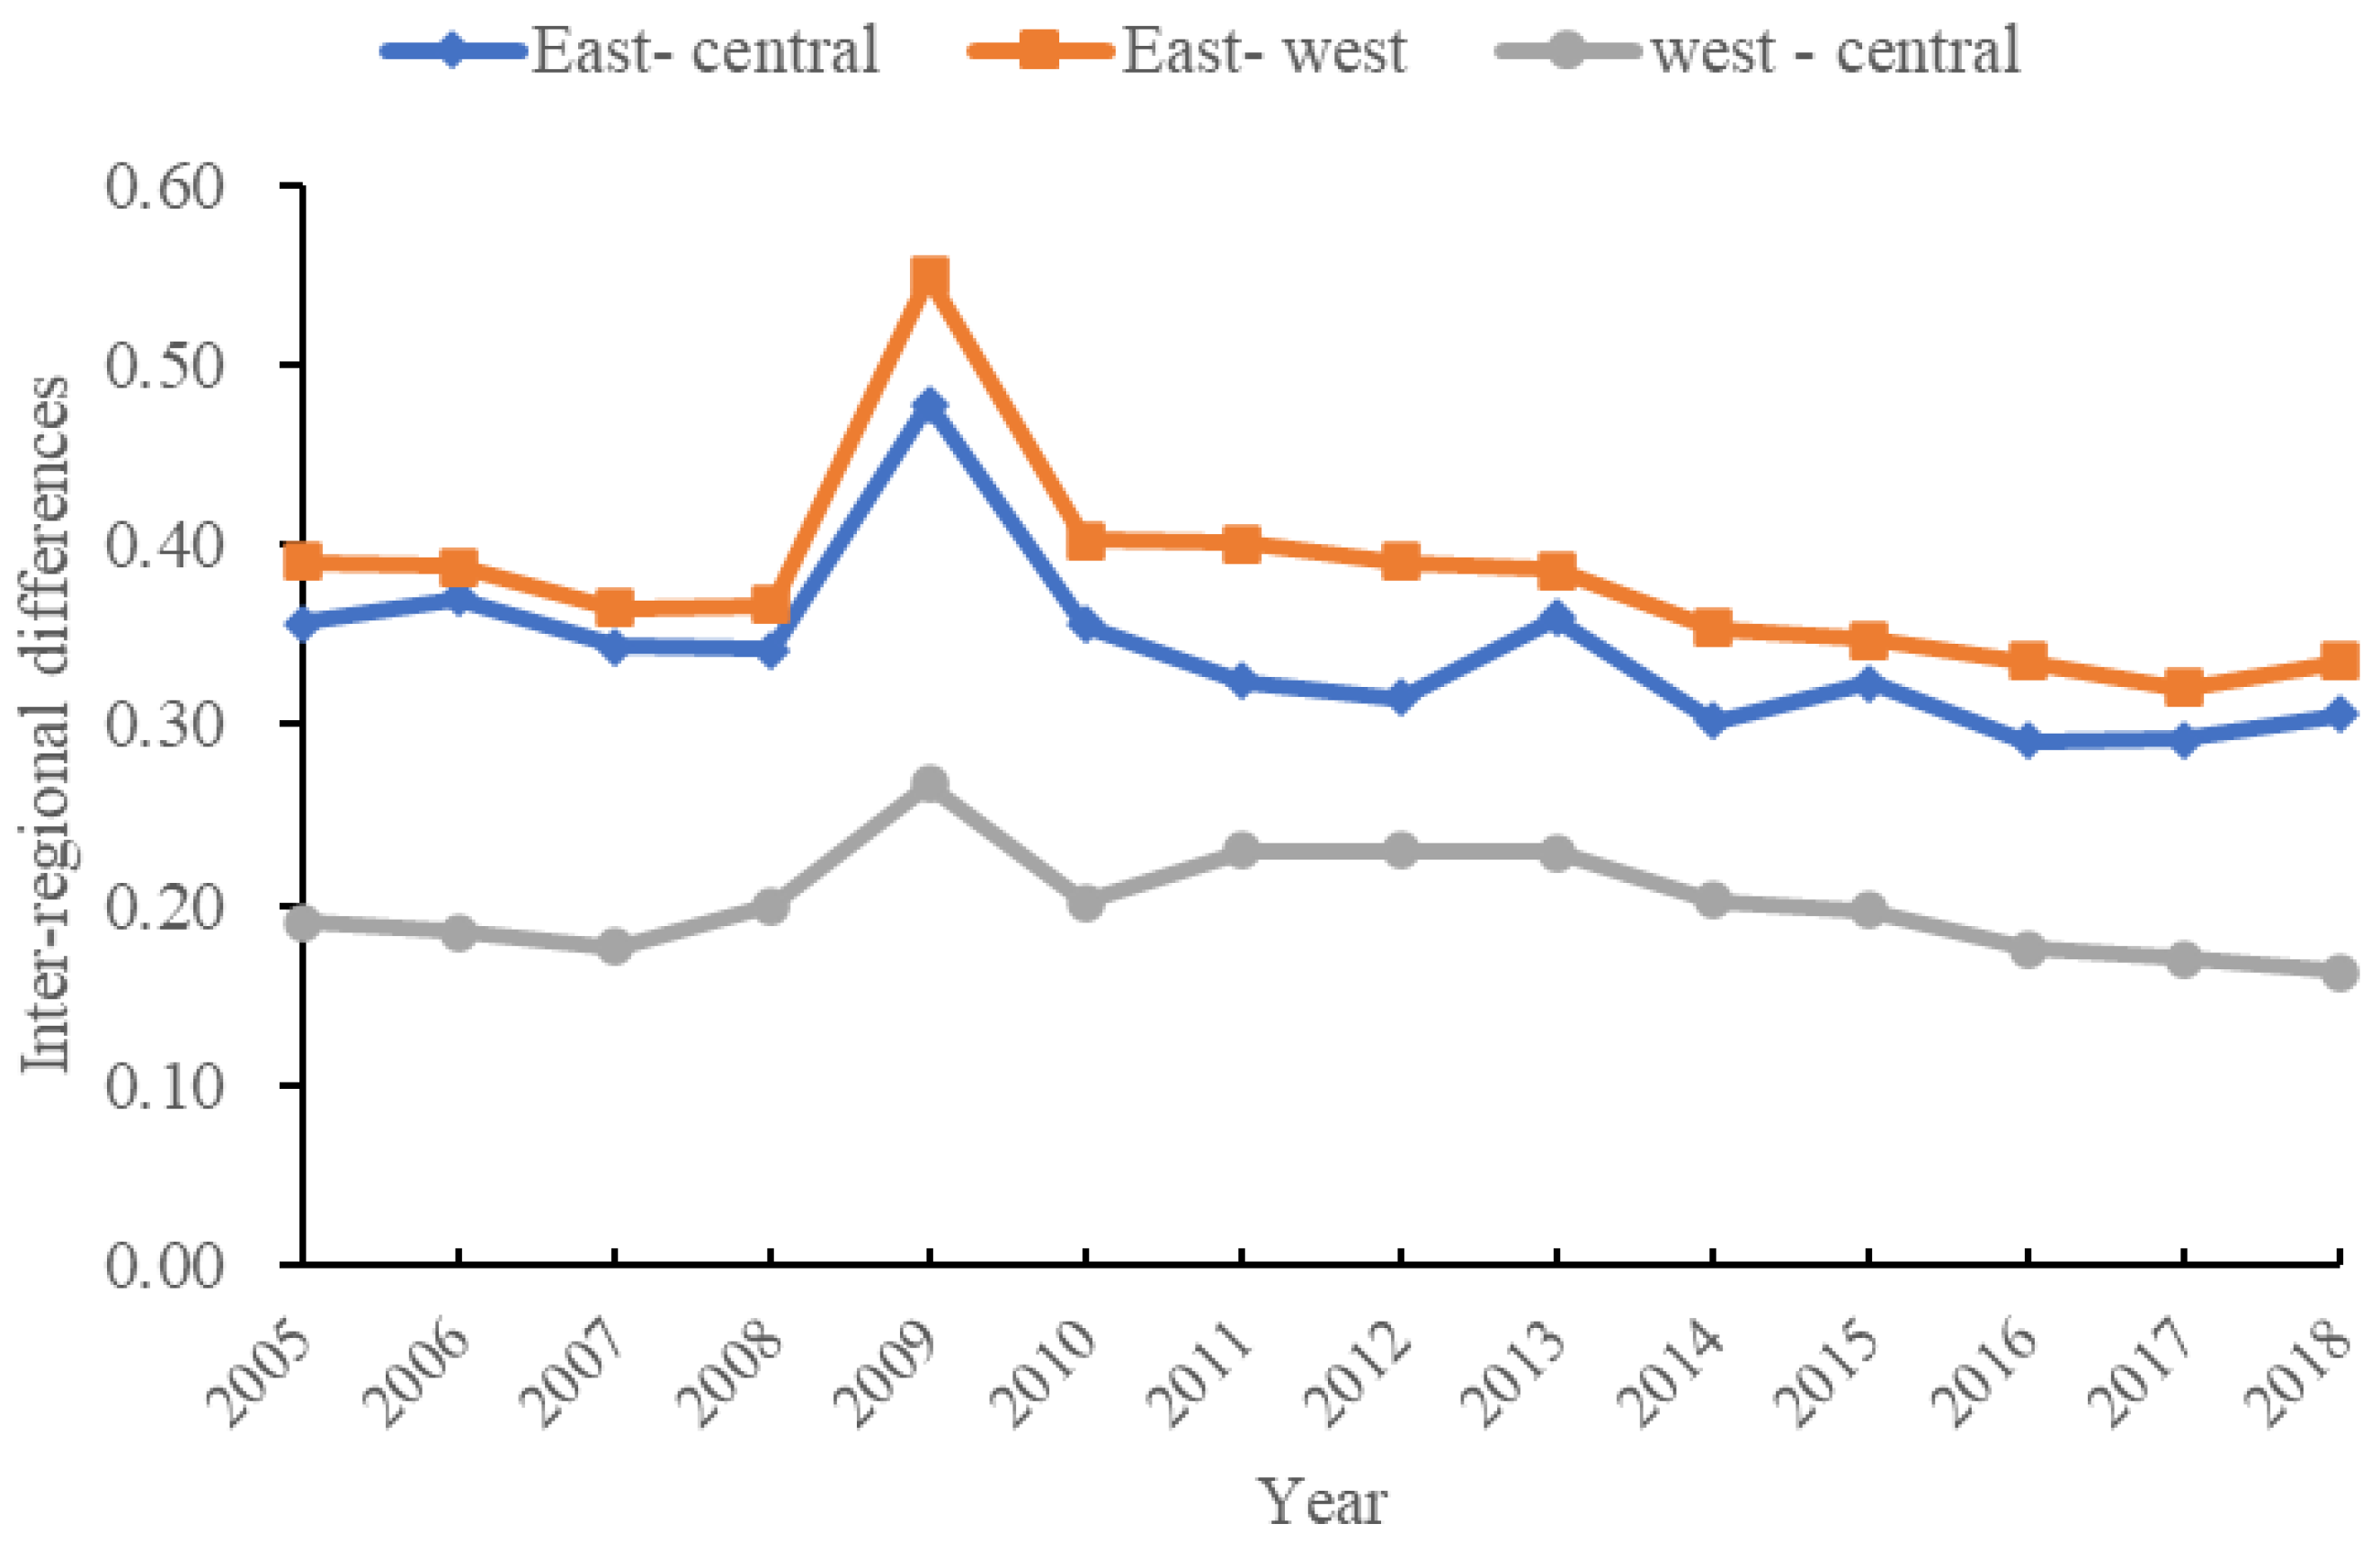
In terms of inter-regional differences (Figure 3), the overall difference in the efficiency of industrial green technology innovation between regions shows a fluctuating downward trend, with the largest difference between east-west regions, followed by east-central regions, and the smallest difference between central-west which is much smaller than the difference between east-west and east-central regions. This suggests that the differences between the eastern region and the central and western regions are a major factor in the uneven industrial GTIE. Specifically, the difference between the east and central regions was always between 0.291 and 0.478, and reached a peak in 2009, after which it began to fluctuate downwards, with a greater fluctuation from 2013 to 2016, and reached a minimum value in 2016. The difference between the east and west regions is slightly higher than that between the east and central regions, with an inverted “N” shape trend, which indicates that the synergy of industrial green technology innovation between the two regions is the weakest. The gap between the central and western regions is smaller and does not fluctuate much.
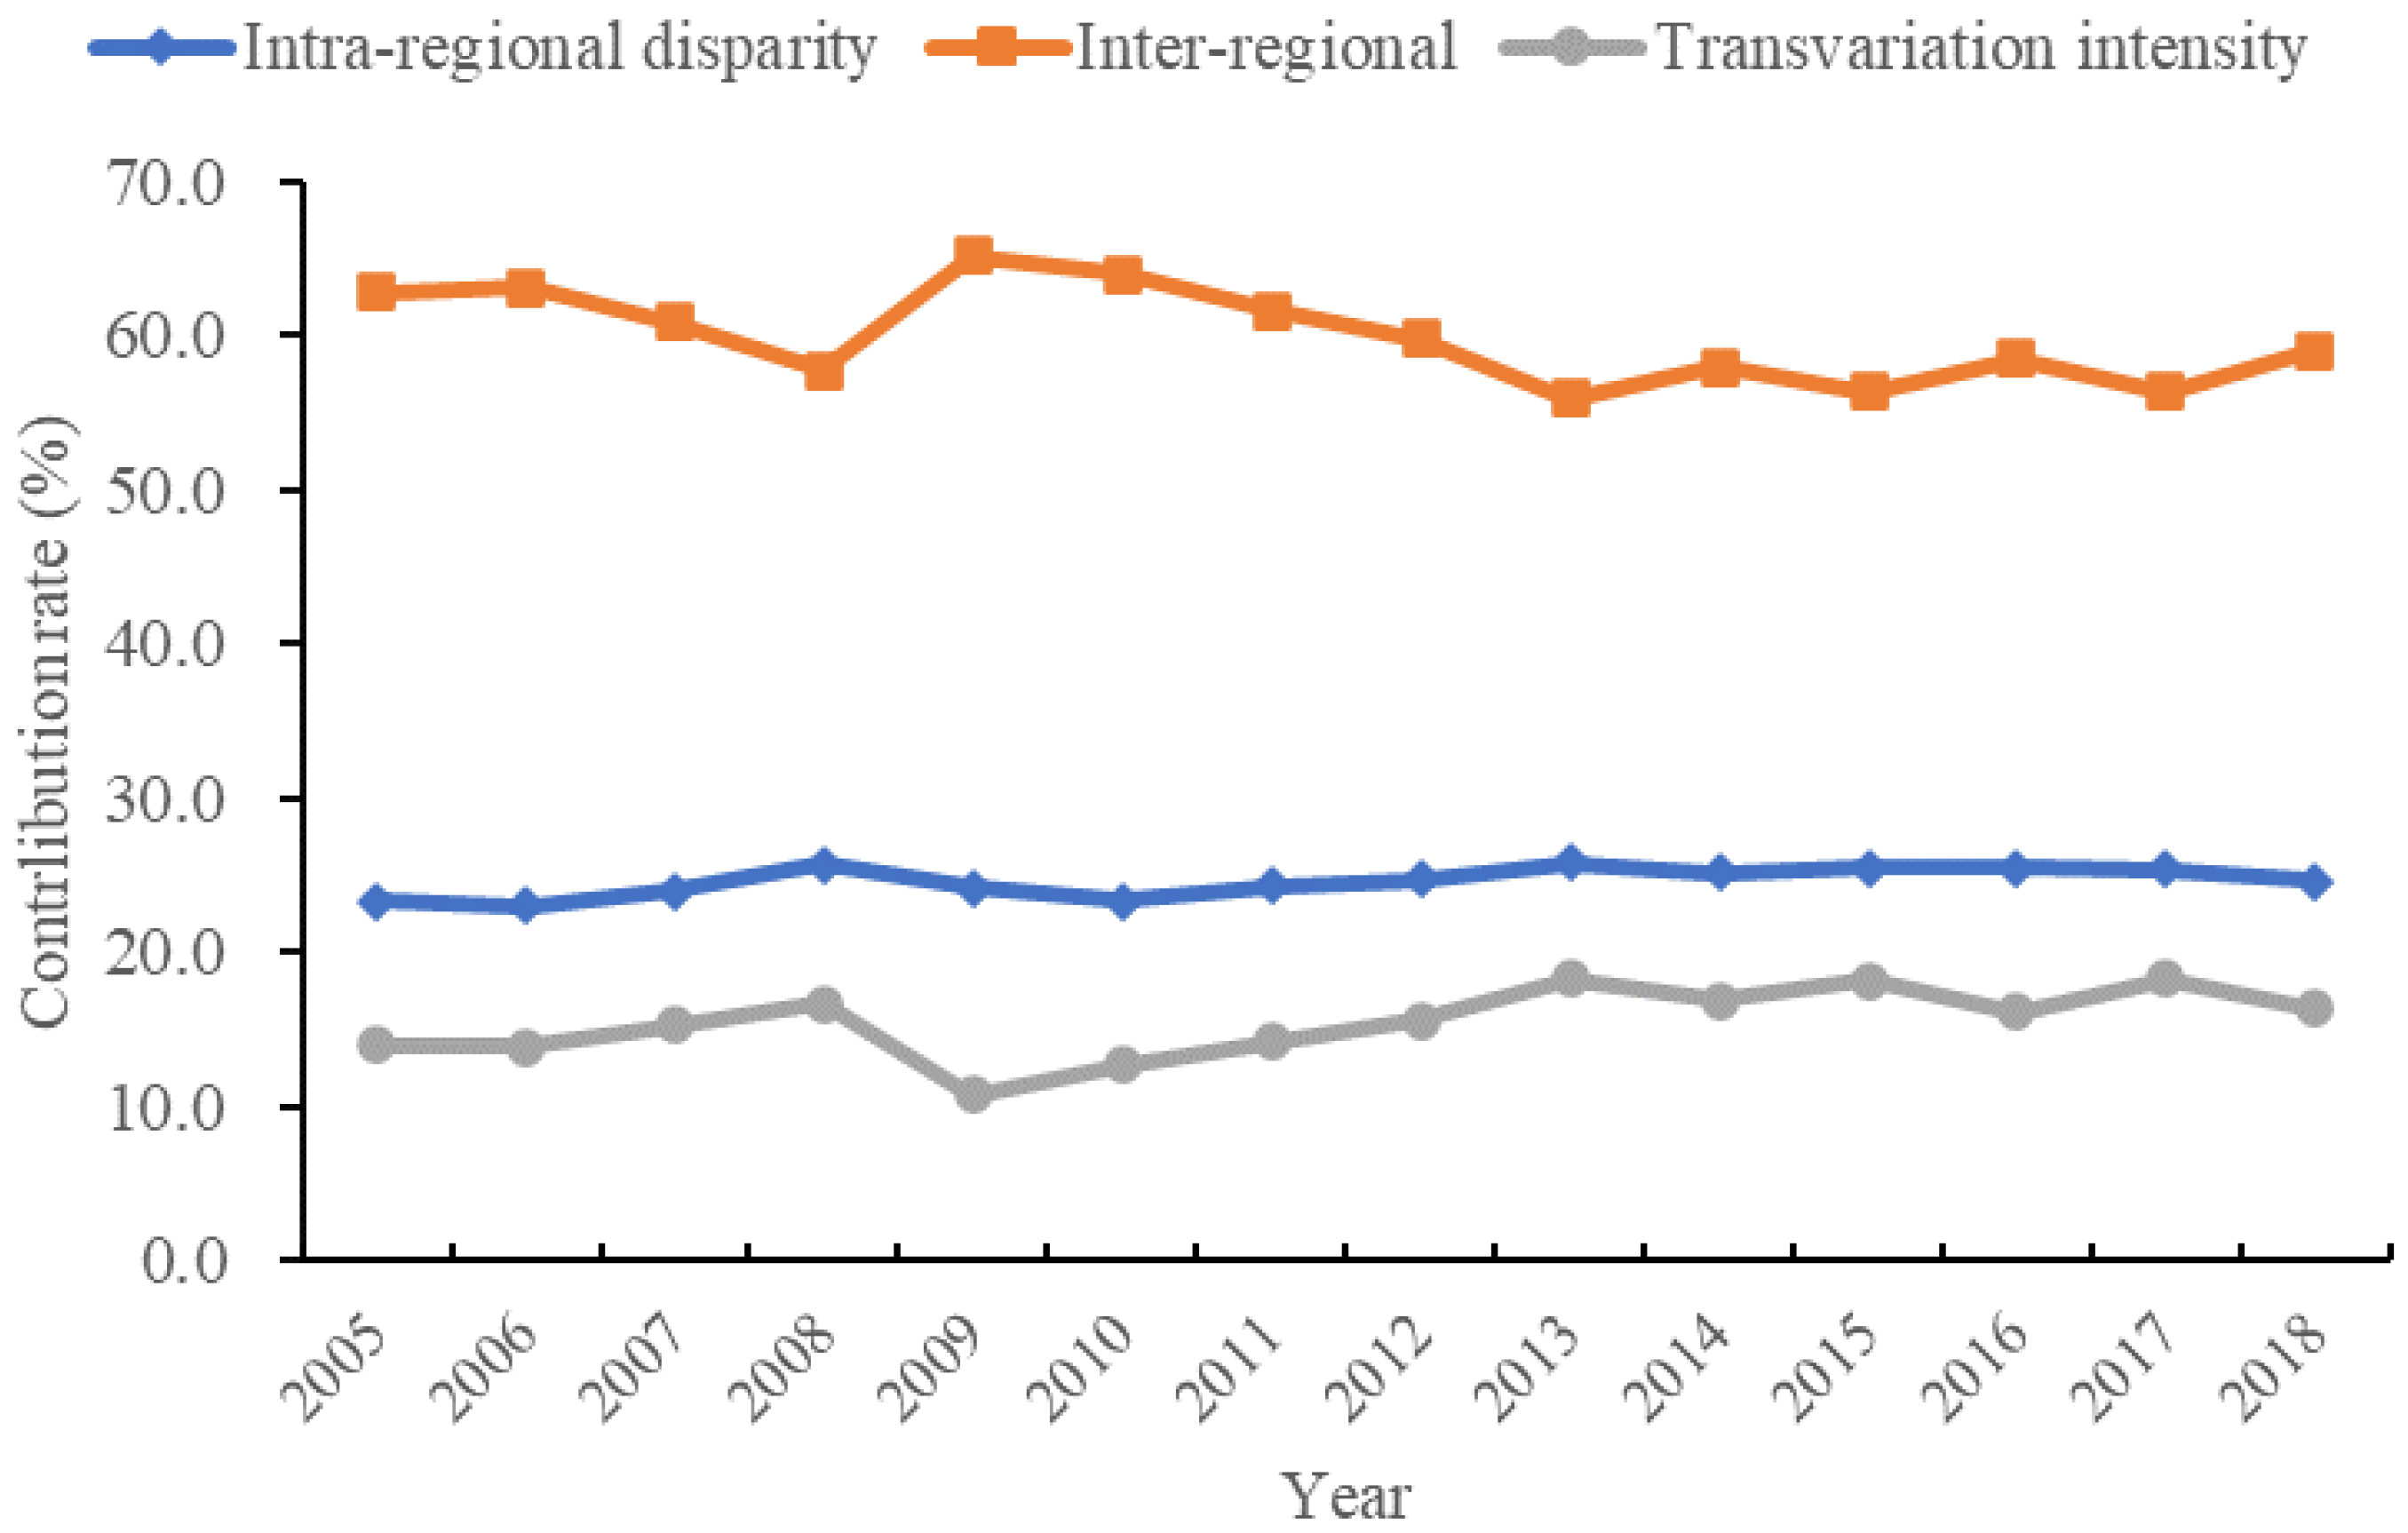
In terms of the contribution rate (Figure 4), inter-regional (Gnb) contribution indicates the difference in industrial GTIE inter-regions. The intra-regional (Gw) contribution represents the difference in industrial GTIE among provinces and cities in the east, central and western regions. The transvariation intensity (Gt) represents the cross impact on industrial GTIE. During the investigation period, the inter-regional contribution rate accounted for about 60%, which was the main factor causing the efficiency gap of China’s industrial GTI, followed by the intra-regional contribution rate, accounting for about 25%, and the influence of the super variable density was the least, accounting for about 15%. From the change trend, Gnb shows a fluctuating downward trend as a whole. From 2012 to 2018, it shows the characteristics of a wave-like change, with a decrease of 5.97% compared with 2005. Gw is relatively stable, and the overall change range is small; Gt increased from 13.906% in 2005 to 16.616% in 2008, but it experienced a “cliff-like” fall in 2009, reaching the lowest value of 10.673%. After that, it began to recover gradually and reached a peak of 18.288% in 2017. Therefore, how to effectively narrow the regional differences has become the key to improving China’s industrial GTIE.

5. Analysis on Influencing Factors of Industrial Green Technology Innovation Efficiency

5.1. Analysis of Regression Results at the National Level

Before the spatial econometric model regression, this paper uses Moran’s I index to test the spatial agglomeration characteristics of China’s industrial GTIE based on the adjacent spatial weight matrix. The results are shown in Table 2. During the investigation period, Moran’s I index of industrial GTIE fluctuated between 0.060 and 0.115, and all passed the significance test at the 1% level. Therefore, it can be determined that there is a positive spatial dependence between the industrial GTIE of provinces and cities. In addition, by analyzing the temporal change of Moran’s I value from 2005 to 2018, it can be seen that its index value shows an “n” trend of first increasing, then decreasing and increasing, indicating that the spatial agglomeration of China’s industrial GTIE has experienced a “rise decline rise” process, and its positive spatial correlation has gradually strengthened after 2010. This is consistent with the previous demonstration results. The reason is that the subprime mortgage crisis has shaken the financial system, and the input and output of innovative capital have decreased significantly. However, with the recovery of capital and the rapid improvement of industrial GTIE, the gap between the eastern region and the central and Western regions has become more and more obvious.
With the help of Stata16.0 software, this paper makes a spatial econometric regression test on the influencing factors of industrial GTIE in 30 provinces and cities in China. Without considering the spatial correlation, the Hausman test results are significant at the 1% level, rejecting the random effect hypothesis, so the fixed effect model is selected. Considering the heterogeneity of geographical location and economic development level of each province, this paper selects the spatiotemporal double fixed model. By comparing the results of corrected R2 and maximum likelihood estimation, the spatial Dubin model (SDM) is selected for further analysis. In addition, the benchmark model adopts the adjacency weight matrix, which does not take into account the geographical distance between different provinces and cities and the spatial correlation of economic activities. Therefore, this paper further constructs the inverse distance spatial weight matrix and economic distance spatial weight matrix for robustness test. It can be seen from the estimation results in Table 3 that the coefficient symbols of all explanatory variables of the SAR, SEM and SDM models have not changed, and the significance of econometric regression results has not changed. Only some spatial lag term coefficients of the SDM model have become insignificant. Therefore, it can be determined that the estimation results of the benchmark model are robust.
The regression results show that the regression coefficient of enterprise scale on industrial GTIE is 0.085, which is significant at the level of 1%, indicating that the expansion of enterprise scale is conducive to the improvement of industrial GTIE. The reasons may be that, on the one hand, with the expansion of enterprise scale, carrying out GTI activities can obtain higher returns to scale, which makes enterprise scale have a driving effect on technological innovation. On the other hand, the larger the scale of the enterprise, the more initial resources such as manpower and capital are invested in technological innovation activities, which can better marketize the patent achievements. While obtaining greater economic value, the enterprise will increase the investment in innovation activities, forming a virtuous circle of “technology input—achievement output—economic value”. In addition, the spatial lag coefficient of enterprise scale is 0.056, which is significant at the level of 5%, indicating that the expansion of enterprise scale in this region will lead to the improvement of industrial GTIE in adjacent areas. It may be because the expansion of enterprise scale will promote industrial agglomeration, attract surrounding enterprises, and accelerate the flow of talents and capital. Through the core technology spillover effect, the enterprise scale gradually forms the “regional block” distribution characteristics in China, reduces the technology exchange cost between regions, and is conducive to improving the development level of green technology.
The regression coefficient of industrial structure to industrial GTIE is −0.835, which is significant at the level of 1%, indicating that the increase of the proportion of industrial output value will reduce the industrial GTIE. Industrial structure is an important “bridge” connecting ecological construction and economic development. The characteristics of regional industrial structure determine the impact of enterprise green innovation activities on energy resource consumption and ecological environment to a certain extent. At present, China is still dominated by the heavy industrial structure of “three high and one low”, and the negative impact on the industrial GTIE continues. In addition, the spatial lag coefficient of industrial structure is 0.157, which is significant at the level of 5%, indicating that the increase in the proportion of industrial output value in this region will lead to the improvement of industrial GTIE in adjacent areas, which is similar to the conclusions of previous studies. It may be because the industrial agglomeration and industrial transfer within the region lead to the concentration of high pollution and high energy consumption industries in an economic zone or economic belt, and the energy consumption and pollutant emission in the surrounding areas are significantly reduced, which promotes the industrial GTIE in the surrounding areas.
The regression coefficient external to industrial GTIE is 0.077, which is significant at the level of 5%, indicating that the increase of total product import and export is conducive to the improvement of industrial GTIE. From the regression results, the impact of the degree of opening to the outside world on the innovation efficiency of industrial green technology supports the “pollution halo” hypothesis. The higher the degree of opening, the more the region will take the lead in having foreign advanced production equipment, technical level and management experience, and radiate the surrounding areas through the “knowledge spillover effect” and “model effect”, so as to drive the improvement of the overall green technology level. In addition, the spatial lag coefficient of the degree of opening to the outside world is −0.045, which is significant at the level of 5%, indicating that the increase of the total import and export of products in this region will reduce the industrial GTIE in adjacent areas, which is similar to the previous studies. From the perspective of the government, in order to create more employment opportunities and accelerate the marketization of R&D achievements in areas with high openness, local governments usually adopt the way of “bottom-by-bottom competition” to attract talent and capital in adjacent areas, resulting in the decline of technical personnel and capital stock in surrounding areas and the lack of green innovation vitality. From the perspective of enterprises, industries with high energy consumption and high pollution will gradually transfer to the surrounding backward areas. These provinces and cities are already at a competitive disadvantage in foreign trade transactions, and they have to further bear the cost of environmental pollution control, resulting in the decline of the industrial GTIE.
The regression coefficient of government support on industrial GTIE is 2.755, which is significant at the level of 1%, and the spatial lag coefficient is 1.712, but it is not significant, indicating that increasing government expenditure on scientific and technological activities can promote the improvement of industrial GTIE in this region, and the impact on adjacent provinces and cities is not significant. The reasons for the impact of government support on the industrial GTIE are mainly divided into positive and negative aspects. First, reasonable government expenditure can help enterprises quickly break through the obstacles of innovation and improve the overall innovation level; second, excessive capital investment will make local enterprises lazy and reduce their enthusiasm for innovation. From the existing regression results, the positive impact of government support on the industrial GTIE is fully reflected, indicating that local governments can comprehensively promote the development of local industrial GTI from the two aspects of market regulation and government support. Adhering to market-oriented enterprises as the main body, and being supplemented by government incentives, encourages enterprises to improve production efficiency and reduce pollution emissions through production technology innovation and scientific and technological R&D innovation, so as to provide favorable conditions for improving industrial GTIE.
The regression coefficient of environmental regulation on industrial GTIE is 2.185, which is significant at the level of 1%, and the spatial lag coefficient is −0.850, but not significant, indicating that the increase of environmental pollution control investment can effectively promote the improvement of industrial GTIE in this region, and the impact on adjacent areas is not significant. It may be because environmental regulation is an effective means to improve industrial GTIE. The government often optimizes the allocation of resources through two environmental regulation methods: command control and market incentive, so as to force enterprises to innovate production equipment and upgrade industrial technology. When enterprises achieve a higher profit level and meet the government’s policy requirements through low science and technology investment, environmental regulation has a “compensation effect” on technological innovation, and the efficiency of industrial green technological innovation is improved. This result is in line with the inference of the “Porter Hypothesis”. It is worth noting that at present, most scholars believe that there are “U”, inverted “U” and “V” nonlinear relationships between environmental regulation and GTIE. Environmental regulation can promote the improvement of GTIE only within a certain threshold. Therefore, the government should adopt appropriate environmental regulation to encourage enterprises to carry out GTI activities and give full play to the “catalyst” effect of environmental regulation.
The regression coefficient of education level on industrial GTIE is 0.065, which is significant at the level of 10%, indicating that the increase in the number of college students is conducive to the improvement of industrial GTIE in this region. There is a positive correlation between education level and human capital. Regional education level can promote the stock of human capital as the endogenous driving force of GTI, human capital can effectively promote the transformation of innovation achievements into productivity, accelerate the implementation and use of innovative technologies, and improve the efficiency of resource utilization and capital allocation. In addition, the spatial lag coefficient of education level is 0.042, which is significant at the level of 10%, indicating that the increase in the number of college students in this area will also promote industrial GTIE in adjacent areas. The reason may be that the large-scale flow of human capital will promote information dissemination and technical knowledge exchange between regions. Through the positive spillover effect, human capital will form a “1 + 1 > 2” agglomeration effect in the region, which will improve the collective innovation consciousness and further promote the development level of industrial green technology.

5.2. Analysis of Regression Results in Eastern, Central and Western Regions

In order to further investigate the causes of the imbalance of China’s industrial GTIE in different regions, this paper makes a regression test on the panel data of the eastern, central and western regions, looks for the key factors affecting different regions, and locates the weak points of industrial GTIE. Table 4 regression results show that for the eastern region, enterprise scale, government support, openness, environmental regulation and education level have a significant positive impact on the industrial GTIE, industrial structure has a significant negative impact, and the openness is not significant. Specifically, with the expansion of enterprise scale, technology-intensive industries have developed rapidly, which has greatly improved industrial GTIE. The impact of industrial structure is negative, because the positive effect brought by technological progress in the area is not enough to offset its pollution to the environment. Due to the better economic foundation, higher industrial technology intensity and more innovative technology and innovation space for enterprises in the eastern region, reasonable government expenditure and appropriate environmental regulation can promote the efficiency of local industrial GTI. The improvement of the education level and import and export trade volume has largely promoted the spatial agglomeration and allocation of high-quality labor force and high tech in the eastern region, and promoted the improvement of industrial GTIE in the region through knowledge diffusion and the technology spillover effect. In addition, enterprise scale, industrial structure and education level have a significant positive impact on adjacent areas, while other factors have no significant impact on adjacent areas.
For the central region, enterprise scale, industrial structure, openness, government support and education level have a significant positive impact on industrial GTIE, and environmental regulation has a significant negative impact. It may be because the central region is rich in energy and mineral resources and relies on the advantages of regional natural resources to undertake and absorb the industrial transfer of developed eastern regions. On the one hand, industrial agglomeration has indeed promoted the rapid economic growth of the central region, accumulated original capital for technological innovation, created an investment environment to attract foreign capital and technical talents, made the central region have a certain industrial foundation, technical level and economic strength, and effectively promoted the improvement of industrial GTIE. On the other hand, due to the long-term extensive development model, the regional ecological environment is damaged, the role of regional environmental policies is not obvious, and the implementation effect of technology R&D and energy conservation and environmental protection is not ideal. Local governments often take appropriate environmental regulation measures to reduce pollutant emissions. At this time, enterprises will unconsciously develop to “Marginalization”, which hinders the improvement of industrial GTIE in this region. In addition, industrial structure and openness have a significant negative impact on adjacent areas, environmental regulation has a significant positive impact on adjacent areas, and other factors have no significant impact on adjacent areas.
For the western region, industrial structure and government support have a significant positive impact on industrial GTIE, environmental regulation has a significant negative impact, and the other influencing factors are not significant. The reason is that the one road and one belt initiative has been attracting more and more enterprises from home and abroad, which has stimulated rapid economic growth in the region and accelerated regional industrial agglomeration and import and export trade. This approach will help alleviate the contradiction between economic development and ecological environment in the central region and provide preconditions for GTI activities. On the other hand, enterprises often adopt traditional production methods in the process of development and pay no attention to resource conservation, energy conservation and emission reduction or technological innovation, resulting in the excessive consumption of energy and resource advantages in the region and serious damage to the ecological environment. At one time, there was an embarrassing situation of “high growth, low development and heavy pollution”. In addition, the industrial structure has a significant negative impact on the adjacent areas, and the other factors have no significant impact on the adjacent areas.

6. Discussion

6.1. Policy Implications

According to the above research conclusions, the following practical significance is obtained.
For the whole of China, while improving industrial GTIE, the aim is also to actively seek the linkage development between regions, gradually build a phased and deep-level regional innovation development plan in combination with the characteristics of regional economic and social development, effectively reduce the institutional transaction cost, and strive to break through the structural contradictions and institutional obstacles in the process of regional linkage innovation. Relying on the resource advantages of Shanxi, Henan and other heavily industrial provinces promotes industrial integration with coal and steel and enables the development and research of new technologies focusing on new utilizations of coal and new materials.
For the eastern region, the leading role of industrial parks and industrial ecological parks in promoting green and ecological industry is highlighted, the site selection and planning of the park are highly valued, the high starting point planning, high-level design and high standard construction are adhered to, and the industrial park is committed to integrating product R&D, technology upgrading new urban functional complex integrating education and training.
For the central and western regions, the government should consider the enthusiasm of industrial enterprises in the process of R&D and innovation, establish and improve corresponding policies and measures, improve the construction of industrial infrastructure, and create a more suitable innovation environment, such as implementing innovation subsidies, green consumption and talent policies to form industrial agglomeration and technology agglomeration, so as to promote the improvement of GTIE.

6.2. Further Research

China’s economy has gradually entered a high-quality development stage. We should abandon the development model that sacrificed the environment in the past and vigorously develop the green economy. We should pursue green innovation to drive economic development, and it is the current economic development goal to promote the coexistence of economic development and environmental friendliness. Green innovation is the core driving force of China’s economic transformation and the construction of national competitive advantage. Relying on scientific and technological progress and industrial innovation is the key factor for it to win the leading position of global green transformation. This paper studies the trend of green innovation efficiency and, combined with the research of internal and external environmental factors, makes it more reasonable to promote the spatial allocation of green innovation efficiency, which is of great significance in promoting green innovation and economic growth and narrowing China’s economic gap. As a key factor in China’s green economic development, green innovation is bound to change China’s overall economic pattern. This research also shows that green innovation has become an excellent way for relatively backward areas such as the central and western regions to catch up with the eastern regions and narrow the gap between the east and the west.
At the same time, green innovation is also a booster to promote the “win-win” of economic growth and environmental protection. It has played an important role in transforming the economic development mode, adjusting the industrial structure and solving outstanding environmental problems. In a word, Chinese economists should attach importance to the promotion of green innovation and economic growth, realize the long-term effect of green innovation on high-quality economic development, and fully consider the emerging economic development goal of “green innovation and low-carbon economy” that China is vigorously promoting. At the same time, by coordinating the interests of enterprises, themselves and all social parties, the government can ensure that the economic benefits and social benefits of the green innovation of enterprises are balanced and promote the enthusiasm and creativity of green economy development, thus promoting the rational transformation and structural upgrading of the regional economy.

7. Conclusions

This paper uses the super efficiency SBM model, considering undesirable outputs, to measure the innovation efficiency of China’s industrial green technology, and the regional differences and influencing factors of industrial GTIE are analyzed in combination with the Dagum Gini coefficient method and spatial econometric model. The following conclusions are drawn:
  • From 2005 to 2018, China’s industrial GTIE showed a relatively stable development trend, and successively experienced three stages: “stable period”, “recession period” and “growth period”. In terms of sub-regions, the change rule of industrial GTIE in China’s eastern, central and western regions is similar to the overall change rule of the whole country, but the efficiency gap between the three regions is obvious, with the highest in the east, the second in the middle and the lowest in the west, and the industrial GTIE in the central and western regions is lower than the national average level.
  • The Dagum Gini coefficient decomposition shows that the overall difference of industrial GTIE showed a fluctuating downward trend from 2005 to 2018. The between-regional differences are the main factors leading to the overall differences, followed by intra-regional differences, and finally the intensity of transvariation. Among the regional differences, the eastern region and the western region have the largest difference in industrial GTIE, followed by the east and central regions. There is an unbalanced pattern of industrial GTIE among the three regions. In terms of regional internal differences, the changes of internal differences in the eastern region are relatively stable, the internal differences in the central region are relatively low and show an inverted “U” trend, and the internal differences in the western region change greatly and show a fluctuating downward trend.
  • Enterprise scale and education level can promote the improvement of China’s industrial GTIE, and can promote the development of industrial GTIE in adjacent areas. The degree of government support and environmental regulation also have a positive impact on industrial GTIE, but the spatial spillover effect is not significant. Industrial structure can inhibit industrial GTIE, but can promote industrial GTIE in adjacent areas. The degree of openness has a positive impact on industrial GTIE, but it has an inhibitory effect on industrial GTIE in adjacent areas. In terms of region, the enterprise scale, government support, openness, environmental regulation and education level in the eastern region have a significant positive impact on industrial GTIE, a significant negative impact on the industrial structure, and the openness is not significant. The enterprise scale, industrial structure, openness, government support and education level in the central region have a significant positive impact on industrial GTIE and a significant negative impact on environmental regulation. The industrial structure and government support in the western region have a significant positive impact on industrial GTIE, a significant negative impact on environmental regulation, and the other influencing factors are not significant. In addition, various influencing factors have different degrees of spatial spillover effects on different regions.

Author Contributions

This paper is a collaborative work of the all the authors. Conceptualization, Investigation, Methodology and Writing—Original Draft, L.Z.; Funding Acquisition, Formal Analysis, X.M.; Funding Acquisition and Visualization, Y.-S.O.; Project Administration, L.Q. All authors have read and agreed to the published version of the manuscript.

Funding

This research was funded by The National Social Science Fund of China, grant number 19BJY085.

Institutional Review Board Statement

Not applicable.

Informed Consent Statement

Not applicable.

Data Availability Statement

The data presented in this study are available on request from the first and corresponding authors.

Conflicts of Interest

The authors declare no conflict of interest.

References

  1. Shao, S.; Zhenbing, Y.; Lili, Y.; Shuang, M. Can China’s Energy Intensity Constraint Policy Promote Total Factor Energy Efficiency? Evidence from the Industrial Sector. Energy J. 2019, 40. [Google Scholar] [CrossRef]
  2. Shen, C.; Shenglan, L.; Xiaopeng, W.; Zhongju, L. The Effect of Environmental Policy Tools on Regional Green Innovation: Evidence from China. J. Clean. Prod. 2020, 254, 120122. [Google Scholar] [CrossRef]
  3. Mao, W.; Wenping, W.; Huifang, S. Driving Patterns of Industrial Green Transformation: A Multiple Regions Case Learning from China. Sci. Total Environ. 2019, 697, 134134. [Google Scholar] [CrossRef] [PubMed]
  4. Fussler, C.; Peter, J. Driving Eco-Innovation: A Breakthrough Discipline for Innovation and Sustainability; Financial Times/Prentice Hall: Hoboken, NJ, USA, 1996. [Google Scholar]
  5. Xiaohong, C.; Na, Y.; Lu, Z.; Dayuan, L. Does Institutional Pressure Foster Corporate Green Innovation? Evidence from China’s Top 100 Companies. J. Clean. Prod. 2018, 188, 304–311. [Google Scholar]
  6. Schiederig, T.; Frank, T.; Cornelius, H. Green Innovation in Technology and Innovation Management—An Exploratory Literature Review. R&D Manag. 2012, 42, 180–192. [Google Scholar] [CrossRef]
  7. Xuemei, X.; Jiage, H.; Hailiang, Z. Green Process Innovation, Green Product Innovation, and Corporate Financial Performance: A Content Analysis Method. J. Bus. Res. 2019, 101, 697–706. [Google Scholar]
  8. Marra, A.; Paola, A.; Pozzi, C. Emerging Green-Tech Specializations and Clusters–a Network Analysis on Technological Innovation at the Metropolitan Level. Renew. Sustain. Energy Rev. 2017, 67, 1037–1046. [Google Scholar] [CrossRef]
  9. Luo, Q.; Chenglin, M.; Liyan, S.; Xiaona, M.; Mengmeng, D. Efficiency Evaluation of Green Technology Innovation of China’s Strategic Emerging Industries: An Empirical Analysis Based on Malmquist-Data Envelopment Analysis Index. J. Clean. Prod. 2019, 238, 117782. [Google Scholar] [CrossRef]
  10. Li, T.; Lei, L.; Dongri, H. Research on the Efficiency of Green Technology Innovation in China’s Provincial High-End Manufacturing Industry Based on the Raga-Pp-Sfa Model. Math. Probl. Eng. 2018, 2018, 1–13. [Google Scholar] [CrossRef]
  11. Xu, S.; Wu, T.; Zhang, Y. The spatial-temporal variation and convergence of green innovation efficiency in the Yangtze River Economic Belt in China. Environ. Sci. Pollut. Res. 2020, 27, 26868–26881. [Google Scholar] [CrossRef]
  12. Liu, C.; Gao, X.; Ma, W.; Chen, X. Research on regional differences and influencing factors of green technology innovation efficiency of China’s high-tech industry. J. Comput. Appl. Math. 2020, 369, 112597. [Google Scholar] [CrossRef]
  13. Wang, S.; Fan, J.; Zhao, D.; Wang, S. Regional innovation environment and innovation efficiency: The Chinese case. Technol. Anal. Strat. Manag. 2015, 28, 396–410. [Google Scholar] [CrossRef]
  14. Yangjun, R.; Wang, C. Research on the Regional Difference and Spatial Effect of Green Innovation Efficiency of Industrial Enterprises in China. Rev. Ibérica Sist. E Tecnol. Inf. 2016, E10, 373–384. [Google Scholar]
  15. Feng, Z. Research on Industrial Enterprises’ Green Innovation Efficiency in China—Based on Provincial Data by a Dea-Sbm Approach. Forum Sci. Technol. China 2013, 2, 82–88. (In Chinese) [Google Scholar]
  16. Li, J.; YuanXin, D. Spatial Effect of Environmental Regulation on Green Innovation Efficiency: Evidence from Prefectural-Level Cities in China. J. Clean. Prod. 2021, 286, 125032. [Google Scholar] [CrossRef]
  17. Ren, Y.; Chonghuai, N.; Tong, N.; Xilong, Y. Theoretical Model and Empirical Research on Green Innovation Efficiency. Manag. World 2014, 7, 176–177. [Google Scholar]
  18. Wang, H.; Herui, C.; Qiaozhi, Z. Effect of Green Technology Innovation on Green Total Factor Productivity in China: Evidence from Spatial Durbin Model Analysis. J. Clean. Prod. 2021, 288, 125624. [Google Scholar] [CrossRef]
  19. Shi, Y.; He, W.; Zhao, J.; Hu, A.; Pan, J.; Wang, H.; Zhu, H. Expected output calculation based on inverse distance weighting and its application in anomaly detection of distributed photovoltaic power stations. J. Clean. Prod. 2020, 253, 119965. [Google Scholar] [CrossRef]
  20. Han, X.; Sun, T.; Cao, T. Study on environmental pollution loss measurement method of waste gas emits in Nanjing MV Industrial Park. Environ. Sci. Pollut. Res. 2020, 27, 16539–16553. [Google Scholar] [CrossRef]
  21. Miao, C.; Debin, F.; Liyan, S.; Qiaoling, L. Natural Resources Utilization Efficiency under the Influence of Green Technological Innovation. Resour. Conserv. Recycl. 2017, 126, 153–161. [Google Scholar] [CrossRef]
  22. Guo, Y.; Xingneng, X.; Sheng, Z.; Danping, Z. Environmental Regulation, Government R&D Funding and Green Technology Innovation: Evidence from China Provincial Data. Sustainability 2018, 10, 940. [Google Scholar] [CrossRef] [Green Version]
  23. Wang, Q.; Jiansheng, Q.; Bao, W.; Penglong, W.; Taibao, Y. Green Technology Innovation Development in China in 1990–2015. Sci. Total Environ. 2019, 696, 134008. [Google Scholar] [CrossRef] [PubMed]
  24. Zhang, D.; Samuel, A.V. How Does Innovation Efficiency Contribute to Green Productivity? A Financial Constraint Perspective. J. Clean. Prod. 2021, 280, 124000. [Google Scholar] [CrossRef]
  25. Fan, F.; Huan, L.; Xiaoyang, L.; Xueli, W. Can Environmental Regulation Promote Urban Green Innovation Efficiency? An Empirical Study Based on Chinese Cities. J. Clean. Prod. 2021, 287, 125060. [Google Scholar] [CrossRef]
  26. Zhang, J.; You, O.; Pablo, B.-P.; Hui, L.; Simon, P.; Philbin, Z.L.; Martin, S. Understanding the Impact of Environmental Regulations on Green Technology Innovation Efficiency in the Construction Industry. Sustain. Cities Soc. 2021, 65, 102647. [Google Scholar] [CrossRef]
  27. Du, K.; Yuanyuan, C.; Xin, Y. Environmental Regulation, Green Technology Innovation, and Industrial Structure Upgrading: The Road to the Green Transformation of Chinese Cities. Energy Econ. 2021, 98, 105247. [Google Scholar] [CrossRef]
  28. Luo, X.; Weiye, Z. Green Innovation Efficiency: A Threshold Effect of Research and Development. Clean Technol. Environ. Policy 2021, 23, 285–298. [Google Scholar] [CrossRef]
  29. Zhang, J.; Le, K.; Hui, L.; Pablo, B.-P.; Martin, S.; Jian, Z. The Impact of Environmental Regulations on Urban Green Innovation Efficiency: The Case of Xi’an. Sustain. Cities Soc. 2020, 57, 102123. [Google Scholar] [CrossRef]
  30. Wang, L.; Wenzhong, Y.; Lingming, C. Research on Green Innovation of the Great Changsha-Zhuzhou-Xiangtan City Group Based on Network. Land 2021, 10, 1198. [Google Scholar] [CrossRef]
  31. Liu, J.; Qiuyue, S.; Ning, L.; Chi, C.G. Threshold Effects of Tourism Agglomeration on the Green Innovation Efficiency of China’s Tourism Industry. Chin. J. Popul. Resour. Environ. 2018, 16, 277–286. [Google Scholar] [CrossRef]
  32. Wang, Q.; Shuo, S.; Jingjing, Z. Action Mechanism and Effect Identification of National High Tech Area to Improve Urban Green Innovation Efficiency—A Test Based on Difference in Difference Method. China Popul. Resour. Environ. 2020, 30, 129–137. (In Chinese) [Google Scholar]
  33. Chen, X.; Zeng, J. An Research on the Influence Factors of China’s High-Tech Industry’s R&D Activities Efficiency. In Proceedings of the 2009 International Conference on Management Science and Engineering, Moscow, Russia, 14–16 September 2009. [Google Scholar]
  34. Alarcón, S.; Mercedes, S. External and Internal R&D, Capital Investment and Business Performance in the Spanish Agri-Food Industry. J. Agric. Econ. 2013, 64, 654–675. [Google Scholar]
  35. Berlemann, M.; Jan-Erik, W. Estimating Aggregate Capital Stocks Using the Perpetual Inventory Method. Rev. Econ. 2014, 65, 1–34. [Google Scholar] [CrossRef]
  36. Li, Y.; Zhiyong, Z. Institutional Supply and Green Innovation Efficiency in China. J. Beijing Inst. Technol. 2019, 21, 50–58. (In Chinese) [Google Scholar]
  37. Cheng, Q.; Xianxiang, H.; Baosheng, L. Green Technology Innovation Efficiency and Its Influencing Factors -an Empirical Study Based on 35 Industrial Industries in China. J. Cent. South Univ. 2020, 26, 97–107. (In Chinese) [Google Scholar]
  38. De Medeiros, J.F.; Gabriel, V.; José Luís, D.R. Driving Factors for the Success of the Green Innovation Market: A Relationship System Proposal. J. Bus. Ethics 2018, 147, 327–341. [Google Scholar] [CrossRef]
  39. Ambec, S.; Mark, A.C.; Stewart, E.; Paul, L. The Porter Hypothesis at 20: Can Environmental Regulation Enhance Innovation and Competitiveness? Rev. Environ. Econ. Policy 2013, 7, 2–22. [Google Scholar] [CrossRef] [Green Version]
  40. Lerman, R.I.; Shlomo, Y. Improving the Accuracy of Estimates of Gini Coefficients. J. Econom. 1989, 42, 43–47. [Google Scholar] [CrossRef]
  41. LeSage, J.P.; R Kelley, P. The Biggest Myth in Spatial Econometrics. Econometrics 2014, 2, 217–249. [Google Scholar] [CrossRef] [Green Version]
Figure 1. Industrial green technology innovation efficiency (GTIE) from 2005 to 2018.
Land 11 00122 g001
Figure 2. Intra-regional differences in industrial green technology innovation efficiency (GTIE) from 2005 to 2018.
Land 11 00122 g002
Figure 3. Inter-regional differences in industrial green technology innovation efficiency (GTIE) from 2005 to 2018.
Land 11 00122 g003
Figure 4. Contribution rate in industrial green technology innovation efficiency (GTIE) from 2005 to 2018.
Land 11 00122 g004
Table 1. Gini coefficient decomposition results of China’s green technology innovation efficiency (GTIE).
YearOverallIntra-Regional DifferencesInter-Regional DifferencesContribution Rate (%)
EastCentralWestEast-CentralEast-WestWest-CentralIntra-Regional Disparity GwInter-Regional GnbTransvariation Intensity Gt
20050.2860.2000.0990.2260.3570.3910.19123.26062.83413.906
20060.2870.1980.0990.2220.3700.3880.18523.03963.12813.833
20070.2720.1980.1000.2130.3440.3650.17723.91660.80915.276
20080.2830.2240.1240.2250.3420.3670.20025.63657.74816.616
20090.4060.3090.1430.2860.4780.5490.26724.21565.11210.673
20100.2930.2010.1360.2230.3560.4030.20223.30463.98212.714
20110.2910.2000.1150.2720.3240.4010.23024.26261.59314.145
20120.2860.2090.1050.2600.3150.3910.23024.68359.73215.585
20130.3020.2210.1560.2710.3590.3860.22925.83455.90818.258
20140.2640.1970.0990.2380.3020.3540.20325.13457.97016.896
20150.2670.2010.1010.2390.3230.3470.19725.49956.38918.112
20160.2490.1990.0890.2090.2910.3350.17625.45658.46216.083
20170.2420.1900.0820.2110.2920.3210.17025.38756.32518.288
20180.2480.1960.0700.2010.3060.3350.16324.62359.07616.301
Table 2. Moran’s I of industrial green technology innovation efficiency (GTIE) in China.
YearMoran’s Ip ValueYearMoran’s Ip Value
20050.0650.00720120.0910.003
20060.0680.00620130.1020.003
20070.0750.00520140.0980.001
20080.0600.00520150.1050.000
20090.0660.00820160.1130.002
20100.0750.00120170.1070.001
20110.0830.00120180.1150.001
Table 3. National spatial econometric regression results.
VariablesAdjacency Distance Matrix (W)Inverse Distance Matrix (D)Economic Distance Matrix (G)
SARSEMSDMSARSEMSDMSARSEMSDM
lnES0.083 ***0.079 ***0.085 ***0.077 ***0.081 ***0.080 ***0.066 ***0.071 ***0.079 ***
(0.45)(0.34)(0.65)(0.38)(0.55)(0.75)(0.33)(0.74)(0.64)
lnINS−0.457 ***−0.504 ***−0.835 ***−0.438 ***−0.511 ***−0.745 ***−0.484 ***−0.514 ***−0.872 ***
(−2.43)(−2.25)(−1.56)(−2.81)(−2.35)(−1.67)(−2.77)(−2.61)(−1.83)
lnOPEN0.045 *0.042 **0.077 **0.043 *0.057 **0.081 **0.042 *0.051 **0.071 **
(1.08)(1.05)(1.78)(1.18)(1.07)(1.67)(1.21)(1.14)(1.84)
lnGOVE2.563 ***2.457 ***2.755 ***2.804 ***2.341 ***2.847 ***2.873 ***2.191 ***2.826 ***
(6.58)(6.44)(6.93)(6.94)(7.04)(6.85)(6.44)(6.31)(6.77)
lnER2.238 ***2.452 ***2.185 ***2.341 ***2.314 **2.328 ***2.291 ***2.316 ***2.308 ***
(7.48)(8.125)(7.32)(7.55)(7.875)(7.62)(7.33)(8.045)(7.49)
lnSTU0.0320.054 *0.065 *0.0430.067 *0.053 *0.0490.063 *0.078 *
(0.54)(0.61)(1.02)(0.74)(0.80)(1.22)(0.58)(0.66)(0.93)
lnES * W 0.056 ** 0.093 0.087 **
(1.12) (1.58) (1.77)
lnINS * W 0.157 ** 0.284 * 0.183 *
(0.64) (0.85) (0.74)
lnOPEN * W −0.045 ** −0.038 −0.051
(−0.72) (−0.65) (−0.87)
lnGOVE * W 1.712 1.581 1.655
(1.95) (1.85) (1.64)
lnER * W −0.850 −0.78 −0.95
(−1.83) (−1.66) (−1.88)
lnSTU * W 0.042 * 0.055 * 0.075
(0.79) (0.62) (0.81)
ρ0.421 *** 0.258 ***0.538 ** 0.221 ***0.607 * 0.240 ***
(0.75) (0.18)(0.69) (0.21)(0.87) (0.23)
R20.8410.8550.8700.8120.8460.8530.8310.8400.857
Log_L239.560245.432258.725213.44218.23224.96236.248239.347247.442
Time effectFixedFixedFixedFixedFixedFixedFixedFixedFixed
Individual effectFixedFixedFixedFixedFixedFixedFixedFixedFixed
N420420420420420420420420420
Notes: *, ** and *** Denote statistical significance at the 10%, 5% and 1% levels, respectively. The t values are in parentheses.
Table 4. Spatial econometric regression results of Eastern, Central and Western in China.
VariablesEastern Region (SDM)Central Region (SDM)Western Region (SDM)
lnES0.079 ***0.052 **0.044
lnINS−0.754 **0.748 **0.875 ***
lnOPEN0.217 ***0.317 ***0.286
lnGOVE0.542 ***0.819 ***0.820 **
lnER0.301 ***−0.330 ***−0.380 ***
lnSTU0.075 **0.094 *0.104
lnES * W0.065 **0.0480.021
lnINS * W0.235 *−0.204 *−0.670 **
lnOPEN * W−0.028−0.118 **−0.175
lnGOVE * W0.3800.4250.383
lnER * W0.1120.241 *0.240
lnSTU * W0.047 **0.0550.023
ρ0.185 ***0.147 ***0.134 ***
R20.8220.8410.897
Log_L283.97254.69268.11
Time effectFixedFixedFixed
Individual effectFixedFixedFixed
N154112154
Notes: *, ** and *** Denote statistical significance at the 10%, 5% and 1% levels, respectively. The t values are in parentheses.
Publisher’s Note: MDPI stays neutral with regard to jurisdictional claims in published maps and institutional affiliations.

