Article

Changes of Soil Properties along the Altitudinal Gradients in Subarctic Mountain Landscapes of Putorana Plateau, Central Siberia

Faculty of Forestry, Technical University in Zvolen, T.G. Masaryka 24, 96001 Zvolen, Slovakia
*
Author to whom correspondence should be addressed.
Submission received: 7 December 2021 / Revised: 6 January 2022 / Accepted: 11 January 2022 / Published: 14 January 2022
(This article belongs to the Section Soil-Sediment-Water Systems)

Abstract

:
Changes of soil properties along elevational gradients were studied in a less accessible and explored forest-tundra ecotone in the NW part of Central Siberia. Data on soil physical and chemical properties were collected along three horizontal transects at an elevation of 100–420 m a.s.l., at two localities differing in the slope angle. At each transect, five soil pits were excavated to a depth of 0.3–0.4 m. Soil samples were taken from the depths of 0–0.1 m, 0.1–0.2 m, and 0.2–0.3 m. The results showed a pronounced effect of slope angle on the pattern of soil properties along the elevational gradient. At the locality with a gentle slope, soils exhibited 2.5 times larger thickness of the surface organic layer (SOL), higher pH, and Na+ content, and lower C, N, Ald, and Fed concentration indicating slower pedogenic processes on this site. On the other hand, at the locality with a steeper slope, soil properties were better differentiated between transects situated along elevational gradient especially at the depths of 0.1–0.2 and 0.2–0.3 m. However, a clear positive or negative trend with the altitude was observed only for some soil characteristics, e.g., SOL, C, N, or Ald concentrations on the Lama location.

1. Introduction

Soil plays a key role in the functioning of terrestrial ecosystems. It is essential not only for biomass production, but also for regulating the environmental interactions (e.g., materials transformation, water purification and supplies, carbon accumulation) and serves as a biological habitat and a gene reserve for a large variety of organisms. Provision of the functions depends on soil properties and processes which are controlled by soil forming factors, including topography. In mountainous areas, elevation, slope aspect, and slope angle belong to the main topographic features which influence the pattern and trends of soil properties through the changes in microclimate, snow accumulation, water flow patterns and local drainage capacity, leaching and redistribution of soil materials and elements along hill slopes, and the distribution of plant communities [1,2,3].
A number of studies have addressed the impact of the topographic features on soil physico-chemical and biological properties from tropical to boreal forests [4,5,6,7,8], but there are limited data from forest ecosystems at high latitudes above the polar circle. Although they represent very precious ecosystems, many regions have not been studied yet due to their inaccessibility. However, soils above the polar circle may exhibit specific properties as they are strongly influenced by low temperature and the presence of permafrost, and it is unclear until now how they reflect the changes in topography because previous studies were performed predominantly in level areas. For example Karelin and Zamolodchikov [9] found important effects of microrelief, vegetation, and surface organic layer (SOL) on soil processes in flat Arctic tundra, mediated by moisture, snow accumulation, and thermal insulation. However, additional factors, such as meso- or macrorelief and frequent temperature inversions can be crucial in mountain areas [10]. At present, more attention is beginning to be paid to soils in these artic and subarctic temperature-limited environments because they are particularly sensitive to climate change and more affected by faster warming compared to the other latitudes [11]. An increase in air temperature can lead to permafrost melting, an increase in the depth of the soil active layer, changes in the intensity of decomposition and weathering processes, and consequently changes of soil physical, chemical, and biological properties, the vegetation cover, and a shift of the tree line north or upward [12,13,14].
The Putorana Plateau, which is situated in the NW part of the Central Siberian Tableland, belongs to the regions sensitive to shifts in atmospheric circulation [15,16]. It represents a unique territory with a set of subarctic and arctic ecosystems in an isolated mountain range. Due to this uniqueness, a part of the Putorana Plateau was included in the World Heritage List by UNESCO as an area of great importance for arctic and subarctic ecosystems conservation [17]. The soil cover in the Putorana Plateau is poorly understood and data from the forest-tundra ecotone are especially rare. Many soils are specific due to the specificity of the pedogenesis determined mainly by the combination of the cold continental climate and the composition of parent material represented by basic and ultrabasic rocks [18]. Moreover, the Putorana Plateau landscape exhibits typical features characterized by a combination of table mountains, deep valleys with characteristic slope profiles, and flat watersheds [10].
Altitudinal gradients belong to the most powerful set-ups for testing the climate influences on soil properties and a prediction of the effects of climate change on forest soils. The Putorana Plateau landscape with steep slopes offers a superb opportunity for the study of soil properties in this context, as well as in view of the current lack of information on soils in such remote locations and hostile environments. To predict how the soils in the subarctic region will respond to climate change, it is necessary to fill-in gaps regarding information on their current state and how they change in relation to topography features. Therefore, the main objective of this study was to evaluate the insufficiently explored effect of elevation on forest soil properties in the subarctic zone using the example of the Putorana Plateau, and to establish the degree of similarity in the pattern of soil-property changes with depth at different altitudes. Our hypothesis was that due to a lower temperature and shorter vegetation season, the changes with elevation will be less pronounced than in the temperate or boreal zones because of a slower intensity of organic matter decomposition and parent rock weathering processes. As the study sites differ in slope gradient, we expected that this would be reflected in the pattern of changes along the altitudinal gradient.

2. Materials and Methods
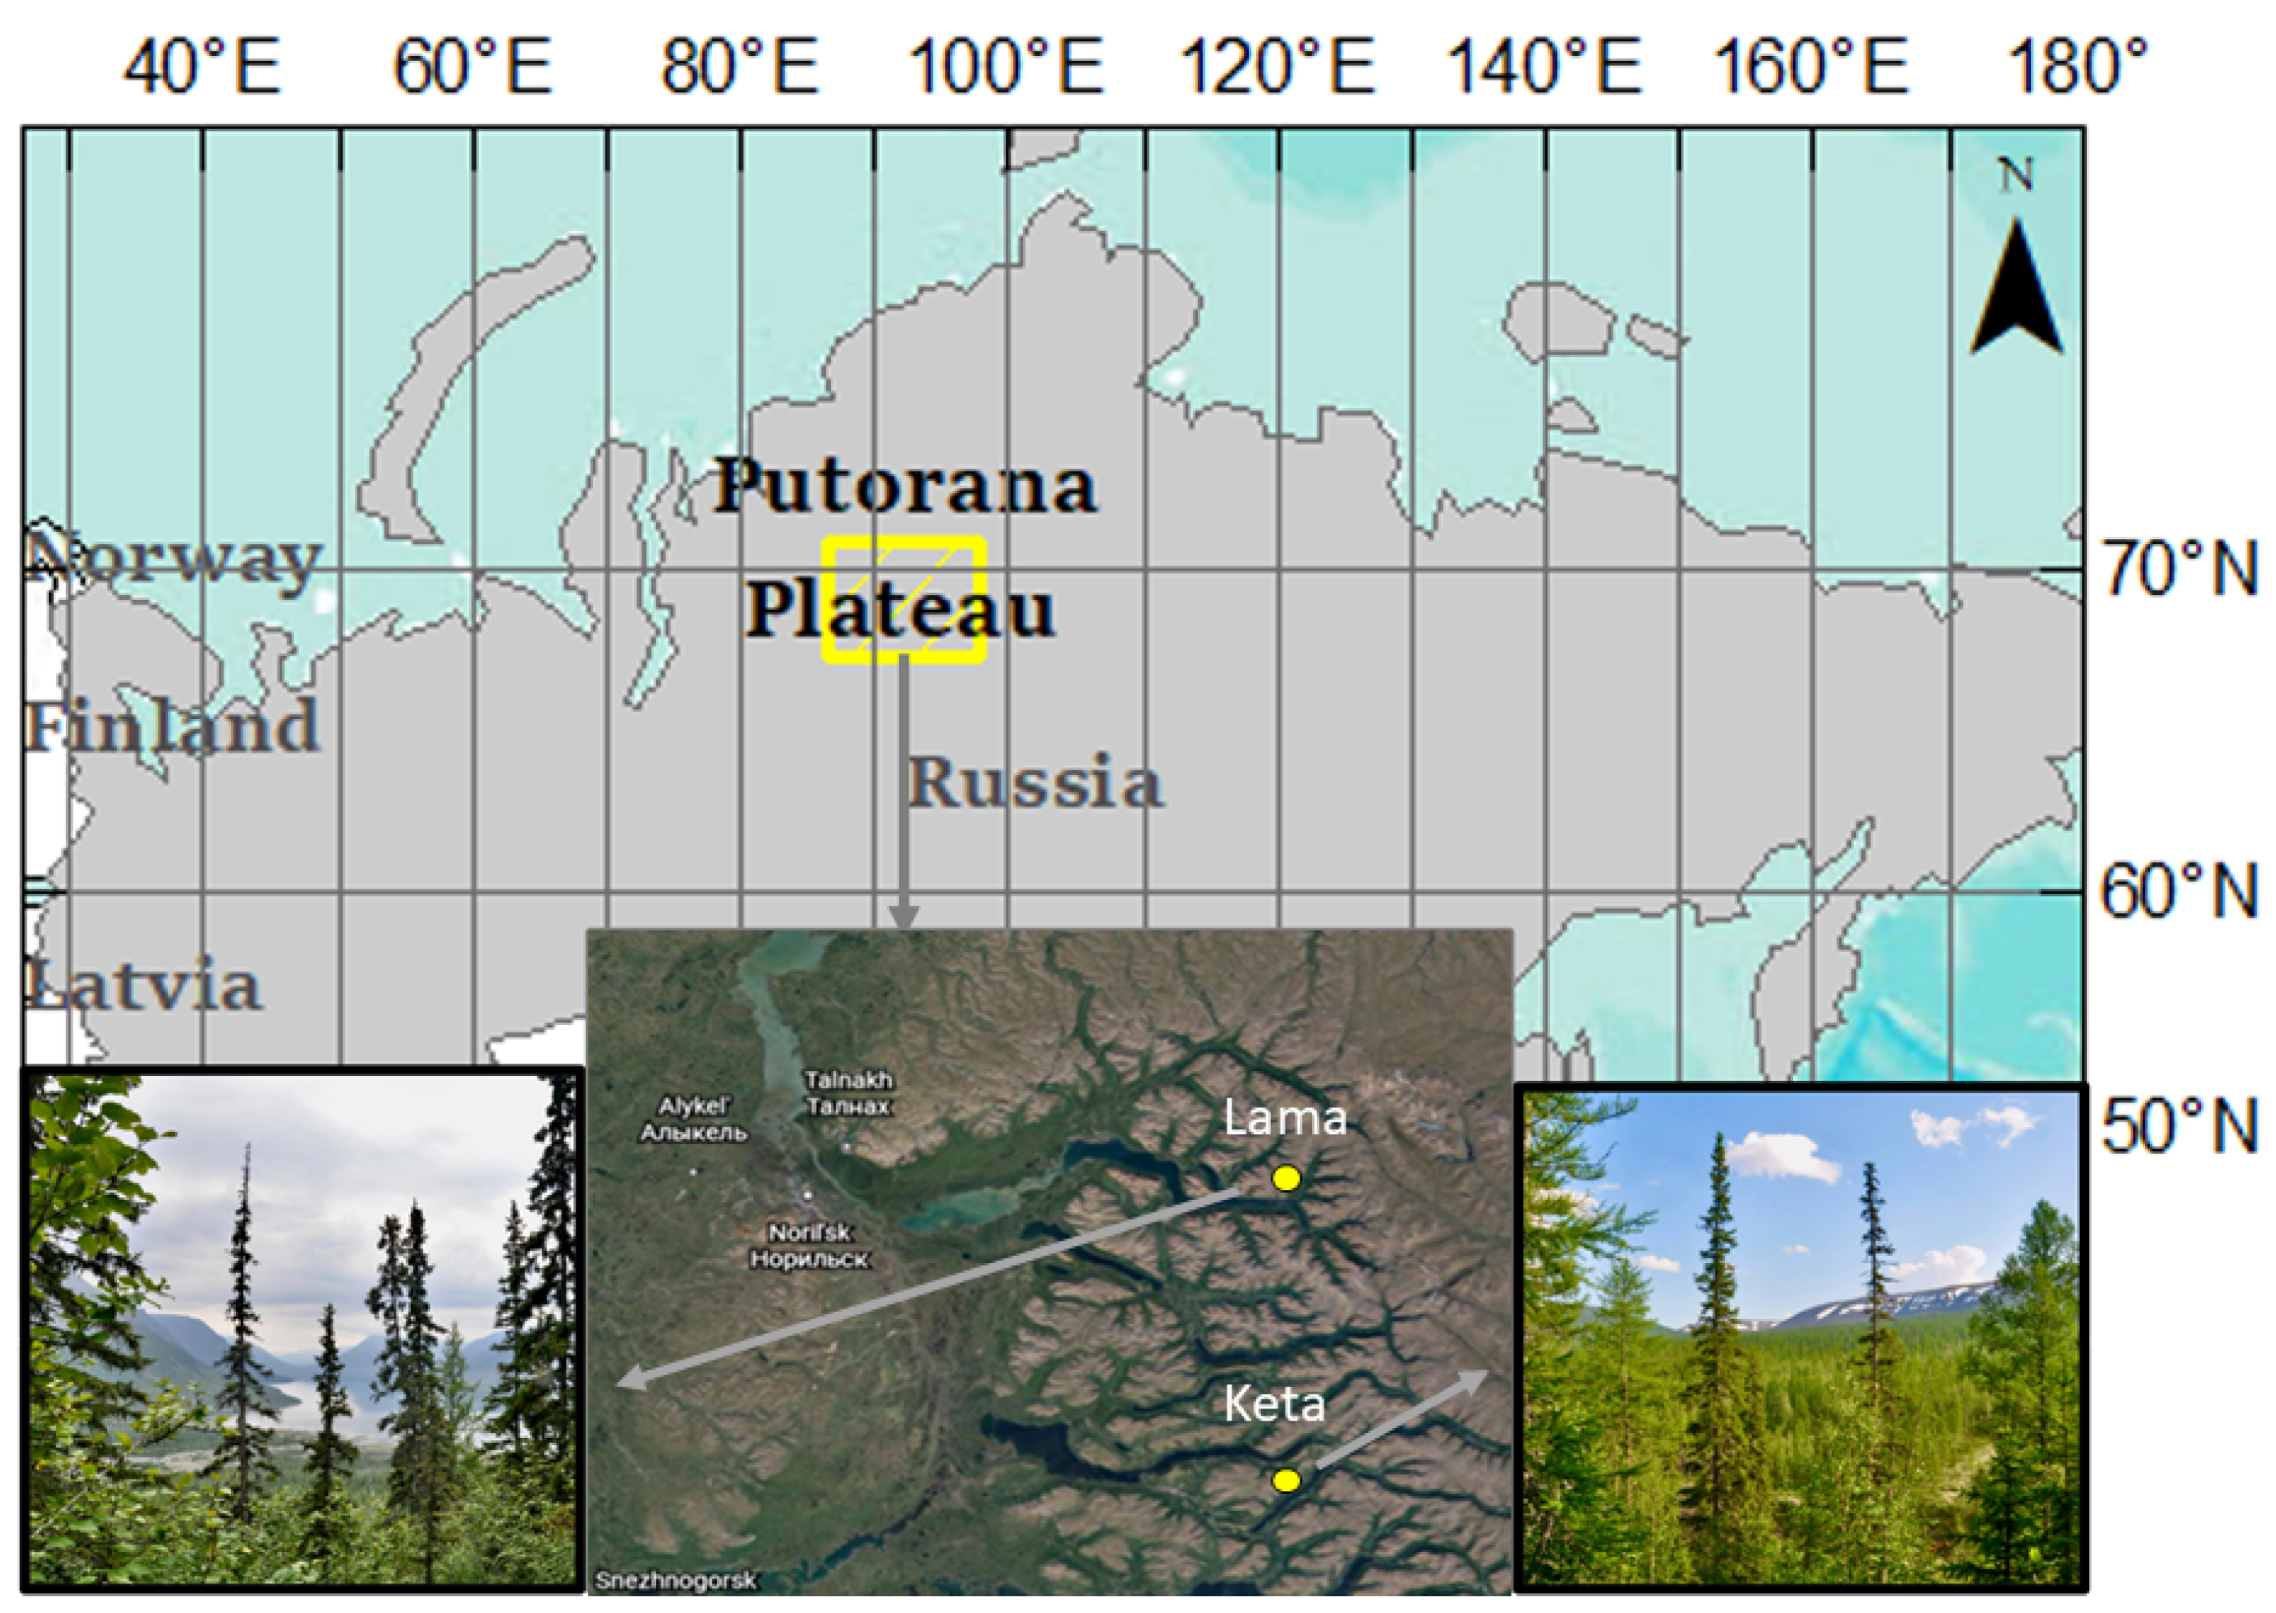
2.1. Study Site

The study site was located in the Putorana Plateau, which is situated in the SW part of the Taimyr Municipal District of the Krasnoyarsk Territory, between 89° and 101° E, and 67° and 70° N, almost completely located north of the Arctic Circle (Figure 1). The plateau is composed of numerous basaltic or andesite strata of clinkers that formed flat-surfaced mountains with elevation averaging 900–1200 m a.s.l. The erosion of edges of these layers resulted in alternation of flat terracelike surfaces and steep rocky slopes featuring trappean structure of slopes with several levels. For the western part of the plateau, deep narrow lake depressions of tectonic origin with steep rocky slopes are typical [15].
Total precipitation in the western part of the Putorana Plateau ranges from 300–400 mm in the foothills to 1200–1600 m at the top [10]. The average depth of snow cover increases from 60–80 cm to 100–150 cm, and the duration of snow cover increases from 200–240 to 280–300 days. A cold climate leads to the presence of continuous permafrost table at the depth of 1–3 m and a development of cryogenic processes [10].
The vegetation of the region is characterized by a mountain tundra in the higher part, while the more sheltered valleys have coniferous forests composed mainly of Larix gmelinii and Picea obovata with an admixture of Larix sibirica in the west. Upper timberline is formed by larch with an admixture of Betula tortuosa and elevates from 200–400 m a.s.l. in the NW to 700–800 m in the SE [19].
The soil cover of the Putorana Plateau is poorly understood. According to available data [10,18], soil cover is thin and rocky. The largest areas are occupied by cryometamorphic soils (granuzems) and organic accumulative soils along with abrazems [18].

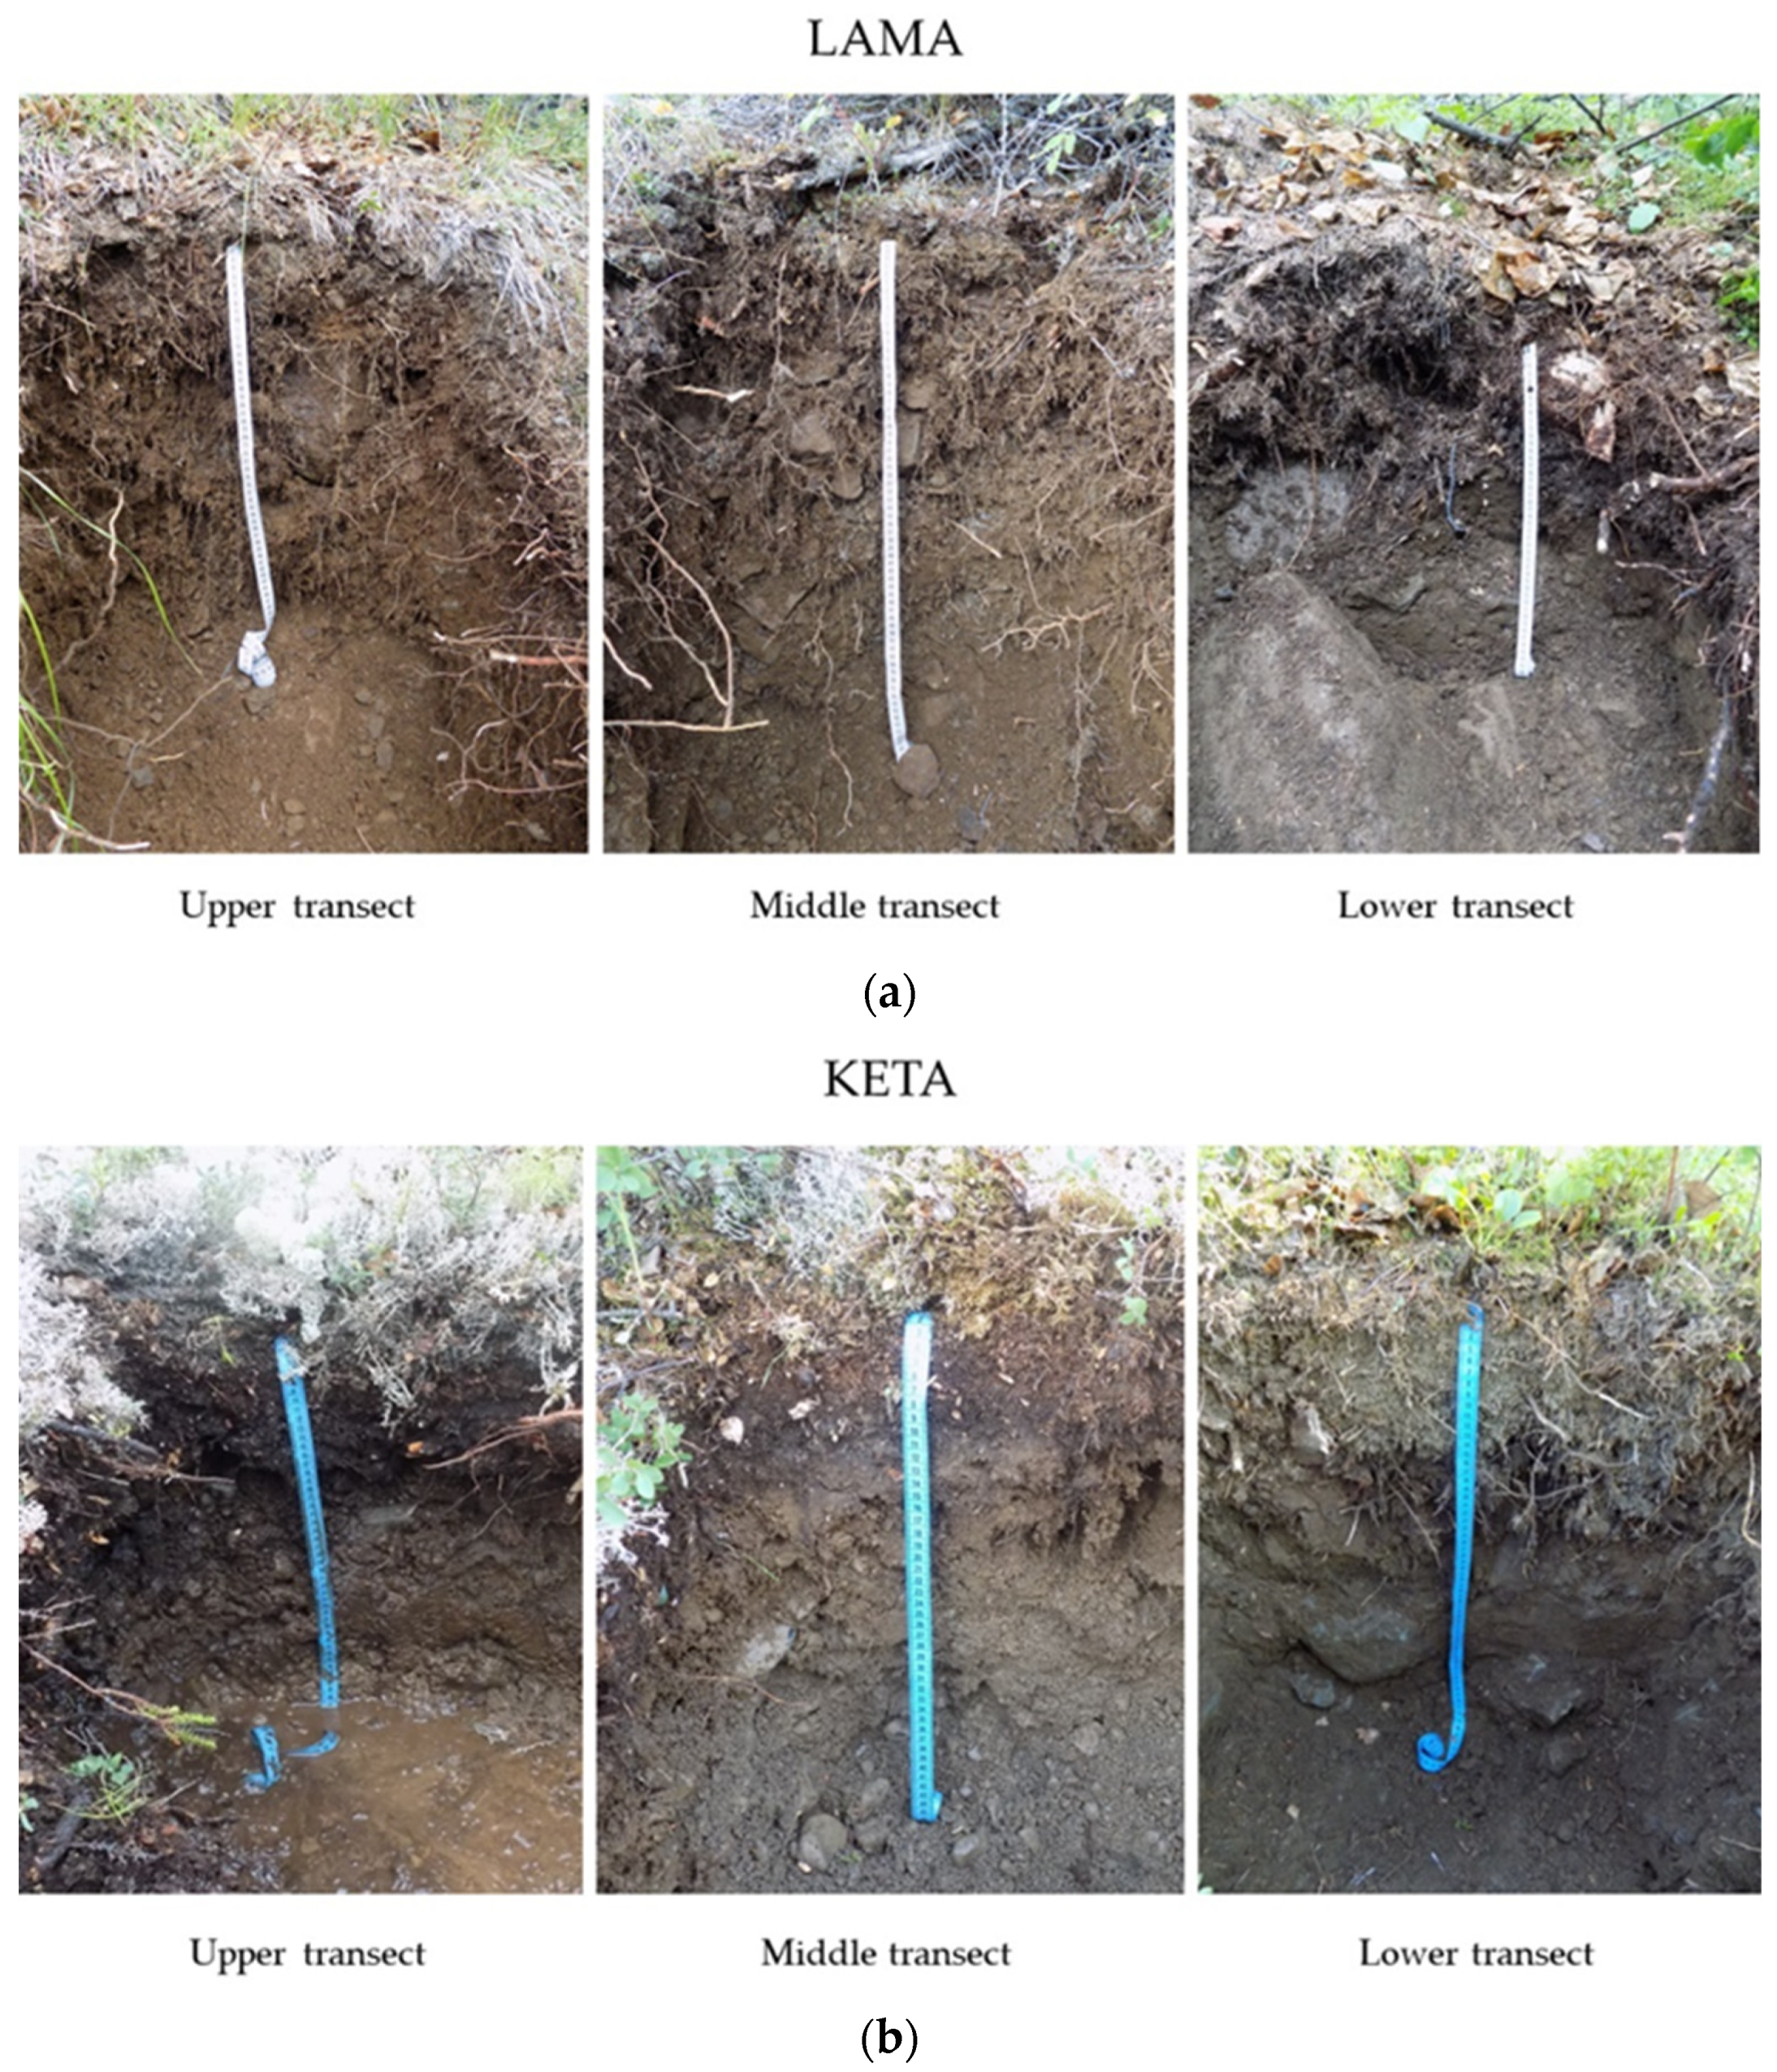
2.2. Soil Sampling and Analysis

Study plots were selected at two localities in the vicinity of the lakes Lama and Keta (here locality Lama, Keta) located about 250–320 km above the Arctic Circle and about 150 km deep inside the NW part of the Putorana Plateau. The basic description of sample plots sites is presented in Table 1. The plots do not differ either in the parent material, climate, or tree biomass.
Soil sampling was performed in August 2018 (Lama) and July 2019 (Keta) along three horizontal transects (elevational zones), each about 250–300 m long (Table 2). The transects are placed on the footslopes (lower transect), in the middle of the forested slope parts (middle transect), and immediately below the upper tree limit (upper transect), and follow the contour lines at the elevations of about 130 m, 250 m, and 420 m a.s.l. in the vicinity of Lama, and 100 m, 260 m, and 340 m a.s.l. near Keta. Nevertheless, altitude within the transects varied in the range of 4–53 m to fulfill the same conditions for plots regarding the vegetation (stands with the dominance of spruce). This was also the reason why the aspect of the lower transect at the Keta locality differed from the other sampling sites; it was not possible to find spruce stands with the same aspect as in the middle and upper slope position.
The localities Lama and Keta differed in slope angle with distinctly higher steepness at Lama. Slope angle varied substantially within the studied localities in the range of 6–46° at Lama and 2–20° at Keta. Generally, the lower parts of the slopes exhibited smaller slope angle while slope steepness increased above 100 m a.s.l.
At each transect, five soil pits approx. 50–60 m apart from each other were excavated to the depth of 0.3–0.4 m. Site conditions (terrain, ecological, and forest stand characteristics) and morphological properties of soils including the thickness of surface organic layer (including litter and organic matter in varying stages of decomposition but without weathered mineral particles), presence of horizons, and soil skeleton content were recorded. Soil samples were taken from depths of 0–0.1 m, 0.1–0.2 m, and 0.2–0.3 m, and transported to laboratories for further analyses. Altogether, 45 samples were taken at the locality Lama (3 transects, 5 soil pits at each transect, and 3 samples from different soil depths). In the same manner, 45 samples were taken at the locality Keta.
As shown in Table 1, the depth of the active layer was smaller at the Keta locality and permafrost was observed already within the 30 cm soil layer in several places, while at the Lama locality the active layer was deeper and we did not notice a frozen layer within 0–0.4 m of the soil during the pit opening.
Illustrations of soil profiles from the transects at the Lama and Keta localities are shown in Figure 2. Soils of the middle transect at the Lama locality exhibited extremely low bulk density; nevertheless, it was not possible to take samples for the bulk density estimation because of a high skeleton content. Soil thixotropy was observed in the field at both localities, at the middle transect of Lama and the upper transect of Keta. All soils exhibited high skeleton content above 50% (up to 80%) to the depth of 0.3 m of the soil profile. The density and depth of rooting was much higher at the Lama than at the Keta locality.
Soil samples were air-dried and sieved (<2 mm) prior to the analyses. The basic physico-chemical properties of the soil samples were determined according to standard methods used in soil science. All soil analyses were performed in the laboratories of the V. N. Sukachev Institute of Forest of the Siberian Branch of the Russian Academy of Sciences in Krasnoyarsk, Russia.
Soil texture was determined by the pipette (sedimentation) method after the removal of organic compounds with hydrogen peroxide (H2O2) and clay dispersion. Three soil textural fractions were determined: sand (2–0.06 mm), silt (0.06–0.002 mm), and clay (<0.002 mm) fractions. Soil pH was measured in a water suspension of air-dried soil at a soil-to-solution ratio of 1:2.5 by the Testo 206 pH instrument (Testo SE & Co. KGaA, Lenzkirch, Germany). Concentrations of C and N were determined by dry combustion method using a CN analyzer (Vario Isotope Cube, Elementar Analysis Systems GmbH, Hanau, Germany). Exchangeable Na, K, Ca, and Mg were measured in the extract of 0.1 M barium chloride (BaCl2) by inductively coupled plasma-optical emission spectrometer (ICP-OES Agilent 5100, Santa Clara, CA, USA). Free Fe (oxalate- and dithionite extractable iron; Feo, Fed) and Al (oxalate- and dithionite extractable aluminum; Alo, Ald) contained in the fine earth fraction were extracted using 0.2 M ammonium oxalate and sodium dithionite–citrate solutes [21]. Dithionite-citrate extraction represents both crystalline and poorly crystalline Fe oxides. Oxalate-extractable Fe and Al represent poorly crystalline aluminosilicates, ferrihydrite, and Al and Fe in organic complexes.

2.3. Statistical Analyses

Statistical evaluation of results was performed using the Statistica 10 software. A three-way analysis of variance (ANOVA) and Tukey pair-wise tests were accomplished to test the differences in soil properties. The effects of locality, altitudinal level, and soil depth were considered fixed. As interactions were frequently significant, therefore, separate one-way ANOVAs testing differences among horizontal transects were performed for each locality. Principal component analysis (PCA) was applied separately for each depth and locality to identify the differences in soil properties between transects and to examine the contribution of soil properties to the overall variation using the software CANOCO 5 [22].

3. Results

3.1. Differences in Soil Properties between Localities and Different Soil Layers

Variation of soil properties among sites, transects, and soil layers was tested using three-way analysis of variance (Table 3). In general, localities differed in almost all soil characteristics except silt content. The same applies to differences in most soil properties among transects at different slope positions and soil layers at different depths.
A basic overview of the investigated soil variables is given in Table 4. Most soil properties differed significantly both between localities and between soil layers. Generally, soils at Lama exhibited smaller thickness of the SOL, higher acidity, C, and N content, and a higher concentration of different forms of aluminum (Alo, Ald) and iron (Feo, Fed) compared to soils at Keta. In particular, the statistically significant difference in SOL thickness was approx. 2.5-fold, exceeding standard deviation at either site. Also, the significantly lowest clay content and C content at 0.2–0.3 m depth, and Fed concentration at 0.1–0.3 m occurred at Keta, where—in contrast to Lama—shallow permafrost table was detected. As the mineral soil is largely affected by energy and material flows, the combined influence of its upper and lower boundary formed by SOL and permafrost, respectively, had a great potential to affect observed soil properties indicative of soil weathering rate through insulation (SOL) and upward cooling (permafrost). In particular, Tukey pairwise-test showed that the largest significant difference in the content of clay, C, and reactive pedogenic Fe and Al minerals, mainly responsible for C binding and stabilization, developed in soil layers adjacent to the two boundaries. On the other hand, the generally high C/N ratio (>15) irrespective of locality and soil depth was typical of considerable presence of particulate organic matter [23]. There was a slight tendency of lower Ca and higher Na concentration at Keta; nevertheless, the variability within each locality was higher than between localities. In the case of soil texture, there was a tendency of higher proportion of sand fraction on one side and lower proportion of silt and clay fraction on the other side at Keta in comparison to Lama.
Generally, soil pH increased with increasing depth, while the opposite tendency was observed for C and N concentration. The top 0.1 m of soils exhibited, generally, higher amount of clay, P, Ca, and most of Al and Fe forms in comparison to the deeper layers.

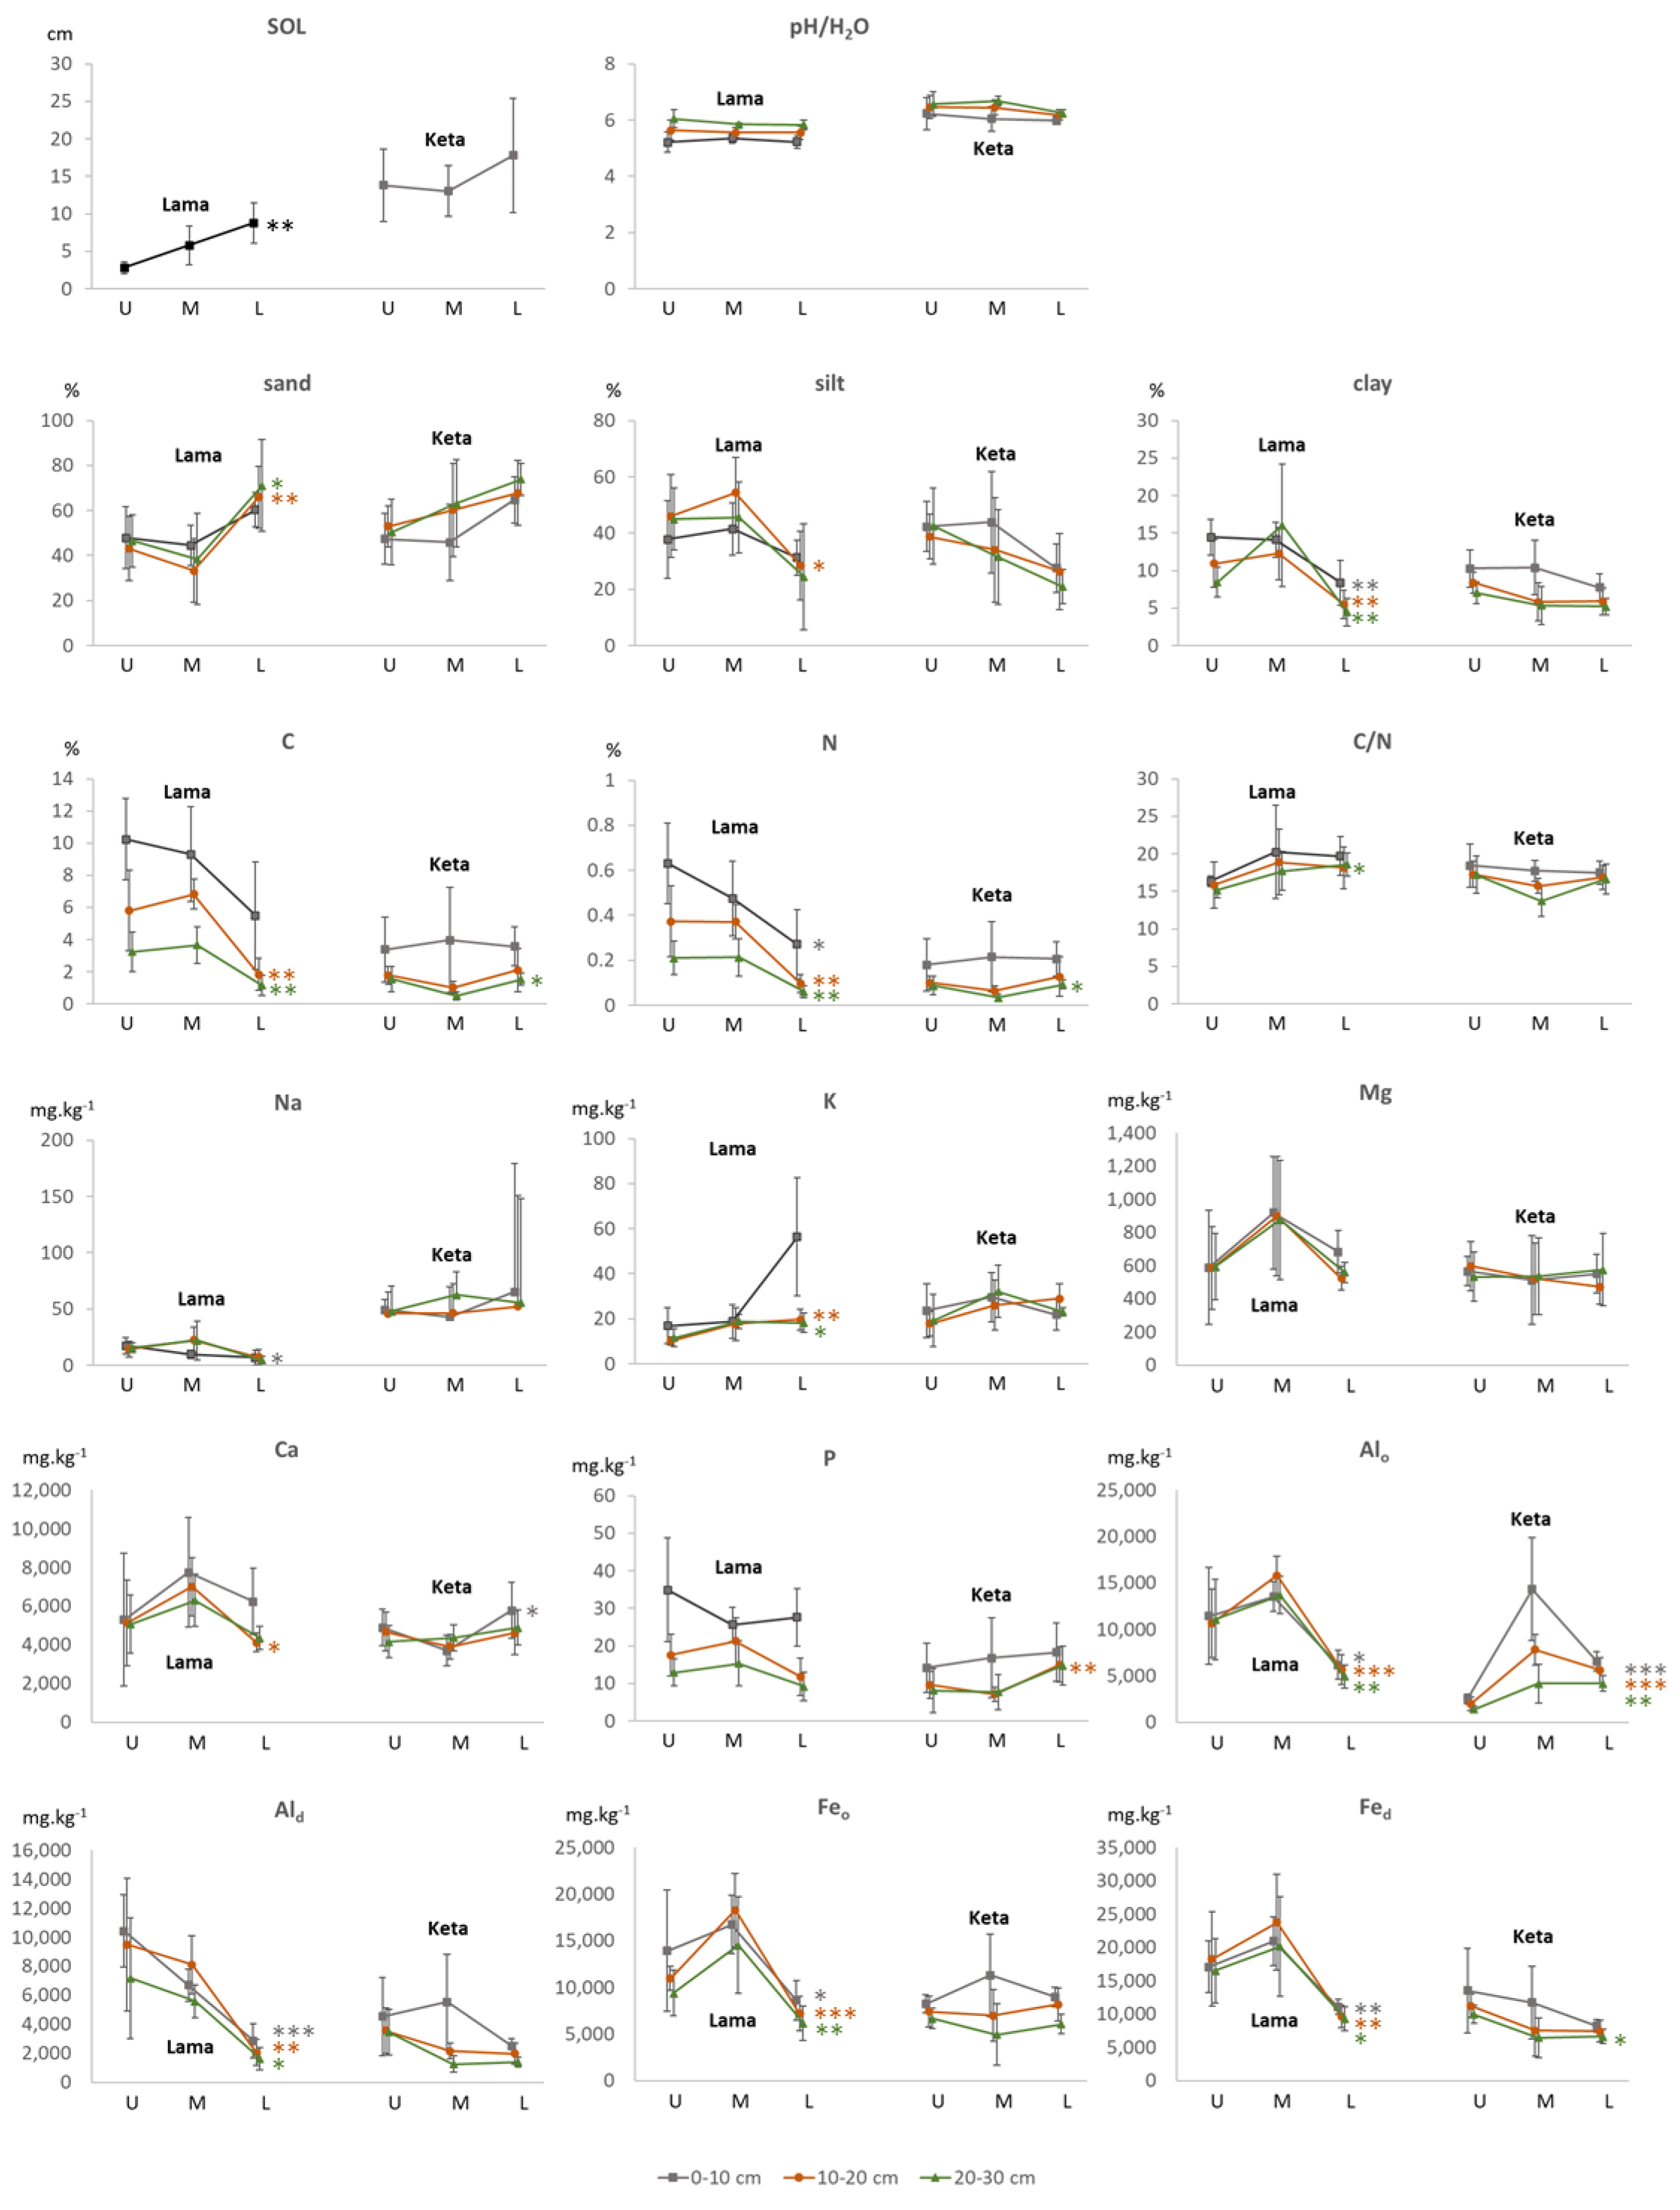
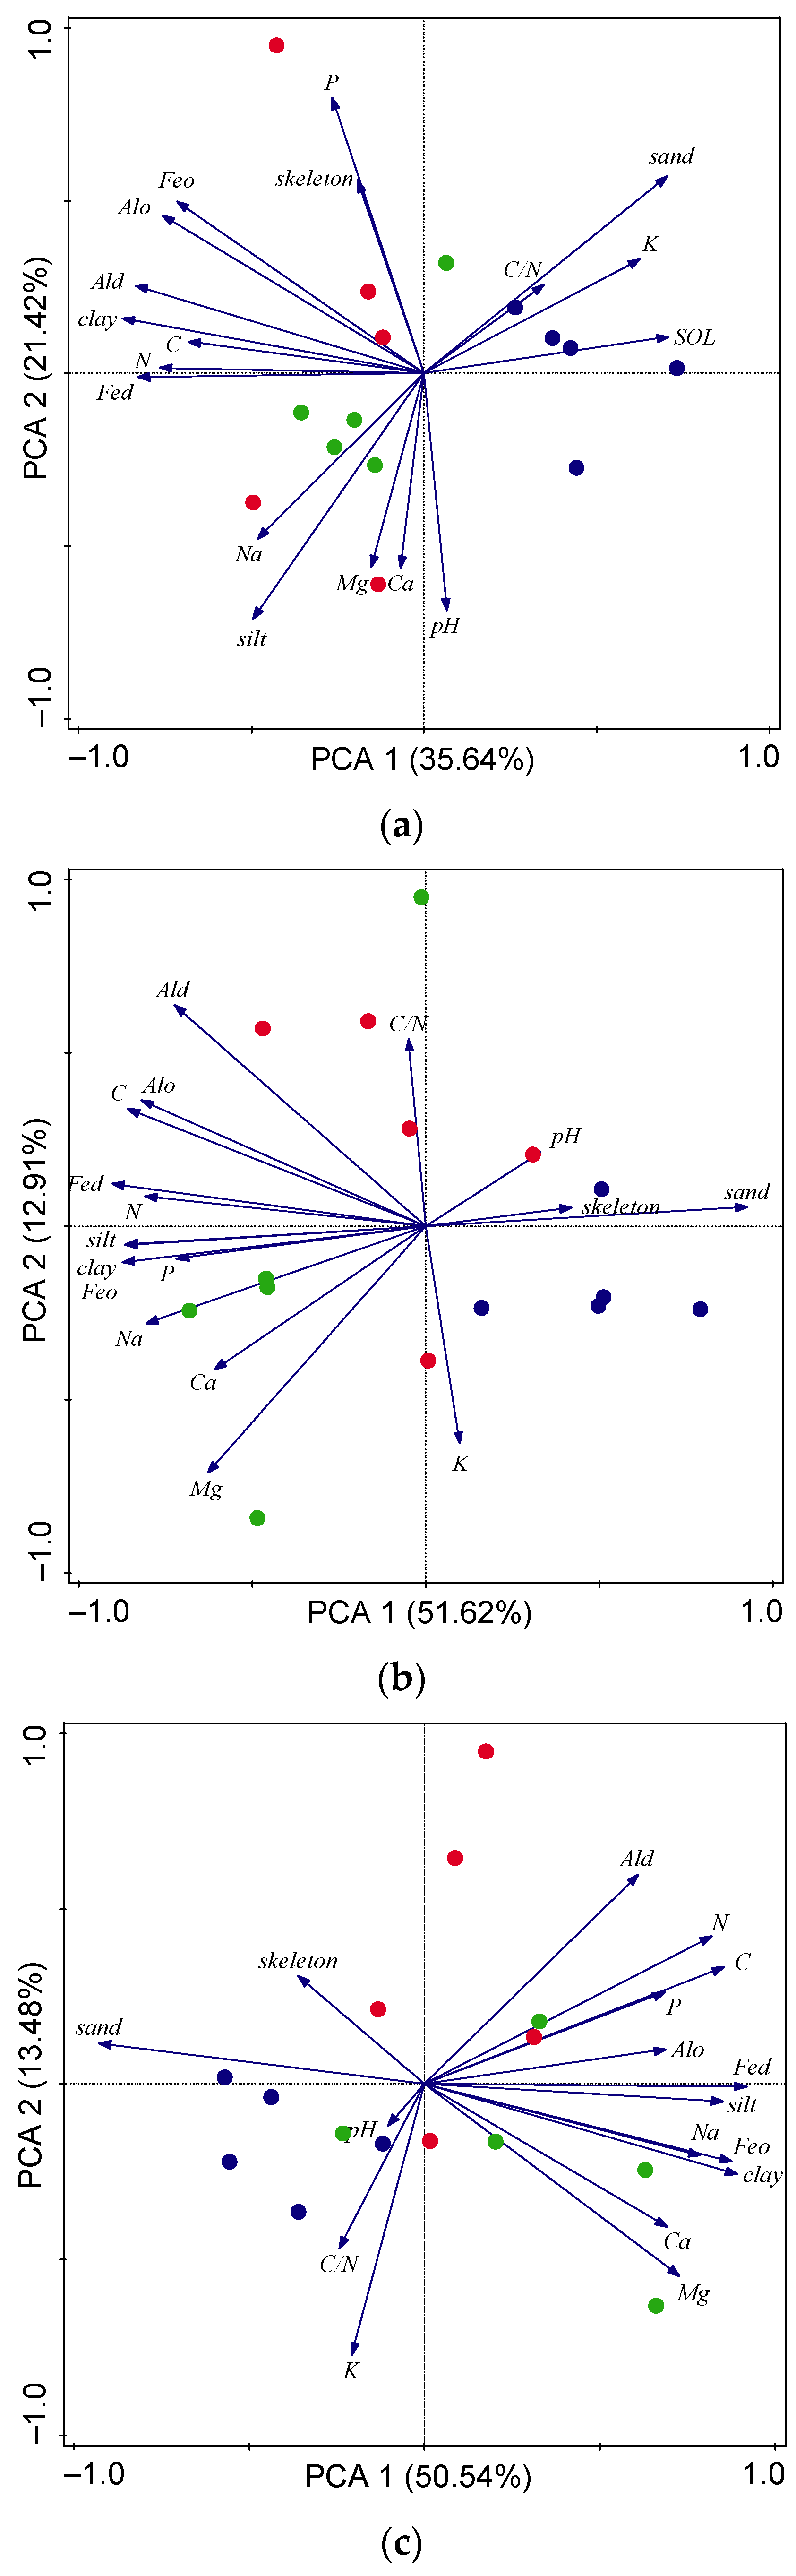
3.2. Soil Properties at Plots along the Altitudinal Gradients

Unidirectional altitudinal trends in soil properties were quite rare and were limited to the locality Lama. Thickness of the soil organic layer decreased, while dithionite-extractable aluminum content increased with elevation at Lama. The contents of organic carbon and nitrogen were the lowest on the lower transect, especially in deeper soil layers (below 0.1 m). On the other hand, the middle transect quite frequently deviated from the upper and lower slope positions; again, this applies primarily to the locality Lama. The proportion of sand was minimal, while the content of clay, concentration of Alo, Feo and Fed was highest in the middle transect almost in all soil layers. At Keta, a consistent pattern was observed only for Alo content, which again peaked on the middle slope position (Figure 3). The findings support previous ANOVA results in showing that the terrain morphology engenders considerable variability in soil properties that are important indices of soil weathering, mainly clay, pedogenic Fe and Al, and C content.
Figure 4 and Figure 5 illustrate similarities or dissimilarities of sampling points at different transects as well as the relations between soil properties for different sites and soil depths. The results indicate that plots at the lowest transect, especially at Lama, were generally more similar in soil properties than on other transects where a bigger variability in soil properties between sampling sites was observed. At Lama, samples from different transects were better separated in the depths of 0.1–0.2 and 0.2–0.3 m, while in the top layer soil properties samples from the upper and middle transects partially overlapped. Although some trends can be observed at Keta, e.g., a separation between the middle and the lower transect at the depth of 0.2–0.3 m, the groups representing different slope positions mostly overlap in all depths. The results hint at likely mixing of soil material at footslope positions though erosion and solifluction, resulting in smaller differences in soil properties among plots below steep slopes at Lama. The thick SOL and permafrost table at Keta does now allow for the development of pronounced differences in soil properties and patterns. Their emergence at Lama led to discernible interactions and associations between pedogenic Fe and Al on the one hand, and C content on the other hand. This trend also emerged from a more detailed inspection of the principal components.
At Lama, the first principal component generally reflects both elevation and soil texture, especially the contrast between sand content on one side and silt/clay content on the other side; this is especially apparent in lower soil layers. PCA diagrams also demonstrated close association of soil organic matter (as reflected in soil C and N content) with pedogenic Fe and Al. At Keta, the general picture is much more blurred: the contrast between sand and silt/clay still remains visible, although it is neither associated with any principal axis nor with elevation. Chemical soil properties also do not show any interpretable pattern.
At Lama, soils at the lower transect exhibited higher organic layer thickness and higher sand proportion, K content and C/N ratio mostly in all depths. For the middle transect, higher amounts of base cations except K and finer texture fractions were found; nevertheless, one of the plots deviates from it. Soils at the upper line exhibited higher Fe and Ald concentration and skeleton content as well. At Keta, point clouds representing the transects mostly overlapped and no clear trend in soil properties at transects was observed.

4. Discussion

Soils in the forest-tundra ecotones situated in mountainous areas, including the Putorana Plateau, above the polar circle are less explored because of their limited accessibility by land transport. To the best of our knowledge this is the first study also focusing on a deeper interior of the Putorana Plateau, containing the area in the vicinity of the Keta Lake. The reported values of soil characteristics in our study correspond with those observed in the studies of Senkov [18], Norin [24], or Karpenko [25] from the plateau margins. In general, soils are mostly sandy loam with higher skeleton content, slightly to moderately acidic, exhibiting higher amount of amorphous mineral compounds. The permafrost table occurred within 0.3 m soil depth only at the Keta Lake.
The distinct effect of differences in climate along an elevational gradient on soil properties has been documented in many studies e.g., [26,27,28,29]. Generally, with increasing altitude, a decrease in temperature and an increase in precipitation are observed. Changed climate affects the composition and the biomass of the vegetation, and both they are reflected in the alteration of soil properties and soil taxa. Common trends reported in these studies included changes in soil organic matter, C/N ratio, increase in soil acidity and cation-exchange capacity, and a decrease in base saturation. Oxyhydroxides, imogolite-type materials, or clay content were also found to be strongly related to elevation [30]. Analyses of soil properties at the Putorana Plateau confirmed these trends only partially, e.g., in the case of C and N content, while no clear trend was observed for pH and base cation contents except K concentration, and an opposite trend was found, e.g., for SOL thickness. The surface organic layer plays an important role in ecosystem processes, as it is not only a source of nutrients but distinctly affects the hydrological processes and thermal regime of soils [31,32]. The thickness of SOL was shown to be correlated, among other factors, also with topography-related factors such as elevation, upslope drainage area, and direct radiation [32]. An increase of SOL with elevation is often observed because of a lower temperature, leading to slower decomposition of organic matter arriving on the soil surface [27,33]. However, the effect of elevation can be weakened by the orientation of the hillslopes affecting the microclimate or by the steepness of the slope influencing the rates of surface-water runoff and erosion-accumulation processes [34]. The latter factor seems to be the driver causing a negative correlation of SOL with altitude. Gentle bases and increased steepness of the slopes with elevation, being a typical feature of the Putorana Plateau, as well as cryogenic processes can influence the movement of soil materials downward on the slopes and result in an accumulation of organic plant residues on the footslopes.
The surface organic layer exhibits a low thermal conductivity, and as such may act as a thermal insulator of the soil from the air, playing an important role in the protection of permafrost layer from melting [35]. Baughman et al. [32] found that the presence of a SOL more than 7 cm thick reduced mean temperature at the top of the mineral soil during the vegetation period by 8 °C, maintaining thinner active layers above the permafrost. A decrease in soil temperature by about 0.35 °C and 0.5 °C per 1-cm-increase in the thickness of SOL was also observed in the studies performed by [36] and [37], respectively. The insulation effect of SOL was also detected at our study plots when the soils at Keta exhibited a higher SOL thickness along with a smaller thickness of the active layer than at Lama. We suggest that just the steepness and consequently SOL thickness led to distinct differences in soil properties between Lama and Keta localities. Lower temperature inhibits not only the decomposition of plant residues but also slows down the chemical weathering of basalts [38,39]. Soils at Keta exhibited a lower amount of C and N, acidity, and Fed and Ald concentration, but higher Na+ concentration indicating slower pedogenesis and lower degree of soil development. The slower pedogenesis is probably the reason why no clear differentiation and trends in soil properties between transects was observed at Keta. Thus, a smaller average slope angle and thick SOL at Keta produced conditions similar to relatively flat forest-tundra, where pedogenic Fe and Al hydroxides showed pronounced small-scale spatial patterns that were neither spatially correlated with SOC stocks nor with any of the other soil properties [40].
A different situation was found along the elevational gradient at the locality Lama. Soils at the lower transect clearly differed from the others especially in characteristics related to the organic matter. Higher K concentration in the top 0–0.1 m soil layer at the lower transect reflects a higher mass of SOL. Potassium, unlike Ca or Mg cations, is very easily leached from plant residues [41]. During the active period, the downward penetrating fluids containing K+ can interact with organic matter and secondary minerals in the upper soil horizons and enrich top horizons [42]. The higher amounts of crystallized Al and Fe observed at higher transects indicate a higher degree of weathering and therefore supposedly higher temperature, which was unexpected. According to Norin [24], soils in the Putorana Plateau are characterized by temperature below the freezing point during 8–9 months in a year and the pedogenic processes take place mainly on slopes during warmer periods. We suppose that soils at the middle or upper transects can be more easily warmed by thinner SOL, enabling better access of the heat into the soil. Moreover, strong thermal inversion along the slopes proximate to the lakes are known to occur; this phenomenon can also modify the intensity of soil processes along the slopes [43].
Surprisingly, some soil properties exhibited the highest values at the middle transect, especially below the depth of 0.1 m, as observed for instance in the case of Ca, Mg, Na, Alo, or the content of finer texture fractions. During the description of soil profiles in the field, we identified a low bulk density and thixotropy indicating the presence of volcanic glass in several soil profiles at the middle transect. The presence of thixotropic soils in the subalpine belt of the Putorana Plateau was also pointed out by Senkov [18]. In the Putorana region, tuffs form small layers or bodies between single basaltic lava flows [44]. Their weathered fractions can be relocated by mass movements and solifluction, as well as cryogenic processes, and contribute to the heterogeneity of soil properties along the slopes.

5. Conclusions

Our study, performed in the forest-tundra ecotone of the Putorana Plateau, did not confirm a general trend of the changes of soil properties along the altitudinal gradient occurring at lower latitudes for most measured soil characteristics. As shown above, slope angle and accumulation of surface organic layer play an important role in the differentiation of soil properties and soil development. In addition, frequent thermal inversion situations in the lake valleys, reported in literature, may counter some expected trends. In general, soils on the steeper slope with thinner surface organic layer exhibited a higher degree of weathering than on the gentle slope, and soil properties were better differentiated along the elevational gradient there, especially at depths below 0.1 m.
Understanding the spatial distribution of soil characteristics as influenced by landscape features is critical for assessing the effect of climate change on soil and the application of models. Soil data from the less explored regions behind the polar circle of Central Siberia bring new information about soil properties especially missing in mountainous areas of subarctic regions, and indicate the need to consider the slope angle and thickness of soil organic layer in spatial models.

Author Contributions

Conceptualization, V.P.; methodology, E.G., V.P. and J.M.; investigation, E.G., V.P., J.M., P.F. and M.H.; resources, V.P.; data curation, E.G., V.P. and J.M.; writing—original draft preparation, E.G.; writing—review and editing, V.P., J.M., P.F. and M.H.; visualization, E.G.; project administration, V.P.; funding acquisition, V.P. and E.G. All authors have read and agreed to the published version of the manuscript.

Funding

This research was founded by the Slovak Research and Development Agency of the Slovak Republic, Project No. APVV-17-0676 and APVV 19-0142.

Data Availability Statement

The data presented in this study are available on request from the corresponding author.

Acknowledgments

The logistical support from Konstantin Prosekin and Alexander Matasov are gratefully acknowledged. The authors also thank Dušan Gömöry for technical assistance.

Conflicts of Interest

The authors declare no conflict of interest.

References

  1. Fisk, M.C.; Schmidt, S.K.; Seastedt, T.R. Topographic patterns of above- and belowground production and nitrogen cycling in Alpine Tundra. Ecology 1998, 79, 2253–2266. [Google Scholar] [CrossRef]
  2. Seibert, J.; Stendahl, J.; Sørense, R. Topographical influences on soil properties in boreal forests. Geoderma 2007, 139, 139–148. [Google Scholar] [CrossRef]
  3. Griffiths, R.P.; Madricht, M.D.; Swanson, A.K. The effects of topography on forest soil characteristics in the Oregon Cascade Mountains (USA): Implications for the effects of climate change on soil properties. For. Ecol. Manag. 2009, 257, 1–7. [Google Scholar] [CrossRef]
  4. Chen, Z.S.; Hsieh, C.F.; Jiang, F.Y.; Hsieh, T.H.; Sun, I.F. Relations of soil properties to topography and vegetation in a subtropical rain forest in southern Taiwan. Plant Ecol. 1997, 132, 229–241. [Google Scholar] [CrossRef]
  5. Tsui, C.C.; Chen, Z.S.; Hsieh, C.F. Relationships between soil properties and slope position in a lowland rain forest of southern Taiwan. Geoderma 2004, 123, 131–142. [Google Scholar] [CrossRef]
  6. Yimer, F.; Ledin, S.; Abdelkadir, A. Soil property variations in relation to topographic aspect and vegetation community in the South-eastern Highlands of Ethiopia. For. Ecol. Manag. 2006, 232, 90–99. [Google Scholar] [CrossRef]
  7. Valtera, M.; Šamonil, P.; Svoboda, M.; Janda, P. Effects of topography and forest stand dynamics on soil morphology in three Picea abies mountains forests. Plant Soil 2015, 392, 67–69. [Google Scholar] [CrossRef]
  8. Liu, R.; Pan, Y.; Bao, H.; Liang, S.; Yiang, Y.; Tu, H.; Nong, J.; Hung, W. Variations in soil physico-chemical properties along slope position gradient in secondary vegetation of the hilly region, Guilin, Southwest China. Sustainability 2020, 12, 1303. [Google Scholar] [CrossRef] [Green Version]
  9. Karelin, D.V.; Zamolodchikov, D.G. Uglerodnyi Obmen v Kriogennykh Ekosistemakh (Carbon Cycle in Cryogenic Ecosystems); Nauka: Moscow, Russia, 2008. (In Russian) [Google Scholar]
  10. Shahgedanova, M.; Perov, V.; Mudrov, Y. The Mountains of Northern Russia. In The Physical Geography of Northern Eurasia; Shahgedanova, M., Ed.; Oxford University Press: Oxford, UK, 2002; pp. 284–313. [Google Scholar]
  11. IPCC. Climate Change 2013: The Physical Science Basis. Contribution of Working Group I to the Fifth Assessment Report of the Intergovernmental Panel on Climate Change; Stocker, D.F., Qin, D., Plattner, G.K., Tignor, M., Allen, S.K., Boschung, J., Naules, A., Xia, Y., Bex, V., Midgley, M., Eds.; IPCC: Cambridge, UK; New York, NY, USA, 2013; Available online: https://www.ipcc.ch/report/ar5/wg1/ (accessed on 11 October 2021).
  12. Powlson, D. Will soil amplify climate change? Nature 2005, 433, 204–205. [Google Scholar] [CrossRef] [PubMed]
  13. Kirdyanov, A.V.; Hagedorn, F.; Knorre, A.A.; Fedotova, E.V.; Vaganov, E.A.; Naurzbaev, M.M.; Moiseev, P.A.; Rigling, A. 20th century treeline advance and vegetation changes along an altitudinal transect in the Putorana Mountains, northern Siberia. Boreas 2012, 41, 56–67. [Google Scholar] [CrossRef]
  14. Agnan, Y.; Courault, R.; Alexis, M.A.; Zanardo, T.; Cohen, M.; Sauvage, M.; Castrec-Rouelle, M. Distribution of trace and major elements in subarctic ecosystem soils: Sources and influence of vegetation. Sci. Total Environ. 2019, 682, 650–662. [Google Scholar] [CrossRef]
  15. Bakalin, V.A.; Fedosov, V.E.; Borovichev, E.A.; Yanov, A.V. Liverworts of Putorana Plateau (East Siberia): An updated checklist. Arctoa 2016, 25, 369–379. [Google Scholar] [CrossRef] [Green Version]
  16. Self, A.; Jones, V.J.; Brooks, S.J. Late Holocene environmental change in arctic western Siberia. Holocene 2014, 25, 150–165. [Google Scholar] [CrossRef] [Green Version]
  17. UNESCO. Putorana Plateau. UNESCO World Heritage Centre. Available online: http://whc.unesco.org/en/list/1234 (accessed on 1 December 2021).
  18. Senkov, A.A. Osobennosti pochvennogo pokrova podgol’covogo pojasa plato Putorana (The Peculiarities of Soil Cover in the Subalpine Belt of the Putorana Plateau). Sib. Ekol. Zhurnal 2014, 6, 845–854. (In Russian) [Google Scholar]
  19. Vodopanova, N.S. Puti formirovaniya flory Putorana (The Routes for the Formation of the Putorana Flora). In Flora Putorana (Flora of the Putorana); Malyshev, L.I., Ed.; Nauka Publishers: Novosibirsk, Russia, 1976; pp. 196–216. (In Russian) [Google Scholar]
  20. Harris, I.; Osborn, T.J.; Jones, P.; Lister, D. Version 4 of the CRU TS Monthly High-Resolution Gridded Multivariate Climate Dataset. Sci. Data 2020, 7, 109. [Google Scholar] [CrossRef] [PubMed] [Green Version]
  21. Courchesne, F.; Turmel, M.-C. Exctractable Al, Fe, Mn, and Si. In Soil Sampling and Methods of Analysis; Carter, M.R., Gregorich, E.G., Eds.; CRC Press: Boca Raton, FL, USA, 2007; pp. 307–315. [Google Scholar]
  22. Ter Braak, C.J.F.; Smilauer, P. CANOCO Reference Manual and User’s Guide to Canoco for Windows: Software for Canonical Community Ordination (Version 4); Centre of Biometry, Wageningen: Winnipeg, MA, Canada, 2002; p. 353. [Google Scholar]
  23. Lavallee, J.M.; Soong, J.L.; Cotrufo, M.F. Conceptualizing soil organic matter into particulate and mineral-associated forms to address global change in the 21st century. Glob. Chang. Biol. 2019, 26, 261–273. [Google Scholar] [CrossRef] [PubMed] [Green Version]
  24. Norin, B.N. Gornye Fitocenoticheskie Sistemy Subarktiki; Nauka: Novosibirsk, Russia; Saint Petersburg, Russia, 1986; Volume 292, pp. 13–26. [Google Scholar]
  25. Karpenko, L.V. Pochvy Plato Putorana v okrestnostjah ozera Lama (The Putorana Plateau soils in the Lama lake vicinity). Vestn. KrasGAU 2015, 8, 58–66. (In Russian) [Google Scholar]
  26. Reese, R.E.; Moorhead, K.K. Spatial characteristics of soil properties along an elevational gradient in a Carolina bay wetland. Soil Sci. Soc. Am. 1997, 60, 1273–1277. [Google Scholar] [CrossRef]
  27. Badiá, D.; Ruiz, A.; Girona, A.; Martí, C.; Casanova, J.; Ibarra, P.; Zufiaurre, R. The influence of elevation on soil properties and forest litter in the Siliceous Moncayo Massif, SW Europe. J. Mt. Sci. 2016, 13, 2155–2169. [Google Scholar] [CrossRef]
  28. Bayranvand, M.; Akbarinia, M.; Jouzani, G.; Gharechachi, J.; Alberti, G. Dynamics of humus forms and soil characteristics along a forest altitudinal gradient in Hyrcanian forest. Iforest Biogeosciences For. 2021, 14, 26–33. [Google Scholar] [CrossRef]
  29. Charan, G.; Bharti, V.K.; Jadhav, S.E.; Kumar, S.; Acharya, S.; Kumar, P.; Gogoi, D.; Srivastava, R.B. Altitudinal variations in soil physico-chemical properties at cold desert high altitude. J. Soil Sci. Plant Nutr. 2013, 13, 267–277. [Google Scholar] [CrossRef] [Green Version]
  30. Egli, M.; Alioth, L.; Mirabella, A.; Raimondi, S.; Nater, M.; Verel, R. Effect of climate and vegetation on soil organic carbon, humus fractions, allophanes, imogolite, kaolinite, and oxyhydroxides in volcanic soils of Etna (Sicily). Soil Sci. 2007, 172, 673–691. [Google Scholar] [CrossRef] [Green Version]
  31. Sato, Y.; Kumagai, T.; Kume, A.; Otsuki, K.; Ogawa, S. Experimental analysis of moisture dynamics of litter layers—the effects of rainfall conditions and leaf shapes. Hydrol. Process. 2004, 18, 3007–3018. [Google Scholar] [CrossRef]
  32. Baughman, C.A.; Mann, D.H.; Verbyla, D.L.; Kunz, M.L. Soil-surface organic layers in Arctic Alaska: Spatial distribution, rates of formation, microclimatic effects. J. Geophys. Res. Biogeosci. 2015, 120, 1150–1164. [Google Scholar] [CrossRef]
  33. Portillo-Estrada, M.; Pihlatie, M.; Korhonen, J.F.J.; Levula, J.; Frumau, A.K.F.; Ibrom, A.; Lembrechts, J.J.; Morillas, L.; Horváth, L.; Jones, S.K.; et al. Climatic controls on leaf litter decomposition across European forests and grasslands revealed by reciprocal litter transplantation experiments. Biogeosciences 2016, 13, 1621–1633. [Google Scholar] [CrossRef] [Green Version]
  34. Birkeland, P.W. Weathering, and Geomorphological Research; Oxford University Press: New York, NY, USA, 1974; pp. 181–195. [Google Scholar]
  35. Johnson, K.D.; Harden, J.; McGuire, A.D.; Clark, M.; Yuan, F.; Finley, O. Permafrost and organic layer interactions over a climate gradient in a discontinuous permafrost zone. Environ. Res. Lett. 2013, 8, 12. [Google Scholar] [CrossRef] [Green Version]
  36. Kasischke, E.S.; Johnstone, J.F. Variation in postfire organic layer thickness in a black spruce forest complex in interior Alaska and its effects on soil temperature and moisture. Can. J. For. Res. 2005, 35, 2164–2177. [Google Scholar] [CrossRef]
  37. Harden, J.W.; Manies, K.L.; Turetsky, M.R.; Neff, J.C. Effects of wildfire and permafrost on soil organic matter and soil climate in interior Alaska. Glob. Chang. Biol. 2006, 12, 2391–2403. [Google Scholar] [CrossRef]
  38. Sveinbjörnsson, B.; Davis, J.; Abadie, W.; Butler, A. Soil carbon and nitrogen mineralization at different elevations in the Chugach Mountains of South-Central Alaska, USA. Arct. Alp. Res. 1995, 27, 29–37. [Google Scholar] [CrossRef]
  39. Dessert, C.; Dupré, B.; Gaillardet, J.; François, L.M.; Allègre, C.J. Basalt weathering laws and impact of basalt weathering on the global carbon cycle. Chem. Geol. 2003, 202, 257–273. [Google Scholar] [CrossRef]
  40. Evgrafova, A.; de la Haye, T.R.; Haase, I.; Shibistova, O.; Guggenberger, G.; Tananaev, N.; Sauheitl, L.; Spielvogel, S. Small-scale spatial patterns of soil organic carbon and nitrogen stocks in permafrost-affected soils of northern Siberia. Geoderma 2018, 329, 91–107. [Google Scholar] [CrossRef]
  41. Trippler, C.E.; Kaushal, S.S.; Likens, G.E.; Walter, M.T. Patterns in potassium dynamics in forest ecosystems. Ecol. Lett. 2006, 9, 451–466. [Google Scholar] [CrossRef]
  42. Pokrovsky, O.S.; Schott, J.; Kudryavtzev, D.I.; Dupré, B. Basalt weathering in Central Siberia under permafrost conditions. Geochim. Cosmochim. Acta 2005, 69, 5659–5680. [Google Scholar] [CrossRef]
  43. Malyshev, L. Levels of the Upper Forest Boundary in Northern Asia. Vegetation 1993, 109, 175–186. [Google Scholar] [CrossRef]
  44. Büchl, A.; Gier, S. Petrogenesis and alteration of tuffs associated with continental flood basalts from Putorana, northern Siberia. Geol. Mag. 2003, 140, 649–659. [Google Scholar] [CrossRef]
Figure 1. Position of the sample locations in Russia: the lakes Lama and Keta (Krasnoyarsk region).
Land 11 00128 g001
Figure 2. Soils of the upper, middle, and lower transects at the locality Lama (a) and Keta (b).
Land 11 00128 g002
Figure 3. Changes of soil properties along the altitudinal gradient in different soil depths at the Lama and Keta localities (U–upper transect, M–middle transect, L–lower transect; vertical bars represent standard deviations). Significance of ANOVA F-tests: *** p < 0.001, ** p < 0.01, * p < 0.05.
Land 11 00128 g003
Figure 4. PCA analysis of soil properties in the depth of soil (a) 0–0.1 m, (b) 0.1–0.2 m, and (c) 0.2–0.3 m at the Lama locality. Color of points: blue–lower transect, green–middle transect, red–upper transect.
Land 11 00128 g004
Figure 5. PCA analysis of soil properties in the depth of soil (a) 0–0.1 m, (b) 0.1–0.2 m and (c) 0.2–0.3 m at Keta locality. Color of points: blue–lower transect, green–middle transect, red–upper transect.
Land 11 00128 g005
Table 1. Basic characteristics of the research localities. Mean annual temperature (MAT) and mean annual precipitation total (MAP) were calculated from the CRU TS Monthly High-Resolution Gridded Multivariate Climate Dataset v. 4 [20].
LocalityMAT
(°C)
MAP
(mm)
Geological
Substrate
Active Layer Depth
(m)
Tree Biomass
(t/ha)
Lama−9.4435.3Basalt>0.4 m52.2
Keta−10.1456.7Basalt<0.3 m52.3
Table 2. Basic characteristics of the transects at the research localities (mean values and range of variation of altitude, aspect and slope angle).
Locality CoordinatesAltitude
(m)
Aspect
(°)
Slope Angle
(°)
LamaTransect 1N 69°29′03.00″ E 91°25′34.14″419
(400–441)
126
(110–150)
33
(30–46)
Transect 2N 69°28′54.66″ E 91°25′56.16″249
(216–269)
112
(70–130)
35
(19–47)
Transect 3N 69°28′42.30″ E 91°26′44.04″129
(111–149)
102
(80–120)
9
(6–13)
KetaTransect 1N 68°44′40.70″ E 91°31′52.70″338
(320–351)
203
(190–208)
9
(6–14)
Transect 2N 68°44′48.18″ E 91°32′08.34″260
(252–269)
184
(170–198)
16
(8–20)
Transect 3N 68°45′17.30″ E 91°29′35.70″104
(102–106)
342
(330–350)
2
(2–4)
Table 3. Three-way analysis of variance of soil properties (F-test values and corresponding significance levels).
Source of Variation Variable
SOL 1pH/H2OSandSiltClayC
DFF F F F F F
locality134.57***134.71***7.52**3.58ns24.87***69.43***
transect23.87*3.32*18.2***14.03***18.9***8.68***
Locality * transect20.51ns1.02ns2.34ns1.02ns10.61***13.22***
depth2 23.61***1.09ns0.43ns9.63***40.64***
Locality * depth2 1.27ns1.23ns1.44ns0.24ns6.13**
Transect * depth4 0.18ns0.25ns0.49ns1.09ns0.52ns
Locality * transect * depth4 0.81ns0.76ns0.58ns1.91ns1.04ns
error72
NC/NNaKMgCa
DFF F F F F F
locality169.68***3.63ns17.49***3.28ns10.15**12.30***
transect211.73***1.52ns0.03ns10.34***3.99*1.41ns
Locality * transect218***7.41**0.48ns6.59**5.56**8.96***
depth234.77***3.73*0.05ns5.94**0.21ns2.24ns
Locality * depth25.14**0.05ns0.08ns5.27**0.14ns0.64ns
Transect * depth40.68ns0.62ns0.18ns2.62*0.27ns0.74ns
Locality * transect * depth41.58ns0.14ns0.04ns5.01**0.12ns0.48ns
error72
PAloAldFeoFed
DFF F F F F
locality127.28***82.50***49.08***42.49***63.51***
transect20.07ns47.25***33.95***17.88***20.72***
Locality * transect26.53**22.88***11.33***17.73***12.21***
depth226.29***7.24**6.99**9.35***2.21ns
Locality * depth25.12**5.00**1.12ns0.22ns1.23ns
Transect * depth40.38ns1.89ns0.38ns0.31ns0.13ns
Locality * transect * depth41.73ns3.41*1.62ns1.54ns0.53ns
error72
1 DF (error) = 29. *** p < 0.001, ** p < 0.01, * p < 0.05, ns non-significant. SOL–surface organic layer.
Table 4. Soil properties at two localities and of different soil layers (mean values, standard deviations, and Tukey pairwise test; means with the same letters do not differ significantly).
VariableLamaKeta
0–0.1 m0.1–0.2 m0.2–0.3 m0–0.1 m0.1–0.2 m0.2–0.3 m
n = 15n = 15n = 15n = 15n = 15n = 15
SOL (cm)5.80 ± 3.26b 14.87 ± 5.58a
Sand (%)50.91 ± 11.99a47.45 ± 19.23a52.00 ± 21.95a52.65 ± 15.05a60.33 ± 15.69a62.46 ± 16.77a
Silt (%)36.79 ± 10.45a42.98 ± 16.52a38.34 ± 16.86a37.88 ± 14.01a32.98 ± 14.00a31.68 ± 15.07a
Clay (%)12.30 ± 3.73a9.57 ± 4.07ab9.65 ± 6.77ab9.46 ± 2.84ab6.69 ± 2.20ab5.86 ± 1.89b
pH5.26 ± 0.26d5.58 ± 0.25d5.90 ± 0.22c6.08 ± 0.40bc6.36 ± 0.31ab6.50 ± 0.32a
C (%)8.34 ± 3.47a4.81 ± 2.70b2.68 ± 1.49bcd3.64 ± 2.17bc1.63 ± 1.94cd1.19 ± 0.70d
N (%)0.46 ± 0.22a0.28 ± 0.16b0.16 ± 0.10bc0.20 ± 0.11bc0.10 ± 0.06c0.07 ± 0.03c
C/N18.76 ± 4.02a17.62 ± 3.49a17.14 ± 2.28a17.89 ± 1.94a16.61 ± 1.52a15.85 ± 2.58a
Na (mg/kg)11.32 ± 7.23b14.68 ± 10.18ab14.10 ± 12.24ab52.53 ± 63.52ab48.20 ± 55.21ab55.30 ± 52.49a
K (mg/kg)30.72 ± 24.19a15.82 ± 6.32a16.22 ± 4.92a24.97 ± 9.92a24.27 ± 8.94a55.28 ± 117.9a
Mg (g/kg)0.73 ± 0.30a0.67 ± 0.29a0.67 ± 0.27a0.54 ± 0.17a0.54 ± 0.17a0.55 ± 0.19a
Ca (g/kg)6.42 ± 2.74a5.42 ± 1.91ab5.42 ± 1.91ab4.79 ± 1.34ab4.40 ± 0.95b4.47 ± 0.81b
P (mg/kg)29.38 ± 9.74a16.88 ± 6.55b12.48 ± 4.95b16.42 ± 8.07b10.57 ± 4.73b10.19 ± 5.91b
Alo (g/kg)10.38 ± 4.41a10.70 ± 4.91a9.84 ± 4.63a7.80 ± 5.89ab5.13 ± 2.77b3.24 ± 1.81b
Ald (g/kg)6.67 ± 3.56a6.55 ± 4.30a4.81 ± 3.36ab4.19 ± 2.62ab2.57 ± 1.21b2.05 ± 1.38b
Feo (g/kg)13.08 ± 5.23a12.14 ± 5.35a10.03 ± 4.79ab9.50 ± 2.83ab7.52 ± 2.02b5.88 ± 2.06b
Fed (g/kg)16.35 ± 5.13ab17.21 ± 8.17a15.30 ± 6.76ab11.16 ± 5.05bc8.73 ± 3.04c7.69 ± 2.48c
Publisher’s Note: MDPI stays neutral with regard to jurisdictional claims in published maps and institutional affiliations.

