
Impacts of Urban Expansion on the Loss and Fragmentation of Cropland in the Major Grain Production Areas of China


1
Faculty of Geomatics, Lanzhou Jiaotong University, Lanzhou 730070, China
2
Institute of Geographic Sciences and Natural Resources Research, Chinese Academy of Sciences, Beijing 100101, China
3
Key Laboratory of Urban Land Resources Monitoring and Simulation, Ministry of Natural Resources, Shenzhen 518034, China
4
National-Local Joint Engineering Research Center of Technologies and Applications for National Geographic State Monitoring, Lanzhou 730070, China
5
Gansu Provincial Engineering Laboratory for National Geographic State Monitoring, Lanzhou 730070, China
*
Author to whom correspondence should be addressed.
Land 2022, 11(1), 130; https://0-doi-org.brum.beds.ac.uk/10.3390/land11010130
Submission received: 21 December 2021
/
Revised: 10 January 2022
/
Accepted: 12 January 2022
/
Published: 14 January 2022
Abstract
:The continuous expansion of urban land has led to massive encroachment upon cropland. To examine the impacts of urban expansion on the loss and fragmentation of cropland in China’s nine major grain production areas (MGPAs), we used standard deviation ellipse, land use transfer matrix, land use dynamic degree, and landscape metric to explore the spatio-temporal evolutions, mutual transfer, and landscape patterns of cropland and urban land. The results show the following: (1) From 1995 to 2018, the areas of cropland in MGPAs showed a trend of “short-term increase—long-term decrease—short-term increase”, while that of urban land grew continuously; (2) Urban expansion is the main cause of cropland loss. The cropland area converted to urban land accounts for a large proportion (49.26%) of the total transfer of cropland to other land types, especially in the densely populated, rapidly urbanizing and industrializing Taihu Lake Plain, Jianghuai Region, and Pearl River Delta; (3) In most MGPAs, urban expansion has led to fragmentation of cropland, especially in the Pearl River Delta, as indicated by the significant change of patch density. However, in the Sanjiang Plain and Songnen Plain, a less pronounced or even reduced cropland fragmentation was observed due to the significant conversion of other land types to cropland under specific land policies. From these results, we suggest that the government should regulate the encroachment of urban land on cropland and the transfer of natural land to it, and encourage the rural land consolidation to increase the cropland.
1. Introduction
The world has experienced dramatic urbanization in recent decades [1]. According to statistics, the global urbanization rate was 50% in 2009 and is expected to rise to 68% by 2050, and the urban population will grow by more than 2/3, with about 90% occurring in the urban centers of Asia and Africa [2]. According to current trends, the urban population of developing countries is expected to double and the build-up area to triple between 2000 and 2030 [3]. Urban expansion, as the most dramatic form of land use/land cover change, is a visual manifestation of urbanization [4]. While urban expansion creates a built environment for house urban populations and their activities [5], it also has a negative impact on habitat quality [6], ecosystem services [7], regional climate [8], biodiversity [9], and hydrology [10]. Most of the relevant studies focus on exploring the drivers of urban expansion, analyzing the impacts of urban expansion on regional ecology and environmental, and digging the coupling relationship between urban expansion and socio-economic development [11]. Moreover, urban expansion was analyzed at multiple scales include city, region, urban agglomeration [12], province, nation, and global levels. In addition, the study areas are mostly in the developed regions with intense urban expansion and the used data is mainly derived from remote sensing monitoring and interpretation data [13].
Cropland loss is one of the most significant negative impacts of urban expansion in developing countries [14], due to rapid urban expansion that eats up available land in peri-urban and rural areas, forcing farmers living on the urban fringe with large populations to migrate to new places in search of farming space, resulting in a decrease in cropland area [15]. China is the largest developing country and has experienced rapid urban growth over the past 40 years, with increasing population density and economic development levels [16]; however, rapid urban expansion has also resulted in the encroachment of large amounts of prime cropland [17]. In response, the Chinese government has formulated a series of policies and regulations to protect cropland, such as “requisition–compensation balance of cropland”, “return cropland to forest and grassland”, and “dynamic balance of total cropland” [18,19]. However, the loss of cropland is unavoidable, with the proportion of cropland loss due to urban expansion in China reaching 45.96% in 1997–2000 and rising to 55.44% in 2000–2010 [20]. This poses a severe challenge to China, which has a large population and little land, with less than 40% of the world average cropland per capita [3], directly endangering its food security. Therefore, a scientific understanding of the impact of urban expansion on cropland loss under the severe land use situation is of great practical significance and a guide to the reasonable coordination of the contradiction between urban expansion and cropland protection.
Research on the impacts of urban expansion on the spatial pattern of cropland has been a hot topic in sustainable development and livelihoods [21], current research topics can be summarized as follows: (1) The statistical analysis of the amount of change of cropland during urban expansion. Most studies have found that a significant loss of cropland occurs during a rapid urban expansion [22]. Moreover, the loss of cropland during urban expansion demonstrates obvious geographical variations as reported by studies conducted on different regions [23]. Furthermore, from a long-term perspective of cropland loss during urban expansion, some studies also observed the Kuznets curve-like relationship between urbanization ratio and the amount of cropland [24]. (2) The effects of urban expansion on cropland. Urban expansion generally harms cropland, which is reflected in the fact that urban expansion constantly compromises the quantity and quality of cropland, leading to ultimate losses of large amounts of high-quality cropland [25]. However, some research also found urbanization to have a positive effect on cropland under certain population sizes. In addition, from a regional perspective, urban expansion also means the emigration of the rural population to some extent, which in essence, saved the cropland originally designated for construction by lowering the emigrating rural population’s demand for living space per capita [26]. (3) The drivers of cropland changes due to urban expansion. The current research mainly explored how the underlying forces and restrictions of urban expansion influenced cropland change via logistic regression models, spatial regression models, or machine learning methods, while at the same time considering socio-economic and natural-environmental factors, such as regional policy, industry structure, climate, and topography. For example, Liu et al. [27] used artificial neural networks to analyze the dominant factors of cropland change and found that the rapid development of secondary and tertiary industries was the dominant cause of serious cropland loss. Chen et al. [28] used a logistic regression model to spatially identify the factors influencing cropland change and found that location conditions, population growth, and farmer income were the main factors influencing the transfer of cropland.
At present, research on the impacts of urban expansion on cropland is still mainly focused on the ecologically fragile arid and semi-arid areas and the developed eastern coastal regions [29,30]. Furthermore, the scale of the analysis focuses on countries, provinces, and regions, whilst few studies have considered this issue from the perspective of China’s major grain production areas (MGPAs, called commodity grain bases in Chinese) [31,32], however, these areas are the core areas of China’s grain production and the key to ensuring its food security. In the country, rapid urbanization has led to increasingly prominent conflicts between the people and land, moreover, the resource constraints and loss of cropland in MGPAs have become more dramatic [21]. In this context, it is of great significance to explore the consequences of urban expansion on cropland in MGPAs [4,33]. Nevertheless, these areas represent major concentrations of high-quality cropland, which is key to food security. Therefore, it is worthy to research cropland changes in MGPAs to explore whether these areas can continue to play their part in ensuring food security. Based on the above objectives, this paper uses standard deviation ellipses to characterize the spatial evolution of cropland and urban land, explores the structural characteristics of land use change and the degree of change in the study area through land use transfer matrix and land use dynamic degree, and finally uses landscape metrics to investigate whether urban expansion has a fragmentation effect on cropland. By the above methods, we explored the evolution of cropland and urban land, occupation of cropland by urban land and impacts of urban land on the fragmentation of cropland, with the intent of understanding the spatiotemporal evolution, effects, and ongoing exchange between cropland and urbanization; furthermore, providing a reference base to guide the rational formulation of cropland protection and regional development policies.
2. Data and Methods
2.1. Study Area
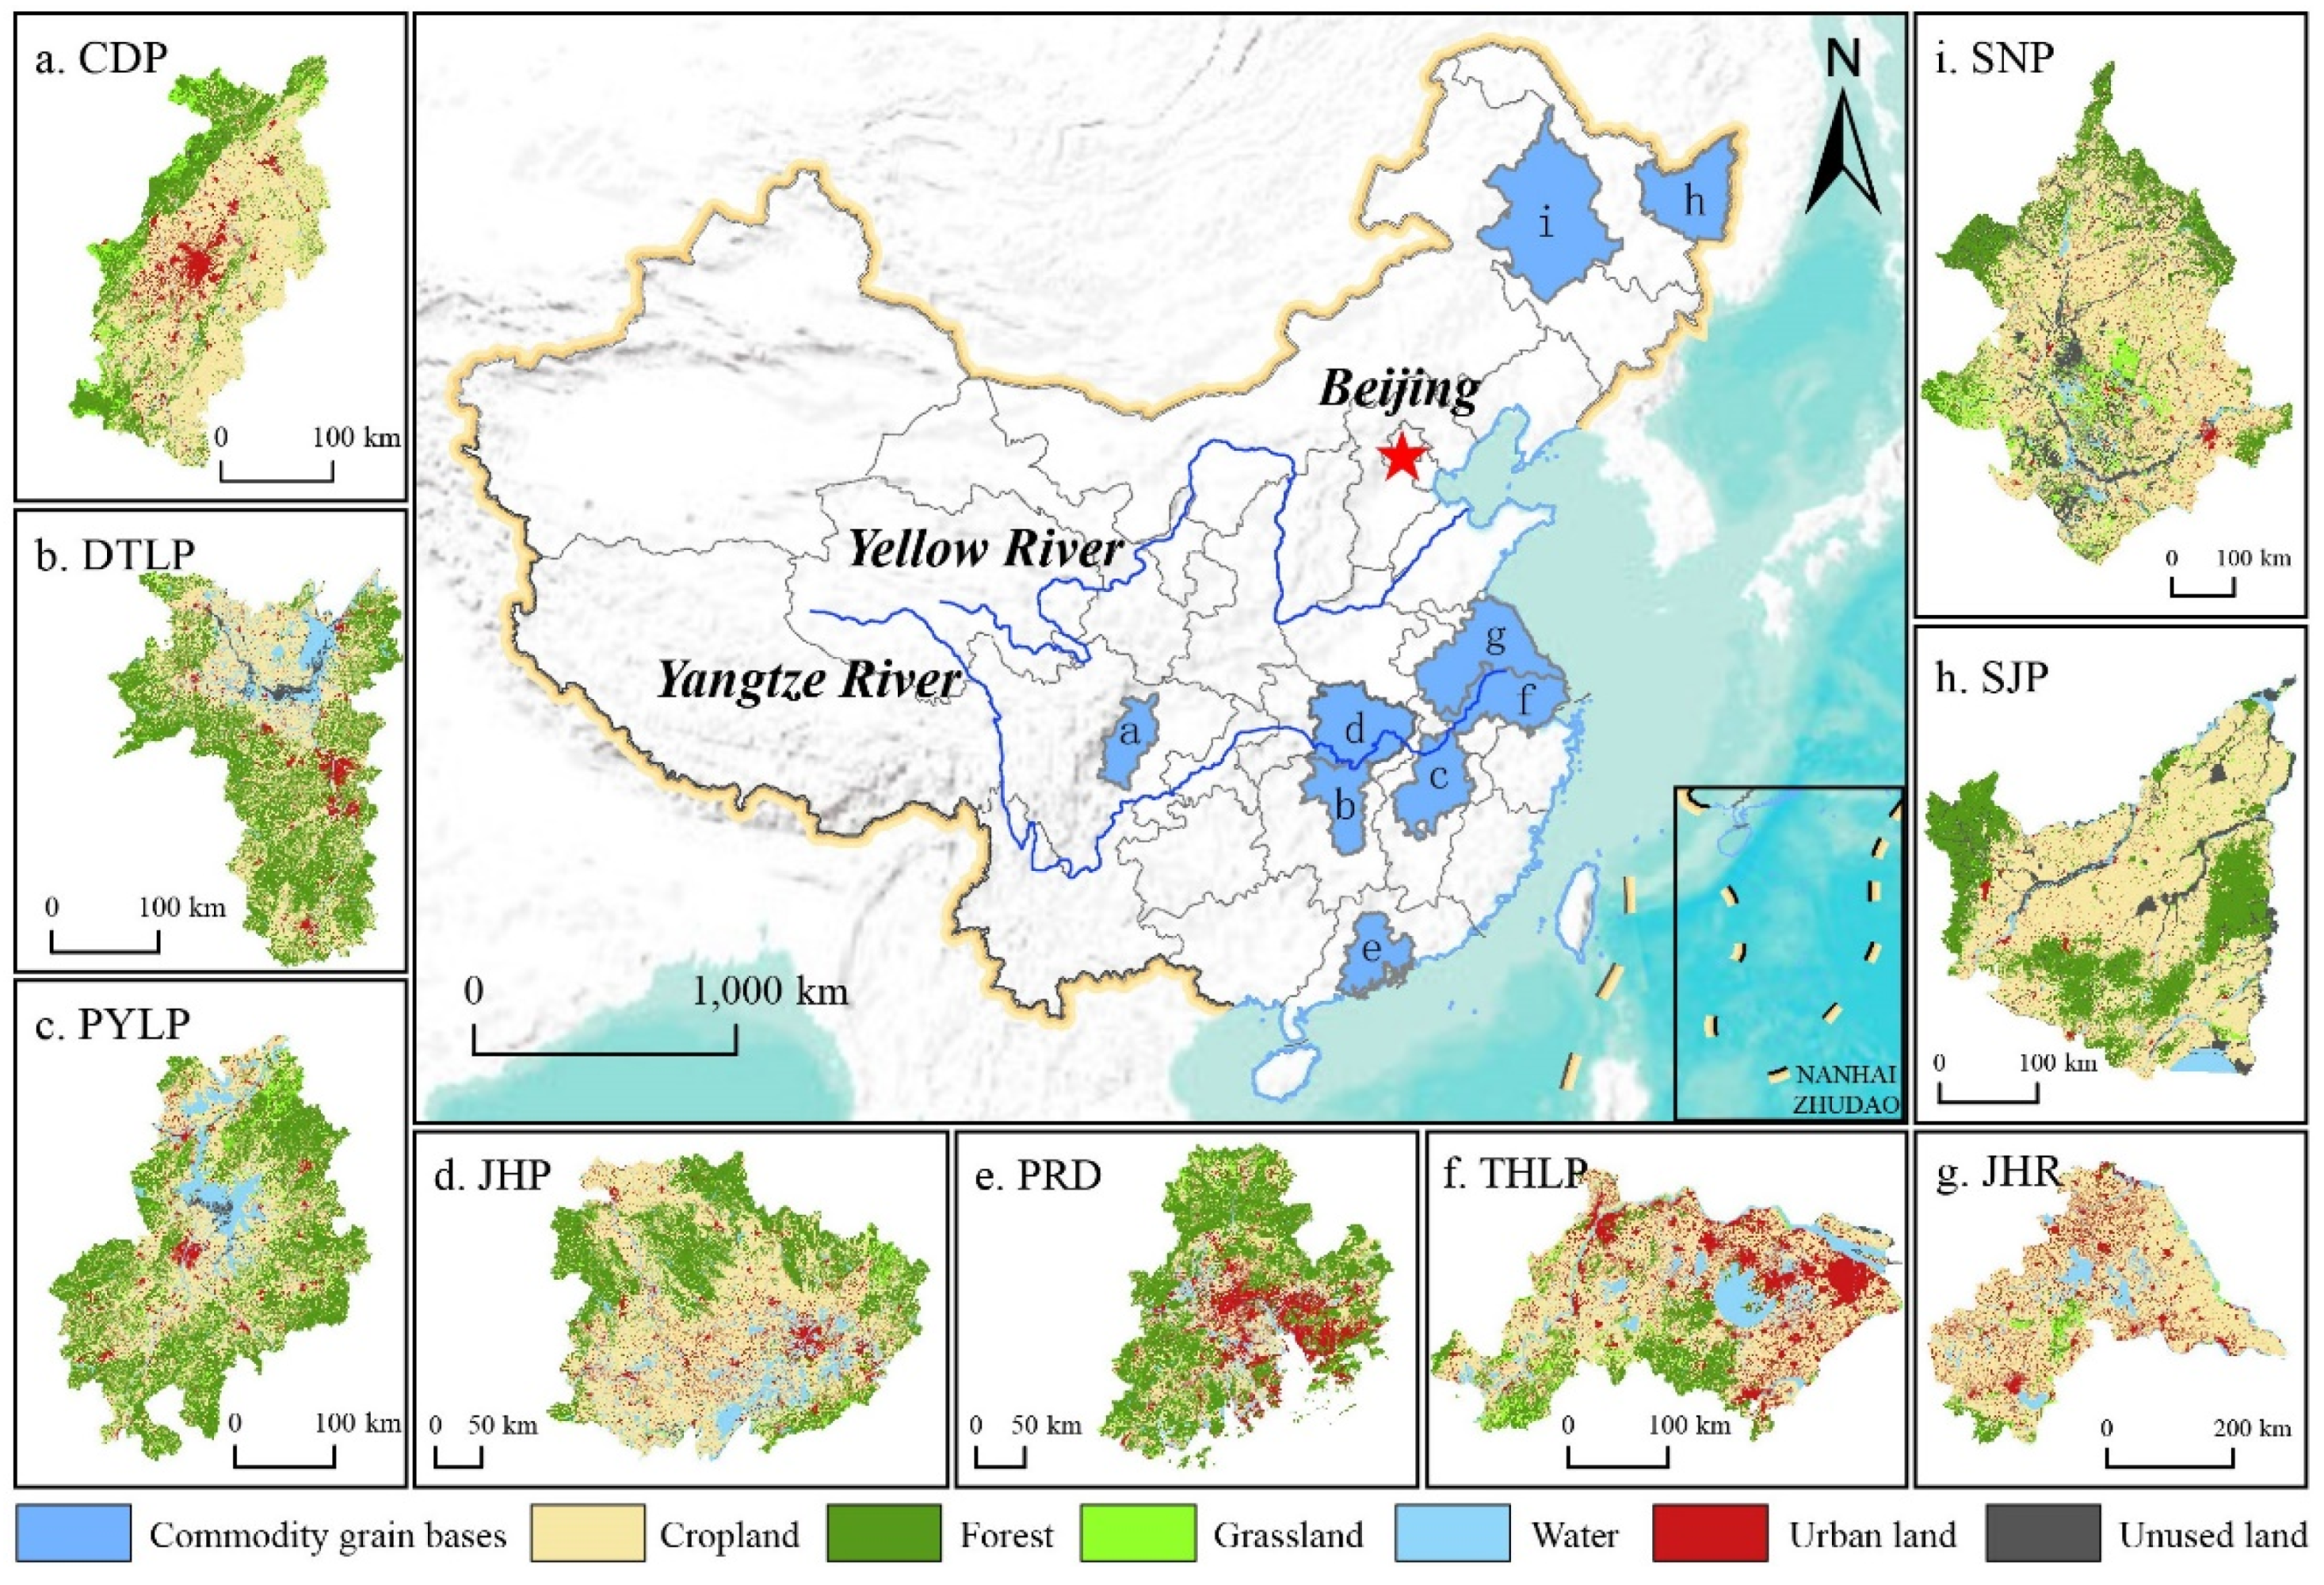
This paper selects MGPAs in China as the study area, divided into three grain-based categories (Figure 1). The first category is composed of the original high-yielding areas in the south, including the Taihu Lake Plain, Jianghan Plain, Poyang Lake Plain, Dongting Lake Plain, Chengdu Plain, and Pearl River Delta, all of which are located in the subtropical zone characterized by superior natural conditions, an extended growing season, and rich farming history. These areas provide grain accounting for more than 60% of all grain production areas in China. The second category is the newly developed area in the Jianghuai Region, located in the southern part of the Huang–Huai–Hai Plain. The area is covered by flat and fertile soil in the transitional area between the warm temperate zone and the subtropics. Although its yield per unit is not high, the produced grain accounts for 20% of the total grain across China. The third category is the northeastern areas, including the Songnen Plain and Sanjiang Plain. These two high-latitude and mechanized grain production areas have a low grain yield per unit area but produce a large total amount, which can provide 20% of commodity grain to China every year. These MGPAs are the core regions of China’s grain production, and the degree of protection of their cropland resources depends on whether China can ensure food security and effectively guarantee people’s well-being, which is of great importance to social stability and economic development.
2.2. Data
The land-use data used in this paper are derived from China’s National Land Use and Cover Change dataset [34], which spans 1995–2018 with a spatial resolution of 100 m. The primary classification for the data includes six categories: cropland, forest, grassland, wetland, urban land, and unused land, noting that the secondary classification has 25 types. Since there is no clear vector data that defines the boundaries of MGPAs, this paper refers to the distribution map of MGPAs consistent with the entries from Baidu’s Encyclopedia. Vectors are then added to obtain the final boundaries of MGPAs.
2.3. Methods
2.3.1. Standard Deviation Ellipse
The standard deviation ellipse method can accurately reveal the spatial distribution pattern and evolutionary characteristics of the study object [35]. Its main parameters include the elliptical center of gravity, azimuthal angle, and elliptical long-short axis. The elliptical center of gravity can characterize the center of gravity of geographic elements and their migration trajectory. The azimuthal angle characterizes the main trend direction of their distribution on two-dimensional space. The elliptical long-short axis responds to the form of geographic element distribution. The calculation formulas of the three parameters are as follows:
where and are the horizontal and vertical coordinates of the standard deviation for the elliptical center of gravity, respectively; (xi, yi) is the spatial location of the geographical element i; wi is its corresponding weight; α is the orientation angle, δx and δy are the standard deviations along the x and y axes, respectively; x′ and y′ denotes the difference between the coordinates of the center of gravity and those of geographical element.
2.3.2. Land Use Transfer Matrix
The land use transfer matrix can reflect the structural characteristics of land use and the transformational degree and direction among the types, thereby revealing the spatial and temporal evolution process of the land-use pattern. Its mathematical expression is:
where Sij is the area of class i transformed into class j; n is the number of the land-use types; i and j represent the land-use types before and after the transfer, respectively.
2.3.3. Land Use Dynamic Degree
Land use dynamic degree refers to the quantitative change among certain land-use types over a given time interval. This metric is designed to assess the degree of land-use change attributed to the regional land-use transfer component. A positive (negative) value indicates a net increase (decrease) of such land area. The absolute value of land use dynamic degree indicates the degree of change for the particular land-use type change. It follows that the larger the absolute value, the more drastic the change of a particular land-use type.
Here, K is the dynamic degree of a certain land-use type during the study period; Ua is the quantity of a certain land-use type at the beginning of the study period, Ub is that which is observed at the end of the study period; T is the length of the study period, and when the period of T is set to year, K is the annual rate of change of a certain land-use type in the study area.
2.3.4. Landscape Metrics
Landscape metrics are commonly used to portray the regional landscape pattern, and the analytical scales are divided into patch level, type level, and landscape level. In this paper, the metrics of patch density (PD), edge density (ED), aggregation index (AI), and Area-weighted Mean Euclidean Nearest-Neighbor Distance (ENN_AM) are evaluated to characterize the connectivity, heterogeneity, and fragmentation of the study area (Table 1).
3. Results
3.1. Evolution of Cropland and Urban Land
3.1.1. Temporal Evolution of Cropland and Urban Land
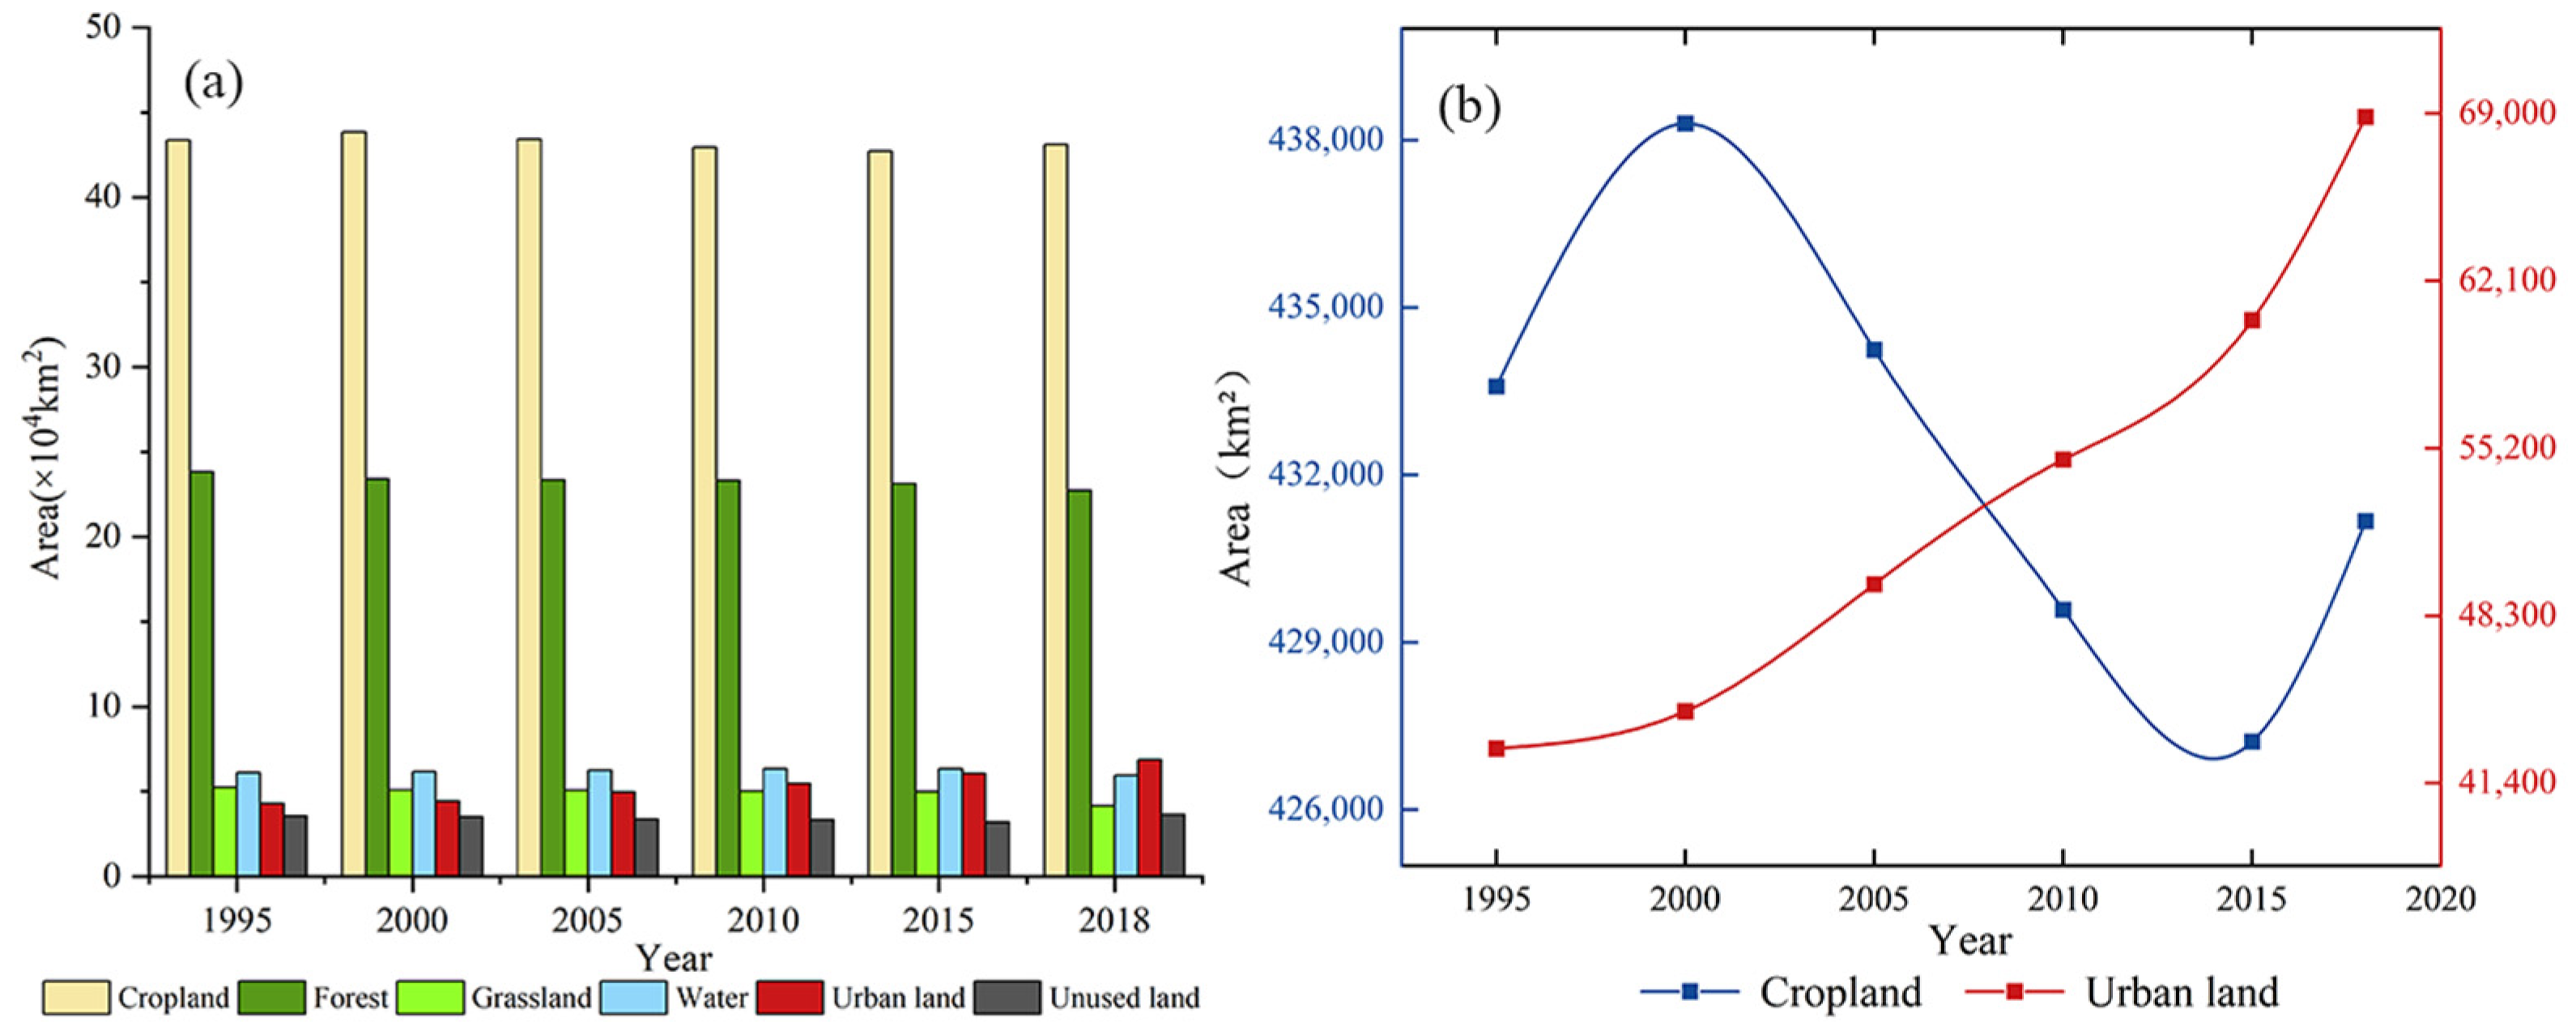
MGPAs are the core areas of grain production in China. Their overall land-use types from 1995 to 2018 are dominated by cropland and forest, with an average area share of 50.03% and 26.96%, respectively. In comparison, the urban land occupies an average area share of 6.19% (Figure 2a). Cropland shows a recent fluctuating trend of “short-term increase—long-term decrease—short-term increase” where the area first increased by 4712.33 km2 from 1995 to 2000, then decreased by 6365.70 km2 during 2000–2015, before it finally increased again by 3954.56 km2 in the nearly four years spanning, 2015–2018 (Figure 2b). In terms of the rate of change, we observed the smallest absolute dynamic degree occurred from 2010 to 2015, indicating that cropland changed most gently during this period, while the largest change occurred from 2015 to 2018, which implies a dramatic degree of change in cropland during this period (Table 2). Urban land, on the other hand, is dominated by rapid expansion, growing from 42,831.27 km2 in 1995 to 68,858.29 km2 in 2018, with its area share increasing from 4.96% to 7.96%, representing a 161% increase. The average annual growth of urban land from 1995 to 2000 was 306.53 km2, while the average annual growth from 2015 to 2018 was 2790.49 km2, 9.1 times more rapid than in 1995–2000. The land use dynamic degree for urban land increased steeply during 2000–2015 and 2015–2018, indicating accelerated growth in urban land (Table 2).
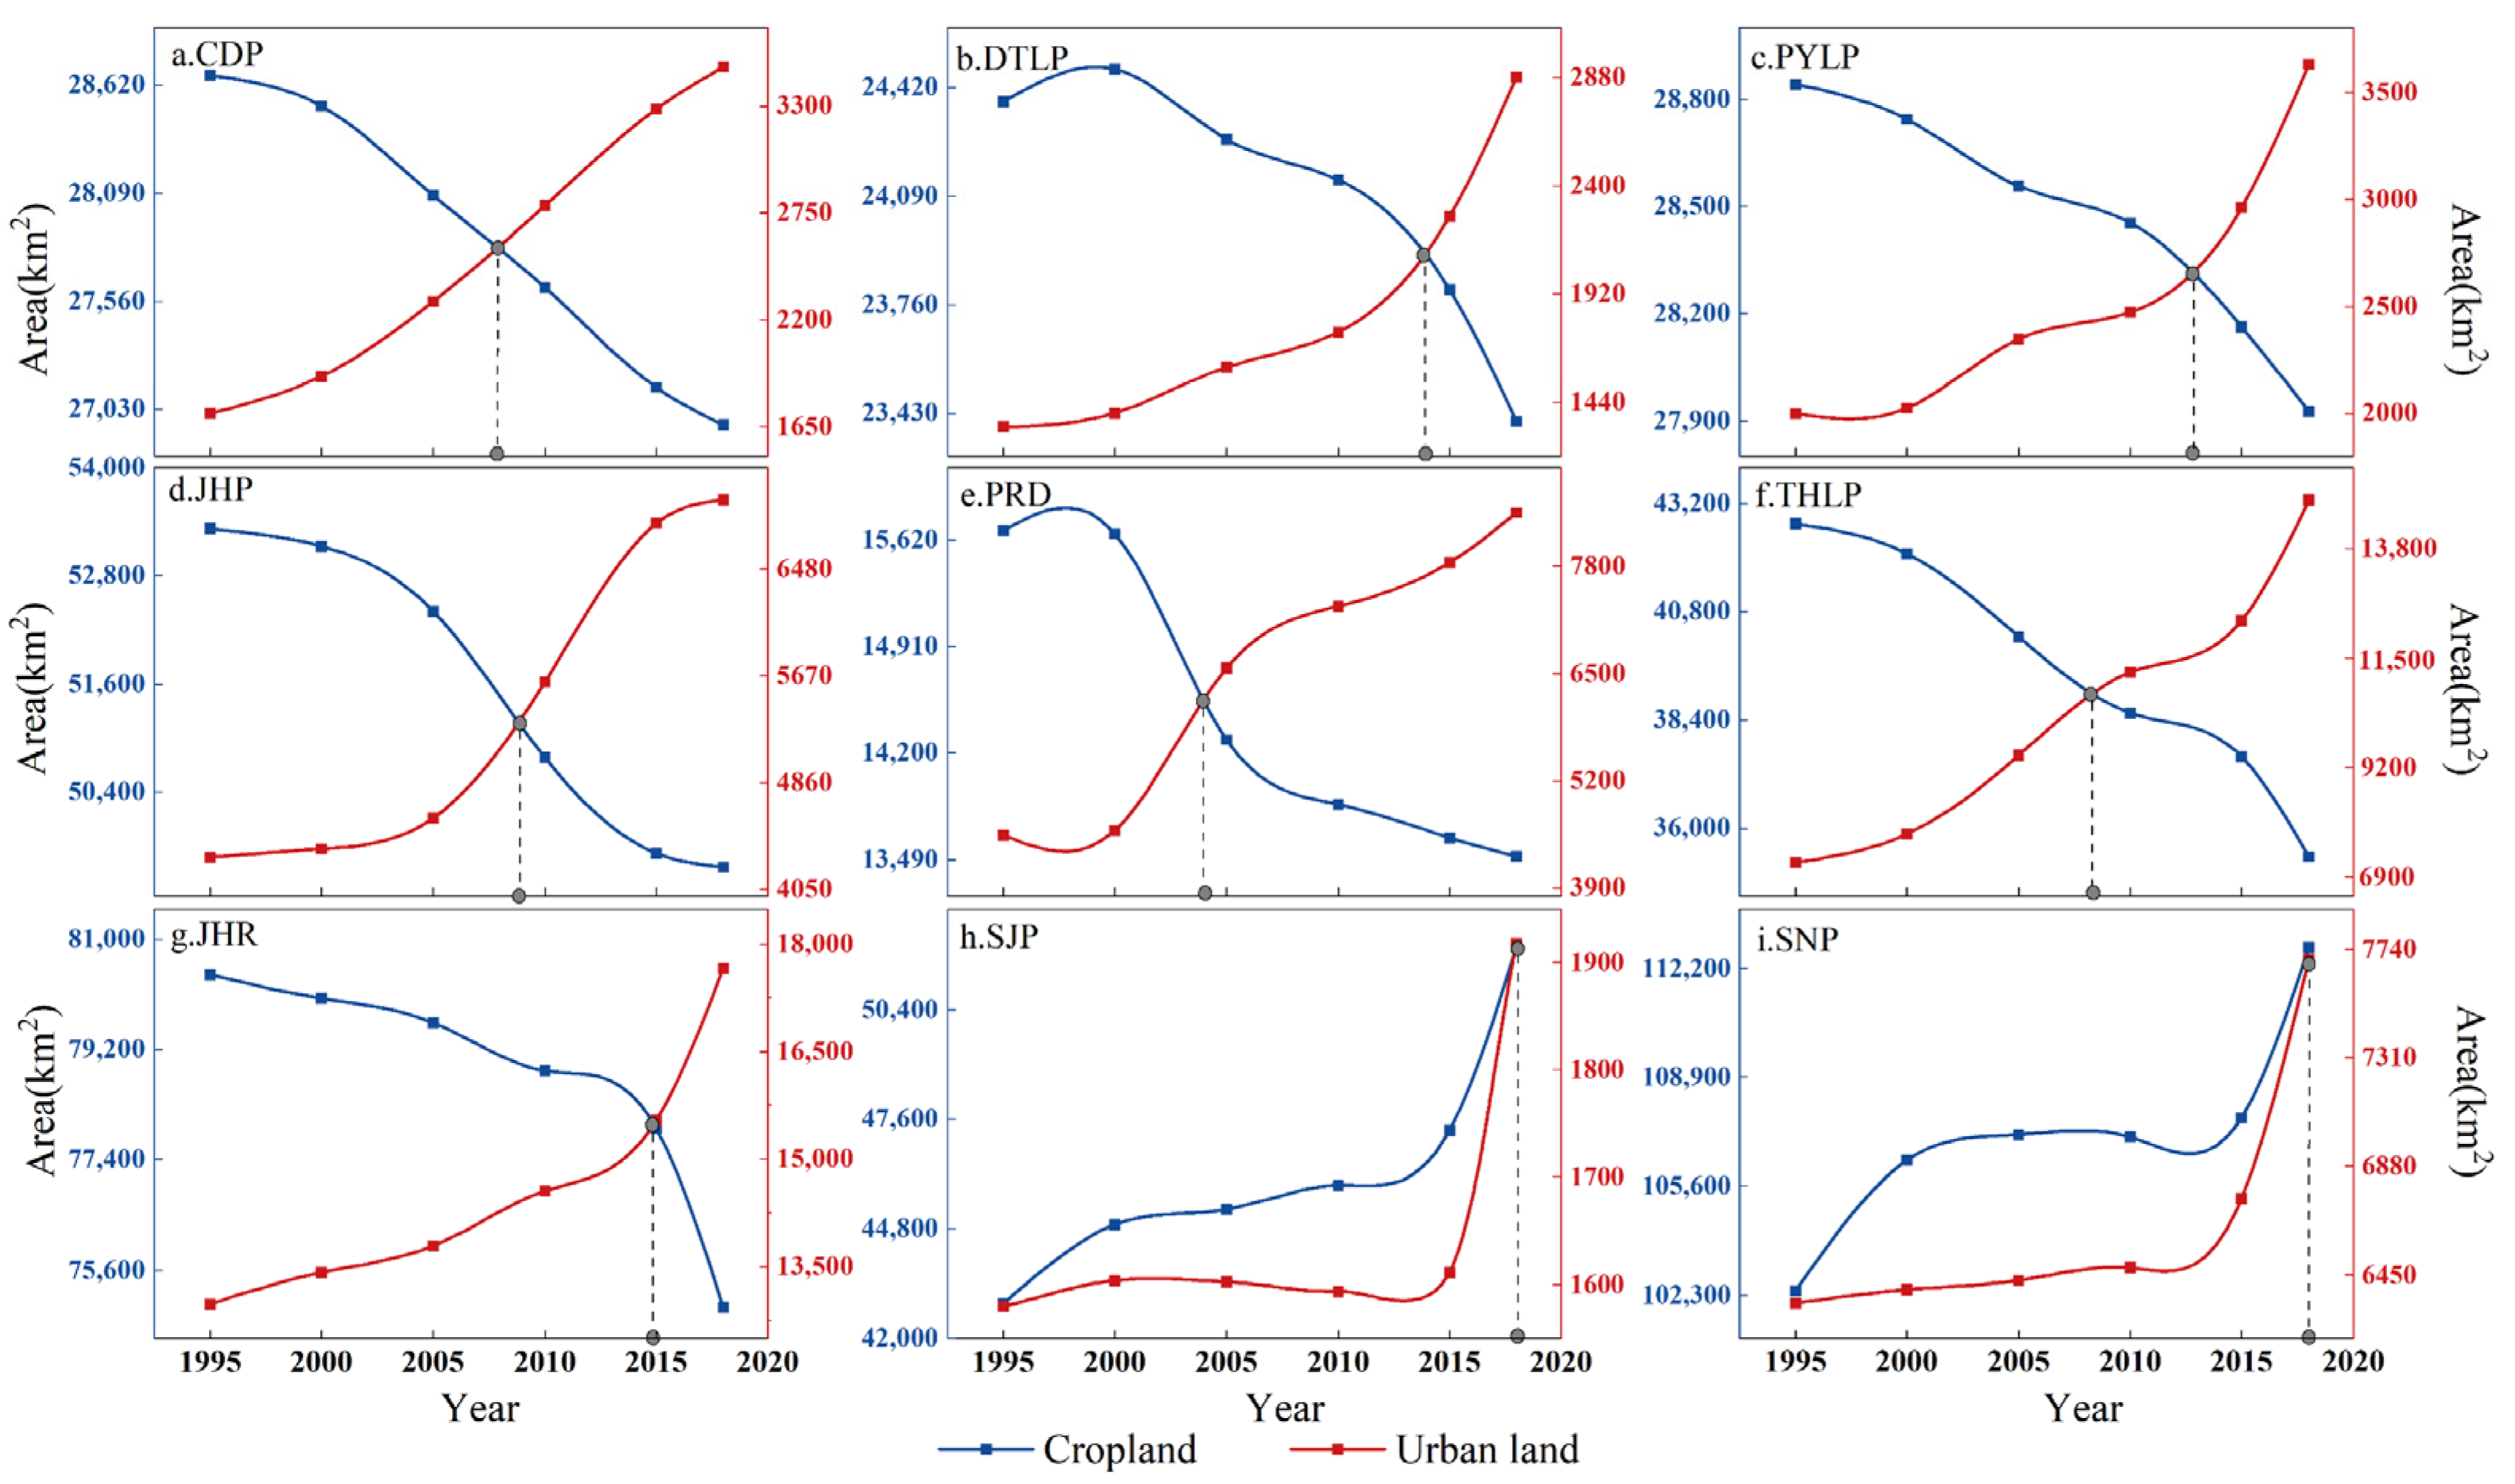
Changes in cropland and urban land significantly varied across MGPAs. Most areas show a continuous decline in cropland and an increasing trend in urban land, while the Sanjiang Plain and Songnen Plain show a simultaneous growth trend for both cropland and urban land (Figure 3). Specifically, the cropland in the Songnen Plain increased from 102,447.89 km2 to 112,826.43 km2, and its urban land increased from 6339.37 km2 to 7697.81 km2, representing growth rates of 10.13% and 21.42%, respectively; cropland in the Sanjiang Plain increased from 42,887.78 km2 to 52,026.87 km2, and urban land increased from 1579.68 km2 to 1917.14 km2, representing growth rates of 21.31% and 21.36%, respectively. In terms of the land use dynamic degree at the individual level, the largest absolute land use dynamic degree of cropland occurred in the Sanjiang Plain, indicating that cropland in this area has experienced the most dramatic changes relative to the other eight grain production areas during 1995–2018, while the smallest changes occurred in the Poyang Lake Plain, indicating that it has changed the least in MGPAs (Table 2). The largest absolute value of land use dynamic degree for urban land occurred in Dongting Lake Plain, indicating the most dramatic urban land changes. In contrast, the smallest change occurred in the Songnen Plain and Sanjiang Plain, implying relatively minimal urban land changes during 1995–2018. The early appearance of the intersection of urban land and cropland areas in the Pearl River Delta, Taihu Plain, Chengdu Plain, and Jianghan Plain is consistent with the rapid urbanization in these areas.
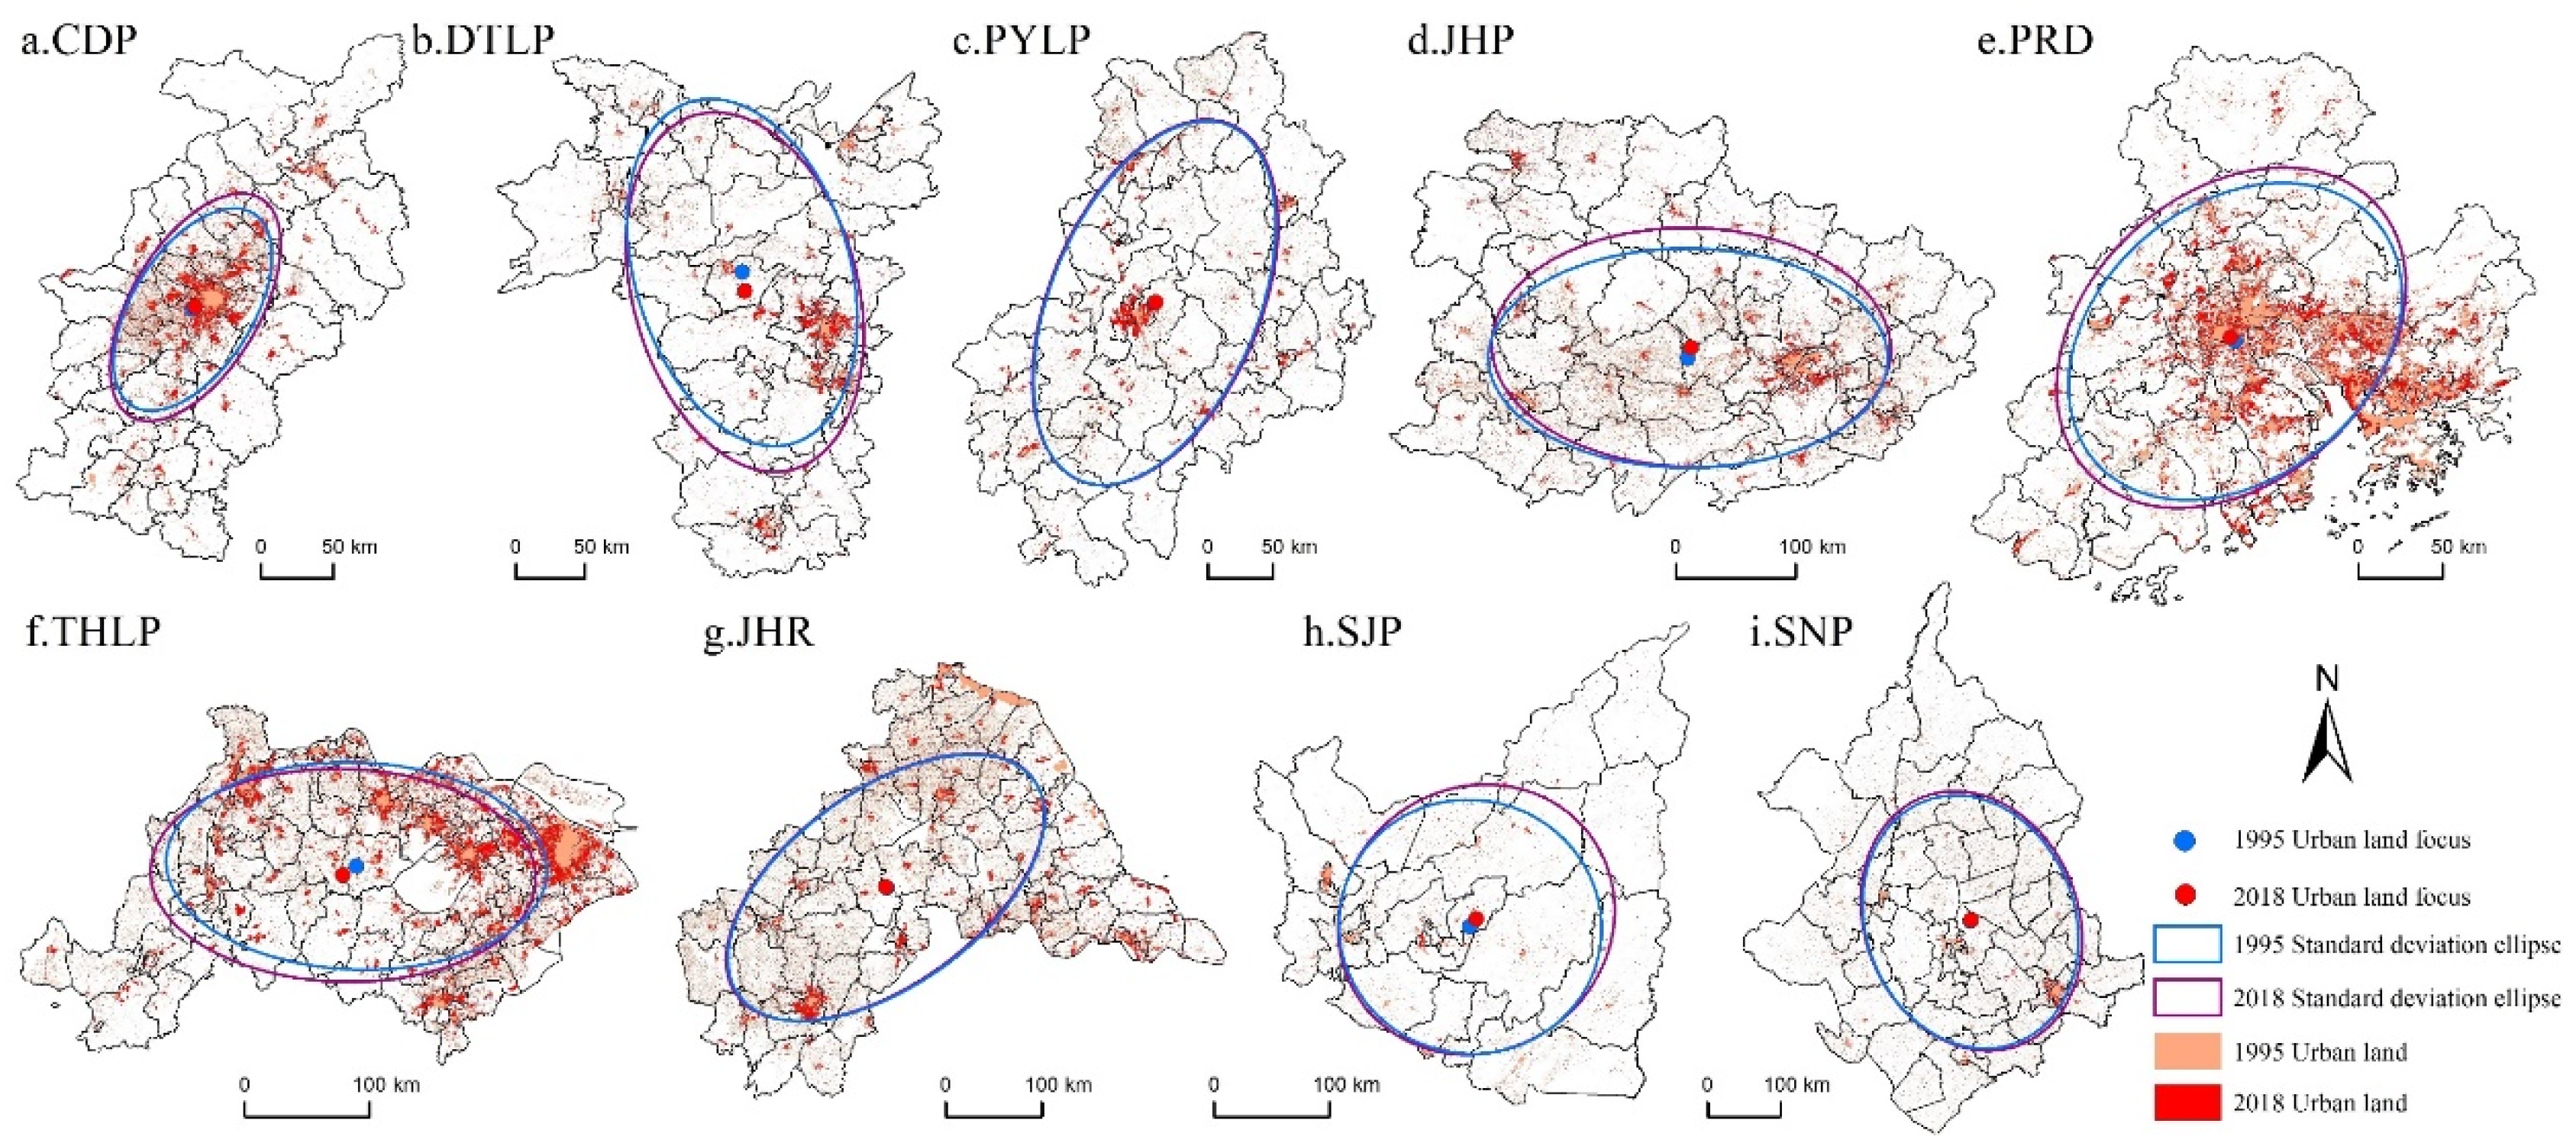
3.1.2. Spatial Evolution of Cropland and Urban Land
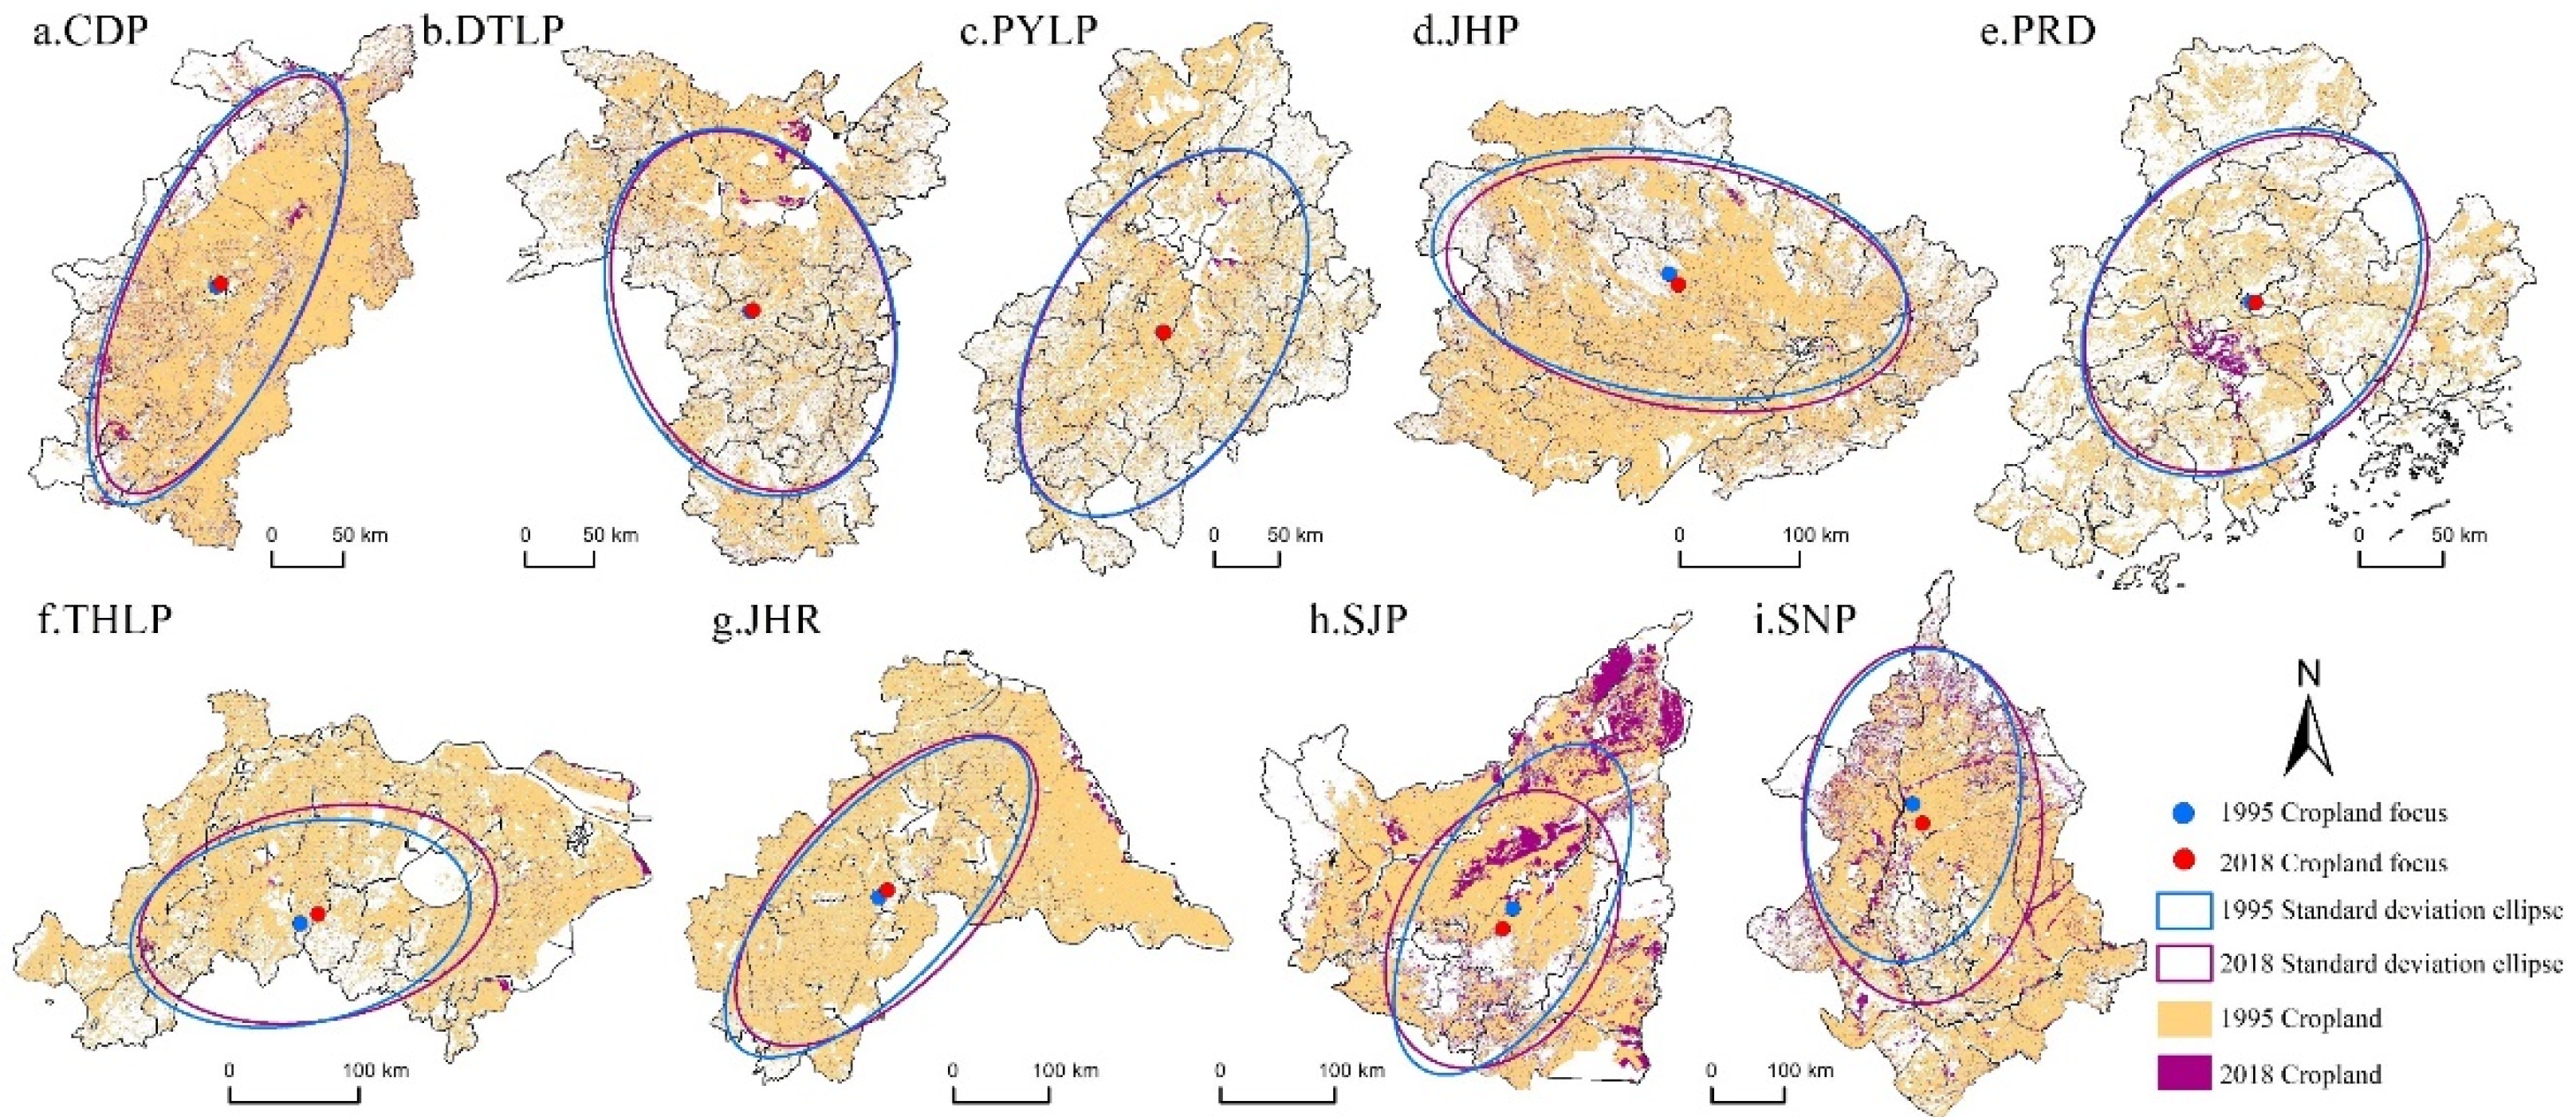
The standard deviation ellipses of cropland and urban land in MGPAs are presented in Figure 4 and Figure 5, from which we can infer the concentration and directional trends between the two land-use types. These parameters are reflected by the direction of movement of the point indicating the center of gravity and the change in the ellipse area for the concentration. From 1995 to 2018, the spatial evolution characteristics of both cropland and urban land varied across the grain production areas (Table 3). Specifically, the ellipse of cropland in the Taihu Lake Plain, Jianghuai Region, and Songnen Plain shows an expansion trend, while the remaining areas show a contraction trend (Figure 4). The cropland expansion in the Songnen Plain is the most dramatic, with the ellipse area increasing by 27,614 km2 (5.2 times that of the Jianghuai Region and 2.5 times that of the Taihu Lake Plain), whose center of gravity coordinates moved mainly in a southeasterly direction. The ellipse of cropland in the Chengdu Plain shows the most significant contraction trend, with its standard deviation ellipse decreasing from 27,167 km2 to 25,677 km2, with a spatial growth rate of −5.48%, along with its center of gravity shifting slightly in the northeastern direction.
All standard deviation ellipses for urban land show an expanding spatial trend, with their centers of gravity shifting in various directions (Figure 5; Table 3). The standard deviation ellipse of the Chengdu Plain changed the most during the study period, increasing from 8913 km2 in 1995 to 10,653 km2 in 2018, with an average annual increase of 76 km2 and a spatial expansion rate of 19.52%. Its center of gravity coordinates shifted in a northeasterly direction. In contrast, the area of the standard deviation ellipse in the Jianghuai Region changed the least, with a spatial growth rate of only 0.14%, and its area grew slowly from 60,525 km2 to 60,611 km2, with its center of gravity moving slightly in a southwesterly direction.
3.2. Occupation of Cropland by Urban Land
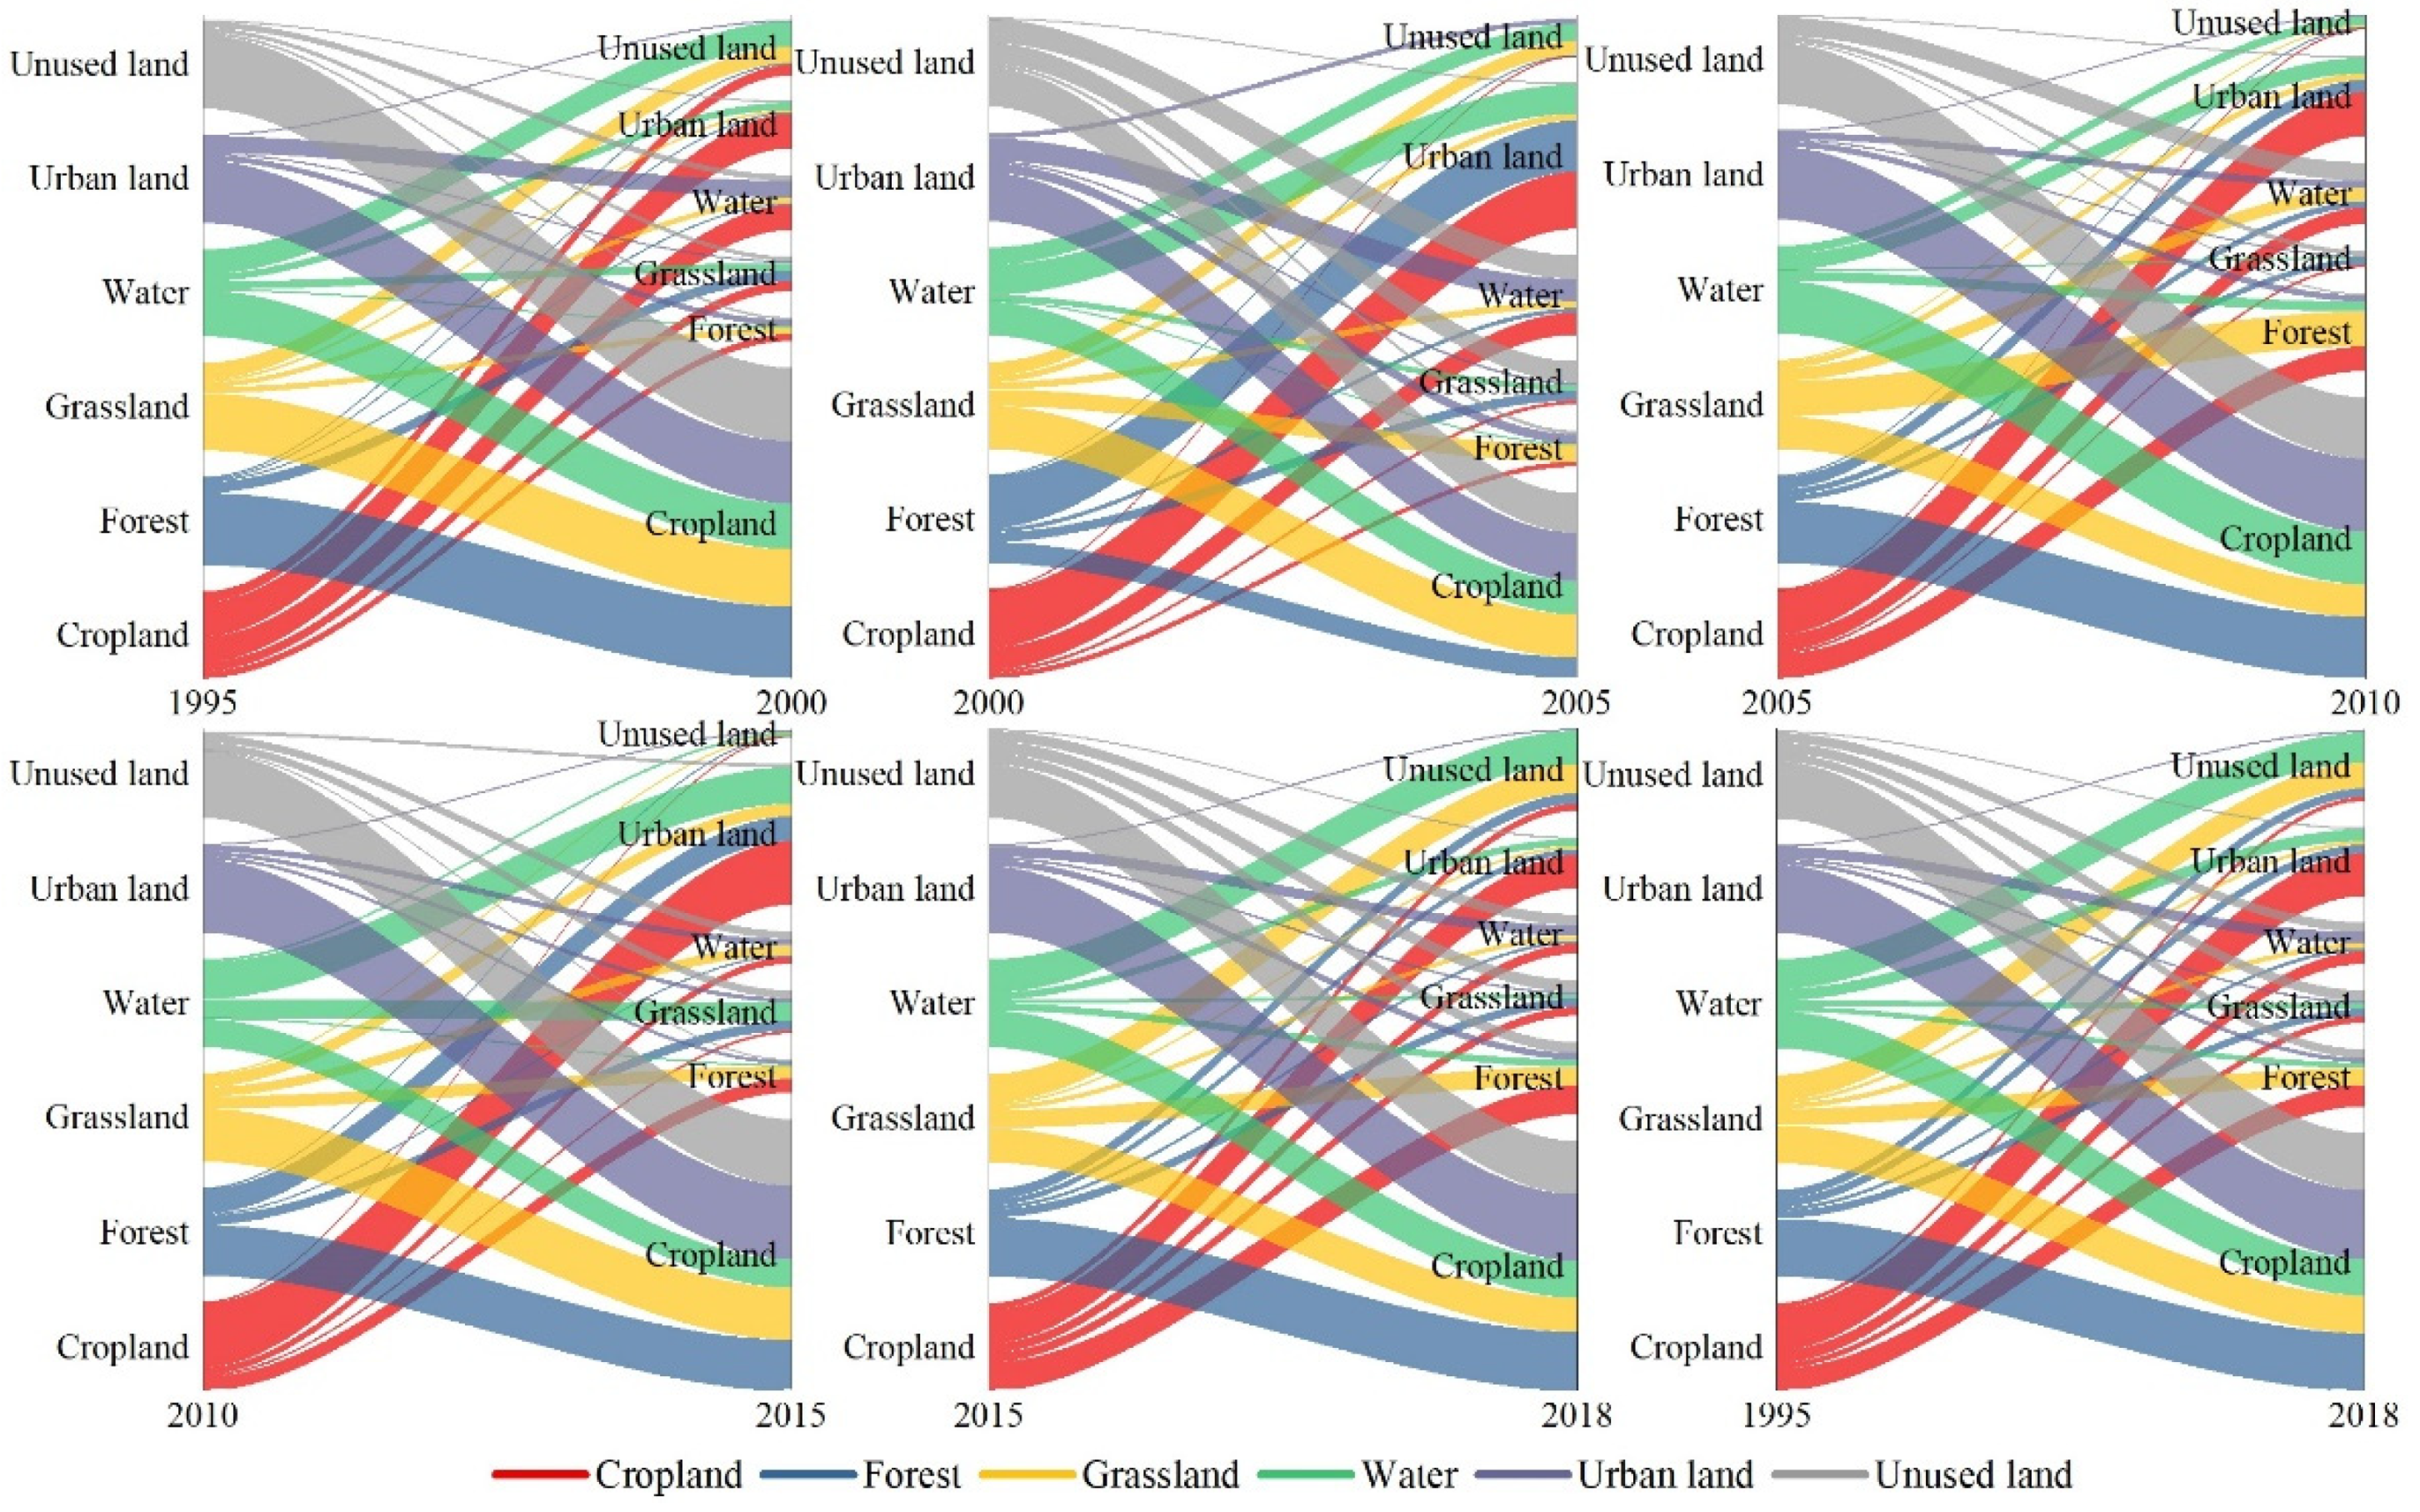
3.2.1. Occupation of Cropland by Urban Land at the Entire Level
To explore the occupation of cropland by urban land, the land use transfer matrix was used to analyze the specific flows between cropland and urban land. The period of 1995–2018 saw dramatic changes in the partitioning between cropland and urban land in MGPAs, with the total outward change in cropland during this study period of 57,503.87 km2, which was mainly transformed into urban land (Figure 6). The associated transfer area was 28,328.35 km2, accounting for 49.26% of the total change in cropland. The total change in urban land was 9152.66 km2, with urban land mainly transformed into cropland, with a transferred area of 7153.99 km2, accounting for 78.16% of the total change in urban land. In terms of the individual periods, cropland shifted mainly to urban land in all periods from 1995 to 2018. The conversion of cropland to urban land accounted for the largest proportion (72.70%) of the total outward change in cropland in 2010–2015, and the smallest proportion occurred in 1995–2000 (also significant at 39.35%), indicating that in all time periods urban land has substantially encroached upon cropland.
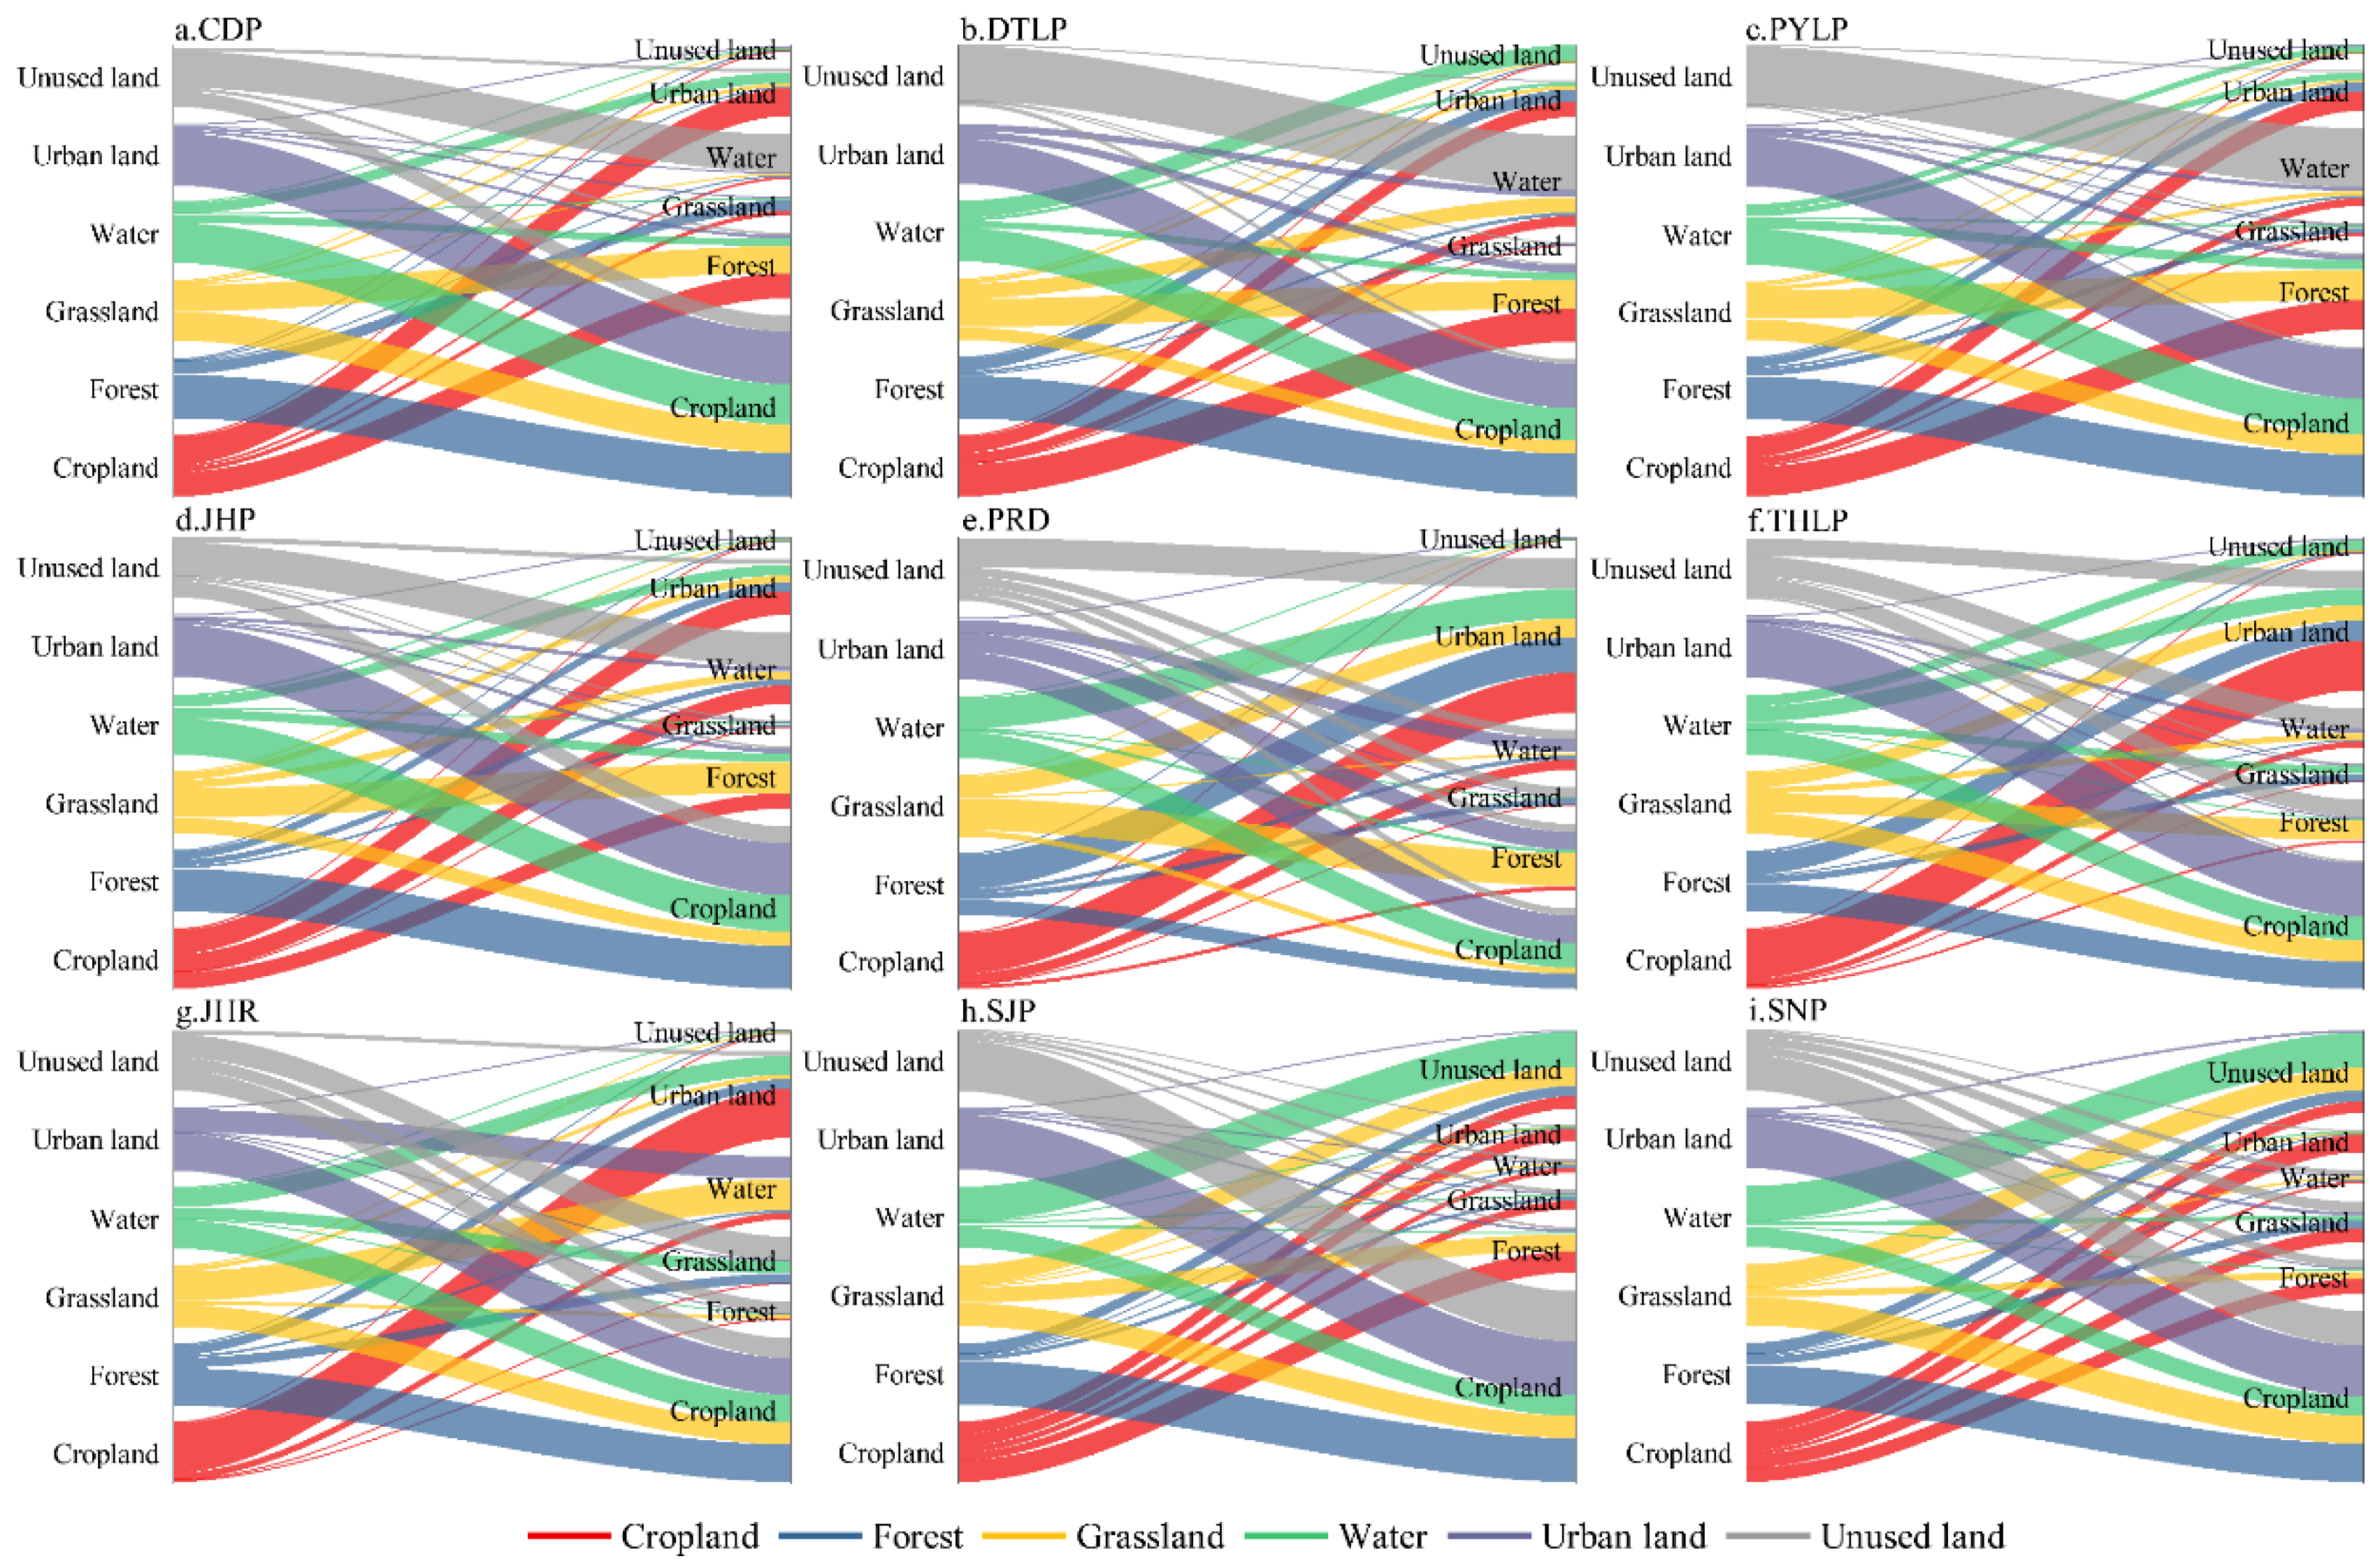
3.2.2. Occupation of Cropland by Urban Land at the Individual Level
Great changes have also taken place between cropland and urban land in individual grain production areas (Figure 7). Among these areas, only the land-use conversion of Sanjiang Plain was dominated by forest to other types from 1995 to 2018, with a total outward change of 6979.32 km2, while the rest of the land-use conversion in MGPAs was dominated by cropland. Especially notable was the cropland conversion into urban land in the Jianghuai Region and Taihu Lake Plain, which accounted for a total outward change of cropland of 81.82% and 83.13%, respectively. This indicates that the cropland in these two regions was subjected to the largest encroachment of urban land in 1995–2018. Significant outward changes of cropland also occurred in the Pearl River Delta, Chengdu Plain, and Jianghan Plain, accounting for 67.29%, 46.88%, and 39.88%, respectively. The same trend was also observed, but to a lesser extent, in the Sanjiang Plain, Dongting Lake Plain, and Songnen Plain, whose transfer ratios were 20.85%, 25.59%, and 28.62%, respectively. Even the Sanjiang Plain, which has the smallest proportion of cropland encroached upon by urban land, reaches nearly a quarter of the total change in cropland. In general, encroachment of cropland by urban land contributes significantly to the loss of urban land within each of MGPAs.
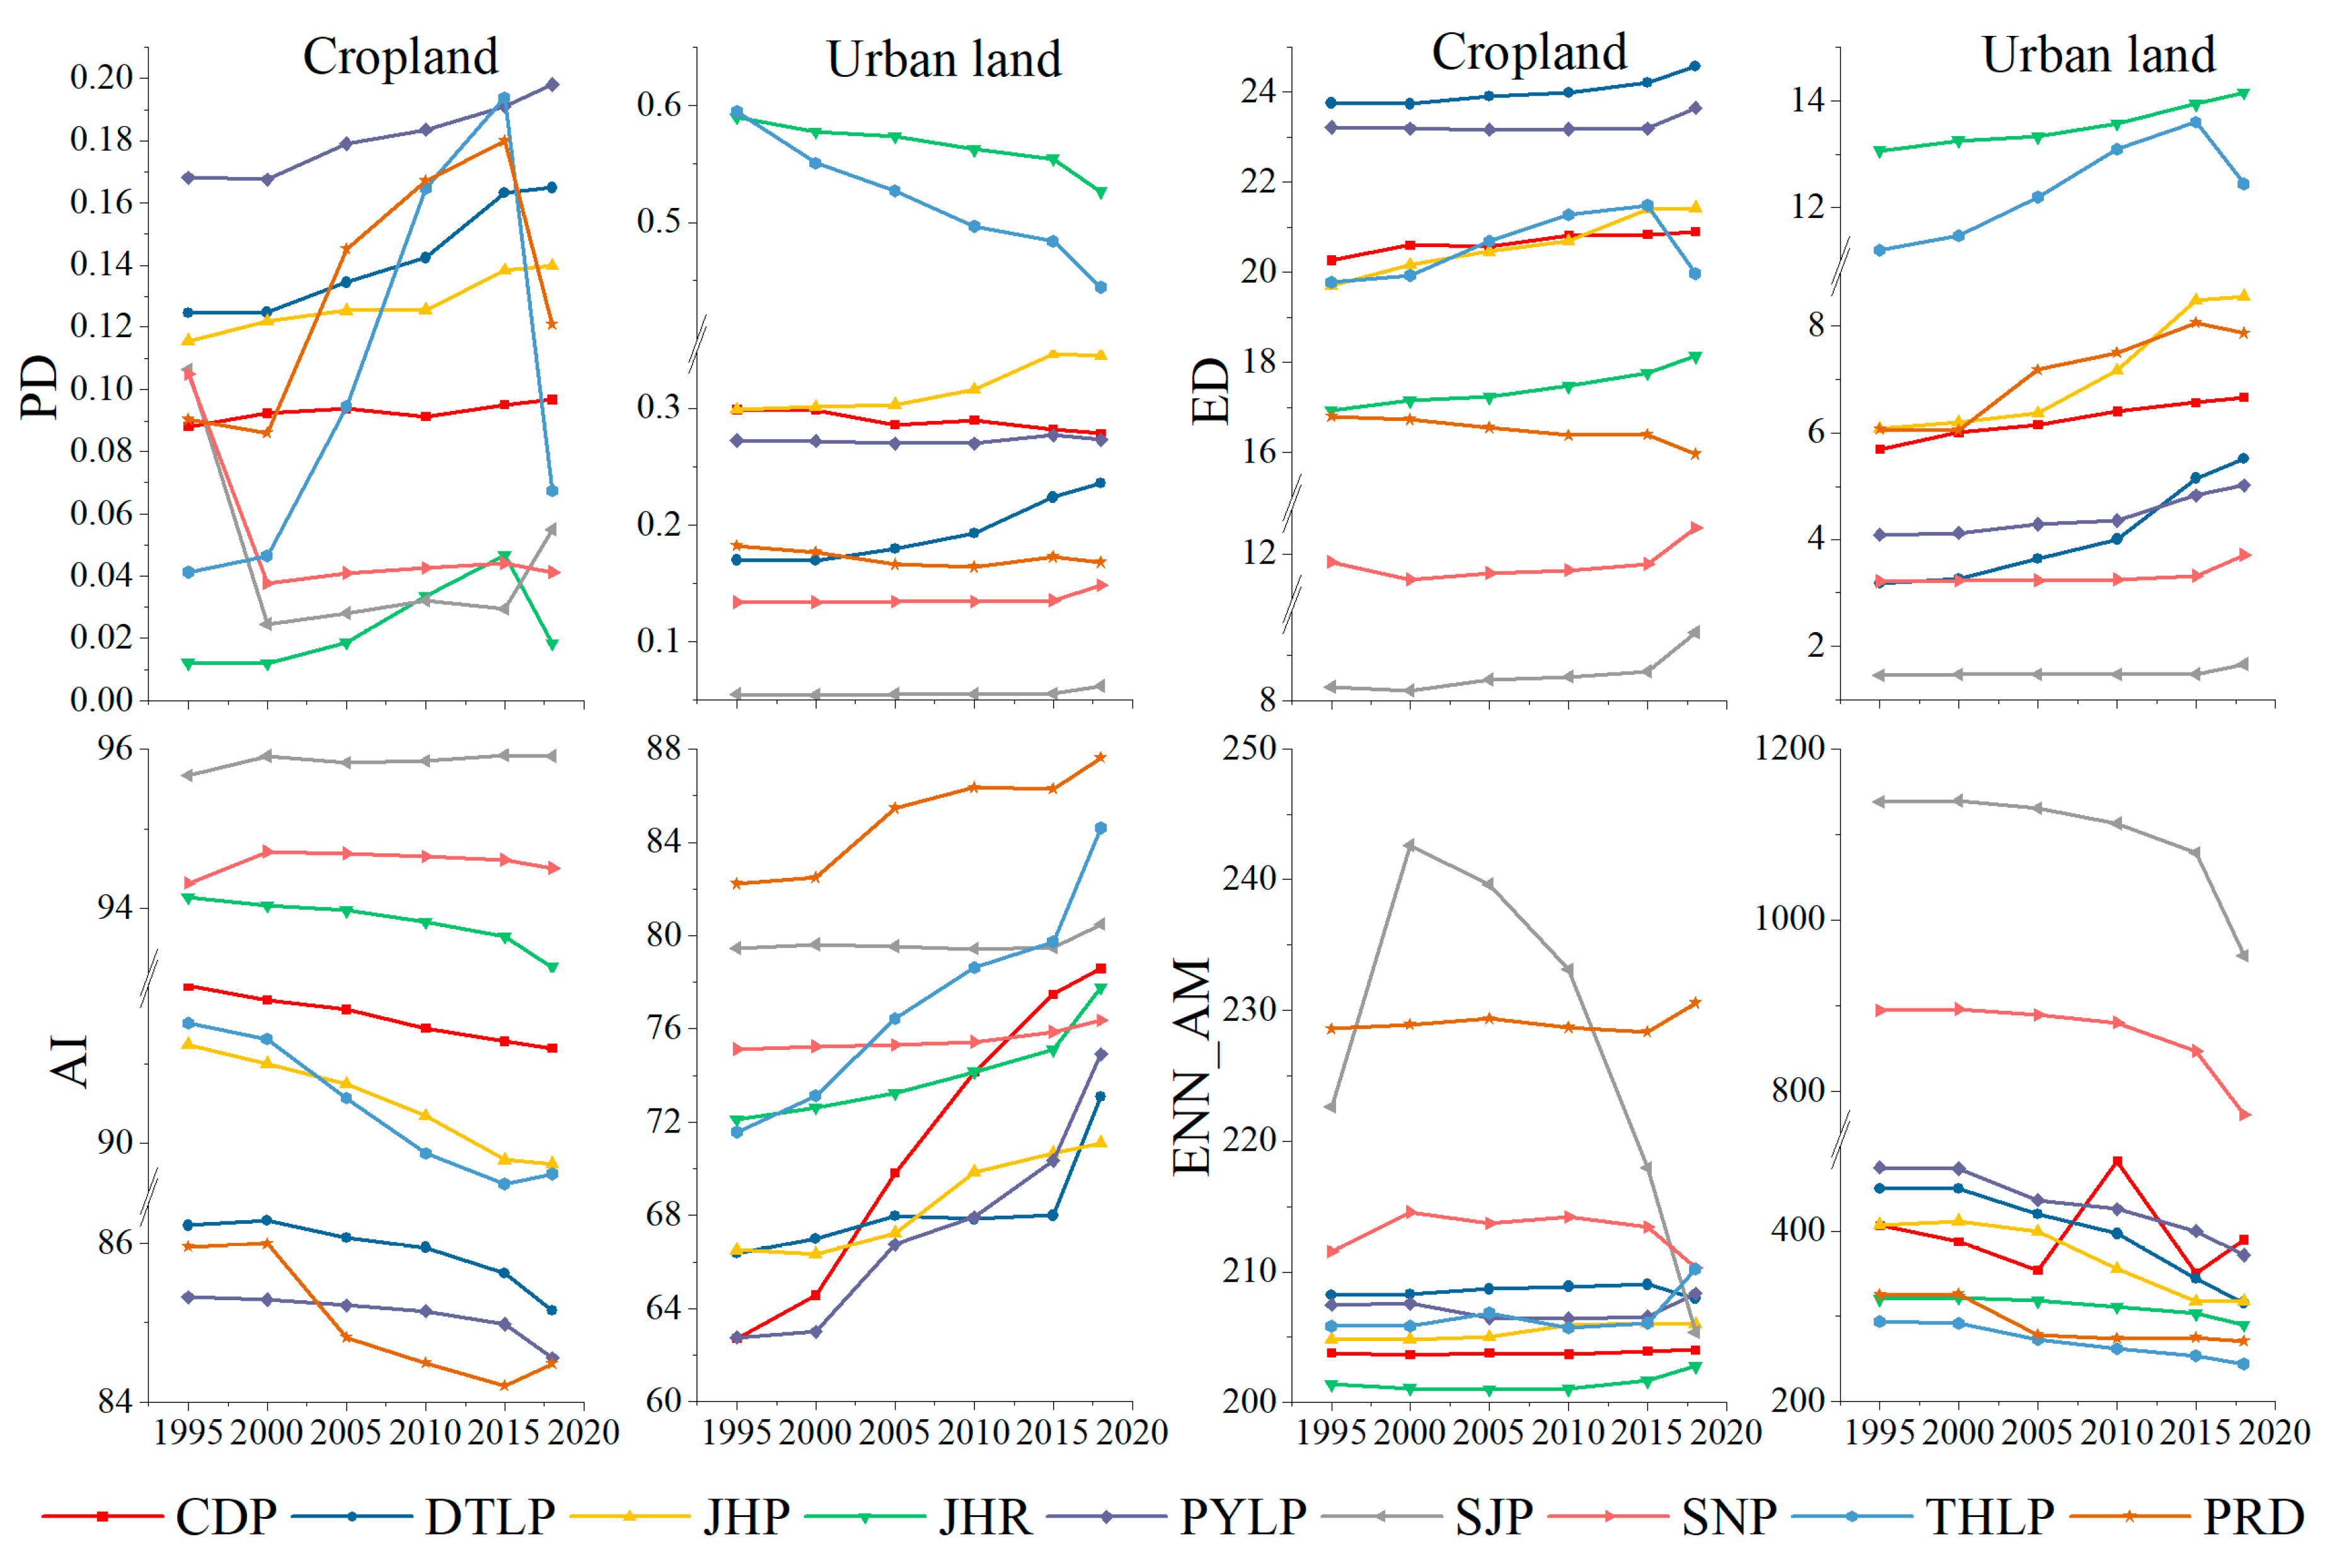
3.3. Impacts of Urban Land on Cropland Fragmentation
Analysis of the landscape metrics of cropland and urban land in different grain production areas reveals that only the patch density (PD) of cropland in the Sanjiang Plain and Songnen Plain showed a decreasing trend. In contrast, the rest showed an increasing trend, indicating that patches in most grain production areas are fragmented (Figure 8). The level of agglomeration is generally low, while the agglomeration of cropland in the Sanjiang Plain and the Songnen Plain is increasing. In terms of edge density (ED), only the ED of cropland in the Pearl River Delta shows a decreasing trend, while the remainder of the grain production areas shows an increasing trend. The ED of urban land as a whole shows an increasing trend, indicating that the shape of urban land in MGPAs is becoming more irregular as the complexity of the shape of cropland in the Pearl River Delta decreases. The CLUMPY metric of cropland in the Sanjiang Plain, Songnen Plain, Pearl River Delta Plain, Poyang Lake Plain, and Dongting Lake Plain show a decreasing trend, while the others show an increasing trend. In terms of the AI metrics, the cropland in the Sanjiang Plain and the Songnen Plain show an increasing trend, while the others are decreasing. This indicates that the degree of aggregation of cropland patches in these two regions has increased slightly. In contrast, fragmentation of cropland patches in the remaining seven grain production areas represents the dominant trend. The cropland in the Taihu Lake Plain and the Pearl River Delta is declining at the fastest rate. The AI metrics of urban land, as a whole, show an obvious increasing trend, indicating a significant increase in the degree of aggregation of urban land. In terms of ENN_AM, the cropland in the Sanjiang Plain rose sharply from 1995 to 2000, before exhibiting a continuous decline, indicating that the fragmentation of cropland in the Sanjiang Plain was significant before 2000 and that aggregation increased rapidly after 2000. In contrast, the Pearl River Delta has maintained high values, indicating that cropland in this region has been in a consistent, high state of aggregation. The ENN_AM values for urban land have shown a decreasing trend over time, with the largest values in the Sanjiang and Songnen Plains, indicating the highest fragmentation of urban land in these two areas.
4. Discussion
This paper explores the occupation of cropland and its fragmentation effects by urban expansion in MGPAs in terms of its spatiotemporal evolution characteristics, interconversion relationships with urban lands, and landscape patterns. The results show that the degree of interconversion between cropland and urban land, from 1995 to 2018, is dramatic in the study area at entire and individual levels, indicating that cropland is encroached upon by urban land at large extents. Specifically, rapid urban expansion has led to a significant decline in cropland area within some grain production areas, including the Pearl River Delta, the Taihu Lake Plain, the Jianghuai region, with the conversion of cropland to urban land accounting for 67.29%, 83.13%, and 81.82% of the total outward transfer area of cropland, respectively. The occupation has also led to varying degrees of fragmentation of cropland, most dramatically in the Pearl River Delta. These results answer our research question that some of MGPAs in China, especially in regions where high urbanization has occurred (the Pearl River Delta, the Taihu Lake Plain, the Jianghuai region) have lost their original function as MGPAs and can hardly provide a stable food supply and thus food security anymore.
The Pearl River Delta, the Taihu Lake Plain, and the Jianghuai region were formerly important grain production areas nationwide, but now their status is gradually declining or even disappearing. The main reasons for this can be divided into two points. First, rapid urbanization has led to the continuous expansion of urban land and the massive occupation of cropland, resulting in a sharp decrease in the area of cropland. Although significant attention has been given by the central government of China on cropland protection and a series of policies and regulations such as “cropland protection”, “rural land consolidation and economical and intensive land use”, “requisition–compensation balance of cropland”, and “land acquisition” have been formulated [36,37,38,39], these policies usually yielded to local government’s pursuit of economic growth. Even these policies have been implemented effectively in some areas, the amount of cropland also hardly increase, given the gaps in the land price and revenue between cropland and urban land. Specially, the increase of cropland mostly occurred in rural areas via occupying natural lands and consolidating existing rural settlements from a spatial points, which have become a compension of cropland occupation by urban expansion in suburb areas to maintain the total amount of cropland. In addition, unreasonable planning and artificial abandonment by some local governments have also caused a large amount of cropland to be left idle and wasted. Second, agricultural industry restructuring, referring to the adjustment of the ratio of land between the agricultural industry, forestry, animal husbandry and fishery, etc, leads to the reduction of food sown area. The formation and changes are subject to a variety of factors, mainly: (1) natural conditions; (2) historical production habits and living habits of the residents; (3) the state of productivity; and (4) social demand for agricultural products. The internal adjustment of agricultural structures in the Pearl River Delta, Taihu Lake Plain and Jianghuai region, and the conversion of some cropland to flowers and vegetables, has led to a continuous reduction of food sown area. In order to curb the continuous expansion of urban land, and ensure food security in China, it is important to promote an intensive transformation of land-use patterns. The macro-control of land policies should resolutely suppress unreasonable demand for urban land and achieve the requirements for sustainable development goals, thus alleviating the dichotomy between urban expansion and cropland protection [40].
Except for the Sanjiang Plain and Songnen Plain in the north, most grain production areas show an obvious decreasing trend in the amount of cropland in addition to enhanced fragmentation, since the cropland replacement policy has led to new patches of cropland in some marginal areas, increasing their overall fragmentation of cropland. It is worth noting that the Sanjiang Plain and the Songnen Plain in the northeast do not show a significant fragmentation trend, but rather a slight agglomeration (in terms of aggregation index), which is due to the strict implementation of the policy of cropland reallocation. This policy has increased the amount of cropland, but at the expense of the ecosystem service value of other encroached natural ecological lands, and the yield of newly reclaimed cropland may not reach the original level. Although the overall food security is maintained, it is unsustainable from the environmental dimension and its ecological impact cannot be ignored.
There are still limitations in this paper, which are worthy of further study. First, this paper considers the impacts of urban expansion on cropland only in terms of quantity and fragmentation, which is not comprehensive enough. Second, due to the lack of clear vector boundaries of the MGPAs, this paper manually vectorizes the images in Baidu’s Encyclopedia and obtains the study area boundaries composed by clustering counties, this operation will make the boundary range deviate from the actual range, but it does not affect the subsequent result analysis. Future investigations can use multi-source geospatial data, such as nighttime lights, topography, population, etc., to consider the impacts of urban expansion on cropland in a comprehensive manner in terms of socio-economic, natural conditions and policy implications. In addition, we can simulate the land use changes of the MGPAs in the future through multiple scenarios to explore the impacts of urban expansion on cropland to different degrees under different scenarios, to find the optimal scenario that can balance economic development and cropland protection, and to provide effective reference for rational regional planning.
5. Conclusions
In the context of rapid urbanization, the diversification between cropland and urban land is intensifying, and food security is facing great challenges. In light of this, sustaining MGPAs remains a top priority for ensuring food security in China. Based on the land-use data of six periods from 1995 to 2018, this study explored the spatial and temporal evolution of cropland and urban landscapes in MGPAs. The findings are as follows.
(1) During 1995–2018, both cropland and urban land areas of MGPAs in China changed dramatically but in very different ways. The overall cropland area in the study area increased by 1.09% between 1995 and 2000, decreased by 2.53% from 2000 to 2015, and increased by 0.93% from 2015 to 2018, showing an overall trend of “short-term increase—long-term decrease—short-term increase”, while the change in the area of urban land shows continuous growth, increasing by 60.77% over the study period. The amount of cropland in the study area declined most rapidly from 2000 to 2015, with an overall decrease of 2.53%. Among the areas, the Chengdu Plain saw a decrease in cropland of 1713.46 km2 and an increase in urban land of 1780.02 km2, making it the most dramatic area for change throughout the period.
(2) Urban expansion is the main cause of cropland loss, and the mutual transfer of cropland and urban land occupies the largest component of the outward transfer for these land-use types. The area of cropland converted to urban land accounts for 49.26% of the total change in cropland. Across the grain production areas, all areas are dominated by the transfer of cropland. The most significant changes occurred in the Taihu Lake Plain and Jianghuai Region, where the cropland area converted to urban land accounts for up to 83.13% and 81.82% of the total cropland change, the Pearl River Delta also reached 67.29%.
(3) In most grain production areas, urban expansion has led to fragmentation of cropland, among which the fragmentation of cropland in the Pearl River Delta is the most significant. The cropland in all MGPAs except the Sanjiang Plain and Songnen Plain was agglomerated, indicating that the substantial conversion of other land types to cropland due to some cropland policies has alleviated the impact of urban expansion to some extent, leading to a less pronounced or even decreasing fragmentation of cropland.
Author Contributions
Conceptualization, Z.Y. and L.Z.; methodology, Z.Y. and L.Z.; software, Z.Y. and L.Z.; validation, L.Z., D.S. and F.H.; formal analysis, Z.Y.; investigation, Z.Y.; resources, Z.Y.; data curation, Z.Y.; writing—original draft preparation, Z.Y.; writing—review and editing, D.S. and F.H.; visualization, Z.Y.; supervision, L.Z.; project administration, Z.Y.; funding acquisition, L.Z. All authors have read and agreed to the published version of the manuscript.
Funding
This research has been supported by National Natural Science Foundation of China (No. 41961027), Open Fund of Key Laboratory of Urban Land Resources Monitoring and Simulation, Ministry of Natural Resource (No. KF-2020-05-067), Foundation of Key Talent Projects of Gansu Province (No. 2021RCXM073), and Foundation of A Hundred Youth Talents Training Program of Lanzhou Jiaotong University (No. 2019).
Institutional Review Board Statement
Not applicable.
Informed Consent Statement
Not applicable.
Data Availability Statement
All relevant data sets in this study are described in the manuscript.
Acknowledgments
The authors thank the anonymous reviewers for the helpful comments that improved this manuscript.
Conflicts of Interest
The authors declare no conflict of interest.
References
- Sun, L.; Chen, J.; Li, Q.; Huang, D. Dramatic uneven urbanization of large cities throughout the world in recent decades. Nat. Commun. 2020, 11, 5366–5374. [Google Scholar] [CrossRef]
- United Nations. World Urbanization Prospects: The 2018 Revision; United Nations Department of Economic and Social Affairs: New York, NY, USA, 2019; pp. 26–27. [Google Scholar]
- Xu, G.; Huang, X.; Zhong, T. Assessment on the effect of city arable land protection under the implementation of China’s National General Land Use Plan (2006–2020). Habitat. Int. 2015, 49, 466–473. [Google Scholar] [CrossRef]
- Liu, F.; Zhang, Z.; Shi, L.; Zhao, X.; Xu, J.; Yi, L.; Liu, B.; Wen, Q.; Hu, S.; Wang, X.; et al. Urban expansion in China and its spatial-temporal differences over the past four decades. J. Geogr. Sci. 2016, 26, 1477–1496. [Google Scholar] [CrossRef]
- Brend’Amour, C.; Reitsma, F.; Biaocchi, G.; Barthel, S.; Güneralp, B.; Erb, K.-H.; Haberl, H.; Creutzig, F.; Seto, K.C. Future urban land expansion and implications for global croplands. Proc. Natl. Acad. Sci. USA 2016, 114, 8939–8944. [Google Scholar] [CrossRef] [Green Version]
- Song, S.; Liu, Z.; He, C.; Lu, W. Evaluating the effects of urban expansion on natural habitat quality by coupling localized shared socioeconomic pathways and the land use scenario dynamics-urban model. Ecol. Indic. 2020, 112, 106071. [Google Scholar] [CrossRef]
- Li, X.; Suoerdahan, G.; Shi, Z.; Xing, Z.; Ren, Y.; Yang, R. Spatial-temporal impacts of urban sprawl on ecosystem services: Implications for urban planning in the process of rapid urbanization. Land 2021, 10, 1210. [Google Scholar] [CrossRef]
- Du, J.; Xiao, X.; Zhao, B.; Zhou, H. Impact of urban expansion on land surface temperature in Fuzhou, China using Landsat imagery. Sustain. Cities Soc. 2020, 61, 102346. [Google Scholar] [CrossRef]
- Seto, K.C.; Güneralp, B.; Hutyra, L.R. Global forecasts of urban expansion to 2030 and direct impacts on biodiversity and carbon pools. Proc. Natl. Acad. Sci. USA 2020, 109, 16083–16088. [Google Scholar] [CrossRef] [PubMed] [Green Version]
- Haase, D.; Nuissl, H. Does urban sprawl drive changes in the water balance and policy? The case of Leipzig (Germany) 1870–2003. Landsc. Urban Plan 2007, 80, 1–13. [Google Scholar] [CrossRef]
- Zhang, P.; Yang, D.; Li, E.; Li, Y. The coupled coordination relationship between land urbanization and population urbanization—A case study of the central plains economic region. Econ. Geogr. 2017, 37, 145–154. (In Chinese) [Google Scholar] [CrossRef]
- Niu, F.; Yang, X.; Wang, F. Urban agglomeration formation and its spatiotemporal expansion process in China: From the perspective of industrial evolution. Chin. Geogra. Sci. 2020, 30, 532–543. [Google Scholar] [CrossRef] [Green Version]
- Ouyang, X.; Zhu, X. Spatio-temporal characteristics of urban land expansion in Chinese urban agglomerations. Acta Geogr. Sin. 2020, 75, 571–588. (In Chinese) [Google Scholar] [CrossRef]
- Deng, X.; Huang, J.; Rozelle, S.; Zhang, J.; Li, Z. Impact of urbanization on cultivated land changes in China. Land Use Policy 2015, 45, 1–7. [Google Scholar] [CrossRef]
- Abass, K.; Adanu, S.K.; Agyemang, S. Peri-urbanisation and loss of arable land in Kumasi Metropolis in three decades: Evidence from remote sensing image analysis. Land Use Policy 2018, 72, 470–479. [Google Scholar] [CrossRef]
- Zhou, L.; Dang, X.; Mu, H.; Wang, B.; Wang, S. Cities are going uphill: Slope gradient analysis of urban expansion and its driving factors in China. Sci. Total Environ. 2021, 775, 145836. [Google Scholar] [CrossRef]
- Tan, M.; Li, X.; Xie, H.; Lu, C. Urban land expansion and arable land loss in China—a case study of Beijing-Tianjin-Hebei region. Land Use Policy 2005, 22, 187–196. [Google Scholar] [CrossRef]
- Liu, Y.; Fang, F.; Li, Y. Key issues of land use in China and implications for policy making. Land Use Policy 2014, 40, 6–12. [Google Scholar] [CrossRef]
- Gao, X.; Cheng, W.; Wang, N.; Liu, Q.; Ma, T.; Chen, Y.; Zhou, C. Spatio-temporal distribution and transformation of cropland in geomorphologic regions of China during 1990–2015. J. Geogr. Sci. 2014, 29, 180–196. [Google Scholar] [CrossRef] [Green Version]
- Zhao, X.; Zhang, Z.; Wang, X.; Zuo, L.; Liu, B.; Yi, L.; Xu, J.; Wen, Q. Analysis of Chinese cultivated land’s spatial-temporal changes and causes in recent 30 years. Trans. Chin. Soc. Agric. 2014, 30, 1–11. (In Chinese) [Google Scholar]
- Li, H.; Song, W. Cropland abandonment and influencing factors in Chongqing, China. Land 2021, 10, 1206. [Google Scholar] [CrossRef]
- Sun, Y.; Zhao, S. Spatiotemporal dynamics of urban expansion in 13 cities across the Jing–Jin–Ji urban agglomeration from 1978 to 2015. Ecol. Indic. 2018, 87, 302–313. [Google Scholar] [CrossRef]
- Li, H.; Wu, Y.; Huang, X.; Sloan, M.; Skitmore, M. Spatial-temporal evolution and classification of marginalization of cultivated land in the process of urbanization. Habitat. Int. 2017, 61, 1–8. [Google Scholar] [CrossRef] [Green Version]
- Qu, F.; Wu, L. Hypothesis and validation on the Kuznets Curves of economic growth and farmland conversion. Resour. Sci. 2004, 26, 61–67. (In Chinese) [Google Scholar]
- Song, W.; Deng, X. Effects of urbanization-Induced cultivated land loss on ecosystem services in the North China Plain. Energies 2015, 8, 5678–5693. [Google Scholar] [CrossRef]
- Cai, J.; Zhou, B. On urbanization and cropland conservation. J. Soc. Sci. 2005, 6, 5–12. (In Chinese) [Google Scholar]
- Liu, X.; Wang, J.; Liu, J.; Liu, M.; Meng, B. Quantitative analysis approaches to the driving forces of cultivated land changes on a national scale. Trans. Chin. Soc. Agric. 2005, 21, 56–60. (In Chinese) [Google Scholar]
- Chen, Z.; Lu, C.; Fan, L. Farmland changes and the driving forces in Yucheng, North China Plain. J. Geogr. Sci. 2012, 22, 563–573. [Google Scholar] [CrossRef] [Green Version]
- Ju, H.; Zhang, Z.; Zhao, X.; Wang, W.; Wu, W.; Yi, L.; Wen, Q.; Liu, F.; Xu, J.; Hu, S.; et al. The changing patterns of cropland conversion to built-up land in China from 1987 to 2010. J. Geogr. Sci. 2018, 28, 1595–1610. [Google Scholar] [CrossRef] [Green Version]
- Liang, X.; Li, Y. Spatio-temporal features of farmland scaling and the mechanisms that underline these changes within the Three Gorges Reservoir Area. J. Geogr. Sci. 2018, 73, 1630–1646. [Google Scholar] [CrossRef]
- Xiao, R.; Liu, Y.; Huang, X.; Shi, R.; Yu, W.; Zhang, T. Exploring the driving forces of farmland loss under rapid urbanization using binary logistic regression and spatial regression: A case study of Shanghai and Hangzhou Bay. Ecol. Indic. 2018, 95, 455–467. [Google Scholar] [CrossRef]
- Zhang, Y.; Li, C.; Wang, T.; Cai, C.; Bao, Y. County-level patterns of cropland and their relationships with socio-economic factors in Northwestern China. Agric. Ecosyst. Environ. 2015, 203, 11–18. [Google Scholar] [CrossRef]
- Zhang, L.; Yao, Z.; Tang, S.; Li, X.; Hao, T. The basic characteristics and spatial patterns of global cultivated land change since the 1980s. J. Geogr. Sci. 2017, 72, 1235–1247. [Google Scholar] [CrossRef] [Green Version]
- Liu, J.; Liu, M.; Deng, X.; Zhuang, D.; Zhang, Z.; Luo, D. The land use and land cover change database and its relative studies in China. J. Geogr. Sci. 2002, 12, 275–282. [Google Scholar] [CrossRef]
- Li, D.; Yu, H.; Li, X. The spatial-temporal Pattern analysis of city development in countries along the Belt and Road initiative based on nighttime light data. Geomat. Inf. Sci. Wuhan Univ. 2017, 42, 711–720. [Google Scholar] [CrossRef]
- Liu, F.; Zhang, Z.; Zhao, X.; Wang, X.; Zuo, L.; Wen, Q.; Yi, L.; Xu, J.; Hu, S.; Liu, B. Chinese cropland losses due to urban expansion in the past four decades. Sci. Total Environ. 2019, 650, 847–857. [Google Scholar] [CrossRef] [PubMed]
- Lichtenberg, E.; Ding, C. Assessing farmland protection policy in China. Land Use Policy 2008, 25, 59–68. [Google Scholar] [CrossRef]
- Zhou, L.; Zhou, C.; Che, L.; Wang, B. Spatio-temporal evolution and influencing factors of urban green development efficiency in China. J. Geogr. Sci. 2020, 30, 724–742. [Google Scholar] [CrossRef]
- Ding, C. Policy and praxis of land acquisition in China. Land Use Policy 2007, 24, 1–13. [Google Scholar] [CrossRef]
- Zhou, L.; Dang, X.; Sun, Q.; Wang, S. Multi-scenario simulation of urban land change in Shanghai by random forest and CA-Markov model. Sustain. Cities Soc. 2020, 55, 102045. [Google Scholar] [CrossRef]
Figure 1.
Study area (a–i) denote Chengdu Plain, Dongting Lake Plain, Poyang Lake Plain, Jianghan Plain, Pearl River Delta, Taihu Lake Plain, Jianghuai Region, Sanjiang Plain, Songnen Plain).
Figure 1.
Study area (a–i) denote Chengdu Plain, Dongting Lake Plain, Poyang Lake Plain, Jianghan Plain, Pearl River Delta, Taihu Lake Plain, Jianghuai Region, Sanjiang Plain, Songnen Plain).

Figure 2.
(a) Area of land-use types at the entire level; (b) Area of cropland and urban land, 1995–2018.
Figure 2.
(a) Area of land-use types at the entire level; (b) Area of cropland and urban land, 1995–2018.

Figure 3.
Land-use type change at the individual level, 1995–2018.

Figure 4.
Standard deviation ellipses of cropland, 1995–2018.

Figure 5.
Standard deviation ellipses of urban land, 1995–2018.

Figure 6.
Land-use transfer at the entire level, 1995–2018.

Figure 7.
Land-use transfer at the individual level, 1995–2018.

Figure 8.
Changes in landscape metrics of cropland and urban land at class level, 1995–2018.


Table 1.
Explanation of landscape metrics.
| Landscape Metric | Scale | Formulas and Parameter Meanings |
|---|---|---|
| PD | Class | NP is the total number of patches in the landscape, A is the total landscape area. |
| ED | Class | E is the total length of the edge in landscape involving patch class i, A is the total landscape area. |
| AI | Class | gij is the number of like adjacencies between pixels of patch class i, based on the single-count method, max(gij) is the maximum number of gij. |
| ENN_AM | Class | hij is the distance (m) from patch ij to nearest neighboring patch of the same type, based on patch edge-to-edge distance, computed from cell center to cell center. |
Table 2.
Land use dynamic degree at the individual level.
| Study Area | Per Area/% | Time Period | All Areas/% | ||
|---|---|---|---|---|---|
| Cropland | Urban Land | Cropland | Urban Land | ||
| CDP | −0.26 | 4.50 | 1995–2000 | 0.22 | 0.72 |
| DTLP | −0.17 | 5.07 | |||
| PYLP | −0.14 | 3.55 | 2000–2005 | −0.18 | 2.36 |
| JHP | −0.31 | 2.74 | |||
| PRD | −0.60 | 3.75 | 2005–2010 | −0.21 | 2.08 |
| THLP | −0.75 | 4.60 | |||
| JHR | −0.29 | 1.57 | 2010–2015 | −0.11 | 2.10 |
| SJP | 0.93 | 0.93 | |||
| SNP | 0.44 | 0.93 | 2015–2018 | 0.31 | 4.61 |
| Overall | −0.02 | 2.64 | |||
Table 3.
Variation in the standard deviation ellipse for cropland and urban land.
| Study Area | Year | Cropland | Urban Land | ||||
|---|---|---|---|---|---|---|---|
| Scope/km2 | Growth Rate/% | Direction | Scope/km2 | Growth Rate/% | Direction | ||
| CDP | 1995 2018 | 27,167 25,677 | −5.48 | North–East | 8913 10,653 | 19.52 | North–East |
| DTLP | 1995 2018 | 38,613 36,712 | −4.92 | North–East | 27,857 30,028 | 7.89 | South–East |
| PYLP | 1995 2018 | 44,289 43,912 | −0.85 | South–East | 36,976 37,791 | 2.20 | North–East |
| JHP | 1995 2018 | 54,139 53,661 | −0.88 | South–East | 40,920 44,588 | 8.96 | North–East |
| PRD | 1995 2018 | 28,819 28,625 | −0.67 | South–East | 25,755 28,820 | 11.90 | North–West |
| THLP | 1995 2018 | 32,485 36,016 | 10.87 | North–East | 39,805 41,422 | 4.06 | South–West |
| JHR | 1995 2018 | 59,085 62,203 | 5.28 | North–East | 60,525 60,611 | 0.14 | South–West |
| SJP | 1995 2018 | 38,961 37,185 | 4.56 | South–West | 39,346 43,954 | 11.71 | North–East |
| SNP | 1995 2018 | 100,597 128,211 | 27.45 | South–East | 80,381 84,309 | 4.89 | North–East |
Publisher’s Note: MDPI stays neutral with regard to jurisdictional claims in published maps and institutional affiliations. |
© 2022 by the authors. Licensee MDPI, Basel, Switzerland. This article is an open access article distributed under the terms and conditions of the Creative Commons Attribution (CC BY) license (https://creativecommons.org/licenses/by/4.0/).
Share and Cite
MDPI and ACS Style
Yuan, Z.; Zhou, L.; Sun, D.; Hu, F. Impacts of Urban Expansion on the Loss and Fragmentation of Cropland in the Major Grain Production Areas of China. Land 2022, 11, 130. https://0-doi-org.brum.beds.ac.uk/10.3390/land11010130
AMA Style
Yuan Z, Zhou L, Sun D, Hu F. Impacts of Urban Expansion on the Loss and Fragmentation of Cropland in the Major Grain Production Areas of China. Land. 2022; 11(1):130. https://0-doi-org.brum.beds.ac.uk/10.3390/land11010130
Chicago/Turabian StyleYuan, Zifeng, Liang Zhou, Dongqi Sun, and Fengning Hu. 2022. "Impacts of Urban Expansion on the Loss and Fragmentation of Cropland in the Major Grain Production Areas of China" Land 11, no. 1: 130. https://0-doi-org.brum.beds.ac.uk/10.3390/land11010130
Note that from the first issue of 2016, this journal uses article numbers instead of page numbers. See further details here.