1. Introduction
Green development has led an important direction of urban and regional development as a global consensus, which emphasizes the coordination of resources, environment, economy and society. In the context that global development turning from traditional model to green model, Chinese government regards green development as one of the five concepts for national development. Green development has gradually become the development principles for Chinese cities and regions.
The description of “green economy” was first proposed in Blueprint for a Green Economy by Pearce et al. [
1]. The report is regarded as the start of green development concept [
2]. Since then, scholars and research institutions had made in-depth analysis on the connotation of green development. Despite various definitions, there is a consensus on the understanding of green development: resources and environment should be regarded as internal factor of development; the coordination of economy, society and ecology should be emphasized; greenization of social and economic activities should be the main content and approach [
3,
4,
5].
With the deepening of the research, scholars began to evaluate the green development level of cities and regions. The existing evaluation framework can be divided into three categories: green national economic accounting [
6], green development efficiency and green development composite index [
7,
8,
9]. Integrated Environmental and Economic Accounting (SEEA) proposed by the United Nations Statistical Office is one of the most influential and widely used green national economic accounting systems thus far. Green development efficiency emphasizes the improvement of resource utilization efficiency in the process of economic development by using data envelopment analysis method (DEA) and slacks-based model to measure input-output efficiency [
10,
11,
12]. However, the number of indicators in the DEA method is limited, which means too many or too few indicators will cause the inconsistent results. Considering that the green development evaluation needs all-round index [
13], a few scholars, therefore, hold the view that the DEA method has its limitation in the assessment of green development level [
14]. Green development composite index can reveal the progress in every aspect of green development through multilevel evaluation index. The major advantages of this method are its ability to show the status of regional green development level by constructing a diversified indicator system, and to compare between regions. Hence, green development composite index has been widely used in existing research [
15,
16,
17]. Generally speaking, green national economic accounting and green development efficiency focus on resources reserves, resource consumption and their coupling relationship with economic growth, but they cannot reflect other fields of green development, such as ecological renovation, social equity and so on [
2,
18,
19]. Although green development composite index can effectively avoid the above imperfections, it largely focuses on the level of each subsystem, ignoring the synergistic development of multiple subsystems [
20].
Given the rise in the research on green development evaluation, additional attention has been paid to spatial distribution and clustering characteristics of regional green development via visualization function of ArcGIS and exploratory spatial data analysis (ESDA) [
18,
21,
22,
23]. These studies can hardly show the dynamic evolution process of the region’s green development which necessitates applying the comparative analysis of the cross-section data in different years. Meanwhile, spatial units are often assumed as “isolated islands” without considering the interaction between analyzed units so that the influence of spatial dependency on green development has not been found. In fact, the complex relationship between cities makes the interaction of cities’ green development possible. Further, the existing research cannot answer some important questions, such that is the level of urban green development influenced by the neighboring cities? What are the spatial effects of cities with different green development levels on the neighboring cities? Are there any temporal changes of the cities’ green development that are affected by neighboring cities in different periods? In recent years, the spatial Markov chain approach was gradually adopted to investigate the spatial interaction between regions. It has been applied extensively to the field of economics [
24,
25]. However, few scholars employ this approach in the research of green development.
In terms of the research object, the scholars were devoted to carry out research on the YREB from a development perspective in the past. It was not until after 2017 that re-search on green development assessment of this region began to emerge. The analysis of the characteristics of urban and regional green development level in the YREB is a hot topic at present. Most scholars focus on the provincial level, secondary urban agglomerations [
26,
27]. Besides, the study span of these study is short, lacking comprehensive and dynamic evaluation of the green development of all cities in the YREB.
To sum up, many theoretical and empirical studies on green development have been introduced, which have laid a solid foundation for this paper. However, these studies also have some limitations on the evaluation system and methods. To achieve the goal of healthy and stable green development, this paper adopts the green development assessment framework which considers the level of urban multi-system and the state of coordination between subsystems. On the basis of dynamic comprehensive evaluation of the green development level of 126 cities in the Yangtze River Economic Belt (YREB) from 2008 to 2017, the Markov chain is applied to the panel data analysis to examine the spatial dependency in the process of green development, clarify the heterogenous effects of spatial dependency, predict the change of green development levels. This will provide a new perspective for interpreting the spatial-temporal evolution of regional green development and theoretical support for the regional synergistic strategies.
This paper is structured as follows. The following two sections discuss the study area and the adopted methodology. The analysis results and discussion are described in the penultimate section. The final section provides concluding remarks on this study.
2. Study Area
The Yangtze River Economic Belt (YREB) is one of four major national development strategies in China. It is an inland river economic belt with global influence, a coordinated development belt of interaction and cooperation between the East and the West, a comprehensive domestic and foreign opening-up belt along the coast, rivers and borders, and a leading demonstration belt for the construction of ecological civilization [
28]. The outline of the development plan of the Yangtze River Economic Belt was officially issued in September 2016, establishing a new development pattern of “one axis, two wings, three poles and multiple points” of the YREB. In November 2018, the CPC Central Committee and the State Council clearly requested to give full play to the regional advantages of the Yangtze River Economic Belt across the three plates of the East, middle and West, to promote the coordinated development of the upper, middle and lower reaches of the Yangtze River and the high-quality development of the areas along the Yangtze River, guided by joint protection and no large-scale development, ecological priority and green development. Accomplishing the balance between protection and development of YREB has long-term and comprehensive benefits to the implementation of China’s green development strategy. Therefore, it is essentially important to fully recognize the green development level and evolution trend of the Yangtze River Basin.
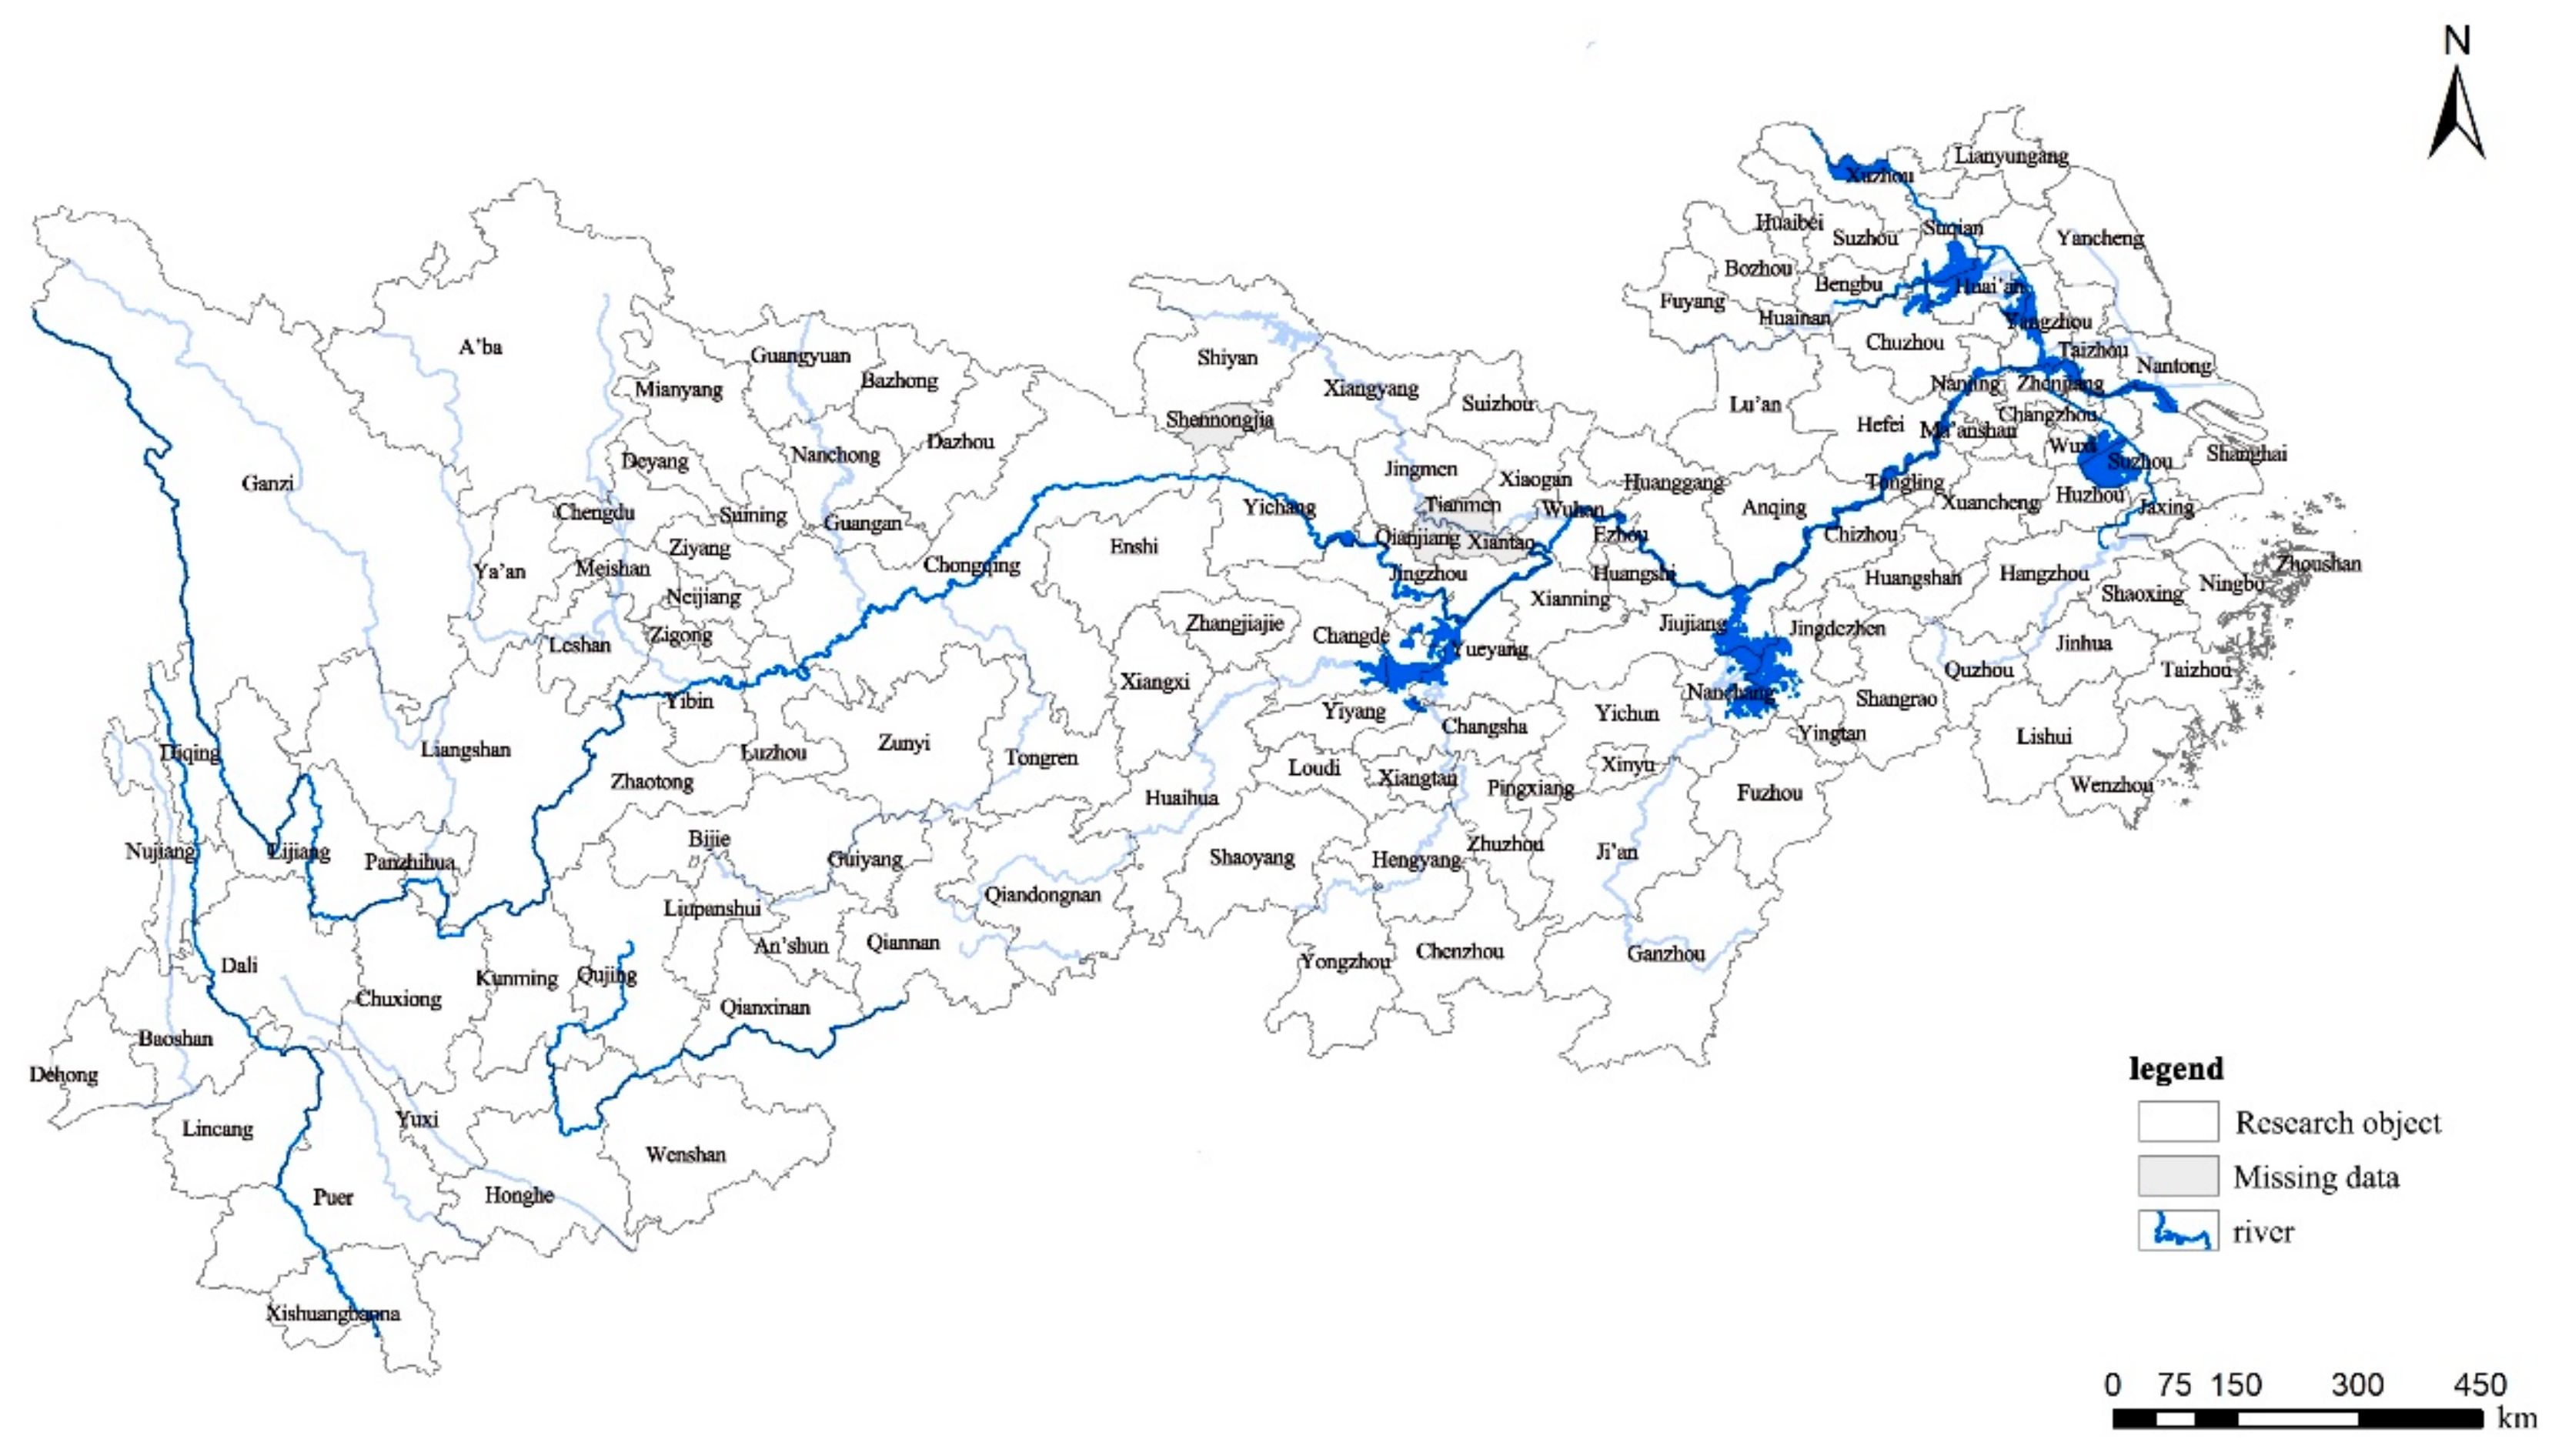
The Yangtze River Economic Belt covers 11 provinces and cities including Shanghai, Jiangsu, Zhejiang, Anhui, Jiangxi, Hubei, Hunan, Chongqing, Sichuan, Yunnan and Guizhou, covering an area of about 2.0523 million square kilometers, accounting for 21.4% of China, and its population and GDP exceed 40% of the country. There are about 225 million people in the lower reaches, accounting for 37.6% of the YREB, about 175 million people in the middle reaches, accounting for 29.2%, about 199 million people in the upper reaches, accounting for 33.2%
1. The current study area comprises 126 spatial units, including province-level municipalities, autonomous prefectures, sub-provincial cities, and prefecture-level cities in the Yangtze River Economic Belt. Because Shennongjia Forest Region, Tianmen, Xiantao and Qianjiang in Hubei Province are county-level cities are significantly lagged behind from others in terms of economic development, these cities are not included in the scope of this paper. This study defines cities according to the extent of their administrative boundaries (
Figure 1).
3. Methodology
3.1. Evaluation System
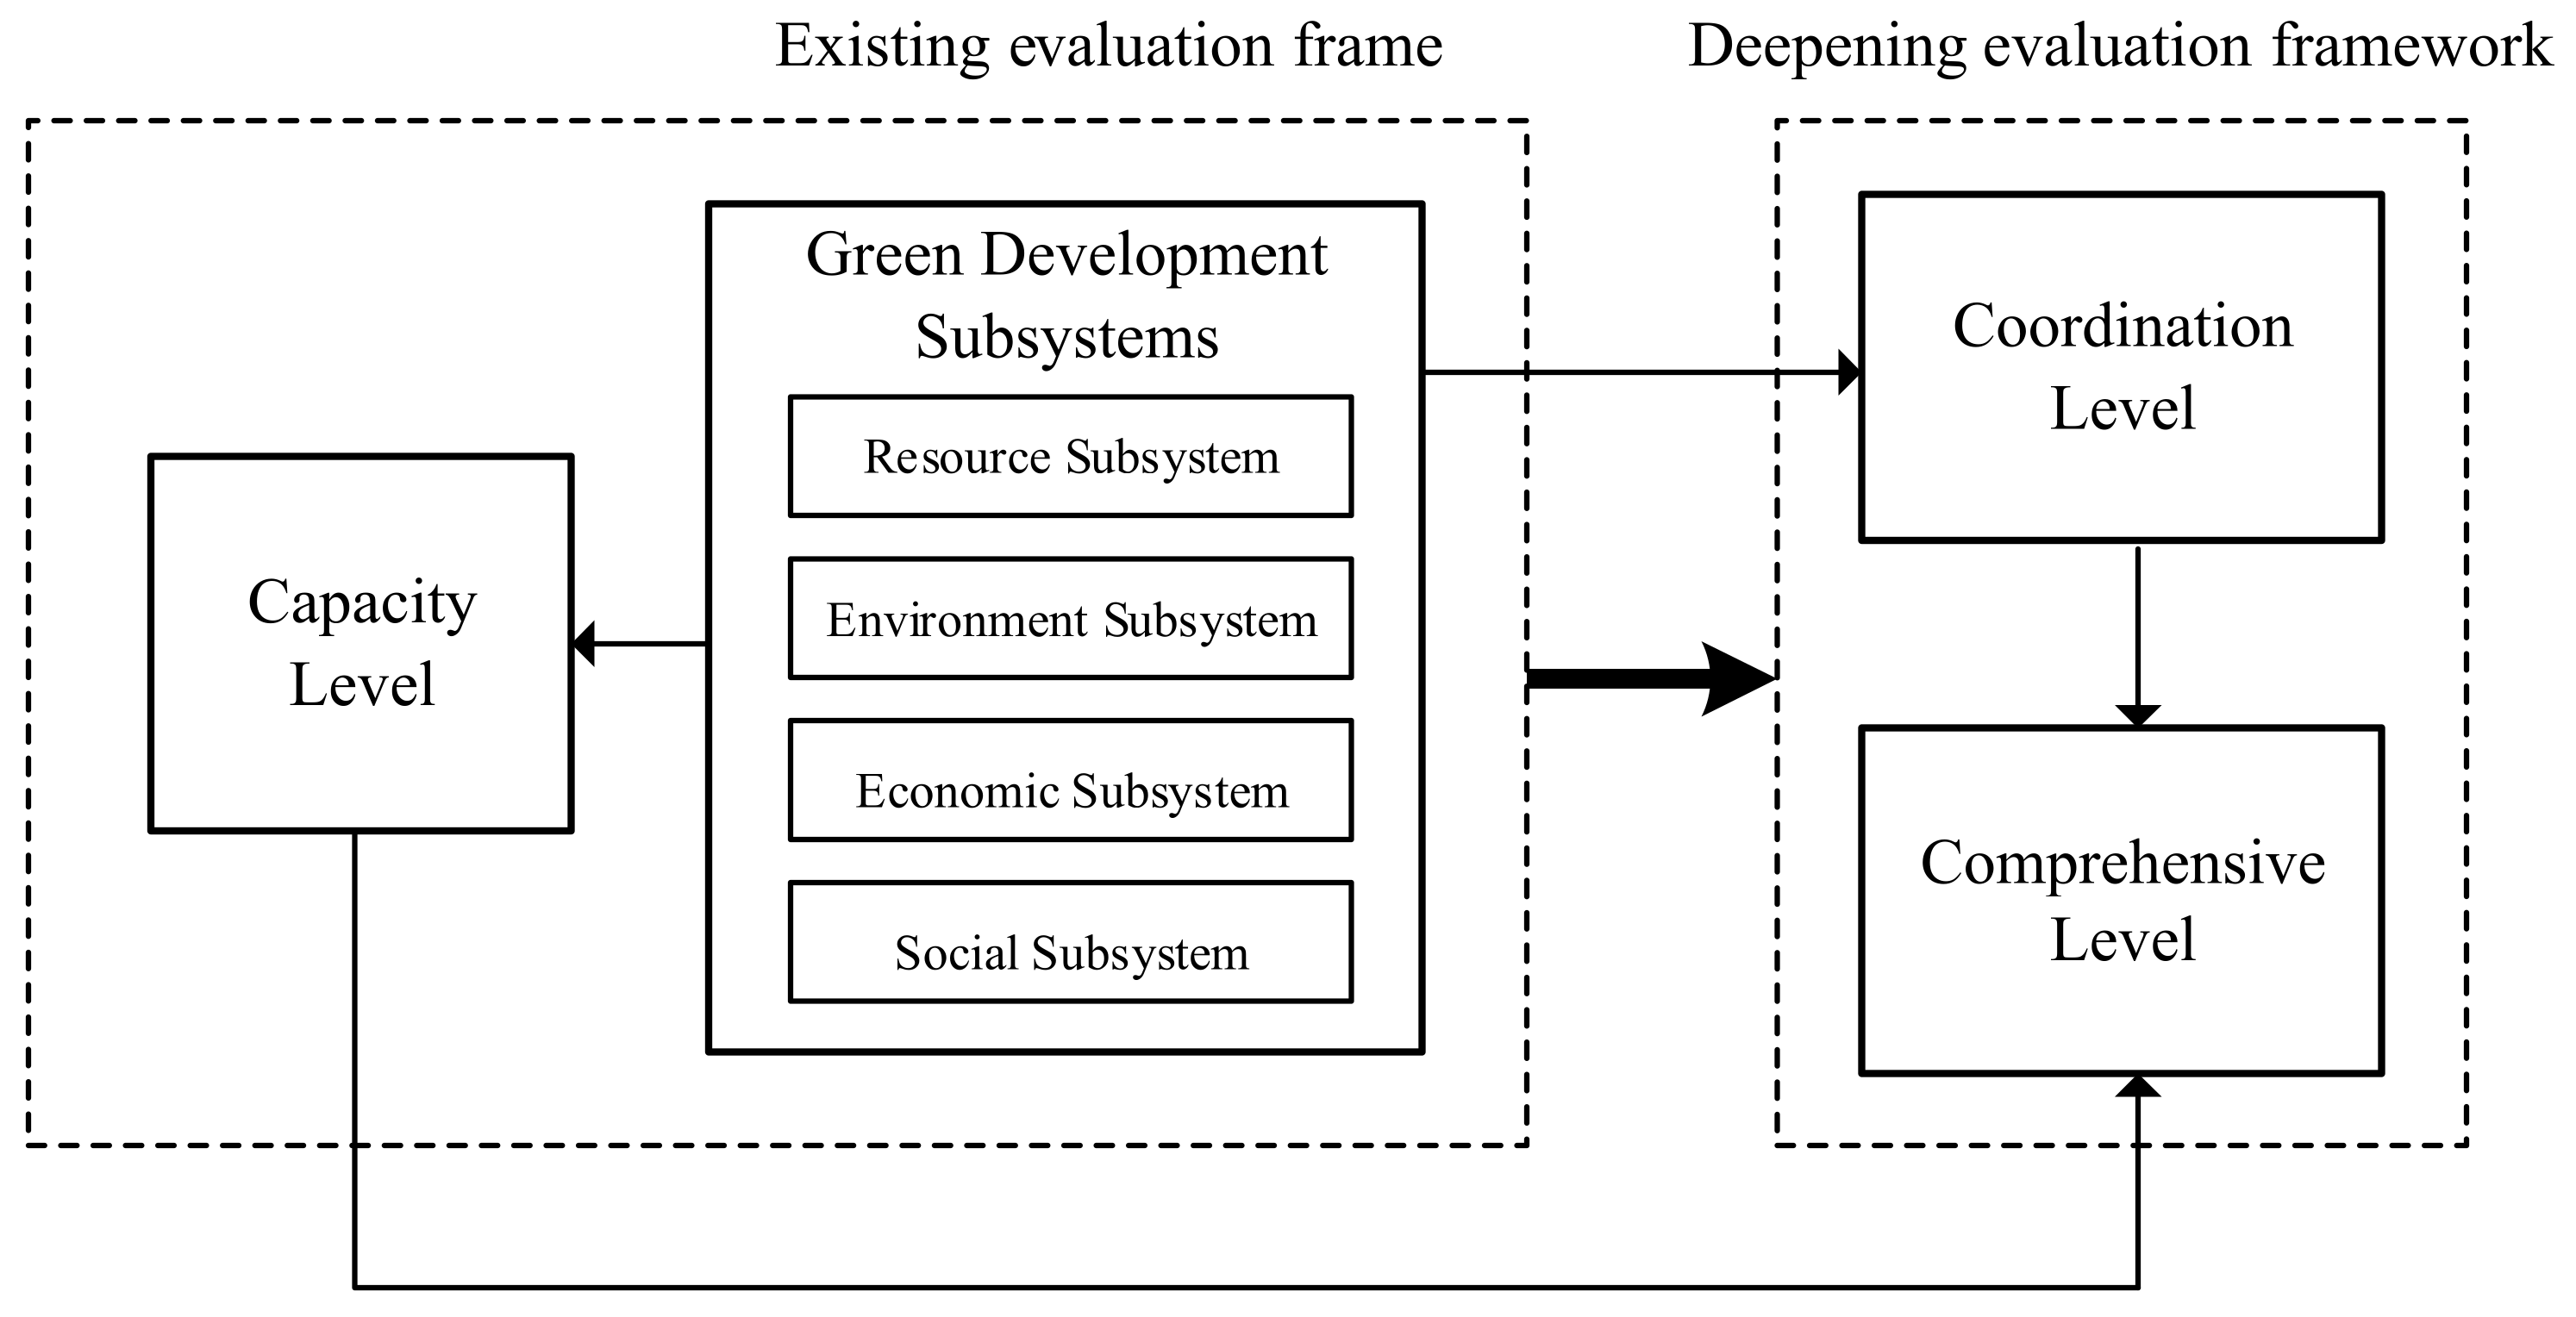
Based on the existing literature on green development composite index [
23,
28], the “coordination level” is added to this study to construct an innovative evaluation system of “capacity level-coordination level-comprehensive level” (
Figure 2). This research categorizes the urban green development into several dimensions, including resources, environment, economy, and society subsystems. The capability level and the coordination level reflect different connotation characteristics of green development. The former represents the overall development degree of multi-system, and the latter emphasizes the coordinated development status between subsystems. Urban green development may fall into a dilemma of having high capability level with low coordination level or having low capability level with high coordination level. To avoid this, the comprehensive level is calculated according to the evaluation results of capability level and coordination level to reflect the all-round status of urban green development. The following part mainly analyzes the comprehensive level of green development in the Yangtze River Economic Belt.
The selection of specific evaluation indexes follows three principles.
- (1)
Problem-oriented: Summarizing and refining the specific problems of the Yangtze River economic belt, so as to make the index system conforms to reality [
29,
30].
- (2)
Goal-oriented: Reflecting the concept and connotation of urban green development comprehensively.
- (3)
Representativeness and feasibility: Priority should be given to the indexes with the highest frequency and recognition in relevant reports and literatures, and the difficulty of obtaining them should be fully considered to ensure the consistency of the evaluation in time and space dimensions [
21,
31].
Finally, this system consists of twenty-seven indexes selected from four subsystems (
Table 1).
3.2. Model Specifications
3.2.1. Capacity Level of Urban Green Development
The evaluation of capacity level employed the entropy value method to determine the index weight [
32]. The evaluation values of four subsystems are then obtained by linear weighted method:
where
represents the value of the subsystems;
represents the standardized value of the
indicator in systems.
is the weight value of systems. The value of four subsystems
,
,
and
can be calculated in accordance to the steps above.
Since each subsystem is equally important, the final score of capacity level of the city is:
The larger the value is, the higher the green development level of the city is, and vice versa.
3.2.2. Coordination Level of Urban Green Development
The concept of coupling in physics is used in this paper to reflect the coordination level of urban green development. The coordination level, which means the interactions between resources, environment, economy and society can be analyzed through the coupling degree model. While in practical application, different formulas are applied by different scholars [
29,
30], this paper adopts the following formula recommended by Jiang et al. [
31]:
where
C is the coordination level of urban green development. The larger the value, the higher the coordination level between subsystems. Due to the advantages of simple calculation and performance of calculation results, formula (3) is widely used in related studies [
33].
3.2.3. Comprehensive Level of Urban Green Development
In order to consider both the capability level and coordination level, this paper calculates the comprehensive level in reference to coupling coordination degree model:
where
D is the comprehensive level,
C and
G which are obtained in the previous steps.
3.2.4. Moran’s I Index Analysis
In order to deeply reveal the spatial agglomeration of green development in the YREB, this paper makes a quantitative discussion by using spatial autocorrelation. The global autocorrelation coefficient is to test the agglomeration situation of the whole region, which is generally measured by Moran’s I Index, and its calculation formula is:
where
represent the observed values of space unit
i and
j,
is the average observed value of all regions,
is the spatial weight matrix,
n is the number of all spatial units in the watershed. In this paper, the common boundary principle is used to determine the spatial weight matrix. If the spatial elements
i and
j are adjacent, then
is 1, otherwise it is 0. Moran’s I ranges from [−1,1]. If the value is positive, it is positive correlation, the value is negative, it is negative correlation, and the absolute value is autocorrelation intensity. If the value is close to −1/(
n − 1), it indicates that the spatial distribution is random. In addition, the significance test index Z value and its adjoint probability P value can also be obtained through calculation. In this study, its specific meaning is the probability of random distribution of green development level of each city in space. Combined with the three indexes of Moran’s I Index, Z value and P value, the regional agglomeration can be comprehensively judged.
3.2.5. Markov Chain Analysis
The traditional Markov chain is based on the random process theory of Russian mathematician. The aim of this method is to construct a state transition probability matrix to measure the probability of event occurrence and predict the trend of event development [
34]. The spatial Markov chain combines the concept of spatial lag with the classic Markov chain to incorporate spatial interaction into the study. The goal of this method is to measure the weighted attribute values of neighboring areas by introducing the spatial weight matrix, to judge the state of the spatial lag type. Because the Markov chain matrix is under different spatial lag conditions, we can examine the effects of different settings of spatial lag types on spatial units and the different characteristics of spatial dependency in different periods.
Specifically, the spatial Markov chain transition probability matrix decomposes the classic n-order transition probability matrix (
) into
n conditional transition probability matrices (
). For the
n-th condition matrix, the element
specify the probability that a city which was in class
i at time t turns into class
j at time t + 1. The spatial lag type is determined according to the spatial weighted average values of the neighboring spatial units, which is the spatial lag value. The calculation formula is:
where
is the horizontal value of a space unit,
represents the element in row
i and column
j of the spatial weight matrix. In this paper, the common boundary principle used by many scholars is adopted to determine the spatial weight matrix, when the spatial element
i is adjacent to
j,
is 1, otherwise it is 0 [
35,
36]. By comparing the traditional Markov chain matrix with the spatial Markov chain matrix, we can examine the effects of the surrounding area on the probability of a certain spatial unit’s class transition. If class transition is not influenced by neighbor background, all elements in two matrices would be equal.
4. Results
4.1. Club Convergence of Green Development in the Yangtze River Basin
The above evaluation system was applied to measure the green development comprehensive level of 126 spatial units in YREB from 2008 to 2017. The natural breaks method was implemented for the classification of the full sample data. The green development level of the spatial units in YREB are divided into four classes: very low (VL), low (L), high (H), and very high (VH). In order to study the change of green development level of the YREB during the ten years, the traditional Markov transition probability matrix was applied for the entire study period (
Table 2).
There is a convergence in the urban green development comprehensive level during the study period, and the VH club indicates a more significant convergence. As shown in
Table 2, the diagonal elements are relatively greater than the remaining elements, with the highest reaching 0.939 and the lowest 0.708. It means that the urban green development of cities is influenced by their original state deeply. Among them, the cities in the VH club have stronger stability than other classes.
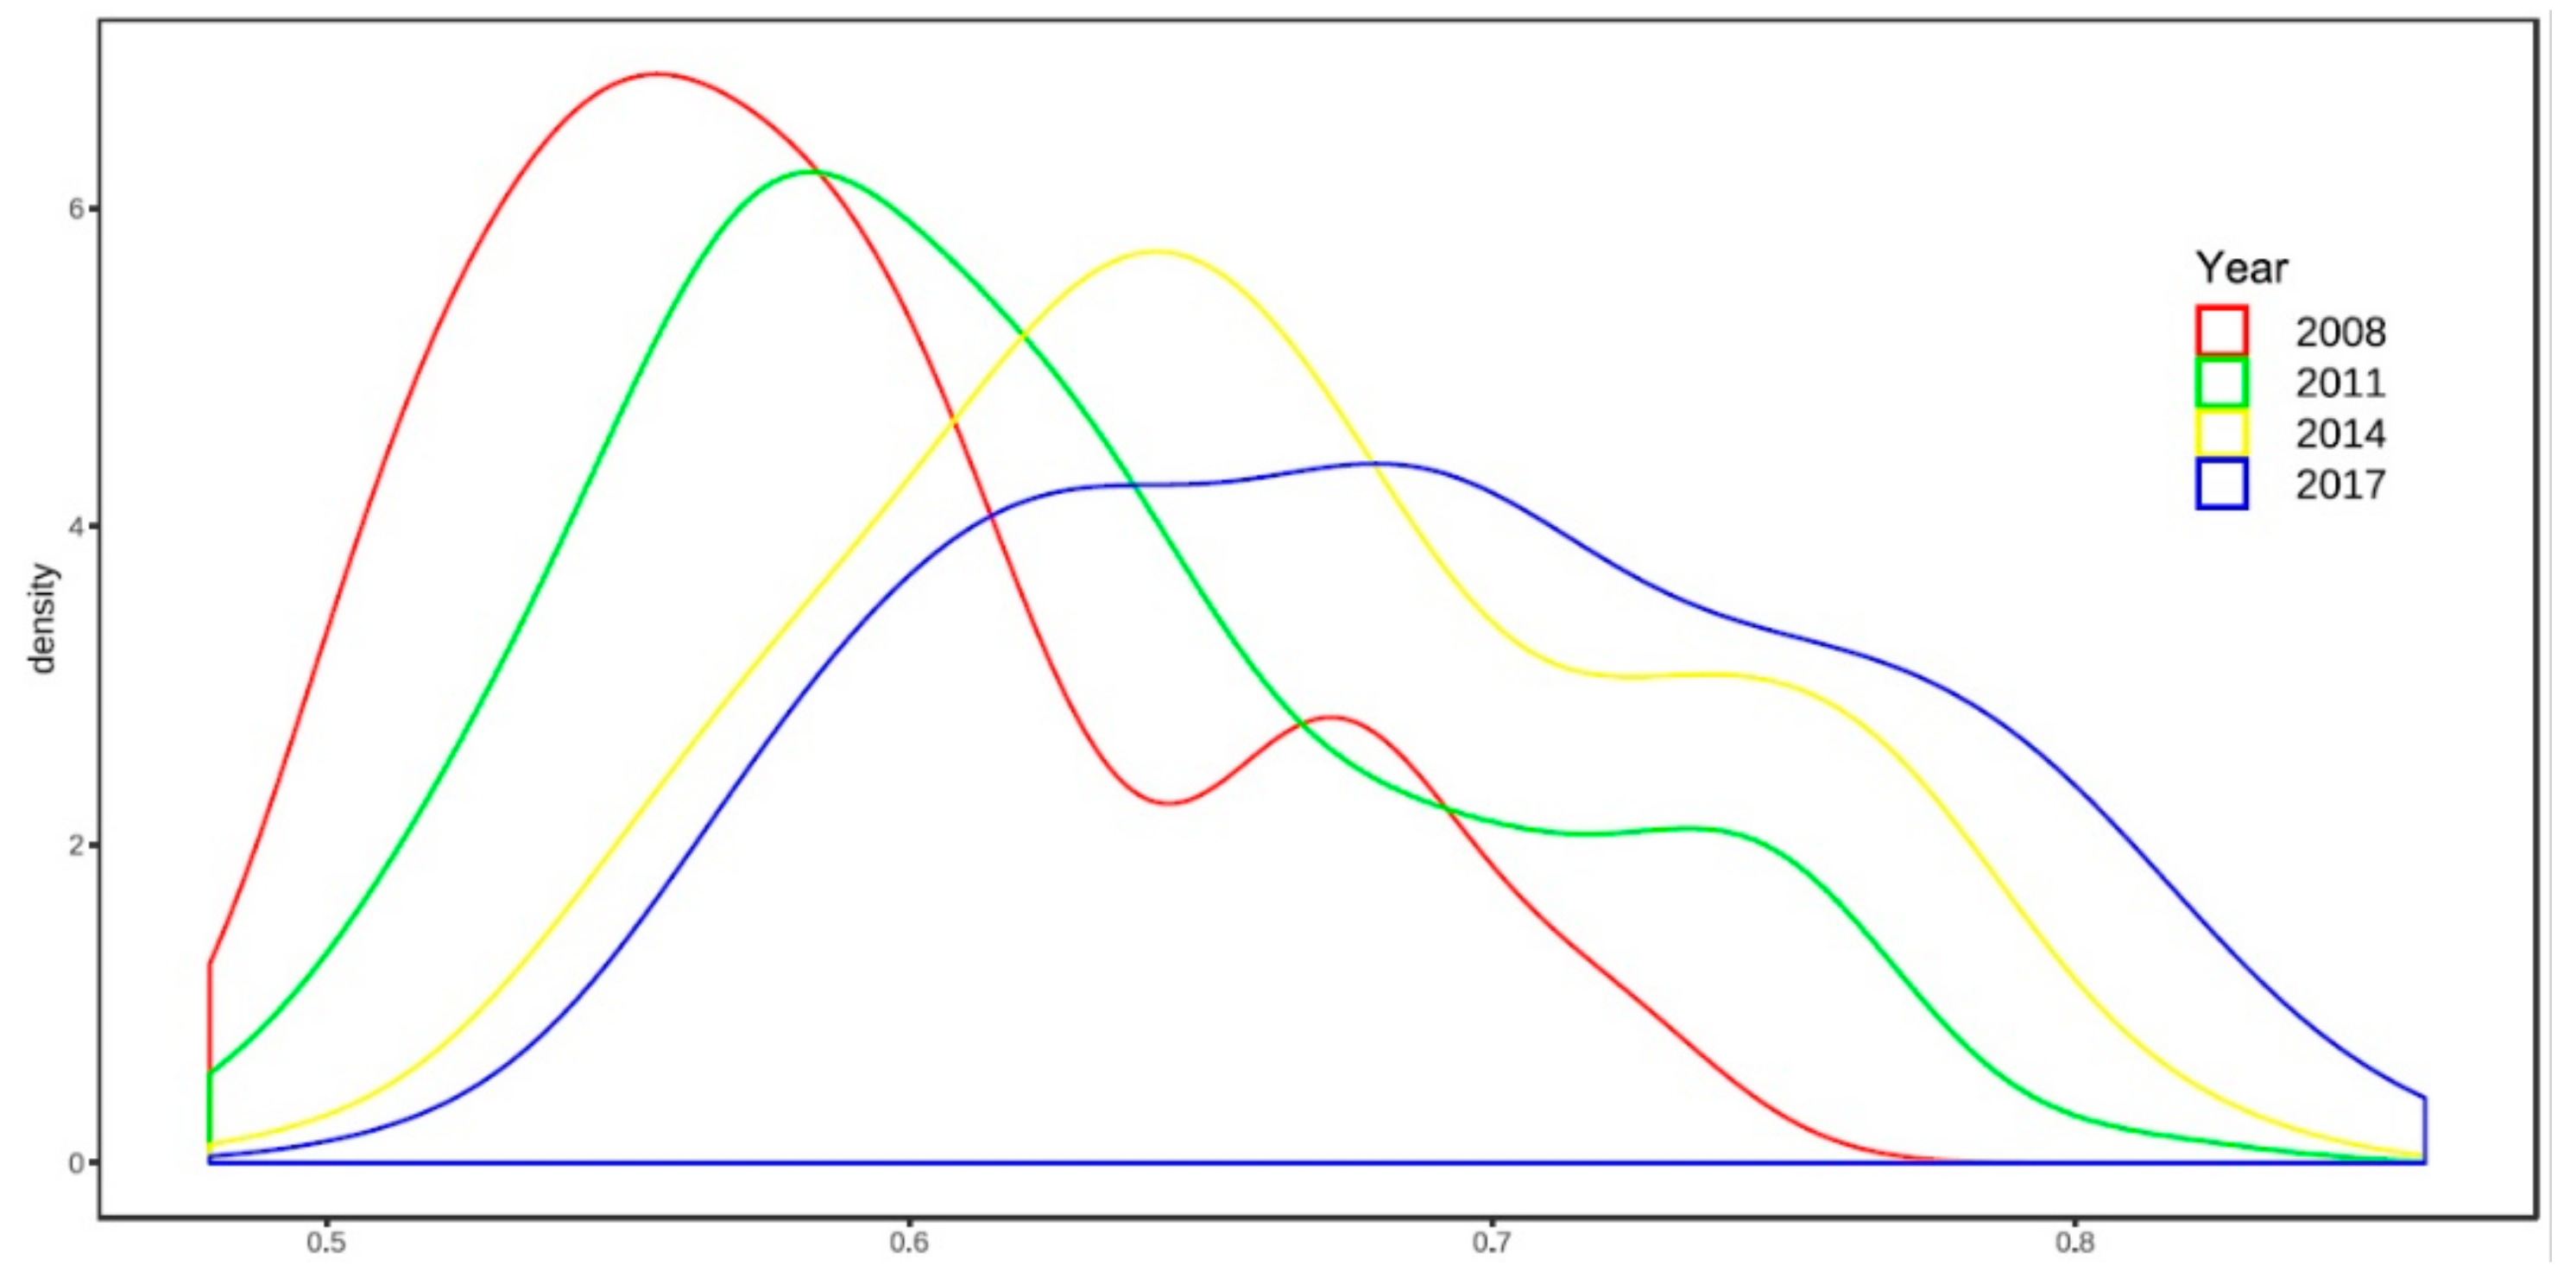
Meanwhile, cities in other clubs have the tendency to move upward. It means that lower clubs are gradually shifting to higher clubs, and the green development in the Yangtze River Basin hasn’t polarized. Furtherly, exploring the results by Gaussian Kernel Density Estimation in the analysis of sample data for four years: 2008, 2011, 2014 and 2017 (
Figure 3) [
37]. The result shows that the urban green development level of YREB presents a distribution pattern of one main peak and one sub peak. During the evolution process, two peaks were moving to the right, from steep “double peak” to gentle “single peak”, representing the lower clubs have “catch up effect” for higher clubs.
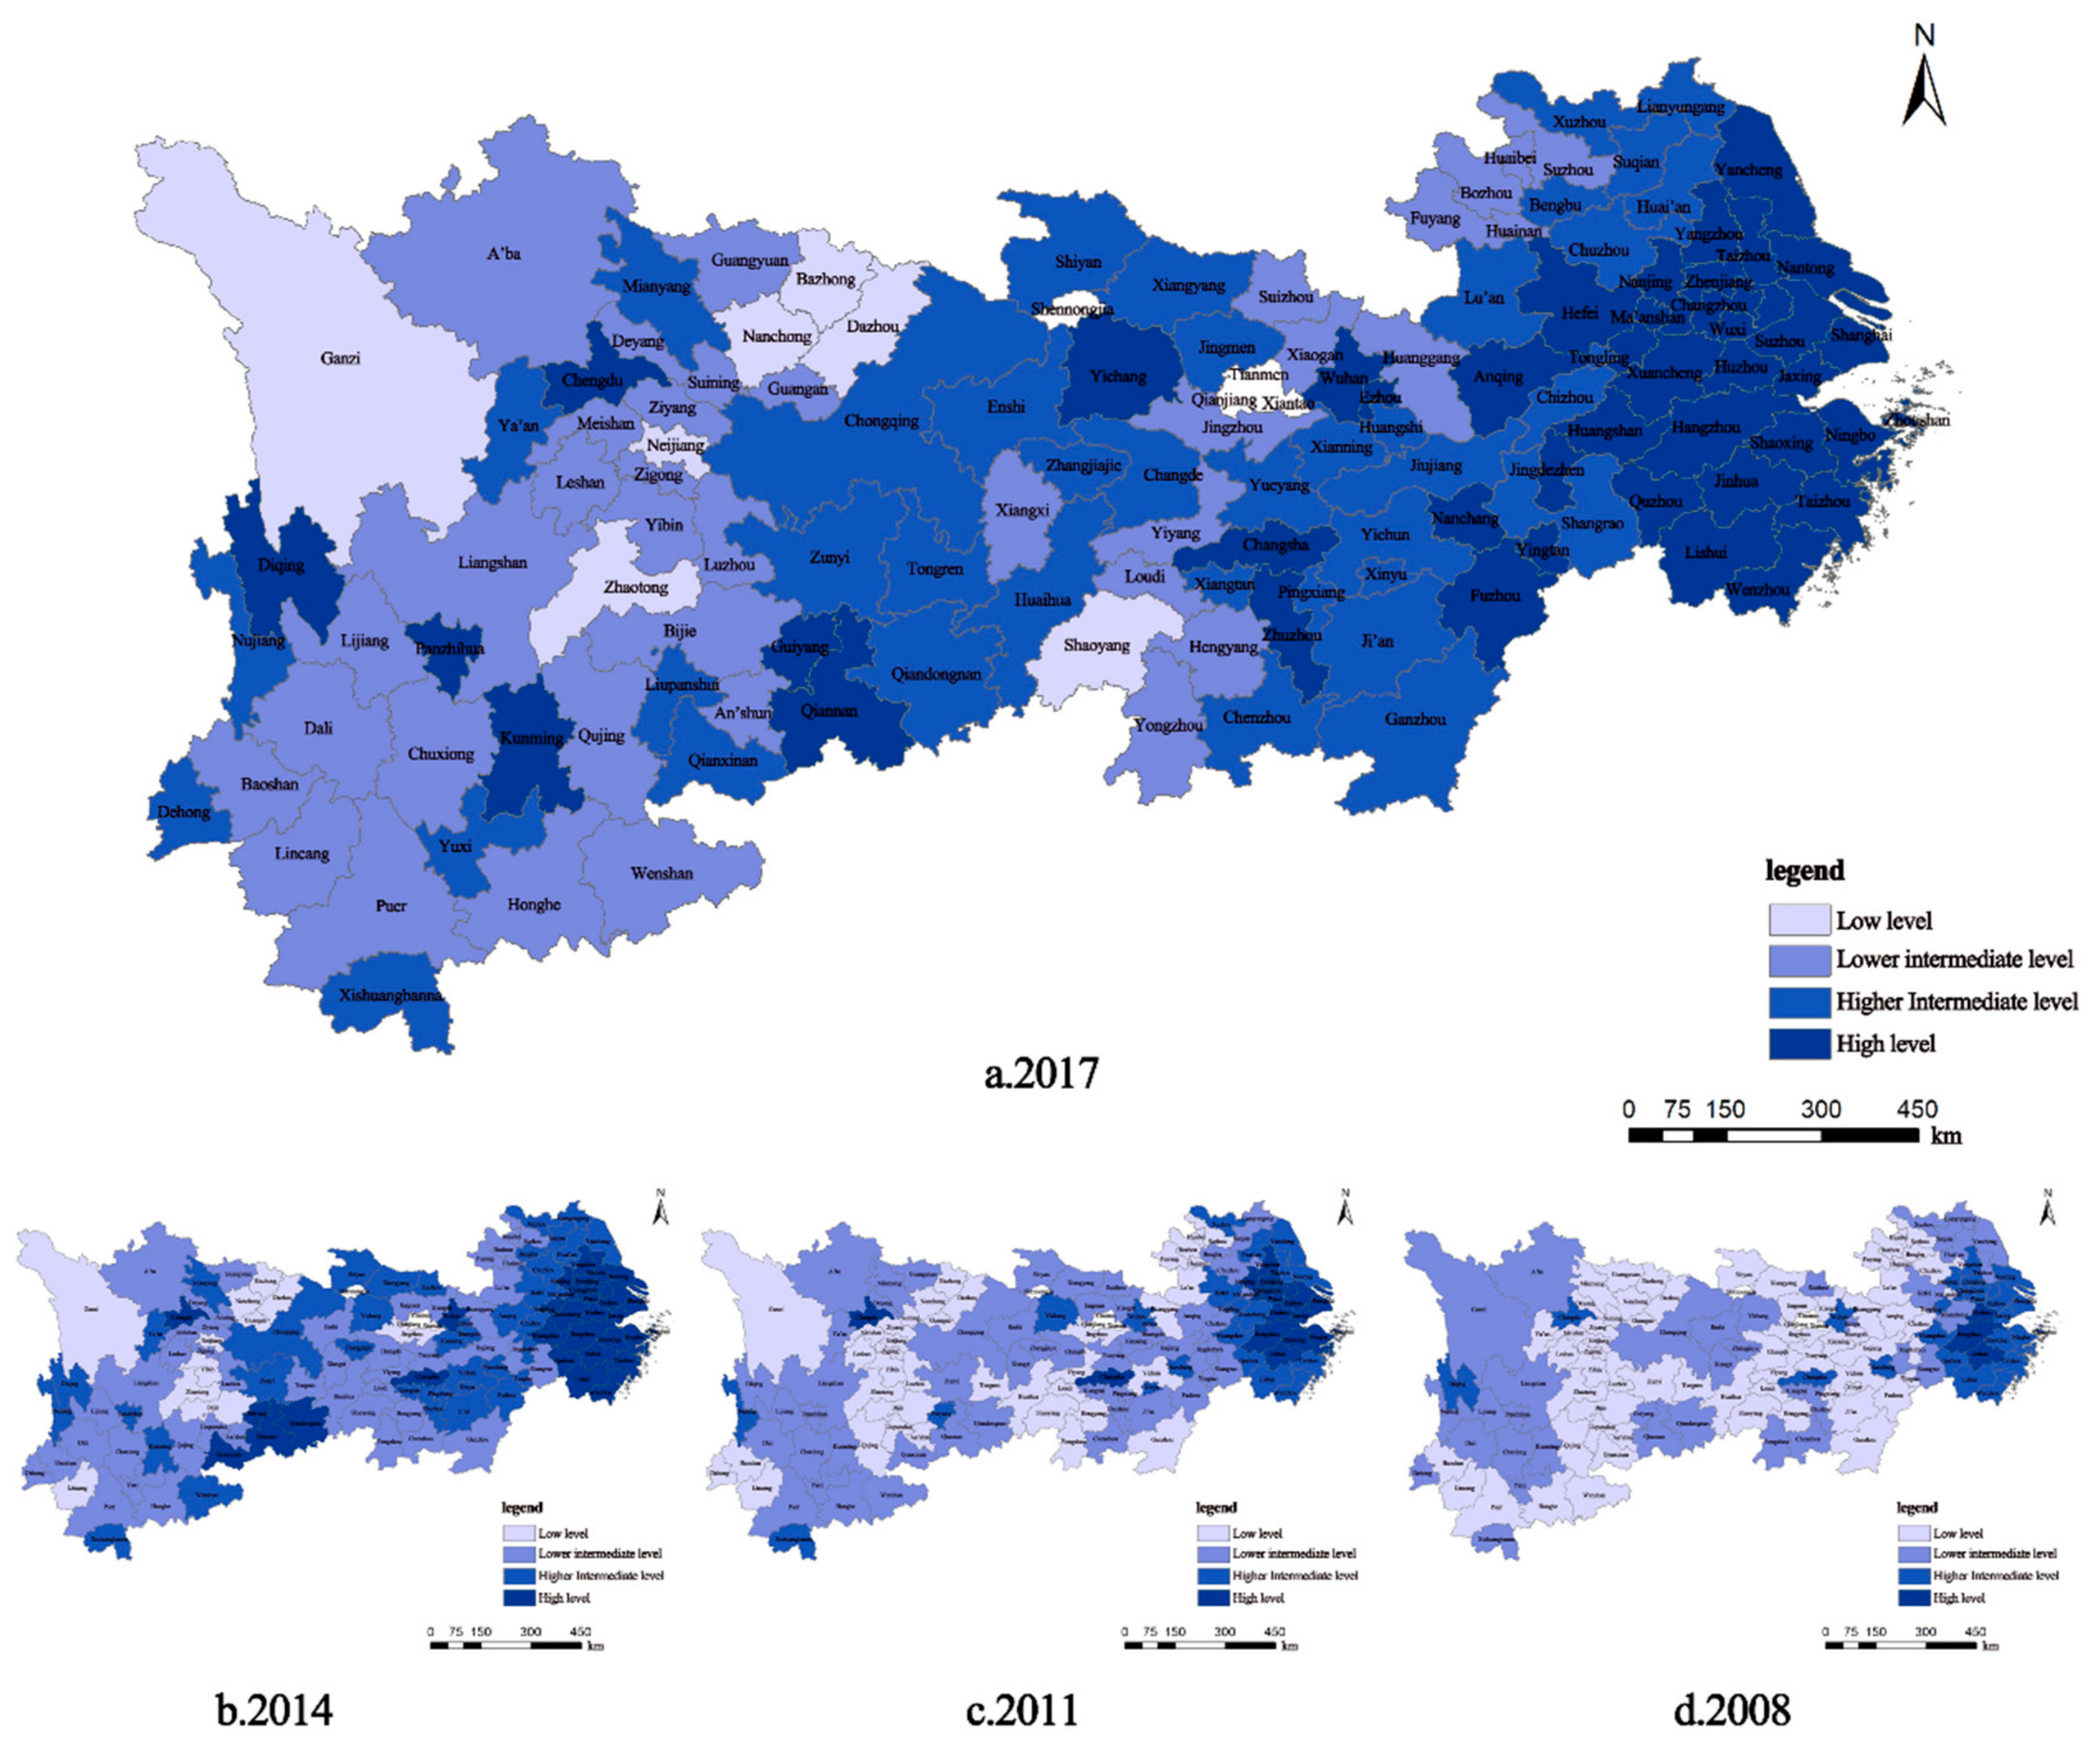
From a regional view, the spatial distribution of VH club tends to clump together in the lower reaches and sporadically distribute in the upper and middle reaches. The imbalanced distribution is strengthened gradually and performance in the quantity and density of eastern is more than western in the mass (
Figure 4). Meanwhile, the number of cities in H club increases strikingly in the middle reaches, which is closely related to the implementation of pollution reduction measures and the improvement of ecological restoration technologies in this area. In addition, the cities in L club are mostly located in the upper reaches, where is a low-lying area the rich natural resources have not been transformed into economic benefits.
4.2. The Influence of Neighbor Background on the Club Convergence
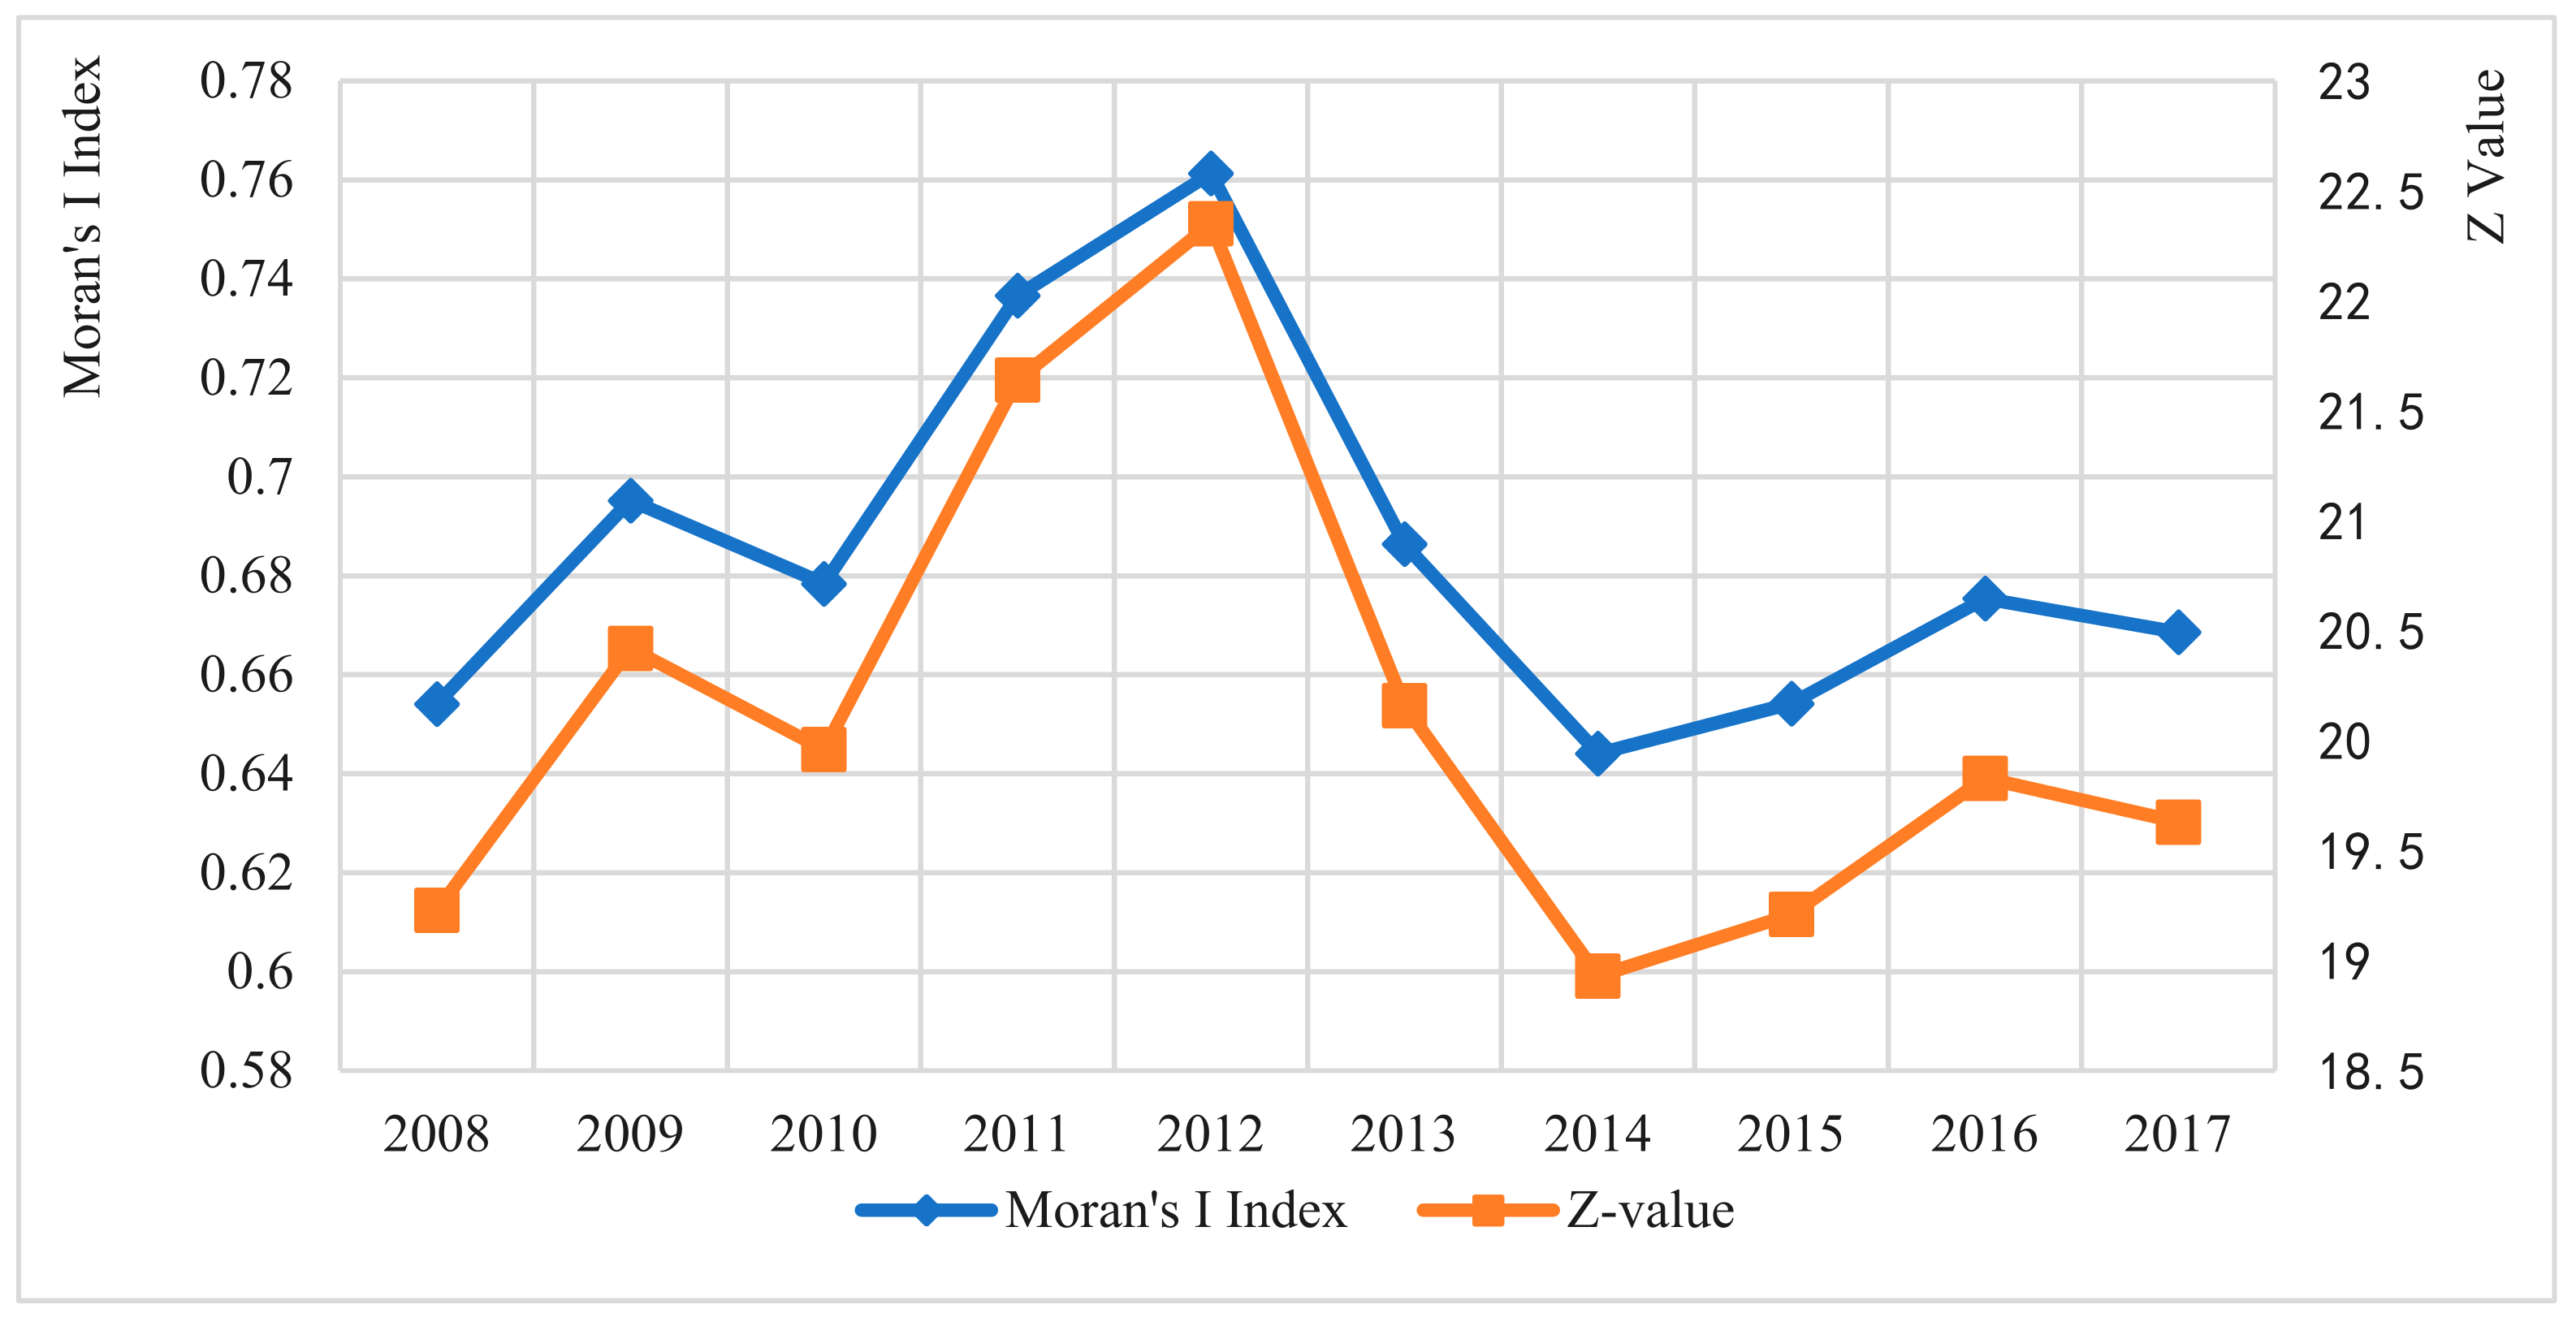
The analysis of spatial autocorrelation suggests that the spatial units in the Yangtze River Basin are not “isolated islands” in terms of green development. In
Figure 5, Moran’s I Index is positive in different years and passes the Z-value test, indicating that the spatial agglomeration of urban green development is significant in the whole period. Moran’s I Index has a fluctuating uprising tendency during the period 2008–2012. It reaches the peak in 2012 and declines during the period 2012–2017.
The analysis of spatial autocorrelation has demonstrated the potential for understanding interactions between spatial units to some extent. However, it cannot explain the spatial mechanism of the club convergence phenomenon from the perspective of temporal evolution. Hence, this study discussed whether there is spatial effect of neighbor backgrounds and the law of function. According to related research [
38], the spatial distribution map showing the green development class transition of the units and their regional background can confirm whether neighbor backgrounds have spatial effect on cities. Due to the characteristics derived from spatial autocorrelation analysis, the research can be subdivided into two time periods of 2008–2012 and 2012–2017.
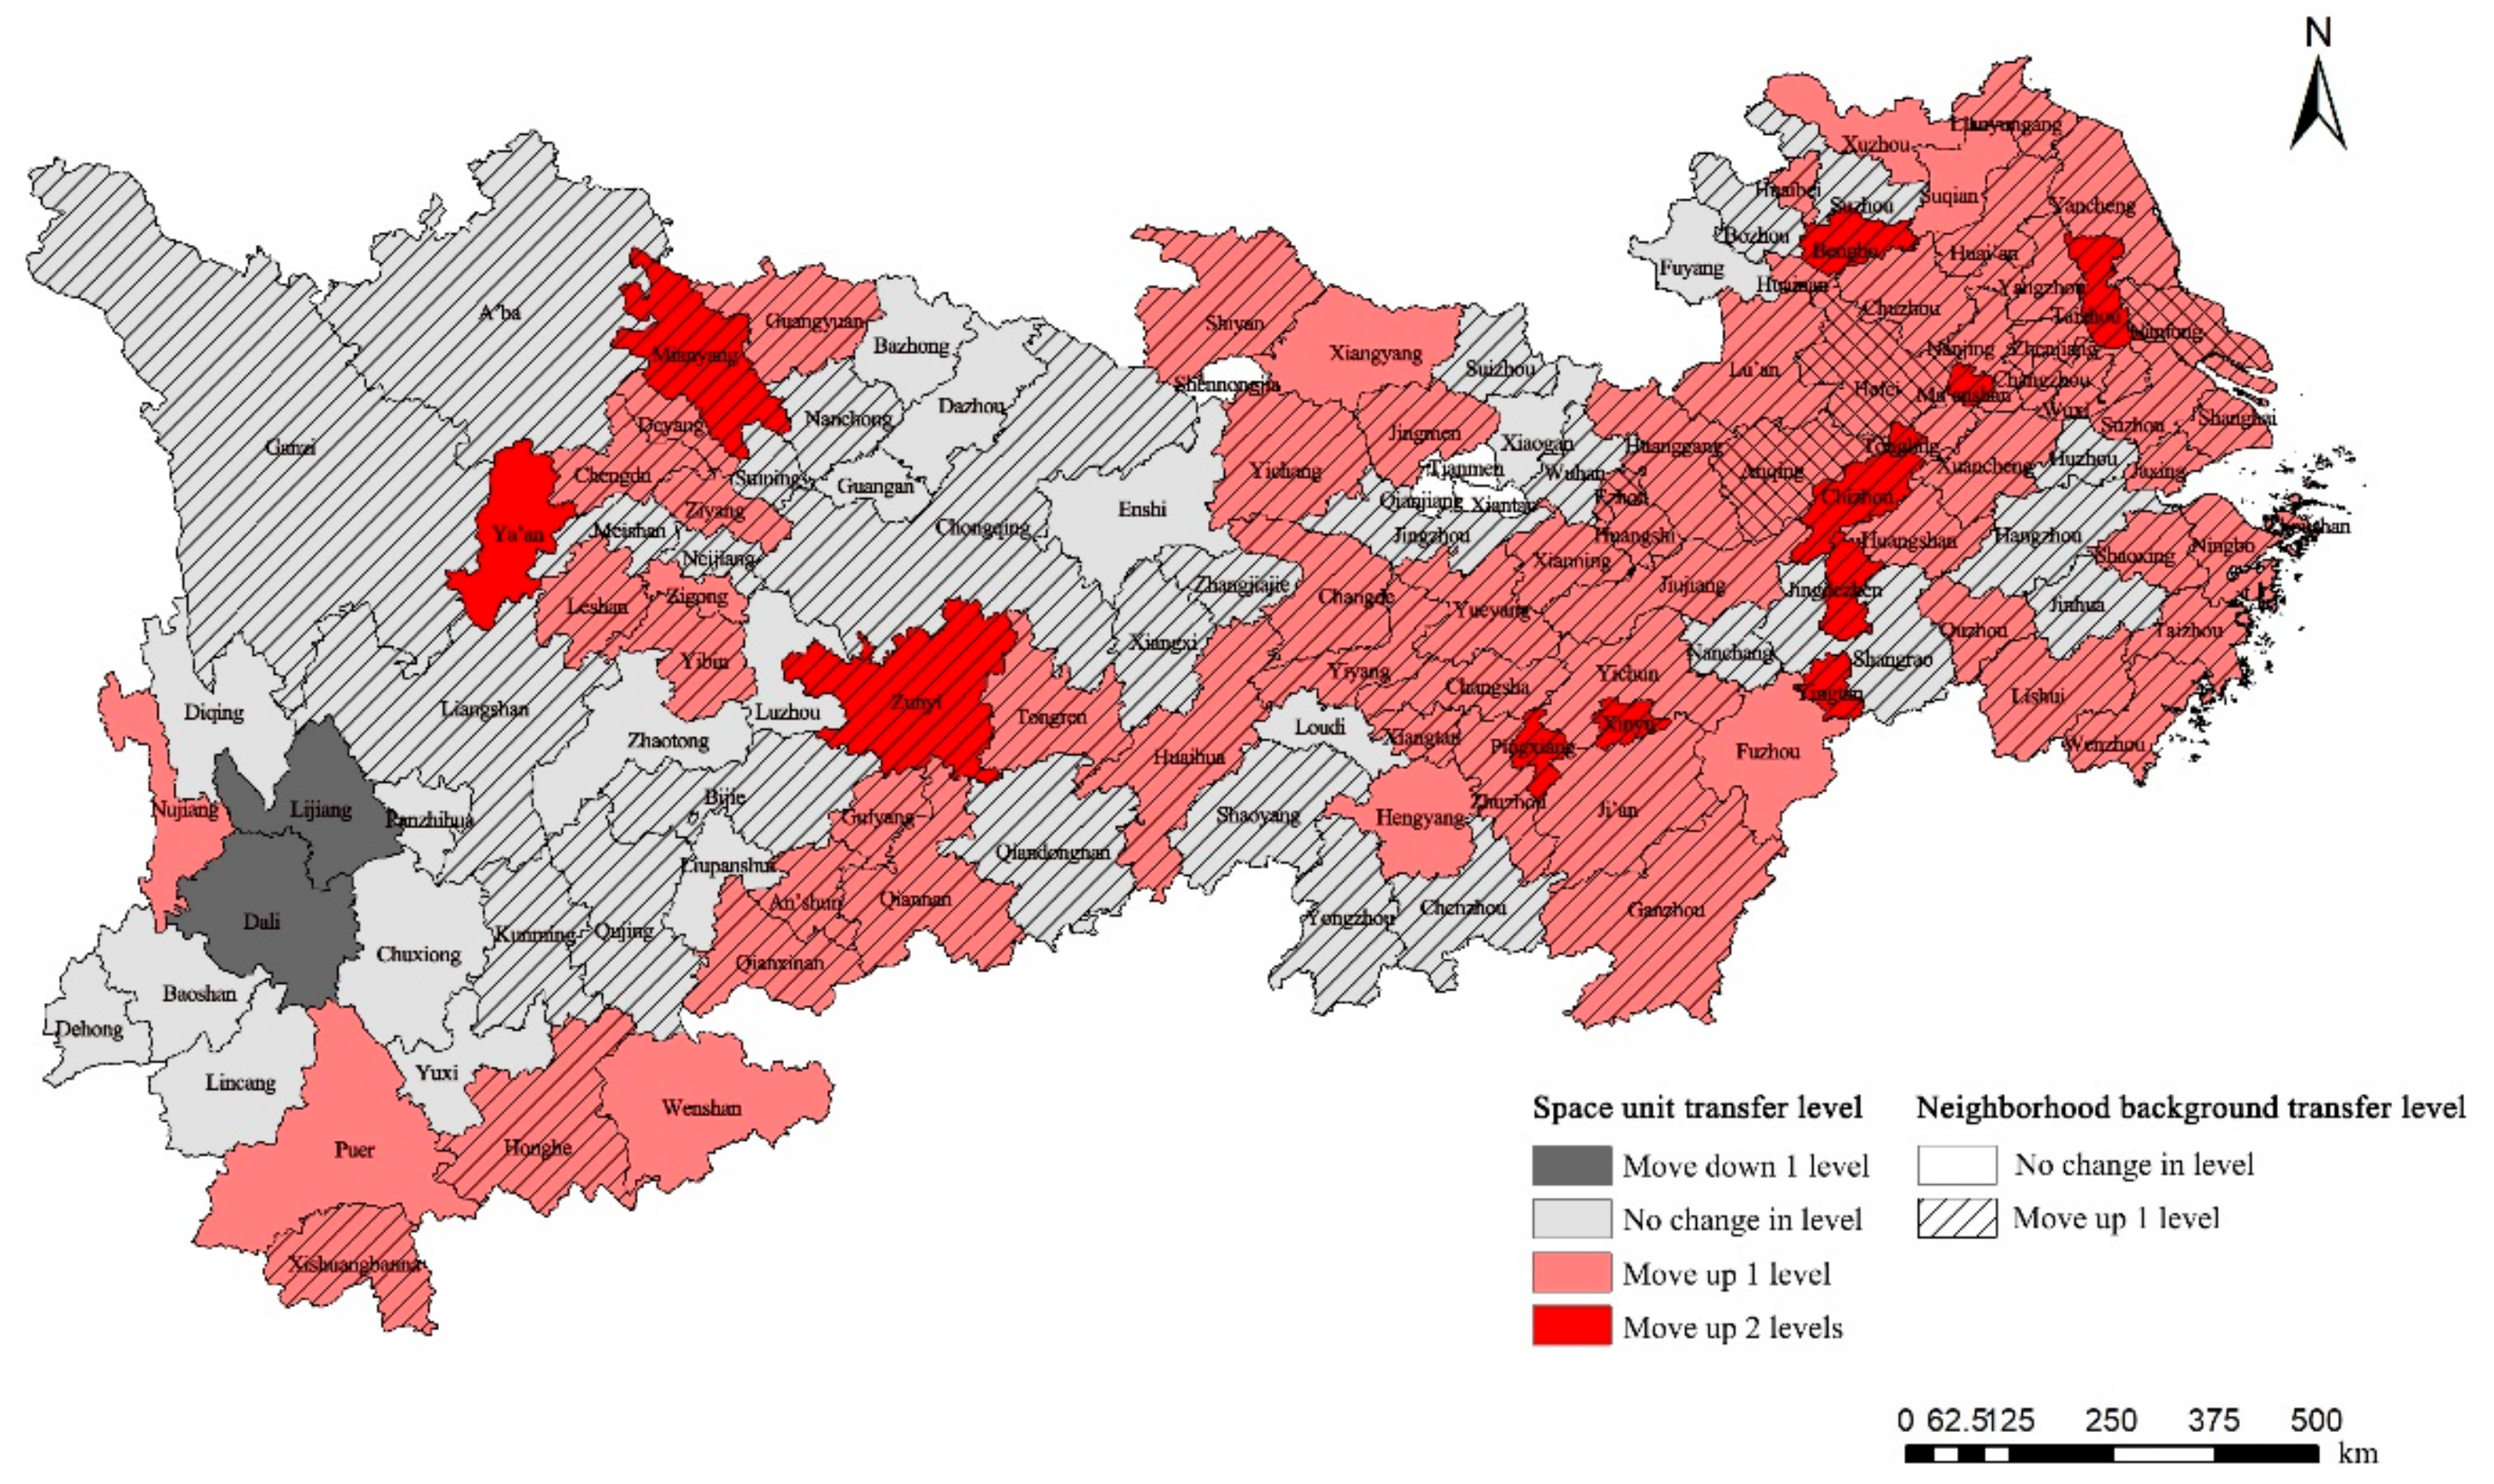
When a spatial unit and its neighborhood move downward, upward or remains unchanged, the trend of their transitions is same. If they transfer in the opposite direction or only one remains stable, the trend is different. As can be seen in
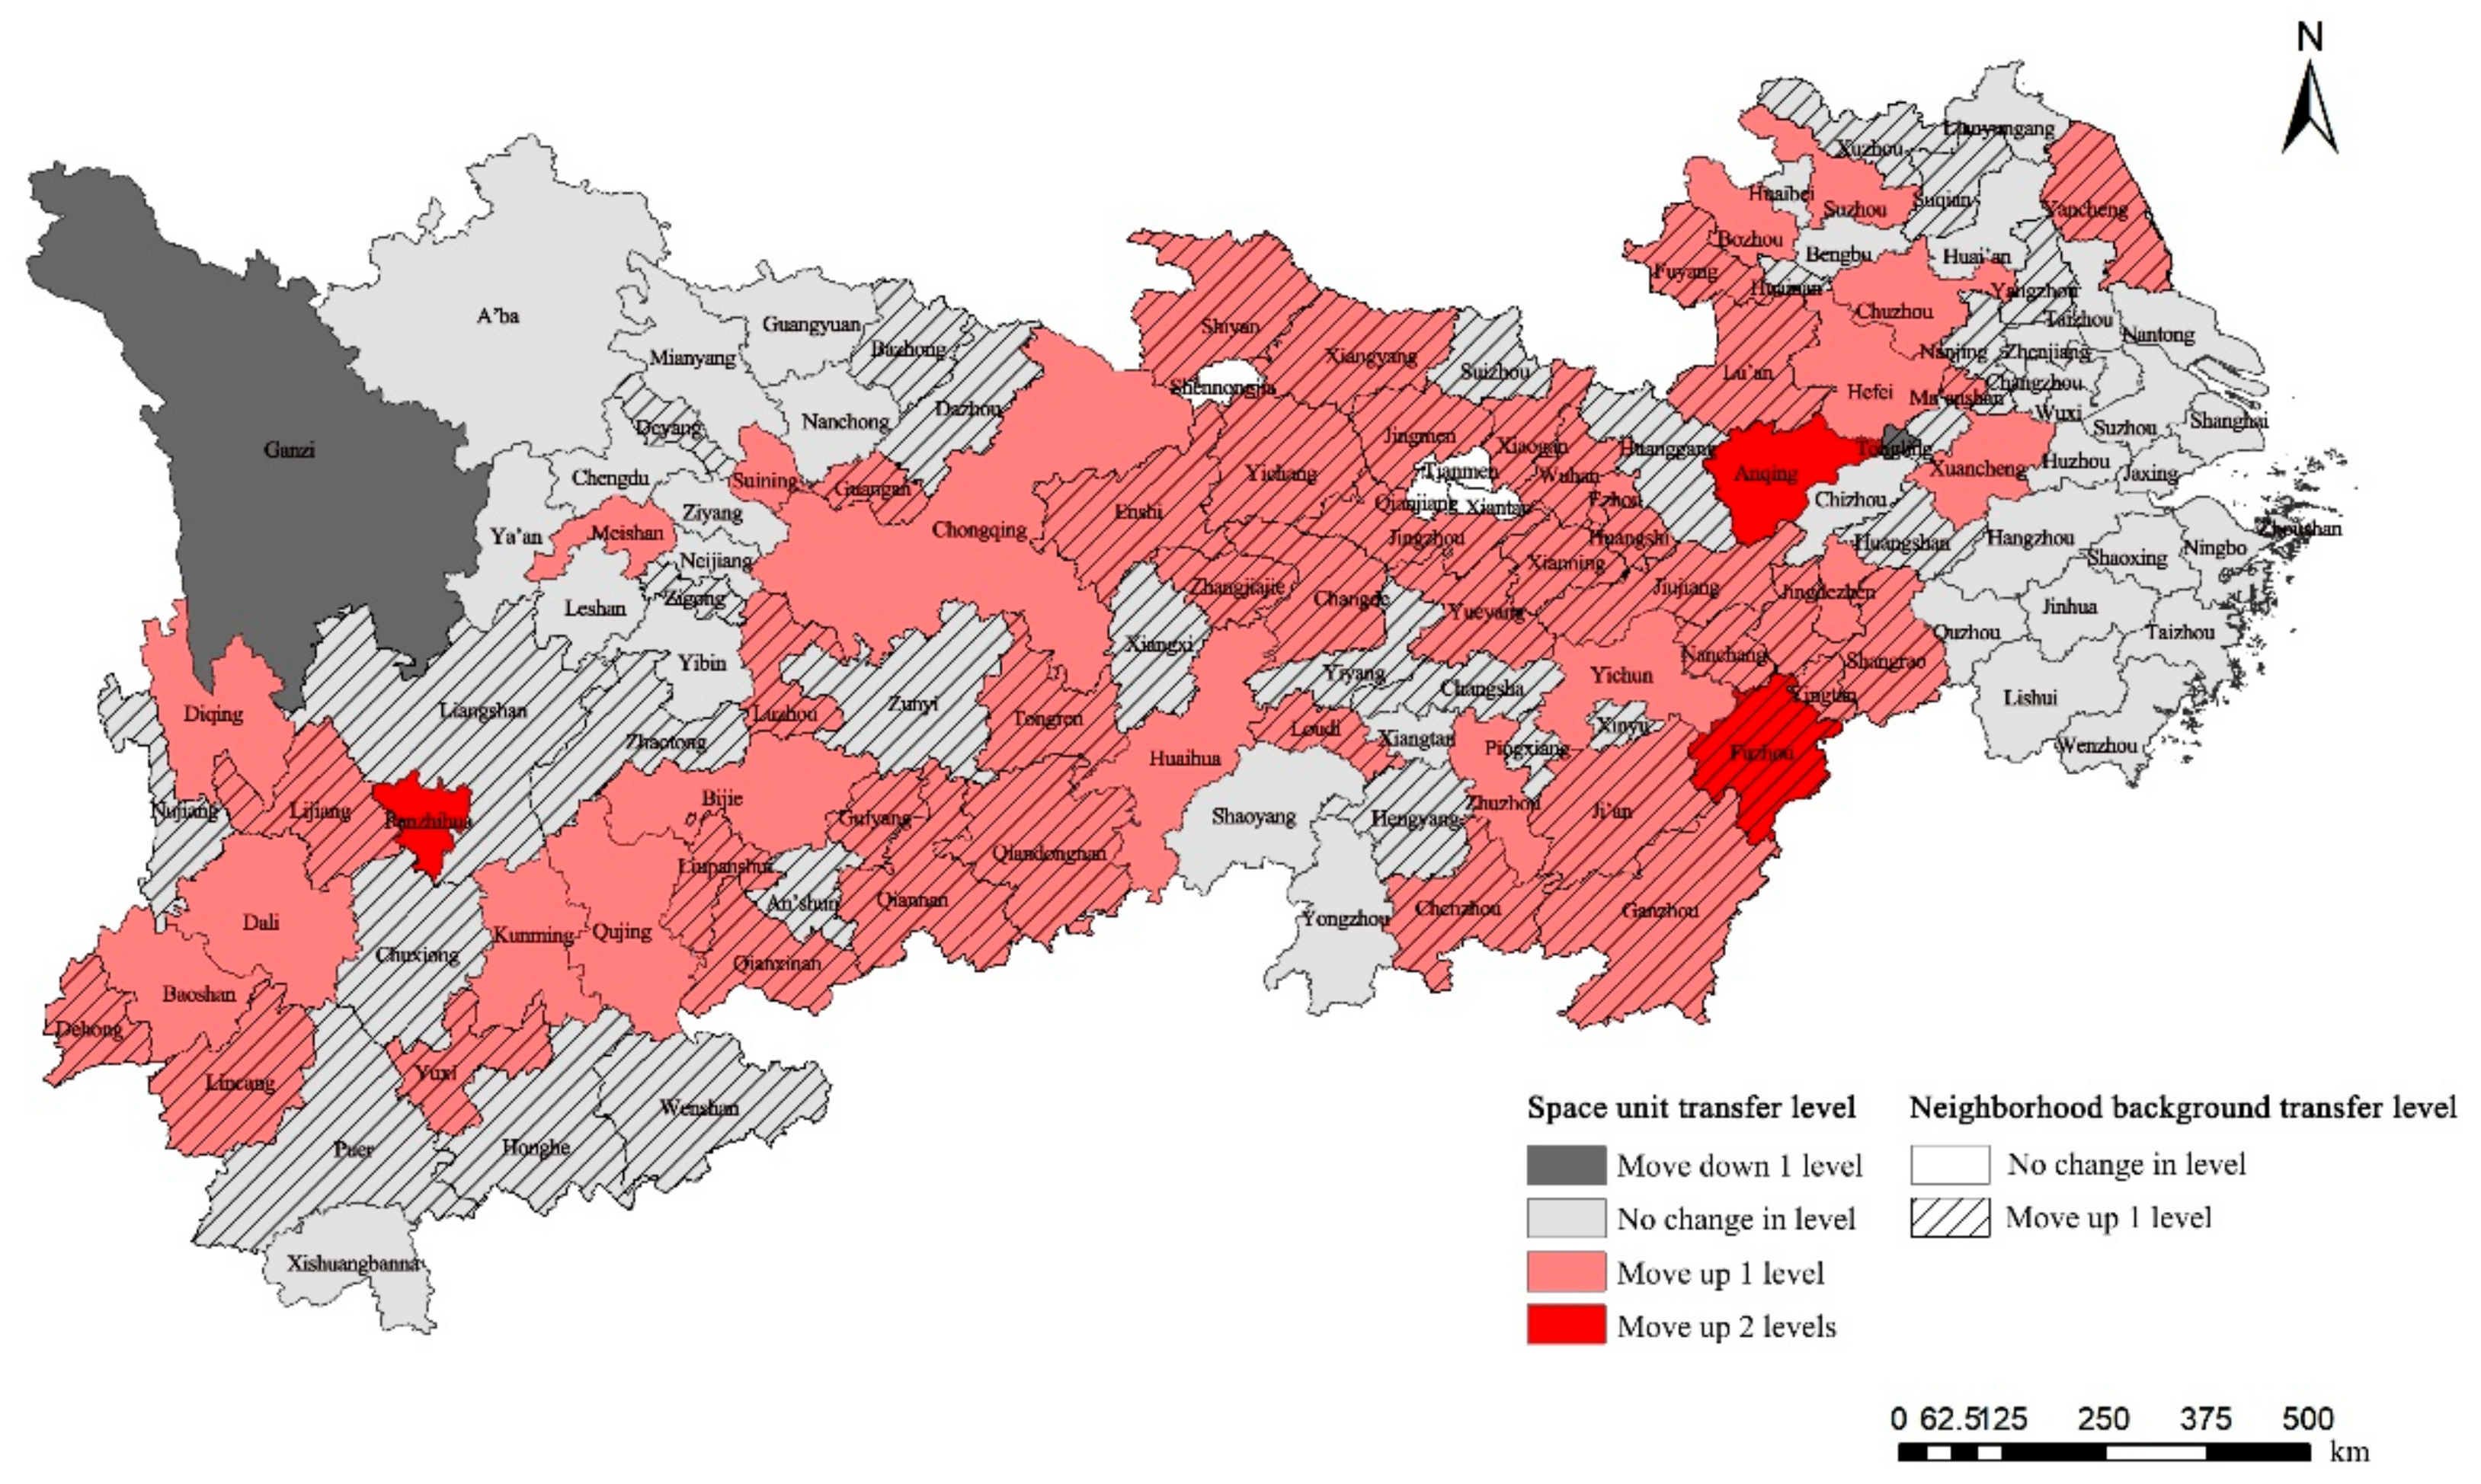
Figure 6, the cities had the same transition trend with their neighborhood accounting for about 69% in 2008–2012, of which 70 cities and their neighborhood move upward, 19 remained unchanged. This number in 2012–2017 was relatively less but still more than half, accounting for 59% (
Figure 7). It suggests that the convergence characteristic dominated in both time periods, and cities were more significantly affected by the neighborhood in 2008–2012.
This convergence characteristic is particularly prominent in the lower reaches. From 2008 to 2012, with the exception of Hangzhou, Jinhua, and Huzhou, which were already in VH class, other cities and their neighborhood all move upward synchronously in this area. During 2012 to 2017, these cities and their neighborhood basically remained stable. The convergence characteristic in the middle reaches is obvious either, with nearly 60% of cities and their neighborhood all have an upward transition in the period 2008–2012 and 2012–2017 respectively. However, the cities in the upper reaches have a weaker association with their neighborhood. About 50% cities whose class transition diverged from their neighborhood, indicating that it is more difficult to give full play to the driving effect of the surrounding cities. Chongqing, Kunming, GanZi and Liangshan are the most representative cities, whose individual-level changes basically depends on their own conditions and has a weaker interaction with their neighborhood.
Overall, the above analysis demonstrates the evolution of the urban green development comprehensive level is closely related to the neighborhood, and the transition trend of the spatial unit tends to be consistent with its neighborhood. This spatial mechanism is an important reason for the YREB to maintain high spatial agglomeration.
By confirming the spatial effect, spatial Markov chains approach is introduced to examine the influence of the neighborhood and the probability of its change to which convergent groups. The above study shows that the evolution trend of green development level of the two time periods 2008–2012 and 2012–2018 is different. Therefore, the classic Markov transition probability matrix and the spatial Markov transition probability matrix for 2008 to 2012 and 2012 to 2017 are calculated separately with the help of MATLAB software. By comparing the corresponding elements in the two matrices, the relationship between the class transition probabilities of the cities and their neighborhood background can be analyzed. From
Table 3 and
Table 4, it can be seen that the neighborhood spatial units have the following effects:
- (1)
Table 3 and
Table 4’s probability matrices are significantly different, proved that the class transition of urban green development in YREB has spatial dependence. From 2008 to 2012, the probability of cities in H class to move upward is 0.239 regardless of geographical spatial pattern. When they are adjacent to cities in VH class, the probability raises to 0.625, indicating that urban green development is affected by regional backgrounds.
- (2)
The class transition probabilities of the cities vary when they are adjacent to different classes. From 2008 to 2012, the probability of a city in VL class to move upward is 0.270. It will increase to 0.426 when the city is adjacent to an area in with L class. From 2012 to 2017, when the neighborhood is in VH class, the probability of a city in VH class to move downward will drop to 0.019 compared with the average of 0.066. Meanwhile, if this city is adjacent to cities in L class, the probability moving downward increases to 0.242. It indicates that the cities at higher green development level have the radiation effect on neighborhood, while the cities in lower green development level may have the inhibition effect.
- (3)
During different periods, the effect of neighborhood background level in YREB is different. During 2008–2012, when the surrounding area is in very low (VL) class, the probability of the spatial unit in low (L) class initially maintaining stability is 0.720. However, from 2012 to 2017, the probability of maintaining stability is 0.833 in very-low-level environment, which is significantly higher than that of without considering background (0.732). It indicates that the foundation of low-level cities is strengthened, which makes it less affected by lower-level cities. In addition, the blocking effect of high-level neighborhood background on very-high-level cities and the pulling effect of very-high-level neighborhood background on high-level cities are obviously increased. It shows that the region should pay attention to the inhibitory effect of lower-level neighborhood environment and reduce its negative spillover effect from surrounding areas.
4.3. Forecasting Long-Term Trends of Green Development in the Yangtze River Basin
The class distribution of the green development in the Yangtze River after n years can be obtained by calculating the n-step probability transition matrix. When n approaches infinity, the limit distribution of the state can be obtained, and it is possible to predict the long-term evolution of the urban green development in YREB. In order to find the limiting distribution of the whole period, the classic Markov transition probability matrix for the whole study period and the limiting distribution of this matrix are calculated (
Table 5).
Compared with the initial state, the number of cities in VL and L classes decreases significantly and the number of cities in VH and H classes increases correspondingly, indicating that the urban green development level will be greatly improved in accordance with the evolution trend from 2008 to 2017. In terms of the class distribution of limit state, a large proportion of cities will be in VH class (64%) and a small number of the cities will be in H class (24%), only a few cities will remain in VL or L class. Therefore, the previous trend that the level distribution pattern changes from double peaks to a single peak will intensify in the long-term evolution and the main peak will be likely to appear in the range of higher-level.
5. Discussion
As mentioned in the literature review, an increasing number of scholars have gradually been attracted to the study of green development. Currently, the majority of research focuses on green development from partial dimension rather than comprehensive perspective [
39]. The current research overlooks synergistic development of multiple subsystems to some extent [
40], can hardly find the influence of neighborhood background on green development. YREB, as a typical region of undergoing rapid urbanization in China, its identification of green development level will facilitate the sustainable development and may improve local responses to actual development bottlenecks [
41,
42]. This study provides the spatiotemporal analysis of characteristics, regional disparity, and spatial effects on green development at city level of the YREB.
The results of this study indicated that the improvement of urban green development level is the consequences of the endogenous growth of urban individuals and the spillover effect of adjacent areas. Therefore, it is necessary to put forward overall guidelines from the goal of coordination, proposing strategies from three spatial levels: the whole basin, three reaches and key cities. At present, many cities in the basin are facing the mismatch between capacity and coordination level. Therefore, how to promote the synchronous improvement of capacity level and coordination level and achieve more efficient growth of green development level is a practical problem that needs urgent attention. Based on this, in the practice of green development, on the one hand, we should identify the short board of current development lag based on the existing evaluation results. Even if urban managers choose to carry out comprehensive regulation and control of resources, environment, economy and social systems simultaneously [
43], they should also focus on and invest more elements in systems with obvious insufficient development. Under the condition of limited resources, it can ensure the stable growth of capacity level and coordination level. On the other hand, we should not ignore the dynamic change of urban development short board and carry out real-time monitoring, it is necessary to dynamically evaluate the whole system and constantly adjust the distribution scheme of factors [
44,
45].
At the aspect of different reaches, the upper reaches of the Yangtze River have been in the low-lying area of green development for a long time, exposing the problem of insufficient regional green development capacity and coordination level. In terms of spatial distribution, Sichuan Province and Yunnan Province tend to form low-value agglomeration, and there is a weak spatial correlation between cities. The analysis above show that the key areas of breakthrough lie in the economic system and social system [
46], and the key cities of breakthrough are Zhaotong, Bazhong, Nanchong, Dazhou, Ganzi and Neijiang, which are at a low level at this stage, as well as Zigong and Ziyang, which are potentially lagging cities. The middle reaches show lagging characteristics in terms of environmental system. Yichang, Jingmen, Jingzhou and Xiaogan in the region jointly form a low-value agglomeration area. Therefore, the primary task of the middle reaches is to solve the problem of regional environmental pollution, so as to prevent the emergence of the “black growth” mode of sacrificing the environment for economic development. At the same time, it is necessary to be extra vigilant against the negative spillover effect in the low value agglomeration area of the environmental system, so as to avoid the city falling into the trap of “Matthew effect” [
47]. Different from the middle and upper reaches, the lower reaches continue to maintain the leading position of green development and are high-value agglomeration areas with both capacity and coordination level. The downstream region is a river basin economic system and has the characteristics of strong industrial foundation, high-end talent gathering and advanced science and technology. Therefore, the region should give full play to its leading role as an economic green development demonstration area and take advantage of its existing superiorities to actively promote regional industrial transformation and upgrading and put forward an economic green development scheme that can be copied and used for reference for the middle and upper reaches.
The important node city is the key individual under the goal of coordination. Such cities are basically provincial capitals or municipalities directly under the central government, play a leading role in the river basin. However, the research results show that some key cities have insufficient leadership or significant polarization characteristics. Chongqing, Nanchang and Hefei are the last three cities in the comprehensive level among the important node cities. Among them, Nanchang and Hefei do not have advantages at the provincial level. Therefore, these three important node cities focus on cultivating their own strength in the near future. While ensuring the city’s own strength, Chengdu should address the short board of the development of neighboring cities in the near future, focusing on giving play to the leading role of radiation. Other key cities, including Guiyang, Kunming, Wuhan, Changsha, Shanghai, Hangzhou, Nanjing, Suzhou, Wuxi and Ningbo, should follow the individual characteristics of cities, dynamically evaluate and supplement their weaknesses, and selectively give full play to their advantageous fields to drive neighboring cities.
These findings provide important implications for the dedicated practical action of the YREB and other similar regions worldwide. The main purposes of this study are: (1) constructing the green development evaluation index system to measure the ability level and coordination level at the same time, and closing the gap in neglecting the influence of external space in the current research.; (2) identifying the spatio-temporal characteristics of YREB, and exploring the spatial effect of neighborhood background on cities; (3) providing a new analytical perspective for the formation of regional difference pattern and put forward different strategies. This paper breaks through the limits in the existing green development evaluation, and creatively constructs a multi-dimensional evaluation framework of “capability + coordination + synthesis” around the goal of synchronous and coordinated development in multiple fields. On the other hand, it makes up for the limitations of paying attention to provincial level, focusing on cross-sectional data and lack of spatial analysis in the existing green development research of the YREB, using panel data to evaluate and analyze the spatio-temporal characteristics of all spatial units, this more comprehensive and dynamic exploration is conducive to a profound understanding of the green development characteristics of the YREB.
6. Conclusions
This paper advances the existing green development evaluation framework and then measures the green development comprehensive level of 126 spatial units in YREB from 2008 to 2017. Further, the paper analyzes the spatial-temporal dynamic pattern of urban green development comprehensive level in YREB by Markov chain method. The main conclusions are as follows:
- (1)
Urban green development comprehensive level in YREB is characterized by convergence, and the convergence phenomenon is more prominent in very-high-level cities, with low-level cities gradually developing from low to high level. The level distribution pattern is changing from double peaks to a single peak. In the long run, the green development of YREB will follow a progressive development model, the number of cities in VH and H classes will increase significantly, but there still are very few cities that remain in L and VL classes.
- (2)
The urban green development level of YREB has shown obvious spatial heterogeneity. In general, the density of high-value cities is decreasing from east to west. The lower reaches show high-value agglomeration, the middle reaches are second only to the lower reaches, and its growth rate is rapid, while the upper reaches show low-level agglomeration.
- (3)
The transition of club convergence is significantly influenced by neighbor background. When the neighborhood class is higher, it usually has radiation driving effect, and when the neighborhood class is lower, it is easy to produce inhibition effect, and when it is one class different from the urban spatial unit, the blocking effect is largest. Comparing to other cities, the cities in VH class are less influenced by the neighborhood. However, in recent years, the negative effect that they are facing from the neighborhood in H class has increased. In addition, the cities in the upper reaches of YREB has a weaker association with their neighboring cities compared with the middle and lower reaches, which is an important cause for being a low-lying area continuously.
Overall, the YREB is undergoing a transformation to step into the greener development path. However, the problem of unbalanced regional development persists in a long time, and the cities with low green development level still have great potential to improve showed by the long-term evolution trend. Urban green development should fully consider the spatial correlation characteristics within the region, and the positive spillover effects between adjacent cities should be strengthened and the negative spillover effects should avoid or alleviate. For instance, a full-cost price system of natural resources should be established in the resource reallocation to stimulate the city’s consciousness of cost reimbursement for excessive consumption of resources. Hence, the resource squeezing effect on surrounding areas produced by the cities with high resource scarcity can be reduced. In terms of industrial transfer, the industrial-undertaking cities are supposed to increase the threshold of environmental regulation to avoid the dispersal of pollution with the industrial transfer. Inter-city cooperation of industrial parks and enterprise can be strengthened to give full play to the positive role of leading cities, thereby promoting regional economic synergistic development. From the perspective of shunting domain segment, great effort must be made to promote the flow of factors between cities in the upper reaches, especially in regional economic and social system. Meanwhile, the upper reaches should foster new areas of growth based on the related planning and upgrade the green development level of cities in the main development axis so as to promote the growth of neighboring cities.
In this research, to ensure the consistency of time and space dimensions, some indicators are not included in the index system, such as per capita cultivated land area in resource system, surface water quality compliance ratio in environmental system and so on. The spatial effect different classes of neighborhood background on cities is analyzed, but whether there are differences in the spatial effect of different regions is still worth further study. This paper lacks attention to the coupling relationship between urban scale, urban nature and green development level, such as whether there is an optimal population model under the restriction of green development. Furthermore, due to the complex interaction relationship between various elements of the system, a more in-depth and quantitative study on the interaction mechanism of all elements can be carried out in the follow-up to explore the specific changes of the whole system under the change of a certain element, which will help to realize the synchronous improvement of capability level and coordination level through more accurate element investment.
Author Contributions
Conceptualization, C.P.; methodology, S.C.; formal analysis, S.C.; writing—original draft preparation, S.C.; writing—review and editing, M.Z.; visualization, P.C.; supervision, M.Z.; funding acquisition, C.P. All authors have read and agreed to the published version of the manuscript.
Funding
This research was funded by the Fundamental Research Funds for the Central Universities (No: 2019WKZDJC010).
Institutional Review Board Statement
Not applicable.
Informed Consent Statement
Not applicable.
Data Availability Statement
Some or all data, models, or code that support the findings of this study are available from the corresponding author upon reasonable request.
Acknowledgments
We gratefully acknowledge the support of the Fundamental Research Funds for the Central Universities (No: 2019WKZDJC010).
Conflicts of Interest
The authors declare no conflict of interest.
Notes
| 1 | All statistical data on the YREB is from the Network of the Development of the Yangtze River Economic Belt ( http://cjjjd.ndrc.gov.cn/, accessed on 1 December 2022), which is built and managed by Office of the Leading Group for Promoting the Development of the YREB. |
| 2 | The main data sources of this study are China Urban Statistical Yearbook, China Urban Construction Statistical Yearbook and China Regional Economic Statistical Yearbook. The data required for the number of patents applications, forest coverage and air quality excellence rate are from the statistical bulletin of national economic and social development of cities and prefectures China’s environmental statistical yearbook and the environmental quality bulletin of each province are obtained. The water resources data are from the water resources bulletin of each province, and some urban data are supplemented according to the statistical yearbooks of each city. For the missing data, the mean method and linear interpolation method are adopted according to the data distribution characteristics. |
References
- Pearce, D.; Markandya, A.; Barbier, E. Blueprint for a Green Economy; Earthscan: London, UK, 1989. [Google Scholar]
- Yang, C.; Zeng, W.; Yang, X. Coupling coordination evaluation and sustainable development pattern of geo-ecological environment and urbanization in Chongqing municipality, China. Sustain. Cities Soc. 2020, 61, 102271. [Google Scholar] [CrossRef]
- United Nations Environment Programme. Green Economy: Developing Country Success Stories; UNEP: Nairobi, Kenya, 2010. [Google Scholar]
- Wang, M.-X.; Zhao, H.-H.; Cui, J.-X.; Fan, D.; Lv, B.; Wang, G.; Li, Z.-H.; Zhou, G. Evaluating green development level of nine cities within the Pearl River Delta, China. J. Clean. Prod. 2018, 174, 315–323. [Google Scholar] [CrossRef]
- Wang, H.; Gao, S. Germination, starting and policy evolution of green development in China: Observation of some stage characteristics. Reform 2016, 3, 6–26. [Google Scholar]
- Zheng, H. A research review on green development indicator system. J. Ind. Technol. Econ. 2013, 33, 142–152. [Google Scholar]
- Guo, F.; Tong, L.; Xu, L.; Lu, X.; Sheng, Y. Spatio-temporal pattern evolution and spatial spillover effect of green development efficiency: Evidence from Shandong Province, China. Growth Chang. 2020, 51, 382–401. [Google Scholar] [CrossRef]
- Yuan, H.; Zhang, T.; Feng, Y.; Liu, Y.; Ye, X. Does financial agglomeration promote the green development in China? A spatial spillover perspective. J. Clean. Prod. 2019, 237, 117808. [Google Scholar] [CrossRef]
- Zhang, H.; Geng, Z.; Yin, R.; Zhang, W. Regional differences and convergence tendency of green development competitiveness in China. J. Clean. Prod. 2020, 254, 119922. [Google Scholar] [CrossRef]
- Wu, H.; Li, Y.; Hao, Y.; Ren, S. Environmental decentralization, local government competition, and regional green development: Evidence from China. Sci. Total Environ. 2020, 708, 135085. [Google Scholar] [CrossRef] [PubMed]
- Zhu, B.; Zhang, M.; Zhou, Y.; Wang, P.; Sheng, J.; He, K.; Wei, Y.-M.; Xie, R. Exploring the effect of industrial structure adjustment on interprovincial green development efficiency in China: A novel integrated approach. Energy Policy 2019, 134, 110946. [Google Scholar] [CrossRef]
- Hou, D.; Li, G.; Chen, D.; Zhu, B.; Hu, S. Evaluation and analysis on the green development of China’s industrial parks using the long-tail effect model. J. Environ. Manag. 2019, 248, 109288. [Google Scholar] [CrossRef]
- Yuan, Q.; Yang, D.; Yang, F.; Luken, R.; Saieed, A.; Wang, K. Green industry development in China: An index based assessment from perspectives of both current performance and historical effort. J. Clean. Prod. 2020, 250, 119457. [Google Scholar] [CrossRef]
- Zhang, J.; Zhang, L.; Wang, S.; Fan, F. Study on regional sustainable development efficiency measurement and influencing factors: Based on DPSIR-DEA Model. China Popul. Resour. Environ. 2017, 27, 1–9. [Google Scholar]
- Yang, Y.; Huang, P. Has the level of green development in the northwestern provinces of China truly improved? A case study of Shaanxi. Sustain. Cities Soc. 2019, 51, 101779. [Google Scholar] [CrossRef]
- Cheng, C.; Ge, C. Green development assessment for countries along the belt and road. J. Environ. Manag. 2020, 263, 110344. [Google Scholar]
- Fang, G.; Wang, Q.; Tian, L. Green development of Yangtze River Delta in China under population-resources-environment-development-satisfaction perspective. Sci. Total Environ. 2020, 727, 138710. [Google Scholar] [CrossRef] [PubMed]
- Huang, Y.; Li, L. A comprehensive assessment of green development and its spatial-temporal evolution in urban agglomerations of China. Geogr. Res. 2017, 36, 1309–1322. [Google Scholar]
- Zhao, X.; Wu, D.; Zeng, Y. Research for green development assessment based on the characteristics of regional development stage: Taking the 21 cities in Guangdong as an example. South China J. Econ. 2018, 342, 45–57. [Google Scholar]
- Ren, J.; Ma, Y. Green development level and the obstacle factors of old industrial base in northeast China. Sci. Geogr. Sin. 2018, 38, 1042–1050. [Google Scholar]
- Sun, C.; Tong, Y.; Zou, W. The evolution and a temporal-spatial difference analysis of green development in China. Sustain. Cities Soc. 2018, 41, 52–61. [Google Scholar] [CrossRef]
- Wang, Y.; Li, H.; Hai, H. Analysis of spatial pattern and evolution characteristics of provincial green development in China. China Popul. Resour. Environ. 2018, 28, 96–104. [Google Scholar]
- Torres Preciado, V.H.; Polanco Gaytan, M.; Tinoco Zermeno, M.A. Dynamic of foreign direct investmen in the states of Mexico: An analysis of Markov’s spatial chains. Contaduría Adm. 2017, 62, 163–183. [Google Scholar] [CrossRef] [Green Version]
- Maza, A.; Hierro, M.; Villaverde, J. Income distribution dynamics across European regions: Re-examining the role of space. Econ. Model 2012, 29, 2632–2640. [Google Scholar] [CrossRef]
- Chuanqing, W.; Lei, H. Evolution Track, Performance Evaluation and Green Development of Urban Agglomerations in the Middle Reaches of the Yangtze River. Reform 2017, 26, 65–77. [Google Scholar]
- Ruzi, L.; Yaobin, L.; Wengang, W.; Dongqi, S. Spatial-temporal Evolution of Green Total Factor Productivity and Identification of Area Problems in the Yangtze River Economic Belt. Sci. Geogr. Sin. 2018, 38, 1475–1482. [Google Scholar]
- Shi, B.; Yang, H.; Wang, J.; Zhao, J. City green economy evaluation: Empirical evidence from 15 sub-provincial cities in China. Sustainability 2016, 8, 551. [Google Scholar] [CrossRef] [Green Version]
- Yang, Q.; Hu, F.; Chen, Y.; Zhang, X. Green Development Strategy and Advices for Yangtze River Economic Belt Based on Water-nomics Theroy. Environ. Prot. 2016, 44, 36–40. [Google Scholar]
- Du, Y. Protecting the eco-environment, and striving for the green development in the Yangtze river basin. Resour. Environ. Yangtze Basin 2016, 25, 171–179. [Google Scholar]
- Zhang, H.; Luo, C.; Cheng, J.; Wang, H. The level of green development and its spatial relationship in Hubei province. Econ. Geogr. 2016, 36, 158–165. [Google Scholar]
- Du, D.; Pang, Q.-H.; Wu, Y. Modern Comprehensive Evaluation Methods and Cases Selection; Tsinghua University Press: Beijing, China, 2008; Volume 54, pp. 86–110. [Google Scholar]
- Yang, Y.; Guo, H.; Chen, L.; Liu, X.; Gu, M.; Ke, X. Regional analysis of the green development level differences in Chinese mineral resource-based cities. Resour. Policy 2019, 61, 261–272. [Google Scholar] [CrossRef]
- Hou, M.; Yao, S. Measurement and temporal-spatial dynamic evolution of urban eco-efficiency in China. China Popul. Resour. Environ. 2018, 28, 13–21. [Google Scholar]
- Zhang, Z.; Li, Y. Coupling coordination and spatiotemporal dynamic evolution between urbanization and geological hazards–A case study from china. Sci. Total Environ. 2020, 728, 138825. [Google Scholar] [CrossRef] [PubMed]
- Jiang, L.; Bai, L.; Wu, Y. Coupling and Coordinating Degrees of Provincial Economy, Resources and Environment in China. J. Nat. Resour. 2017, 32, 788–799. [Google Scholar]
- Zhang, X.; Chen, S.; Liao, C.; Song, J. Spatial spillover effects of regional economic growth in Beijing-Tianjin-Hebei region. Geogr. Res. 2016, 35, 1753–1766. [Google Scholar]
- Du, Q.; Wu, M.; Xu, Y.; Lu, X.; Bai, L.; Yu, M. Club convergence and spatial distribution dynamics of carbon intensity in China’s construction industry. Nat. Hazards 2018, 94, 519–536. [Google Scholar] [CrossRef]
- Yuan, B.; Xiang, Q. Environmental regulation, industrial innovation and green development of Chinese manufacturing: Based on an extended CDM model. J. Clean. Prod. 2018, 176, 895–908. [Google Scholar] [CrossRef]
- Chen, Y.; Zhang, S.; Huang, D.; Li, B.-l.; Liu, J.; Liu, W.-J.; Ma, J.; Wang, F.; Wang, Y.; Wu, S.; et al. The development of China’s Yangtze River Economic Belt: How to make it in a green way. Sci. Bull. 2017, 62, 648–651. [Google Scholar] [CrossRef] [Green Version]
- Konstantina, L. Eco-development and environmental spatial planning. Fresenius Environ. Bull. 2017, 26, 1291–1300. [Google Scholar]
- Adams, B. Green Development: Environment and Sustainability in a Developing World; Routledge: London, UK, 2019; pp. 165–172. [Google Scholar]
- He, Y.; Pu, Y.; Wang, J.; Chen, G.; Ma, J. Spatial-temporal Dynamics of Industrial Structure with Markov Chains Approach in Sichuan Province. China Popul. Resour. Environ. 2011, 21, 68–75. [Google Scholar]
- Wang, Q.; Qu, J.; Wang, B.; Wang, P.; Yang, T. Green technology innovation development in China in 1990–2015. Sci. Total Environ. 2019, 696, 134008. [Google Scholar] [CrossRef] [PubMed]
- Hou, M.; Yao, S. Spatial-temporal evolution and trend prediction of agricultural eco-efficiency in China: 1978–2016. Acta Geogr. Sin. 2018, 73, 2168–2183. [Google Scholar]
- Chen, P.; Zhu, X. Regional convergence at county level in China. Sci. Geogr. Sin. 2013, 33, 1302–1308. [Google Scholar]
- Zhang, J.; Chang, Y.; Zhang, L.; Li, D. Do technological innovations promote urban green development?—A spatial econometric analysis of 105 cities in China. J. Clean. Prod. 2018, 182, 395–403. [Google Scholar] [CrossRef]
- Hu, A.G.; Zhou, S.J. Green development: Functional definition, mechanism analysis and development strategy. China Popul. Resour. Environ. 2014, 24, 14–20. [Google Scholar]
| Publisher’s Note: MDPI stays neutral with regard to jurisdictional claims in published maps and institutional affiliations. |
© 2022 by the authors. Licensee MDPI, Basel, Switzerland. This article is an open access article distributed under the terms and conditions of the Creative Commons Attribution (CC BY) license (https://creativecommons.org/licenses/by/4.0/).


