Article

Dynamic Landscapes in the UK Driven by Pressures from Energy Production and Forestry—Results of the CORINE Land Cover Map 2018

1
Centre for Landscape and Climate Research, School of Geography, Geology and Environment, University of Leicester, University Road, Leicester LE1 7RH, UK
2
Specto Natura, College Road, Impington, Cambridge CB24 9PL, UK
3
School of Geography, University of Nottingham, Sir Clive Granger Building, Nottingham NG7 2RD, UK
4
Department of Geography, School of Environment Education and Development, University of Manchester, Manchester M13 9PL, UK
5
Division of Agricultural and Environmental Sciences, School of Biosciences, University of Nottingham, Leicestershire LE12 5RD, UK
6
Centre for Environmental Health and Sustainability, University of Leicester, University Road, Leicester LE1 7RH, UK
7
National Centre for Earth Observation, University of Leicester, University Road, Leicester LE1 7RH, UK
*
Author to whom correspondence should be addressed.
Submission received: 14 December 2021 / Revised: 20 January 2022 / Accepted: 24 January 2022 / Published: 26 January 2022
(This article belongs to the Special Issue Land Use and Land Cover Mapping in a Changing World)

Abstract

:
The CORINE Land Cover (CLC) map was established in 1985 and is now one of the most widely used products from the Copernicus Land Monitoring Service. As the world’s longest consistent operational land cover monitoring product, CLC maps have been produced for reference years 1990, 2000, 2006, 2012 and now for 2018. This paper presents the results from the CLC2018 mapping project in the UK and analyses the results of the land cover status layer and the change layer from the period 2012–2018. It sets this change in context with the change results from the period 2006–2012 and finds that the rate of change between the subsequent CORINE land cover maps is continuing to increase. Changes mapped for the period 2012–2018 covered 76,032 ha greater than the change mapped between 2006 and 2012, an increase of 26% of mapped change. The area of changes mapped covered an area equivalent to 1.16% of the total land area of the UK. The number of different types of changes also continue to diversify; however, the dominance of rotational forestry is consistent with the previous map. The process of urban land take has been highlighted in the results between 2012 and 2018 and is a trend identified in previous iterations of the CLC inventories. The largest gain is in industrial or commercial units (an increase of 14.4%). This growth is mainly attributed to renewable energy infrastructure. As well as the descriptive analysis, the results have been analysed to identify the likely pressures being experienced on the land in the UK. Although the CLC mapping approach is consistent, there have been improvements to the input EO data used to map the changes. For 2018, the Copernicus Sentinel-2 system offered a consistent and reliable image source for the first time. This increased the spatial resolution of the source datasets to 10 m, allowing for more accurate identification of small features and those with fine spatial textures such as suburban, road networks and windfarms. We also look forward to the development of CLC+, the new generation of CORINE land mapping, and the improvements it could make.

1. Introduction

Over decadal time scales, land cover and land use in the UK have undergone significant changes as a result of multiple policy drivers, economic shifts and now, increasingly, environmental impacts. The primary policy drivers of change in the coming decade are the new Agriculture Bill that replaces the Common Agricultural Policy of the European Union in the UK after Brexit, and the Defra 25-year Environment Plan [1], with its ambitious goals for environmental improvements and the directive to achieve net zero carbon emissions by 2050 to address climate change. Global policy options towards climate-friendly and sustainable lifestyle changes that are being discussed include bans on advertising high-carbon foods, reducing food waste and prioritising the distribution of food to undernourished people [2]. If higher costs were placed on emissions-intensive foods such as beef and lamb, whilst encouraging fruit and vegetable consumption as a means to mitigate climate change, substantial land use changes would likely be the consequence. The impacts of climate change such as sea-level rise and the flooding caused by the increase in the intensity of storms are likely to see more land being handed over to mitigation schemes.
A recent policy report by the British House of Commons Committee on Climate Change concluded that land use in the UK must change to meet its net-zero greenhouse gas emissions target by 2050: “Fundamental change in the use of land across the UK is needed to maintain a strong agriculture sector that also delivers climate mitigation, adaptation and wider environmental objectives” [3]. The report sets out ambitions for a high uptake of low carbon farming practices and suggests releasing 22% of land out of traditional agricultural production for long-term carbon sequestration. Other policy drivers include the drive to stimulate housing supply, with a pledge of 300,000 new homes a year in The Housing White Paper [4]. Land use change on this scale is unprecedented in the UK since the operational monitoring of land cover and land use from satellites began. Monitoring of land cover and land use (LCLU) has been one of the major uses of new satellite data products, which have continued to increase in coverage, quality and accessibility in recent decades [5]. There are many approaches to the mapping of LULC change, with different methods suited to different contexts. Land cover and land use maps have been produced at a range of scales from local to continental levels to address particular requirements, political drivers and funding regimes, and as a baseline for simulations of future LULC change under different scenarios [6].
LULC change mapping is conventionally based on satellite images from two reference periods sufficiently separated in time to allow the changes to be identified reliably, given the constraints of the input data and the mapping approach. However, satellite data cannot always be captured at regular intervals due to weather conditions or technical issues such as variation in sensor orbits [7]. This has been a challenge within the remote sensing community since its inception, and as such there are numerous methods for interpolating missing images for planned timeseries for analysis while maintaining accurate results, such as pixel-based temporal composites [8] and spatiotemporal data fusion [9]. Frequent return periods of recent satellite missions such as the European Space Agency’s Sentinel satellites are valuable for addressing this challenge [10].
Automated methods for identifying and mapping LULC change are a large research focus, as the volume of geospatial data collected outstrips our capacity for manual interpretation and analysis [11], and as high-performance computing and machine learning methods become more advanced [12,13]. These approaches are highly suited to certain mapping applications, for example, where the focus is on land cover as opposed to land use, or there are a small number of highly contrasting classes in the mapping specification [9]. Complex classifications such as CORINE, which characterise land cover and land use using 44 classes in total, incorporate contextual information for interpretation of changes, for example, an awareness of the policy pressures discussed above, for which visual interpretation by skilled analysts remains unparalleled. Despite this, some elements of automation have been incorporated into the CORINE methodology [14].
The CORINE Land Cover (CLC) methodology was established in the mid-1980s and is now one of the most widely used products from the Copernicus Land Monitoring Service [15]. As the world’s longest consistent operational land cover monitoring product, CLC maps have been produced for reference years 1990, 2000, 2006, 2012 and now for 2018. This paper presents results from the CLC2018 mapping exercise in the UK and analyses the results of the land cover status layer with a 25 ha minimum mapping unit (MMU) and the change layers from 2006 to 2012 and 2012 to 2018 with a 5 ha MMU [16].
Over its long history, more than 870 publications have made use of the CLC data [17], and a large body of work has been summarised in [18]. CLC data have been used for research in geography, remote sensing, ecology, forestry, agriculture, engineering, optics and computer science [17], as well as for many operational applications in businesses and policy contexts. The CLC data addresses many common challenges identified in remote sensing of land cover, because it is free to access and comprises a long-standing data timeseries, covering a large, multiregional scope, with consistent methodology, data processing, validation and verification, the details for which are publicly available [19].
The CLC2018 is therefore a further step in delivering a powerful and rich time-series of landscape dynamics in Europe. The UK component thus provides an important stocktake of the primary land cover and land use types before all of the new drivers described above manifest themselves as landscape changes. There are some limitations in the CLC methodology, namely the spatial resolution [20] and some nomenclature definitions, for detailed assessment of the implementation of environmental objectives. However, there is huge value in the large-scale consistent mapping approach. Recent improvements in the use of higher resolution input data from Sentinel and future developments of CLC+ are addressing some of these limitations. This paper aims to present an assessment of the large-scale land cover and land use types in the UK in 2018, examine the primary changes since 2006, and their likely drivers, and analyse change patterns and land cover transitions quantitatively.

2. Methods

The CLC is now part of the Copernicus Land Monitoring Service (CLMS) and integrated within a portfolio of products that provide a range of spatial and temporal detail for thematic or biophysical properties for either selected hotspot locations or wall-to-wall coverage at a pan-European level. The CLC could be described as a classical parcel-based land cover map that covers the EEA-38 countries plus the UK. Selected products from the CLMS can be combined to produce further monitoring and assessment information that is beyond the capabilities of a single dataset. The CLMS is now producing the second generation of CLC, or CLC+, giving improved spatial detail and an advanced thematic data model, but it will still be able to generate the traditional CLC for long term monitoring purposes.
The CLC classes are defined in a 3-level hierarchical structure grouped into artificial surfaces, agricultural areas, forest and semi-natural areas, wetlands and water bodies at Level 1. The detailed class descriptions as set out in the nomenclature [21] were followed during the interpretation processes of this work. The status and changes in CLC are mapped based on the 44 individual classes at Level 3, but during reporting and analysis these can be aggregated up to 15 classes at Level 2, and just the 5 broad classes at Level 1. Table 1 shows an overview of the CLC class nomenclature. In this paper, we focus on the 44 classes at Level 3.
The production of CLC2018 in the UK followed the same production methodology as CLC2012, with some modifications and improvements. Following the technical guidelines set out by the European Environment Agency (EEA) [22], the method applied is the ‘change mapping approach’ based on the CLC2012 product and using visual interpretation of satellite imagery. The change mapping approach aims to map real land cover/land use change, representing the change process on the ground, and also technical changes (errors in CLC2012 that were missed during the 2012 update). This is achieved by interpreting change based on a comparison of multi-date satellite imagery with direct delineation of change polygons relative to the 2012 status map. This produces a CLC Change2012–2018 layer with an MMU of 5 ha. The process also produces a revised CLC2012 dataset (CLC2012revised) in which the technical changes are corrected. The CLC2018 status product is then produced by combining the CLC change2012–2018 polygons and the CLC2012revised polygons and is represented by the equation:
CLC2018 = CLC2012revised + CLC-Changes2012–2018
As the CLC2012revised and CLC2018 status layers are mapped at a 25 ha MMU and the change layer is mapped at 5 ha MMU after intersection and unification, any small polygons are generalised with their neighbours according to a priority table [23].
As a consequence of the two different MMUs between the CLC status layers and the change layer, ‘Technical change polygons’ are produced as auxiliary change polygons to avoid major inaccuracies in the CLC2018 database, but do not represent a real change in land cover/land use. These technical change polygons have been removed from the 2012–2018 change database for analysis in this paper.
There are some limitations to the current CLC methodology for monitoring the implementation of environmental interventions or the impact of land cover/land use change on climate change drivers. As the MMUs of 25 ha for the status layer map and 5 ha for the change layer map are considerably larger than some other monitoring and mapping in the UK, this can lead to different figures if compared directly between data sources (e.g., the natural capital accounts [24]). The differing results are not incorrect but caused by variations in scale and nomenclature. For example, the construction of renewable energy infrastructure is often captured in the CLC MMU, but does not always fill the land parcel, and the definition of the nomenclature translates this change to industrial development. Further analysis at a finer resolution would require additional field or land inventory data at a much higher spatial resolution. The improvements made by incorporating higher resolution input data, and the development of the CLC+ and the full integration of the CLMS data product suite, go a long way to improving these limitations. The power of the CLC time series of products is its length and the consistency of implementation so that multi-decadal landscape changes and trends of change are identified easily and reliably using these data

Input Data

The available satellite data for interpretation of changes between 2012 and 2018 consisted of two slightly different datasets. IMAGE2012, the imagery from the previous production, was reused and mainly consisted of images from 2011 through 2013 (a mixture of IRS-P6 LISS III, IRS-R2 LISS IV and RapidEye systems). IMAGE2018 consisted of images from 2017 only (aiming to document the situation at the beginning of the reference period) acquired by the European Copernicus Sentinel-2 satellites, with the US Landsat 8 satellite used for gap filling. The move to Sentinel-2 data as the input for the CLC2018 represents a big change in the ability to interpret land cover types and change as the spatial resolution is improved from approximately 25 m down to 10 m. This increase in spatial resolving power of over 6 enabled clearer identification of features. Furthermore, images were available within a shorter reference period due to the more frequent revisit of Sentinel-2 compared to other similar class systems.
Each set of image data contained images from two separate acquisition windows, coverage 1 and 2, preferably for the same year and with an optimum date difference of 6 weeks to allow for relative phenological change of different land covers to aid their discrimination (Table 2). The aim was to have at least two full coverages of the UK. However, due to cloud cover, it was necessary to select some images that only conformed to the minimum time difference of 4 weeks. The image availability in IMAGE2018 was greatly improved to that in IMAGE2012, where availability was limited and had to be combined over several years to piece together the coverage required [25]. In 2017, 64.6% of the UK had between 3 and 6 images available and only 10% was interpreted by a single image.
In-situ and online data was also used in the CLC2018 production in areas where satellite imagery was not sufficient for the interpretation of particular classes and/or changes. Examples include ordnance survey open data, the national forestry inventory and very-high spatial resolution satellite imagery. All data was open access and sourced online from commercial or government department websites. The satellite imagery can be viewed freely in Google Earth and greatly aided visual interpretation of IMAGE2012 and IMAGE2018.
The results presented in this paper are from a map representing the whole of the United Kingdom. The Channel Islands and Northern Ireland were reprojected from their native coordinate systems and stitched together with the UK data. The map has a 25 km buffer around the coastline to ensure all islands, estuaries, tidal flats and ports and harbours are included. The buffer is clipped to the border between Northern Ireland and the Republic of Ireland. The status layer statistics used in each set of results are the up-to-date revisions created during each production, i.e., CLC2018 and CLC2012revised for 2018 and CLC2012 and CLC2006revised for 2012. Class 523 (sea and ocean) has been removed from the statistics for the status layers to avoid skewing the results.

3. Analysis of the CORINE Land Cover Map
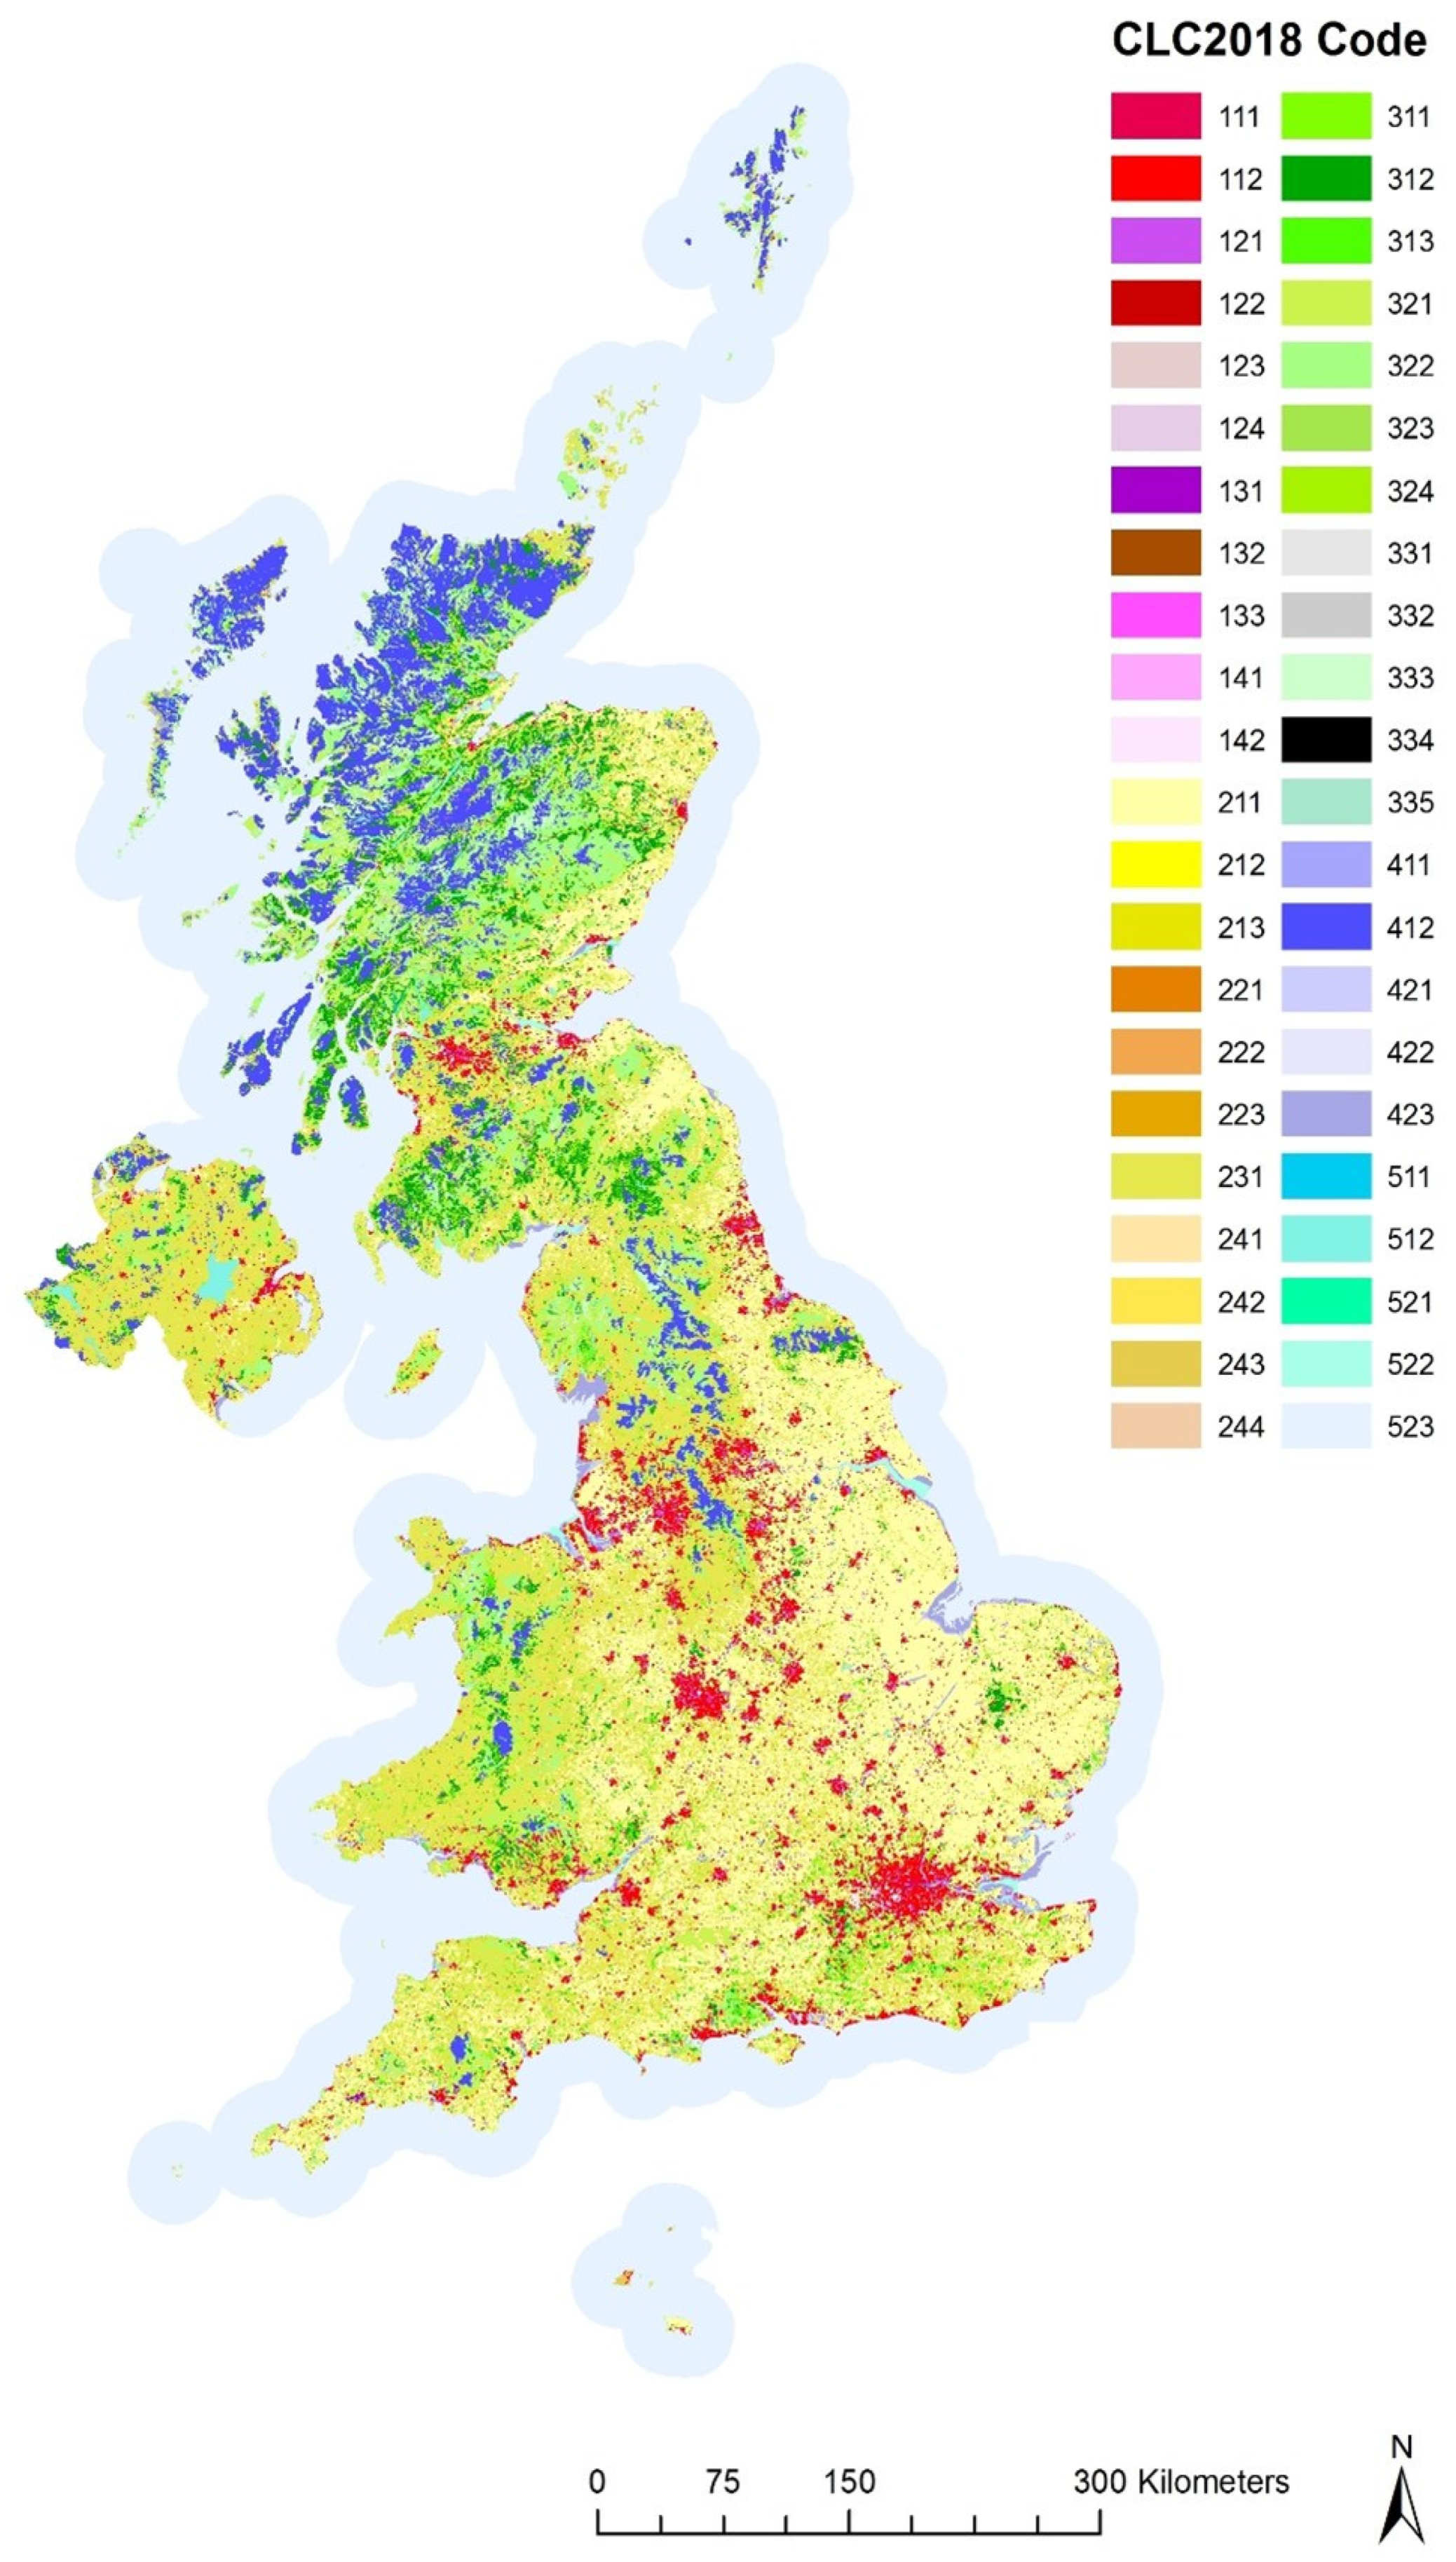
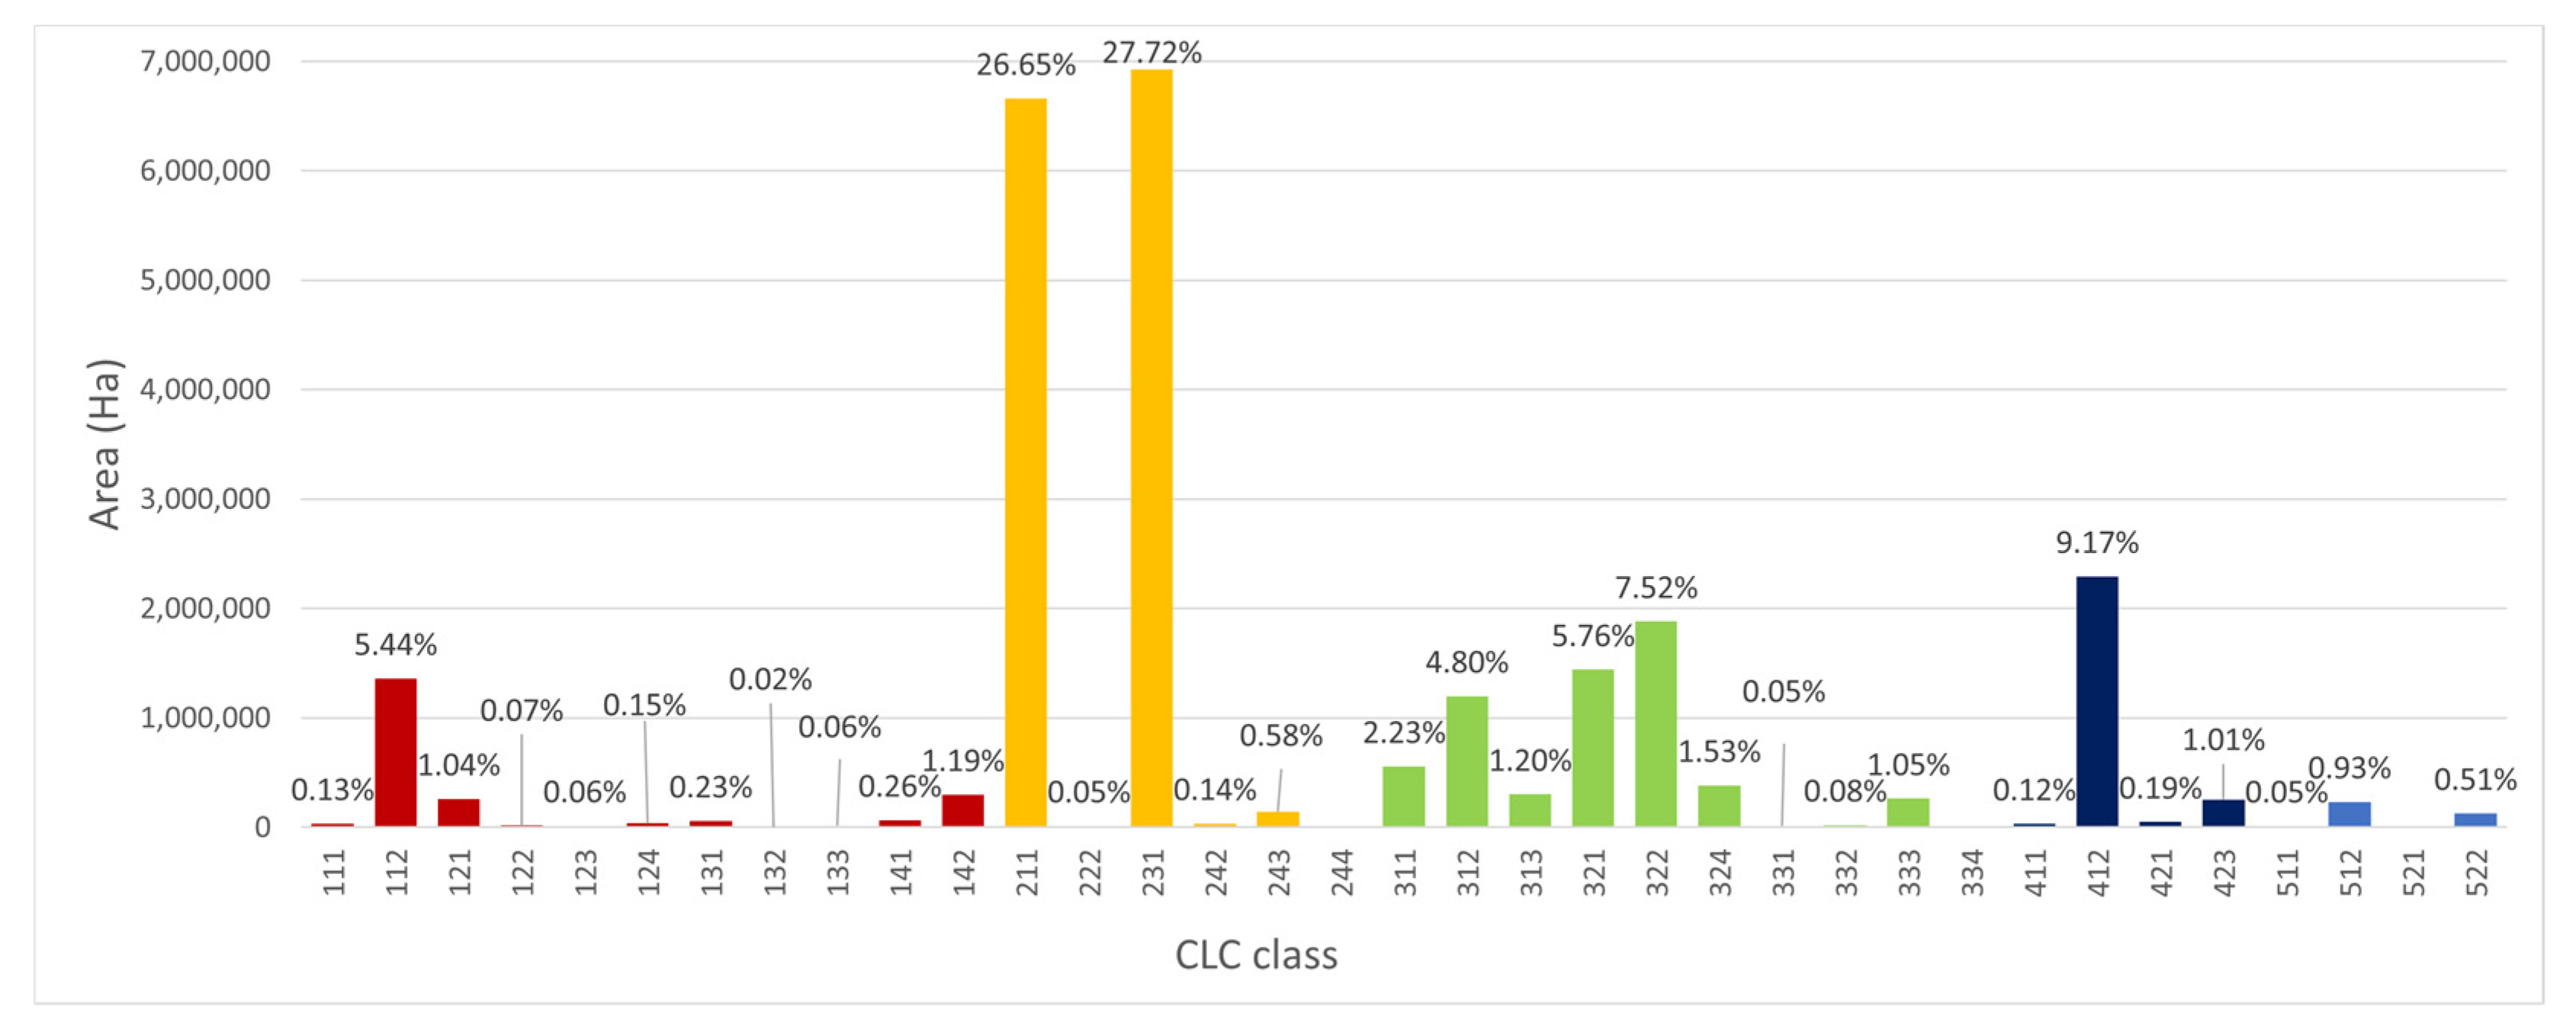
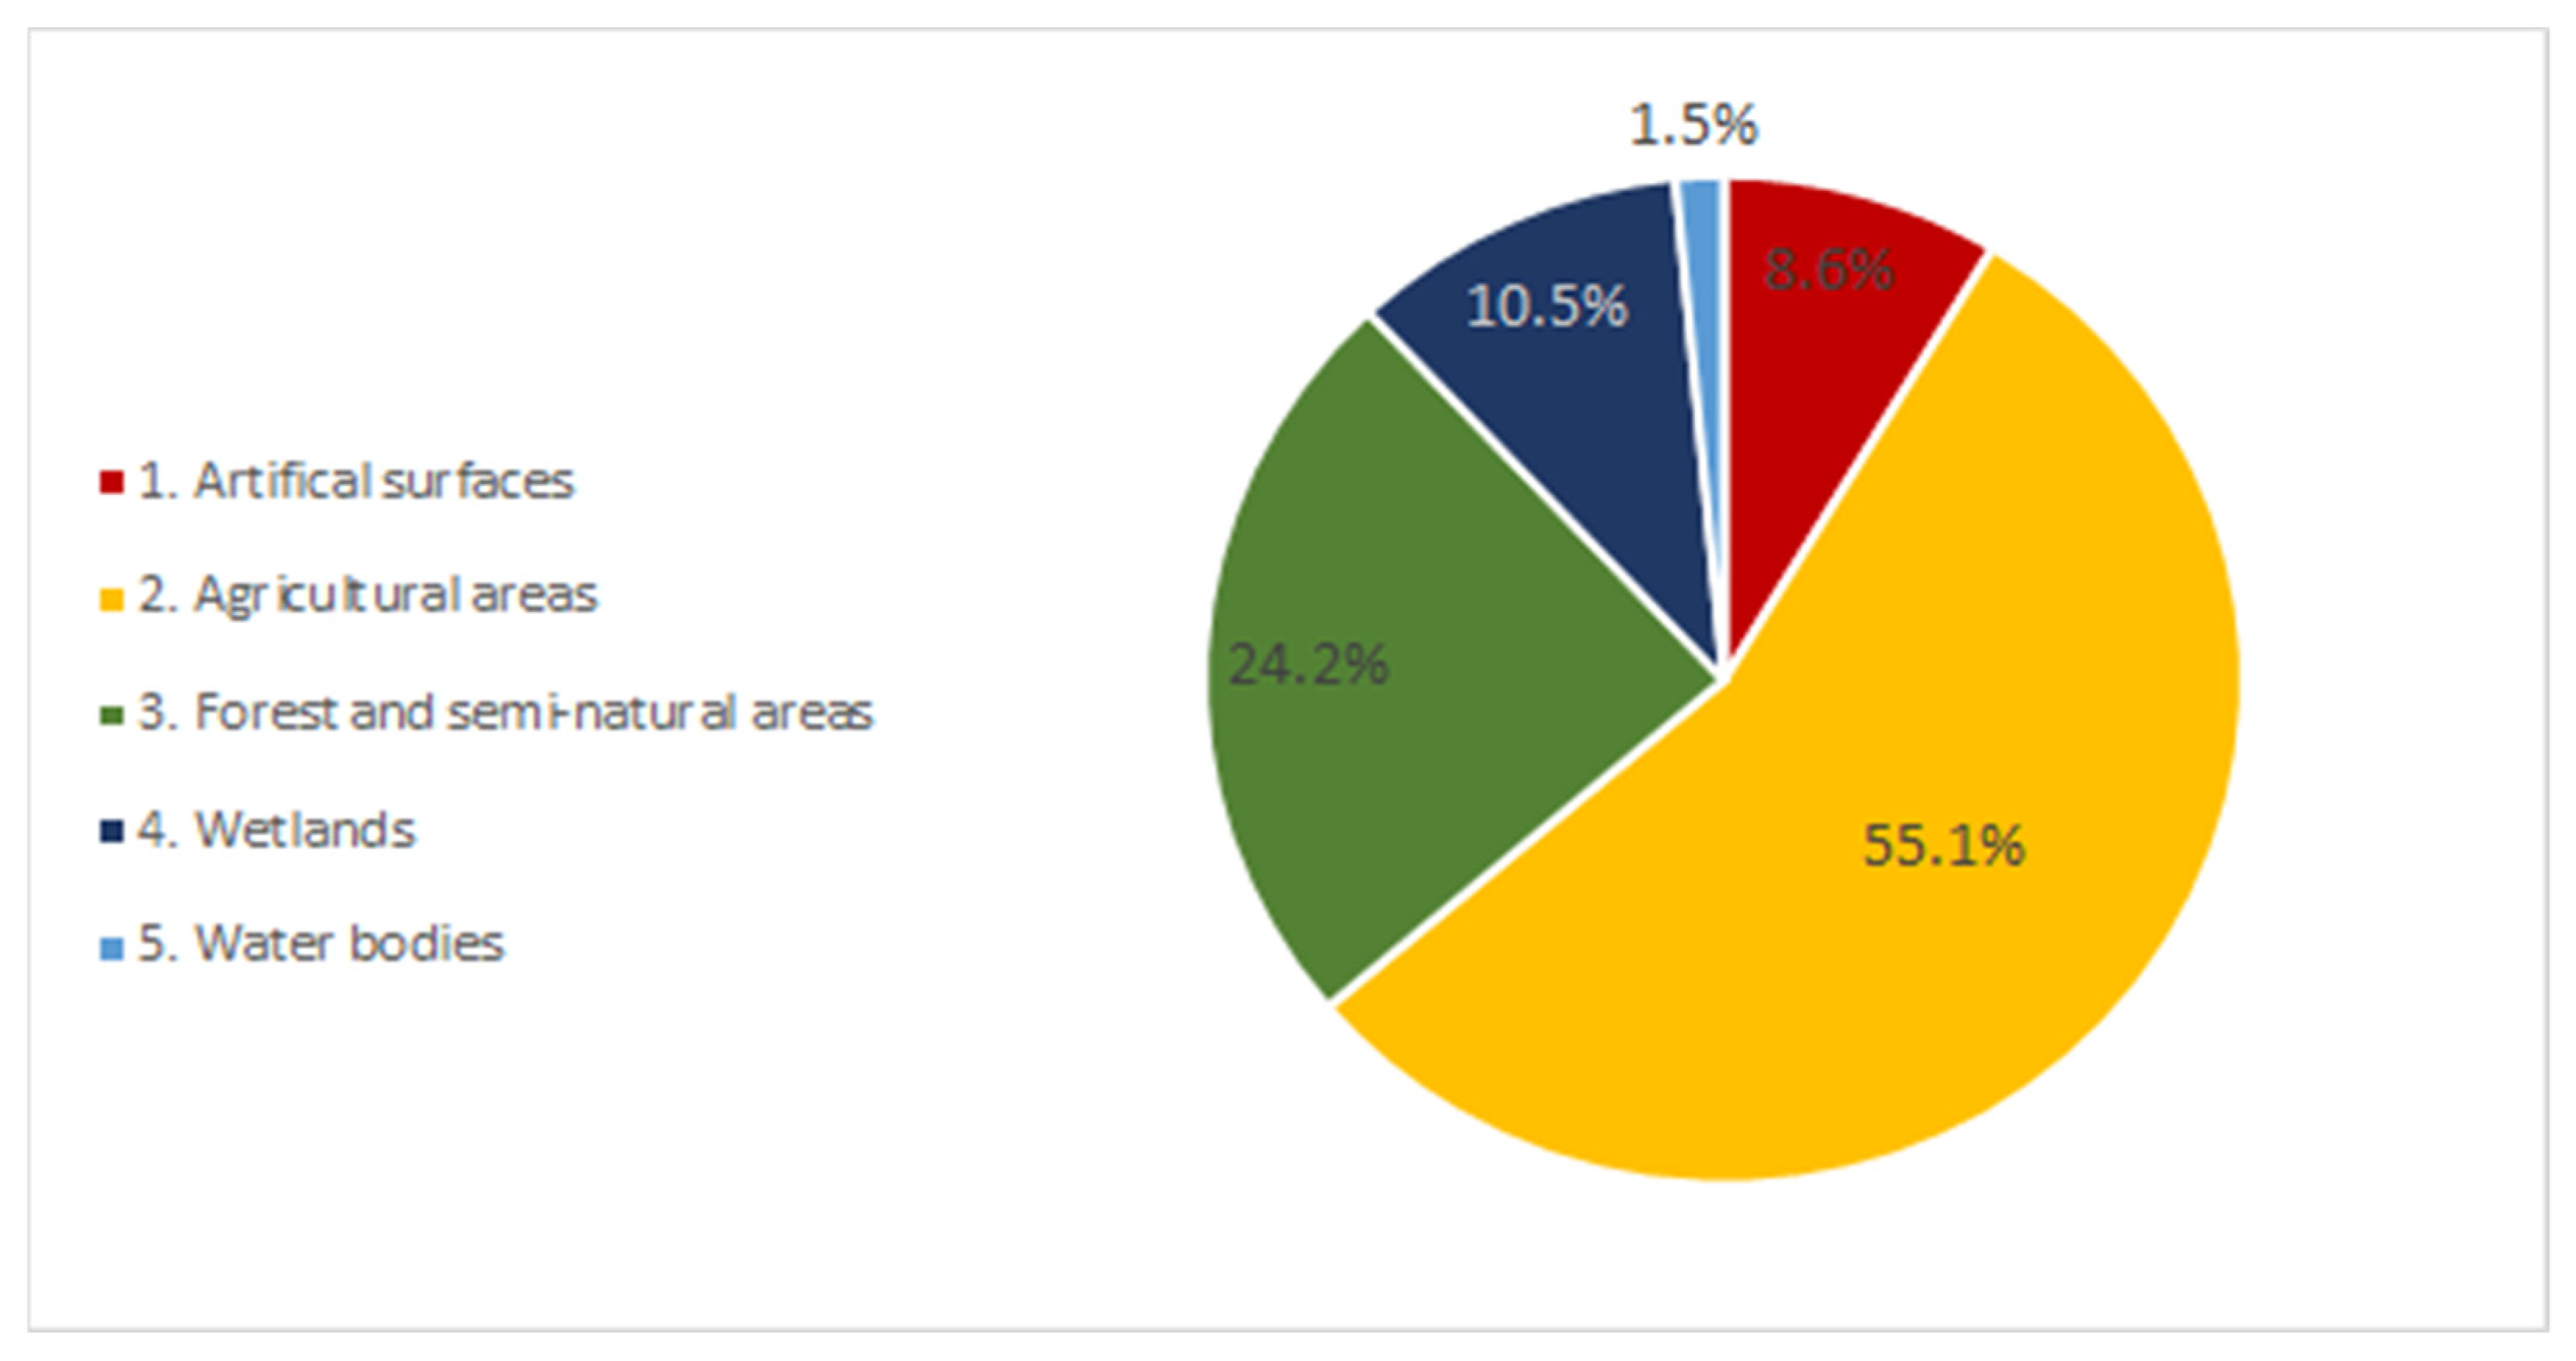
3.1. Status Layer

The UK CLC2018 status map is shown in Figure 1; it provides a comparable representation of the UK in the context of the EEA-38 countries, our immediate geographical neighbours. The CLC2018 map includes 36 of the 44 Level 3 classes in the CORINE nomenclature (Table 1); 8 classes were not present in the UK, such as olive groves and rice fields. The area covered by each class is shown in Figure 2; this has been aggregated up to Level 1 nomenclature to see the overall proportions of land cover types in Figure 3. Agriculture remains the most dominant land cover, accounting for 55% coverage of the UK. There is an approximately even split between 6,660,235 ha of non-irrigated arable land (211) and 6,926,447 ha of pasture (231), covering 26.7% and 27.7% of land, respectively. There is also an east-west split, with arable land predominantly occupying the east of the country and pastures in the west, due to environmental conditions. However, at a local scale, there is often a more complex mosaic between these classes due to topography, soils and farm management practices.
The second most dominant Level 1 class is forest and semi-natural areas, representing 24.2% of the territory. The natural vegetation classes 321 (natural grassland) and 322 (moors and heaths) account for the largest part of this, with 13.3% of the coverage. When the peatland class, 412, is added, which covers another 9.2%, the natural open moorland landscapes occupy nearly a quarter of the country, concentrated in the upland areas of Scotland, Wales and the Pennines. The forestry classes cover a combined area of 2,437,987 ha, or 9.8% of the country if you include class 324, transitional woodland scrub. This class can represent woodland degradation, forest regeneration or natural succession. It also includes clear cut areas in forests, regeneration areas in the transitional stage or regrowth lasting 5–8 years or until the trees reach 5 m in height [21]. In the UK, the majority of this class is attributed to the clear cut or regrowth of harvested coniferous woodland. There are 556,176 ha of broad-leaved forest, 1,198,586 ha of coniferous forest and 300,353 ha of mixed forest.
Artificial surfaces occupy 8.6% of the country and are widely distributed, with a greater density in the south. The majority of this class is made up of urban settlements, containing class 112 discontinuous urban fabric (5.4%) and 142 sport and leisure facilities (1.2%), which can be large areas of open land including, for example, golf courses. To put this into context, 83.4% of the UK population lived in urban areas in 2018 [26].

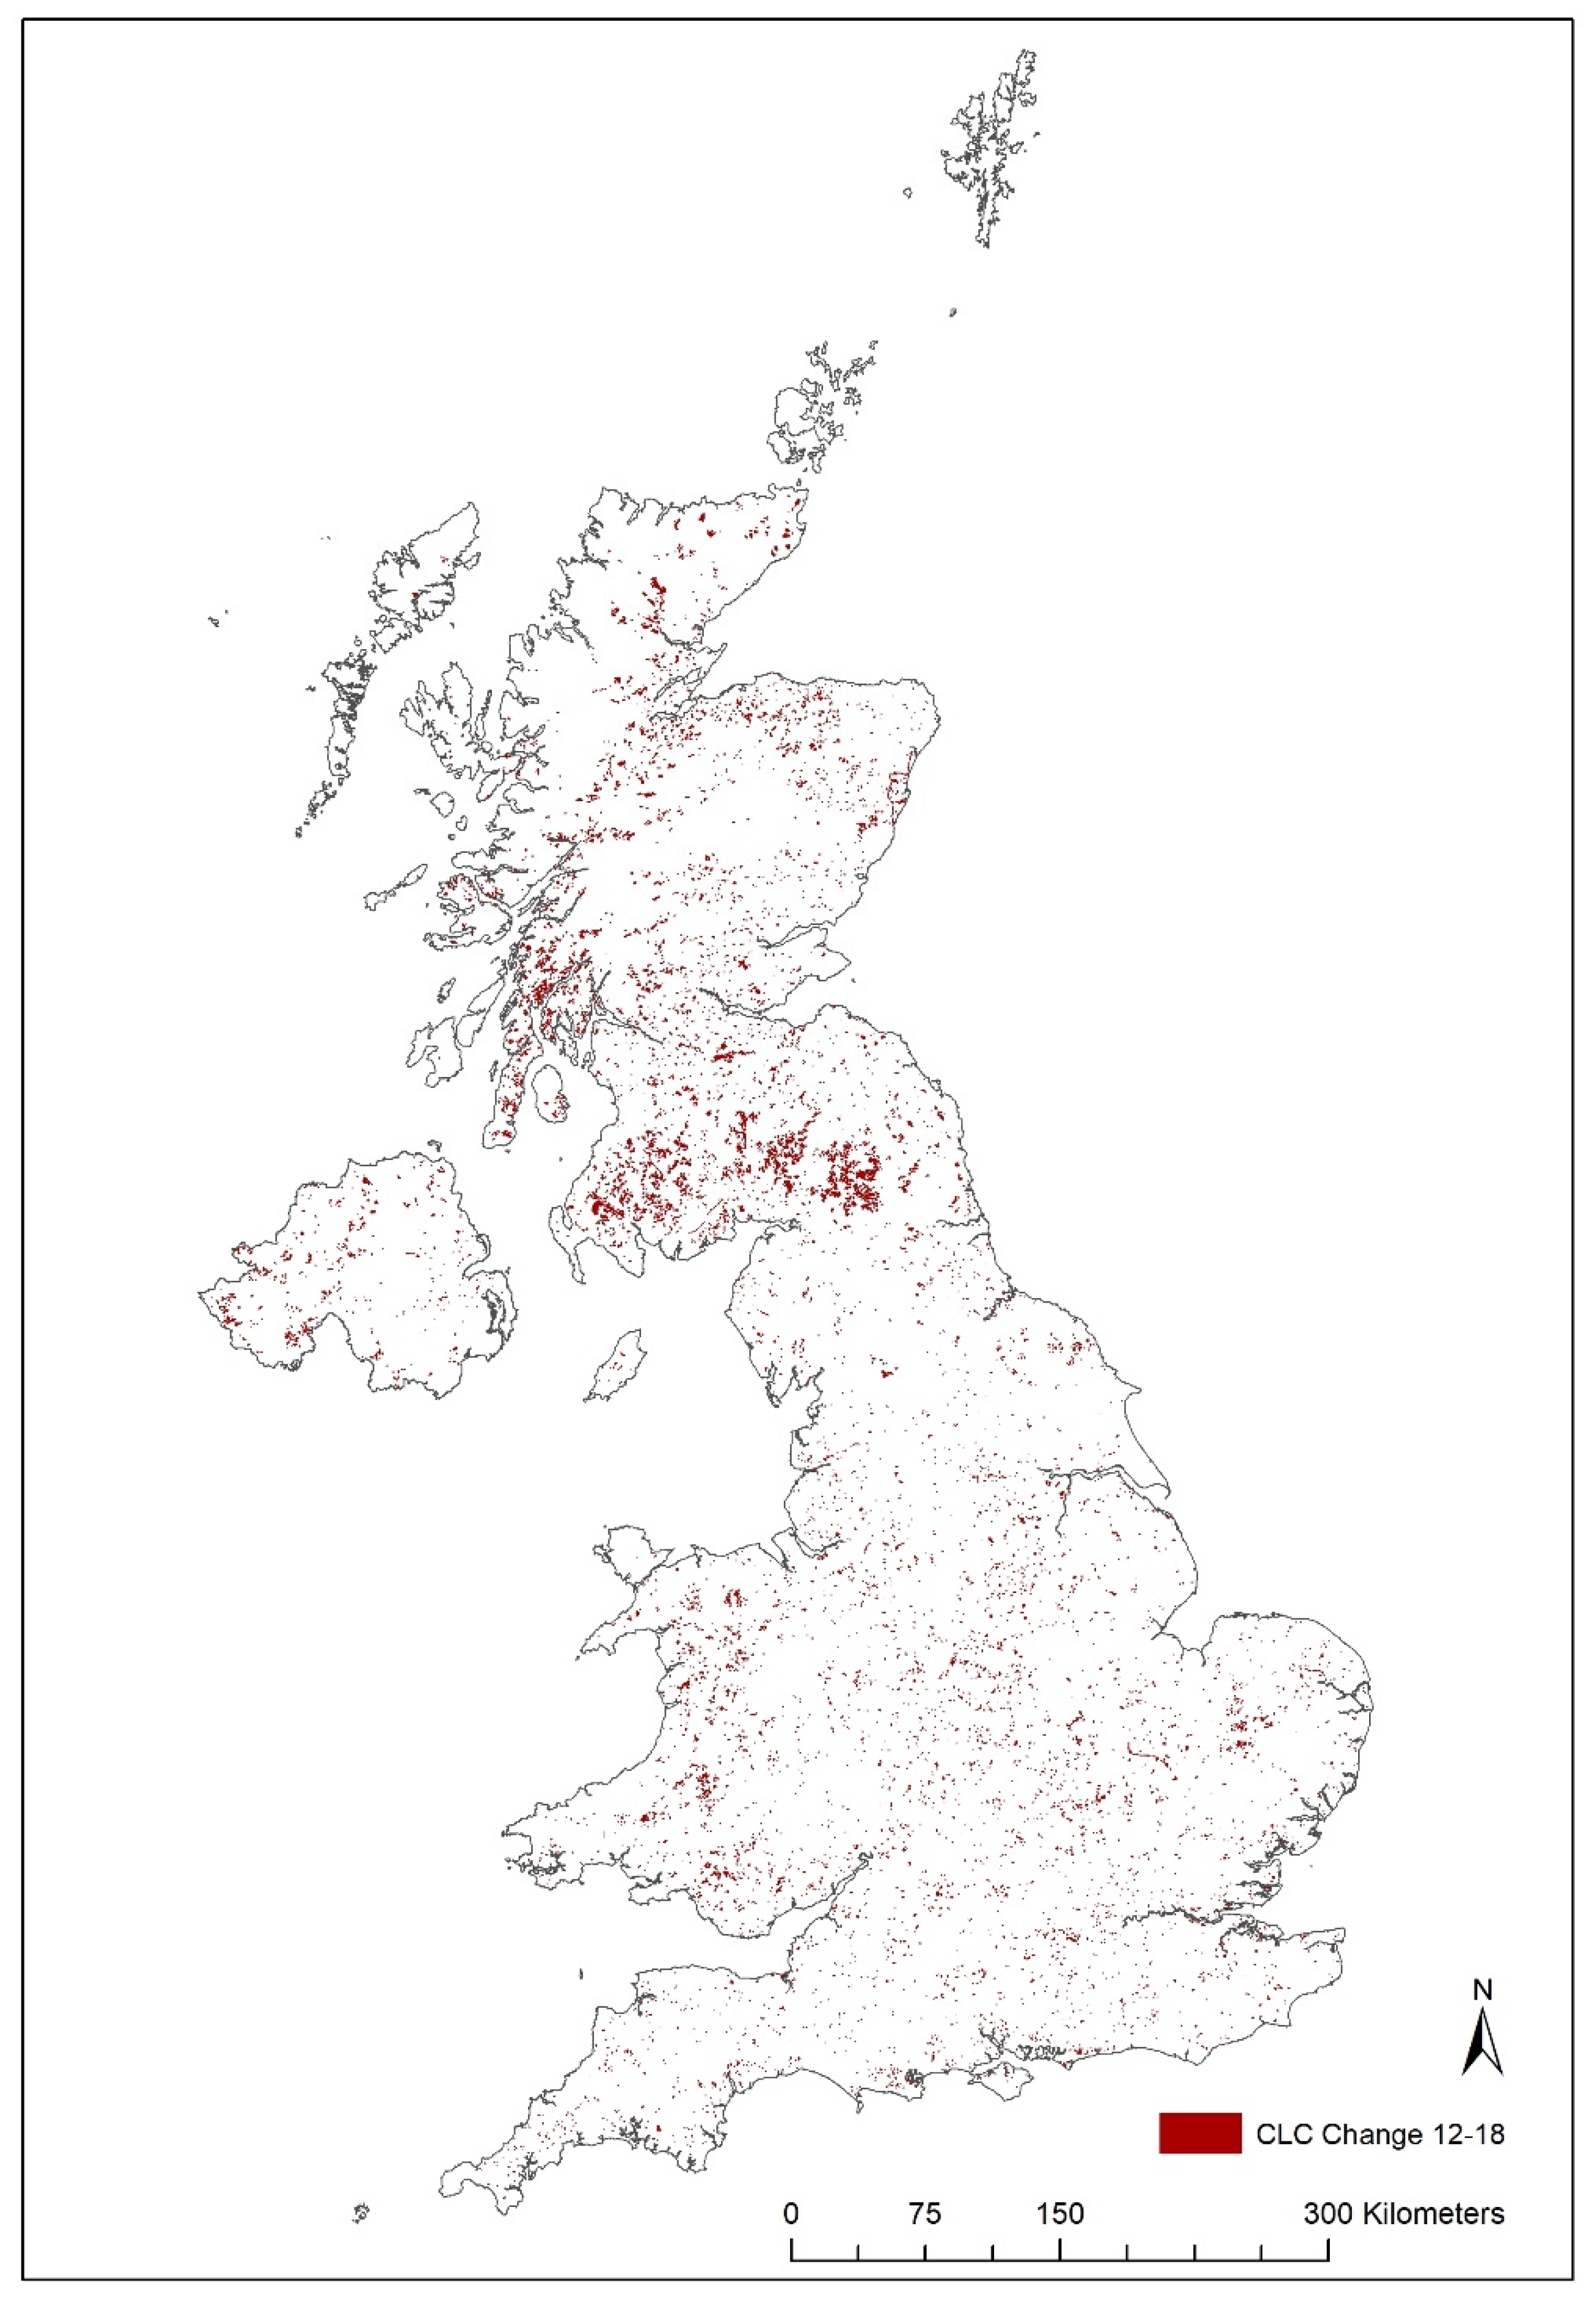
3.2. Main Land Cover/Land Use Changes between 2012 and 2018

The total area of land cover/land use changes between 2012 and 2018 amount to 290,368 ha, which corresponds to 1.16% of the total land area of the UK. Most of the changes occurred around the English–Scottish border, the southwest of Scotland and in Wales, and are predominantly related to forest management, i.e., clear-cutting and replanting of coniferous woodland. The spatial distribution of changes between 2012 and 2018 is similar to those detected from 2006 to 2012. The amount and the spatial distribution of changes between CLC classes are shown in Figure 4.
There were 205 different types of land cover/land use change in the CLC change layer during the period 2012–2018. The complete dataset of all changes at the national scale is summarised in the change matrix shown in Table S1 in the Supplementary Material. Table 3 shows a slimmed-down version, showing classes with over 1000 ha of change. The class transitions with the largest area of change between 2012 and 2018, which represents almost 90% of the area, are shown in Table 4.
The felling and planting of coniferous woodland (changes 312-324 and 324-312) accounted for the greatest amount of change; 62.7% to 64.4% of all change in the UK can be attributed to this driver of change (the uncertainty is introduced when considering the mixed wood class, 313). This forestry change was most common in Scotland, particularly focused around both sides of the Scottish Border with some occurring in Wales and other parts of England.
Seven of the top twenty changes are from a vegetated CLC class to industrial and commercial development (121). This type of change may initially seem unusual, but this change can, in some cases, be a predominantly land use rather than a land cover change. The majority of these areas were not completely denuded of vegetation but converted to a land use primarily aimed at renewable energy generation. New windfarm developments in vegetated areas necessitate access road building and small areas without vegetation in the immediate vicinity of the windfarm, but they generally leave the majority of the CLC polygon unchanged in terms of its land cover. However, because the primary land use changes from forestry or agriculture to energy generation, under the CLC technical guidelines, such alterations are mapped as a class change. The agricultural classes that changed from 2xx to industrial and commercial development (121) were often converted to solar energy farms (72%), while the forest and semi-natural classes in the uplands that changed to 121 were mainly converted to windfarm developments (92%). The agricultural classes changing to the industrial or commercial class covered 9241 ha, accounting for a combined 6.4% of all changes. This is an increase from previous CLC inventories [25] and can be mainly attributed to the increase in the number and scale of solar energy farm developments. The overall increase in the 121 industrial class is 33,562 ha, a greater increase than that of the urban fabric, class 112, with 11,896 ha. The net decrease of both the arable class by 29,404 ha and the pasture class by 14,363 ha represents a combined total of 15.1% of the total UK change.
Figure 5a shows the ten CLC classes with the largest amount of land use/land cover change between 2012 and 2018 in terms of change area in hectares, and Figure 5b shows the net change (gains and losses) for those classes. These ten classes showed over 2000 ha of changed area per class.
The artificial surfaces classes 111 (continuous urban fabric), 121 (industrial or commercial units) and 133 (construction sites) all gained more area than they lost, which is indicative of continued urban land take and in particular large housing developments and construction sites over 5 ha in area. Only class 131 (mineral extraction sites) showed a net decrease. More new construction site areas (133) were started than completed from 2012 to 2018.
The classes 211 (non-irrigated arable land) and 231 (pastures) both lost more in area than they gained. Urban expansion often occurs on former agricultural land around cities and towns in the UK, and also farmland has been given over to renewable energy supply. The advent of government solar incentives for farmland since 2010 [27] is likely to have contributed to this apparent industrial expansion.
More than twice as much land of class 312 (coniferous forest) in 2012 was lost than gained. Mirroring that change, class 324 (transitional woodland/shrub) gained approximately twice as much land as it lost over the 6 years. Transitions between these two classes are representative of typical rotation forestry practices in the UK, where mature forest stands are clear-cut and then replanted. Until the replanted forest stand is sufficiently established, the land is classed as transitional woodland/shrub in the CORINE nomenclature. What is significant about the change statistics between these two classes is that coniferous forest was harvested much faster than it was re-establishing on harvested land. Even though this does not change the primary land use of coniferous forest land, it does change the total coniferous forest cover and the carbon stock stored in UK forests. Wood production has increased across the UK since 1975 [28], although since 2014 it has reached a plateau (Figure 6a). The increase in wood production is driven mainly by softwood production. Since the Kyoto Protocol baseline year of 1990, new tree planting in the UK has declined, mainly because of a drop in conifer planting, due to the ending of the tax breaks that fuelled conifer planting in the 1970s and 1980s [29,30], which has not been compensated for by the increase in planting of deciduous trees (Figure 6b). We can see this in the CLC change data, with class 312 showing an overall loss of 76,018 ha (Figure 5).
Classes 322 (moors and heathland) and 412 (peat bogs) also lost more than they gained, which is concerning given that these land cover types are generally thought of as deserving and receiving, in many cases, protected status. The change that is occurring in these classes is mainly to 121 (industrial), which can be attributed to renewable energy and the building of windfarms. As discussed above, these occupy a smaller area than is often classified on the map because of the CLC minimum mapping width of 100 m, and that the surface provisions in windfarms still leave vegetated areas.

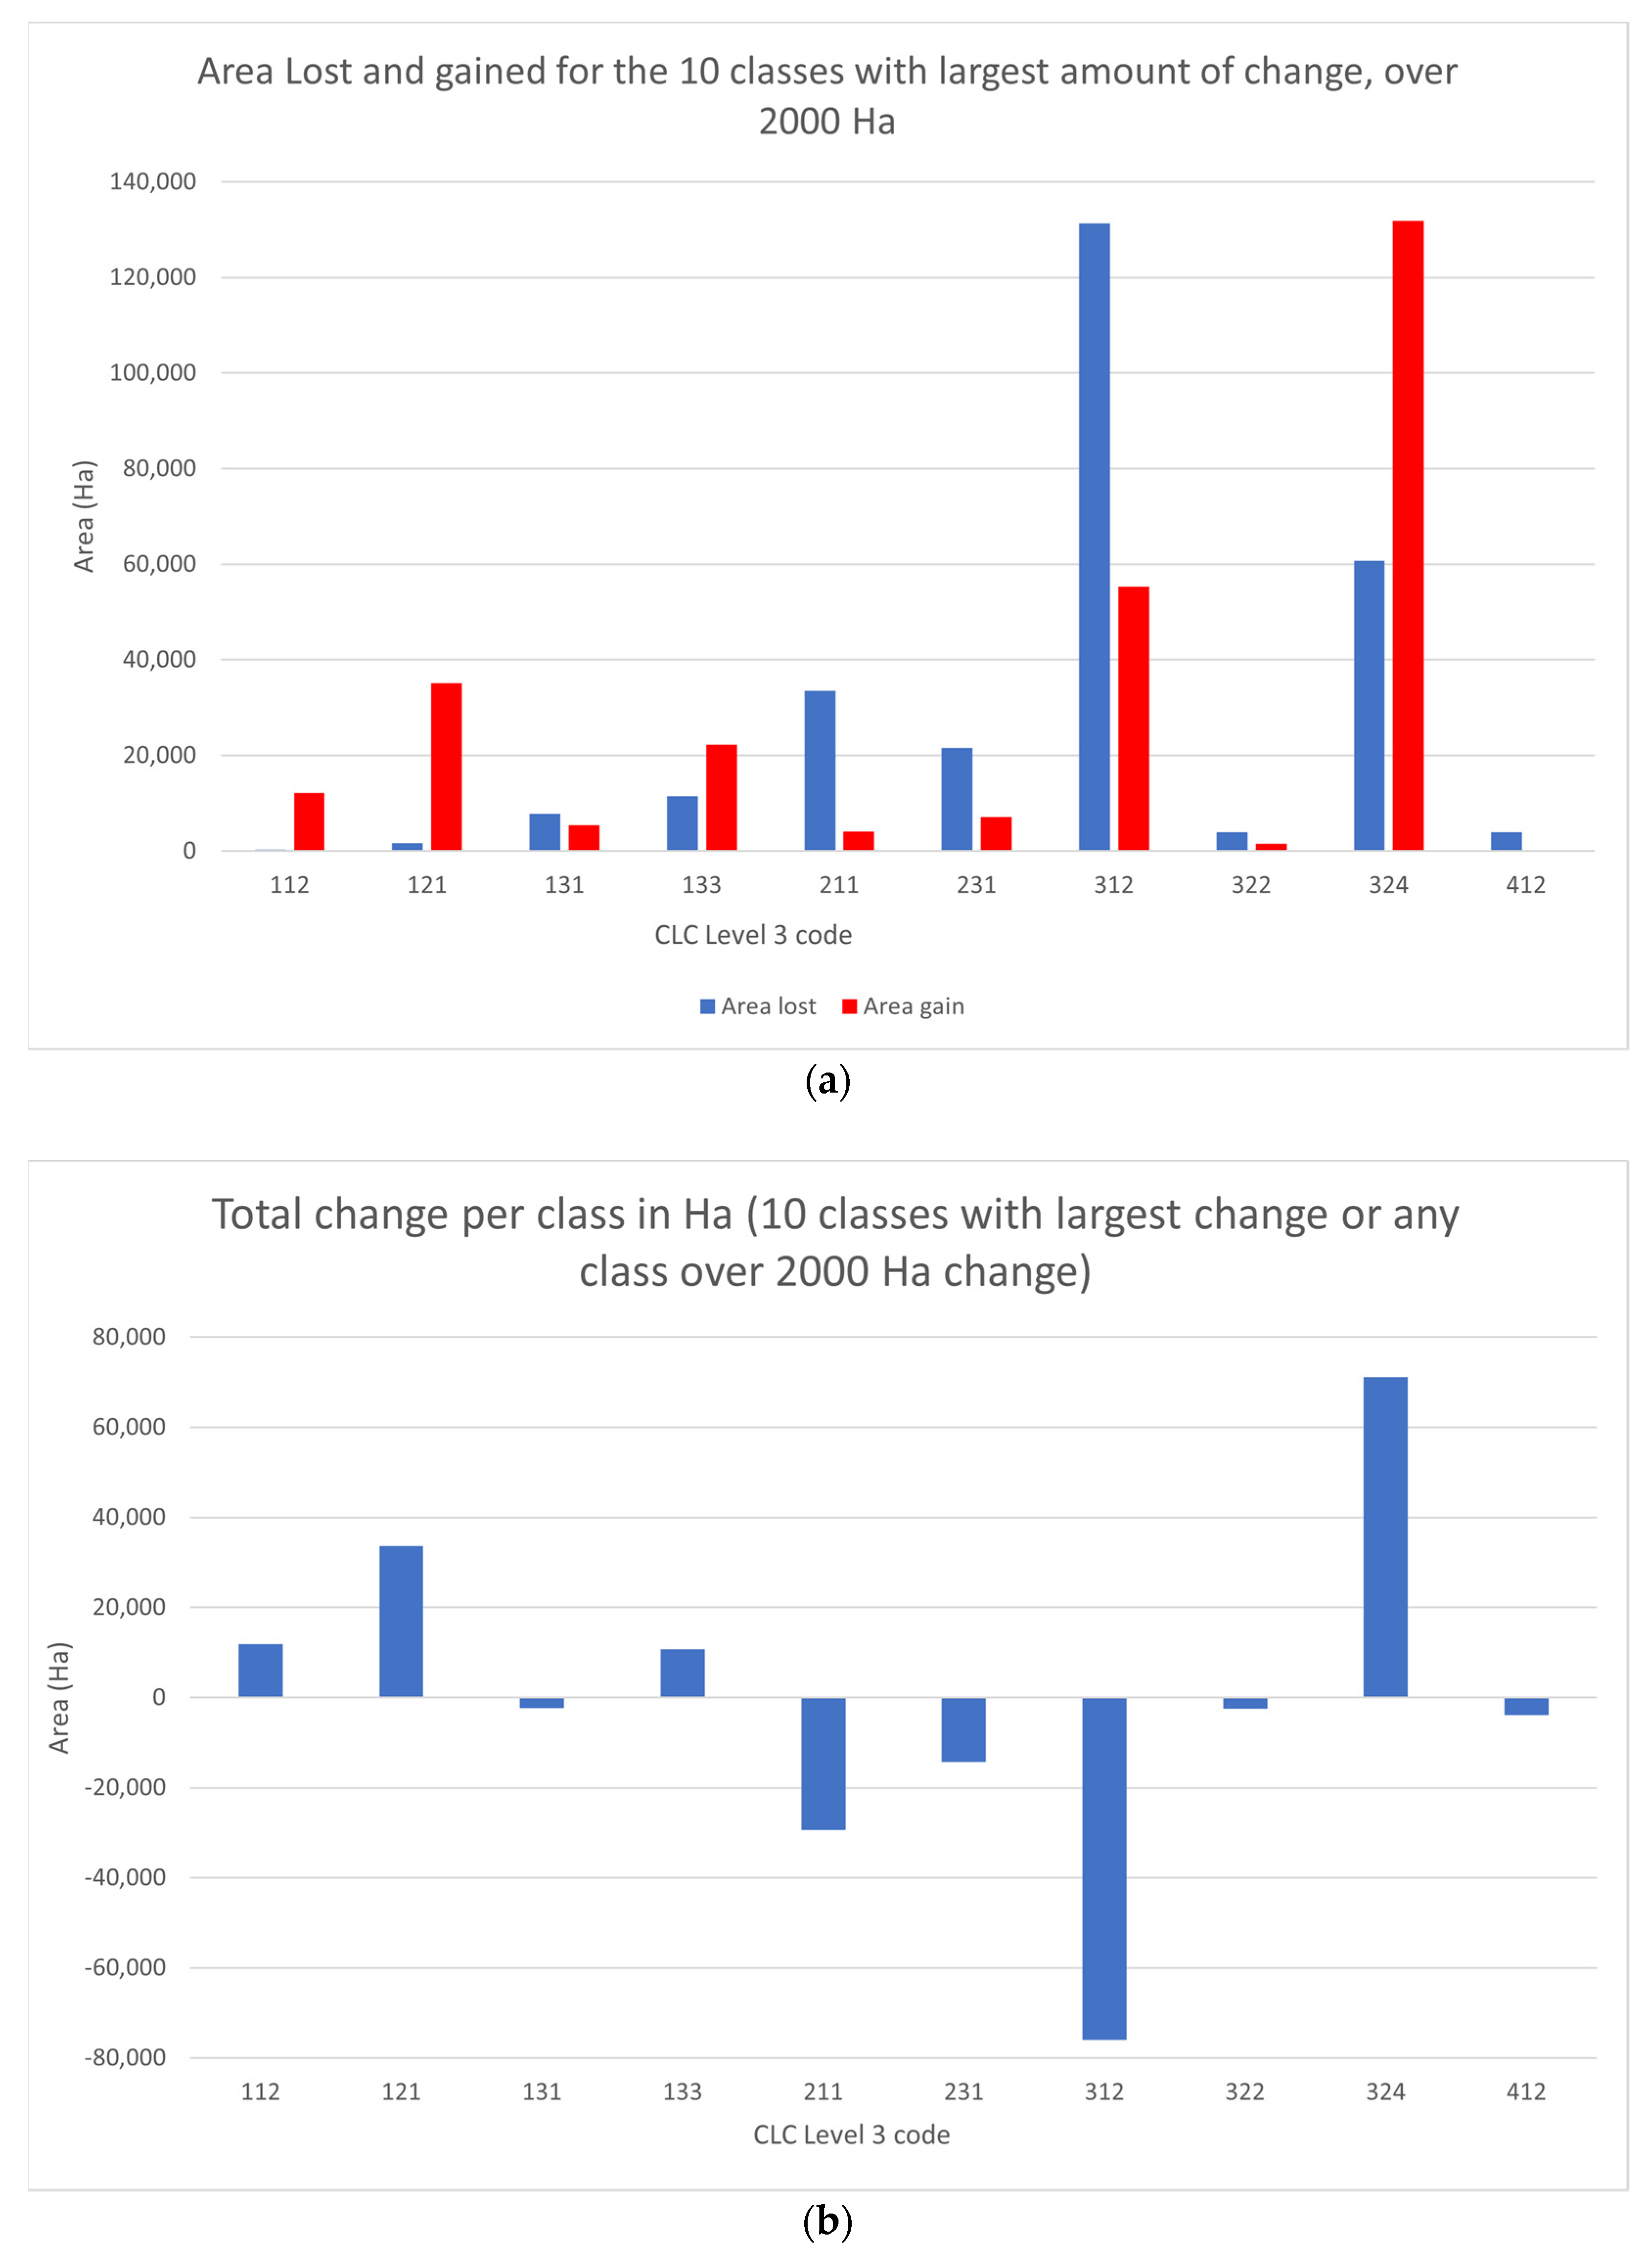
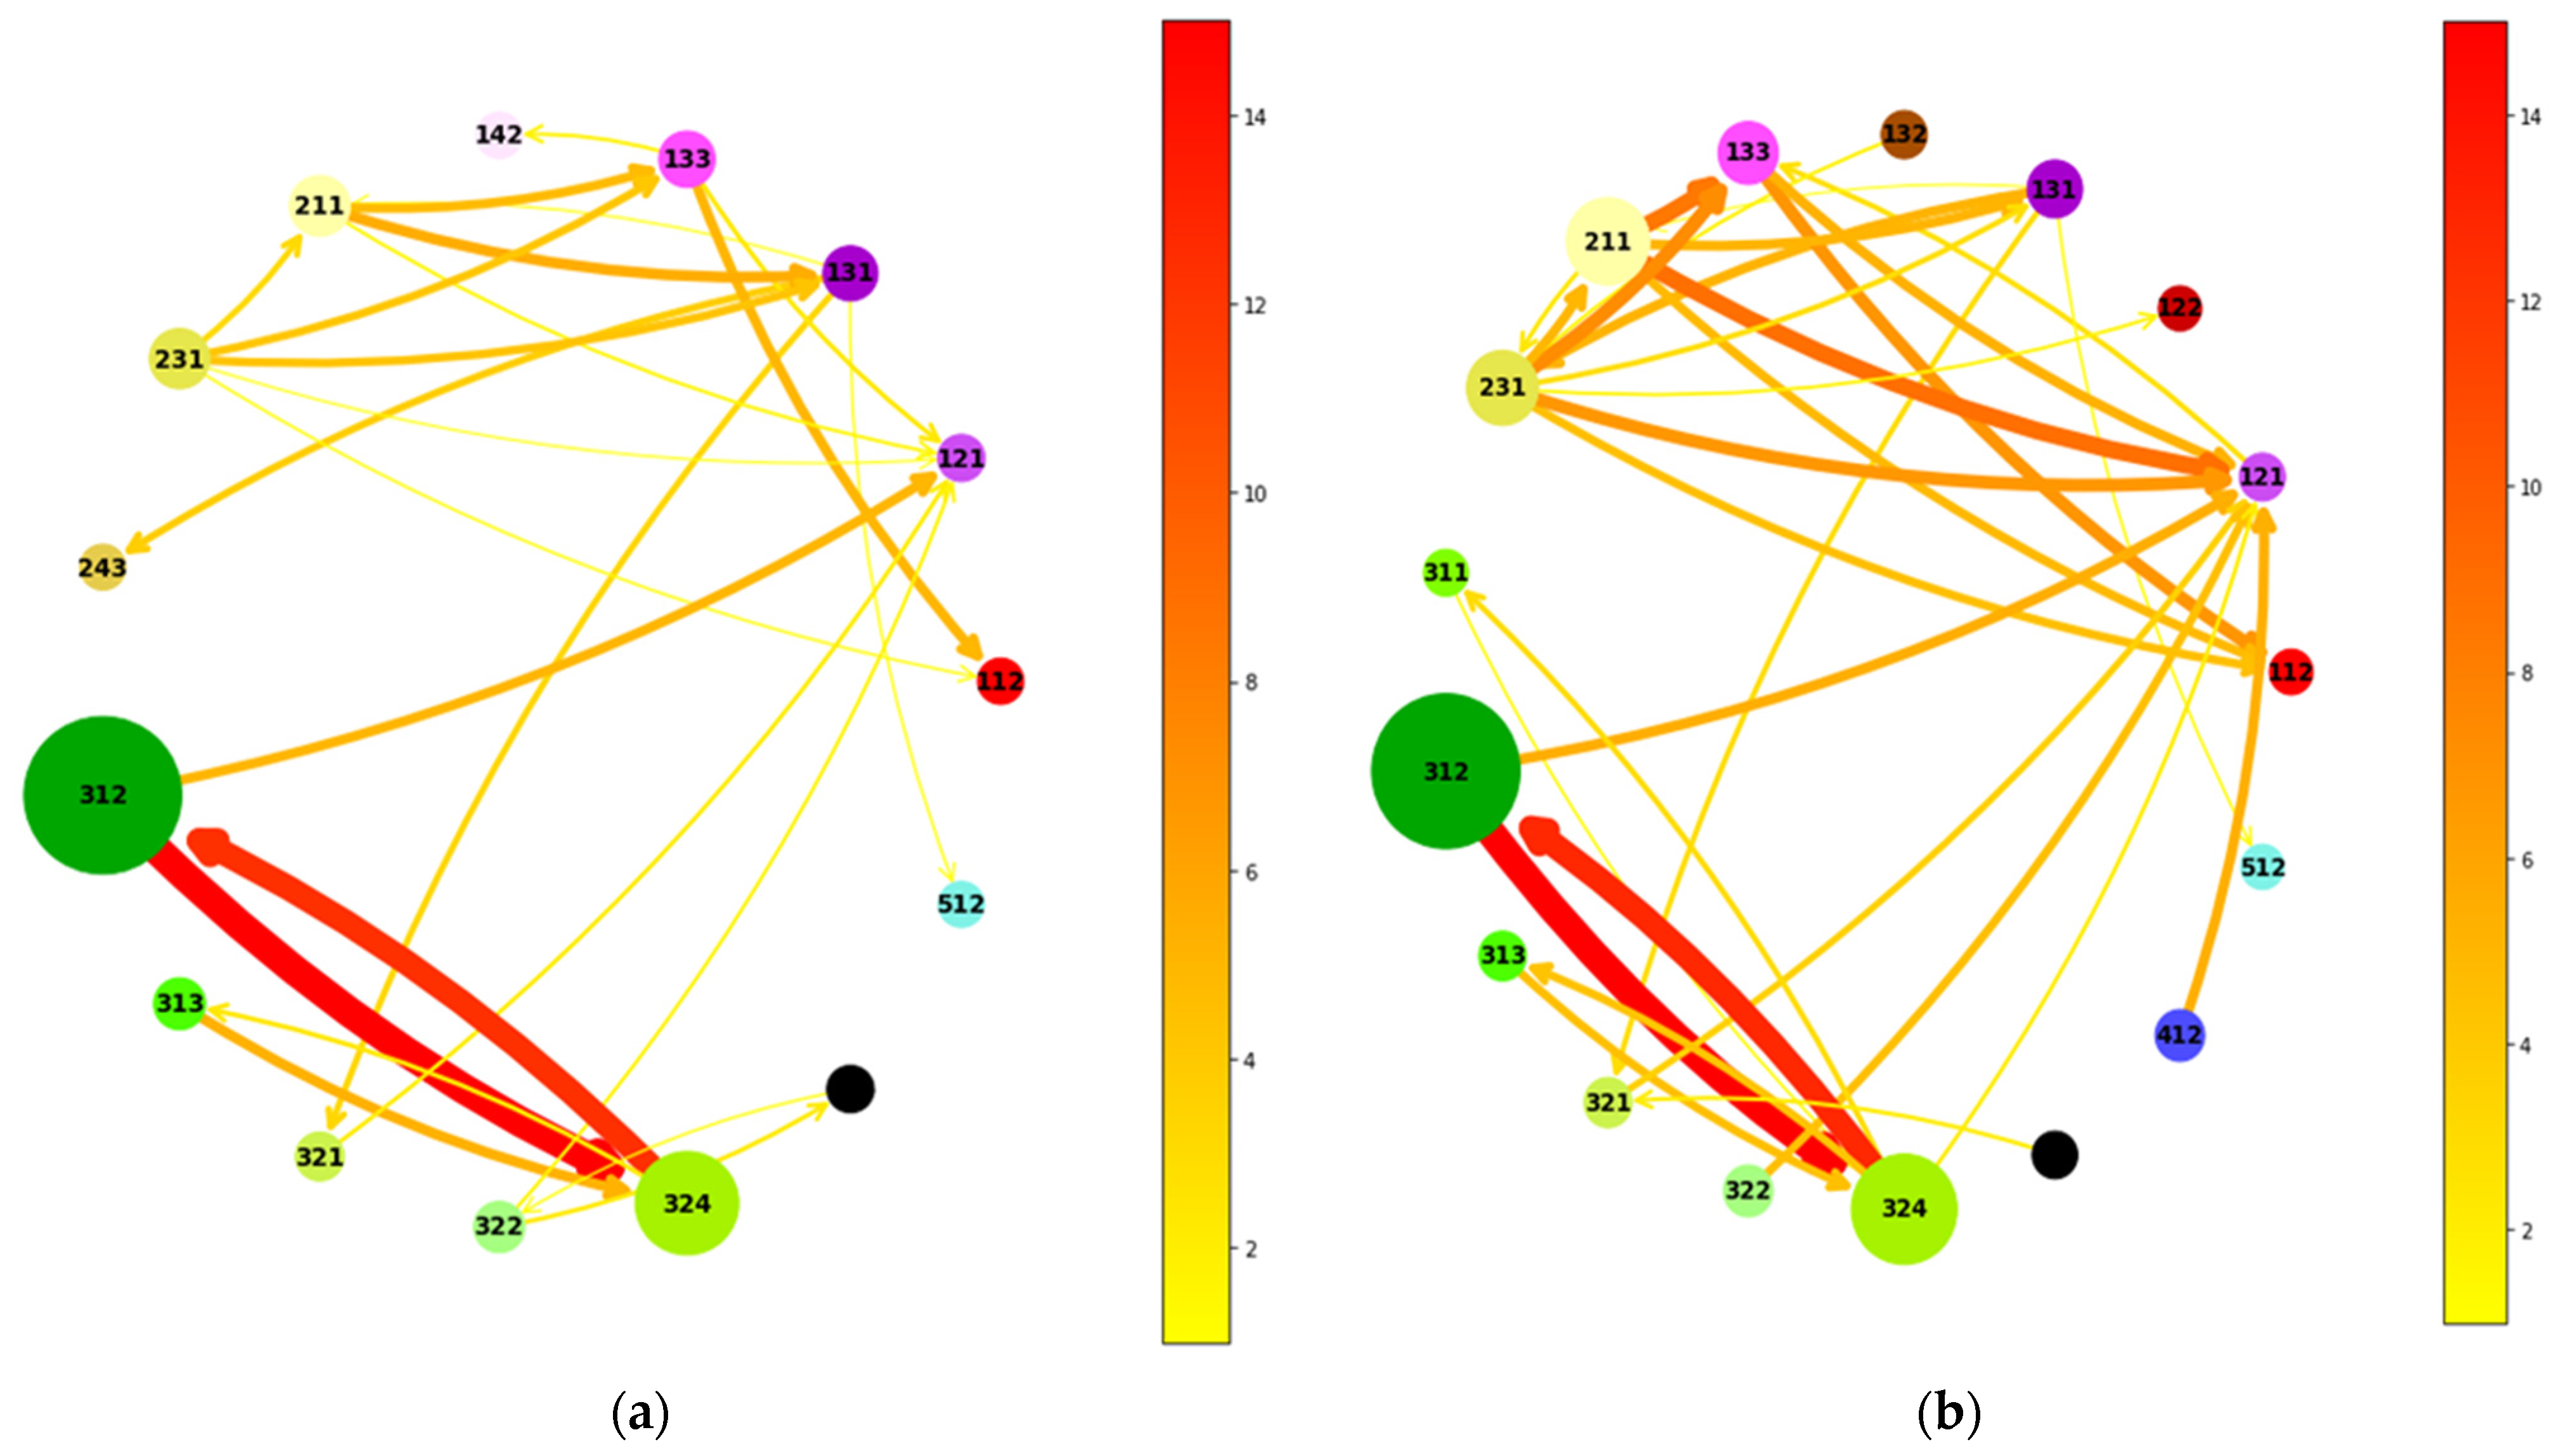
3.3. Land Cover/Land Use Classes That Have Experienced the Most Gains or Losses

To put the amount of land cover/land use changes observed in the CLC change layer 2012 to 2018 into the context of the nature of UK landscapes, Figure 7 shows the gains and losses of CLC classes as a percentage of their area extent in the UK in 2012.
In contrast to Figure 5 above, Figure 7 emphasises the relative change that affected the CLC classes over the six years. The artificial surface classes 121 (industrial or commercial units) and 122 (road and rail networks and associated land) expanded their cover substantially compared to their area extent in 2012. Industrial or commercial units increases in cover by 14.4% and road and rail networks is only slightly less at 12.5%.
Classes 124 (airports), 131 (quarries) and 132 (dump sites) decreased in area. There is a significant redevelopment of retired military airbases into residential areas, with dozens of projects currently underway showing changes to other urban classes, and the ceasing of operations of some smaller airports. Similarly, there is a regeneration of quarry and landfill sites as brownfield areas for residential and industrial expansion. Class 133 (construction sites) showed the largest relative increase in area, which is indicative of the large areas that were made available for housing development, road building and industrial development. Class 141 (green urban areas) decreased in coverage, although urban green spaces are often protected against development. It is possible, however, that developments on brownfield sites and losses of greenbelt land in cities occurred over the reporting period. The total loss was only 929 ha; this is distributed fairly evenly across the country, with one or two polygons of change to either construction sites or discontinuous urban fabric in each of the larger cities.
Out of the agricultural areas, Class 222 (fruit trees and berry plantations) has increased significantly relative to the small absolute area that they covered in 2012. The forest and semi-natural area class 312 (coniferous forest) has decreased significantly since 2012, while class 324 (transitional woodland-shrub) increased even more relative to its cover in 2012. These two large relative changes show an intensification of timber harvesting in the UK. Class 334 (burnt areas) decreased considerably in comparison to its original extent in 2012, which was driven by large-scale wildfires between 2006 and 2012 that were not matched in area by new fires from 2012 to 2018. The extent of burnt areas was very low in the UK, so a small number of changes can make a big difference to the relative size of the class.
The wetland classes 411 (inland marshes) and 421 (salt marshes) saw an increase in relative extent compared to the baseline of 2012, representing the development of new sites for nature conservation and natural flood management, typically by conservation charities in partnership with the UK Environment Agency, e.g., Steart Coastal Management Project [31].

3.4. Changing Trends—2006–2012 Change Layer Compared to 2012–2018 Change Layer

Figure 8 shows a visualisation of the main land cover/land use transitions for both time periods as connected graphs. The two graphs show at a glance that, from 2012 to 2018, there were a substantially greater number of transitions in land cover/land use than from 2006 to 2012 (thicker arrows of darker colour and red hue). In both time periods, the largest transitions in terms of change area were between 312 (coniferous forest) and 324 (transitional woodland-shrub) in both directions, which indicate rotation forestry practices for softwood production and tree planting after harvest. As already mentioned, the transition from 312 (coniferous forest) to 121 (Industrial or commercial units) are largely indicative of new wind turbines in forested landscapes for the primary purpose of renewable energy generation. This type of change is classed as 121 under the technical methodology of CORINE because the primary purpose of the land use changes from forestry to energy production, even though in the vast majority of cases the wind turbines only require small clearings in the forest and most trees remain intact (Figure 9).
Between 2010 and 2019, wind power capacity in the UK more than quadrupled to 24 GW, with greater production capacity on land (up from 4.1 GW in 2010 to 14.2 GW in 2019) and offshore (up from 1.3 GW to 9.8 GW) (BEIS, 2020). This trend is set to continue. Figure 8 shows an increasing transition from 211 (non-irrigated arable land) to 131 (mineral extraction sites) and 133 (construction sites), with some changes from 231 (pastures) to 131 in 2006–2012 and 133 in 2012–2018. The transitions from 211 (non-irrigated arable land) and 231 (pastures) to 112 (discontinuous urban fabric) also increased in magnitude. Class 112 describes types of housing development with associated gardens and green spaces that are typical for urban expansion around the fringes of towns and cities. Urban expansion is often taking place on agricultural land previously used for crop production or as pastures, and the CORINE statistics suggest a much greater degree of urban expansion and new settlements over 5 ha in area since 2012 compared to 2006–2012. Additionally, the transitions from agricultural land (211) and pastures (231) to industrial or commercial land (121) increased substantially from 2012; it increased from a change of 1477 ha in 2006–2012 to 18,462 ha in 2012–2018. From 2012–2018 there is also a new transition from 412 (peat bogs) to 121 (industrial or commercial units), which was caused by the creation of wind turbines in the uplands where the main peatland cover still remains but the primary land use is now for energy production.

3.5. Analysis of Pressures on Land Cover/Land Use Change in the UK

Beyond the descriptive analysis of large-scale land cover/land use change, the question arises of which pressures have acted on land cover/land use in the UK that led to the observed transitions between CORINE classes over these two 6-year periods. Most land use and land cover changes are caused by a combination of social, economic and natural processes which operate at all scales, from the local to the global level. For example, agricultural policies combined with varying local employment opportunities lead to intensified use of land in some areas and abandonment in other areas. These changes can therefore affect the environment and its condition and biodiversity in either a positive or a negative manner, depending on context.
In the early 2000s, the BIOPRESS project [32] aimed to provide quantitative information on how changes in land cover and land use affected the environment and biodiversity in Europe in terms of pressures. The project produced consistent and coherent sets of historical (1950–1990–2000) land cover/land use change information for selected sites located from the Boreal to the Mediterranean, and from the Atlantic to the Continental regions of Europe. BIOPRESS focused on Pressures, State and Impact parts of the DPSIR framework (D = Drivers; R = Response) and the Pressure State Impact (PSI) model MIRABEL [33]. This model was originally designed as a tool for predicting pressures, impacts and scenarios of change, so the MIRABEL approach was not only being used to identify (and quantify) pressures based on observed land cover changes over the preceding 50 years, but also aimed to look at predicting future impacts on biodiversity. The land cover change statistics were converted into quantitative measures of pressures on biodiversity through the integration of socio-economic indicators.
In the BIOPRESS project, pressures have been defined as the processes that can be determined by the spatial patterns of land cover changes that are related to habitat fragmentation at the local scale. In other words, the processes determine how land cover changes may affect local environmental conditions. It is well known that land cover change is not a unidirectional process (e.g., forests being converted to agriculture). In the land cover change–pressure matrix, each land cover conversion was associated with a unique and particular process, which was meant to represent a specific anthropogenic pressure on biodiversity. This assumption was far from being satisfactory. Firstly, the same land cover change might be associated with two different processes at the same time, depending on where the land cover change took place in the first period. Secondly, it is not advisable to assume that any type of land cover change is always a pressure on a habitat. BIOPRESS dealt with these issues by applying expert knowledge to carry out the final mapping of land cover conversions.
The change statistics in BIOPRESS were produced by the backdating of CORINE land cover for Level 3 of the nomenclature at the selected sites. A land cover change–pressure association matrix was developed which can be considered as a compact format for representing the pressures that have resulted in different transitions between all possible land cover categories. Six main pressures were selected in BIOPRESS for the statistical analysis of land cover change patterns in combination with economic development, technology, and other social factors:
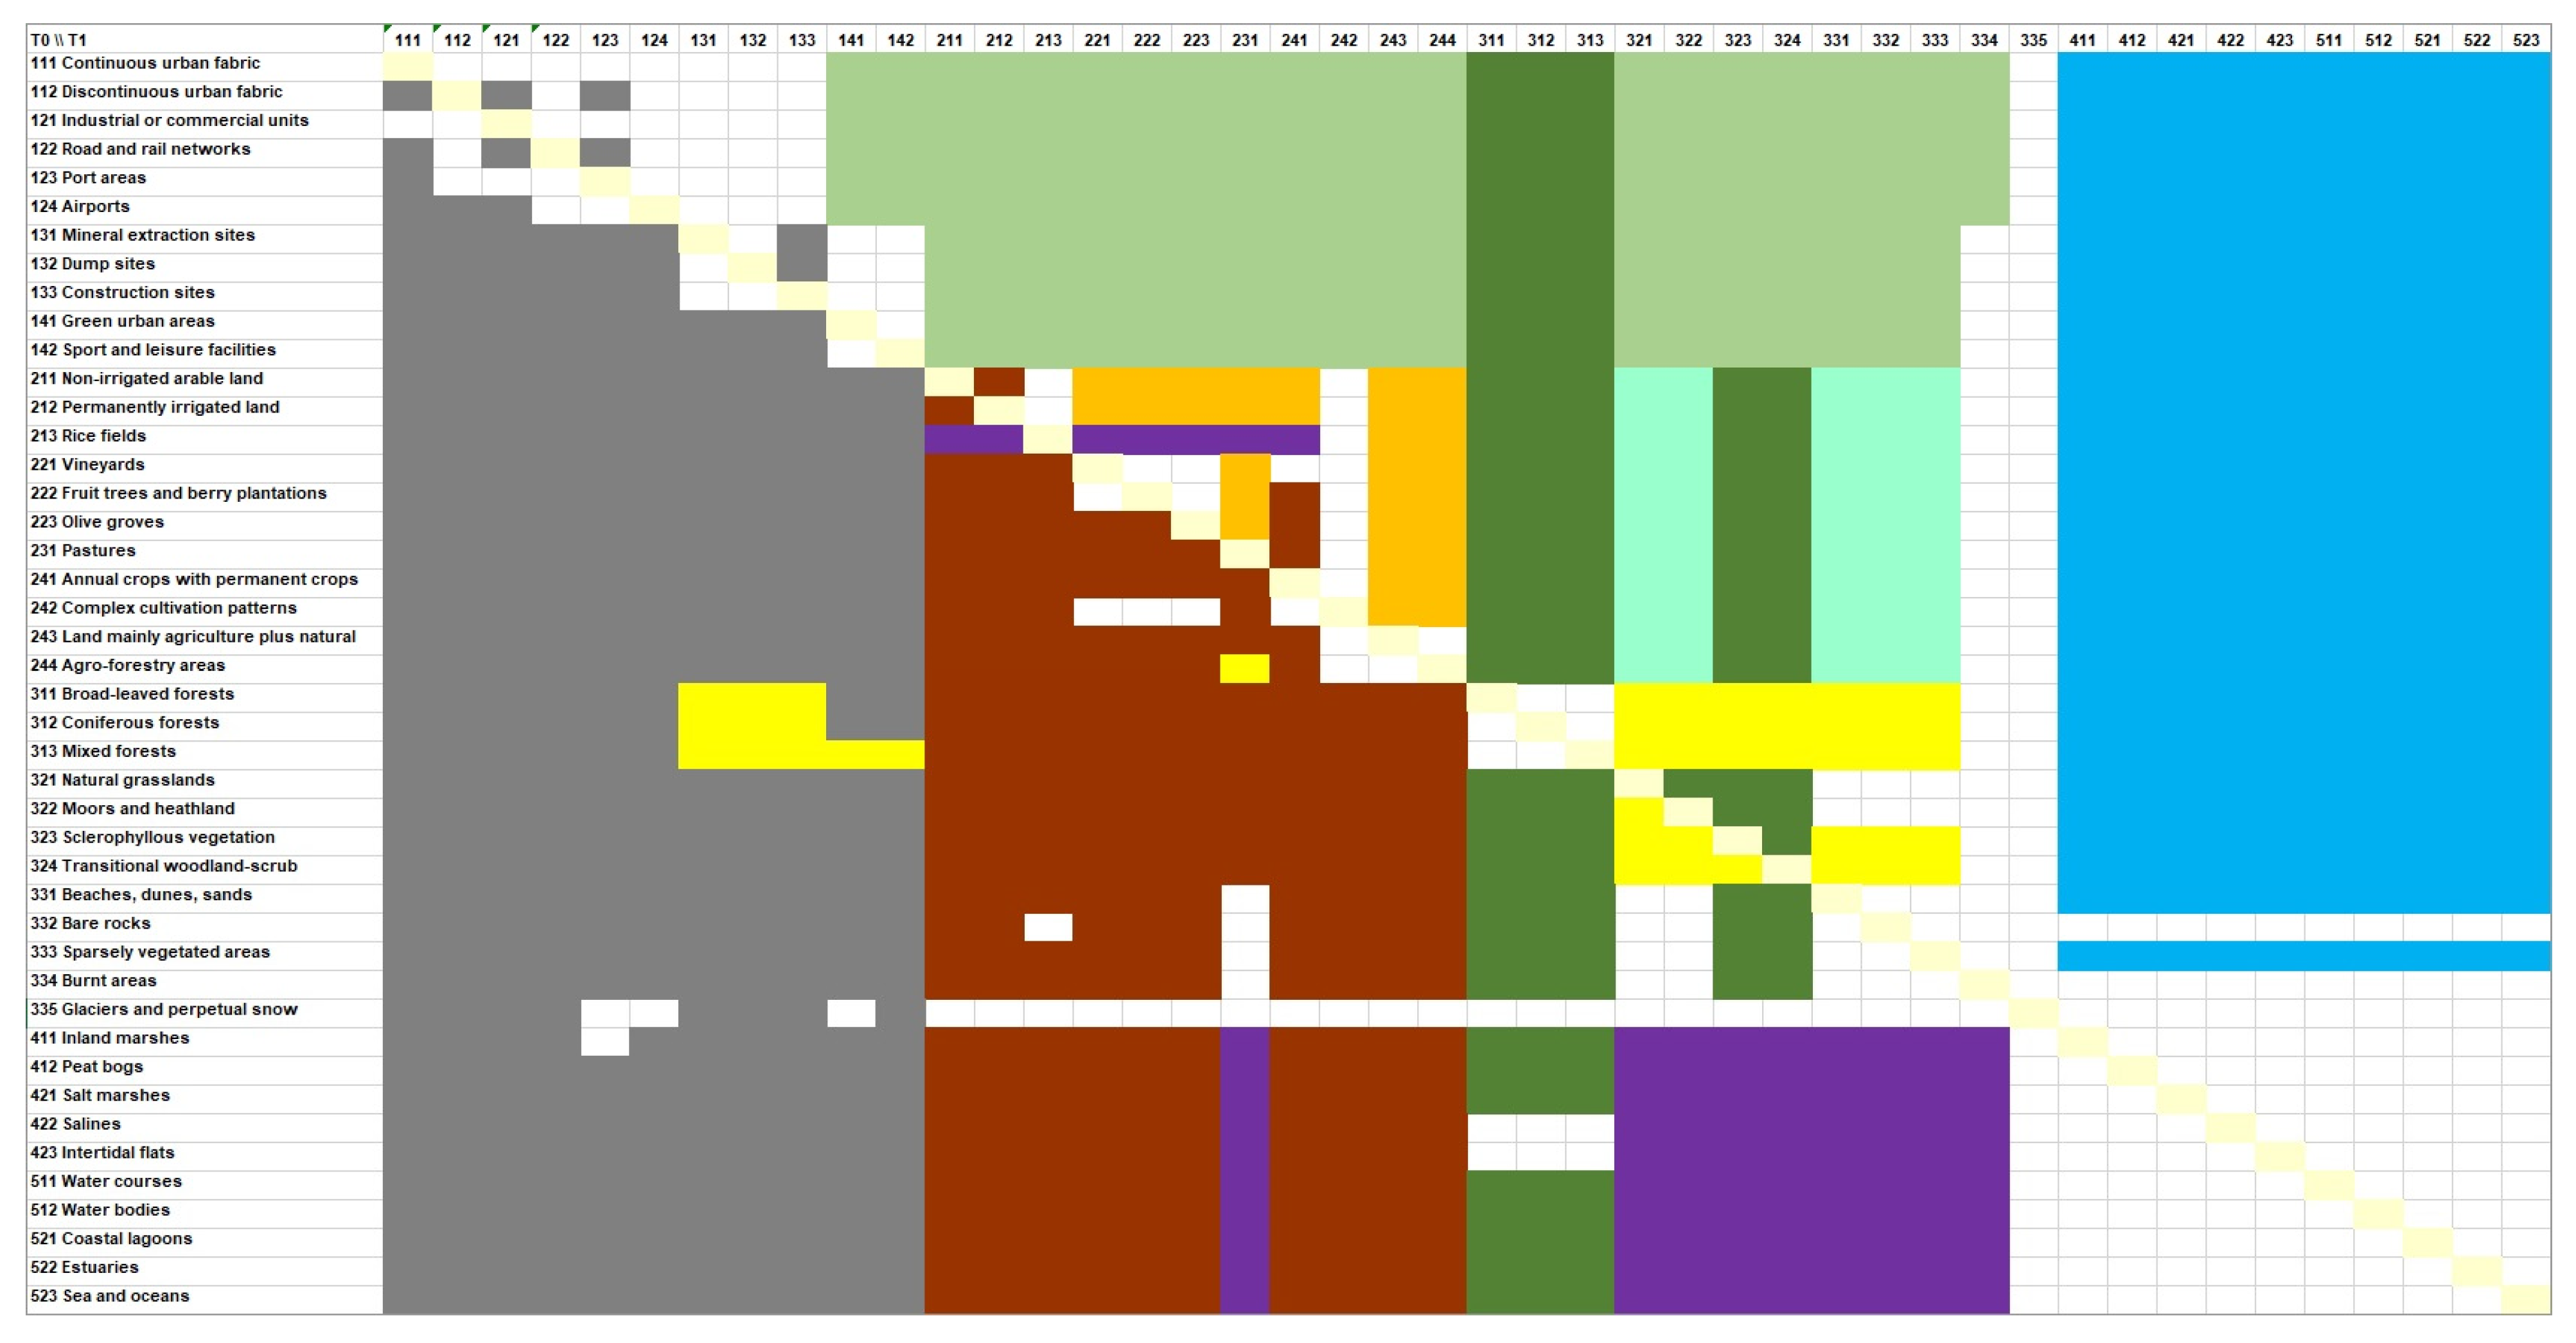
  • Agricultural Intensification (I): agricultural conversions as well as transformations to more intensive practices.
  • Land Abandonment (Ab): cropping cessation and conversion into early successional, herbaceous habitats. The transition to woody, later-successional habitats was considered as a Mediterranean extension of Afforestation.
  • Afforestation (A): conversion of open (more or less natural) habitats into forests or macchias.
  • Deforestation (D): conversion of forest to non-forest classes.
  • Drainage (Dr): All changes affecting aquatic habitats that are transformed into more terrestrial ones, including land gain from intertidal and sea areas and the loss of peatlands drained due to agricultural practices or forests.
  • Urbanisation (U): transformation to urban covers but also to related covers (road system, leisure areas, construction sites, etc.).
The work here considered three further pressures/processes because it was beyond the scope of this paper to analyse local context, specific interpretations and fragmentation which had been undertaken in the BIOPRESS project. The additional pressures were therefore:
  • Urban greening (Ug): conversion of urban classes to more vegetated classes.
  • Extensification (Ex): conversion of intensive agricultural classes to more extensive management.
  • Re-wetting (Rw): conversion of ‘dry’ classes to wetlands and intertidal cover types.
  • The resulting adapted land cover change–pressure matrix is given in Figure 10, where the colour of the land cover change combination gives the type of pressure.
In this paper, we have therefore compared the UK CLC changes from 2006 to 2012 and from 2012 to 2018 to the adapted land cover change–pressure matrix to summarise the likely pressures being experienced in the UK.
As expected from the Level 3 change results reported above, the dominant pressures are related to afforestation (A) and deforestation (D), Figure 11, but this is only the manifestation of rotational planting in commercial forestry. The BIOPRESS analysis shows that deforestation had a higher percentage of the total changes than afforestation over both periods, but deforestation declined more between the two periods than afforestation (Figure 11). These changes are also reflected by the Forest Research wood production data (Figure 6). According to these official statistics, the average annual rate of increase in wood production (slope of the trend line) reduced between 2012 and 2018 to 64,000 green tonnes per year from 397,000 tonnes per year between 2006 and 2012 (Figure 6). At the same time, the average annual rate of tree planting across the UK slowed down substantially from +380 ha per year between 2006 and 2012 to a declining trend of −930 ha per year from 2012–2018 (Figure 6). These trends are problematic in the context of the UK’s legally binding commitment to achieve a net zero greenhouse gas budget by 2050. In an assessment of pathways to achieve this commitment, the Sixth Carbon Budget for the UK by the Climate Change Committee made four key recommendations in 2020, one of which states that 460,000 ha of new mixed woodland need to be planted by 2035, increasing woodland cover from 13% of UK land in 2020 to 15% by 2035, and 18% by 2050 to remove CO2 and deliver wider environmental benefits. Additionally, 260,000 ha of farmland would need to switch to producing energy crops [3].
When the likely changes related to commercial forestry are removed, the pressures of afforestation and deforestation are equal at around 0.5% of the changes and stable between the two change periods. This would suggest that the impacts of any government tree planting schemes are not being detected; however, it is reported that the government are falling short of their targets. The CLMS High spatial Resolution Layer (HRL) for forests records changes in forest area in its dominant leaf type change sublayer. It records forest changes on a 20 m grid (0.04 ha) rather than the 25 ha MMU of CLC, but it gives a similar order of magnitude for the changes and a similar split between afforestation and deforestation.
The next largest pressure is related to urbanisation or urban land take through a range of developments, from housing and industrial to infrastructure and construction. Given the MMU of CLC-Changes, only the large urbanisation projects will be detected and the considerable number of small brownfield infilling developments will not be recorded. Of particular interest, as they were identified by the interpreters during the production of both CLC2012 and CLC2018, were the creation of renewable energy sites related to onshore wind and solar. In CLC terms, these sites would be represented by conversion to industrial and commercial (121). Between the 2006–2012 and 2012–2018 periods, urbanisation doubled, but this conversion to industrial and commercial actually trebled. As onshore wind dominates in the uplands and solar tends to be in the lowlands, a rough breakdown of the split between onshore wind and solar can be made by considering the source class for the change. From a sample of the 500 largest change objects going to 121, it was found that 92% of the changes from forest, semi-natural and bog classes were related to onshore wind, and 72% of the changes from arable and pasture were to solar, so the assumption holds. In fact, of the changes in the 2012–2018 period to 121, 79% were related to renewable energy. In the 2006–2012 period, the split in the percentages of change was 2.60 and 0.69 for onshore wind and solar, respectively. By the 2012–2018 period, the changes had both increased and the split altered to 3.88 and 6.37, respectively, giving increases by a factor of 1.5 and 9.2. These increases and the change in the split between onshore wind and solar are comparable with the BEIS electrical generating capacity figures for renewable sources, which increased factors between the two periods of 1.7 and 6.5, respectively. The CLC-Change results are very realistic, even considering there will be some commission of changes that are not related to renewable energy.
The remaining pressures are relatively minor compared to forestry and urban development. However, there appear to be increases in agricultural intensity which goes against the need for increased biodiversity in the agricultural environment and the promotion of regenerative farming in recent years. It will be interesting to see if this has changed by the next CLC update. More promising is the increase in urban greening, a trend which must continue in order to keep established urban areas habitable given the likely impacts of climate change. This result may appear to contradict those in Figure 7, but in that case only changes to the CLC class 141 (green urban areas) were considered. In this pressure analysis, all changes from an urban to a vegetated class, e.g., 131 (mineral extraction sites) to 231 (pastures), associated with the restoration of sites were included. It is hoped that this pressure will increase in future and be more strongly detectable in CLC updates.

4. Discussion

The change results described above raise a number of issues and important conclusions for land cover/land use mapping and changes to the UK landscape. Firstly, the rate of change between the subsequent CORINE land cover maps is continuing to increase. As reported in [25], between the 2000–2006 map and the 2006–2012 map, there was an increase in the amount of change mapped by 21,854 ha, or 11%, and the variety of types of change also increased. This increase is continuing with changes between 2012 and 2018, covering an area of 76,032 ha greater than 2006–2012, which represents 26% of the total change. The changes mapped in 2006–2012 covered an area equivalent to 0.86% of the total land area of the UK, and in 2012–2018 this increased to 1.16%. The number of different types of changes is also continuing to diversify, as seen in Figure 8, the diagram of directions of changes between the two time periods. The results of land cover/land use change presented in the paper are broadly indicative of the important processes happening in the UK landscape. However, developments in both the CORINE mapping process and the pressures on the UK landscape have resulted in some changes being represented accurately, or enhanced, while others are less well-captured. It is important to consider these while moving forwards into the next generation of CORINE.
Because the CORINE class descriptions and the technical manual have stayed essentially unchanged for decades, some new land use forms have to be mapped into an existing class. This is most prominent in the mapping of renewable energy infrastructure, which is classed as ‘artificial surfaces’ if the primary land use of an area has changed from, say, forestry or agriculture to energy production. However, the dominant land cover of that land parcel may not have changed that much. Often, wind turbines are erected that use up very small areas of the parcel and that are connected by narrow roads or bridleways. Similarly, fields which host solar farms can and do continue to be used as pasture for small livestock such as sheep and poultry in a multi-purpose land use arrangement [34]. However, under the CORINE guidelines, these parcels are still classified as an artificial surface. This represents a trade-off between continuity and contemporary relevance; on the one hand, mapping to the same specification over decadal timescales enables long-term trends to be analysed, which is valuable in landscape studies [35]. On the other hand, newly developing trends in the dynamics of the landscape may not be best captured by older specifications and, as a result, the interpretation of the results of the changes requires an in-depth understanding of the mapping guidelines [21] in order not to misinterpret the data. From the perspective of the map producer, this means that the mapping guidelines must be clearly communicated as part of the data product.
Although the CLC mapping guidelines have remained relatively stable from the first products in 1990, there has been continuous variability in the specifications of the input EO data against which the changes are mapped. Originally, the 30 m spatial resolution Landsat series of satellites was the preferred choice, but due to the loss of Landsat 6, instrument problems on Landsat 7 and the shortening repeat frequency of the product from 10 to 6 years, other systems had to be used to plug the gap to give a relatively heterogeneous image data source. For 2018, the Copernicus Sentinel-2 system offered a consistent and reliable image source with similar capabilities to Landsat. However, a key change was the reduction of the spatial resolution down to 10 m, giving a resolving power six times better than Landsat (Figure 12). As can be seen, this allowed more accurate identification of small features and those with fine spatial textures such as suburban, road networks and windfarms. Although there was no change to the method, the improved 2018 data allowed the identification of technical changes (e.g., small suburban areas) that were not visible in IMAGE2012. Now that these technical changes have been made to CLC2018, future updates should be easier and more accurate, and Sentinel-2 will continue to be available over the next few decades at least.
The dominant landscape change in the UK is clearly the cutting of coniferous forests, and their subsequent regrowth as part of the rotation forestry for timber production. This has not changed since the last analysis between 2006 and 2012; however, what has been identified this time is the net reduction of the replanting and regrowth. A significant number of land parcels that were ‘coniferous forest’ in 2012 changed to ‘transitional woodland/scrub’ in 2018, leading to a net reduction in the coniferous forest cover over this period in the CORINE map. This is also reflected in Deforestation being one of the main pressures on the UK habitats according to the BIOPRESS methodology (Figure 11). Although over the same timeframe, the UK wood harvesting statistics are fairly stable at a very high level (Figure 6), the new tree planting statistics (Figure 6) appear to be insufficient to compensate for the high harvesting intensity. This is particularly an issue of concern in the context of the UK’s pathway towards net zero carbon emissions by 2050, which was turned into law in June 2019. The UK’s Sixth Carbon Budget [3] recommended that the UK’s woodland cover should increase from 13% to 15% by 2035. To achieve this goal, a further 440,000 ha of mixed woodland will have to be planted to remove CO2. Over the same timescale, 260,000 ha of agricultural land should switch to bioenergy production, including short-rotation forestry. The CORINE class definitions in their current form would not be able to adequately quantify the changes towards these new forms of land use. Bioenergy production would be classed as agricultural cropland or, if covered by young trees, as transitional woodland/scrub. In terms of assessing the UK’s habitats and carbon balance, it is important to know whether an area of transitional woodland/scrub is actively growing new trees as part of commercial forestry and bioenergy production or if it has been abandoned; there is an opportunity to incorporate this into the next generation of landscape mapping. Peatland restoration is also part of ongoing climate mitigation efforts in the UK, which has substantial peatland areas, most of which are degraded to some degree. The CORINE classes do not currently distinguish between restored and degraded peatland, although that will become a major issue for policy.
The process of urbanisation or urban land take has been highlighted in the results between 2012 and 2018 and is a trend identified in previous iterations of the CLC inventories. The major headline to note is the dramatic increase in the amount of renewable energy infrastructure in the UK over the last two decades. Due to the specifications of CLC, it may not always precisely represent the area of land that is being taken, but it is clearly picking up the trends in this sector and even the split between onshore wind and solar projects due to their context. In the case of onshore wind, the visual interpretation of satellite images and the exaggeration of this class with the mapping rules have been an advantage. Future developments of CLC, described below, will more accurately map windfarms as turbines and access roads, but the use of a characterisation rather than classification approach will allow both land cover and land use attributes to be attached to these features.
Other growths in impervious land such as the reported 12.5% rise in transport infrastructure and 105% increase in construction sites, although significant, need to be viewed with caution as the total areas these land uses cover are relatively low across the whole of the UK. Urban fabric, in the sense of the built environment, is captured in the CLC classes 111 and 112. These classes have both increased between each iteration of the CLC maps; however, the rise between 2012 and 2018 is 11,925 ha, accounting for an increase in just below 1% of their cover in the UK.
Moving forward the CLMS will continue to expand its portfolio to provide improved land cover/land-use products and provide more information on surface characteristics and dynamic behaviours. Central to the CLMS development at the pan-European scale will be the CLC+, or 2nd generation CLC, initiative, which will provide base datasets with improved spatial resolution and thematic content. The CLC+ Backbone will provide a wall-to-wall land cover map with a 0.5 ha MMU, but a relatively simple nomenclature compared to current CLC standards. The CLC+ Core will be a corresponding grid-based (1 ha) thematic information engine holding detailed land cover, land-use and additional characteristics for each cell. CLC+ Core will adopt the EAGLE data model [36], which is specifically designed to characterise rather than classify landscape features, thus allowing improved descriptions, greater flexibility and better representations in different application contexts. CLC+ Core will be drawn from a broad range of CLMS, EEA Member State and open-source datasets. By combining CLC+ Backbone and CLC+ Core via appropriate mapping specification and rule sets, an almost infinite number of derived CLC+ Instances can be produced, based on a common underlying information source. The first CLC+ Instances to be produced will be related to Land Use, Land-Use Change and Forestry (LULUCF), an inventory for emissions and removals of greenhouse gases resulting from direct human-induced land use, and CLC+ Legacy, the conventional CLC that we have today. Together, these products will form a powerful tool for tracking and understanding our environment in increasing detail while being compatible with the long time series of CLC.

5. Conclusions

There has been an increase in the rate of change in UK land cover/land use, both in area and type of change. An area covering 1.16% of the total UK has changed between 2012 and 2018. The urban fabric has increased by 1% and the industrial or commercial units by 14%, which has been driven by the increase in renewable energy infrastructure, accounting for 79% of this change. The dominant landscape change in the UK remains the clearcutting and regrowth of coniferous forests; however, there seems to be a reduction in replanting and regrowth leading to net reduction of forest cover.
The two largest changes in the UK landscape during the period 2012–2018—forestry and renewable energy—while represented clearly in the change mapping are both somewhat vulnerable to misinterpretation under the current CORINE methodology. The producers of this map emphasise the need for careful review of mapping guidelines before use of the data.
The nomenclature has been stable for decades, which enables long-term changes and trends to be identified; however, some more recent types of changes, such as the renewable energy types, are not as well captured. In its current form, CORINE is not well suited to mapping the classes required for the UK net zero assessment because the class definitions would not adequately quantify the change to the new forms of land use required to meet the UK climate change targets. However, the new methodology based on CLC+, which enables the distinction of land use and land cover, and the increase in spatial resolution will be able to more accurately capture some of the most important contemporary land changes. Consistent long-term monitoring of land change is extremely important in the changing environment of the 21st century and should be maintained in the UK to support progress towards climate commitments, which will require a component of significant land-use change in the coming decades.
However, at the time of writing, it had not been confirmed whether the UK will continue to be part of the Copernicus programme and therefore whether the CLMS products will be updated for the UK following Brexit. As environmental time-series grow, their value increases, and at this time of climate emergency and biodiversity crisis it is important that CLC and other CLMS products continue to be regularly produced for the UK in a manner consistent with the complete European coverage.

Supplementary Materials

The following are available online at https://0-www-mdpi-com.brum.beds.ac.uk/article/10.3390/land11020192/s1, Table S1: full change matrix showing total area (Ha) of each change 2012–2018.

Author Contributions

B.C., writing—original draft, investigation, validation, formal analysis, supervision, project administration; G.S., writing—original draft, validation, formal analysis; B.d.l.B.-B., writing—review and editing, investigation, validation, formal analysis, supervision, project administration; S.C.M.J., writing—review and editing, supervision, project administration; A.H., writing—review and editing, investigation, validation; M.P., writing—review and editing, investigation, validation; T.C., investigation, validation; L.Y.C., investigation, validation; H.B., writing—original draft, formal analysis, supervision. All authors have read and agreed to the published version of the manuscript.

Funding

Supported by the European Environment Agency under Framework service contract No EEA/IDM/R0/16/009/United Kingdom with funding by the European Commission. IMAGE 2012 and IMAGE2018 data were provided by the Copernicus land monitoring service with financial support from the European Space Agency and the European Commission. H.B. was supported by the NERC National Centre for Earth Observation. The APC was funded by Leicester Research Archive.

Institutional Review Board Statement

Not applicable.

Data Availability Statement

The data presented in this study are openly available from the Environmental Information Data under the Open Government License and is available at: https://0-doi-org.brum.beds.ac.uk/10.5285/027b6432-f44d-41ab-b349-89fae673d5f5 (CLC12-18 change), https://0-doi-org.brum.beds.ac.uk/10.5285/084e0bc6-e67f-4dad-9de6-0c698f60e34d (CLC2018), https://0-doi-org.brum.beds.ac.uk/10.5285/9bb7caab-764d-407b-9a81-0d758722d900 (CLC2012 revised).

Conflicts of Interest

The authors declare no conflict of interest. The funders (The EEA) specified the method for the CLC mapping to ensure consistence across Europe. They had no role in the analyses or interpretation of data, in the writing of the manuscript, or in the decision to publish the results.

References

  1. Rodgers, C. Delivering a better natural environment? The Agriculture Bill and future agri-environment policy. Environ. Law Rev. 2019, 21, 38–48. [Google Scholar] [CrossRef] [Green Version]
  2. Capstick, S.; Wang, S.; Khosla, R. Bridging the gap–the role of equitable low-carbon lifestyles. In UNEP Emissions Gap Report 2020; United Nations Environment Programme: Nairobi, Kenya, 2020. [Google Scholar]
  3. Committee on Climate Change. The Sixth Carbon Budget The UKs path to Net-Zero; Committee on Climate Change: London, UK, 2020; p. 448. [Google Scholar]
  4. Department for Communities and Local Government. Fixing Our Broken Housing Market; Department for Communities and Local Government: London, UK, 2017; p. 106. [Google Scholar]
  5. Wulder, M.A.; Coops, N.C.; Roy, D.P.; White, J.C.; Hermosilla, T. Land cover 2.0. Int. J. Remote Sens. 2018, 39, 4254–4284. [Google Scholar] [CrossRef] [Green Version]
  6. Ren, Y.; Lü, Y.; Comber, A.; Fu, B.; Harris, P.; Wu, L. Spatially explicit simulation of land use/land cover changes: Current coverage and future prospects. Earth-Sci. Rev. 2019, 190, 398–415. [Google Scholar] [CrossRef]
  7. Zhang, H.K.; Roy, D.P. Landsat 5 Thematic Mapper reflectance and NDVI 27-year time series inconsistencies due to satellite orbit change. Remote Sens. Environ. 2016, 186, 217–233. [Google Scholar] [CrossRef] [Green Version]
  8. White, J.C.; Wulder, M.A.; Hobart, G.W.; Luther, J.E.; Hermosilla, T.; Griffiths, P.; Coops, N.C.; Hall, R.J.; Hostert, P.; Dyk, A.; et al. Pixel-Based Image Compositing for Large-Area Dense Time Series Applications and Science. Can. J. Remote Sens. 2014, 40, 192–212. [Google Scholar] [CrossRef] [Green Version]
  9. Lu, Y.; Wu, P.; Ma, X.; Li, X. Detection and prediction of land use/land cover change using spatiotemporal data fusion and the Cellular Automata–Markov model. Environ. Monit. Assess. 2019, 191, 68. [Google Scholar] [CrossRef] [PubMed]
  10. Caballero, I.; Ruiz, J.; Navarro, G. Sentinel-2 Satellites Provide Near-Real Time Evaluation of Catastrophic Floods in the West Mediterranean. Water 2019, 11, 2499. [Google Scholar] [CrossRef] [Green Version]
  11. Hussain, M.; Chen, D.; Cheng, A.; Wei, H.; Stanley, D. Change detection from remotely sensed images: From pixel-based to object-based approaches. ISPRS J. Photogramm. Remote Sens. 2013, 80, 91–106. [Google Scholar] [CrossRef]
  12. Khatami, R.; Mountrakis, G.; Stehman, S.V. A meta-analysis of remote sensing research on supervised pixel-based land-cover image classification processes: General guidelines for practitioners and future research. Remote Sens. Environ. 2016, 177, 89–100. [Google Scholar] [CrossRef] [Green Version]
  13. Carranza-García, M.; García-Gutiérrez, J.; Riquelme, J.C. A Framework for Evaluating Land Use and Land Cover Classification Using Convolutional Neural Networks. Remote Sens. 2019, 11, 274. [Google Scholar] [CrossRef] [Green Version]
  14. Balzter, H.; Cole, B.; Thiel, C.; Schmullius, C. Mapping CORINE Land Cover from Sentinel-1A SAR and SRTM Digital Elevation Model Data using Random Forests. Remote Sens. 2015, 7, 14876–14898. [Google Scholar] [CrossRef] [Green Version]
  15. Büttner, G. CORINE Land Cover and Land Cover Change Products. In Land Use and Land Cover Mapping in Europe: Practices & Trends; Manakos, I., Braun, M., Eds.; Springer Netherlands: Dordrecht, The Netherlands, 2014; pp. 55–74. ISBN 978-94-007-7969-3. [Google Scholar]
  16. Bossard, M.; Feranec, J.; Oťaheľ, J. Corine Land Cover Technical Guide-Addendum 2000; European Environment Agency: København, Denmark, 2000; p. 105. [Google Scholar]
  17. Bielecka, E.; Jenerowicz, A. Intellectual Structure of CORINE Land Cover Research Applications in Web of Science: A Europe-Wide Review. Remote Sens. 2019, 11, 2017. [Google Scholar] [CrossRef] [Green Version]
  18. Feranec, J.; Soukup, T.; Hazeu, G.; Jaffrain, G. (Eds.) European Landscape Dynamics: CORINE Land Cover Data, 1st ed.; CRC Press: Boca Raton, FL, USA, 2016; ISBN 978-1-315-37286-0. [Google Scholar]
  19. Nedd, R.; Light, K.; Owens, M.; James, N.; Johnson, E.; Anandhi, A. A Synthesis of Land Use/Land Cover Studies: Definitions, Classification Systems, Meta-Studies, Challenges and Knowledge Gaps on a Global Landscape. Land 2021, 10, 994. [Google Scholar] [CrossRef]
  20. Diaz-Pacheco, J.; Gutiérrez, J. Exploring the limitations of CORINE Land Cover for monitoring urban land-use dynamics in metropolitan areas. J. Land Use Sci. 2014, 9, 243–259. [Google Scholar] [CrossRef]
  21. Kosztra, B.; Büttner, G.; Hazeu, G.; Arnold, S. Updated CLC Illustrated Nomenclature Guidelines; European Environment Agency: København, Denmark, 2017; p. 124. [Google Scholar]
  22. Büttner, G.; Kosztra, B. CLC2018 Technical Guidelines; European Environment Agency: Wien, Austria, 2017; p. 61. [Google Scholar]
  23. Pataki, R. ArcGIS 10.5-10.3 Toolbox for Creation of CLC2018 Database. User Guide; European Topic Centre on Urban, Land and Soil Systems: Wageningen, The Netherlands, 2018; p. 13. [Google Scholar]
  24. ONS Woodland Natural Capital Accounts, UK-Office for National Statistics. Available online: https://www.ons.gov.uk/economy/environmentalaccounts/bulletins/woodlandnaturalcapitalaccountsuk/2020 (accessed on 17 June 2021).
  25. Cole, B.; Smith, G.; Balzter, H. Acceleration and fragmentation of CORINE land cover changes in the United Kingdom from 2006–2012 detected by Copernicus IMAGE2012 satellite data. Int. J. Appl. Earth Obs. Geoinf. 2018, 73, 107–122. [Google Scholar] [CrossRef]
  26. The World Bank World Bank Open Data. Urban Population-United Kingdom. Available online: https://data.worldbank.org/indicator/SP.URB.TOTL.IN.ZS?locations=GB (accessed on 14 July 2021).
  27. DECC. UK Solar PV Strategy Part 1: Roadmap to a Brighter Future; Department of Energy and Climate Change: London, UK, 2013; p. 38. [Google Scholar]
  28. Forest Research Forestry Statistics 2020. Available online: https://www.forestresearch.gov.uk/tools-and-resources/statistics/data-downloads/ (accessed on 1 June 2021).
  29. Gabbatiss, J. In-Depth Q&A: How Will Tree Planting Help the UK Meet Its Climate Goals? CarbonBrief: London, UK, 2020. [Google Scholar]
  30. Barkham, P. Fir’s Fair: UK must Embrace Conifers in Climate Fight, Says Forestry Chief; The Guardian: London, UK, 2020. [Google Scholar]
  31. McGrath, T. To enable communities to engage with the biggest European tidal flat and saltmarsh restoration project. In Coastal Wetlands Restoration; Routledge: London, UK, 2021; p. 13. ISBN 978-0-367-86309-8. [Google Scholar]
  32. Gerard, F.; Petit, S.; Smith, G.; Thomson, A.; Brown, N.; Manchester, S.; Wadsworth, R.; Bugar, G.; Halada, L.; Bezák, P.; et al. Land cover change in Europe between 1950 and 2000 determined employing aerial photography. Prog. Phys. Geogr. Earth Environ. 2010, 34, 183–205. [Google Scholar] [CrossRef] [Green Version]
  33. Petit, S.; Firbank, L.; Wyatt, B.; Howard, D. MIRABEL: Models for Integrated Review and Assessment of Biodiversity in European Landscapes. AMBIO J. Hum. Environ. 2001, 30, 81–88. [Google Scholar] [CrossRef] [PubMed]
  34. BRE. Agricultural Good Practice Guidance for Solar Farms; Scurlock, J., Ed.; National Farmers Union: Washington, DC, USA, 2014; p. 8. [Google Scholar]
  35. Crumley, C.L.; Kolen, J.C.A.; de Kleijn, M.; van Manen, N. Studying long-term changes in cultural landscapes: Outlines of a research framework and protocol. Landsc. Res. 2017, 42, 880–890. [Google Scholar] [CrossRef] [Green Version]
  36. Arnold, S.; Smith, G.; Hazeu, G.; Kosztra, B.; Perger, C.; Banko, G.; Soukup, T.; Strand, G.-H.; Valcarcel Sanz, N.; Bock, M. The eagle concept-A paradigm shift in land monitoring. In Land Use and Land Cover Semantics-Principles, Best Practices and Prospects; CRC Press: Boca Raton, FL, USA, 2015; pp. 107–144. ISBN 978-1-4822-3739-9. [Google Scholar]
Figure 1. CORINE Land Cover (CLC) map for the UK 2018. See Table 1 for class descriptions.
Land 11 00192 g001
Figure 2. Area and proportion of UK land in each class for 2018.
Land 11 00192 g002
Figure 3. Proportion of UK land area aggregated to Level 1 class for 2018.
Land 11 00192 g003
Figure 4. Overview map of all observed CORINE land cover/land use changes between 2012–2018 for the UK.
Land 11 00192 g004
Figure 5. CLC land cover/land use area gained and lost (ha) between 2012 and 2018 (a) and total area of overall change (b) per class for the 10 largest changes.
Land 11 00192 g005
Figure 6. UK Forestry statistics. (a) Wood production statistics in thousands of green tonnes. Data for 2020 are provisional. (b) New tree planting in thousands of hectares. Data for 2020 are revised. Source: [28].
Land 11 00192 g006aLand 11 00192 g006b
Figure 7. Percentage of the area gained and lost between 2012 and 2018 per CLC class as a proportion of the area covered by that class in 2012. Graph shows A ± x the log of the absolute value of % change. Only the classes with more than 1% of the change in their area are shown.
Land 11 00192 g007
Figure 8. Transitions over 600 ha in magnitude between CORINE land cover classes at Level 3 for 2006–2012 (a) and 2012–2018 (b). Arrow widths and colours are proportional to the logarithm of the area of change (ha) from the CORINE change layers. Only changes over 500 ha are shown.
Land 11 00192 g008
Figure 9. Land use change from coniferous forest to renewable energy (industrial or commercial units), showing the exaggeration in area caused by the mapping guidelines.
Land 11 00192 g009
Figure 10. Adapted land cover change–pressure matrix. The colours identify the pressures that the land cover change represents: Brown—Agricultural Intensification, Light green—Land Abandonment, Dark green—Afforestation, Yellow—Deforestation, Purple—Drainage, Grey—Urbanisation, Mid green—Urban greening, Orange—Extensification, Blue—Rewetting.
Land 11 00192 g010
Figure 11. Pressures being experienced in the UK based on the BIOPRESS approach. Key: Agricultural Intensification (I), Land Abandonment (Ab), Afforestation (A), Deforestation (D), Drainage (Dr), Urbanisation (U), Urban greening (Ug), Extensification (Ex) and Re-wetting (Rw).
Land 11 00192 g011
Figure 12. A comparison of Landsat 8 (a) and Sentinel-2 (b) data (fcc) on the same day for an area in northeast England, showing the increased resolving power of 10 m spatial resolution data (right), particularly the traffic roundabout in the centre of the image and the suburban areas in the lower right.
Land 11 00192 g012
Table 1. CORINE class nomenclature of the 44 land cover/land use classes at Levels 1, 2 and 3.
Level 1Level 2Level 3
1Artificial Surfaces1.1Urban fabric1.1.1Continuous urban fabric
1.1.2Discontinuous urban fabric
1.2Industrial, commercial and transport units1.2.1Industrial or commercial units
1.2.2Road and rail networks and associated land
1.2.3Port areas
1.2.4Airports
1.3Mine, dump and construction sites1.3.1Mineral extraction sites
1.3.2Dump sites
1.3.3Construction sites
1.4Artificial, non-agricultural vegetated areas1.4.1Green urban areas
1.4.2Sport and leisure facilities
2Agricultural areas2.1Arable land2.1.1Non-irrigated arable land
2.1.2Permanently irrigated land
2.1.3Rice fields
2.2Permanent crops2.2.1Vineyards
2.2.2Fruit trees and berry plantations
2.2.3Olive groves
2.3Pastures2.3.1Pastures
2.4Heterogeneous agricultural areas2.4.1Annual crops associated with permanent crops
2.4.2Complex cultivation patterns
2.4.3Land principally occupied by agriculture with significant areas of natural vegetation
2.4.4Agro-forestry areas
3Forests and semi-natural areas3.1Forests3.1.1Broad-leaved forest
3.1.2Coniferous forest
3.1.3Mixed forest
3.2Shrub and/or herbaceous vegetation associations3.2.1Natural grassland
3.2.2Moors and heathland
3.2.3Sclerophyllous vegetation
3.2.4Transitional woodland scrub
3.3Open spaces with little or no vegetation3.3.1Beaches, dunes, sand plains
3.3.2Bare rock
3.3.3Sparsely vegetated areas
3.3.4Burnt areas
3.3.5Glaciers and perpetual snow
4Wetlands4.1Inland wetlands4.1.1Inland marshes
4.1.2Peat bogs
4.2Coastal wetlands4.2.1Salt marshes
4.2.2Salines
4.2.3Intertidal flats
5Water bodies5.1Continental waters5.1.1Water courses
5.1.2Water bodies
5.2Marine waters5.2.1Coastal lagoons
5.2.2Estuaries
5.2.3Sea and ocean
Table 2. UK acquisition windows for IMAGE2018, for the North and South of the UK.
Coverage 1
Land 11 00192 i001
UK_N01/05/1715/06/1701/09/1730/09/17
UK_S15/04/1715/06/1701/09/1731/10/17
Land 11 00192 i002 Land 11 00192 i002
Coverage 2 Coverage 2
Table 3. Change matrix, 2012 to 2018, showing the total area (ha) of each change. Only classes with more than 1000 ha are shown in this matrix for size purposes. Totals are for all classes. The full change matrix can be found in Supplementary Material Table S1.
2018
CLC Code112121122131133142211231311312313321322324512Total
2012121190 1289 152 10 1640
131134186 143666823186 13835732087787819
132 26 8156 910 43611685 1742
13358673314215 473130575 137 12511,473
141362179404152511 1165
14213475 576 907317 17 25 1017
211280512,827486309410,874260 11182123 51820933,498
23124955655878134570731072989 169 251252993921,524
3115925234880 27 781 1044
31214352818143250 10 400 126,935 131,317
313278126340 2482 2633
321111762382481681465437 54 111 3000
322924961072311251435308 64 52 346 3979
324 1019 76124 8 141855,1332342220345 60,716
334 1018322 1340
412 3448229614911 41 16 7 1133915
Total12,19935,2031840540122,206103340947161152155,299274334661498131,8431263
Table 4. The 20 most common CLC land cover/land use changes by total area between 2012 and 2018 detected in the change layer with a minimum mapping unit of 5 ha. The change code shows the transition from one Level 3 class to another. The impacts of these land cover/land use changes in relation to climate change are noted as positive or negative.
Change CodeChange DescriptionImpact for Climate ChangeArea (ha)% Changed Area in UK
312-324Clear-cutting of coniferous forest-ve126,93543.7
324-312Regrowth of coniferous forest+ve55,13319.0
211-121Arable land to industrial and commercial development-ve12,8274.4
211-133Arable land converted to construction sites-ve10,8743.7
231-133Pastureland converted to construction sites-ve70732.4
133-112Completion of construction sites to urban areas-ve58672.0
231-121Pastureland to industrial and commercial development-ve56551.9
312-121Coniferous forest to industrial and commercial development-ve35281.2
412-121Peatland to industrial and commercial development-ve34481.2
133-121Completion of construction sites to industrial and commercial developments-ve33141.1
131-231Mineral extraction sites converted to pastureland+ve31861.1
211-131Arable land to mineral extraction sites-ve30941.1
231-211Pastureland converted to arable land (intensification of agriculture)-ve29891.0
211-112Arable land to urban areas-ve28051.0
322-121Moors and heath to industrial and commercial development-ve24960.9
231-112Pastureland to urban areas-ve24950.9
313-324Clearing of mixed forest-ve24820.9
324-313Growth/replanting of mixed forest+ve23420.8
321-121Natural grassland to industrial and commercial development-ve17620.6
324-311Regrowth of broad-leaved forest+ve14180.5
Total259,72489
Publisher’s Note: MDPI stays neutral with regard to jurisdictional claims in published maps and institutional affiliations.

