Article

Research on the Planning of an Urban Ventilation Corridor Based on the Urban Underlying Surface Taking Kaifeng City as an Example

1
Key Laboratory of Geospatial Technology for the Middle and Lower Yellow River Regions (Henan University), Ministry of Education, Kaifeng 475004, China
2
Key Laboratory of Integrative Prevention of Air Pollution and Ecological Security of Henan Province, Henan University, Kaifeng 475004, China
3
Henan Key Laboratory of Earth System Observation and Modeling, Henan University, Kaifeng 475004, China
4
Weather Modification Office of Qinghai Province, Xining 810001, China
5
Department of Geography, Kent State University, Kent, OH 44242, USA
*
Author to whom correspondence should be addressed.
Submission received: 1 December 2021 / Revised: 23 January 2022 / Accepted: 26 January 2022 / Published: 28 January 2022
(This article belongs to the Section Land Planning and Landscape Architecture)

Abstract

:
With the rapid development of urbanization, various urban problems such as air pollution, urban heat islands, poor ventilation, and so on have followed. Ventilation corridors can improve the internal ventilation conditions of a city and can effectively alleviate these urban problems. Taking Kaifeng as an example of a medium-sized city, this study used meteorological analysis and remote sensing (RS) technology and a geographical information system (GIS) to plan ventilation corridors. Through analysis of the thermal environment, the influential factors of the underlying surface (building density, road length, water length, vegetation coverage) and wind environment in Kaifeng, the compensation space and action space, and the comprehensive values of the ventilation potential in each region were determined. The results show that with the use of the single-window algorithm and Landsat8 data, high-resolution ground temperature can be retrieved. Moreover, although the ventilation potential value of Kaifeng in the northern part is better than that in the southern part, the temperature in the north is higher than that in the south. Through comparison and analysis of the location of the low-temperature zone, the air duct opening of the ventilation corridor can be determined and the source areas of three ecological ventilation corridors identified. According to the ventilation corridor air duct opening, the urban underlying surface and the dominant wind direction of Kaifeng city, two ventilation corridors located on the eastern and western sides of Kaifeng city were planned. This urban ventilation corridor planning method, which is based on temperature difference analysis and determination of the source area of the ventilation corridor, can provide a reference for the construction of an ecologically livable city.

1. Introduction

Due to the expansion of the city scale and unbalanced distribution of urban buildings, the urban heat island effect, air pollution, and increased urban energy consumption have increasingly become important limiting factors affecting the healthy development of cities [1]. Studies have shown that the urban wind environment is closely related to the urban form, and improving urban ventilation can alleviate the urban heat island effect and reduce the urban energy demand [2]. Therefore, the construction of the urban ventilation corridors is becoming more and more important as a part of urban planning. In existing research, the study scale of the urban ventilation corridor is mainly divided into regional areas, urban areas, blocks, and buildings [3].
At present, numerical simulation models such as computational fluid dynamics (CFD), the wind tunnel test, the weather research and forecasting model (WRF), the radial breathing-like mode (RBLM), and the method of combining meteorological analysis with geographical information system (GIS) technology platforms are widely used to study urban ventilation corridors. On the regional scale, the WRF numerical simulation method is often used, and the regional wind environment can be well reproduced [4,5,6], but it can only reflect the instantaneous spatial distribution characteristics of the airflow, and cannot reflect the long-term wind environment [7]. The RBLM numerical simulation method takes into account the influence of the urban underlying surface characteristics and human factors on the boundary layer structure in detail, although it is only suitable for meteorological studies at the urban and regional scales [8,9]. From the micro-scale of a street valley to the local scale of a street block, the research methods include CFD and wind tunnel simulation, which have the characteristics of fast speed and low calculation costs [10,11]; however, these simulations mostly focus on the physical environment of some districts and buildings that cover small ranges [12]. Moreover, some studies proposed a new method of ventilation corridor identification based on circuit theory [13], which can identify air cross and ventilation corridors at a lower cost. Different research scales have different model methods. In the comprehensive planning of urban-scale ventilation corridors, the combination of GIS and RS technology and meteorology provides a new method for studying the urban wind environment [14]. Studies have shown that the method of combining meteorological analysis with RS technology can obtain more specific air duct information [15,16]; moreover, the GIS-based method identifies areas with high ventilation potential by analyzing the roughness length of the underlying surface to catch the distribution of ventilation corridors [17,18,19].
According to the study of the operation of urban local circulation, the urban ventilation system can be directly divided into action space, compensation space, and the air guide channel (air duct) in theory [20,21]. The action space refers to areas with thermal or air pollution; the compensation space, or say, compensation space for climate ecology, exchanges air with its adjacent space in order to generate regional air circulation; the ventilation path connects the action space and the compensation space, with relatively low land surface roughness and less resistance to air flow [22]. However, in practice and in the dynamic process of wind movement, it is easy for airflow to detour when encountering obstacles, and buildings are the most common obstacles blocking wind movement in cities [23,24]. Studies have shown that building density as the main factor limits the effective range of ventilation corridors [25]. In addition, the distribution of buildings and changes in different building forms can profoundly affect the ventilation efficiency of cities [26,27,28,29].
Moreover, it is known that in vegetated areas, water has a strong cooling effect, and reasonable road planning is important in the design of ventilation corridors [12,30,31]. The ventilation corridor can also let airflow penetrate into the inner area of urbanization, and green façades, water, and roads can further extend the cooling intensity, which proves the importance of using green plants, water, and roads properly to expand the cooling potential of these areas [32,33]. Therefore, the urban ventilation potential can be estimated by the surface roughness determined by the building density, natural vegetation, water body, and road network [14,34,35]. In addition, besides the dynamic factors of urban wind movement, the thermal difference in surface temperature also can reflect the ventilation efficiency and the effect of urban wind corridors [36,37]. Compared with the previous TM (Thematic Mapper) or ETM (Enhanced Thematic Mapper) sensors, Landsat 8′s thermal infrared sensor TIRS (thermal infrared sensor) has two thermal infrared wavelengths, with more advantages in LST inversion than its earlier satellite remote sensing products of the same series [38,39]. The single-window algorithm can directly include the influence of the atmosphere and the surface in the calculation formula, is simple and easy to apply, and can be applied to the land surface temperature inversion study of the long-term series of Landsat data [40].
Therefore, in this study, based on the combination of meteorological analysis and RS technology and GIS, we analyzed the method of planning ventilation corridors for Kaifeng in China. The single-window algorithm for land surface temperature inversion and the action space and compensation space were defined by the results of the surface temperature inversion. Building density, road network length, water body length, and vegetation coverage were selected as the evaluation indicators that affect the ventilation potential, and we constructed a comprehensive evaluation model that can reflect the ventilation potential of various regions in the city. We extracted the wind direction and speed data of various weather stations in Kaifeng, analyzed the wind environment, and drew a wind rose diagram to determine the dominant wind direction. Finally, the source areas of three ecological ventilation corridors and two ventilation corridors in the east and west of the main urban area of Kaifeng were planned.

2. Data and Methods

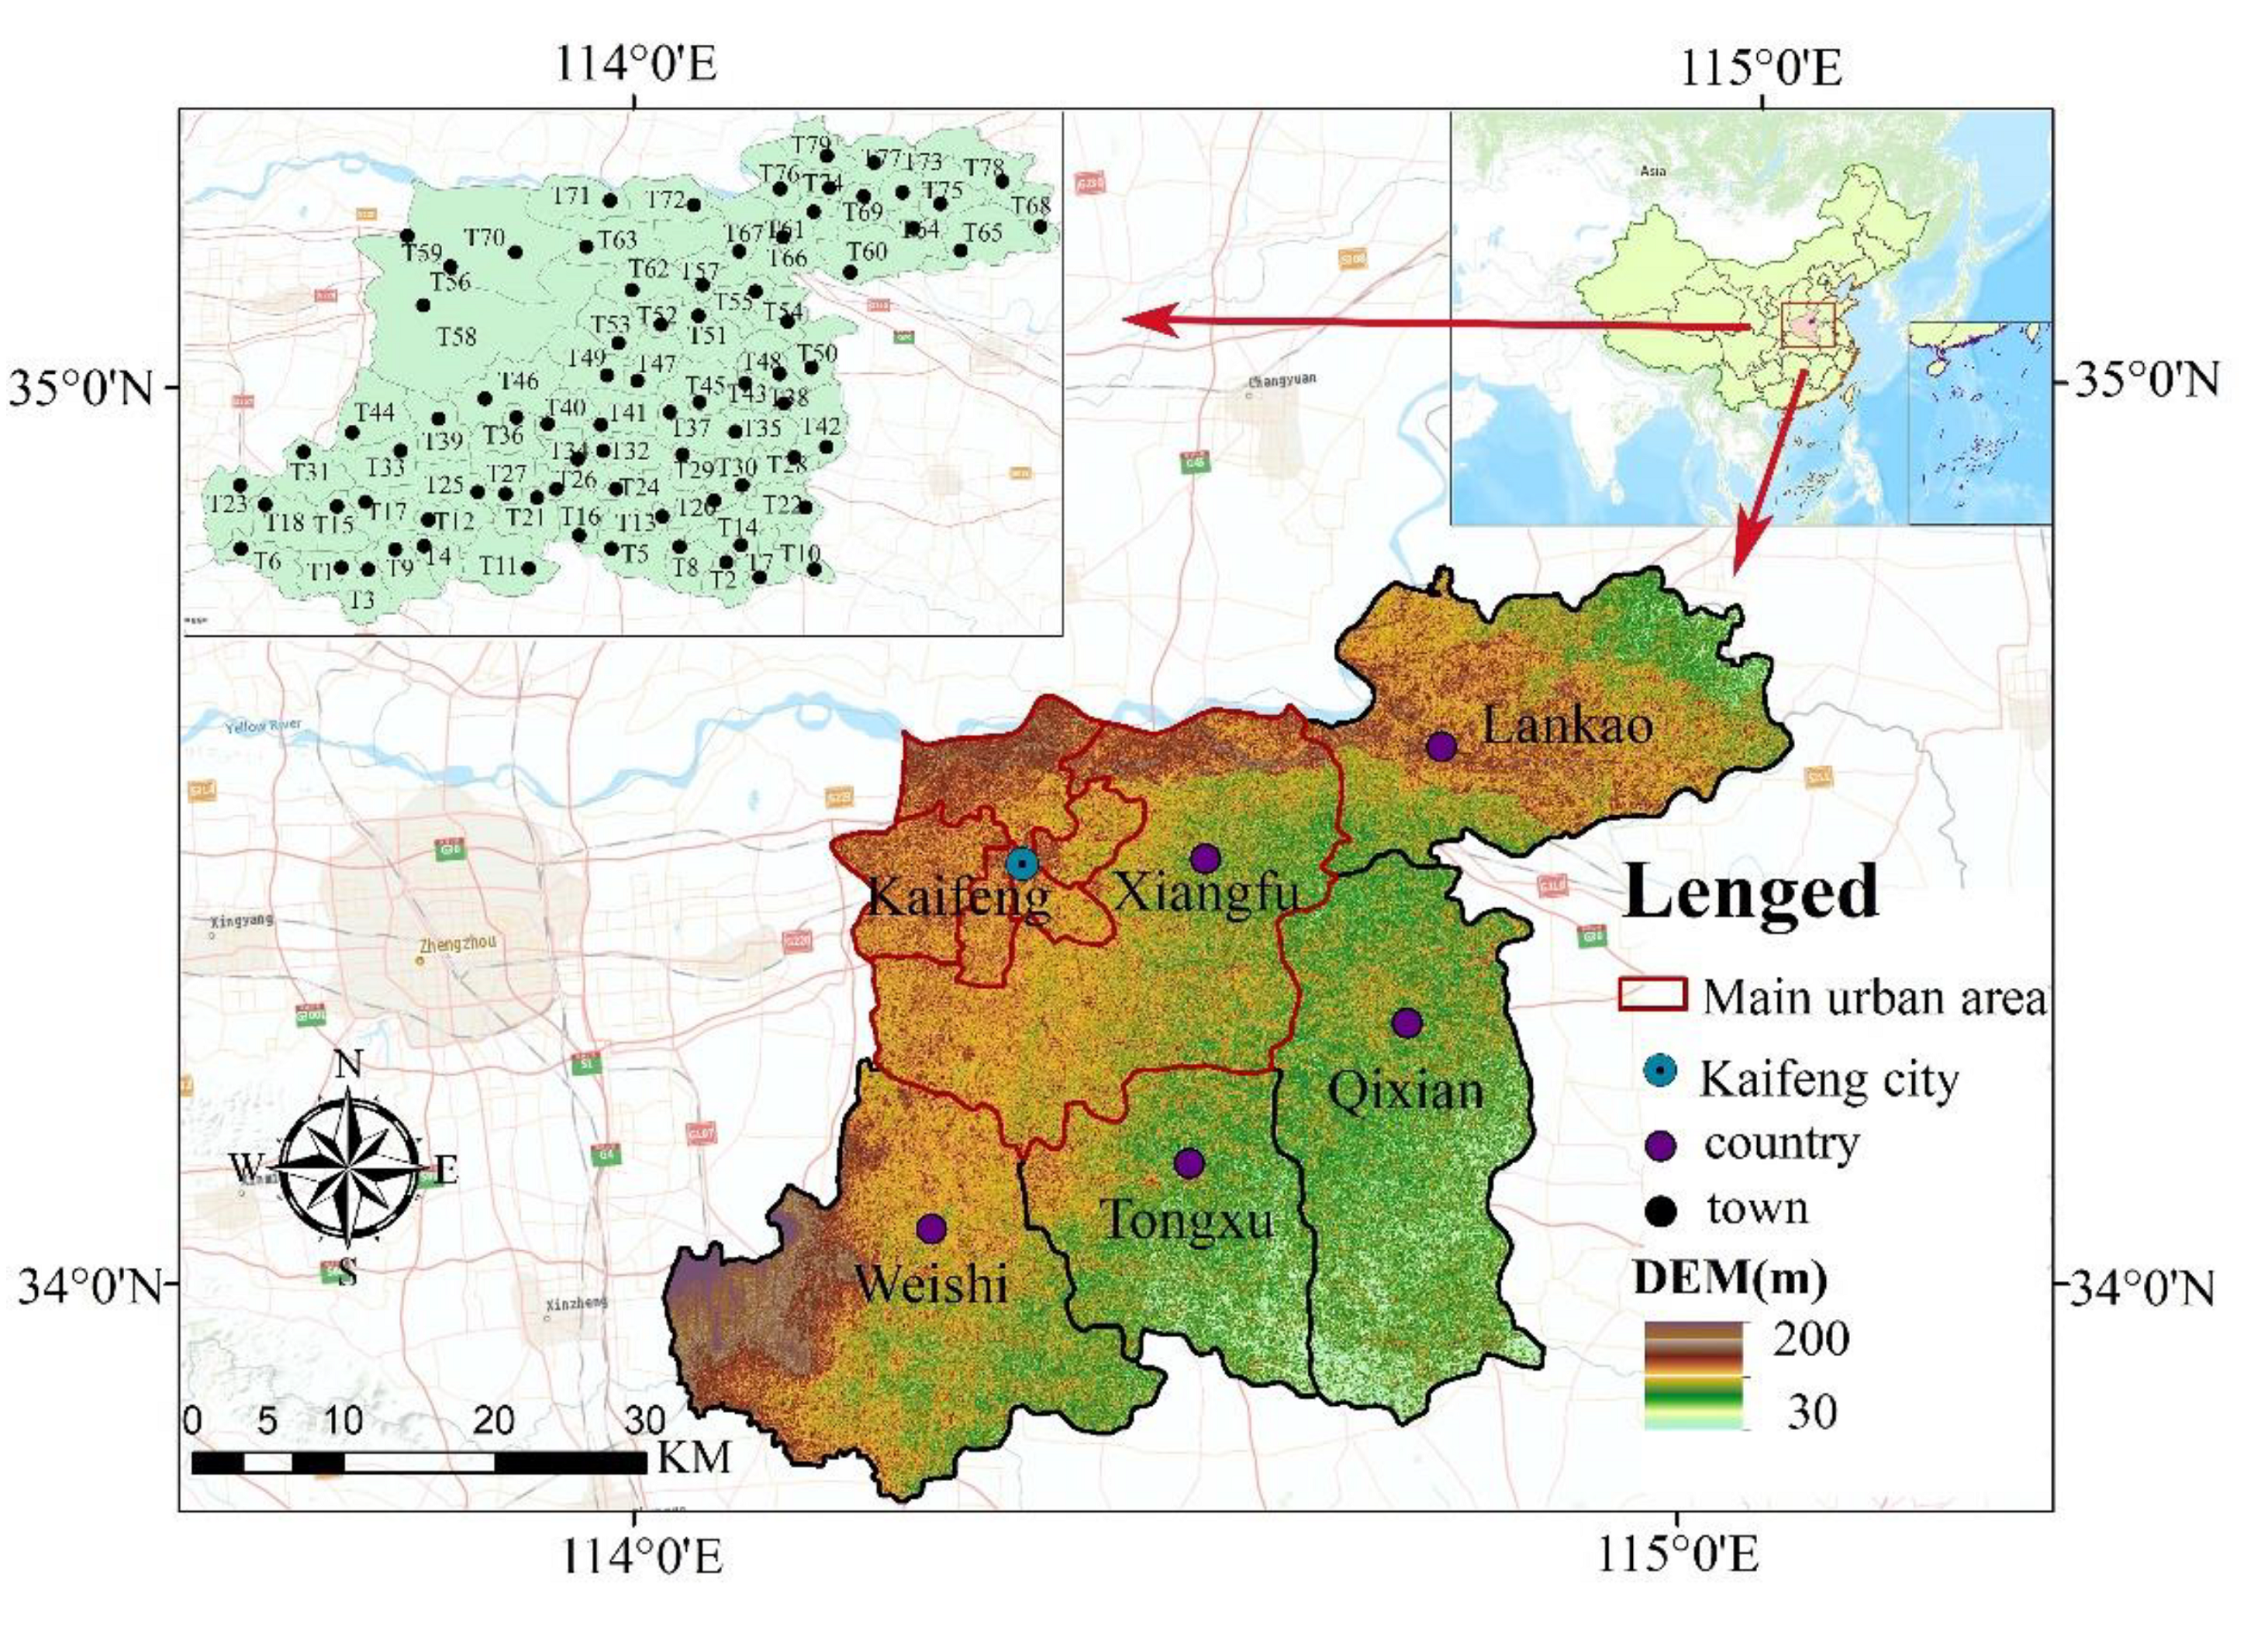
2.1. Data Resource and Study Area

In this study, the Landsat8OLI_TIRS remote sensing image with 30 m spatial resolution was used, i.e., 7 May 2017, 10 July 2017, 30 October 2017, and 17 December 2017, with cloud cover of 1.52, 2.21, 0.57, and 2.22; these data were downloaded from (http://www.gscloud.cn/#page1/1, accessed on 13 August 2021). The data of building density came from the land use data (100 m spatial resolution in 2017) released by the Data Center of Resources and Environmental Sciences, Chinese Academy of Sciences, which can be downloaded from (https://www.resdc.cn, accessed on 16 April 2021). Road network and water system data were obtained from the National Basic Geographic Database (1:1 million, 2017) (https://www.webmap.cn/commres.do?method=result100W, accessed on 19 July 2021). Hourly wind direction and wind speed data were provided by the China Meteorological Data Service Centre (http://data.cma.cn, accessed on 27 June 2021).
Kaifeng is located in the east of the central part of Henan Province, bordering on the Yellow River in the north, and in the North China Plain, including five districts (Kaifeng city, Lankao, Qixian, Tongxu, and Weishi). Kaifeng’s terrain is flat, and the average altitude is 70 m, without rolling terrain such as mountains and hills. The total area of the city is 6.4 × 10³ square kilometers, and the permanent population is 4.8 × 10² ten thousand, i.e., a typical medium-sized city. Therefore, the urban layout, building density, and vegetation cover can be the decisive factors affecting the ventilation of Kaifeng; moreover, it is very representative in studying the influence of the urban underlying surface on ventilation corridors. In addition, Kaifeng is located in the Yellow River Basin and has a natural source of cold airflow. However, it mainly has tourism and a large population flow, which can easily cause air pollution and form an urban heat island effect. Kaifeng currently does not have a complete ventilation corridor planning system. Figure 1 shows the geographical location of Kaifeng.

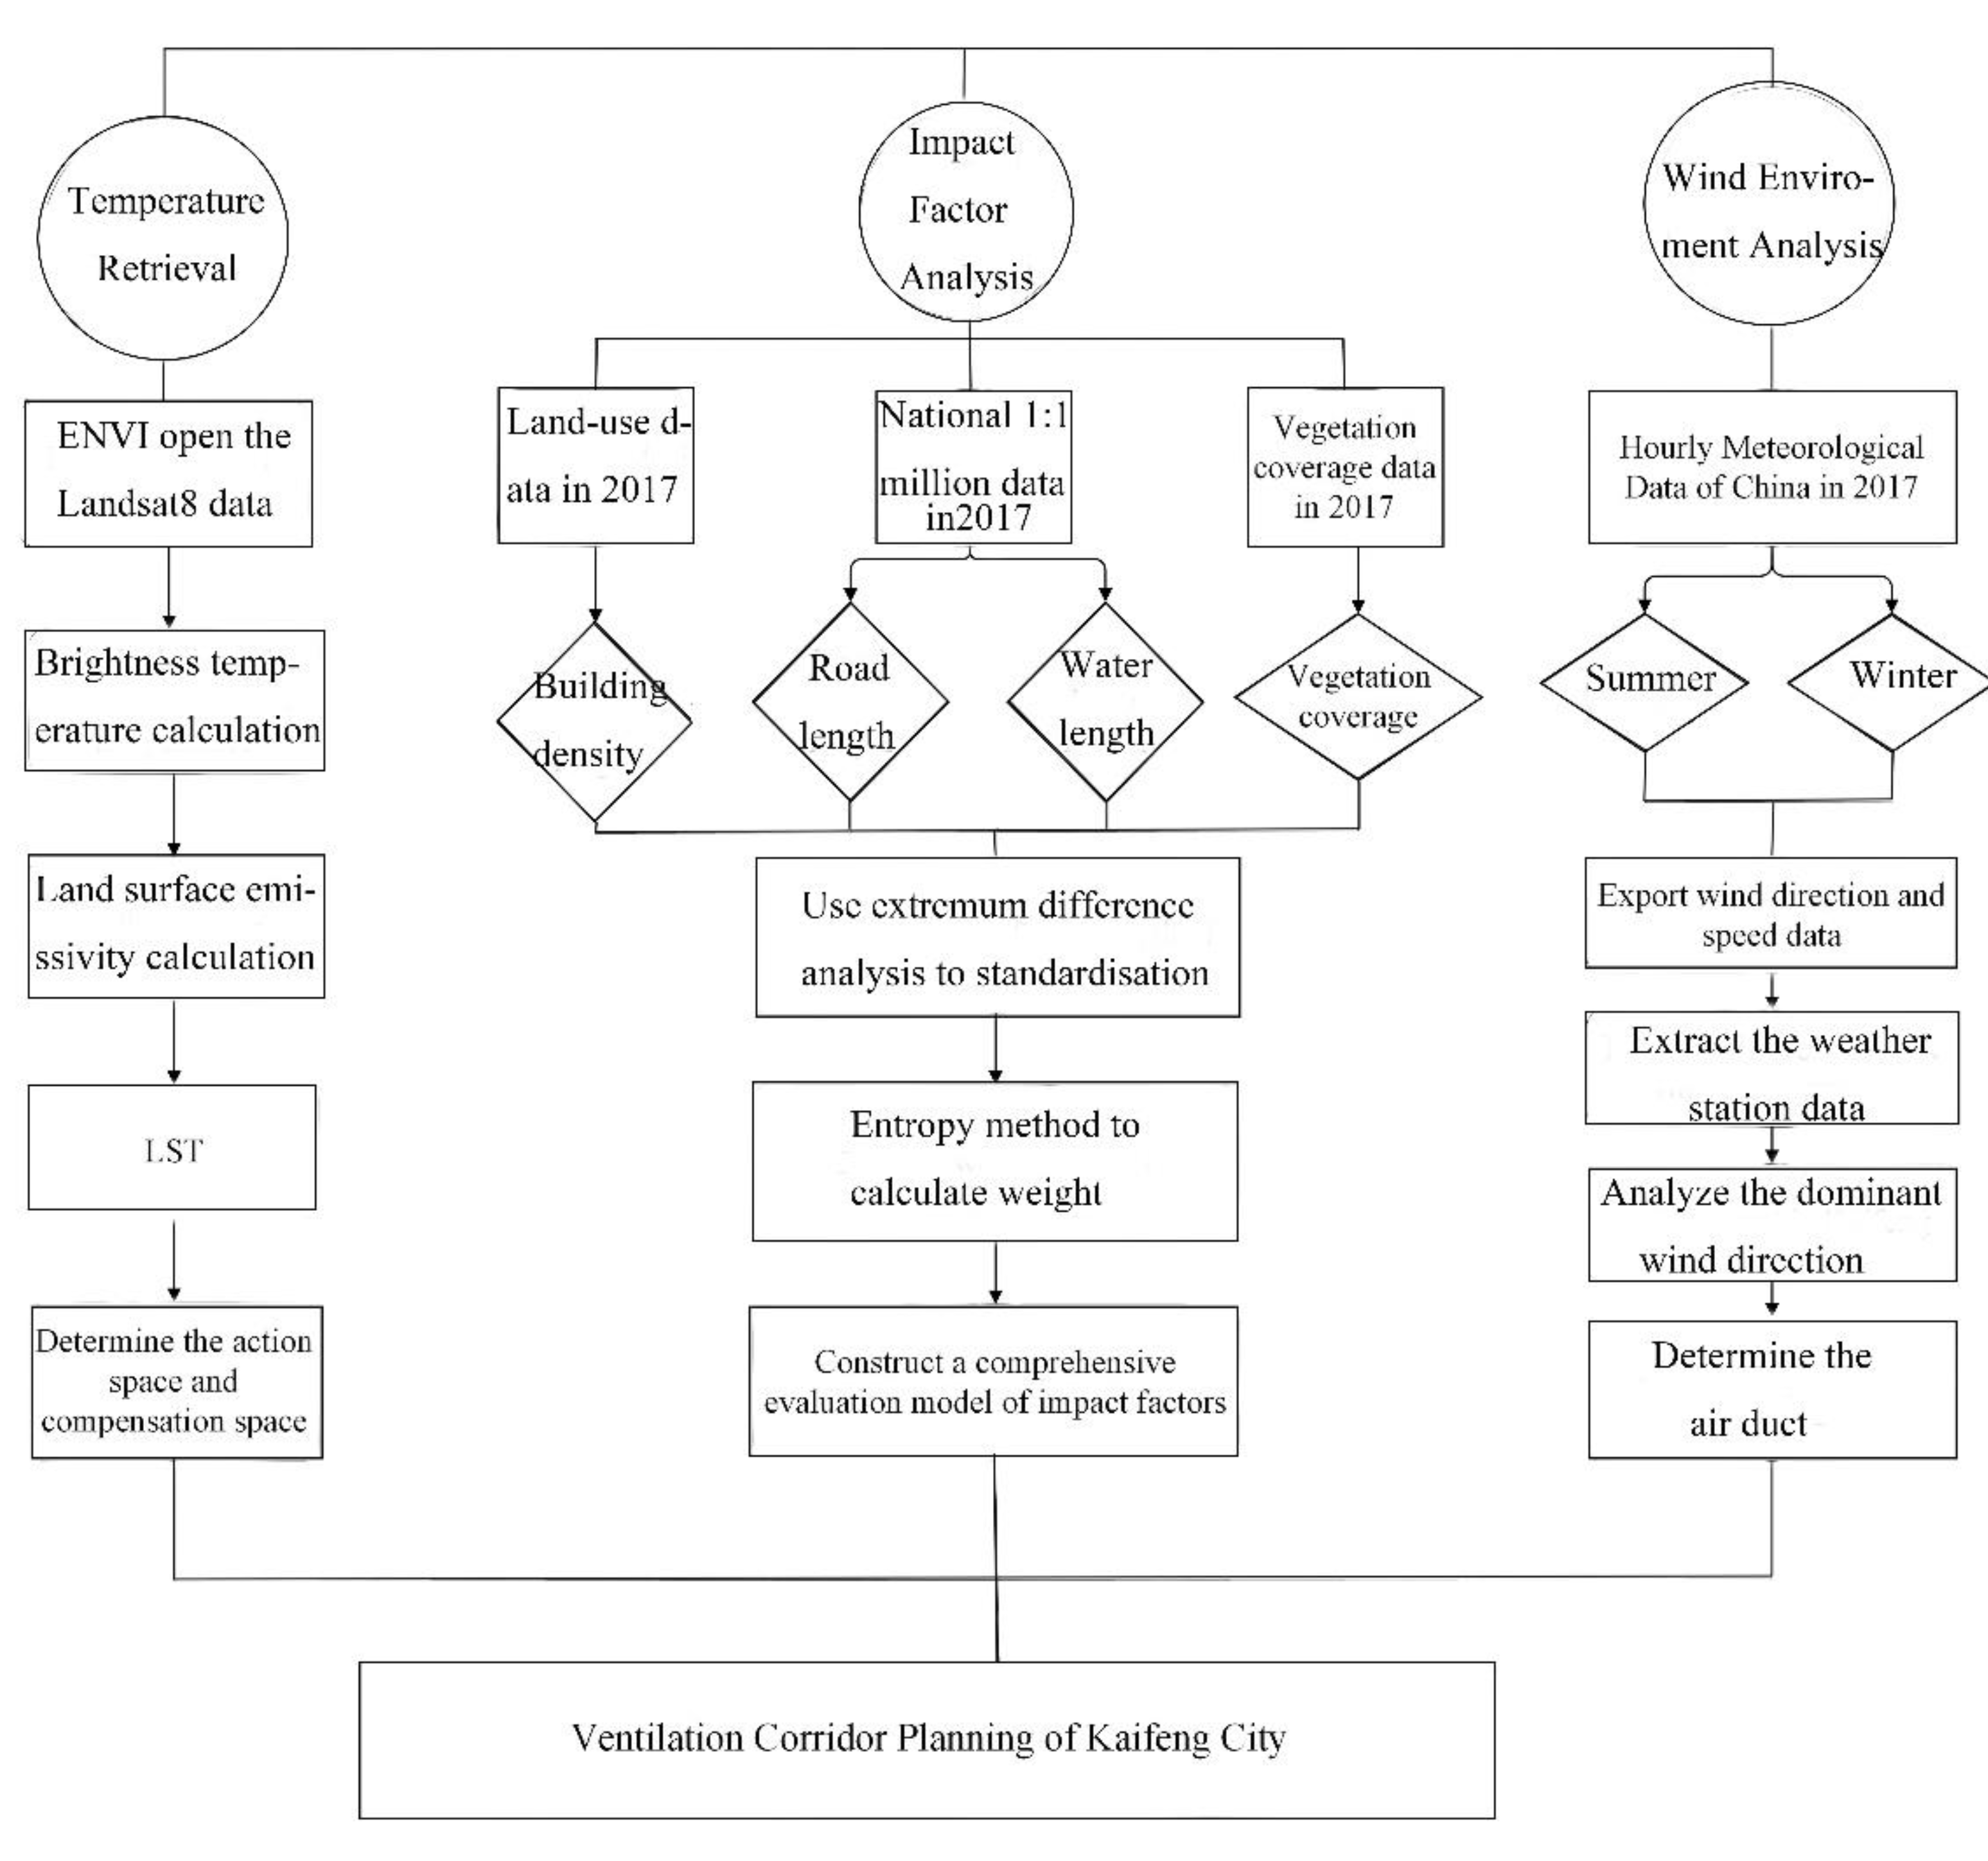
2.2. Research Method

2.2.1. Land Surface Temperature Inversion from Landsat 8 Images

For the algorithms that use remote sensing data to calculate surface temperature, the single-window algorithm is an efficient method to retrieve surface temperature [38,41,42,43]. Considering the advantages of Landsat 8 products’ resolution, this paper adopted the single-window algorithm to retrieve the land surface temperature of Kaifeng by using Landsat 8 OLI_TIRS satellite digital products.
(1)
Brightness temperature calculation
Radiation calibration of the thermal infrared band (band 10) was conducted, and the brightness temperature was calculated by Equation (1).
T i = K 2 / l n 1 + K 1 / L λ  
Here, T i is the brightness temperature,   L λ is the radiance value of the 10th band. K 1 and K 2 are constants, the K 1 value of the 10th band is 774.89 W/(m2∙sr∙μm), and K 2 is 1321.08 K.
(2)
Surface specific emissivity calculation
Radiometric calibration of multi-spectral images was conducted, and we calculated NDVI and recorded the values with cumulative percentages of 5% and 95%. The vegetation coverage ( f v c ) was calculated by Equation (2), and the surface specific emissivity ( ε ) was calculated by Equation (3).
f v c = b 1   l t   N D V I M I N · 0 + b 1   g t   N D V I M A X · 1 + b 1 N D V I M I N / N D V I M A X N D V I M I N · b 1   g e   N D V I M I N   a n d   b 1   l e   N D V I M A X  
NDVIMAX and NDVIMIN represent NDVI values with cumulative percentages of 5% and 95%, respectively; b1 is the image value after multispectral radiometric calibration.
ε = 0.004 · f v c + 0.986  
(3)
LST calculation
The LST can be calculated as follows:
C = ε · τ
D = 1 ε · 1 + 1 ε · τ
T a = 16.0110 + 0.9262 T 0  
L S T = a · 1 C D + b · 1 C D + C + D · T i D · T a C 273.15    
Here, ε is the surface specific emissivity (calculated by Equation (3)), τ is atmospheric permeability (https://atmcorr.gsfc.nasa.gov, accessed on 13 August 2021), a and b are empirical coefficients; when the temperature is (0–70 °C, a = −67.355351, b = 0.458606), T i is brightness temperature (calculated by Equation (1)), and T a is the atmospheric average action temperature, in K, calculated by Equation (6). T 0 is the near-surface temperature in K, which can be obtained by querying the historical weather (http://lishi.tianqi.com, accessed on 13 August 2021).

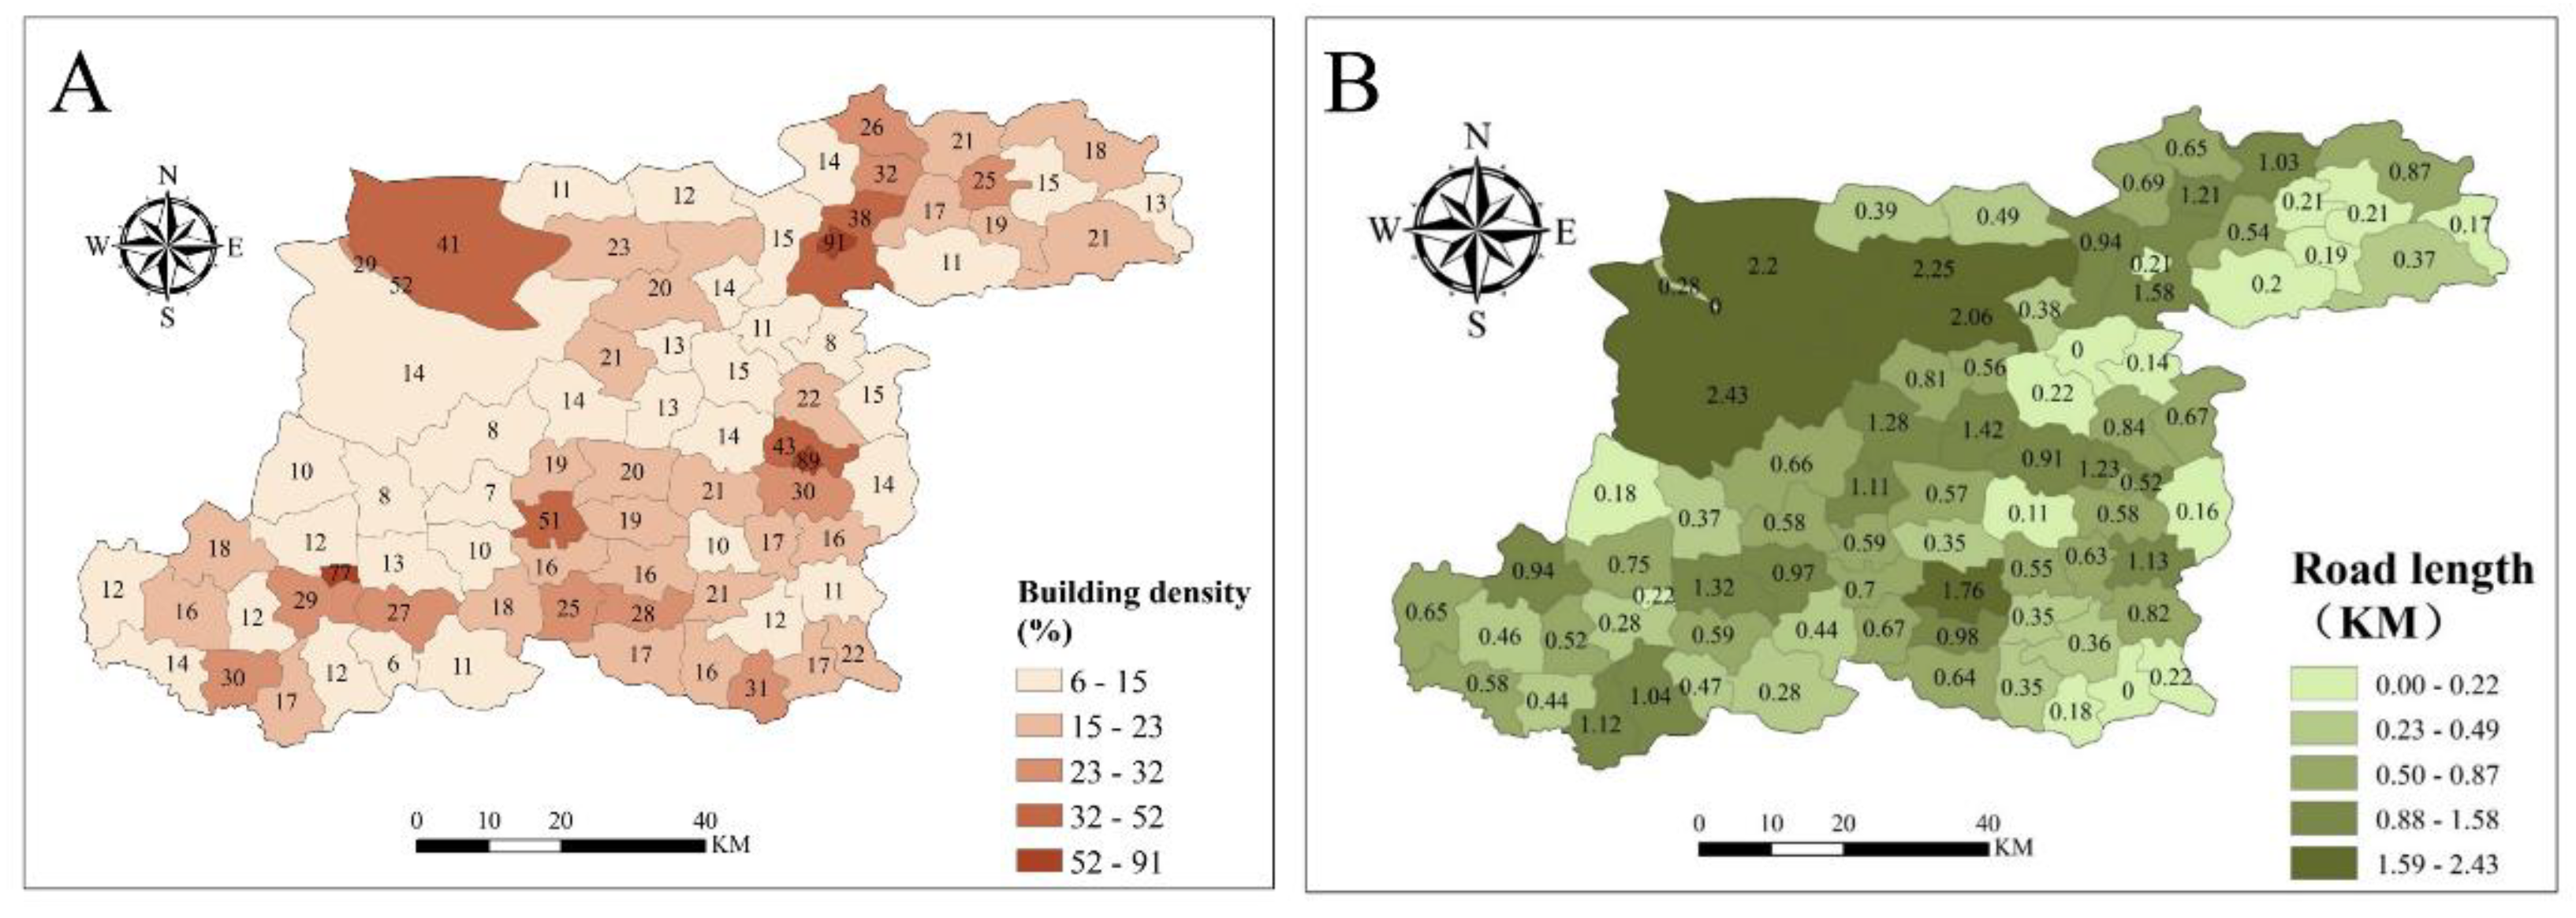
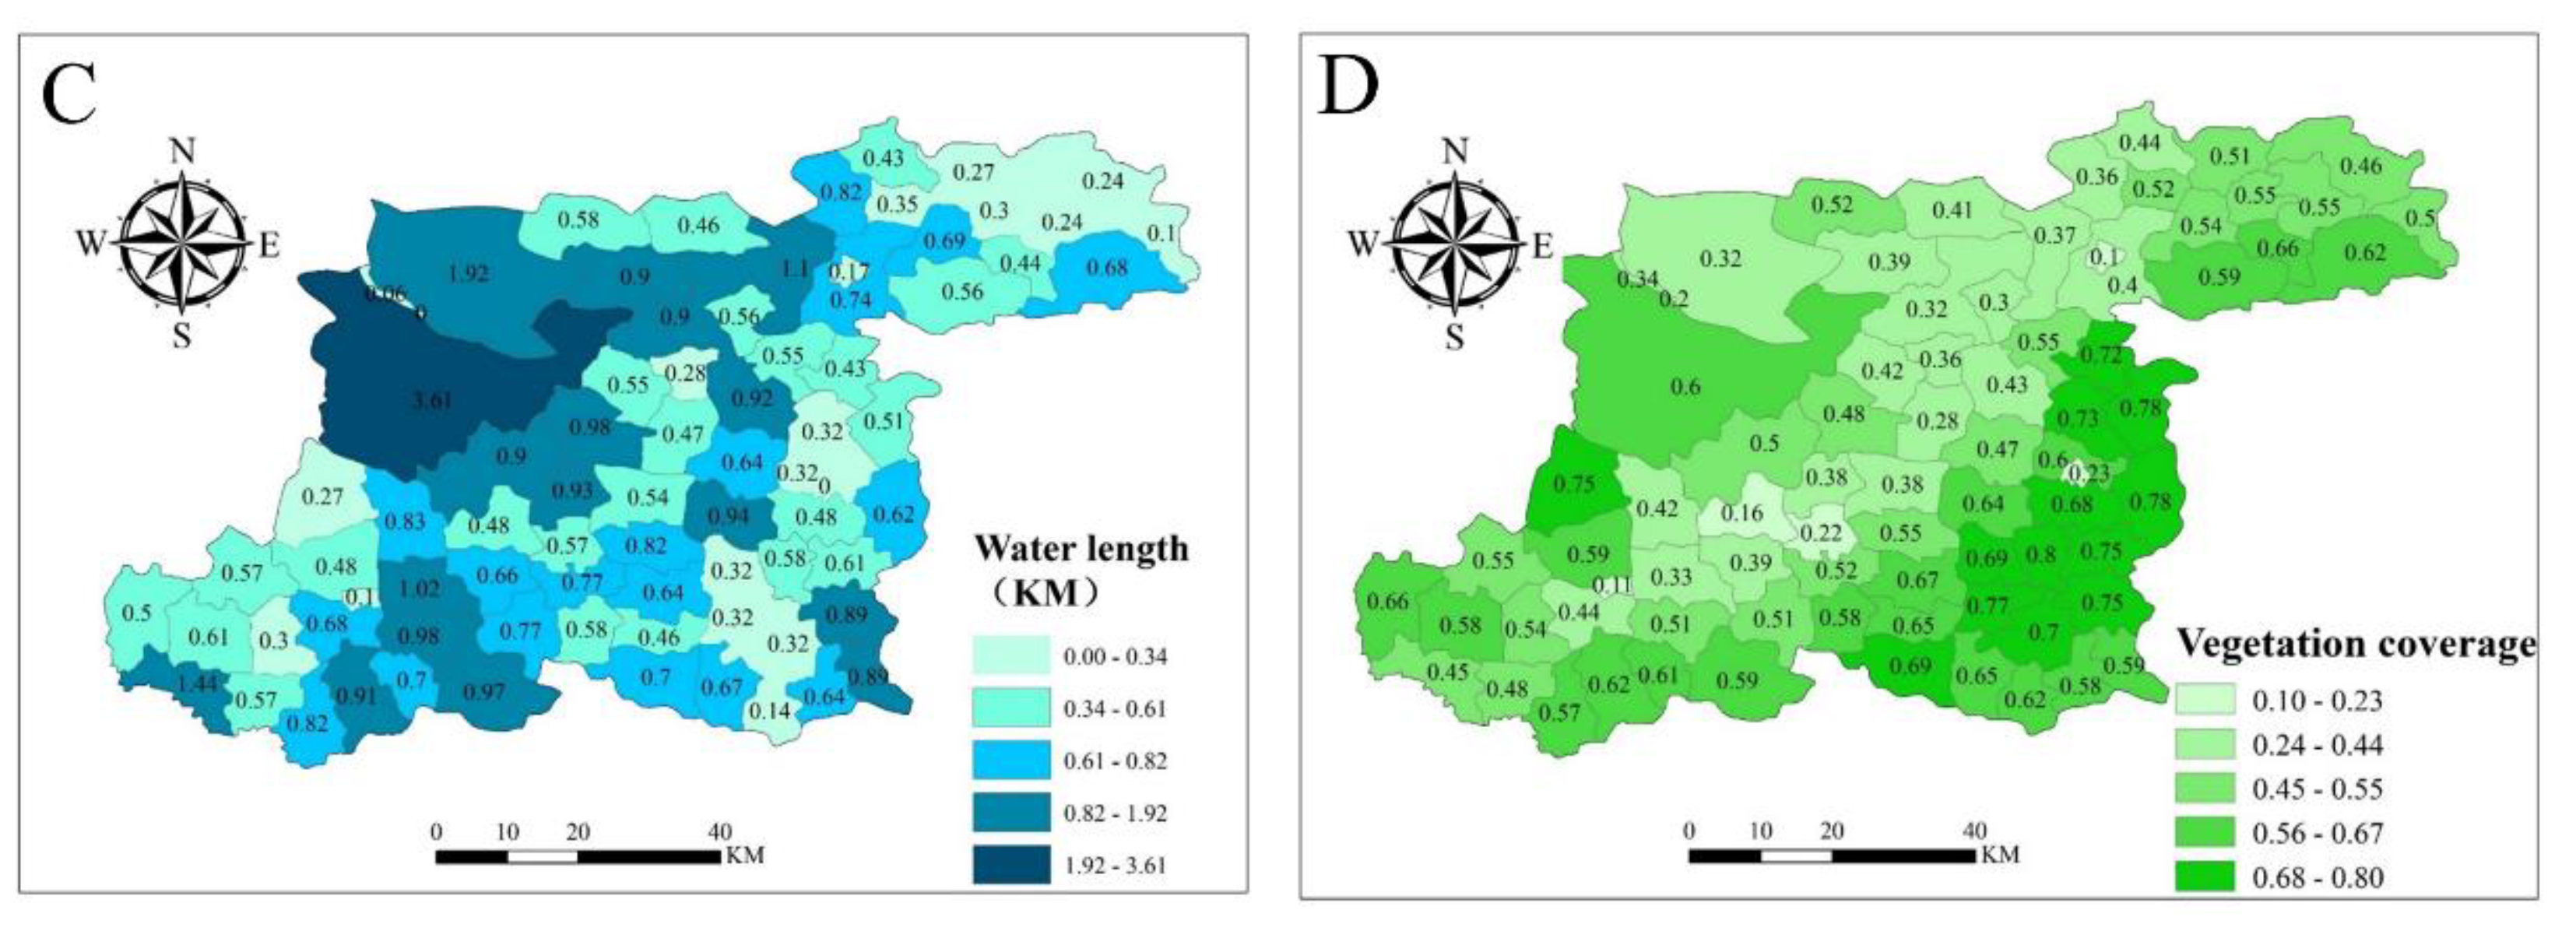
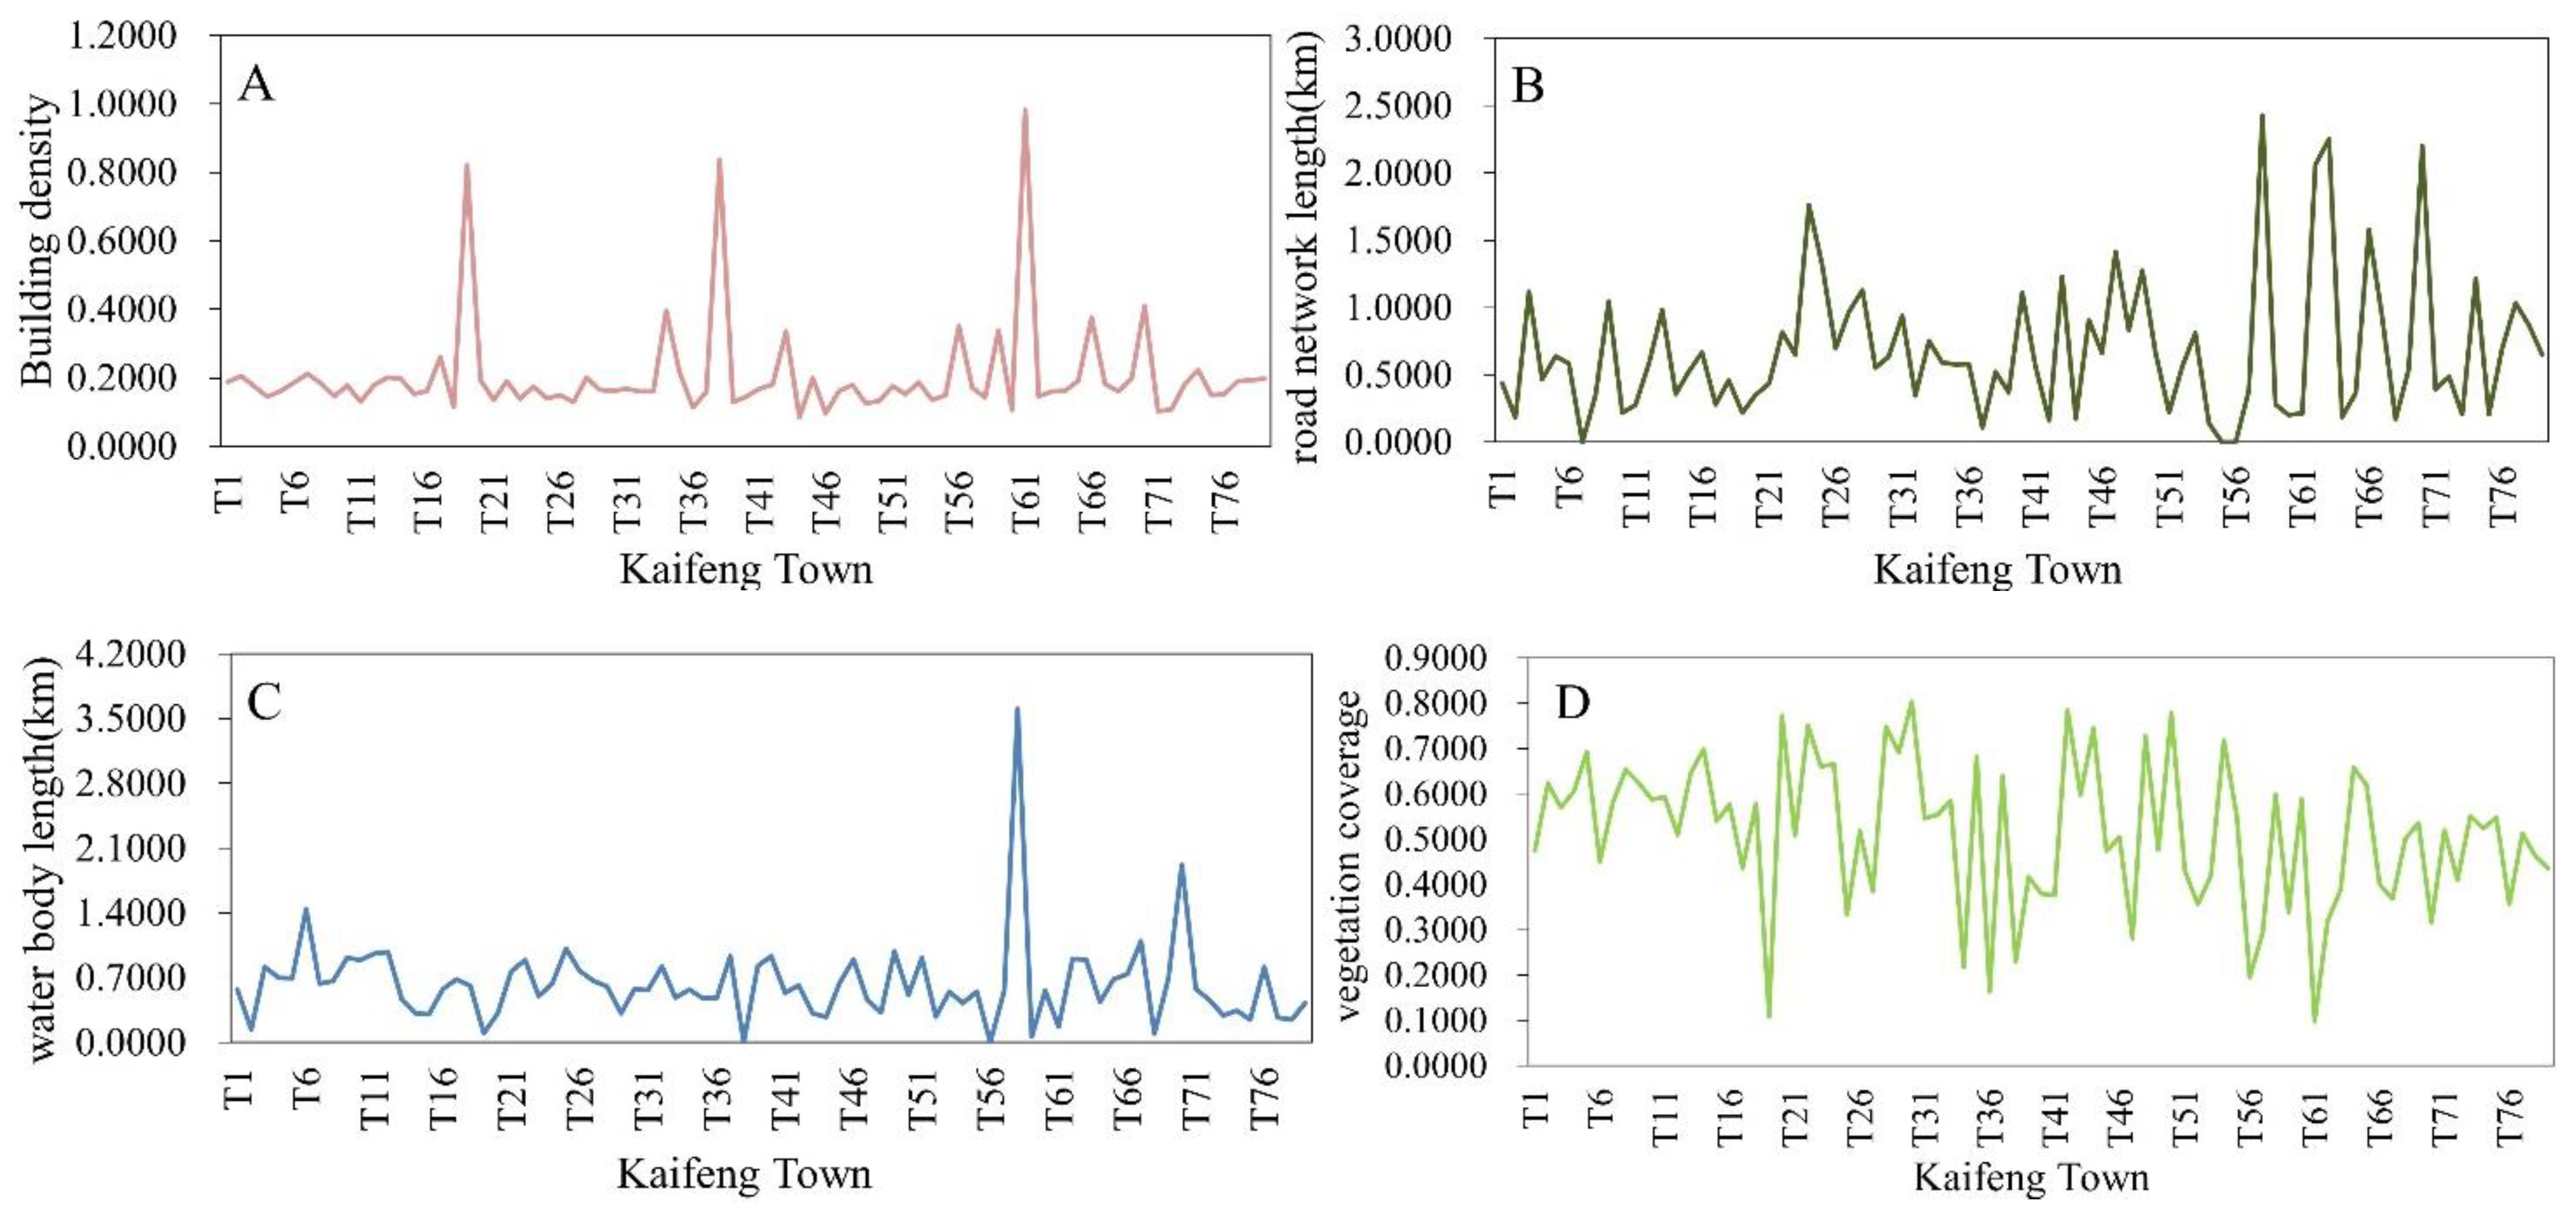
2.2.2. Constructing a Comprehensive Evaluation Model of the Ventilation Potential

Surface roughness, a three-dimensional quantity related to scale, is one of the important parameters that characterize the influence of urban morphology on wind circulation. It is often related to factors such as building density, natural vegetation, water bodies, and urban road accessibility [44]. Therefore, building density, vegetation coverage, water length, and road length were selected as the influential factors for evaluating the ventilation potential. Among them, the building density is calculated using the formula: building density = building area/town area. The framework of this study is as follows (Figure 2).
By constructing a comprehensive evaluation model of the ventilation potential, the effects of various influential factors can be integrated together, and the ventilation potential of each area can be more intuitively expressed, which can be used as a basis for planning the ventilation corridor. We standardized the original data by using the extremum difference analysis method (Equations (8) and (9)) [45,46] in which the building density is a negative index, and the water length, road length, and vegetation coverage are positive indexes.
A i j = X i j m i n X i j m a x X i j m i n X i j   ( X i j   is   a   positive   indicator ) ,
A i j = m a x X i j X i j m a x X i j m i n X i j   ( X i j   is   a   negative   indicator ) ,
Calculate the information entropy E i of each index by Equation (10).
E i = l n n 1 i = 1 n P i j l n p i j ,
P i j = Y i j / i = 1 n Y i j , if P i j = 0 , then define lim P n 0 P i j l n P i j = 0 .
Determine the weight of each index by Equation (11).
ω i = 1 E i k E i i = 1 , 2 , , k ,
The ventilation potential can be obtained as follows:
V = j = 1 n x j × ω j   ,
In which x j is the single factor evaluation value of the jth influential factor, and ω j (Table 1) is the weight value of the jth influential factor.

3. Results

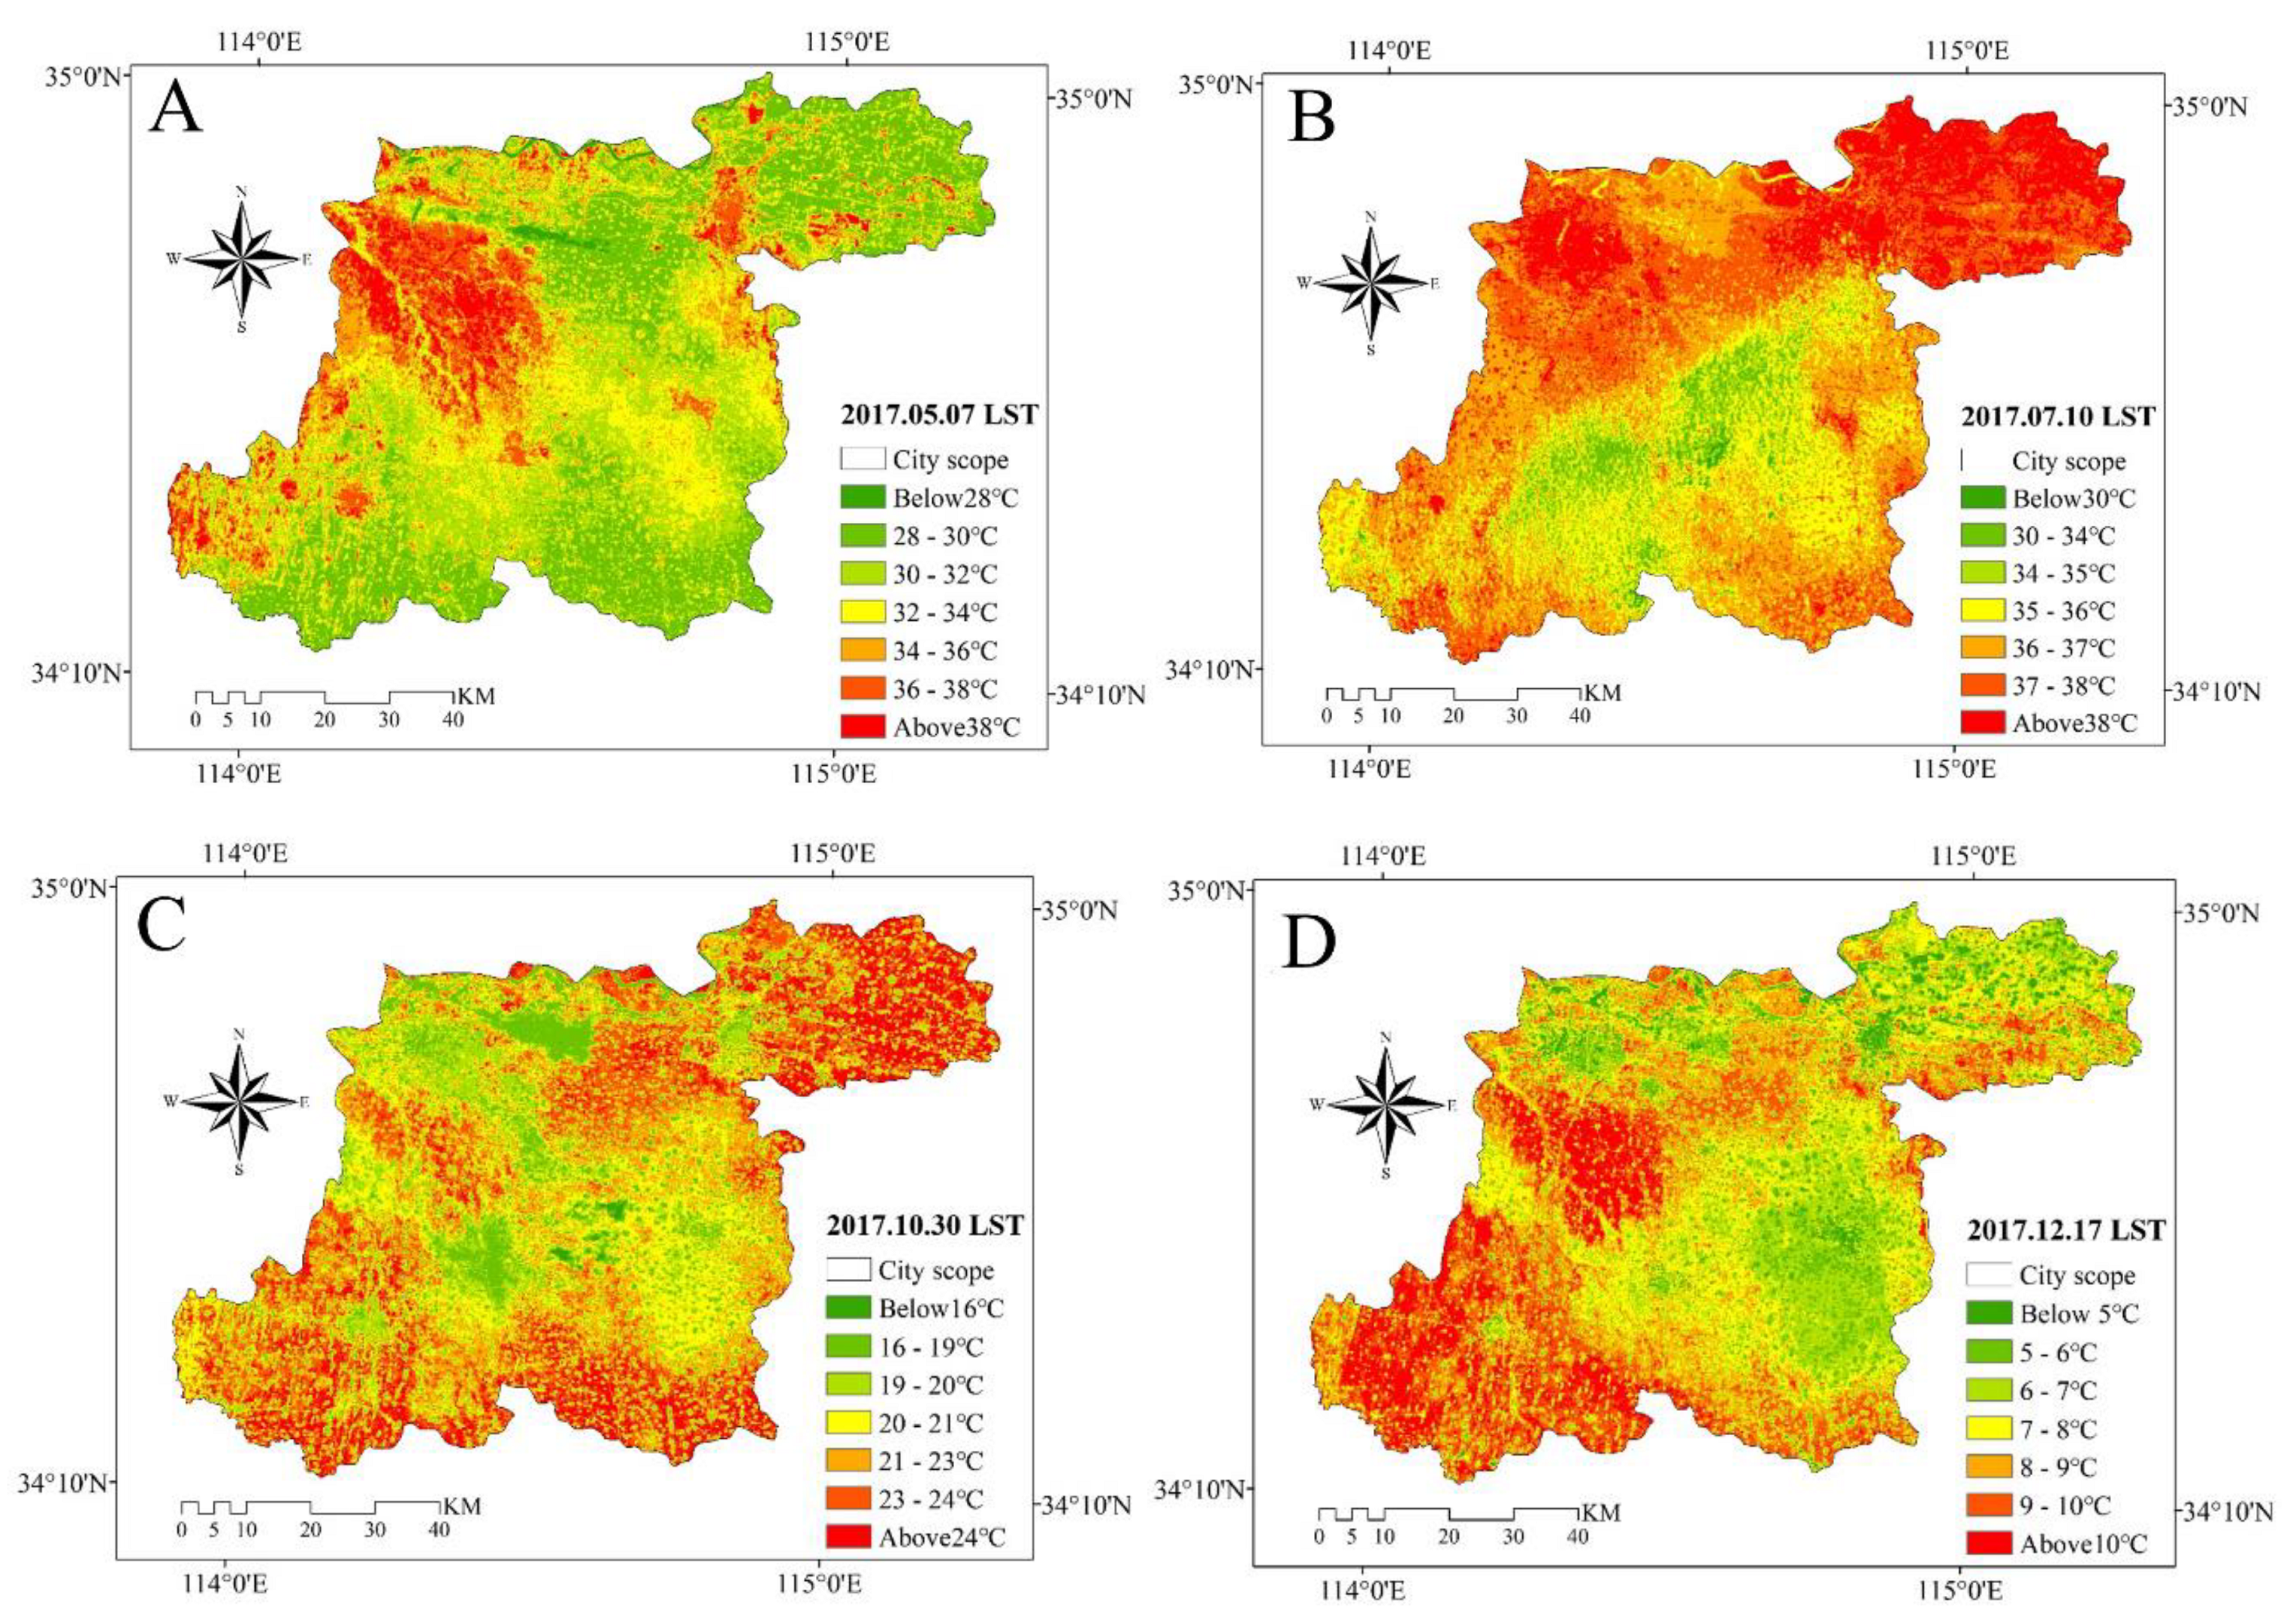
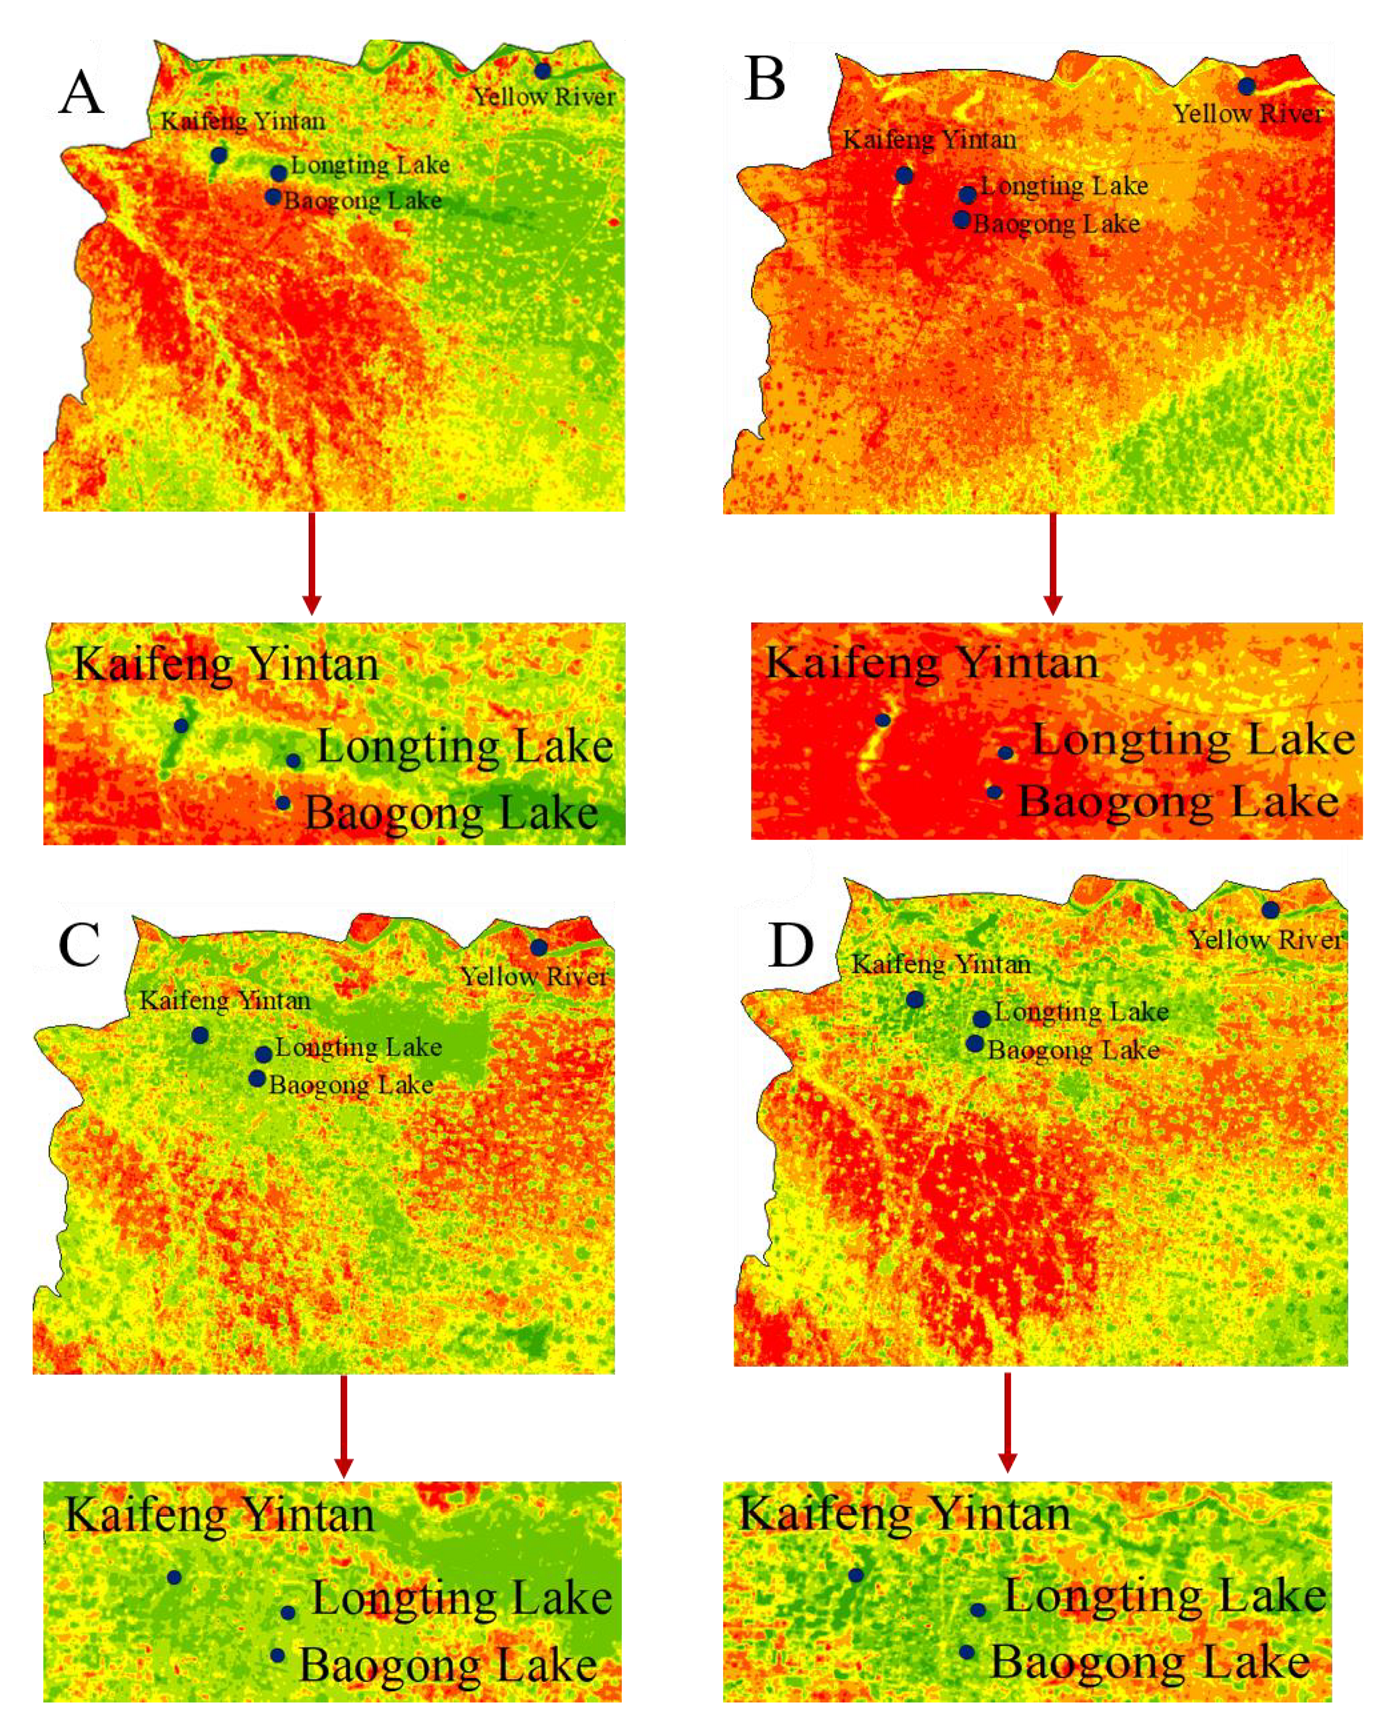
3.1. Surface Temperature

Because there are not enough meteorology stations in Kaifeng to provide high-resolution ground observations, we chose Landsat 8 data to retrieve the surface temperature. According to the surface temperature distribution, the location of the high-temperature areas and the low-temperature areas can be seen intuitively.
From the inversion results of surface temperature at different times, the spatial distribution of LST varied greatly, which may be related to the vegetation coverage and the area of bare soil in different seasons, but the LST in the main urban area has always been relatively high. As shown in Figure 3, the vegetation coverage in May was good, and from the inversion results, the high-temperature area was a large area of flakes, mainly distributed in the main city, showing obvious an urban heat island phenomenon. Due to direct sunlight, the LST in July was generally high, with a three-section distribution. Moreover, according to Figure 3, it can be seen that the areas with high LST in July were mainly concentrated in areas with low vegetation coverage. The high-temperature zone of LST in October spread to the surroundings and was mainly divided into four sections; the high-temperature zone in December was divided into two sections, distributed in the main urban area and Weishi.
In addition, we extracted the surface temperature coverage of the main urban area, as shown in the partial map corresponding to Figure 4. It is easy to see that the temperature in the main urban area in May, July, and December was relatively high and concentrated. The distribution of the high-temperature area in October was relatively scattered, mainly divided into two sections. In the densely distributed main urban areas of high-temperature areas, the corresponding surface temperatures of the Yellow River, Kaifeng Yintan, Longting Lake, and Baogong Lake were relatively low, and there were many water bodies, which can provide a source of cold air for the city and can be used as an alternative area of compensation space.
We fused the average of the four images together, as shown in Figure 5. The spatial distribution of the LST was similar to that on 7 May. Moreover, the high-temperature area was mainly distributed in the main city, and the urban heat island phenomenon was obvious. Therefore, according to the distribution of surface temperature, we initially determined the action space (A1–A14) and compensation space (Kaifeng Yintan, Baogong Lake, Longting Lake, Nanhu Park, and surrounding farmland green space) within the city.

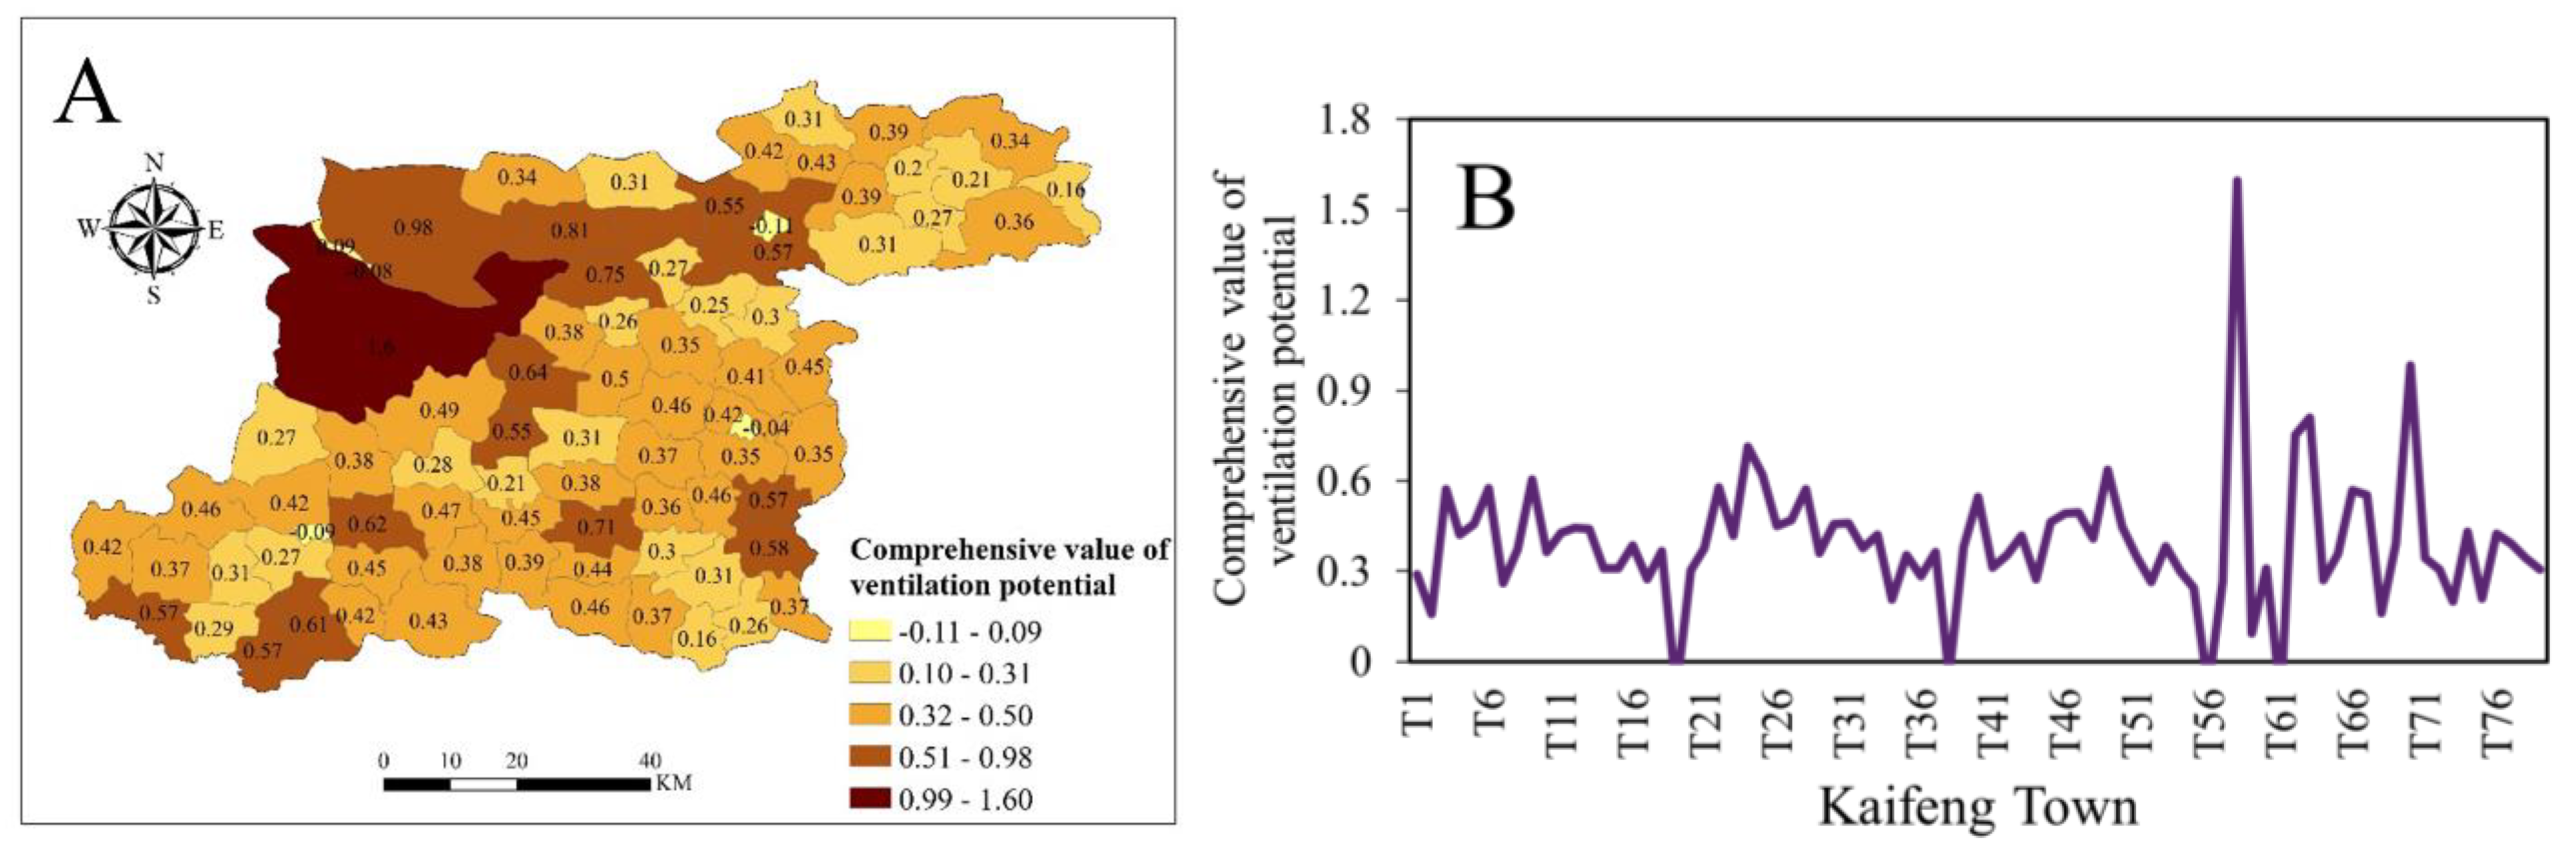
3.2. Potential Analysis of City Ventilation

It can be seen from Figure 6 and Figure 7 that the building density, road length, and water length in the main urban area of Kaifeng city are relatively large, but the vegetation coverage is relatively low; in comparison, vegetation coverage in the suburbs is relatively high. Besides, in the southeast of Kaifeng, the corresponding vegetation coverage is relatively high too, and compared with Figure 3, the corresponding LST at each time is low, but in areas with high building density, the corresponding ground temperature is relatively high, showing that the influential factors of the underlying surface in different regions are obviously different.
Furthermore, as shown in Figure 8, in the comprehensive impact factor analysis diagram, the darker color refers to a higher ventilation potential, and the lighter color indicates an area that is less conducive to the circulation of urban wind. It can be seen that the southern part of Kaifeng’s main urban area has good ventilation potential, while the northern part has relatively weak ventilation potential. This is because there are a large number of water bodies and accessible road networks in the southern part of the main urban area of Kaifeng, and the corresponding areas of the Yellow River, Kaifeng Yintan, Longting Lake, and Baogong Lake also have good ventilation potential. In addition, from Figure 5 and Figure 8, although the ventilation potential value of Kaifeng in the northern part is better than that in the southern part, the temperature in the north is higher than that in the south. This is because the main urban area is in the north of Kaifeng, with high building density and dense traffic. However, the southern part is the suburbs and farmland of Kaifeng, and water and vegetation are abundant, which effectively absorb the heat generated by solar radiation to achieve a cooling effect.
Therefore, it can be inferred that to reduce the surface temperature of the city, the role of the road network, water, and vegetation should be exerted. It is further known that when designing urban air ducts or improving the urban microclimate, the thermal and dynamic forcing of this underlying surface should be used.

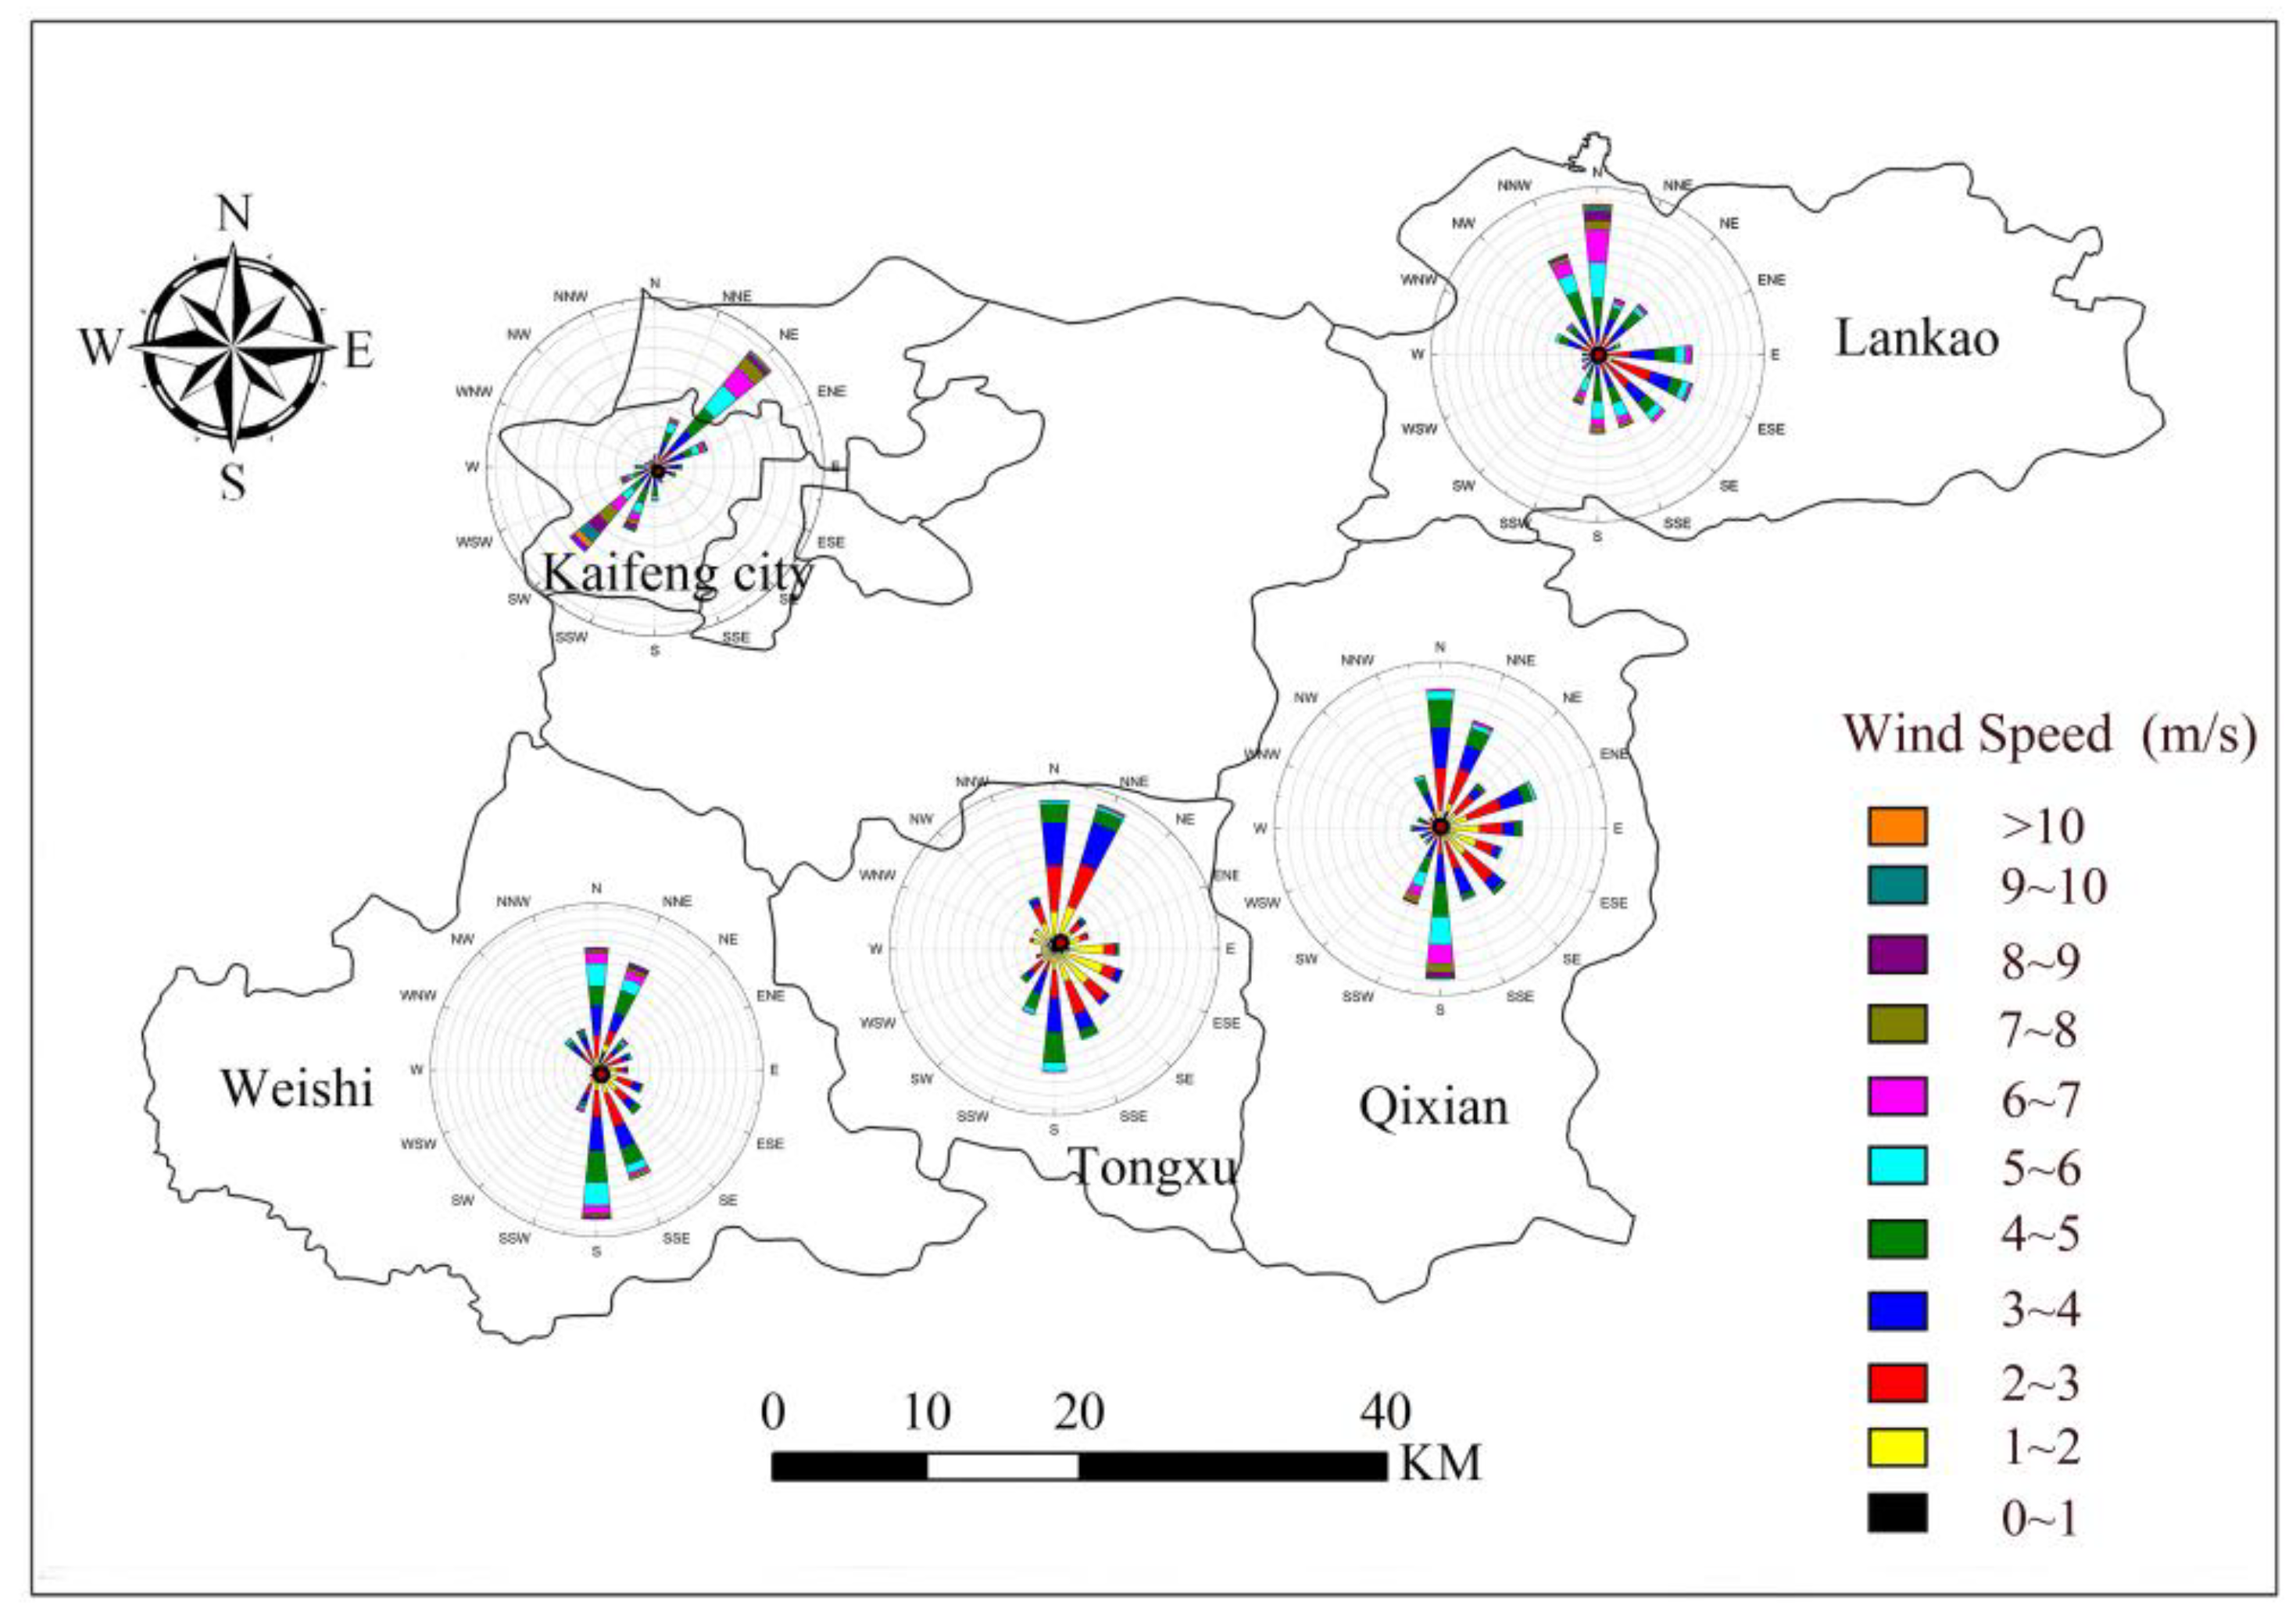
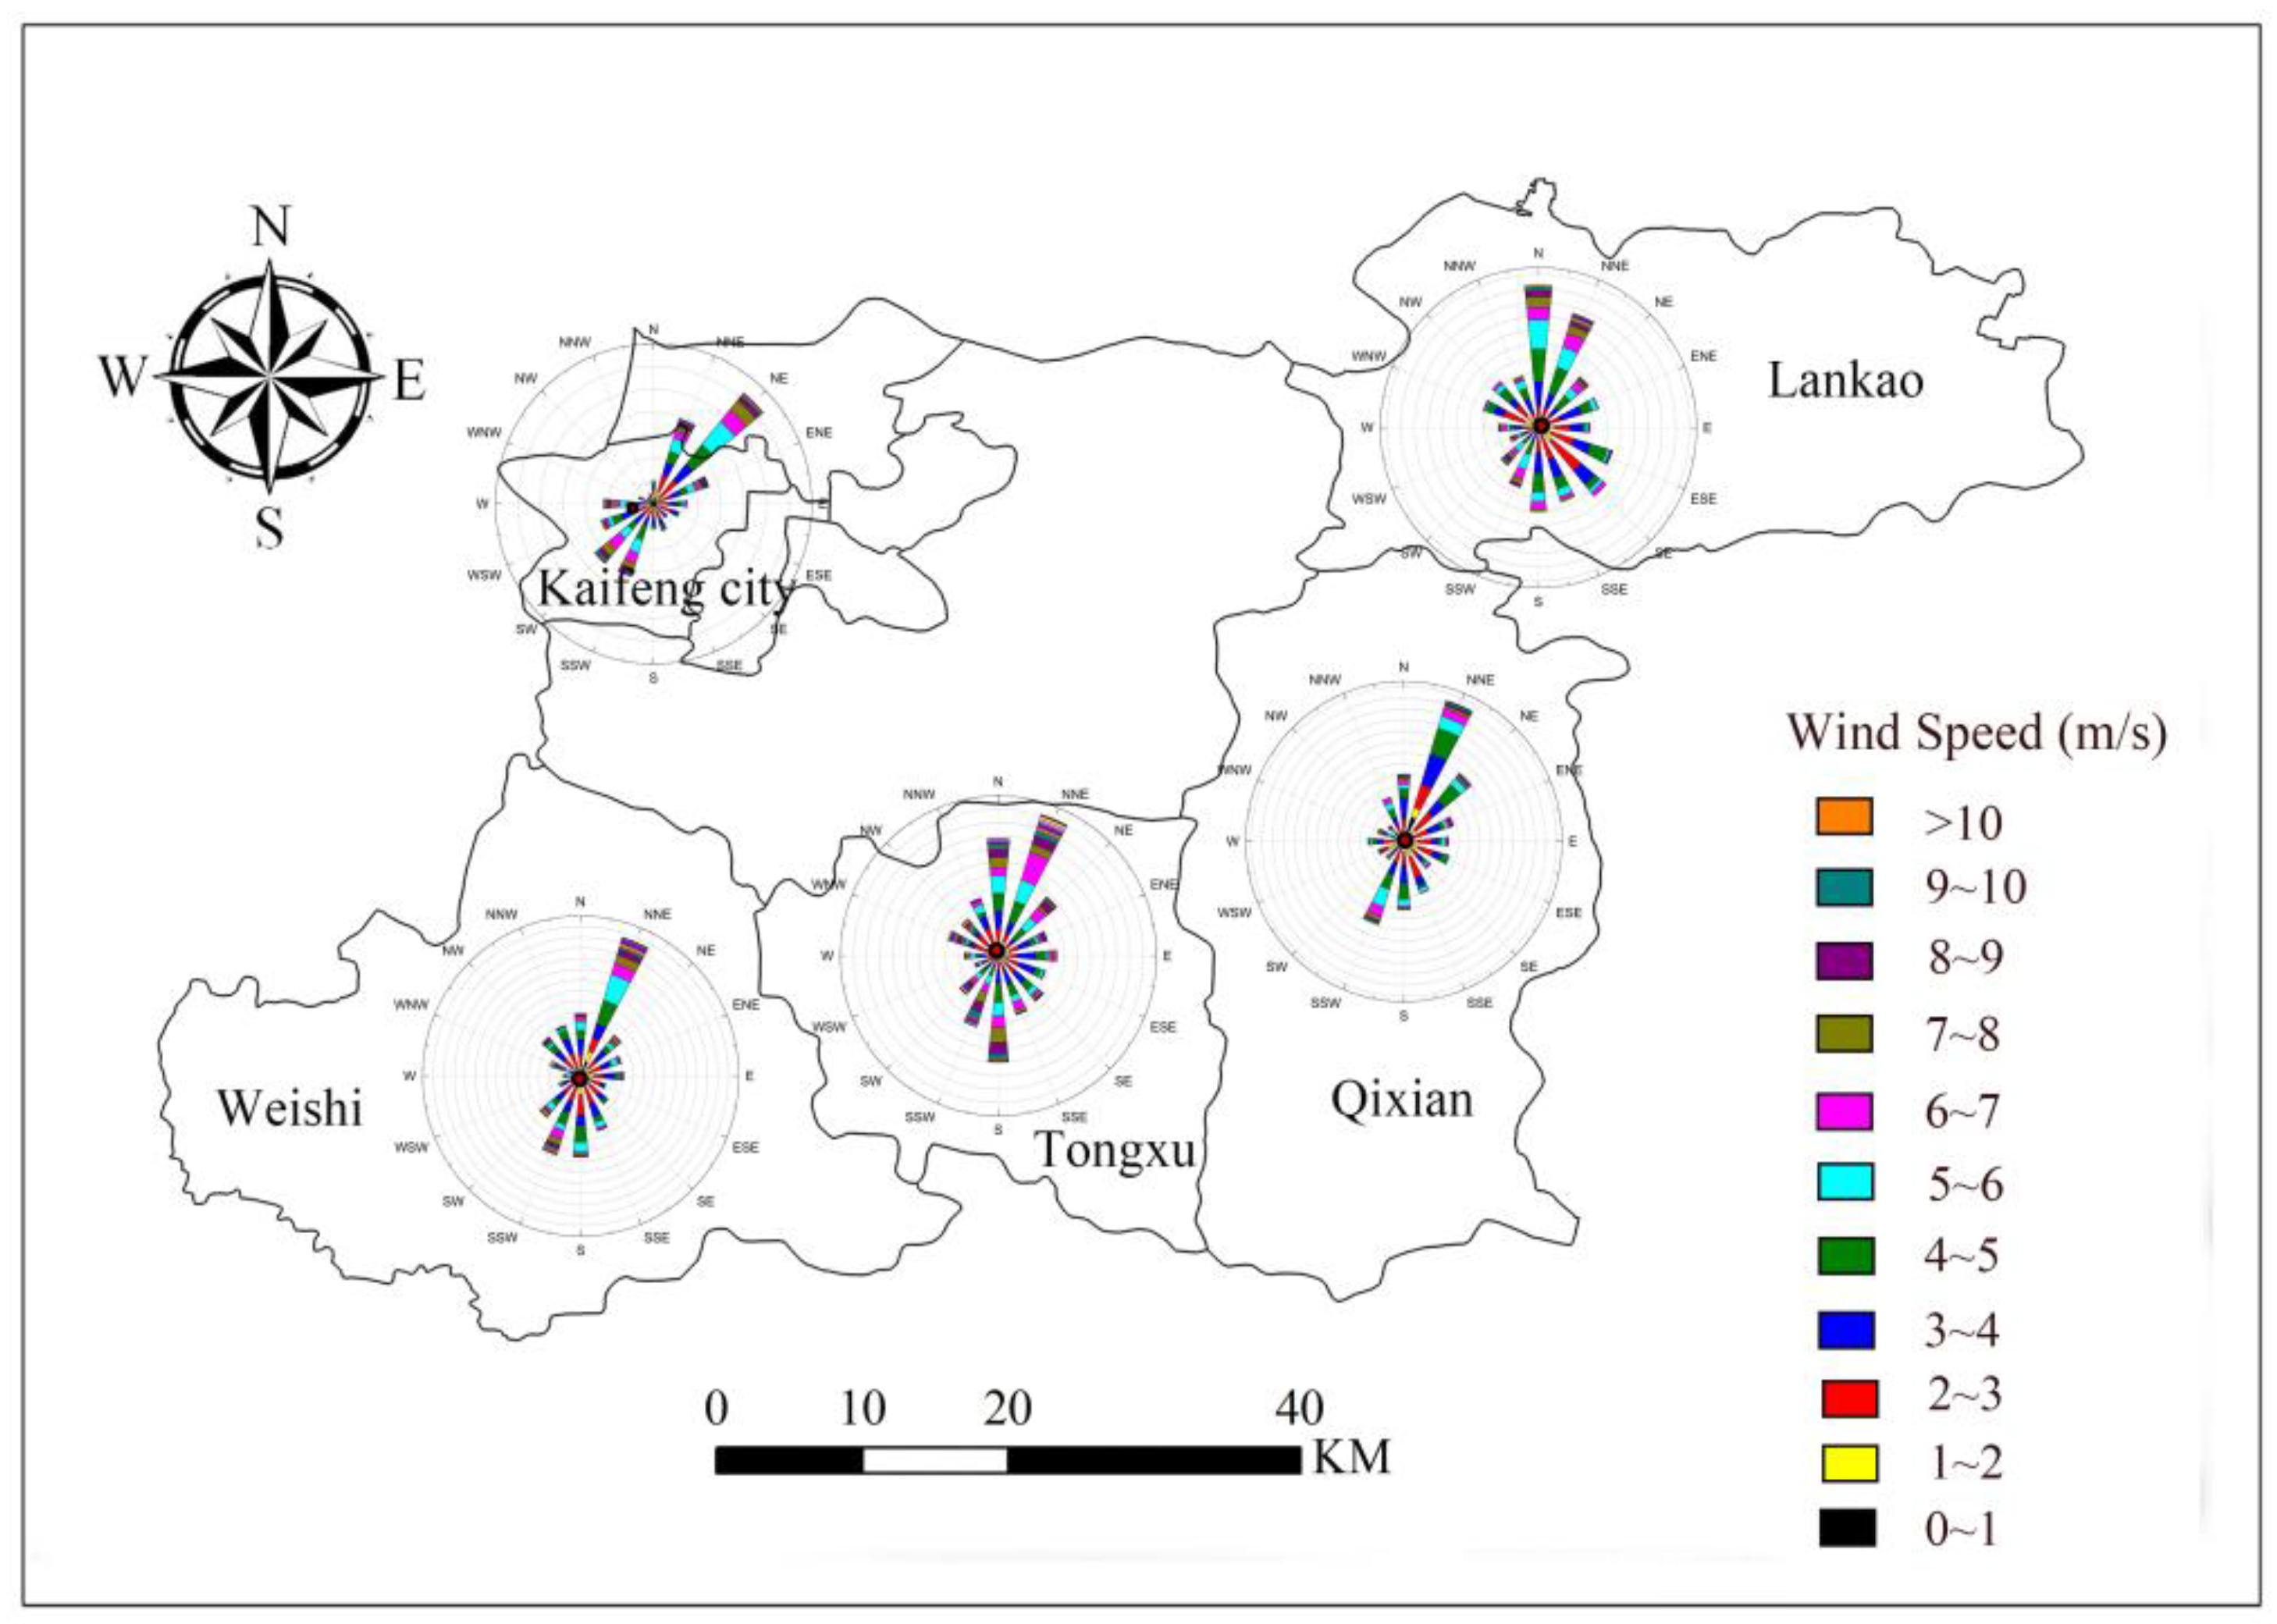
3.3. Wind Environment Analysis

Kaifeng has a temperate continental monsoon climate, which is controlled by alternating winter and summer monsoons. There is a significant difference between the dominant wind direction in summer and winter. However, due to dynamic and thermal forcing from the land surface, the dominant wind direction in each internal area would be different, so it is necessary to further analyze the actual dominant wind directions in each internal area.
There are five national meteorological stations in Kaifeng: Kaifeng city, Lankao, Qixian, Tongxu, and Weishi. By using hourly meteorological data of these five meteorological stations in summer (June, July, and August) and winter (December, January, and February) of 2017, as shown in Figure 9 and Figure 10, the wind rose chart of each meteorological station in winter and summer was obtained, and the maximum frequency wind direction of each meteorological station was calculated as its dominant wind direction. It can be seen from Figure 9 and Figure 10 that the “maximum wind direction” of each meteorological station in Kaifeng city is mainly “N, S, NE” in summer and “NNE, N, NE” in winter. The construction of urban air ducts introduces cold air from the suburbs or the periphery of the city into the urban area through the ventilation corridor. Therefore, by analyzing the dominant wind direction in Kaifeng, the main wind crossings can be determined, which can be used as the reference for the planning of ventilation corridors. The following is a specific representation of the wind direction in Figure 9 and Figure 10. North(N), North–North–East (NNE), North East (NE), East–North–East (ENE), East (E), East–South–East (ESE), South East (SE), South–South–East (SSE), South (S), South–South–West (SSW), South West (SW), West–South–West (WSW), West (W), West–North–West (WNW), North West (NW), and North–North–West (NNW).
According to the dominant wind direction in Kaifeng, it is shown that the air flow from the Yellow River and the outer suburbs can blow into the city and help reduce the temperature inside the city and possibly alleviate the urban heat island effect. Therefore, on the basis of analyzing the land surface temperature, action space, underlying surface influential factors, and dominant wind direction in Kaifeng, air duct openings were selected in the Yellow River, Kaifeng Yintan, Baogong Lake, and Longting Lake, and under the action of the dominant wind direction, airflow can blow into the city through the Yellow River–Kaifeng Yintan, Yellow River–Longting Lake–Baogong Lake and other water bodies.

4. Air Duct Planning Scheme

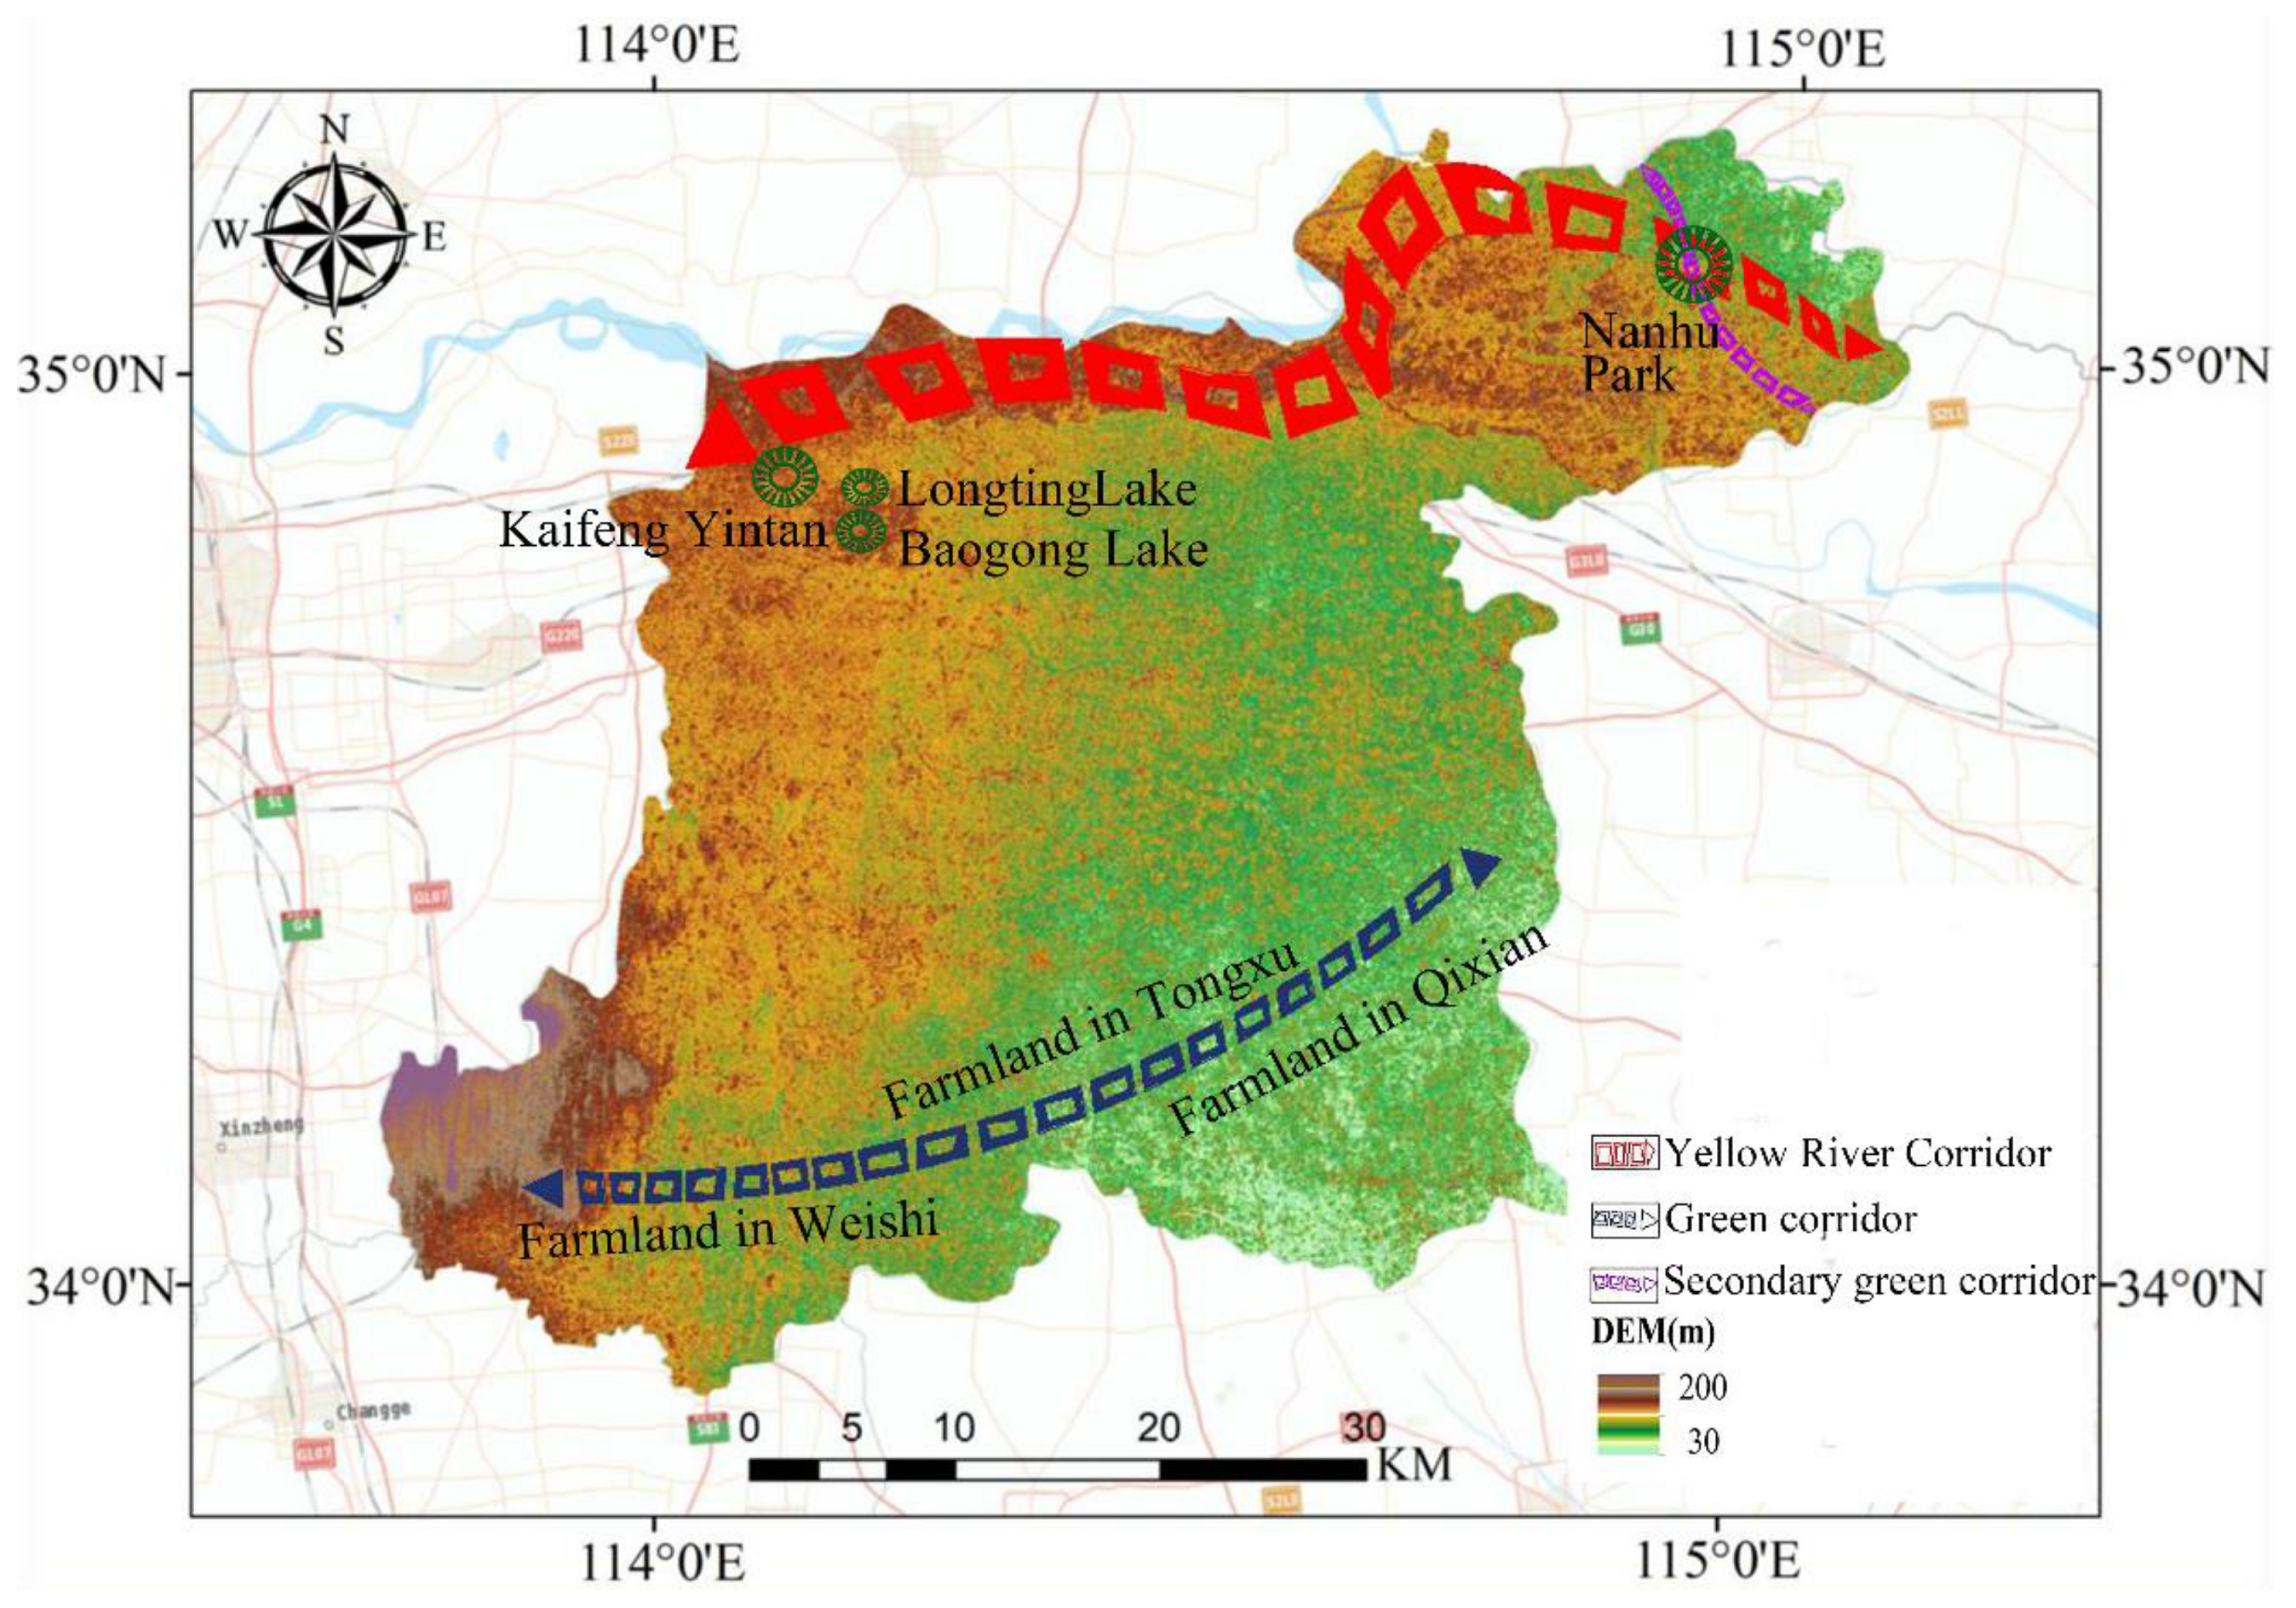
4.1. Ecological Ventilation Corridor Source Zone

In addition to rivers, road networks, and vegetation, the spacious farmland green space is also another ideal source area for ecological ventilation corridors, which can also effectively discharge the air inside the city to the outside of the city and change the microclimate inside the urban heat island area. According to the distribution of action space and compensation space (Figure 5) and the ventilation potential of each region (Figure 8), three main ecological ventilation corridors were identified: the Yellow River ecological ventilation corridor; the Yellow River–Nanhu Park ecological ventilation corridor; and the Qixian farmland–Tongxu farmland–Weishi farmland ecological ventilation corridor, as shown in Figure 11.

4.2. Ventilation Corridors in Kaifeng City

It can be found from Figure 3, Figure 4 and Figure 5 that the main urban area of Kaifeng city has an obvious urban heat island phenomenon. Therefore, based on the source area of the ecological ventilation corridor (Figure 11) and the dominant wind direction of Kaifeng city, the Yellow River, Kaifeng Yintan, Longting Lake, and Baogong Lake were selected as the air passages of the ventilation corridor, and two main ventilation corridors can be constructed in the main urban area: Yellow River–Kaifeng Yintan and Yellow River–Longting Lake–Baogong Lake, as shown in Figure 12.
As shown in Figure 12, the ventilation corridor in the west of Kaifeng city can be constructed based on a lake surface, and the width is about 1.0 km. On both sides of the path of this ventilation corridor, there are tall buildings with a height greater than 50 m. From this, it can be judged that under the action of the dominant wind direction, such tall buildings could produce a “narrow tube effect”, which could accelerate air flow [23]. For another ventilation corridor on the east side of Kaifeng, the underlying surface is still dominated by lakes and parks. Besides, on the west side of this ventilation corridor, there are many tall buildings higher than 50 m, and on the east side there are buildings less than 30 m in height.
It is worth noting that at the southern end of these two ventilation corridors, tall buildings are gradually being closed. Since the prevailing wind direction in the urban area of Kaifeng city is northerly, this kind of blocking effect in the southern section reduces the speed of low-temperature air coming from the north, thereby reducing the effect of ventilation. In future urban planning, the building layout of these areas should be reasonably controlled or other approaches implemented, such as increasing the road network, surface vegetation or the narrow tube effect in the air duct, to increase the ventilation efficiency of the air duct and to reduce the obstructive effect of the existing buildings on the air duct. Moreover, to avoid the urban heat island effect, on the basis of making full use of the role of the source area of the ecological corridor, other towns and villages in Kaifeng with higher surface temperature should be planned based on the conditions of the road network, building density, and water bodies.

5. Conclusions

Through the distribution of surface temperature, it was found that Kaifeng city has an obvious urban heat island effect, and the temperature in Kaifeng city is obviously higher than that in the surrounding suburbs. According to the ventilation corridor source area, urban underlying surface, and dominant wind direction of Kaifeng city, two ventilation corridors located on the eastern and western sides of Kaifeng city were planned. The main conclusions are as follows:
(1)
There is an obvious urban heat island effect in the main urban area of Kaifeng. Based on the analysis of the temperature results retrieved using Landsat data, the Yellow River, Kaifeng Yintan, Baogong Lake, and Longting Lake were selected as compensation spaces. Moreover, higher temperature areas in urban areas were selected as the action space. Through analysis of the wind environment of Kaifeng, it was determined that the dominant wind direction in Kaifeng is northerly, which can bring the low-temperature air into the city from the wind tunnel source area.
(2)
In terms of ventilation potential, the overall ventilation potential of the Kaifeng urban area is relatively good. However, in the south of Kaifeng city, tall buildings are gradually being closed; this kind of blocking effect in the southern section would reduce the speed of low-temperature air coming from the north, thereby reducing the effect of ventilation. In other villages and towns, the road length, water scale, and vegetation-covered areas have lower temperatures and good ventilation potential.
(3)
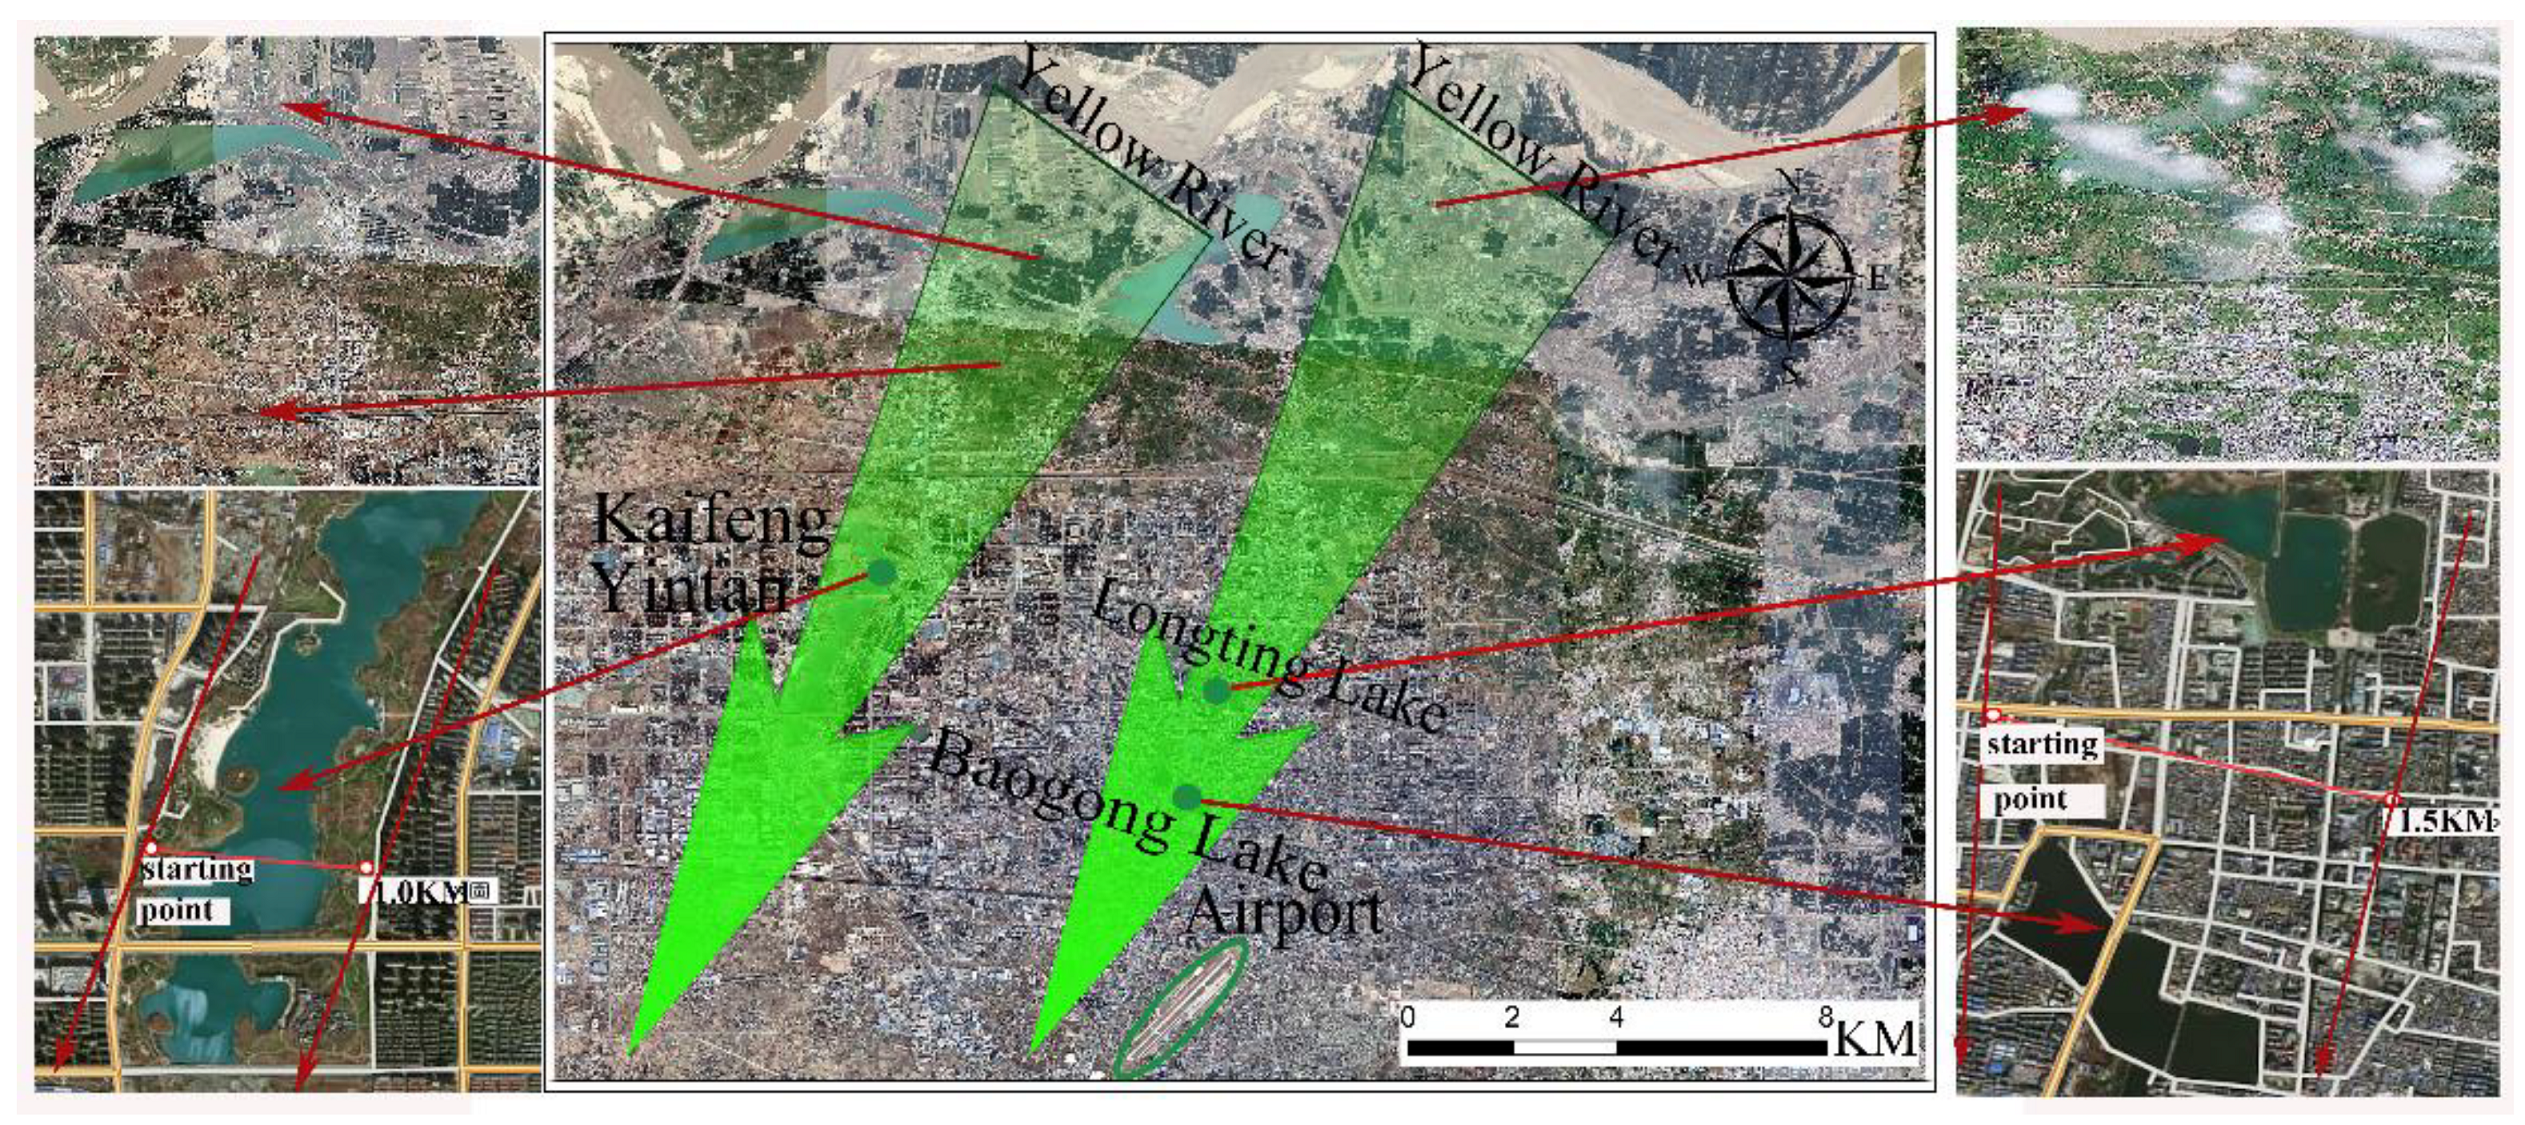
According to environmental characteristics such as the location of the low-temperature zone and ecological vegetation, the location of the air duct openings of the ventilation corridor was determined. In accordance with the characteristics of the underlying surface of the city, two ventilation corridors from the east and the west are planned. The ventilation corridor in the west of Kaifeng city can be constructed based on the lake surface, of which the width is about 1.0 km. For another ventilation corridor on the east side of Kaifeng city, the underlying surface is still dominated by lakes and parks, and the width is about 1.5 km.
There are some limitations in this study, which did not consider the micro-level analysis of the current situation in Kaifeng and the seasonal climate factors (winter versus summer), so a follow-up study on the basis of numerical simulation and quantitative analysis will be carried out in our future work. Furthermore, many Chinese cities have proposed varieties of urban plans, strategies, and management plans in response to severe intra-urban pollution. Among them, city-scale ventilation corridors are an aggressive but popular proposal [47]. However, the existing ventilation corridor planning is mostly researched from a single scale (urban areas, blocks, buildings) and lacks comprehensive consideration of multiple scales. Moreover, seasonal climate factors and variations (winter versus summer), street orientation, building layout, vegetation coverage, and water distribution are all key factors affecting the construction of ventilation corridors. Thus, in future planning and design, it is recommended that city planners and designers adopt a multi-standard method, comprehensively consider influential factors, and construct reasonable and effective ventilation corridors.

Author Contributions

Conceptualization, D.L., S.Z. and Y.C.; methodology, D.L., S.Z., L.W. and Y.C.; software, D.L., M.Z.; validation, D.L., M.Z., W.T., X.Z., S.X. and S.Y.; formal analysis, Q.C., S.Z. and L.W.; investigation, D.L. and S.Z.; resources, S.Z. and Y.C.; data curation, S.Z. and Y.C.; writing—original draft preparation, D.L. and S.Z.; writing—review and editing, D.L., S.Z., J.L. and Y.C.; visualization, D.L., M.Z., W.T., X.Z., S.X. and S.Y.; supervision, S.Z.; project administration, S.Z.; funding acquisition, S.Z. and Y.C. All authors have read and agreed to the published version of the manuscript.

Funding

This research was funded by the National Natural Science Foundation of China, grant numbers 42005102, 42071415, the Second Tibetan Plateau Comprehensive Scientific Expedition, grant number 2019QZKK0104, the Qinghai Science and Technology Department Project, grant number 2020-ZJ-711, the Henan Science & Technology Think Tank Project, grant number HNKJZK-2021-35C, the Outstanding Youth Foundation of Henan Natural Science Foundation, grant number 202300410049, and the National Key Research and Development Program of China, grant number 2021YFE0106700.

Institutional Review Board Statement

Not applicable.

Informed Consent Statement

Not applicable.

Data Availability Statement

The Landsat8OLI_TIRS remote sensing image was downloaded from (http://www.gscloud.cn/#page1/1, accessed on 13 August 2021). The building density data were obtained from the land use data released by the Data Center of Resources and Environmental Sciences, Chinese Academy of Sciences, which can be downloaded from (https://www.resdc.cn, accessed on 16 April 2021). Road network and water system data were obtained from the National Basic Geographic Database (1: 1 million, 2017) (https://www.webmap.cn/commres.do?method=result100W, accessed on 19 July 2021). Hourly wind direction and wind speed data were provided by the China Meteorological Data Service Centre (http://data.cma.cn, accessed on 27 June 2021).

Acknowledgments

This platform depends on the establishment of Henan University, the Ministry of Education “Yellow River Civilization and Sustainable Development Center” provide sustained support. We thank the reviewers who provided valuable comments to improve the paper.

Conflicts of Interest

The authors declare no conflict of interest.

References

  1. Zhang, Y.; Zhai, X. Research on Strategies for Mitigation of Urban Heat Island. Build. Sci. 2017, 33, 142–151. [Google Scholar]
  2. Yang, J.; Wang, Y.; Xue, B.; Li, Y.; Xiao, X.; Xia, J.; He, B. Contribution of urban ventilation to the thermal environment and urban energy demand, Different climate background perspectives. Sci. Total Environ. 2021, 795, 148791. [Google Scholar] [CrossRef] [PubMed]
  3. Ren, C.; Yuan, C.; Ho, C.K.; Yung, Y. A Study of Air Path and Its Application in Urban Planning. Urban Plan. Forum 2014, 3, 52–60. [Google Scholar]
  4. Ren, Q.; Wei, J.; Dai, W. Characteristics of Regional Wind Environment and Construction of Ventilation Corridors, a Case Study of the Pearl River Delta. Trop. Geogr. 2016, 36, 887–894. [Google Scholar]
  5. Wang, X.; Chen, Y.; Jiang, W.; Wu, Z.; Lin, W. Impacts of Urban Planning on Atmospheric Environment over the Pearl River Delta Region. Acta Sci. Nat. Univ. Sunyatseni 2009, 48, 115–120. [Google Scholar]
  6. Yang, G.; Wu, X.; Zhou, H. Effect analysis of WRF on wind speed prediction at the coast wind power station of Fujian province. J. Meteorol. Sci. 2014, 34, 530–535. [Google Scholar]
  7. Wang, X.; Gao, F.; Tan, Q.; Xiao, Z. Planning for ventilation corridor in city with high-frequency static wind: A case study of ChengDu city. City Plan. Rev. 2020, 44, 129–136. [Google Scholar]
  8. Liu, H.; He, X.; Miao, S.; Yu, B.; Wei, L.; Wang, X. A Study on Meteorological Effect of the Hangzhou Ventilation Corridors Based on High Resolution Numerical Simulation. Clim. Environ. Res. 2019, 24, 22–36. [Google Scholar]
  9. He, X.; Jiang, W.; Chen, Y.; Liu, G. Numerical simulation of the impacts of anthropogenic heat on the structure of the urban boundary layer. Chin. J. Geophys. 2007, 50, 75–83. [Google Scholar] [CrossRef]
  10. Yang, T.; Wang, W.; Chang, M.; Wang, X. Numerical simulation and comprehensive identification of potential wind corridors in Beijing. Int. J. Geogr. Inf. Sci. 2020, 22, 1996–2009. [Google Scholar]
  11. Wang, W.; Xu, Y.; Ng, E.Y.Y.; Raasch, S. Evaluation of satellite-derived building height extraction by CFD simulations, A case study of neighborhood-scale ventilation in Hong Kong. Landsc. Urban Plan. 2018, 170, 90–102. [Google Scholar] [CrossRef]
  12. Fang, Y.; Gu, K.; Qian, Z.; Sun, Z.; Wang, Y.; Wang, A. Performance evaluation on multi-scenario urban ventilation corridors based on least cost path. J. Urban Manag. 2020, 10, 3–15. [Google Scholar] [CrossRef]
  13. Xie, P.; Yang, J.; Wang, H.; Liu, Y.; Liu, Y. A New method of simulating urban ventilation corridors using circuit theory. Sustain. Cities Soc. 2020, 59, 1021162. [Google Scholar] [CrossRef]
  14. Liu, Y.; Xu, F.; Zhang, F.; Cheng, C. Research and Application of Urban Surface Ventilation Potential: Cases of Beijing and Guangzhou. Planners 2019, 35, 32–40. [Google Scholar]
  15. Du, W.P.; Fang, X.Y.; Liu, Y.H.; He, Y.; He, J. Construction of Ventilation Corridors in the Beijing Central Urban Area Based on Meteorology and GIS Technology. Urban Plan. Forum. 2016, 5, 79–85. [Google Scholar]
  16. Zhan, Q.; Ouyang, W.; Jin, Z.; Zhang, L. RS and GIS Based Ventilation Potential Study and Planning. Planners 2015, 31, 95–99. [Google Scholar]
  17. Yin, J.; Zhang, Q. Urban Street Wind Path Research Based on GIS and CFD—A Case Study of Wuhan. Chin. Landsc. Archit. 2019, 35, 84–88. [Google Scholar]
  18. Xu, Y.; Wang, W.; Chen, B.; Chang, M.; Wang, X. Identification of ventilation corridors using backward trajectory simulations in Beijing. Sustain. Cities Soc. 2021, 70, 102889. [Google Scholar] [CrossRef]
  19. Laura, G.; Meinolf, K.; Stephan, W. Mapping urban cold-air paths in a Central European city using numerical modelling and geospatial analysis. Urban Clim. 2019, 29, 100503. [Google Scholar]
  20. Tao, Y.; Yang, H. Exploration on Planning System and Planning Method of Urban Ventilation Corridor. J. World Archit. 2017, 42, 37–38. [Google Scholar]
  21. Liu, S.; Shen, J. Urban ventilation channel planning method based on local circulation: A case study of Stuttgart, Germany. J. Zhejiang Univ. (Eng. Sci.) 2010, 44, 1985–1991. [Google Scholar]
  22. Wong, Q.; Zhang, H.; Bao, H.; Liu, J.; Wu, H. Study on Ventilation Channels of Nanjing City. Sci. Technol. Eng. 2015, 15, 89–94. [Google Scholar]
  23. Bao-Jie, H.; Lan, D.; Deo, P. Enhancing urban ventilation performance through the development of precinct ventilation zones, A case study based on the Greater Sydney. Aust. Sustain. Cities Soc. 2019, 47, 101472. [Google Scholar]
  24. Chen, H.; Ryozo, O.; Hang, H.; Takash, T. Study on mitigation measures for outdoor thermal environment on present urban blocks in Tokyo using coupled simulation. Build. Environ. 2009, 44, 2290–2299. [Google Scholar] [CrossRef]
  25. Liu, W.; Zhang, G.; Jiang, Y.; Wang, J. Effective Range and Driving Factors of the Urban Ventilation Corridor Effect on Urban Thermal Comfort at Unified Scale with Multisource Data. Remote Sens. 2021, 13, 1783. [Google Scholar] [CrossRef]
  26. Chen, Q.; Cheng, Q.; Chen, Y.; Li, K.; Jing, C. Analysis of the influence of the urban building sky view factor on land surface thermal environment. Sci. Surv. Mapp. 2021, 46, 148–155. [Google Scholar]
  27. Yuan, C.; Ng, E. Building porosity for better urban ventilation in high-density cities—A computational parametric study. Build. Environ. 2012, 50, 176–189. [Google Scholar] [CrossRef]
  28. Gülten, A.; Öztop, F. Analysis of the natural ventilation performance of residential areas considering different urban configurations in Elazığ, Turkey. Urban Clim. 2020, 34, 100709. [Google Scholar] [CrossRef]
  29. Song, J.; Chen, W.; Zhang, J.; Huang, K.; Hou, B.; Prishchepov, A. Effects of building density on land surface temperature in China, Spatial patterns and determinants. Landsc. Urban Plan. 2020, 198, 103794. [Google Scholar] [CrossRef]
  30. Huang, X.; Wang, Y. Investigating the effects of 3D urban morphology on the surface urban heat island effect in urban functional zones by using high-resolution remote sensing data: A case study of Wuhan, Central China. ISPRS J. Photogramm. Remote Sens. 2019, 152, 119–131. [Google Scholar] [CrossRef]
  31. Wang, G.; Hu, Y.; Zheng, B. Simulation study on urban generalized ventilation corridor based on roads airflow characteristics in Hengyang county. J. Railw. Sci. Eng. 2020, 17, 1586–1594. [Google Scholar]
  32. Xu, Q.; Miao, J.; Liu, Y.; Huang, L.; Wang, D. Response of sea and land breeze characteristics to urban heat island over the west coast of Bohai Bay. J. Meteorol. Sci. 2013, 36, 408–417. [Google Scholar]
  33. Lan, H.; Lau, K.; Shi, Y.; Ren, C. Improved urban heat island mitigation using bioclimatic redevelopment along an urban waterfront at Victoria Dockside, Hong Kong. Sustain. Cities Soc. 2021, 74, 103172. [Google Scholar] [CrossRef]
  34. Chi, Q.; Zhou, S.; Wang, L.; Zhu, M.; Liu, D.; Tang, W.; Cui, Y.; Lee, J. Exploring on the Eco-Climatic Effects of Land Use Changes in the Influence Area of the Yellow River Basin from 2000 to 2015. Land 2021, 10, 601. [Google Scholar] [CrossRef]
  35. Zhou, S.; Wang, K.; Yang, S.; Li, W.; Zhang, Y.; Zhang, B.; Fu, Y.; Liu, X.; Run, Y.; Chubwa, O.G.; et al. Warming Effort and Energy Budget Difference of Various Human Land Use Intensity: Case Study of Beijing, China. Land 2020, 9, 280. [Google Scholar] [CrossRef]
  36. Dang, B.; Fang, X.; Lv, H.; Cheng, C.; Du, W.; Liu, Y.; Zhang, S.; Yang, F. Preliminary Study on Building Urban Ventilation Corridors Based on Meteorological Research—Taking Nanjing Jiangbei New Region as the Example. Meteorol. Mon. 2017, 43, 1130–1137. [Google Scholar]
  37. Yang, X.; Chen, B.; Hu, K. Research progress on the impact of urbanization on extreme high temperature events. Prog. Geogr. 2015, 34, 1219–1228. [Google Scholar]
  38. Zhang, A.; Zhang, X. Land surface temperature retrieved from Landsat-8 and comparison with MODIS temperature product. J. Beijing For. Univ. 2019, 41, 1–13. [Google Scholar]
  39. Song, T.; Duan, Z.; Liu, J.; Yan, F.; Sheng, S.; Huang, J.; Wu, W. Comparison of four algorithms to retrieve land surface temperature using Landsat 8 satellite. J. Remote Sens. 2015, 19, 451–464. [Google Scholar]
  40. Hu, D.; Qiao, K.; Wang, X.; Zhao, L.; Ji, G. Land surface temperature retrieval from Landsat 8 thermal infrared data using mono-window algorithm. J. Remote Sens. 2015, 19, 964–976. [Google Scholar]
  41. Qin, Z.; Zhang, M.; Arnon, K.; Pedro, B. Single window algorithm for calculating surface temperature using Landsat TM6 data. J. Geogr. Sci. 2001, 56, 456–466. [Google Scholar]
  42. Qin, Z.; Li, W.; Zhang, M.; Arnon, K.; Pedro, B. An Atmospheric Parameter Estimation Method Based on Single Window Algorithm. Remote Sens. Natural Resour. 2003, 02, 37–43. [Google Scholar]
  43. Liu, B.; Bao, G.; Peng, K.; Shi, M.; He, H. Comparison of Different Land Surface Temperature Algorithms Based on Landsat TM Images. Geomat. World 2015, 22, 57–61. [Google Scholar]
  44. Chen, H.; Peng, L.; Wu, Z. Analysis on Climate and Environmental Characteristics and Its Influence in Beijing under the Background of Ventilation Corridor Construction. Urban. Archit. 2021, 18, 17–20. [Google Scholar]
  45. Sun, S.; Zheng, N.; Wang, S.; Li, Y.; Hou, S.; Song, X.; Du, S.; An, Q.; Li, P.; Li, X.; et al. Source Analysis and Human Health Risk Assessment Based on Entropy Weight Method Modification of PM2.5 Heavy Metal in an Industrial Area in the Northeast of China. Atmosphere 2021, 12, 852. [Google Scholar] [CrossRef]
  46. Chao, Y.; Chao, R.; Ng, E. GIS-based surface roughness evaluation in the urban planning system to improve the wind environment—A study in Wuhan, China. Urban Clim. 2014, 10, 585–593. [Google Scholar]
  47. Liu, C.; Shu, Q.; Huang, S.; Guo, J. Modeling the Impacts of City-Scale “Ventilation Corridor” Plans on Human Exposure to Intra-Urban PM2.5 Concentrations. Atmosphere 2021, 12, 1269. [Google Scholar] [CrossRef]
Figure 1. The location of Kaifeng.
Land 11 00206 g001
Figure 2. Framework of this study.
Land 11 00206 g002
Figure 3. The inversion result of the surface temperature in Kaifeng. (A): 2017.05.07 LST distribution; (B): 2017.07.10 LST distribution; (C): 2017.10.30 LST distribution; (D): 2017.12.17 LST distribution.
Land 11 00206 g003
Figure 4. The distribution of LST in the main city corresponding to different times and the corresponding LST of Kaifeng Yintan, Longting Lake, and Baogong Lake. (A): 2017.05.07; (B): 2017.07.10; (C): 2017.10.30; (D): 2017.12.17.
Land 11 00206 g004
Figure 5. Action space and compensation space of the ventilation system in Kaifeng.
Land 11 00206 g005
Figure 6. (A): Building density of each township in Kaifeng; (B): the road network length of each township in Kaifeng; (C): the length of the water body in each township of Kaifeng; (D): vegetation coverage of towns and villages in Kaifeng.
Land 11 00206 g006aLand 11 00206 g006b
Figure 7. Line chart of each influential factor. (A): building density; (B): road network length; (C): water body length; (D): vegetation coverage.
Land 11 00206 g007
Figure 8. Comprehensive value of the ventilation potential in Kaifeng (A) and the line chart (B).
Land 11 00206 g008
Figure 9. The dominant wind direction in summer (June, July, and August).
Land 11 00206 g009
Figure 10. The dominant wind direction in winter (December, January, and February).
Land 11 00206 g010
Figure 11. Source area of ecological ventilation corridors in Kaifeng.
Land 11 00206 g011
Figure 12. Planning of ventilation corridors in Kaifeng.
Land 11 00206 g012
Table 1. Weight value of each index.
Impact FactorBuilding
Density
Road Network
Length
Water Body
Length
Vegetation
Coverage
Weights ( ω i )0.260.240.250.25
Publisher’s Note: MDPI stays neutral with regard to jurisdictional claims in published maps and institutional affiliations.

