Article

Influences of Environmental Variables and Their Interactions on Chinese Farmland Soil Organic Carbon Density and Its Dynamics

1
Research Center for Transformation Development and Rural Revitalization of Resource-Based Cities in China, China University of Mining and Technology, Xuzhou 221116, China
2
School of Public Policy & Management, China University of Mining and Technology, Xuzhou 221116, China
3
School of Resource and Environmental Science, Wuhan University, Wuhan 430079, China
4
State Key Laboratory of Soil and Sustainable Agriculture, Chinese Academy of Sciences, Nanjing 210008, China
*
Author to whom correspondence should be addressed.
Submission received: 3 January 2022 / Revised: 25 January 2022 / Accepted: 27 January 2022 / Published: 28 January 2022

Abstract

:
Farmland is one of the most important and active components of the soil carbon pool. Exploring the controlling factors of farmland soil organic carbon density (SOCD) and its sequestration rate (SOCDSR) is vital for improving carbon sequestration and addressing climate change. Present studies provide considerable attention to the impacts of natural factors and agricultural management on SOCD and SOCDSR. However, few of them focus on the interaction effects of environmental variables on SOCD and SOCDSR. Therefore, using 64 samples collected from 19 agricultural stations in China, this study explored the effects of natural factors, human activities, and their interactions on farmland SOCD and SOCDSR by using geographical detector methods. Results of geographical detectors showed that SOCD was associated with natural factors, including groundwater depth, soil type, clay content, mean annual temperature (MAT), and mean annual precipitation. SOCDSR was related to natural factors and agricultural management, including MAT, groundwater depth, fertilization, and their interactions. Interaction effects existed in all environmental variable pairs, and the explanatory power of interaction effects was often greater than that of the sum of two single variables. Specifically, the interaction effect of soil type and MAT explained 74.8% of the variation in SOCD, and further investigation revealed that SOCD was highest in Luvisols and was under a low MAT (<6 °C). The interaction effect of groundwater depth and fertilization explained 40.4% of the variation in SOCDSR, and fertilization was conducive to SOCD increase at a high groundwater depth (<3 m). These findings suggest that low soil temperature, high soil moisture, and fertilization are conducive to soil carbon accumulation. These findings also highlight the importance of agricultural management and interaction effects in explaining SOCD and SOCDSR, which promote our knowledge to better understand the variation of SOCD and its dynamics.

1. Introduction

Farmland is the most important and active component of the soil carbon pool, which is strongly affected by human activities and has great potential for carbon sequestration [1,2,3]. Canadell [4] determined that the adoption of the best agricultural management could yield 0.4–0.8 Pg of carbon per year in farmland soil. Minasny et al. [5] surveyed farmland soil organic carbon (SOC) stock and sequestration potential in 20 regions across the world (e.g., Russia, Canada, China, America, and Australia) and reported that 4 per mille or even higher sequestration rates can be achieved under best management practices. Carbon sequestration in farmland soil improves soil fertility, thus increasing crop yield and ensuring food security [6,7,8,9]. It also affects regional and global carbon cycles by reducing greenhouse gas concentration, thus achieving the target of the Paris Climate Agreement to limit global warming to less than 2 °C [10,11,12]. The SOC density (SOCD) is used to measure SOC stock, and the sequestration rate in SOCD (SOCDSR) reflects the carbon sequestration in soil or loss from soil. Therefore, exploring the controlling factors of farmland SOCD and SOCDSR is vital for improving carbon sequestration rate, ensuring food security, and addressing climate change.
The farmland SOCD is directly affected by human activities, such as cropping systems and agricultural management [1,13,14,15]. Many studies have proven that appropriate agricultural management, such as planting rice, conservation tillage, fertilization, irrigation, and straw return, is conducive to SOC accumulation [1,8,13,16,17]. The SOCD is also affected by natural factors, including soil properties (e.g., soil type and texture), climate (e.g., temperature and precipitation), organisms (e.g., vegetation and soil microbes), topographical factors (e.g., elevation, slope, and aspect), and parent materials [18,19,20,21]. The integration of natural factors and human activities could explain the spatial variation of farmland SOCD at the regional scale [16,22,23,24,25]. Present studies pay more attention to the impacts of natural factors on SOCD and SOCDSR. However, studies on the impacts of human activities are limited to land use types and vegetation index and ignore the agricultural management [26,27,28,29]. Moreover, few of the studies concentrate on the interaction effects of environmental variables on SOCD.
Several studies have found that the relationship between SOCD and a controlling factor is affected by the value of another factor. For instance, Zhong et al. [30] found that the relationship among SOCD, mean annual precipitation (MAP), and mean annual temperature (MAT) changes at different MAP or MAT levels. Liu, et al. [31] determined that the relationship between SOC and multiple land use percentages has a land-use dependency. Zhu, et al. [32] identified that the effects of topographical factors on SOC depend on land use because the intensities of soil erosion and deposition on slopes are mediated by vegetation cover. These studies highlighted the importance of interaction effects on SOCD. Hence, the consideration of natural factors, human activities, and their interactions may well explain the variations in SOCD and SOCDSR.
Univariate/multivariate analysis methods, such as correlation analysis, one-way/multifactor analysis of variance, and multiple linear regression, are widely used for quantitatively determining influencing factors [33,34,35,36]. Nevertheless, these methods usually assume normality, homoscedasticity, and independence of the error term [37], which are difficult to satisfy. Geographical detector methods have relaxed assumptions and are able to explore the interaction effects of explanatory variables on target variables [33,38]. They assume that if geographical phenomenon A is controlled by factor B, then B will exhibit a spatial pattern similar to that of A. The interaction effect of two factors can be assessed by comparing the explanatory power by overlaying and using them alone. The Q-statistic is developed to quantify the explanatory power of predictors and their interactions with geographical phenomena. Compared with classical variance analysis methods (e.g., one-way/multifactor analysis of variance), geographical detectors are more sensitive to variance fluctuation and can quantitatively determine the explanatory power of predictors and their interactions [38]. Geographical detector methods have been successfully applied to reveal the interaction effects of covariates on various soil properties, such as soil organic matter/carbon [39,40], soil erosion [41,42,43], and heavy metals [44,45,46]. Therefore, geographical detectors may have great potential for identifying the effects of environmental variables and their interactions on SOCD and SOCDSR.
With its wide extent and diverse climate and agricultural systems, China is an excellent study area that allows us to explore the differences of SOCD and its dynamics under different natural environments and agricultural systems. Revealing the drives of SOCD and SOCDSR of Chinese farmlands contributes to national agricultural management. Therefore, using 64 samples collected from 19 agricultural stations in China, this study aims to explore the effects of natural factors, human activities, and their interactions on farmland SOCD and SOCDSR by using geographical detector methods.

2. Materials and Methods

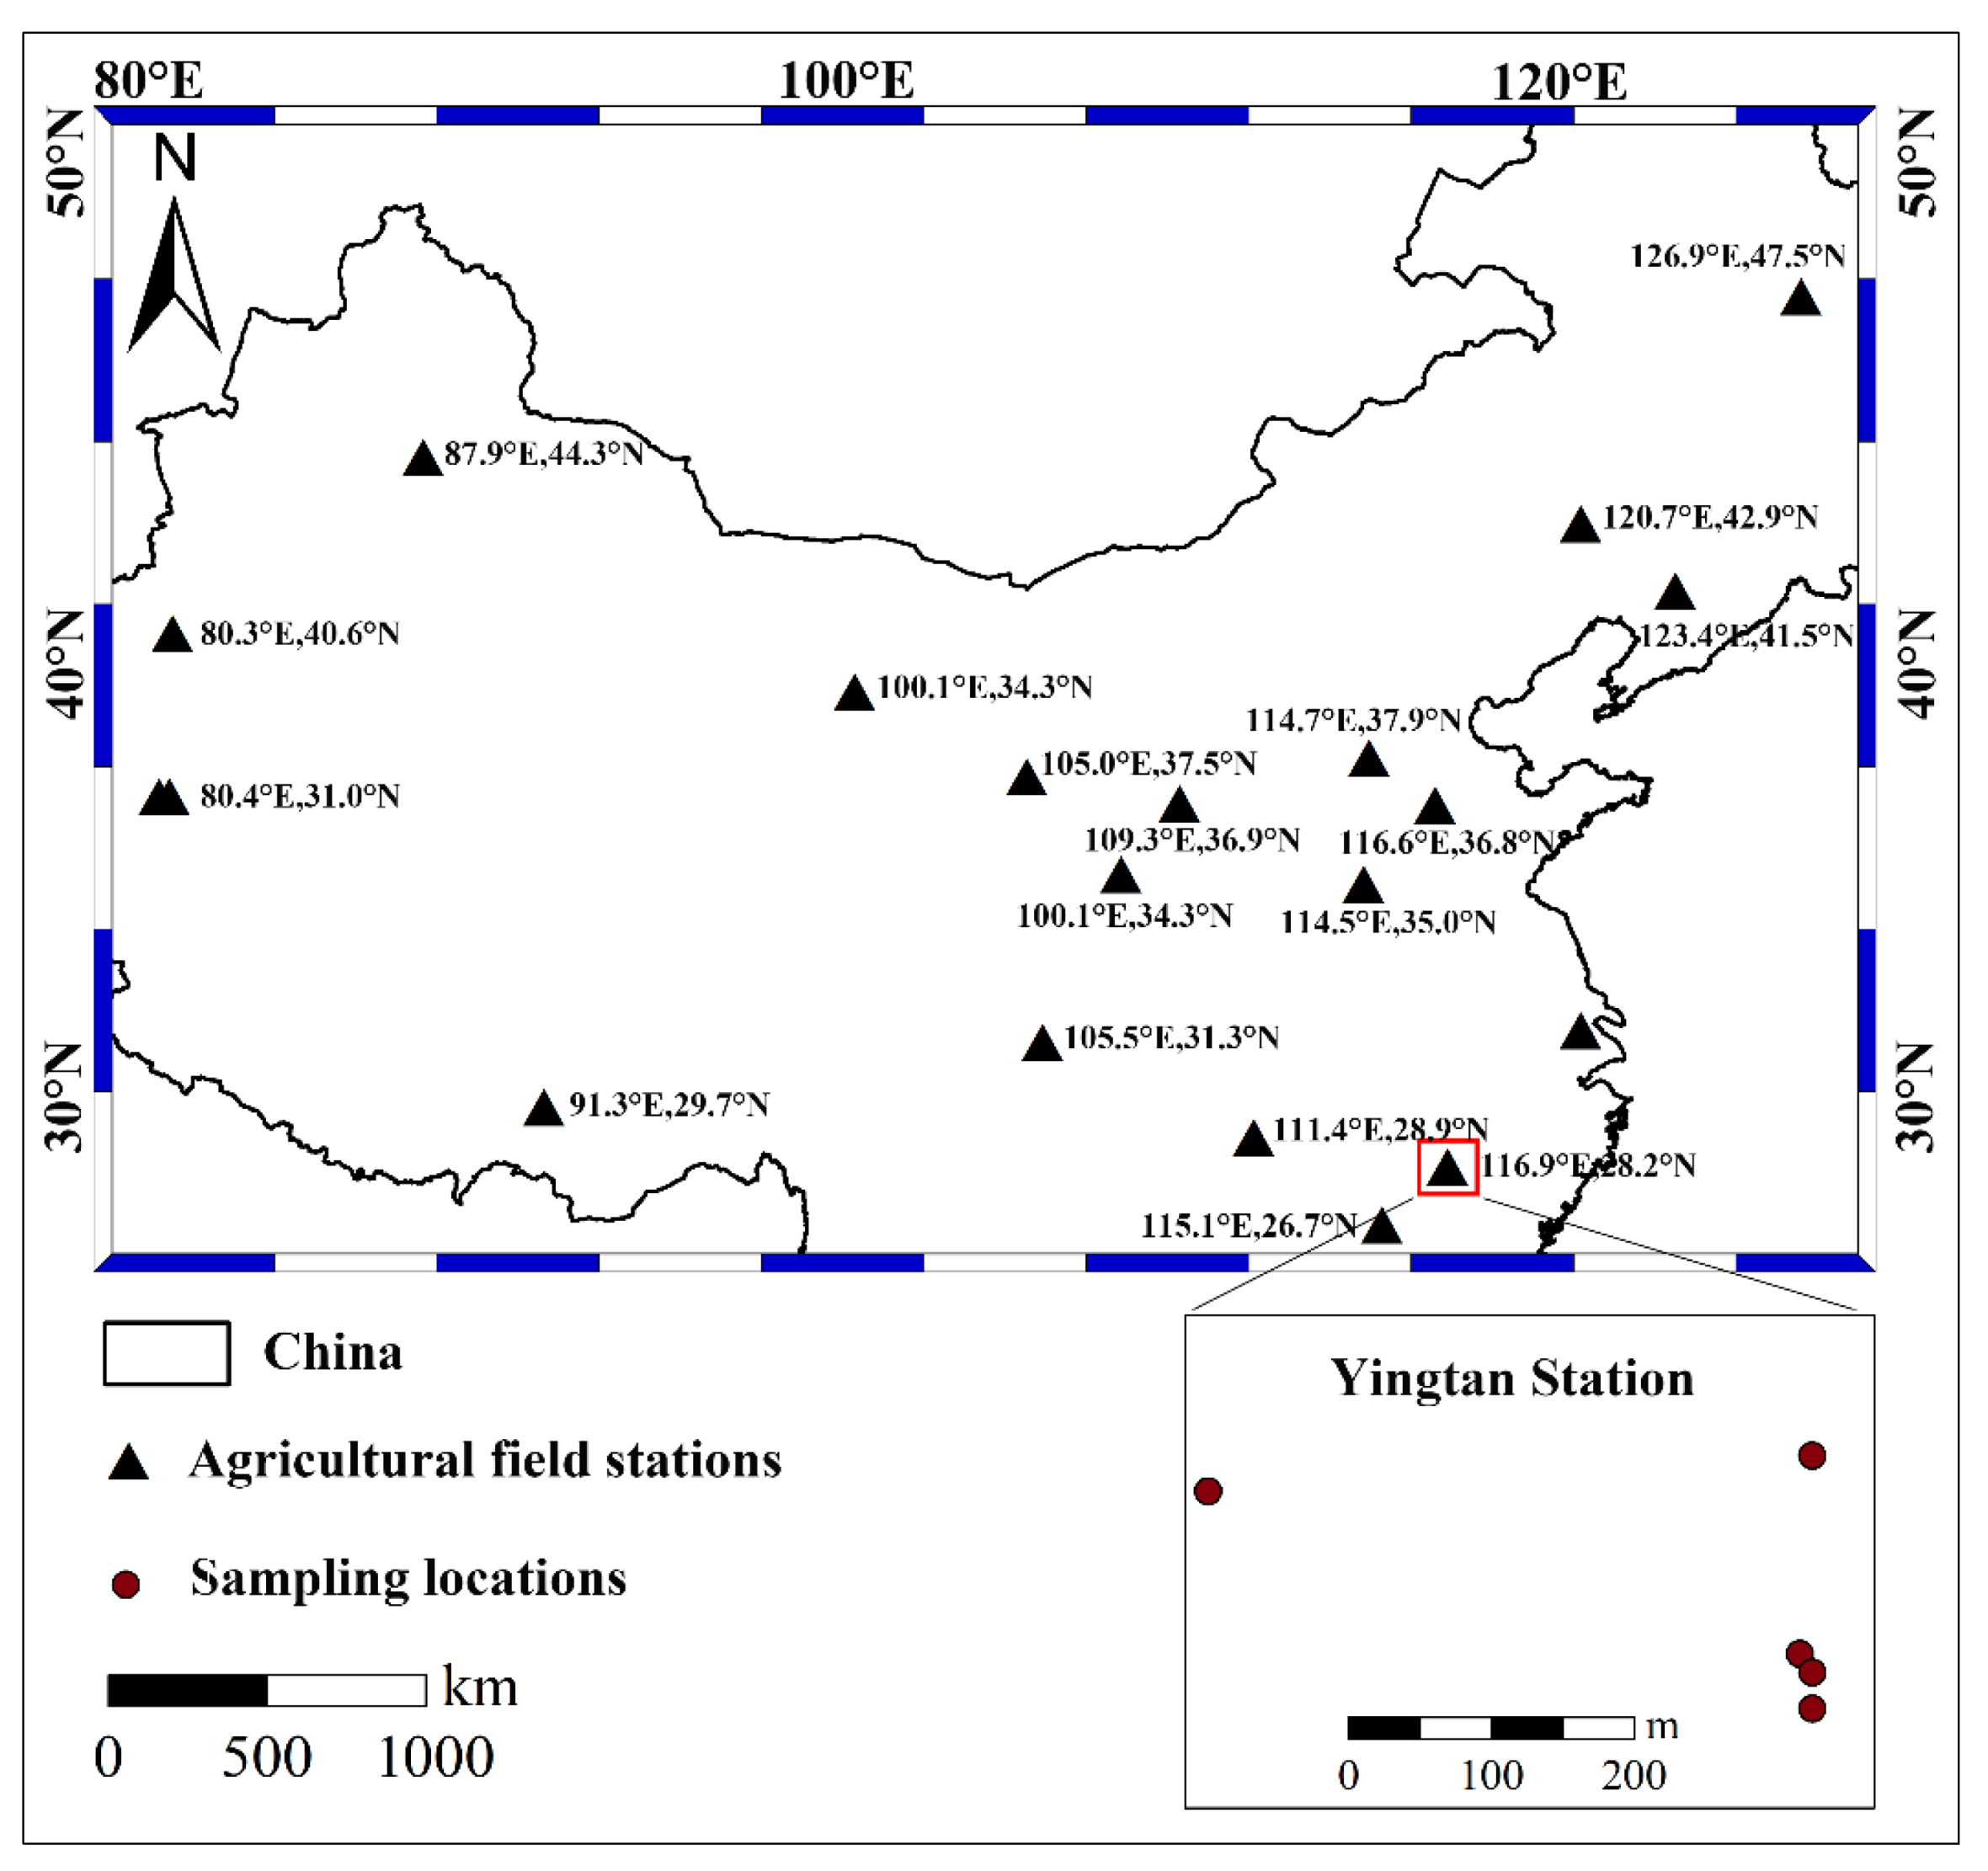
2.1. Study Area and SOCD Data Acquisition

This study used a dataset of topsoil organic carbon density of 19 agricultural field stations of the Chinese Ecosystem Research Network (CERN) from 2005 to 2015 [47]. These stations cover the typical cropping systems of China, including paddy fields in plains and irrigated lands in plains, hills, mountains, Loess Plateau, and desert oases. Their spatial locations are shown in Figure 1. Each station uses the control group to explore the change in SOCD with time under the influence of irrigation, fertilization, or straw return. Each station has 2–5 sampling points, and 64 sampling points exist in total. Each point adopts the same specification for soil property measurement, which makes the SOCD among different stations comparable. Specifically, bulk density was determined by the cutting ring method [48], SOM was measured through the potassium dichromate method [49], and SOCD (kg/m2) was calculated as follows [50,51]:
SOCD = SOM × 0.58 × BD × H / 100
where 0.58 is the Bemmelen transform coefficient, BD is the bulk density (g/cm3), and H is the soil thickness (cm). The soil thickness is 20 cm in this study.
The SOCD in 2005 was used as the initial SOCD, which in 2015 was regarded as the current SOCD. SOCDSR [kg/(m2·a)] was equal to the current SOCD minus the initial SOCD and divided by time. The SOCD in 2015 and SOCDSR were used as target variables.

2.2. Environmental Variables

A number of environmental variables were chosen as potential influencing factors. The natural factors included elevation, soil type, groundwater depth, clay content, MAT, and MAP. The human activities included cropping duration, initial SOCD, cropping systems, irrigation, fertilization, and residue management.
Many covariates, including elevation, soil types, groundwater depth, cropping systems, irrigation, fertilization, and residue management, were recorded in the CERN dataset [47]. The soil types are classified into Luvisols, Anthrosols, Gleysols, Cambisols, and other soils (Acrisols, Calcisols, and Phaeozems soils). The cropping systems included rice, rice–dry crops, and dry crops. Agricultural management methods included fertilization (fertilizer and blank control), irrigation (irrigation and rainfall), and residue management (straw return and blank control). The initial SOCD (i.e., the SOCD in 2005) was used only for SOCDSR. The cropping duration was the time from the establishment of the station (probably before 2005) to 2015, and it was used only for SOCD. The clay content, MAP, and MAT were derived from 1 km-resolution raster images shared by the Resource and Environment Data Cloud Platform (http://www.resdc.cn, access on 1 January 2022). The clay content, MAP, and MAT of each sampling point were extracted via ArcGIS software (version 10.2.1, Esri, Redlands, CA, USA).

2.3. Geographical Detector Methods

The geographical detector methods are developed to detect the spatial heterogeneity of geographical phenomena among strata or subregions [33,38,52]. They include four detectors: factor, risk, interaction, and ecological detectors. The first three detectors were used in this study.

2.3.1. Factor and Risk Detectors

The factor detector can quantitatively determine the explanatory power of each environmental variable and thus its relative importance. The q-statistic was employed to quantify the explanatory power, as shown as follows:
q = 1 h = 1 L N h σ h 2 N σ 2 = 1 SSW SST
where categorical factor X contains L classes, N is the total sample number, Nh is the sample number of class h (h = 1, 2, …, L), σ 2 is the variance of the population, σ h 2 is the variance of class h (h = 1, 2, …, L), SSW is the within the sum of squares, and SST is the total sum of squares. The significance of the q-statistic was determined through F-test [53]. The q value ranges from 0 to 1, and it indicates that factor X can explain q × 100% of the variation in dependent variable Y. The q values of the environmental variables indicate their relative importance, i.e., the greater the q value is, the greater the impact on Y will be.
The risk detector was developed to test whether a significant difference in the mean value of Y exists between any two classes of X through t-test as follows:
t Y ¯ h = 1 Y ¯ h = 2 = Y ¯ h = 1 Y ¯ h = 2 σ h = 1 2 N h = 1 + σ h = 2 2 N h = 2
where Y ¯ h is the mean value of Y in class h. If the t-test result is significant, the mean values of Y between the two classes are significantly different. After pairwise comparison, we can determine whether there are significant differences in the mean values of Y among different classes.

2.3.2. Interaction Detector

The interaction detector was developed to assess the interaction effect of two factors (e.g., X1 and X2) on Y. The q (X1∩X2) was compared with q (X1) and q (X2), and the type of interaction effect was determined as follows:
q (X1∩X2) > q (X1) + q (X2), Nonlinear enhancement;
q (X1∩X2) = q (X1) + q (X2), Independent;
q (X1∩X2) > Max [q (X1), q (X2)], Bi-enhancement;
q (X1∩X2) > Min [q (X1), q (X2)] & q (X1∩X2) < Max [q (X1), q (X2)], Bi-weakening;
q (X1∩X2) < Min [q (X1), q (X2)], Non-linear-weakening;
where X1∩X2 is a new stratum created using overlaying factors X1 and X2 and indicates the interaction effect of X1 and X2.

2.3.3. Data Preprocessing for Geographical Detectors

The geographical detector methods require that the independent variables are categorical variables, and continuous variables should be stratified [33]. In this study, quantile and manual methods were used for the stratification of continuous variables (Table 1). The quantile method makes the sample number in each stratum equal, and the manual method relies on expert knowledge. Specifically, elevations of 200 and 500 m are the boundaries of plains, hills, and mountains; MAPs of 400 mm and 800 m distinguish semiarid, semi-humid, and humid zones. The stratification of MAT was based on the study by Li, et al. [54]. Table 1 shows the basic information and stratification methods for continuous variables. The GeogDetector software was used to implement the geographical detector methods (downloaded from http://geodetector.cn/ (accessed on 1 January 2022)) [55].

3. Results

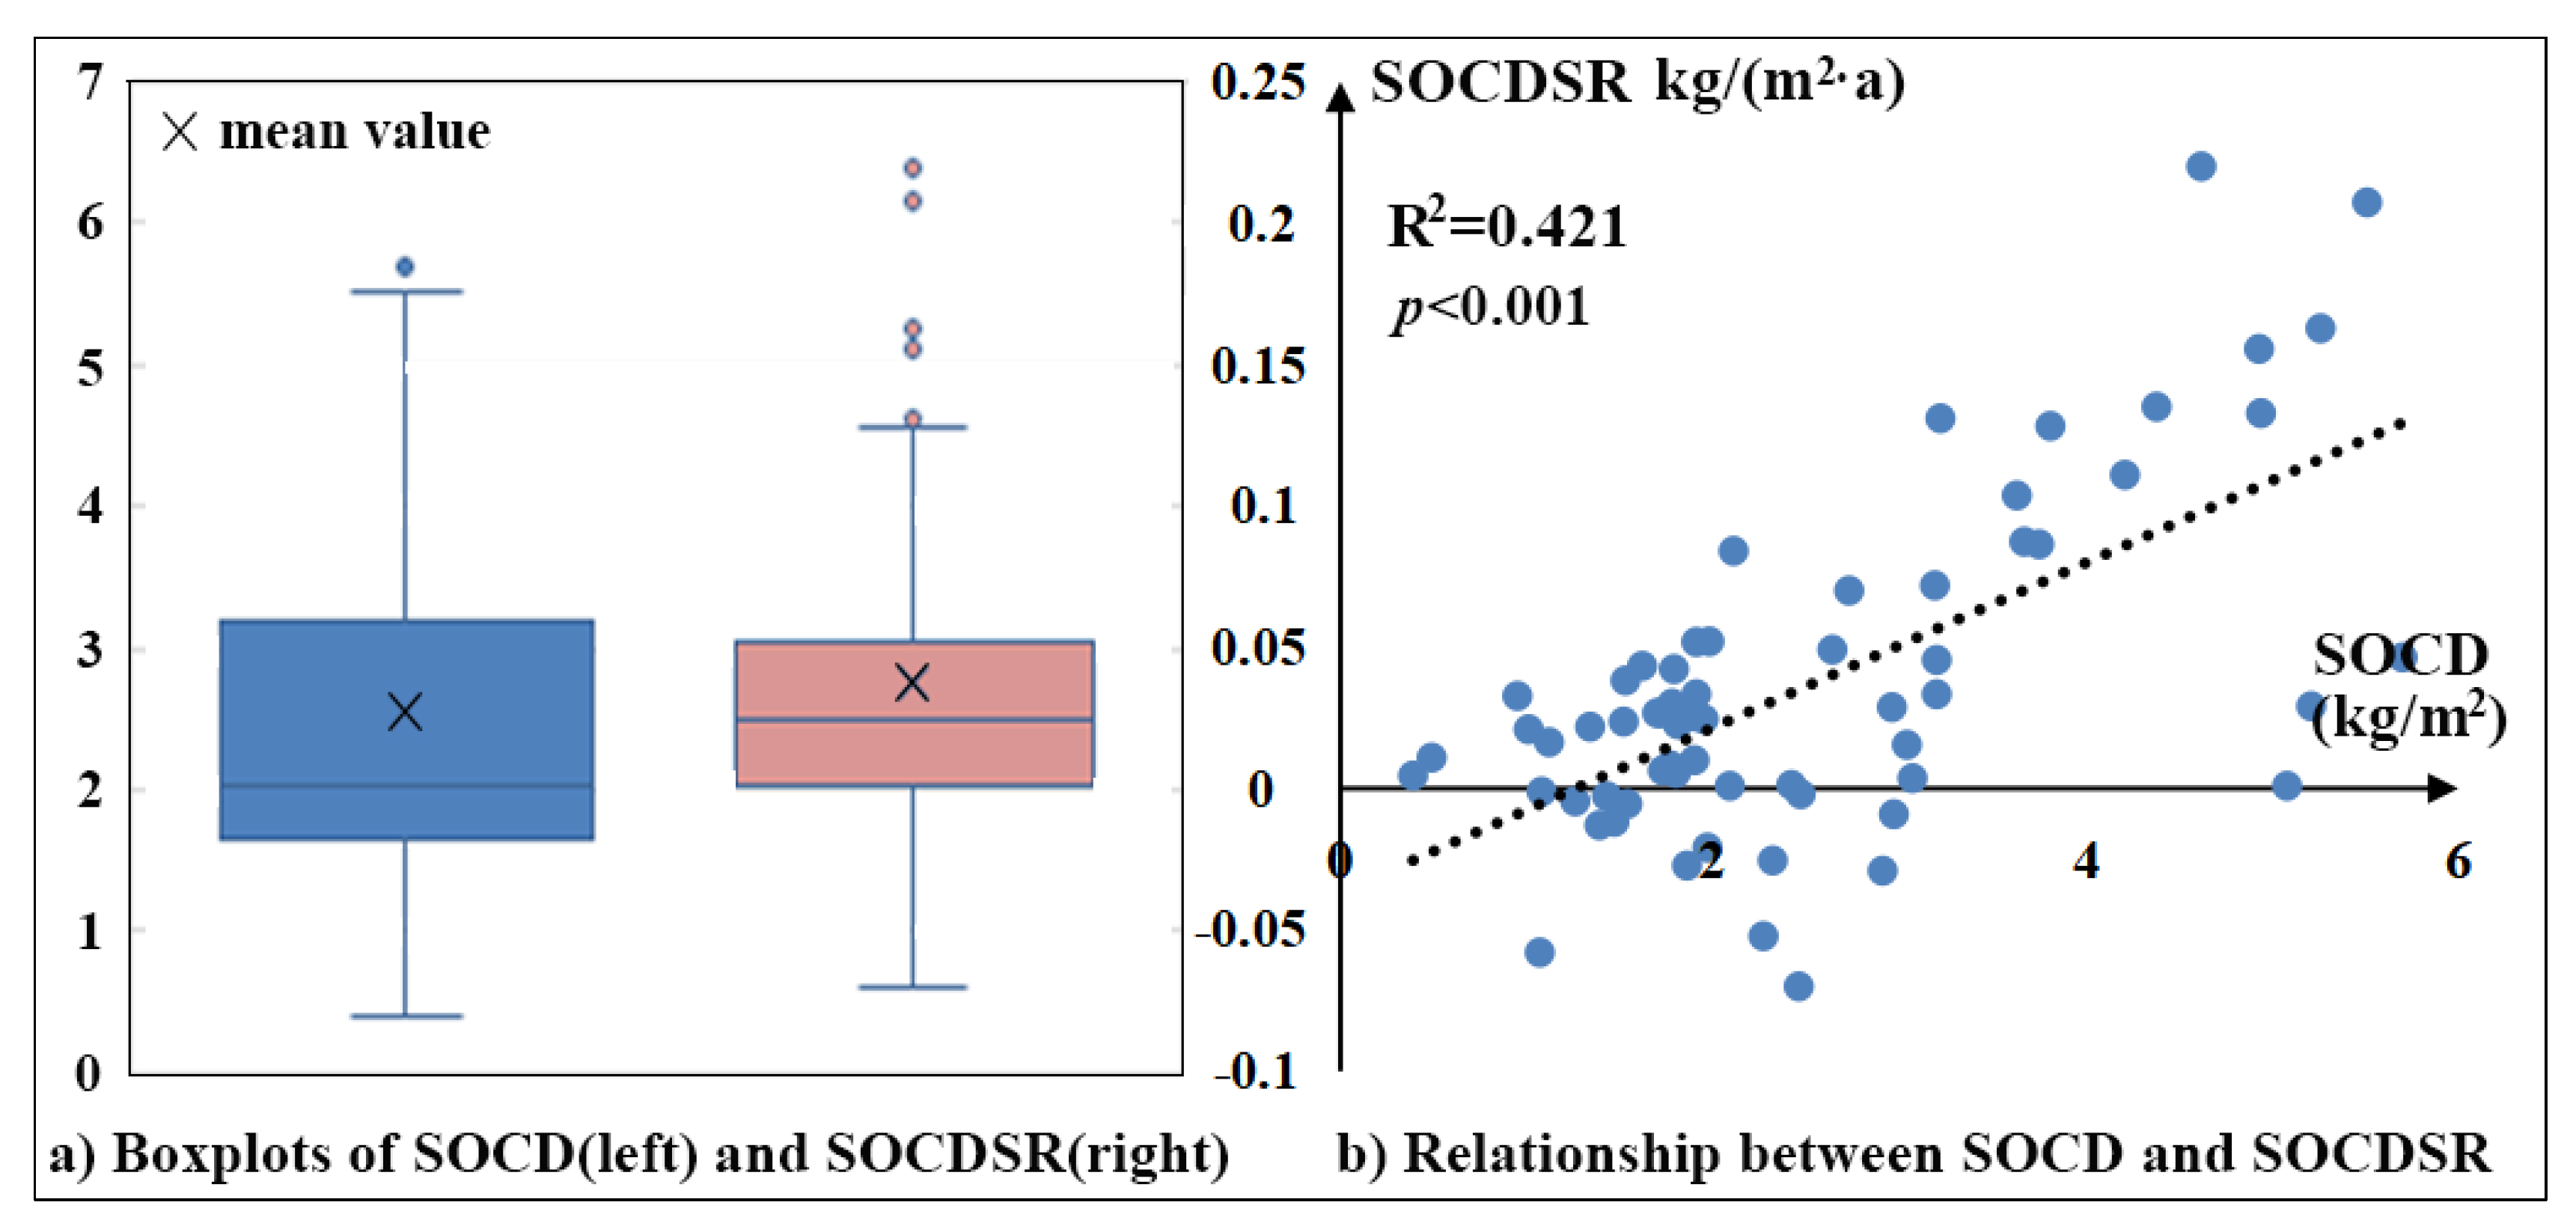
3.1. Descriptive Statistics of SOCD and SOCDSR

Figure 2a exhibits the boxplots of SOCD and SOCDSR. The SOCD ranged from 0.59 kg/m2 to 5.70 kg/m2, and the SOCDSR ranged from −0.07 kg/(m2·a) to 0.22 kg/(m2·a). The mean and median values of SOCD were 2.54 and 2.035 kg/m2, respectively. The mean and median values of SOCDSR were 0.037 kg/(m2·a) and 0.025 kg/(m2·a), respectively. The SOCDSR values of 77% of the sampling points were larger than 0, indicating that SOCD increased at most sampling locations in the previous 11 years. The scatter plot (Figure 2b) shows a positive correlation between SOCD and SOCDSR. This positive correlation was significant in accordance with Pearson correlation analysis (R2 = 0.421, p < 0.001).

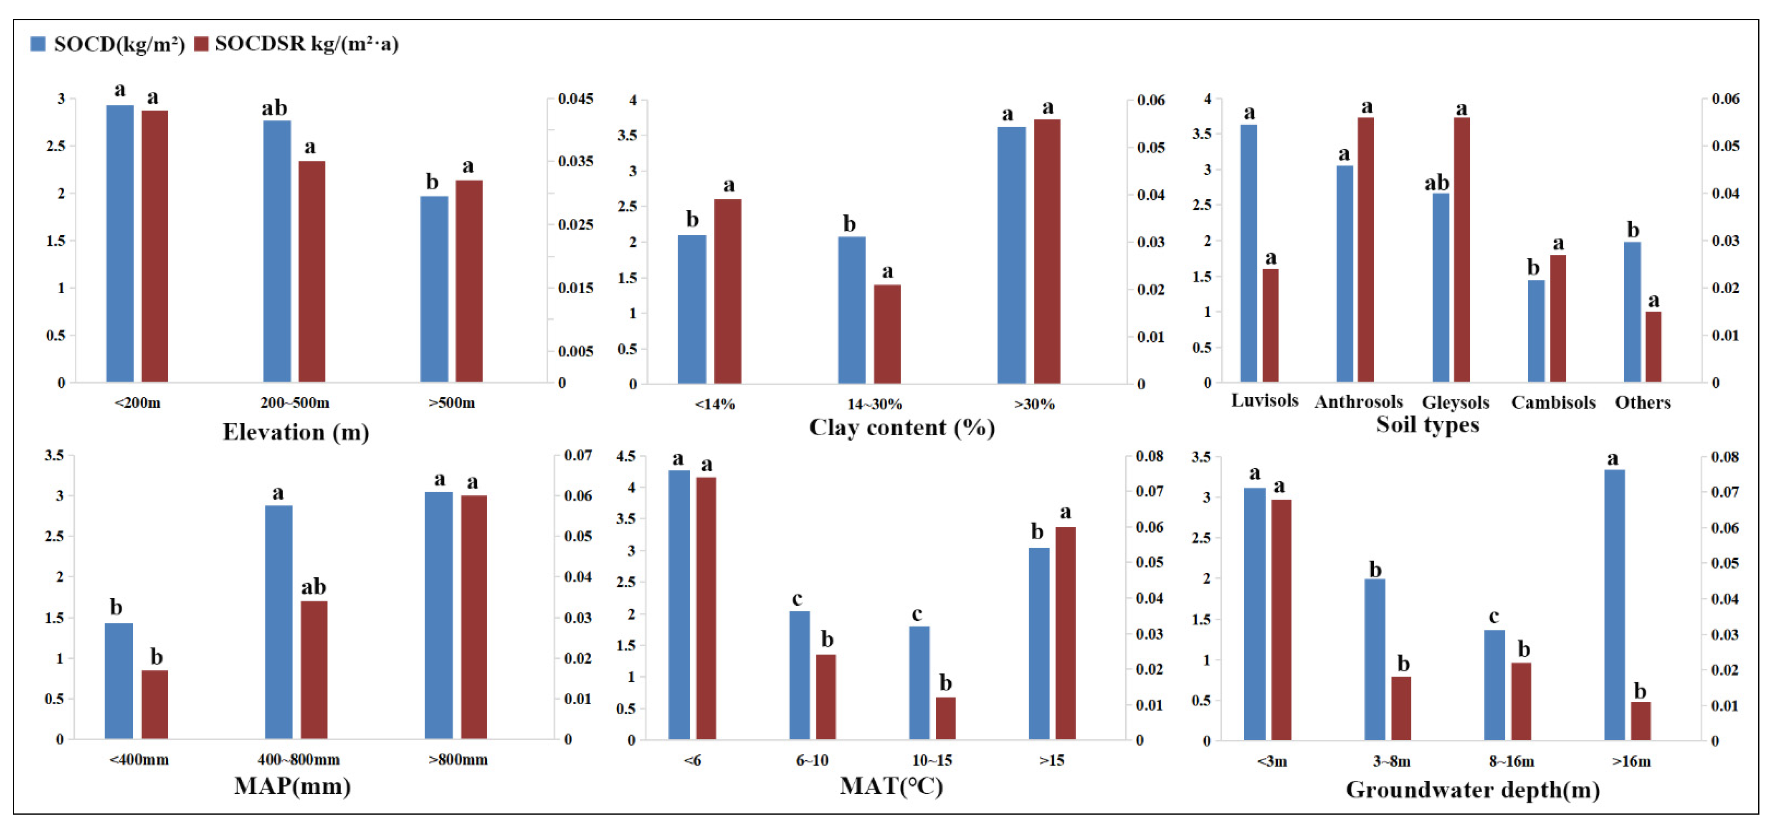
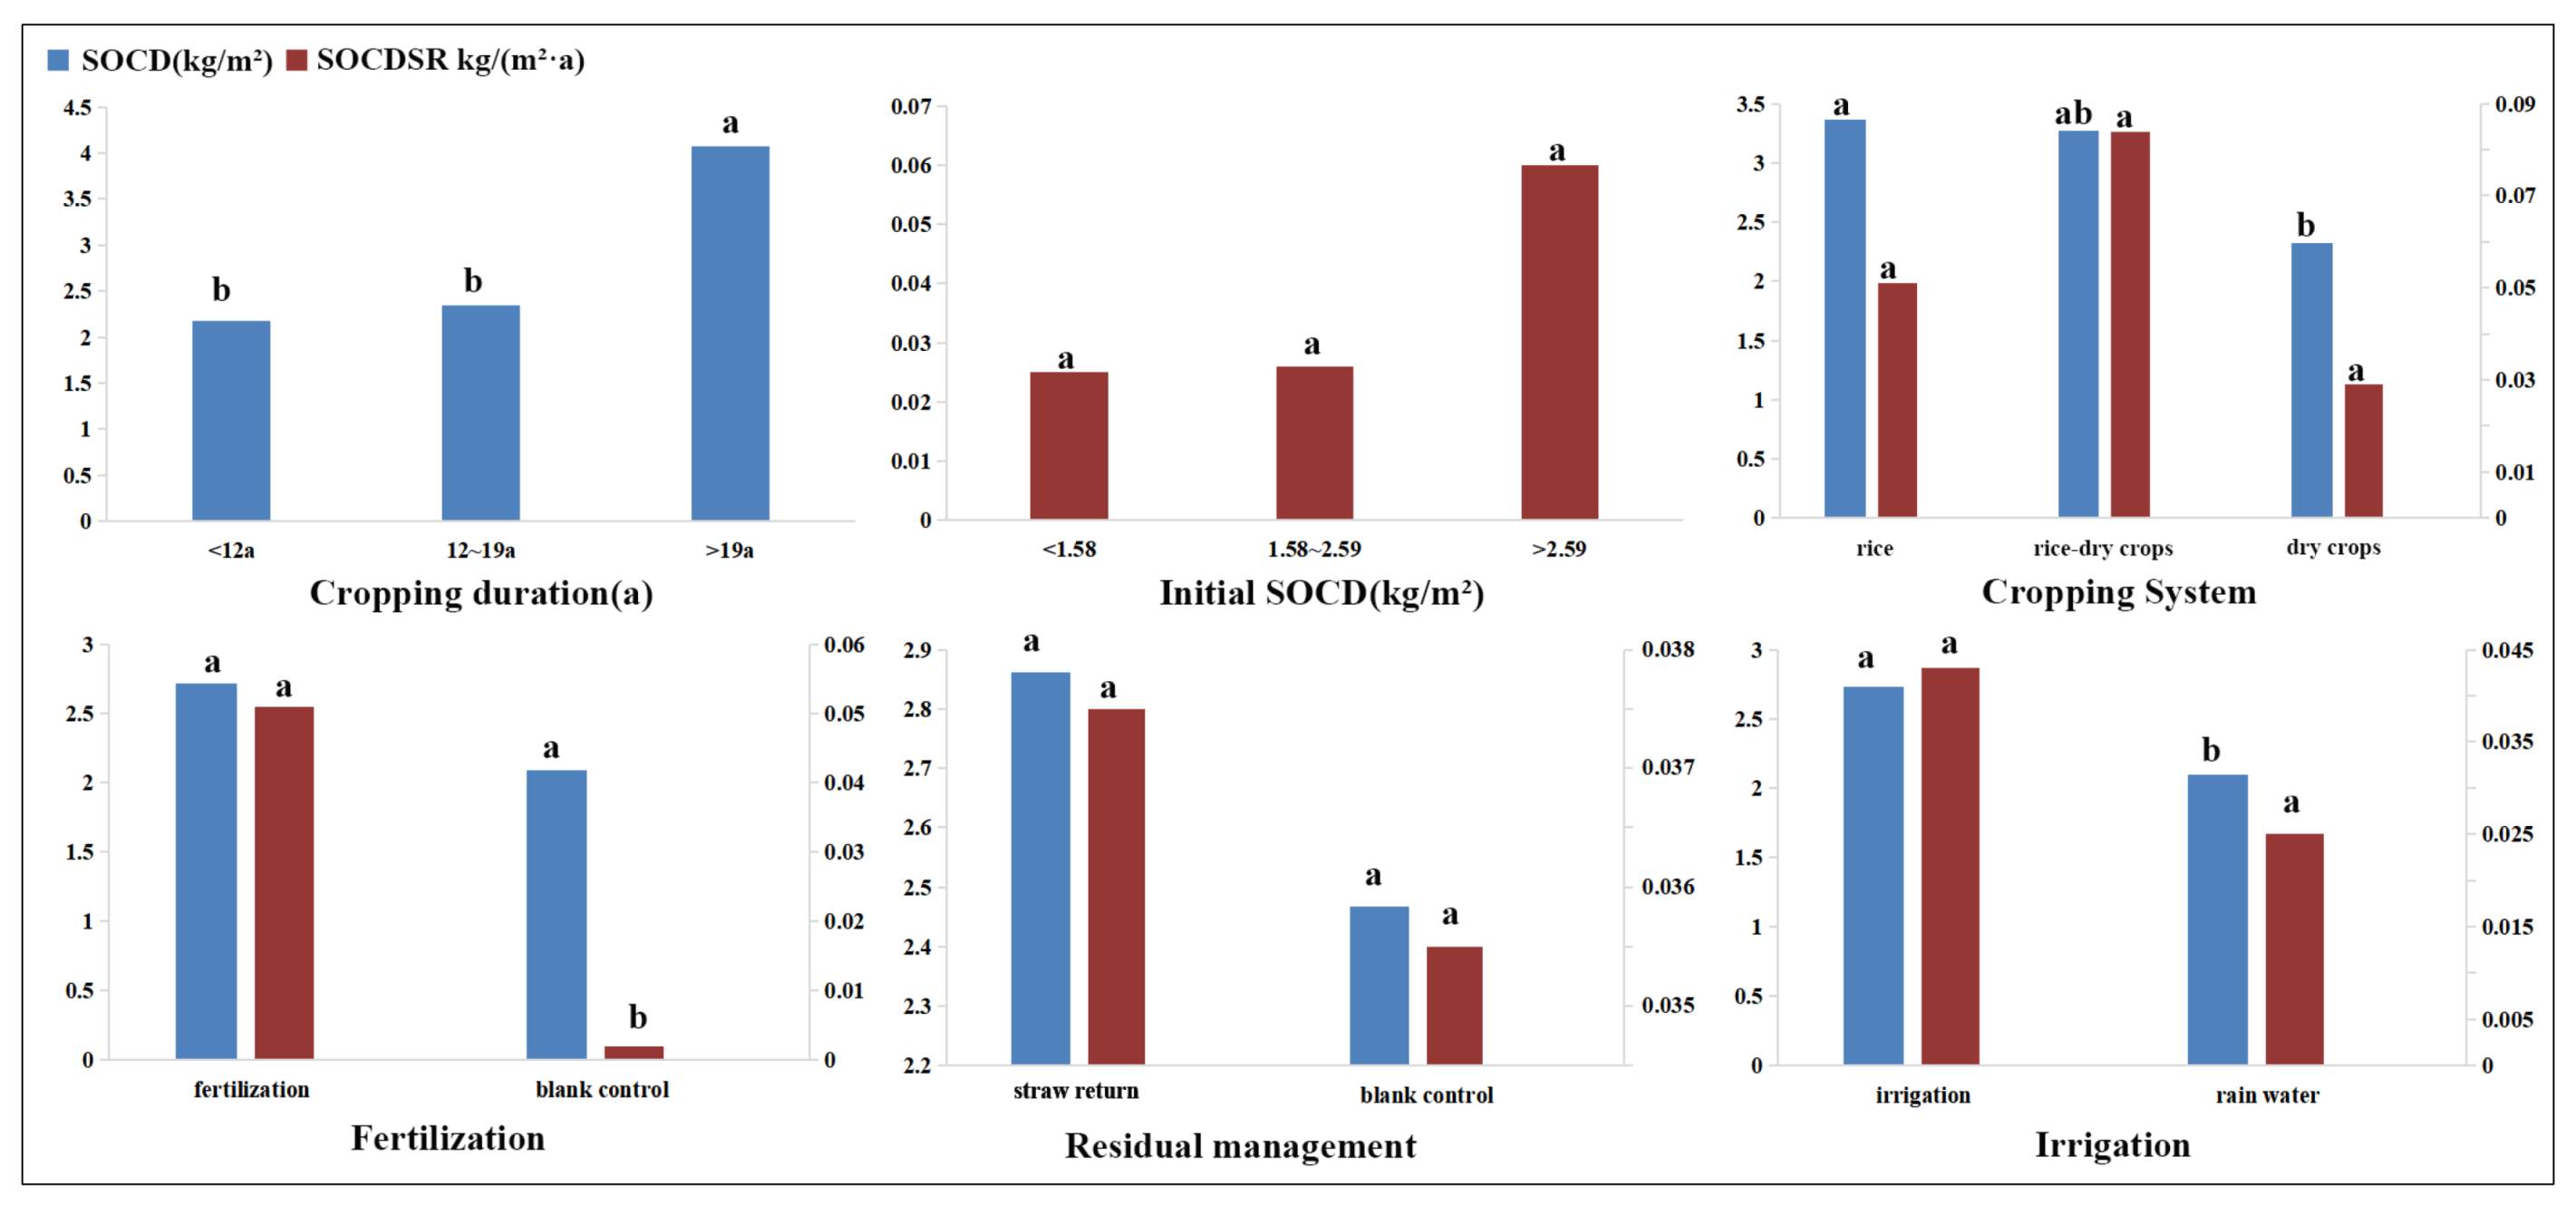
3.2. Factor and Risk Detectors

The factor detector results of SOCD and SOCDSR are shown in Table 2. Groundwater depth, soil type, clay content, MAT, MAP, and cropping duration had significant effects on SOCD. MAT, soil type, and groundwater depth were the three most influential factors and explained 40.3%, 35.7%, and 31.2% of the variation in SOCD, respectively. Groundwater depth, MAT, and fertilization had significant effects on SOCDSR, and they explained 18.2%, 16.4%, and 14.2% of the variation in SOCDSR, respectively. Therefore, SOCD and SOCDSR were affected by natural factors and human activities. The explanation power of existing factors on SOCD was stronger than that on SOCDSR.
On the basis of the risk detector results (Figure 3 and Figure 4), SOCD was related positively to MAP, clay content, and cropping duration and negatively to elevation. In particular, SOCD first decreased and then increased with the increase in groundwater depth and MAT. In general, a high SOCD value was found in the farmland with low relief (<200 m), high groundwater depth (<3 m), high MAP (>400 mm), high clay content (>30%), low and high MAT (<6 °C and >15 °C), Luvisols and Anthrosols, long cropping duration (>21 a), rice planting, and manual irrigation. The SOCDSR was related positively to MAP and negatively to groundwater depth. The high initial SOCD contributed to the high SOC accumulation, but the effect was insignificant. SOCDSR generally peaked under the conditions of high groundwater depth (<3 m), high MAP (>800 mm), low and high MAT (<6 °C and >15 °C, respectively), and fertilization.

3.3. Interaction Detector

A total of 121 pairs of interactions of SOCD and SOCDSR were calculated, and q values of these interactions are shown in Tables S1 and S2. These interactions were divided into three types: pairs of natural factors, pairs of human activities, and pairs of natural and human factors. Table 3 exhibits the dominant interaction effects on SOCD and SOCDSR with corresponding q values. The interaction effect of soil type and MAT was the most influential factor of SOCD, which explained 74.8% of the variation in SOCD. q values of the interactions between pairs of natural factors were higher than those of the two other types of interactions. The SOCDSR was mostly affected by the interaction effect of groundwater depth and fertilization. The joint impact of groundwater depth and fertilization explained 42.4% of the variation in SOCDSR. The interaction effects between pairs of natural and human factors had the greatest influence on SOCDSR, followed by those between pairs of human activities and pairs of natural factors. SOCD was mainly determined by the interactions between pairs of natural factors, whereas SOCDSR was mainly controlled by the interactions between natural and human factors.
Each type of interaction effect was determined by comparing q (X1∩X2) and the sum of q (X1) and q (X2). The joint impacts of soil type and MAT (q = 0.748), cropping duration, and MAT (q = 0.629) on SOCD were greater than the effects of individual factors (q (soil type) = 0.357, q (MAT) = 0.403, and q (cropping duration) = 0.290) but lower than their sum effect, which indicated that they were bi-enhanced. Other joint impacts on SOCD or SOCDSR were greater than the sum effect of two factors, indicating that the two factors enhanced each other (i.e., non-linear enhancement). In particular, the Q-statistic results showed that the cropping system exerted an insignificant effect on SOCD or SOCDSR (p > 0.05), but it played an important role in the interaction effects—with five other factors—on SOCD and SOCDSR. In general, interaction effects had greater explanatory power on SOCD and SOCDSR than single factors had.
The interaction effects with the greatest impacts on SOCD and SOCDSR are separately shown in Figure 5. Figure 5a exhibits the interaction effect of soil type and MAT on SOCD. The effect of MAT on SOCD was different in diverse soil types. The SOCD under low and high MAT (<6 °C and >15 °C, respectively) was much higher than that under medium MAT (6 °C–10 °C and 10 °C–15 °C) in Luvisols, Anthrosols, and Gleysols, but the difference in SOCD under low and high MAT and medium MAT was small in Cambisols and other soils. Figure 5b shows the interaction effect of groundwater depth and fertilization on SOCDSR. The effect of fertilization on SOCDSR varied in different groundwater depths. The difference in SOCDSR between fertilization and blank control was large when the groundwater depth was smaller than 3 m and larger than 16 m but was relatively small when the groundwater depth ranged from 3 m to 8 m and from 8 m to 16 m.

4. Discussion

4.1. Influencing Factors of SOCD and SOCDSR

The SOCD was affected by natural factors—mainly groundwater depth, soil type, clay content, MAT, and MAP—while SOCDSR was affected by natural factors and agricultural management—mainly MAT, groundwater depth, and fertilization (Table 2).
Natural factors play vital effects on SOCD and SOCDSR. Soil types are the comprehensive expression of parent materials and soil-forming processes and are associated with various soil properties, such as texture, pH, soil moisture, and temperature [56,57,58,59,60]. Diverse soil types have different initial fertility and ability to maintain soil nutrients; consequently, the difference in soil types affects the spatial distribution of SOCD. In this study, we found that the SOCD of Luvisols and Anthrosols was significantly higher than that of Cambisols and other soils, such as Calcisols. Luvisols have a thick humus layer with a good aggregate structure and high moisture [61,62]. Anthrosols are mainly paddy soil and usually have a low decomposition rate of SOC and thereby a high SOCD value [13,63,64]. Cambisols have high sand content, low clay content, and high soil porosity, which are unconducive to nutrient storage [65,66]. As a result, the SOCD in Luvisols and Anthrosols was high, whereas the SOCD in Cambisols and Calcisols was low. Clay content is also an important indicator of SOCD. Clayey soil can stabilize SOC because it physically protects SOC against microbial mineralization within soil aggregates and chemically stabilizes SOC through adsorption to clay particles [67,68]. The SOCD is hence often positively related to clay content [69,70,71]. This study confirmed the positive effect of clay content on SOCD. The results also showed that SOCD with a clay content of more than 30% was significantly higher than that with a clay content of less than 30%. The SOCDSR in diverse soil types and clay content levels differed. However, the difference was insignificant. This condition may be due to the fact that soil type and clay content determine the spatial distribution of SOCD in a natural state, but they have minimal effects on the dynamics of SOCD in a short time.
Temperature and precipitation affect SOCD by determining plant species, plant productivity, and carbon decomposition [27,72,73,74,75]. With an increase in temperature, plant productivity increases, and the decomposition of plant residues accelerates; soil carbon input then increases [76,77,78]. Nevertheless, the increase in temperature leads to increases in microbial activity and soil respiration and thus the decomposition rate of SOC [27,79]. Therefore, the relationship between temperature and SOCD is complex and often depends on the balance of vegetation productivity and soil respiration [80,81]. In this study, SOCD and SOCDSR first decreased and then increased with an increase in MAT. The SOCD and SOCDSR under MAT lower than 6 °C or higher than 15 °C were significantly higher than those under MAT between 6 °C and 15 °C. This condition may be due to that low temperature (e.g., lower than 6 °C) inhibits soil respiration [82]. As the temperature increases, the increase in soil respiration is more influential than the increase in crop productivity, which leads to low SOCD [83,84]. The regions with high temperatures (e.g., higher than 15 °C) in South China, where farmlands are dominated by paddy fields, often adopt a multicropping system, which inhibits soil respiration and enhances carbon inputs [13,27,63,85]. As a result, the SOCD under high/low MAT is higher than that under moderate MAT. This finding is similar to that of the research of Li, et al. [54] and Xu et al. [62], who explored the national scale influencing factors of SOC in China’s farmlands and found that when MAT is lower than 10 °C, SOC is negatively correlated with MAT, whereas when MAT is higher than 10 °C, SOC is positively correlated with MAT. Nonetheless, many studies have found that MAT is negatively correlated with SOCD and SOCDSR [84,86,87,88,89,90], which seems inconsistent with our findings. This difference may be due to the fact that these studies were conducted in relatively small-scale areas with moderate/low MAT and mainly natural coverage.
Precipitation affects soil moisture and thus controls SOCD. Low precipitation leads to low soil moisture and high soil salinity, which limit plant productivity and constrain SOM accumulation [72,78]. Moreover, low soil moisture results in high soil aeration and thereby enhances aerobic microbial activity and carbon decomposition [73,91]. As a result, precipitation often exhibits a positive correlation with SOCD and SOCDSR [27,84,88,89,90]. In this study, precipitation had a significant positive effect on SOCD. By contrast, the effect of precipitation on SOCDSR was insignificant (p = 0.066). This condition may be due to the fact that most farmlands are irrigated; consequently, the dependence of soil moisture on precipitation is reduced.
Fertilization (e.g., N, P, and K), straw return, and irrigation can enhance crop yield and biomass productivity, which in turn increases the carbon input into the soil from crop residues and roots [92,93,94,95,96]. Several field experiments have proven that different fertilization treatments sequestrate large amounts of carbon compared to no fertilizer application, and the integration of chemical fertilizers, organic manures, and straw return fixes most carbon [97,98,99,100]. Irrigation water is a good supplement to rainfall, which can improve the soil quality of farmland and has have a high potential for increasing SOCD, especially in arid and semiarid areas [17,94,101,102,103]. In this study, fertilization (e.g., urea, N, P, and K fertilizers), straw return and irrigation (e.g., flood irrigation) exhibited positive effects on SOCD and SOCDSR. However, the difference of SOCD among fertilization, straw return, irrigation, and blank control was not significant, which may be due to insufficient cropping duration.
The aforementioned findings indicated that the spatial distribution of SOCD is mainly controlled by natural factors, such as climate and soil environment. Human activities, especially fertilization, play more important roles in SOCDSR. It can be predicted that with the increase of cropping duration, agricultural management will play a more important role in carbon sequestration.

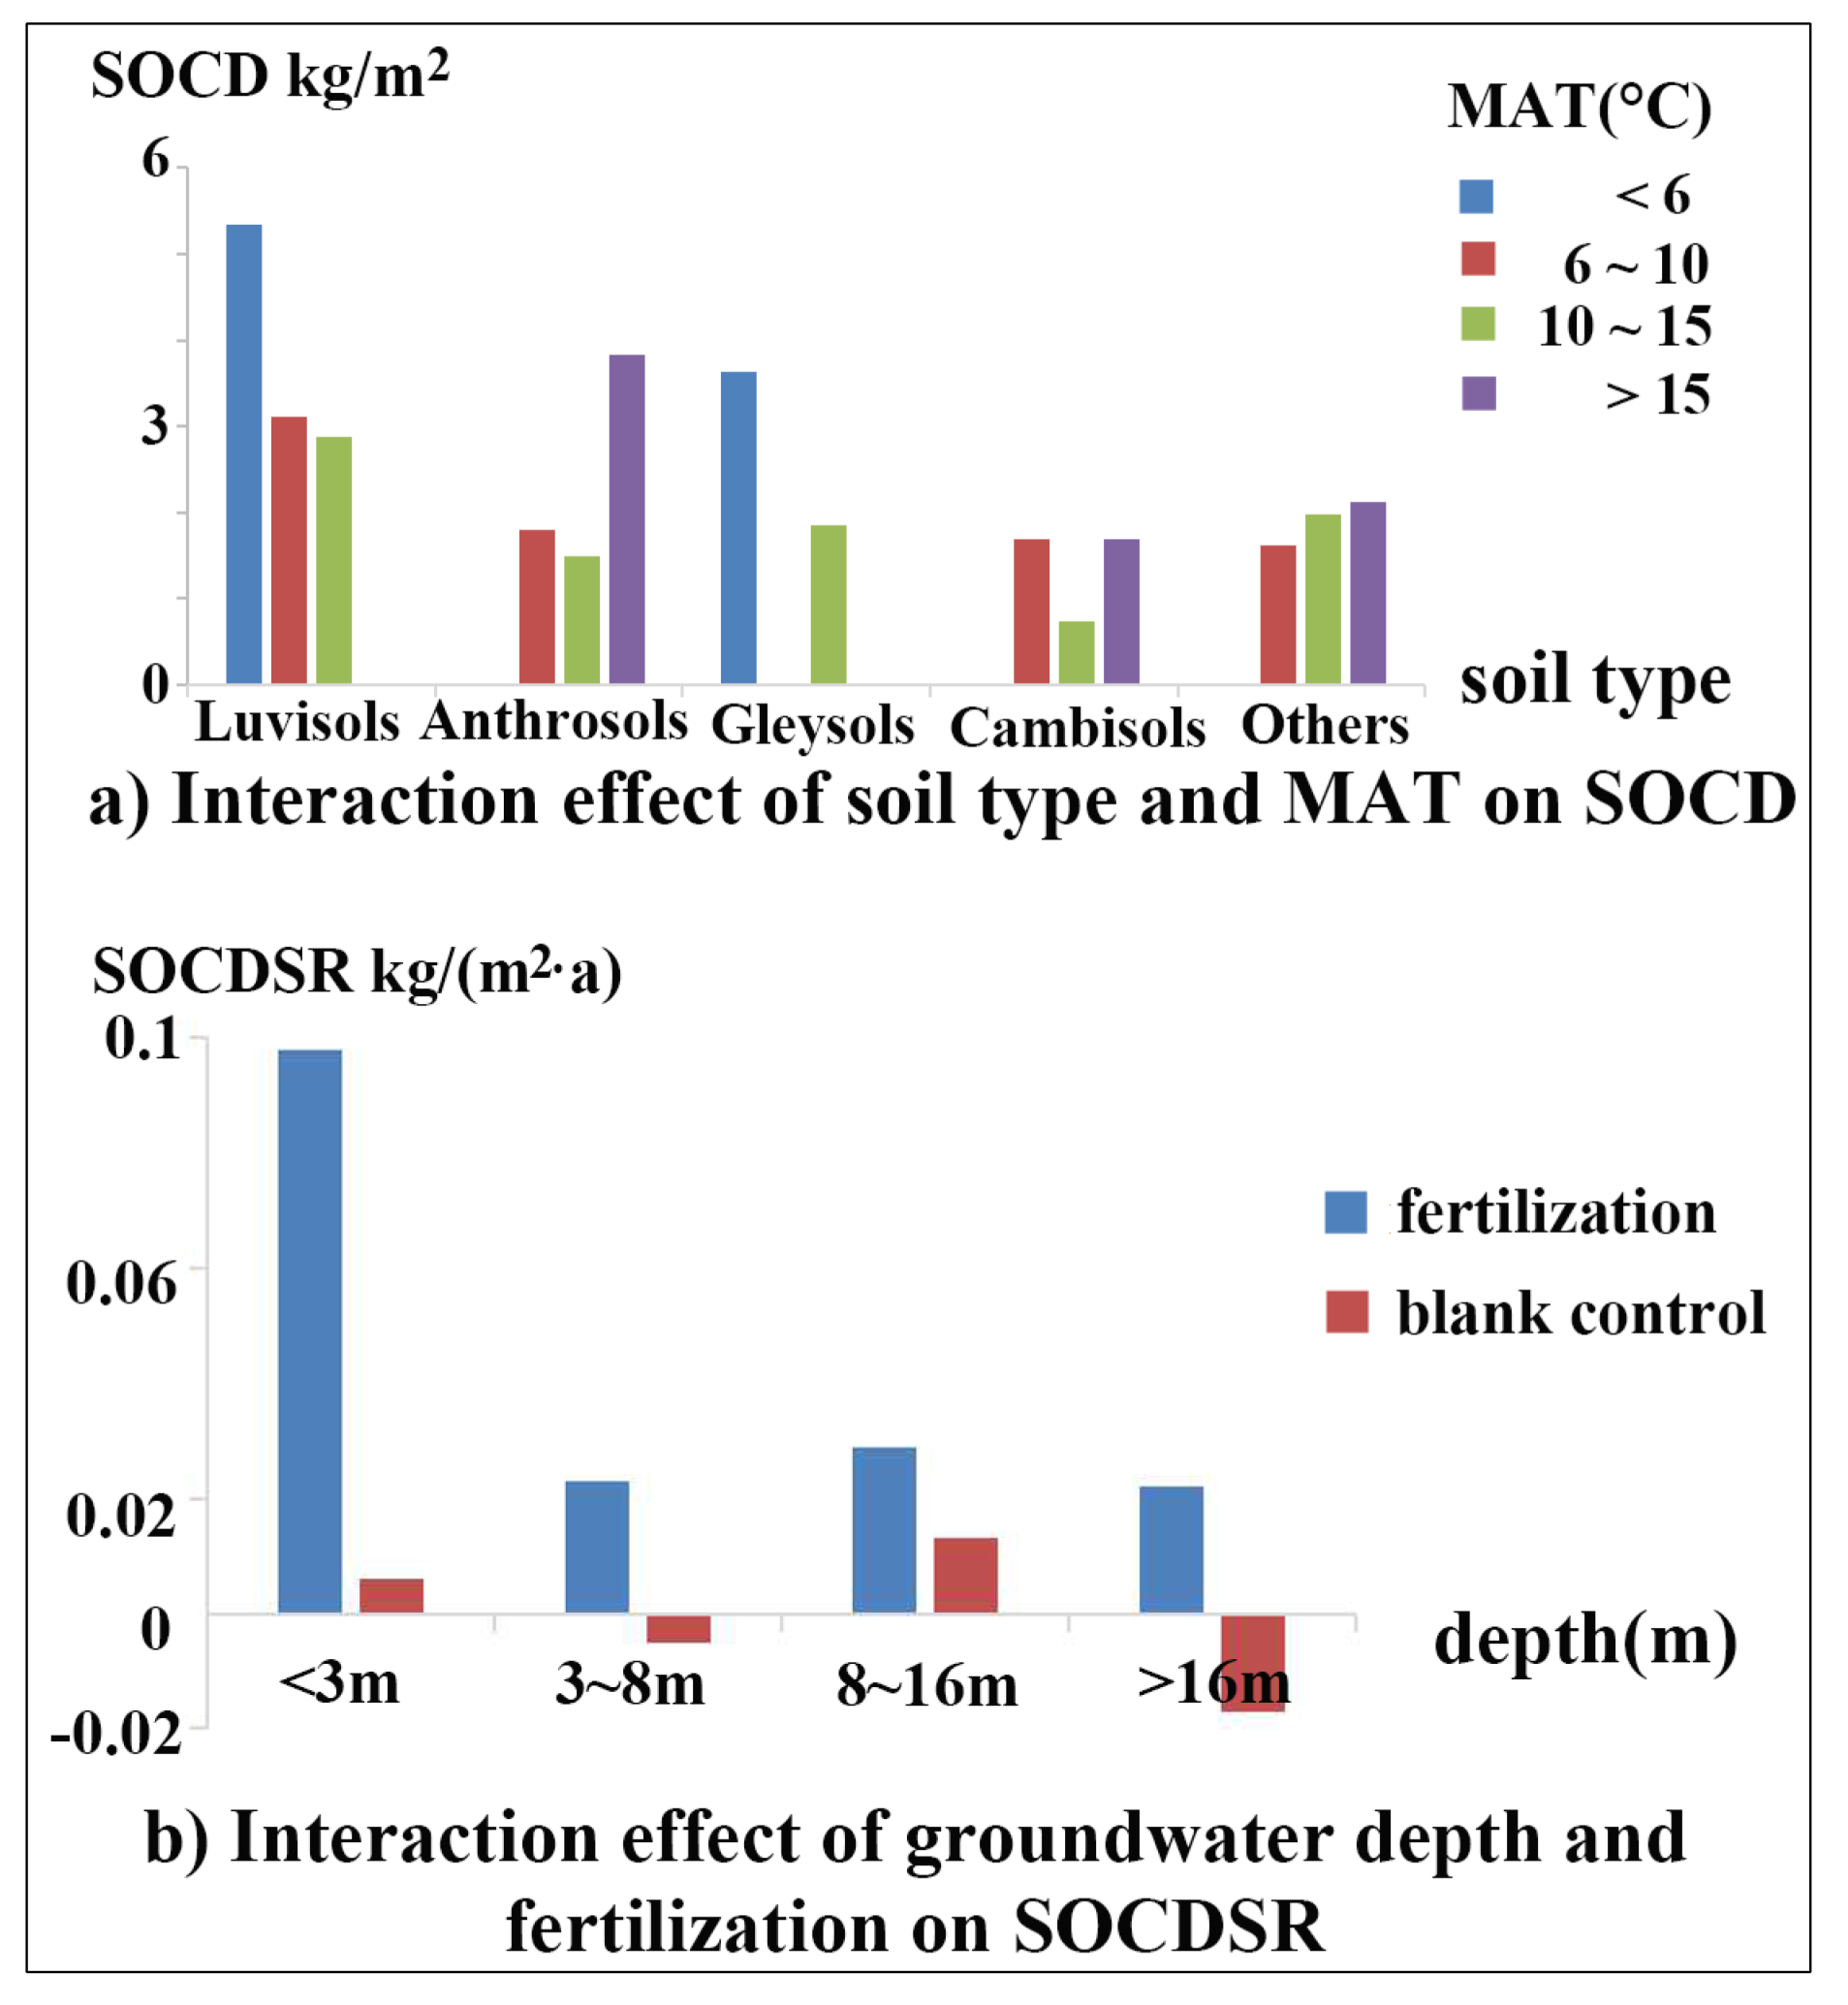
4.2. Interaction Effects of Environmental Variables on SOCD and SOCDSR

This study explored the interaction effects of environmental variables on SOCD and SOCDSR. The results showed that interaction effects existed in all environmental variable pairs, and the q value of interaction effects was often greater than the sum of q values of two single variables. This condition indicated that the influences of environmental variables on SOCD were often dependent on one another, and the consideration of interactions could well explain SOCD and SOCDSR.
We explored the specific interaction effect of environmental variable pairs and identified that the relationship between SOCD and MAT depended on soil types. For example, the SOCD under high MAT (>15 °C) was higher than that under medium MAT (6 °C–15 °C) in Anthrosols, which may be because high MAT promotes vegetation growth, whereas submerged environment inhibits microbial respiration [13,78]. However, the SOCD under high MAT (>15 °C) was not higher than that under medium MAT (especially 6 °C–10 °C), which may be due to the fact that high MAT promotes microbial respiration that exceeds the effect of vegetation growth [83,84]. Similarly, the effect of fertilization on SOCDSR depends on groundwater depth. Fertilization was conducive to SOCD increase at a high groundwater depth (<3 m), which may be because a high groundwater depth (<3 m) implies high soil moisture and thus promotes fertilizer absorption and vegetation growth [94,102]. The abovementioned findings highlight the importance of interaction effects in explaining SOCD and SOCDSR.

4.3. Limitations

This study used 64 sampling points that were collected from the typical cropping systems in China. However, the number of sampling points is far from sufficient to capture the spatial variation of farmland SOCD in China. In our future work, we will collect more samples to explore the dominant factors of spatial variation of SOCD and SOCDSR. Moreover, the consideration of soil environment indicators, such as soil moisture, temperature, and electric conductivity, may better explain SOCD and SOCDSR variation. Several abiotic and biotic factors, such as tillage practice [96,104], seasonal temperature and precipitation [73], and microbial activities [105,106], were not considered because of the lack of data.
We found that interaction effects played an important role in explaining SOCD and SOCDSR. Nevertheless, how to apply interaction effects to improve the mapping of soil properties remains unclear. Song et al. [107] divided the study area on the basis of soil type and climate and then used machine-learning models to estimate the SOC of each pedoclimate zone in combination with other environmental variables. This method considered the interaction effects of soil type, climate, and other continuous environmental variables and thus improved the SOC mapping accuracy. However, it did not consider the interaction effects among those continuous variables. The application of interaction effects in improving soil mapping accuracy requires further exploration.

5. Conclusions

This study explored the effects of natural factors, agricultural management, and their interactions on farmland SOCD and SOCDSR using geographical detector methods. It was revealed that SOCD was associated with natural factors, while the SOCDSR was related to natural factors and agricultural management. It was also revealed that interaction effects existed in all environmental variable pairs, and the explanatory power of the interaction effect was often greater than that of the sum of two single variables. Specifically, the interaction effect of soil type and MAT explained 74.8% of the variation in SOCD, and further investigation revealed that SOCD was highest in Luvisols and was under a low MAT (<6 °C). The interaction effect of groundwater depth and fertilization explained 40.4% of the variation in SOCDSR, and fertilization was particularly conducive to SOCD increase at a high groundwater depth (<3 m). These findings suggest that low soil temperature, high soil moisture, and fertilization are conducive to soil carbon accumulation. These findings also highlight the importance of agricultural management and interaction effects in explaining SOCD and SOCDSR, which promote our knowledge to better understand the variation of SOCD and its dynamics.

Supplementary Materials

The following supporting information can be downloaded at: https://0-www-mdpi-com.brum.beds.ac.uk/article/10.3390/land11020208/s1, Table S1: Interaction detector results of SOCD; Table S2: Interaction detector results of SOCDSR.

Author Contributions

Conceptualization, Z.W. and Y.C.; methodology, Z.W. and Y.L.; software, G.L.; validation, Z.W., G.L. and Y.H.; formal analysis, Z.W.; investigation, Z.W. and Y.L.; resources, Z.W. and Y.H.; data curation, Y.H.; writing—original draft preparation, Z.W.; writing—review and editing, Y.L., X.L. and Y.C.; visualization, G.L. and Y.H.; supervision, Y.L. and X.L.; project administration, Y.C.; funding acquisition, X.L. and Y.C. All authors have read and agreed to the published version of the manuscript.

Funding

This study was funded by the National Natural Science Foundation of China (41771440, 71874192).

Institutional Review Board Statement

Not applicable.

Informed Consent Statement

Not applicable.

Data Availability Statement

Not applicable.

Conflicts of Interest

The authors declare no conflict of interest.

References

  1. Tao, F.; Palosuo, T.; Valkama, E.; Mäkipää, R. Cropland soils in China have a large potential for carbon sequestration based It on literature survey. Soil Tillage Res. 2019, 186, 70–78. [Google Scholar] [CrossRef]
  2. Li, X.; Shang, B.; Wang, D.; Wang, Z.; Wen, X.; Kang, Y. Mapping soil organic carbon and total nitrogen in croplands of the Corn Belt of Northeast China based on geographically weighted regression kriging model. Comput. Geosci. 2020, 135, 104392. [Google Scholar] [CrossRef]
  3. Mayer, S.; Kühnel, A.; Burmeister, J.; Kögel-Knabner, I.; Wiesmeier, M. Controlling factors of organic carbon stocks in agricultural topsoils and subsoils of Bavaria. Soil Tillage Res. 2019, 192, 22–32. [Google Scholar] [CrossRef]
  4. Canadell, J.G. Land use effects on terrestrial carbon sources and sinks. Sci. China Ser. C-Life Sci. 2002, 45, 1–9. [Google Scholar]
  5. Minasny, B.; Malone, B.P.; McBratney, A.B.; Angers, D.A.; Arrouays, D.; Chambers, A.; Chaplot, V.; Chen, Z.-S.; Cheng, K.; Das, B.S.; et al. Soil carbon 4 per mille. Geoderma 2017, 292, 59–86. [Google Scholar] [CrossRef]
  6. Kätterer, T.; Bolinder, M.A.; Berglund, K.; Kirchmann, H. Strategies for carbon sequestration in agricultural soils in northern Europe. Acta Agric. Scand. Sect. A-Anim. Sci. 2012, 62, 181–198. [Google Scholar] [CrossRef]
  7. Frank, S.; Schmid, E.; Havlík, P.; Schneider, U.A.; Böttcher, H.; Balkovič, J.; Obersteiner, M. The dynamic soil organic carbon mitigation potential of European cropland. Glob. Environ. Chang. 2015, 35, 269–278. [Google Scholar] [CrossRef]
  8. Abbas, F.; Hammad, H.M.; Ishaq, W.; Farooque, A.A.; Bakhat, H.F.; Zia, Z.; Fahad, S.; Farhad, W.; Cerdà, A. A review of soil carbon dynamics resulting from agricultural practices. J. Environ. Manag. 2020, 268, 110319. [Google Scholar] [CrossRef]
  9. Zhang, F.; Wang, S.; Zhao, M.; Qin, F.; Liu, X. Regional simulation of soil organic carbon dynamics for dry farmland in Northeast China using the CENTURY model. PLoS ONE 2021, 16, e0245040. [Google Scholar] [CrossRef]
  10. Wollenberg, E.; Richards, M.; Smith, P.; Havlík, P.; Obersteiner, M.; Tubiello, F.N.; Herold, M.; Gerber, P.; Carter, S.; Reisinger, A.; et al. Reducing emissions from agriculture to meet the 2 °C target. Glob. Chang. Biol. 2016, 22, 3859–3864. [Google Scholar] [CrossRef] [Green Version]
  11. Wiesmeier, M.; Mayer, S.; Burmeister, J.; Hübner, R.; Kögel-Knabner, I. Feasibility of the 4 per 1000 initiative in Bavaria: A reality check of agricultural soil management and carbon sequestration scenarios. Geoderma 2020, 369, 114333. [Google Scholar] [CrossRef]
  12. Wise, L.; Marland, E.; Marland, G.; Hoyle, J.; Kowalczyk, T.; Ruseva, T.; Colby, J.; Kinlaw, T. Optimizing sequestered carbon in forest offset programs: Balancing accounting stringency and participation. Carbon Balance Manag. 2019, 14, 16. [Google Scholar] [CrossRef] [PubMed]
  13. Guo, N.; Shi, X.; Zhao, Y.; Xu, S.; Wang, M.; Zhang, G.; Wu, J.; Huang, B.; Kong, C. Environmental and anthropogenic factors driving changes in paddy soil organic matter: A case study in the middle and lower Yangtze River Plain of China. Pedosphere 2017, 27, 926–937. [Google Scholar] [CrossRef]
  14. Pittarello, M.; Dal Ferro, N.; Chiarini, F.; Morari, F.; Carletti, P. Influence of tillage and crop rotations in organic and conventional farming systems on soil organic matter, bulk density and enzymatic activities in a short-term field experiment. Agronomy 2021, 11, 724. [Google Scholar] [CrossRef]
  15. Shakoor, A.; Shakoor, S.; Rehman, A.; Ashraf, F.; Abdullah, M.; Shahzad, S.M.; Farooq, T.H.; Ashraf, M.; Manzoor, M.A.; Altaf, M.M. Effect of animal manure, crop type, climate zone, and soil attributes on greenhouse gas emissions from agricultural soils-A global meta-analysis. J. Clean. Prod. 2021, 278, 124019. [Google Scholar] [CrossRef]
  16. Dong, W.; Wu, T.; Luo, J.; Sun, Y.; Xia, L. Land parcel-based digital soil mapping of soil nutrient properties in an alluvial-diluvia plain agricultural area in China. Geoderma 2019, 340, 234–248. [Google Scholar] [CrossRef]
  17. Fallahzade, J.; Hajabbasi, M.A. The effects of irrigation and cultivation on the quality of desert soil in central Iran. Land Degrad. Dev. 2012, 23, 53–61. [Google Scholar] [CrossRef]
  18. Minasny, B.; McBratney, A.B.; Malone, B.P.; Wheeler, I. Digital Mapping of Soil Carbon. In Advances in Agronomy; Sparks, D.L., Ed.; Academic Press: Cambridge, MA, USA, 2013; Volume 118, pp. 1–47. [Google Scholar]
  19. Sindayihebura, A.; Ottoy, S.; Dondeyne, S.; van Meirvenne, M.; van Orshoven, J. Comparing digital soil mapping techniques for organic carbon and clay content: Case study in Burundi’s central plateaus. Catena 2017, 156, 161–175. [Google Scholar] [CrossRef]
  20. Lamichhane, S.; Kumar, L.; Wilson, B. Digital soil mapping algorithms and covariates for soil organic carbon mapping and their implications: A review. Geoderma 2019, 352, 395–413. [Google Scholar] [CrossRef]
  21. McBratney, A.B.; Santos, M.L.M.; Minasny, B. On digital soil mapping. Geoderma 2003, 117, 3–52. [Google Scholar] [CrossRef]
  22. Zhang, H.; Yin, A.; Yang, X.; Wu, P.; Fan, M.; Wu, J.; Zhang, M.; Gao, C. Changes in surface soil organic/inorganic carbon concentrations and their driving forces in reclaimed coastal tidal flats. Geoderma 2019, 352, 150–159. [Google Scholar] [CrossRef]
  23. Zhang, Z.; Zhou, Y.; Wang, S.; Huang, X. Change in SOC content in a small karst basin for the past 35 years and its influencing factors. Arch. Agron. Soil Sci. 2018, 64, 2019–2029. [Google Scholar] [CrossRef]
  24. Chen, D.; Xue, M.; Duan, X.; Feng, D.; Huang, Y.; Rong, L. Changes in topsoil organic carbon from 1986 to 2010 in a mountainous plateau region in Southwest China. Land Degrad. Dev. 2020, 31, 734–747. [Google Scholar] [CrossRef]
  25. Lu, W.; Lu, D.; Wang, G.; Wu, J.; Huang, J.; Li, G. Examining soil organic carbon distribution and dynamic change in a hickory plantation region with Landsat and ancillary data. Catena 2018, 165, 576–589. [Google Scholar] [CrossRef]
  26. Zhou, Y.; Biswas, A.; Ma, Z.; Lu, Y.; Chen, Q.; Shi, Z. Revealing the scale-specific controls of soil organic matter at large scale in Northeast and North China Plain. Geoderma 2016, 271, 71–79. [Google Scholar] [CrossRef]
  27. Wang, D.; Yan, Y.; Li, X.; Shi, X.; Zhang, Z.; Weindorf, D.C.; Wang, H.; Xu, S. Influence of climate on soil organic carbon in Chinese paddy soils. Chin. Geogr. Sci. 2017, 27, 351–361. [Google Scholar] [CrossRef]
  28. Zhang, C.; Tang, Y.; Xu, X.; Kiely, G. Towards spatial geochemical modelling: Use of geographically weighted regression for mapping soil organic carbon contents in Ireland. Appl. Geochem. 2011, 26, 1239–1248. [Google Scholar] [CrossRef]
  29. Liang, Z.; Chen, S.; Yang, Y.; Zhao, R.; Shi, Z.; Rossel, R.A.V. National digital soil map of organic matter in topsoil and its associated uncertainty in 1980′s China. Geoderma 2019, 335, 47–56. [Google Scholar] [CrossRef]
  30. Zhong, C.; Yang, Z.; Hu, B.; Zhang, X.; Hou, Q.; Xia, X.; Yu, T. Soil organic carbon and the response to climate change in Hebei Plains. Res. Agric. Mod. 2016, 37, 809–816. [Google Scholar]
  31. Liu, Y.L.; Wu, Z.H.; Chen, Y.Y.; Wang, B.Z. Soil carbon mapping in low relief areas with combined land use types and percentages. ISPRS Ann. Photogramm. Remote Sens. Spat. Inf. Sci. 2018, IV-3, 285–292. [Google Scholar] [CrossRef] [Green Version]
  32. Zhu, H.; Wu, J.; Guo, S.; Huang, D.; Zhu, Q.; Ge, T.; Lei, T. Land use and topographic position control soil organic C and N accumulation in eroded hilly watershed of the Loess Plateau. Catena 2014, 120, 64–72. [Google Scholar] [CrossRef]
  33. Xu, L.; Cao, S.; Wang, J.; Lu, A. Which Factors Determine Metal Accumulation in Agricultural Soils in the Severely Human-Coupled Ecosystem? Int. J. Environ. Res. Public Health 2016, 13, 510. [Google Scholar] [CrossRef] [Green Version]
  34. Cao, S.; Lu, A.; Wang, J.; Huo, L. Modeling and mapping of cadmium in soils based on qualitative and quantitative auxiliary variables in a cadmium contaminated area. Sci. Total Environ. 2017, 580, 430–439. [Google Scholar] [CrossRef]
  35. Schillaci, C.; Perego, A.; Valkama, E.; Märker, M.; Saia, S.; Veronesi, F.; Lipani, A.; Lombardo, L.; Tadiello, T.; Gamper, H.A.; et al. New pedotransfer approaches to predict soil bulk density using WoSIS soil data and environmental covariates in Mediterranean agro-ecosystems. Sci. Total Environ. 2021, 780, 146609. [Google Scholar] [CrossRef]
  36. Ye, Y.; Jiang, Y.; Kuang, L.; Han, Y.; Xu, Z.; Guo, X. Predicting spatial distribution of soil organic carbon and total nitrogen in a typical human impacted area. Geocarto Int. 2021, 1–19. [Google Scholar] [CrossRef]
  37. Shaffer, J.P. The Gauss-Markov theorem and random regressors. Am. Stat. 1991, 45, 269–273. [Google Scholar] [CrossRef]
  38. Wang, J.; Xu, C. Geodetector: Principle and prospective. Acta Geogr. Sin. 2017, 72, 116–134. [Google Scholar]
  39. Du, Z.; Gao, B.; Ou, C.; Du, Z.; Yang, J.; Batsaikhan, B.; Dorjgotov, B.; Yun, W.; Zhu, D. A Quantitative Analysis of Factors Influencing Organic Matter Concentration in the Topsoil of Black Soil in Northeast China Based on Spatial Heterogeneous Patterns. ISPRS Int. J. Geo-Inf. 2021, 10, 348. [Google Scholar] [CrossRef]
  40. Xie, E.; Zhang, Y.; Huang, B.; Zhao, Y.; Shi, X.; Hu, W.; Qu, M. Spatiotemporal variations in soil organic carbon and their drivers in southeastern China during 1981–2011. Soil Tillage Res. 2021, 205, 104763. [Google Scholar] [CrossRef]
  41. Gao, J.; Wang, H. Temporal analysis on quantitative attribution of karst soil erosion: A case study of a peak-cluster depression basin in Southwest China. Catena 2019, 172, 369–377. [Google Scholar] [CrossRef]
  42. Gao, J.; Jiang, Y.; Wang, H.; Zuo, L. Identification of Dominant Factors Affecting Soil Erosion and Water Yield within Ecological Red Line Areas. Remote Sens. 2020, 12, 399. [Google Scholar] [CrossRef] [Green Version]
  43. Guo, L.; Liu, R.; Men, C.; Wang, Q.; Miao, Y.; Shoaib, M.; Wang, Y.; Jiao, L.; Zhang, Y. Multiscale spatiotemporal characteristics of landscape patterns, hotspots, and influencing factors for soil erosion. Sci. Total Environ. 2021, 779, 146474. [Google Scholar] [CrossRef]
  44. Qiao, P.; Yang, S.; Lei, M.; Chen, T.; Dong, N. Quantitative analysis of the factors influencing spatial distribution of soil heavy metals based on geographical detector. Sci. Total Environ. 2019, 664, 392–413. [Google Scholar] [CrossRef]
  45. Qi, X.; Gao, B.; Pan, Y.; Yang, J.; Gao, Y. Influence factor analysis of heavy metal pollution in large-scale soil based on the geographical detector. J. Agro-Environ. Sci. 2019, 38, 2476–2486. [Google Scholar]
  46. Hao, J.; Ren, J.; Fang, H.; Tao, L. Identification sources and high-risk areas of sediment heavy metals in the Yellow River by geographical detector method. Water 2021, 13, 1103. [Google Scholar] [CrossRef]
  47. CERN. A dataset of topsoil organic carbon density for agricultural ecosystem field stations of Chinese Ecosystem Research Network (2005–2015) [DB/OL]. Sci. Data Bank 2019. [CrossRef]
  48. Li, B.; Tang, H.; Wu, L.; Li, Q.; Zhou, C. Relationships between the soil organic carbon density of surface soils and the influencing factors in differing land uses in Inner Mongolia. Environ. Earth Sci. 2012, 65, 195–202. [Google Scholar] [CrossRef]
  49. Nelson, D.W.; Sommers, L. A rapid and accurate procedure for estimation of organic carbon in soils. Proc. Indiana Acad. Sci. 1974, 84, 456–462. [Google Scholar]
  50. Schwartz, D.; Namri, M. Mapping the total organic carbon in the soils of the Congo. Glob. Planet. Chang. 2002, 33, 77–93. [Google Scholar] [CrossRef]
  51. Batjes, N.H. Total carbon and nitrogen in the soils of the world. Eur. J. Soil Sci. 1996, 47, 151–163. [Google Scholar] [CrossRef]
  52. Wang, J.; Li, X.; Christakos, G.; Liao, Y.; Zhang, T.; Gu, X.; Zheng, X. Geographical Detectors-Based Health Risk Assessment and its Application in the Neural Tube Defects Study of the Heshun Region, China. Int. J. Geogr. Inf. Sci. 2010, 24, 107–127. [Google Scholar] [CrossRef]
  53. Wang, J.F.; Zhang, T.L.; Fu, B.J. A measure of spatial stratified heterogeneity. Ecol. Indic. 2016, 67, 250–256. [Google Scholar] [CrossRef]
  54. Li, J.Q.; Li, Z.L.; Jiang, G.F.; Cheng, H.; Fang, C.M. A study on soil organic carbon in plough layer of China’s arable land. J. Fudan Univ. 2016, 55, 247–266. [Google Scholar] [CrossRef]
  55. Wang, J.; Hu, Y. Environmental health risk detection with GeogDetector. Environ. Model. Softw. 2012, 33, 114–115. [Google Scholar] [CrossRef]
  56. Wang, Z.M.; Song, K.S.; Zhang, B.; Liu, D.W.; Li, X.Y.; Ren, C.Y.; Zhang, S.M.; Luo, L.; Zhang, C.H. Spatial variability and affecting factors of soil nutrients in croplands of Northeast China: A case study in Dehui County. Plant Soil Environ. 2009, 55, 110–120. [Google Scholar] [CrossRef] [Green Version]
  57. Wang, Y.; Zhang, X.; Zhang, J.; Li, S. Spatial Variability of Soil Organic Carbon in a Watershed on the Loess Plateau. Pedosphere 2009, 19, 486–495. [Google Scholar] [CrossRef]
  58. Zhang, C.; Li, W.; Zhao, Z.; Zhou, Y.; Zhang, J.; Wu, Q. Spatiotemporal Variability and Related Factors of Soil Organic Carbon in Henan Province. Vadose Zone J. 2018, 17, 180109. [Google Scholar] [CrossRef] [Green Version]
  59. Jakšić, S.; Ninkov, J.; Milić, S.; Vasin, J.; Banjac, D.; Jakšić, D.; Živanov, M. The state of soil organic carbon in vineyards as affected by soil types and fertilization strategies (Tri Morave Region, Serbia). Agronomy 2021, 11, 9. [Google Scholar] [CrossRef]
  60. Wang, H.; Ren, T.; Mueller, K.; Van Zwieten, L.; Wang, H.; Feng, H.; Xu, C.; Yun, F.; Ji, X.; Yin, Q.; et al. Soil type regulates carbon and nitrogen stoichiometry and mineralization following biochar or nitrogen addition. Sci. Total Environ. 2021, 753, 141645. [Google Scholar] [CrossRef]
  61. Luo, M.; Guo, L.; Zhang, H.; Wang, S.; Liang, P. Characterization of spatial distribution of soil organic carbon in China based on environmental variables. Acta Pedol. Sin. 2020, 57, 48–59. [Google Scholar] [CrossRef]
  62. Xu, X.W.; Pan, G.X.; Wang, Y.L.; Cao, Z.H. Research of changing characteristics and control factors of farmland topsoil organic carbon in China. Geogr. Res. 2009, 28, 601–612. [Google Scholar]
  63. Zhao, D.; Dong, J.; Ji, S.; Huang, M.; Quan, Q.; Liu, J. Effects of Contemporary Land Use Types and Conversions from Wetland to Paddy Field or Dry Land on Soil Organic Carbon Fractions. Sustainability 2020, 12, 2094. [Google Scholar] [CrossRef] [Green Version]
  64. Li, Z.; Jin, Z.; Li, Q. Changes in land use and their effects on soil properties in Huixian Karst wetland system. Pol. J. Environ. Stud. 2017, 26, 699–707. [Google Scholar] [CrossRef]
  65. Sheng, M.; Han, X.; Long, J.; Li, N. Characterization of soil organic matter in different regions of China. Soils Crops 2019, 8, 320–330. [Google Scholar]
  66. Zhang, J.; Li, M.; Ao, Z.; Deng, M.; Yang, C.; Wu, Y. Estimation of soil organic carbon storage of terrestrial ecosystem in arid western China. J. Arid. Land Resour. Environ. 2018, 32, 132–137. [Google Scholar]
  67. Six, J.; Conant, R.T.; Paul, E.A.; Paustian, K. Stabilization mechanisms of soil organic matter: Implications for C-saturation of soils. Plant Soil 2002, 241, 155–176. [Google Scholar] [CrossRef]
  68. Razafimbelo, T.M.; Albrecht, A.; Oliver, R.; Chevallier, T.; Chapuis-Lardy, L.; Feller, C. Aggregate associated-C and physical protection in a tropical clayey soil under Malagasy conventional and no-tillage systems. Soil Tillage Res. 2008, 98, 140–149. [Google Scholar] [CrossRef]
  69. Meersmans, J.; Martin, M.P.; De Ridder, F.; Lacarce, E.; Wetterlind, J.; De Baets, S.; Le Bas, C.; Louis, B.P.; Orton, T.G.; Bispo, A.; et al. A novel soil organic C model using climate, soil type and management data at the national scale in France. Agron. Sustain. Dev. 2012, 32, 873–888. [Google Scholar] [CrossRef] [Green Version]
  70. Vos, C.; Don, A.; Hobley, E.U.; Prietz, R.; Heidkamp, A.; Freibauer, A. Factors controlling the variation in organic carbon stocks in agricultural soils of Germany. Eur. J. Soil Sci. 2019, 70, 550–564. [Google Scholar] [CrossRef]
  71. Alidoust, E.; Afyuni, M.; Hajabbasi, M.A.; Mosaddeghi, M.R. Soil carbon sequestration potential as affected by soil physical and climatic factors under different land uses in a semiarid region. Catena 2018, 171, 62–71. [Google Scholar] [CrossRef]
  72. Osland, M.J.; Gabler, C.A.; Grace, J.B.; Day, R.H.; McCoy, M.L.; McLeod, J.L.; From, A.S.; Enwright, N.M.; Feher, L.C.; Stagg, C.L.; et al. Climate and plant controls on soil organic matter in coastal wetlands. Glob. Chang. Biol. 2018, 24, 5361–5379. [Google Scholar] [CrossRef] [PubMed]
  73. Thomas, A.; Cosby, B.J.; Henrys, P.; Emmett, B. Patterns and trends of topsoil carbon in the UK: Complex interactions of land use change, climate and pollution. Sci. Total Environ. 2020, 729, 138330. [Google Scholar] [CrossRef] [PubMed]
  74. Guan, C.; Zhang, P.; Zhao, C.; Li, X. Effects of warming and rainfall pulses on soil respiration in a biological soil crust-dominated desert ecosystem. Geoderma 2021, 381, 114683. [Google Scholar] [CrossRef]
  75. Rey, A.; Carrascal, L.M.; Báez, C.G.-G.; Raimundo, J.; Oyonarte, C.; Pegoraro, E. Impact of climate and land degradation on soil carbon fluxes in dry semiarid grasslands in SE Spain. Plant Soil 2021, 461, 323–339. [Google Scholar] [CrossRef]
  76. Del Grosso, S.; Parton, W.; Stohlgren, T.; Zheng, D.; Bachelet, D.; Prince, S.; Hibbard, K.; Olson, R. Global potential net primary production predicted from vegetation class, precipitation, and temperature. Ecology 2008, 89, 2117–2126. [Google Scholar] [CrossRef]
  77. Follett, R.F.; Stewart, C.E.; Pruessner, E.G.; Kimble, J.M. Effects of climate change on soil carbon and nitrogen storage in the US Great Plains. J. Soil Water Conserv. 2012, 67, 331–342. [Google Scholar] [CrossRef] [Green Version]
  78. Chen, Q.; Niu, B.; Hu, Y.; Luo, T.; Zhang, G. Warming and increased precipitation indirectly affect the composition and turnover of labile-fraction soil organic matter by directly affecting vegetation and microorganisms. Sci. Total Environ. 2020, 714, 136787. [Google Scholar] [CrossRef]
  79. Brye, K.R.; McMullen, R.L.; Silveira, M.L.; Motschenbacher, J.M.D.; Smith, S.F.; Gbur, E.E.; Helton, M.L. Environmental controls on soil respiration across a southern US climate gradient: A meta-analysis. Geoderma Reg. 2016, 7, 110–119. [Google Scholar] [CrossRef]
  80. Dijkstra, F.A.; Morgan, J.A. Chapter 27—Elevated CO2 and Warming Effects on Soil Carbon Sequestration and Greenhouse Gas Exchange in Agroecosystems: A Review. In Managing Agricultural Greenhouse Gases; Liebig, M.A., Franzluebbers, A.J., Follett, R.F., Eds.; Academic Press: San Diego, CA, USA, 2012; pp. 467–486. [Google Scholar]
  81. Chen, Y.; Feng, J.; Yuan, X.; Zhu, B. Effects of warming on carbon and nitrogen cycling in alpine grassland ecosystems on the Tibetan Plateau: A meta-analysis. Geoderma 2020, 370, 114363. [Google Scholar] [CrossRef]
  82. Li, Z.; Wang, J.; Cao, H.; Li, S.; Yu, S. Effect of Gradients of Precipitation and Temperature and Fertilization on Light Fraction Organic Carbon and Nitrogen of Soils in Northeastern China. J. Soil Sci. 2009, 40, 1014–1017. [Google Scholar]
  83. Chen, S.; Huang, Y.; Zou, J.; Shi, Y.; Lu, Y.; Zhang, W.; Hu, Z. Interannual variability in soil respiration from terrestrial ecosystems in China and its response to climate change. Sci. China-Earth Sci. 2012, 55, 2091–2098. [Google Scholar] [CrossRef]
  84. Morais, V.A.; Ferreira, G.W.D.; de Mello, J.M.; Silva, C.A.; de Mello, C.R.; Araújo, E.J.G.; David, H.C.; da Silva, A.C.; Scolforo, J.R.S. Spatial distribution of soil carbon stocks in the Cerrado biome of Minas Gerais, Brazil. Catena 2020, 185. [Google Scholar] [CrossRef]
  85. Zhang, L.; Zhuang, Q.; Zhao, Q.; He, Y.; Yu, D.; Shi, X.; Xing, S. Uncertainty of organic carbon dynamics in Tai-Lake paddy soils of China depends on the scale of soil maps. Agric. Ecosyst. Environ. 2016, 222, 13–22. [Google Scholar] [CrossRef]
  86. Alvarez, R.; Lavado, R.S. Climate, organic matter and clay content relationships in the Pampa and Chaco soils, Argentina. Geoderma 1998, 83, 127–141. [Google Scholar] [CrossRef]
  87. Wang, D.-D.; Shi, X.-Z.; Wang, H.-J.; Weindorf, D.C.; Yu, D.-S.; Sun, W.-X.; Ren, H.-Y.; Zhao, Y.-C. Scale effect of climate on soil organic carbon in the Uplands of Northeast China. J. Soils Sediments 2010, 10, 1007–1017. [Google Scholar] [CrossRef]
  88. Wang, M.; Shi, X.; Yu, D.; Xu, S.; Tan, M.; Sun, W.; Zhao, Y. Regional Differences in the Effect of Climate and Soil Texture on Soil Organic Carbon. Pedosphere 2013, 23, 799–807. [Google Scholar] [CrossRef]
  89. Liu, S.; Sun, Y.; Dong, Y.; Zhao, H.; Dong, S.; Zhao, S.; Beazley, R. The spatio-temporal patterns of the topsoil organic carbon density and its influencing factors based on different estimation models in the grassland of Qinghai-Tibet Plateau. PLoS ONE 2019, 14, e0225952. [Google Scholar] [CrossRef] [Green Version]
  90. Zhao, W.; Zhang, R.; Cao, H.; Tan, W. Factor contribution to soil organic and inorganic carbon accumulation in the Loess Plateau: Structural equation modeling. Geoderma 2019, 352, 116–125. [Google Scholar] [CrossRef]
  91. Zhang, Y.J.; Guo, S.L.; Zhao, M.; Du, L.L.; Li, R.J.; Jiang, J.S.; Wang, R.; Li, N.N. Soil moisture influence on the interannual variation in temperature sensitivity of soil organic carbon mineralization in the Loess Plateau. Biogeosciences 2015, 12, 3655–3664. [Google Scholar] [CrossRef] [Green Version]
  92. Berhane, M.; Xu, M.; Liang, Z.; Shi, J.; Wei, G.; Tian, X. Effects of long-term straw return on soil organic carbon storage and sequestration rate in North China upland crops: A meta-analysis. Glob. Chang. Biol. 2020, 26, 2686–2701. [Google Scholar] [CrossRef]
  93. Bégué, A.; Arvor, D.; Bellon, B.; Betbeder, J.; De Abelleyra, D.; Ferraz, R.P.D.; Lebourgeois, V.; Lelong, C.; Simões, M.; Verón, S.R. Remote Sensing and Cropping Practices: A Review. Remote Sens. 2018, 10, 99. [Google Scholar] [CrossRef] [Green Version]
  94. Livsey, J.; Alavaisha, E.; Tumbo, M.; Lyon, S.W.; Canale, A.; Cecotti, M.; Lindborg, R.; Manzoni, S. Soil carbon, nitrogen and phosphorus contents along a gradient of agricultural intensity in the Kilombero Valley, Tanzania. Land 2020, 9, 121. [Google Scholar] [CrossRef] [Green Version]
  95. Zhang, Y.; Shengzhe, E.; Wang, Y.; Su, S.; Bai, L.; Wu, C.; Zeng, X. Long-term manure application enhances the stability of aggregates and aggregate-associated carbon by regulating soil physicochemical characteristics. Catena 2021, 203, 105342. [Google Scholar] [CrossRef]
  96. Zhao, Z.; Gao, S.; Lu, C.; Li, X.; Li, F.; Wang, T. Effects of different tillage and fertilization management practices on soil organic carbon and aggregates under the rice-wheat rotation system. Soil Tillage Res. 2021, 212, 105071. [Google Scholar] [CrossRef]
  97. Tian, K.; Zhao, Y.; Xu, X.; Hai, N.; Huang, B.; Deng, W. Effects of long-term fertilization and residue management on soil organic carbon changes in paddy soils of China: A meta-analysis. Agric. Ecosyst. Environ. 2015, 204, 40–50. [Google Scholar] [CrossRef]
  98. Joshi, S.K.; Bajpai, R.K.; Kumar, P.; Tiwari, A.; Bachkaiya, V.; Manna, M.C.; Sahu, A.; Bhattacharjya, S.; Rahman, M.M.; Wanjari, R.H.; et al. Soil organic carbon dynamics in a Chhattisgarh Vertisol after use of a rice-wheat system for 16 Years. Agron. J. 2017, 109, 2556–2569. [Google Scholar] [CrossRef]
  99. Sun, Y.; Huang, S.; Yu, X.; Zhang, W. Differences in fertilization impacts on organic carbon content and stability in a paddy and an upland soil in subtropical China. Plant Soil 2015, 397, 189–200. [Google Scholar] [CrossRef]
  100. Tian, K.; Zhao, Y.; Xu, X.; Huang, B.; Sun, W.; Shi, X.; Deng, W. A meta-analysis of field experiment data for characterizing the topsoil organic carbon changes under different fertilization treatments in uplands of China. Acta Ecol. Sin. 2014, 34, 3735–3743. [Google Scholar]
  101. Gillabel, J.; Denef, K.; Brenner, J.; Merckx, R.; Paustian, K. Carbon sequestration and soil aggregation in center-pivot irrigated and dryland cultivated farming systems. Soil Sci. Soc. Am. J. 2007, 71, 1020–1028. [Google Scholar] [CrossRef] [Green Version]
  102. Li, Z.; Tian, C.; Zhang, R.; Mohamed, I.; Liu, Y.; Zhang, G.; Pan, J.; Chen, F. Plastic mulching with drip irrigation increases soil carbon stocks of natrargid soils in arid areas of northwestern China. Catena 2015, 133, 179–185. [Google Scholar] [CrossRef]
  103. Li, X.; Liang, Z.; Li, Y.; Zhu, Y.; Tian, X.; Shi, J.; Wei, G. Short-term effects of combined organic amendments on soil organic carbon sequestration in a rain-fed winter wheat system. Agron. J. 2021, 113, 2150–2164. [Google Scholar] [CrossRef]
  104. Kan, Z.; Virk, A.L.; He, C.; Liu, Q.; Qi, J.; Dang, Y.P.; Zhao, X.; Zhang, H. Characteristics of carbon mineralization and accumulation under long-term conservation tillage. Catena 2020, 193, 104636. [Google Scholar] [CrossRef]
  105. Huang, Y.; Liang, C.; Duan, X.; Chen, H.; Li, D. Variation of microbial residue contribution to soil organic carbon sequestration following land use change in a subtropical karst region. Geoderma 2019, 353, 340–346. [Google Scholar] [CrossRef]
  106. Shirale, A.O.; Kharche, V.K.; Zadode, R.S.; Meena, B.P.; Rajendiran, S. Soil biological properties and carbon dynamics subsequent to organic amendments addition in sodic black soils. Arch. Agron. Soil Sci. 2017, 63, 2023–2034. [Google Scholar] [CrossRef]
  107. Song, X.; Wu, H.; Ju, B.; Liu, F.; Yang, F.; Li, D.; Zhao, Y.; Yang, J.; Zhang, G. Pedoclimatic zone-based three-dimensional soil organic carbon mapping in China. Geoderma 2020, 363, 114145. [Google Scholar] [CrossRef]
Figure 1. Study area and spatial locations of agricultural field stations.
Land 11 00208 g001
Figure 2. Boxplots of SOCD and SOCDSR (a) and their relationship (b). Note: SOCD and SOCDSR: soil organic carbon density and its sequestration rate.
Land 11 00208 g002
Figure 3. Effects of natural factors on SOCD and SOCDSR via the risk detector. Note: MAT: mean annual temperature; MAP: mean annual precipitation; SOCD and SOCDSR: soil organic carbon density and its sequestration rate. The same letters in the histogram represent insignificant differences.
Land 11 00208 g003
Figure 4. Effects of human activities on SOCD and SOCDSR via the risk detector. Note: SOCD and SOCDSR: soil organic carbon density and its sequestration rate. The same letters in the histogram represent insignificant differences.
Land 11 00208 g004
Figure 5. Interaction effect of soil type and MAT on SOCD (a) and interaction effect of groundwater depth and fertilization on SOCDSR (b). Note: SOCD and SOCDSR: soil organic carbon density and its sequestration rate.
Land 11 00208 g005
Table 1. Basic information and stratification methods of environmental factors.
FactorsRangeCutting ValueMethod
Groundwater depth0.57–84.48 m3, 8, 16Quantile
Clay content4–37%14, 30Quantile
Cropping duration9–29 a12, 19Quantile
Initial SOCD0.34–5.19 kg/m21.58, 2.59Quantile
Elevation3–3688 m200, 500Manual
MAT2 °C–18.2 °C6, 10, 15Manual
MAP39.3–1696 mm400, 800Manual
Note: MAT: mean annual temperature; MAP: mean annual precipitation.
Table 2. q values of natural factors and human activities for SOCD and SOCDSR.
Influencing Factorsq Value of SOCDq Value of SOCDSR
natural factorselevation0.117 0.007
groundwater depth0.312 ***0.182 **
soil type0.357 ***0.084
clay content 0.286 ***0.060
MAT0.403 ***0.164 *
MAP0.264 ***0.078
human activitiescropping duration0.290 **-
initial SOCD-0.077
cropping system0.102 0.080
irrigation0.049 0.019
fertilization 0.047 0.142 **
residual management 0.014 0.001
Note: MAT—mean annual temperature; MAP—mean annual precipitation; and SOCD and SOCDSR—soil organic carbon density and its sequestration rate. *—Correlation is significant at the 0.1 level; **—Correlation is significant at the 0.05 level; ***—Correlation is significant at the 0.01 level.
Table 3. Interaction effects of environmental variables on SOCD and SOCDSR.
Influencing FactorsSOCDSOCDSR
Interactionsq ValueTypesInteractionsq ValueTypes
natural factorsST∩MAT0.748 Bi-EST∩GD0.305Nonlinear-E
ST∩Elev0.725 Nonlinear-EST∩MAT0.287Nonlinear-E
ST∩Clay0.702 Nonlinear-EGD∩MAT0.274Nonlinear-E
natural and human factorsMAT∩CD0.630 Bi-EGD∩Fert0.424Nonlinear-E
MAT∩CS0.614 Nonlinear-EMAT∩Fert0.389Nonlinear-E
ST∩CD0.602Nonlinear-EMAT∩CS0.311Nonlinear-E
human activitiesCD∩CS0.451 Nonlinear-EFert∩CS0.374Nonlinear-E
CD∩Fert0.366 Nonlinear-EIS∩CS0.312Nonlinear-E
CD∩Irri0.358 Nonlinear-EFert∩IS 0.293Nonlinear-E
Note: ST—soil types; MAT—mean annual temperature; Elev—elevation; Clay—clay content; CD—cropping duration; CS—cropping system; Fert—fertilization; Irri—irrigation; IS—initial SOCD; GD—groundwater depth; Bi-E and Nonlinear-E—bi-enhancement and nonlinear-enhancement, respectively; and SOCD and SOCDSR—soil organic carbon density and its sequestration rate.
Publisher’s Note: MDPI stays neutral with regard to jurisdictional claims in published maps and institutional affiliations.

