Article

Coupling Coordination Analysis and Prediction of Landscape Ecological Risks and Ecosystem Services in the Min River Basin

1
State Key Laboratory for Subtropical Mountain Ecology of the Ministry of Science and Technology and Fujian Province, Fujian Normal University, Fuzhou 350007, China
2
College of Geographical Science, Fujian Normal University, Fuzhou 350007, China
3
College of Tourism, Fujian Normal University, Fuzhou 350117, China
4
The Higher Educational Key Laboratory for Smart Tourism of Fujian Province, Fuzhou 350007, China
5
Postdoctoral Research Station of Ecology, Fujian Normal University, Fuzhou 350007, China
*
Author to whom correspondence should be addressed.
Submission received: 23 December 2021 / Revised: 27 January 2022 / Accepted: 27 January 2022 / Published: 2 February 2022
(This article belongs to the Special Issue Feature Papers for Landscape Ecology Section)

Abstract

:
Watershed landscape ecological security and ecosystem service functions are the material basis and environmental guarantee for promoting socioeconomic development. Analyzing the spatiotemporal characteristics of landscape ecological risks (LERs) and ecosystem services (ESs) and exploring the coupling coordination relationship between the two are of great significance for promoting the construction of ecological civilization and achieving sustainable development in the watershed. With the Min River Basin as the study area, the landscape ecological risk assessment, Integrated Valuation of Ecosystem Services and Tradeoffs (InVEST), and Carnegie Ames–Stanford Approach (CASA) models were used to evaluate the LERs and ESs based on the shared socioeconomic pathways (SSPs), and the patch-generating land use simulation (PLUS) model was used to predict the land use distribution of the Min River Basin in 2030. On this basis, the coupling coordination degree model was used to explore the coupling coordination relationship between the LERs and ESs. The results show that, from 2000 to 2020, the LER of the Min River Basin gradually decreased, and the overall spatial distribution pattern was “high in the north and low in the south”. The ES of the Min River Basin initially decreased and then increased, showing a spatial distribution pattern of “low in the south and high in the north”. Among the SSPs in 2030, the LER is the largest under the SSP3 scenario and the smallest under the SSP4 scenario. The ES improvement is the most significant under the SSP1 scenario and the lowest under the SSP3 scenario. From 2000 to 2030, the coupling coordination degree of the Min River Basin first decreased and then increased, showing a spatial distribution pattern of “high in the south and low in the north”. Among the five SSPs, the coupling coordination degree was the highest under SSP1. The spatial distribution of urban area is the main driving factor affecting the coupling coordination relationship between the LER and ES, and the development of social and economy is the beginning of landscape pattern optimization.

1. Introduction

Watersheds have important economic, ecological, and cultural functions as complex systems with unique physical–geographical features and socioeconomic development [1]. The watershed ecosystem contains the necessary ecosystem service functions for social development, such as water services, soil conservation, and food supply [2]. However, at the same time, many studies have shown that watershed ecosystems often face natural vegetation reduction [3], soil erosion [4,5], landscape ecological destruction [6], and other landscape risks and ecological issues that urgently need scientific measures for comprehensive management. Ecological civilization represents the state of harmonious interaction between humans and nature and a new standard of human sustainable development. In China, promoting ecological progress is a central policy and is included in China’s 13th Five-Year Plan (2016–2020) [7]. The Min River Basin, as the home of the mother river of Fujian Province, China’s first national ecological civilization experiment zone, holds an important position in China’s experience in developing ecological civilization construction reforms and road exploration. However, with the socioeconomic development of the basin, extensive human activities have led to rapid landscape pattern changes. The rapid expansion of urban area and the occupation of cropland, forest, and grassland [8,9] significantly affected the structure and function of landscapes and ecosystems in the watershed [10], leading to increased fragmentation of landscapes [11,12], reduced ecosystem functions [13], and other issues, threatening the ecological security and sustainable development of the basin. Therefore, based on the perspective of the landscape pattern, evaluating the risks faced by the landscape pattern, the changes in ecosystem service functions, and the relationship between the two is of great significance for optimizing the spatial configuration of the country, promoting the coordinated development of the social economy and ecology, and promoting the construction of ecological civilization.
At present, the coupling response between landscape patterns and ecological processes has become point of concern in landscape ecology. From the research content perspective, some researchers have explored the correlation between habitat quality, ecosystem service value, and landscape patterns by analyzing their spatiotemporal changes [14,15]. For example, Yohannes, et al. evaluated the response of hydrological ecosystem services to landscape changes and showed that soil and water conservation interventions are key to improving ecosystem services [16]. Some researchers have also studied the response mechanism of the two based on the coupling coordination relationship between landscape patterns and ecosystem service functions [17,18]. However, existing studies that explored the relationship between landscape pattern features and ecosystem services have mostly focused on the state and changes in landscape and ecology in the past. There are insufficient studies on future predictions, and it is difficult to provide a scientific reference basis for territorial and spatial planning and local policy formulation. From the research method perspective, existing studies mostly use a single landscape index or simple weighting to characterize landscape characteristics and perform correlation analysis with ecosystem service functions [19]. For example, Mitchell, et al. explored the impact of land cover fragmentation on ecosystem services by linking between landscape fragmentation and ecosystem services [20]. From the perspective of single landscape features and ecological functions, there is a lack of comprehensive consideration of the coordinated relationship between regional ecological security and ecosystem service functions, resulting in a one-sided assessment that does not reflect the development status and characteristics of the landscape pattern and ecosystem in the region.
Based on the above problems, this research is based on the patch-generating land use simulation (PLUS) model and introduces shared socioeconomic pathways (SSPs) to provide methods and approaches for predicting the distribution of land use types in the study area under different scenarios. Among them, the PLUS model, as an improvement of the traditional CA model, achieves higher simulation accuracy and better results by including new land conversion rule mining strategies and multiple types of seed growth mechanisms [21]. SSPs provide a contextual framework for describing future social development models by considering urbanization, population, environment, technology, and other aspects [22]. The framework contains a total of five paths: sustainable scenario (SSP1), middle-of-the-road scenario (SSP2), regional rivalry scenario (SSP3), inequality scenario (SSP4), and fossil-fueled and development scenario (SSP5). The framework has been widely used in carbon emissions [23], water footprint or demand [24,25], urban expansion or heat-related risk [26,27], and many other fields.
This research with the Min River Basin as an example, combines the SSPs scenarios and the PLUS model to simulate the distribution of land use types in 2030. The landscape ecological risk assessment model was used to comprehensively reflect the possibility of risks caused by landscape patterns under natural or human disturbance [28]. The Integrated Valuation of Ecosystem Services and Tradeoffs (InVEST) and Carnegie Ames–Stanford Approach (CASA) models were used to evaluate regional ecosystem services. On this basis, the coupling coordination degree model was used to explore the coupling coordination relationship between landscape ecological risks (LERs) and ecosystem services (ESs). This research aims to: (1) explore the spatiotemporal dynamics of LERs and ESs in the Min River Basin and reveal the laws of their spatiotemporal changes; (2) predict the LERs and ESs and explore the differences among different scenarios; and (3) analyze the coupling coordination relationship between LERs and ESs. The fundamental purpose of this research is to fill the gap in the research on the relationship between LERs and ESs. It then provides a scientific decision-making basis for landscape pattern risk management and ecosystem function improvement of the basin, promoting the construction of ecological civilization and the harmonious development of humans and nature in the basin.

2. Materials and Methods
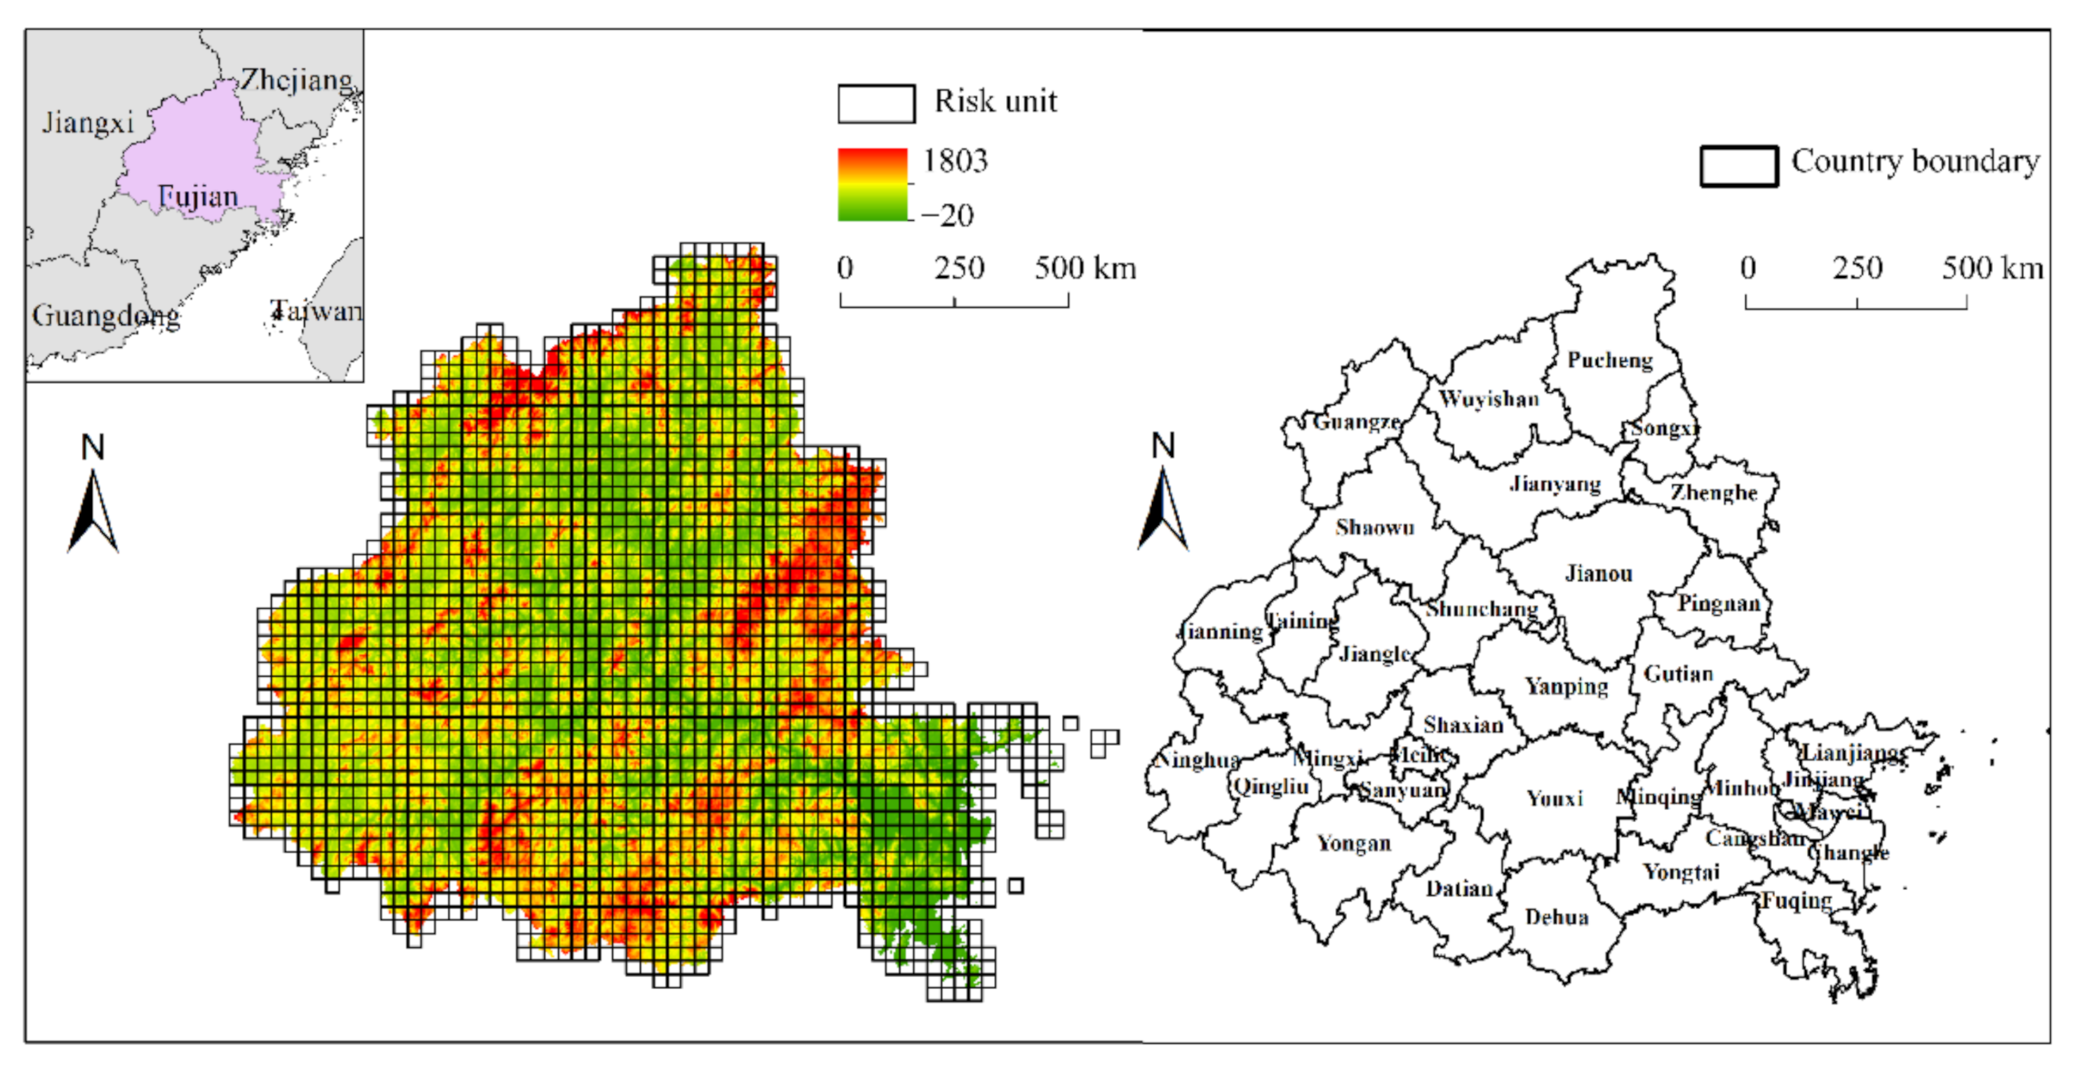
2.1. Study Area

The Min River is the largest river in Fujian Province. The Min River Basin is located at 116–120° E, 25–29° N, with a total length of 2959 km and the main stream length of 577 km. The total area of the basin is more than 60,000 km2, accounting for more than half of the land area of Fujian Province and is located in the hilly and mountainous regions of the south. It is an important part of the economic zone on the west side of the Straits and also an important ecological security barrier for China. In the past 20 years, human activities have intensified; urban and transportation infrastructure construction, mining, and other human activities have caused forest loss and biodiversity reduction, threatening the sustainable development of the ecology and economy of the Min River Basin [29]. Therefore, coordinating the economic development and ecological protection of the basin is of great significance for promoting sustainable development and ecological civilization construction in Fujian Province and the whole country. Combining previous analyses [30,31], the natural boundary of the watershed, and comprehensively considering the integrity of the study area, the final research scope is determined as follows: the upper reaches of the river including Jianning, Qingliu in Sanming, among other counties and cities; the middle reaches including Guangze and Wuyishan in Nanping, Pingnan, and Gutian in Ningde, among other counties and cities, and the lower reaches including Dehua in Quanzhou, Fuqing, and Yongtai in Fuzhou, among other counties and cities (Figure 1).

2.2. Data Source

For landscape ecological risk assessment, land use data were obtained from the land satellite remote sensing images by the Resource and Environmental Science Data Center of the Chinese Academy of Sciences. The remote sensing images are preprocessed by band extraction, false color synthesis, and geometric correction. According to the land resource classification system of the Chinese Academy of Sciences and the unified interpretation mark [32], the human–computer interactive land use/cover type judgment and interpretation is carried out on the ArcMap software platform. The accuracy exceeded 90% [33], which met the accuracy requirements of this research. Using ArcGIS 10.2, land use types were divided into six types: forest cover, grassland, cropland, urban area, water area, and barren land.
In the ecosystem services assessment, climate data such as annual average precipitation and temperature were obtained from the China Meteorological Data Network (http://data.cma.cn/ (accessed on 2 November 2021)), and the spatial distribution map of climate data in the study area was obtained through Kriging interpolation. Social and economic data were derived from statistical yearbooks of cities and counties in Fujian Province, and the spatial expression of data was realized through correlation with land use types. The soil attribute data were obtained from the World Soil Database (http://westdc.westgis.ac.cn/data/ (accessed on 2 November 2021)).
In the land use simulation, the SSPs data were obtained from the simulation results of Jiang et al. [34,35], which comprehensively consider the interprovincial flow of population, the second child policy, and other factors, providing a more reliable scenario framework for urban expansion and landscape pattern simulation (Appendix A, Table A1 and Table A2). The selection of driving factors and data sources for the PLUS model is shown in Appendix A, Table A3. The accessibility of highways and railways was calculated using the Euclidean distance. The slope and aspect were extracted using DEM data. All spatial data were resampled to the same resolution and projected onto a unified coordinate system.

2.3. Methodology

2.3.1. Land Use Simulation and Prediction Based on SSPs Scenarios

In this research, the SSPs scenario and PLUS model were combined to predict multiple scenarios of land use in the Min River Basin in 2030. The PLUS model mainly includes the following: (1) the land use expansion and driving factors of the two periods of land use increase were mined to obtain the development probability of various types based on the random forest algorithm using the land expansion analysis strategy and (2) the simulation of multiple land use types was realized under the constraint of development probability, combined with random seed generation and threshold decreasing mechanism. The model setting mainly includes the following three aspects: future land demand, neighborhood weight, and conversion cost matrix. The parameter setting is based on the existing literature [21].
For future land demand, the area of urban area as the dependent variable and population and GDP as independent variables, the multiple linear regression model was constructed using statistical data from 1990 to 2020 as:
A i = 2.4 × 10 2 × G i + 6 × 10 4 × P i
where Ai is the urban area in year i. Gi is GDP in year i, and Pi is the population in year i. The adjusted R2 of the multiple regression model was 0.98. Under the F-test, the p-value of the multiple regression model was 0.01. Under the t-test, the p-values of the two regression coefficients were 0.046 and 0.009, respectively. This indicates that the multiple regression model and regression coefficient are significant at the 1% and 5% levels, respectively. Therefore, based on the SSPs data, the multiple linear regression model was used to calculate the urban area of the study area under different scenarios in 2030 and combined with the historical change of each land type to determine the demand for other land types and obtain the demand for each land type under different SSPs scenarios.
In the neighborhood weight parameter setting, the neighborhood weight represents the expansion ability of various types of land use, with a value assigned from 0 to 1. The larger the value, the stronger is the expansion capability of the land type. Referring to previous results [36], the historical area changes of each land type to characterize the intensity of land expansion was used to calculate the neighborhood weight parameter. The neighborhood weights for each land use type are: 1.00 for urban area, 0.22 for forest, 0.13 for grassland, 0.00 for cropland, 0.35 for water area, and 0.34 for barren land.
In the conversion cost matrix, the cost matrix indicates whether the conversion of each land type in the PLUS model is allowed. If it can be converted, its value is 1; otherwise, it is 0. Considering the current actual development of the study area and the cost and possibility of conversion of urban area to other land, combined with the historical change of each land, the transfer situation, and the setting of SSPs scenarios, this research restricts the transfer of urban area to other land types, and the value is set to 0. Other land types can be converted to each other, and the value is set to 1.
In the model accuracy test, we first extracted the land use expansion based on the 2000 and 2010 land use data, combined the multiple linear regression model to calculate the land use demand in 2020, predicted the land use type map through the PLUS model, and compared it with the actual data. The Kappa and FoM coefficients were used to test the simulation accuracy of the PLUS model. The calculation formulas are as follows:
Kappa = (PaPb)/(PcPb)
FoM = B/(A + B + C + D)
where Pa represents the proportion of correct simulation; Pb represents the proportion of the expected simulation; Pc represents the ideal simulation value, which is generally set to 1; B represents the area that was predicted to and did actually change; A represents the area that did actually change but was not predicted to; C represents the area that was predicted to and did actually change but in which the direction of change was inconsistent; and D represents the area that did not actually change but was predicted to. The results show that the Kappa and FoM coefficients are 87.5% and 0.06, respectively, indicating that the simulation accuracy of this research is relatively high and can be used in the following multiscenario simulation.

2.3.2. Landscape Ecological Risk Assessment Model

This research uses the perspective of landscape pattern, combined with existing research [37,38], landscape disturbance (Si), and landscape vulnerability (Fi), to construct the landscape ecological risk assessment model. To achieve scientific and accurate spatial expression of LERs, this research followed the principle that the risk unit should reach 2–5 times the average patch area of the study area, dividing the study area into 6 km × 6 km using ArcGIS 10.2, with a total of 2027 risk units. The landscape ecological risk index (LERi) is assigned to the central point of the risk unit, and the spatial distribution of the LERs in the Min River Basin was obtained by Kriging interpolation. The natural breaks classification method was used to divide the LERs into five grades.
In reference to existing research [39,40], landscape fragmentation, landscape splitting degree, and landscape dominance were chosen to calculate the degree of landscape disturbance. The weights of the three landscape indexes were 0.5, 0.3, 0.2 [41,42]. Combining the actual situation of the study area and the characteristics of each landscape type, the following landscape vulnerabilities were assigned from high to low: barren land, 6; water area, 5; cropland, 4; grassland, 3; forest, 2; and urban area, 1. The dispersion normalization method was used to normalize the value of landscape vulnerability of each landscape type [43]. The specific calculation formula for each landscape index is presented in Appendix A, Table A4.

2.3.3. Assessment Methods for Ecosystem Services

In this research, the water production module and soil conservation module in the InVEST, CASA and food supply calculation model were used to calculate four sub-ESs: water yield, soil conservation, carbon sequestration, and food supply. We think that each sub-ESs is equally important to the study region. Therefore, the same weight (both 0.25) was given. After the dispersion normalization method, the weighted assessment results are added together to obtain the total ES, which was divided into five grades by the natural breaks classification method. The water yield module is based on the Budyko curve and annual average precipitation data. Land use/cover type, topography, soil, and other attributes were comprehensively considered to calculate the water yield capacity of various landscape types in the study area [44]. The soil conservation module calculates the soil water flow in the case of no vegetation and vegetation or soil conservation and calculates the soil conservation amount with the difference between the two values. At the same time, the ability of the plot to intercept sediment is considered to achieve a more accurate assessment [44]. For the evaluation of carbon sequestration, net primary production (NPP) was used to characterize the carbon sequestration capacity of the ecosystem [45]. Refer to the results of Hao et al. (2017) [46], which were combined with land use/cover data and the total food output value data in the statistical yearbook of the study area to obtain the spatial expression of various food supplies. The evaluation calculation methods are presented in Appendix A, Table A5.

2.3.4. Coupling Coordination Degree Model

To clarify the relationship between LERs and ESs in the Min River Basin in the past and in the future, the coupling coordination degree model was used to measure the interaction between them as follows [18,43]:
C = 2 × w × u w + u 2
T = α w + β u
D = C × T
where C is the degree of coupling, indicating the degree of interaction and influence between the two systems; w and u are the ES and LER levels in the study area, respectively; α and β are the weights of the two systems, respectively; and T is the comprehensive coordination index. As the prevention and control of LERs are equally important for the improvement of ESs, both weights are assigned a value of 0.5. D is the degree of coupling coordination, which is used to evaluate the development of the two systems. With reference to the classification standards of previous research and physics [18,47], the coupling coordination is divided into the following five levels: high-level coordination (0.8 < D ≤ 1), medium coordination (0.6 < D ≤ 0.8), and basic coordination (0.4 < D ≤ 0.6), medium imbalance (0.2 < D ≤ 0.4), and high imbalance (0 < D ≤ 0.2).

2.3.5. Data Normalization

In this research, the assessment results (such as landscape vulnerability, LERs, and ESs) had different dimensions and orders of magnitude. Therefore, we used the dispersion normalization method to normalize the data to the range of [0, 1] to exclude the influence. The calculation formula is:
X i j = x i j min ( x j ) max ( x j ) min ( x j )         Positive   indicator
X i j = min ( x j ) x i j max ( x j ) min ( x j )         Negative   indicator
where Xij is the normalization result; xij is the assessment result of indicator j in year i; max(xj) and min(xj) are maximum and minimum value of indicator j in the study period.

3. Results

3.1. Landscape Ecological Risk Spatiotemporal Change and Multiple-Scenario Prediction

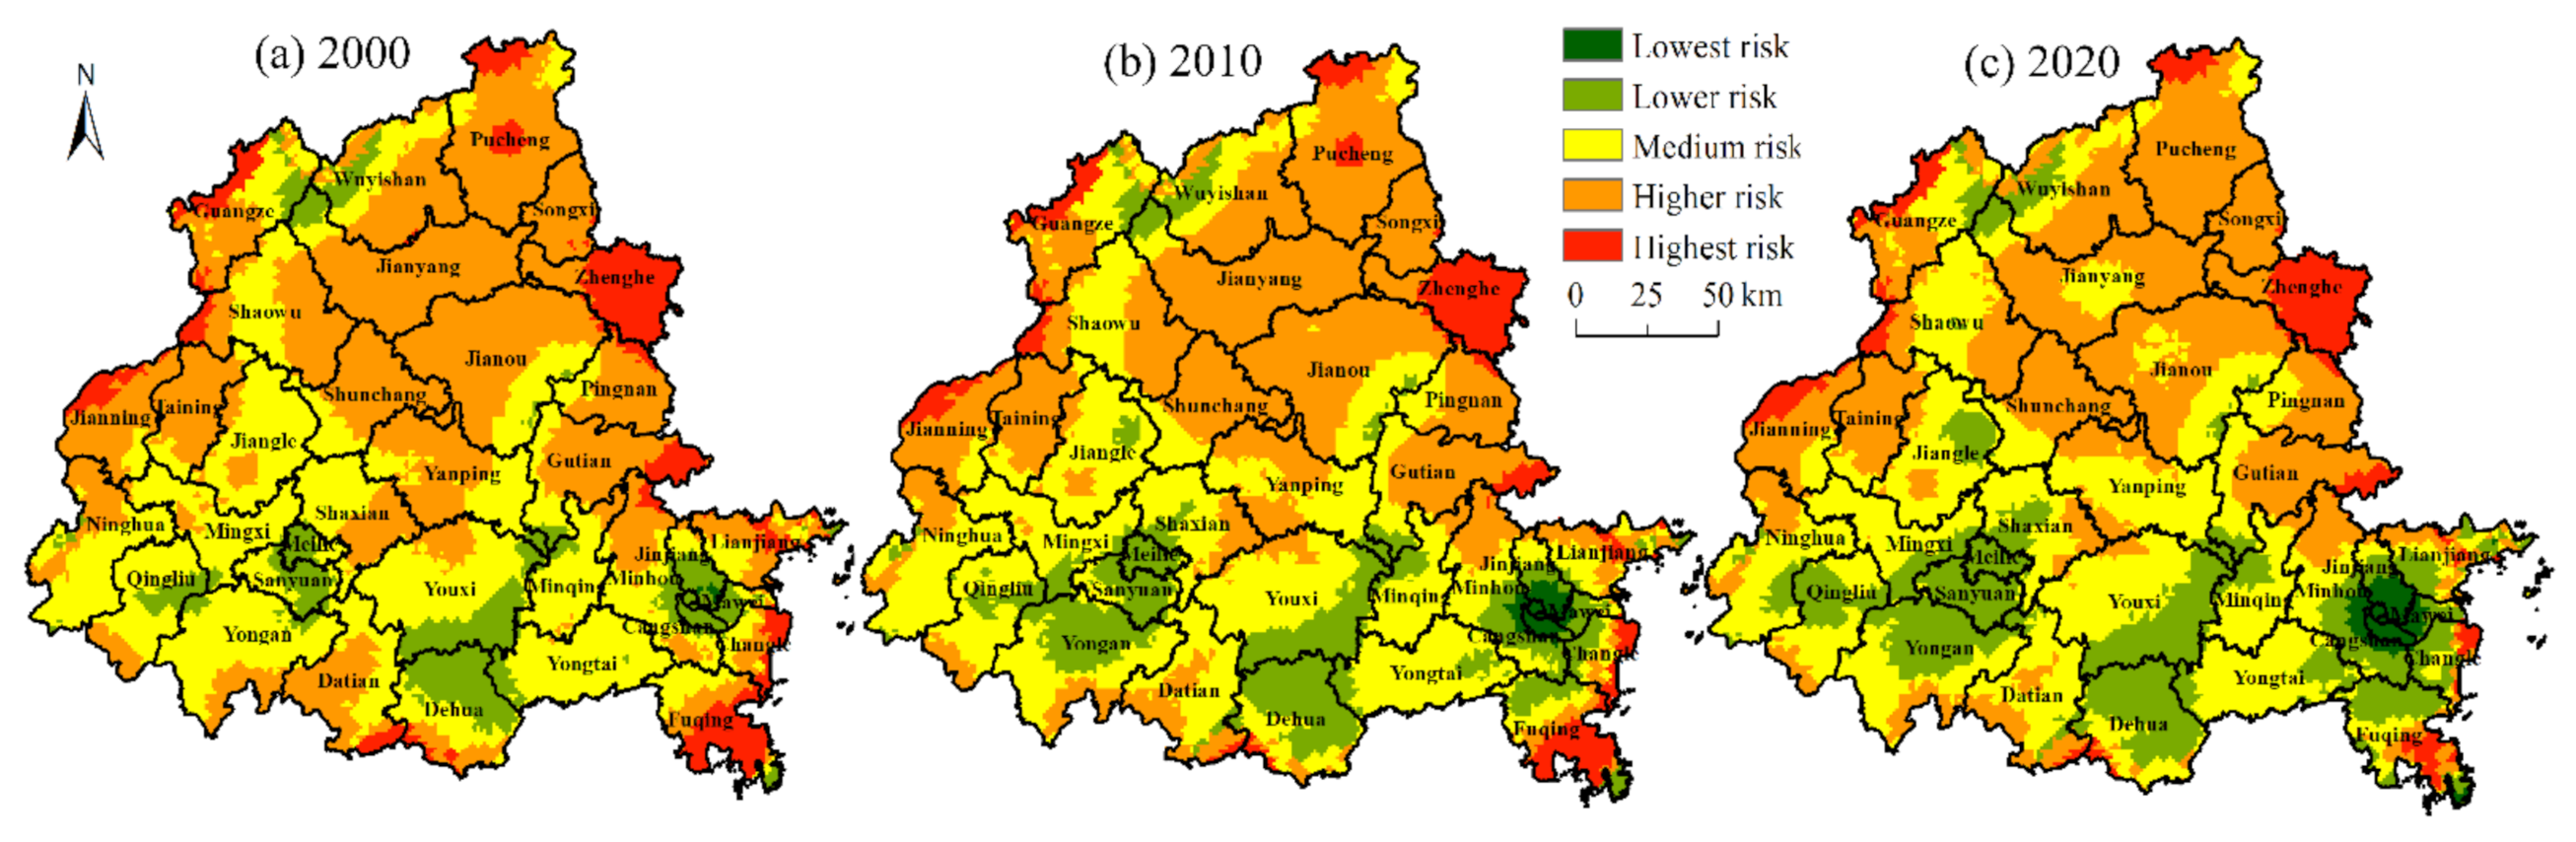
3.1.1. Landscape Ecological Risks Spatiotemporal Change

From 2000 to 2020, LERs in the Min River Basin gradually decreased, and the risks to the ecosystem reduced. Among them, the area under highest-risk areas decreased by 28.3%, and the area under lowest-risk areas increased 13.7 times. During the 20 years, the awareness of ecological protection in Min River Basin gradually increased, and the planning and utilization of ecological land became more reasonable, so the landscape ecological risk reduced. The spatial distribution of LERs generally presented a pattern of “high in the north and low in the south”, with medium-risk areas and higher-risk areas as the main types, which account for 74.7–83.8% of the total area of the study area (Figure 2). The distribution of the highest-risk and lower-risk areas was relatively scattered, and the phenomenon of high-level risk areas nesting in low-level risk areas is obvious. The highest-risk area was mainly located in the eastern part of Zhenghe. During the study period, the area was constructed to promote the regional economy and promote the development of the tourism industry. The construction of infrastructure such as transportation networks, scenic area reception, hotels, and entertainment venues fragmented the original landscape patterns. Land use types such as cropland, forest, and grassland were invaded, resulting in a high level of ecological risk. The lowest-risk areas were concentrated in Jin’an and its surroundings. The level of urbanization in this area was relatively high and the landscape type mainly urban area, with high landscape dominance and low vulnerability; therefore, the landscape ecological risk was low.

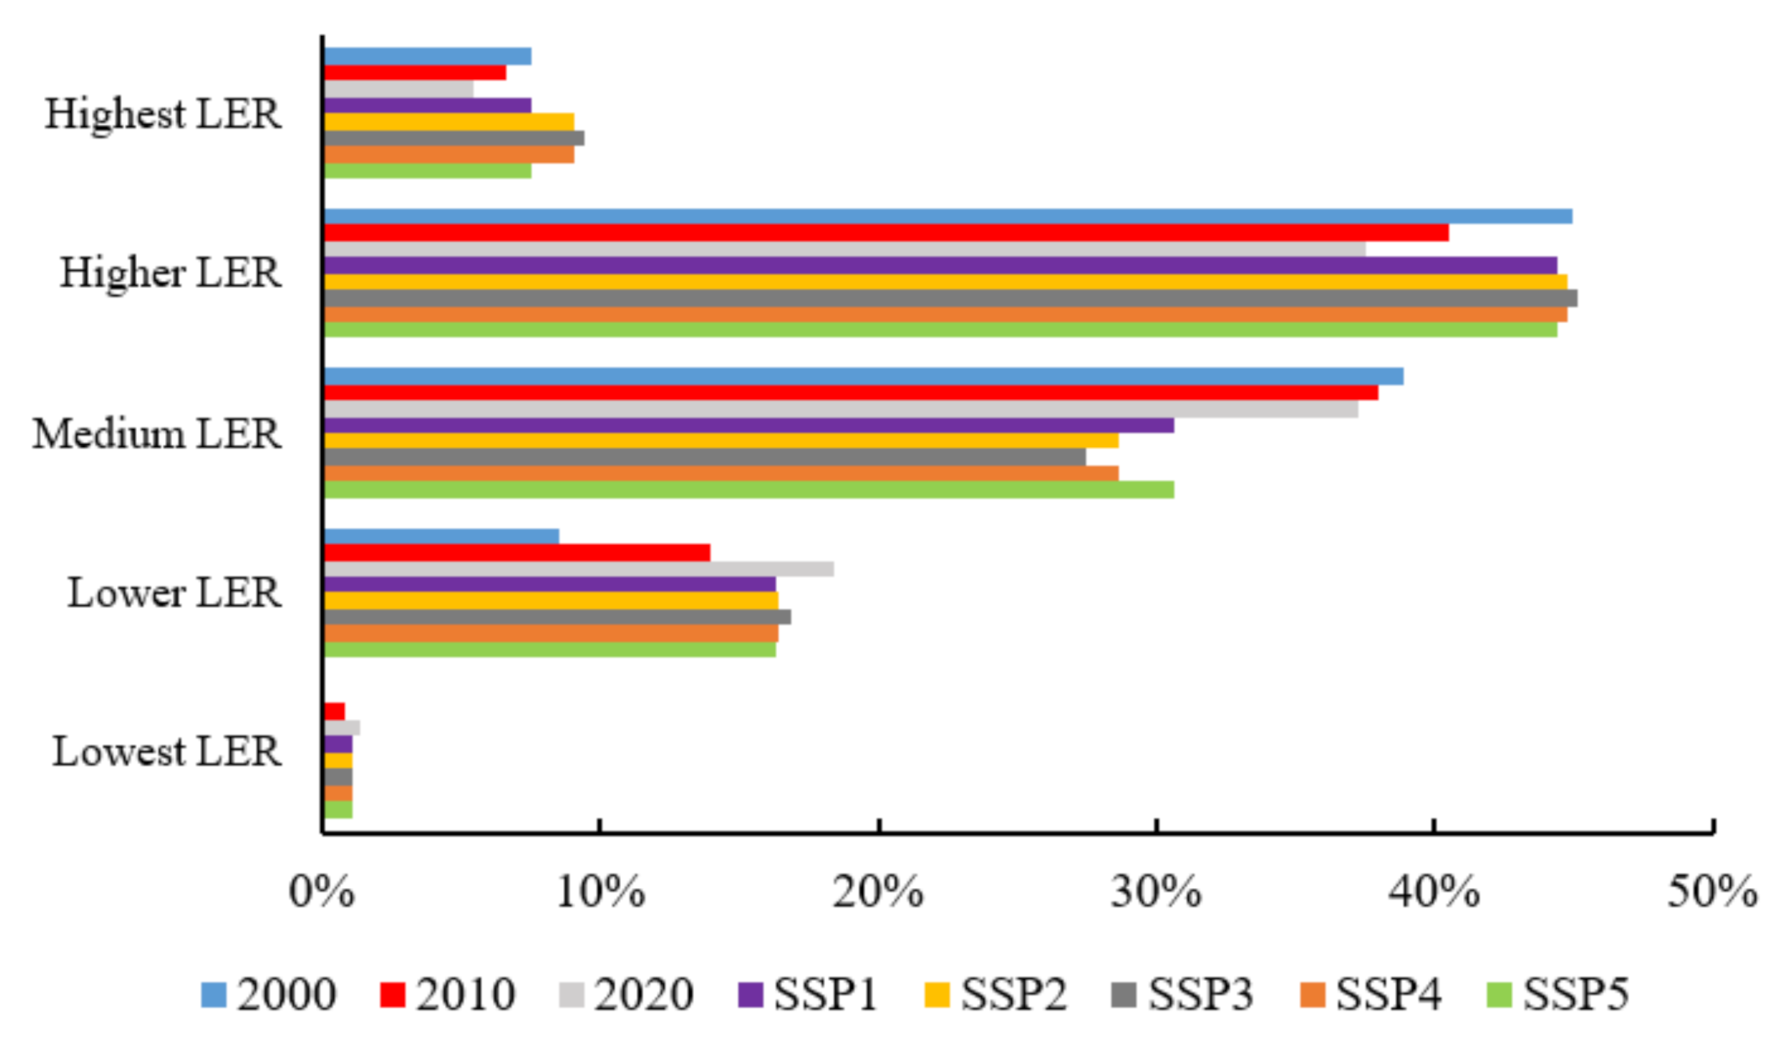
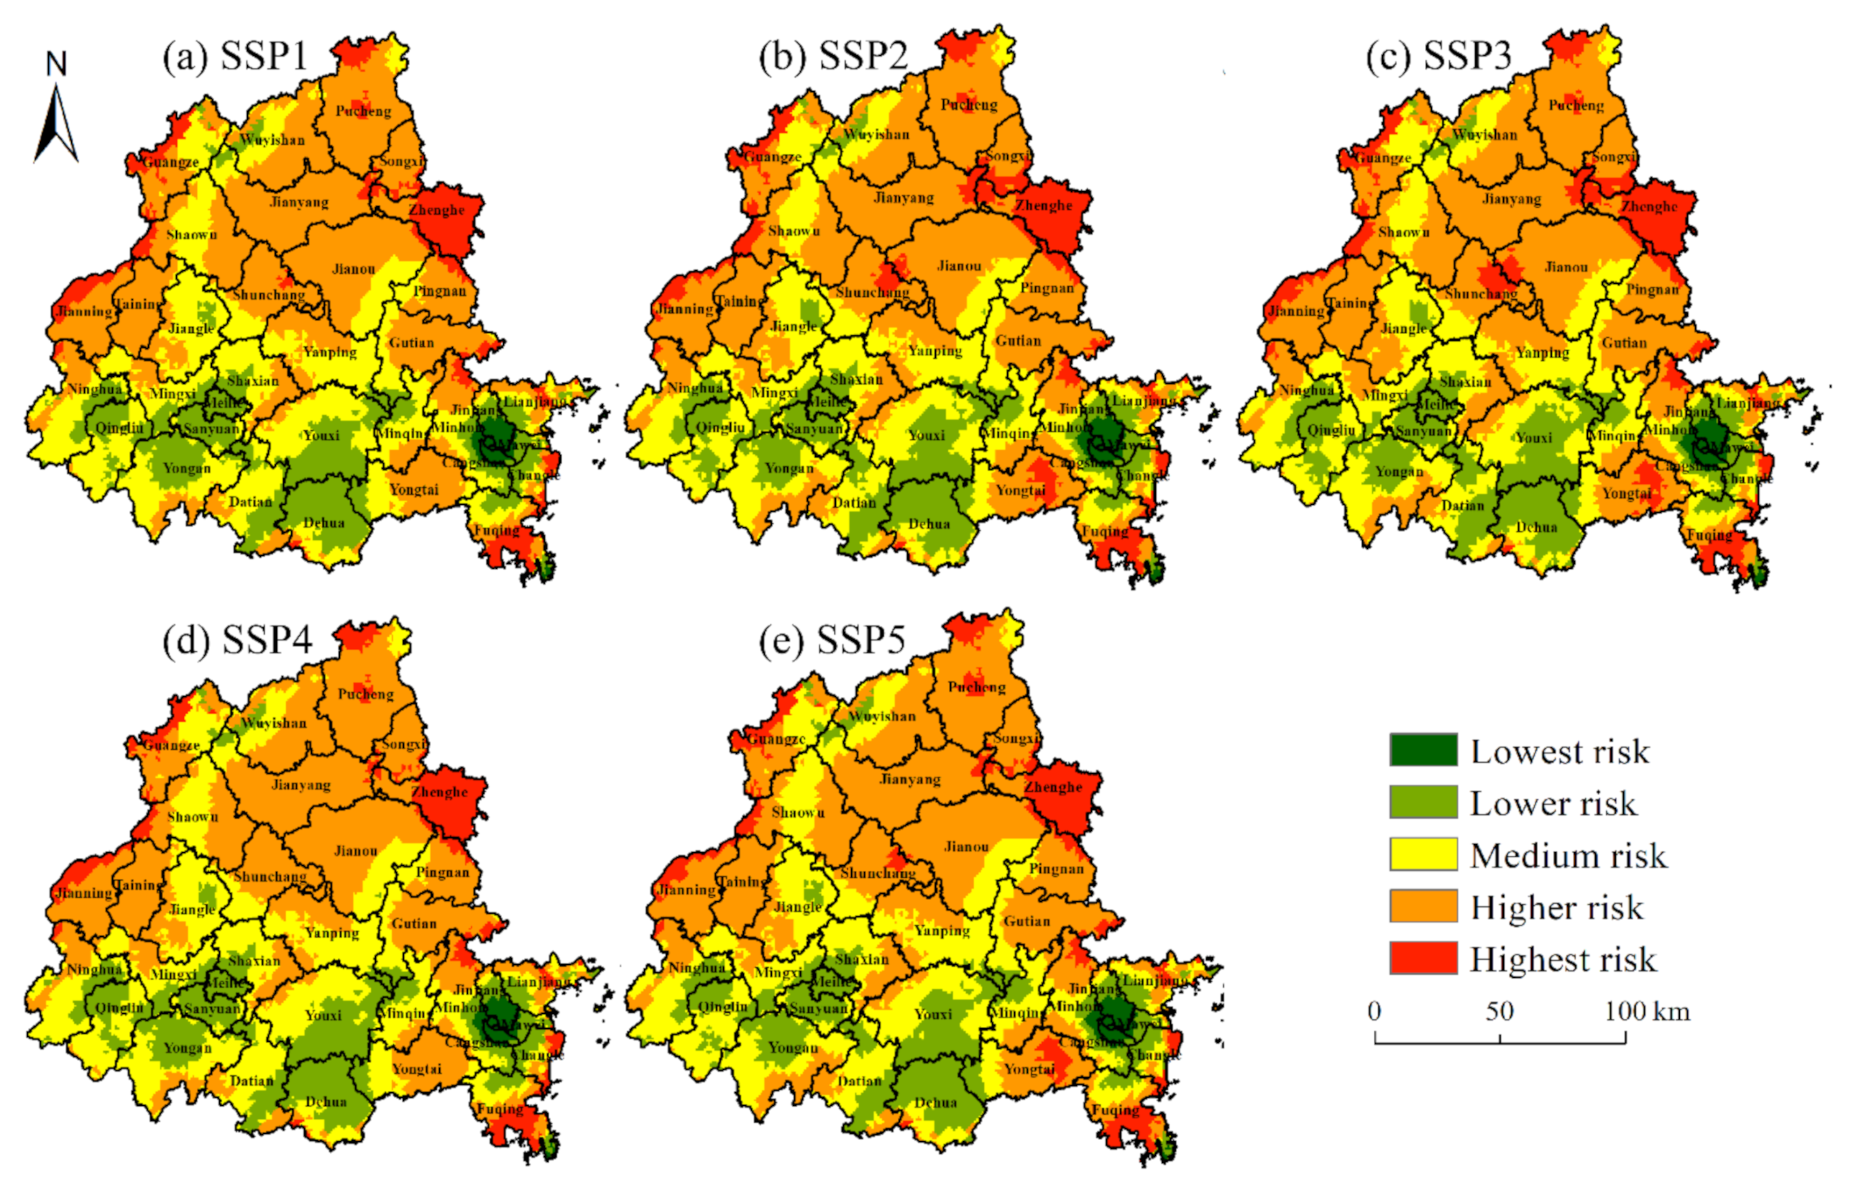
3.1.2. Landscape Ecological Risk Multiple-Scenario Prediction

This research was based on the land use data from 2010 and 2020 to extract the land expansion of each landscape type and used the PLUS model to predict the spatial distribution of each landscape type in 2030 under the SSPs scenarios. The landscape ecological risk index was calculated using a landscape ecological risk assessment model. The results show that the LERs under each SSPs scenario will increase to varying degrees from 2000 to 2030 (Figure 3). The transition from medium- and higher-risk areas to the highest- and higher-risk areas is more obvious, indicating that the potential risk may be intensified in the future. Under the SSP3 scenario, LERs are estimated as the greatest, and the areas under highest-risk and higher-risk areas increase significantly, by 38.9% and 101.7%, respectively, mainly including Jian’ou, Shunchang, Jianyang, and Yongtai (Figure 4). The main reason is that some regions (such as Jian’ou and Shunchang) are dominated by the agriculture and forestry industries. Under the SSP3 scenario, competition among regions is intensified, and communication and cooperation are reduced. Processing and production technology is ignored, the efficiency of intensive land use decreases, cropland occupation increases, and deforestation intensifies, leading to an increase in LERs at the junction of the two regions. In addition, some regions (such as Yongtai) have taken on the migration from the surrounding developed cities, resulting in a surge in urban area, invading the original land type, and causing increased LERs. Under the SSP4 scenario, there are differences in the protection of the ecological environment and awareness of ecological risk prevention and control. The better the area, the more attention is paid to the maintenance and improvement of the ecological environment. For example, Youxi was labeled as the national soil erosion control ecological civilization county, and the Fujian Province was considered the ecological county since 2012 according to the “Fujian Province Greenway network overall planning outline (2012–2020)”, to promote ecological landscape forest improvement projects. The LERs are, thus, the lowest for this county.

3.2. Ecosystem Services Spatiotemporal Change and Multiple-Scenario Prediction

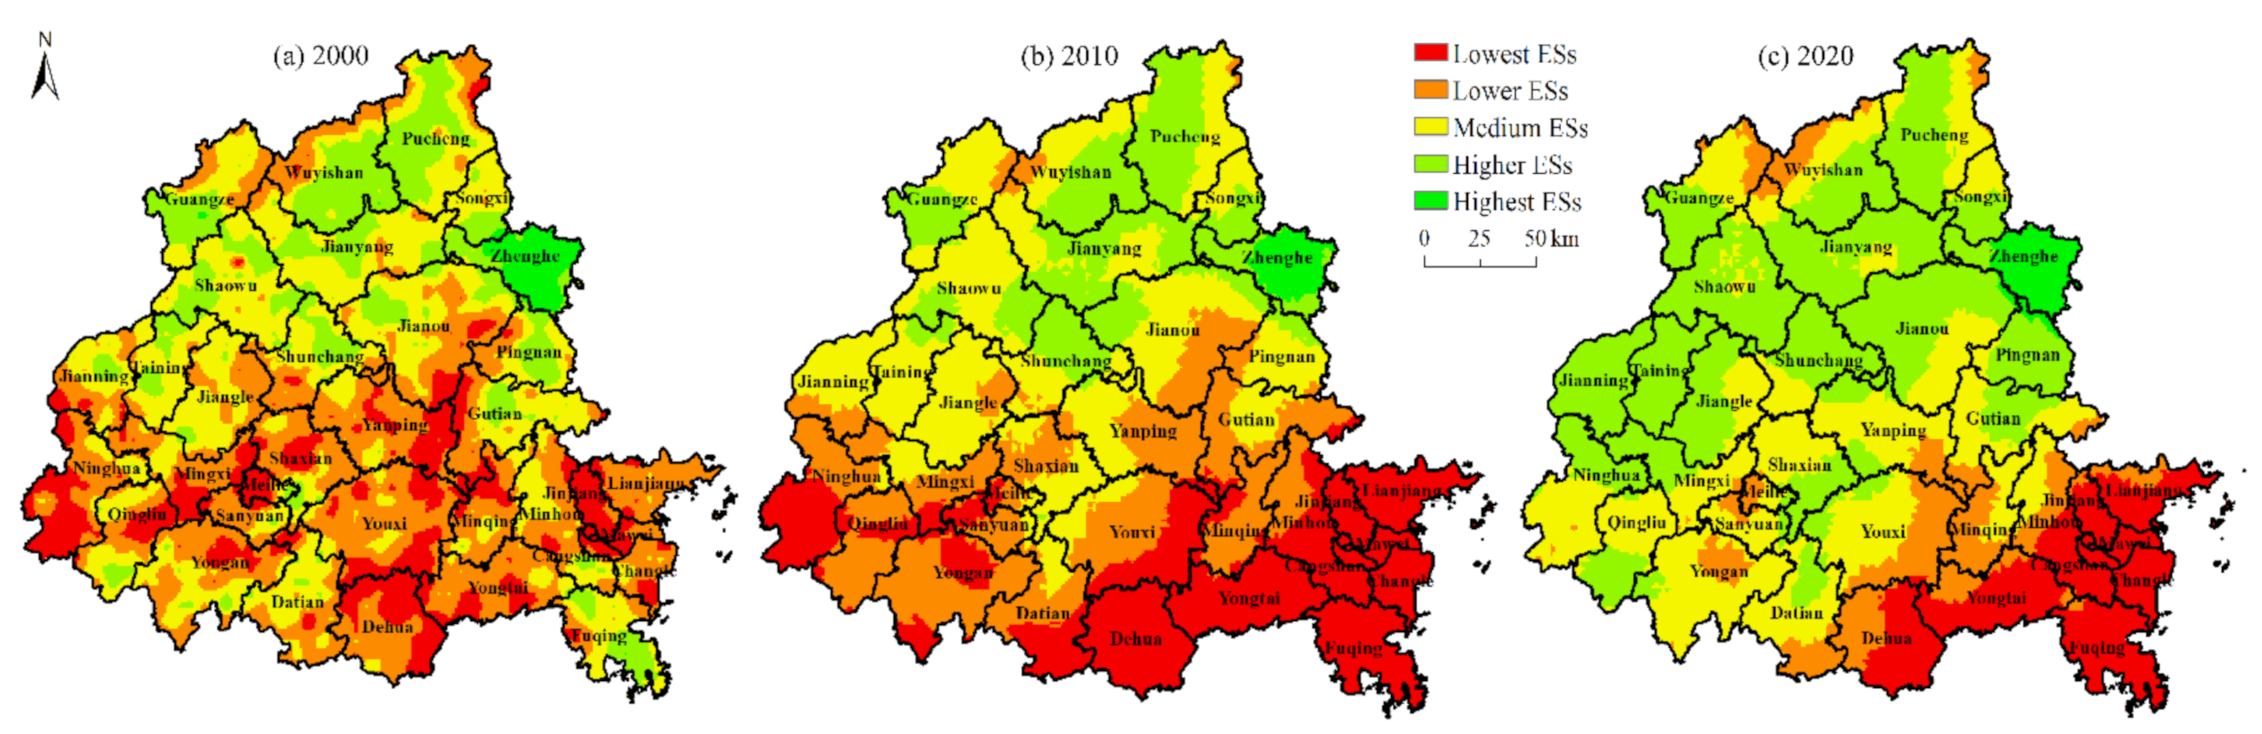
3.2.1. Ecosystem Services Spatiotemporal Change

From 2000 to 2020, the ESs of the Min River Basin first decreased and then increased, and the overall anti-interference ability of the ecosystem improved. Among them, the area of lowest-ESs area decreased by 10.1%, and the area under highest-ESs area increased by 17.1%. During the study period, the water and soil erosion was serious, and the unreasonable land use behaviors seriously reduced the ecological function. With the implementation of the pilot project of ecological protection and restoration of mountains, rivers, forests, fields, lakes, and grasses in the Min River Basin, the quality and capacity of the ecological environment improved, so the ecosystem services showed a trend of first decreased and then increased. The spatial distribution of ESs changed significantly, and the overall distribution pattern was “low in the south and high in the north (Figure 5)”. In 2000, the Min River Basin was dominated by the lowest- and lower-ESs areas, with scattered spatial distribution, and the two areas accounted for 49.4% of the study area. By 2020, the lowest- and lower-ESs areas, including Ninghua, Qingliu, and Yong’an, gathered in a plane and gradually decreased in area, mainly transforming from lowest- and lower-ESs areas to medium- and higher-ESs areas. In some regions (such as Ninghua), with the advancement of the process of creating “Fujian Forest County”, scientific and technological means were applied to ecological restoration and construction to improve the natural service function of the forest system. Therefore, the ES in this region increased. The spatial distribution of the lowest- and lower-ES areas gradually concentrated to the southeast of the study area, mainly including downtown Fuzhou, Changle, and Fuqing. As one of the economic zone centers on the west coast of the Straits, the rapid economic development and population agglomeration in this region have led to contradictions between the surging demand for urban area and the protection of ecological land, resulting in the encroachment of ecological land and the damage of ESs.

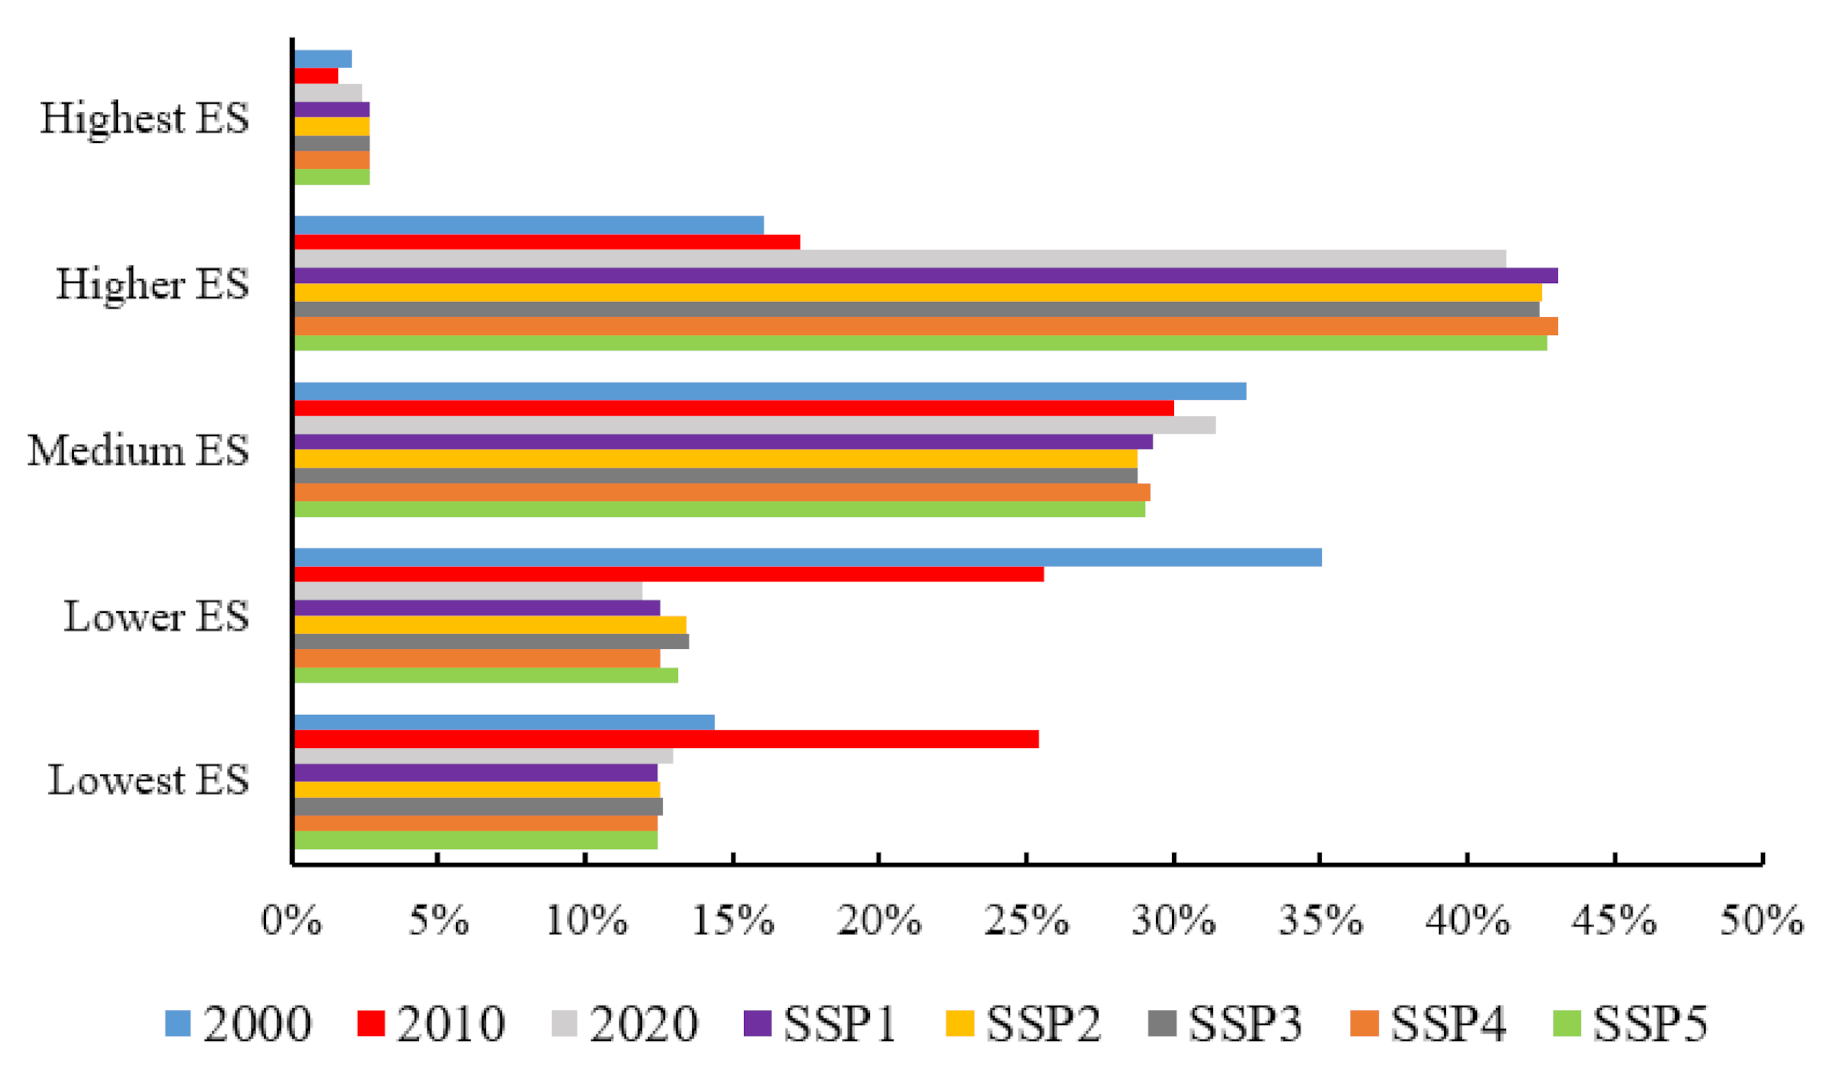
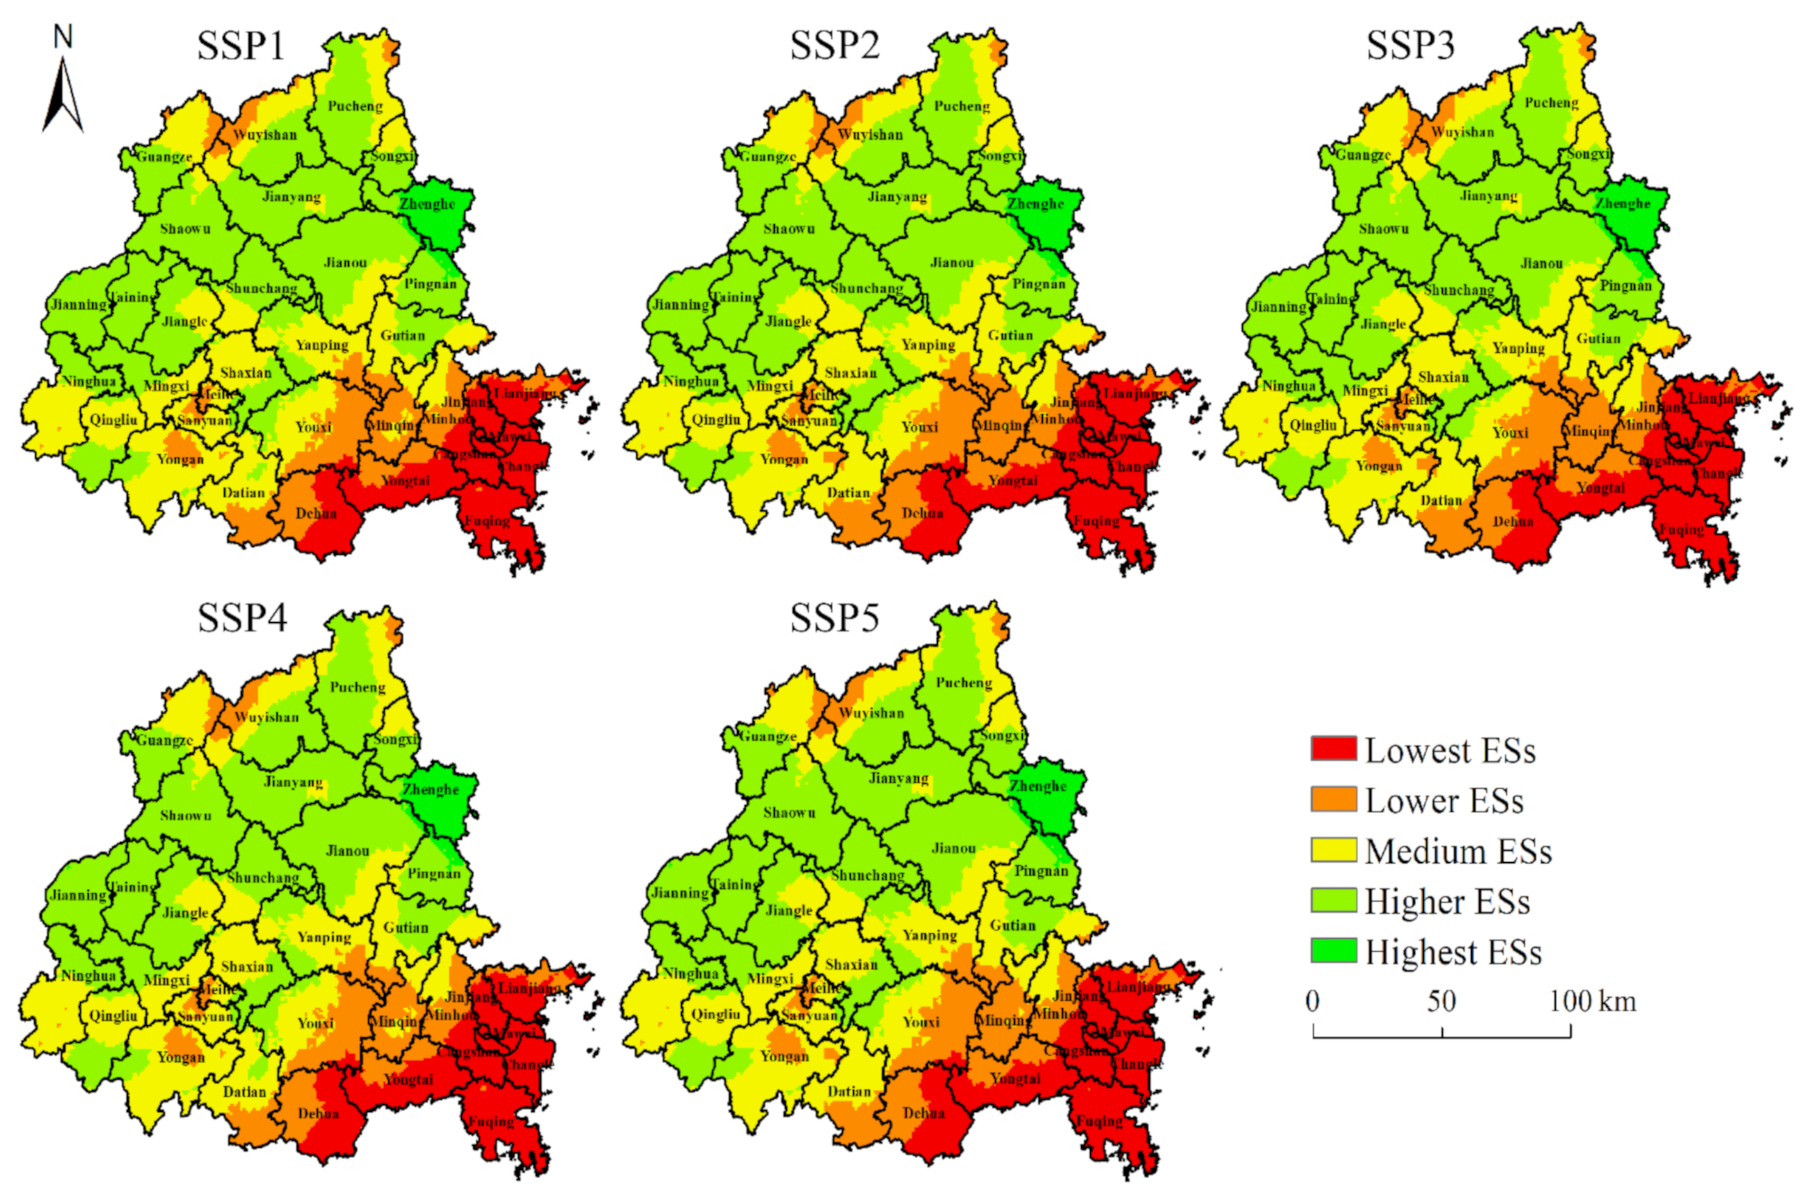
3.2.2. Ecosystem Services Multiple-Scenario Prediction

Based on the land use data obtained from the simulation, the InVEST and CASA models were used to evaluate the ESs under the five SSPs scenarios in the Min River Basin. The statistics and spatial distribution of the research results are shown in Figure 6 and Figure 7. The results show that ESs in Min River Basin will increase in different degrees under the five SSPs scenarios in 2030. Compared with the beginning of the study period, the higher-ESs areas increased and lower-ESs areas will be decreased significantly under the five SSPs scenarios, indicating that ecological functions will be improved with the enhancement of human ecological protection awareness and practical actions in the future. The spatial pattern will present little difference from that of 2020, showing a “high in the south and low in the north” pattern. The highest- and higher-ES areas were mainly concentrated in the south, while the lowest- and lower-ESs areas were concentrated in the southeast of the study area. In the SSP1 scenario, the improvement of ESs is the most significant, with the areas of highest- and higher-ES areas increasing by 4.2% and 11.5%, respectively. For example, in Shaowu, the second batch of national comprehensive trials of new urbanization, the local government followed the principles of sustainable development; improved the conservation and intensification of urban area; and protected cropland, forest, and grassland, resulting in enhanced ESs such as water conservation and food supply. The ESs of the Min River Basin were the lowest under the SSP3 scenario. For example, between 2020 and 2030, Yong’an and Datian would have transformed from higher- and medium-ES areas to medium- and lower-ESs areas, respectively. The main reason for this is that, under the situation of regional competition, the possibility of mining resources is intensified, and the natural broad-leafed forest is destroyed. In addition, the above regions are located in the Dayun Mountains, with serious mountain fragmentation and fragile ecosystems. Therefore, their ESs were the lowest in the five scenarios.

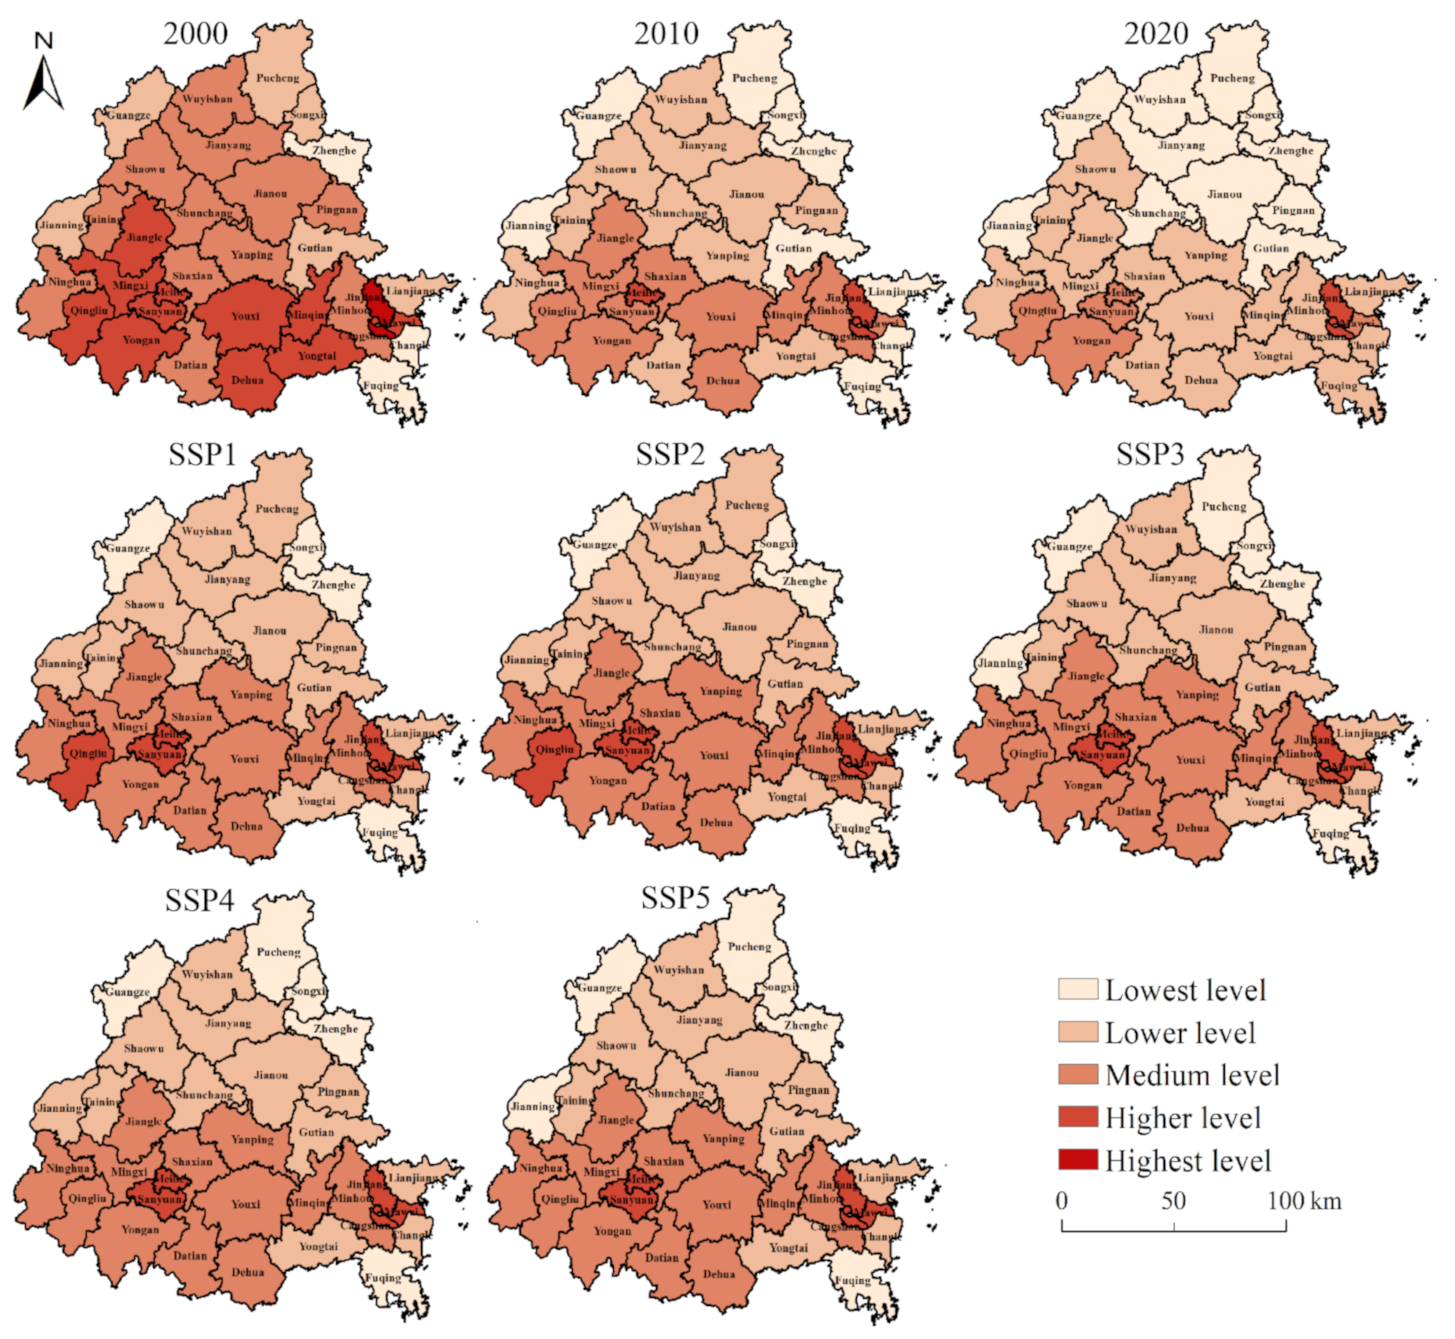
3.3. Coupling Coordination and Prediction of Landscape Ecological Risks and Ecosystem Services

On the temporal scale, the coupling coordination level of the Min River Basin gradually decreased from 0.77 to 0.639 during 2000–2020 (a decrease of 17%, Table 1). All counties and cities were of the medium-coordination type, and the overall coupling coordination level was low. The level of coupling correlation between ESs and LERs in each period was relatively high, but the coordination was poor, indicating that the two had a strong correlation but the degree of coordinated development was low. The Min River Basin as a whole was at a lower ES and higher LER levels. On the spatial scale, the coupling coordination level of the Min River Basin presented a spatial distribution pattern of “high in the south and low in the north”. The highest level areas were mainly concentrated in the southwest, and the lowest level areas were mainly concentrated in the northeast. During the study period, the highest- and higher-level areas shrank severely and generally decreased to the medium- and lower-level areas. Among them, the transformation from highest-level areas to higher-level areas mainly occurred in the southwest, such as Yong’an and Mingxi. The conversion from higher-level areas to lower-level areas mainly occurred in central areas such as Shunchang and Jian’ou.
On the temporal scale, the degree of coupling coordination under the SSPs scenarios of the Min River Basin increased from 2020 to 2030, and the five scenarios increased by 26.92%, 26.13%, 21.44%, 23%, and 16.28%, respectively (Table 1). The coupling coordination level of each scenario was in the order of “SSP1 > SSP2 > SSP4 > SSP3 > SSP5”. ES and LER levels had increased, but the increase in ESs was lower than that in LERs. In the five SSPs scenarios, LERs and ESs still had a high level of correlation, and the coupling correlation degree in each scenario was higher than 0.9. The comprehensive coordination index increased significantly compared with 2020, indicating that the coordinated development level of ES optimization and LER prevention and control in the Min River Basin will be improved in the future.
On the spatial scale, the areas with the highest and higher degree of coupling coordination were mainly concentrated in the south of the Min River Basin (Figure 8). The areas with the lowest and lower degree were mainly distributed in the north. From 2020 to 2030, the coupling coordination degree in the southern Min River Basin would mainly transform from the lower- and medium-level areas to the highest- and higher-level areas. The northern Min River Basin would mainly transform from lowest-level areas to lower-level areas. Under the SSP1 scenario, the coupling coordination between LER management and ES optimization in the Min River Basin was the best. Under the SSP1 scenario, the Min River Basin pays attention to sustainable development and implements measures such as restricting the spread of urban area, sacrificing part of the long-term economy and shifting the value to prioritize sustainable and green development. In this scenario, the Min River Basin has the highest ESs, the lowest LERs, and the best coordinated development between ESs and LERs so that the coupling coordination degree is the highest. In the SSP5 scenario, driven by the “development priority” strategy, the development and utilization of fossil fuels intensified, resource-intensive industrial bases continued to expand, and the exploitation of natural background resources such as mining areas and forests destroyed the original landscape types. This leads to serious fragmentation of the landscape in the region and reduced ESs. Therefore, it presents the lowest ESs, coordinated development level, and coupling coordination degree. To summarize, the correlation between LERs and ESs has always been at a high level, and promoting the coordinated development of the two is the key to reducing LERs and optimizing ESs.

4. Discussion

To provide a new understanding of the impact of landscape pattern changes on LER and ES, the spatiotemporal distribution changes of LERs and ESs in the Min River Basin were investigated. The research found that the low-value areas of LERs were mainly concentrated in the southeast of the study area. This area is a developed area in the Min River Basin, with urban area as the main landscape type, strong anti-interference, low vulnerability, and concentrated contiguity, which has a strong dominance degree and thus has a low LER, which is consistent with previous research results [48]. However, because of the concentrated and contiguous urban area, ecological land such as forest and grassland are less and more dispersed. Thus, ESs such as soil conservation and carbon sequestration are reduced [49,50]. On the one hand, the concentration and expansion of urban area reduces the regional LERs; but on the other hand, it also encroaches on other land types, resulting in the fragmentation of patches and the decline of ESs. Therefore, the spatial distribution of urban area is the main driving factor affecting the LER and ES changes in the Min River Basin.
LER promotes and restricts ES by reflecting the characteristics of landscape patterns, while ES changes LER through service functions, ecological carrying capacity, and policy interference. LER and ES are in mutually inclusive and mutually opposed competitive relationships [51]. In this research, we simulated the spatial distribution of the coupling coordination degree of the LERs and ESs of the Min River Basin in 2030. Consistent with previous research results, the advancement of the new urbanization process had a positive impact on LER management and ES optimization [52]. The advancement of the level of urbanization aroused people’s attention to ecological and environmental protection. After the Party Central Committee proposed building a beautiful China and coordinating ecosystem governance in the 19th National Congress of the Communist Party of China, the Min River Basin immediately formally implemented the pilot project for ecological protection and restoration of landscapes, forests, fields, lakes, and grasses. Although economic development led to the continued expansion of urban area, it also increased the efficiency of intensive land use, thus reducing the possibility of fragmentation of other land types [53]. The construction of grassland, parks, wetlands, and other green space systems in the city maintains the basic ESs to a certain extent [54]. Therefore, with the development of society and economy, reducing LERs does not conflict with enhancing ESs but aids the realization of landscape pattern optimization [55].
Reasonable development planning is essential for the prevention and control of future LER and improvement of ES [56]. In future land use planning, ecological environmental protection policies, and socioeconomic development strategy formulation, the principles of sustainable development should be followed. The spatial distribution between construction land and ecological land should be adjusted according to local conditions, limiting the disordered expansion of urban area and ensuring the integrity of ecological land and the supply of ESs [57]. This is of great significance for LER prevention control and ES improvement in the Min River Basin. At the same time, it provides an important theoretical basis for the promotion of sustainable development and construction of ecological civilization.
As the most significant manifestation of the current urbanization process, the expansion of urban area is also the most important driving factor for changing landscape patterns and ecological processes. Therefore, the prediction of future demand for urban area is particularly critical. This research focuses on the relationship between the urban area and major socioeconomic development factors, such as population and GDP. The multiple linear regression model and SSPs data were used to predict the areas of various types of land in the future. However, the change in urban area is controlled by many factors, and it is not just a simple linear relationship, which causes uncertainty in the prediction results. Moreover, for the evaluation and prediction results of this research, we failed to conduct fieldwork, which limits the precision of our study. In the future, research should combine system dynamics, fieldwork, and other methods to comprehensively consider the influencing factors of urban area changes, improve the accuracy and scientificity of land demand prediction, and carry out more accurate prediction simulation research on the coupling coordination relationship between landscape and ecology.

5. Conclusions

In this research, the Min River Basin was chosen as the study case, and land use changes of the study area under five scenarios in 2030 were predicted based on the SSPs scenario and PLUS model. The landscape ecological risk assessment, InVEST, CASA, and coupling coordination model were used to quantitatively evaluate the LERs, ESs, and their coupling coordination relationship from 2000 to 2030. The main conclusions are as follows:
(1)
From 2000 to 2020, the LERs in the Min River Basin gradually decreased, showing a spatial pattern of “high in the north and low in the south”. In 2030, the LERs in each SSPs scenario will increase to varying degrees. Under the SSP3 scenario, the LERs are the largest, while in the SSP4 scenario, the LERs are the smallest.
(2)
From 2000 to 2020, the ESs of the Min River Basin first decreased and then increased, showing a distribution pattern of “low in the south and high in the north”. Among the five scenarios in 2030, the improvement of ESs is the most significant under the SSP1 scenario and the lowest under the SSP3 scenario.
(3)
From 2000 to 2030, the coupling coordination degree of the Min River Basin first decreased and then increased, showing a “U”-shaped change. The overall coupling coordination degree was basically in the medium coordination degree, showing a spatial distribution pattern of “high in the south and low in the north”. Among the five SSPs, the coupling coordination level was the highest under SSP1.
This research used the coupling coordination degree model to quantitatively evaluate the coupling coordination relationship between LERs and ESs. Compared with previous studies, it can comprehensively reflect the development status and characteristics of landscape patterns and ecosystems in the region. Moreover, the simulation of different scenarios is realized based on the SSPs scenario and PLUS model, which solves the drawbacks that the existing research focuses on the past period, which leads to the limitation of the research results. The research results will provide a scientific basis for regional formulation of landscape pattern risk prevention and control and ecosystem service improvement policies, which will help promote the construction of an ecological civilization and achieve sustainable development.

Author Contributions

Conceptualization, Q.Z., D.C. and Y.L.; Data curation, S.Z.; Formal analysis, S.Z.; Funding acquisition, S.Z., Y.L. and B.L.; Methodology, C.X., Y.C. and Y.L.; Project administration, C.X., Y.C. and Y.L.; Resources, B.L.; Software, Q.Z.; Supervision, Y.L. and B.L.; Writing—original draft, S.Z.; Writing—review and editing, S.Z., Y.L. and B.L. All authors have read and agreed to the published version of the manuscript.

Funding

This research was funded by the National Natural Science Foundation of China (grant number 41901221 and 31971643), the Science and Technology Project of Fujian Provincial of Water Resources Department (grant number SC-290), and the Science and Technology Project of Fujian Forestry Bureau (grant number SC-259).

Data Availability Statement

Not applicable.

Conflicts of Interest

The authors declare no conflict of interest.

Appendix A

Table A1. The simulation results of the Chinese population SSPs data.
Population
(100 Million Persons)
20102015202020252030
SSP1 scenario13.32813.62013.82613.89813.889
SSP2 scenario13.32813.62013.97614.17214.235
SSP3 scenario13.32813.62014.11014.40214.526
SSP4 scenario13.32813.62013.80513.85713.792
SSP5 scenario13.32813.62013.82613.89813.889
Table A2. The simulation results of the Chinese GDP SSPs data.
GDP
(Trillion Yuan)
20102015202020252030
SSP1 scenario41.30363.41088.261117.201146.043
SSP2 scenario41.30363.32286.783114.197140.382
SSP3 scenario41.30363.61885.862110.490131.775
SSP4 scenario41.30365.13088.148116.361143.063
SSP5 scenario41.30361.95485.756113.806143.473
Table A3. The spatial driving factors of the land use change.
CategoryDataYearResolutionData Resource
Land useLand use data2000–202030 mCAS (https://www.resdc.cn/ (accessed on 2 November 2021))
Socioeconomic factorPopulation1000 m
GDP
Proximity to highway201530 mOpenStreetMap (https://www.openstreetmap.org/ (accessed on 6 November 2021))
Proximity to railway
Proximity to arterial road
Proximity to open water
Soil factorSoil PH20081000 mHWSD v 1.2
(http://westdc.westgis.ac.cn/data/ (accessed on 2 November 2021))
CAS (https://www.resdc.cn/ (accessed on 2 November 2021))
Soil type
Climate factorAnnual Mean Temperature2015
Annual Precipitation
Terrain factorElevation201630 mNASA SRTM1 v 3.0
Slope
Constraint areaNature ReserveOpenStreetMap (https://www.openstreetmap.org/ (accessed on 6 November 2021))
Military
Table A4. Landscape index calculation method.
Landscape IndexFormulaDescriptions
Landscape fragmentation index C i = n i / A i Landscape fragmentation index (Ci) reflects the fragmentation degree of various patches. ni is the patch number of type i. Ai is the total area of type i.
Landscape splitting index N i = A 2 A i × n i A Landscape splitting index (Ni) reflects the degree of separation of various patches. A is the total area of landscape.
Landscape dominance index D i = ( Q i + M i ) 4 + L i 2 Landscape dominance index (Di) represents the importance of various patches. Qi is the ratio of quadrat number to total quadrat number of type i. Mi is the ratio of type i to the total number of patches. Li is the ratio of type i area to total area.
Landscape disturbance index S i = a C i + b N i + c D i Landscape disturbance index (Si) represents the degree of external disturbance suffered by different landscape types. a, b, and c are the weights of the above three landscape indexes, and a + b + c = 1.
Landscape ecological risk index L E R i = i N ( S i × A i A ) × F i Landscape ecological risk index (LERi) reflects the degree of ecological risk to landscape pattern under external disturbance and resistance conditions.
Table A5. Ecosystem services assessment.
Ecosystem Service TypesModelFormula and Description
Water yieldWater yield module in
InVEST
Y ( x ) = ( 1 A E T ( x ) P ( x ) ) × P ( x )
Y(x) represents the water yield of grid x. P(x) represents the annual precipitation of grid x. AETx represents the average evapotranspiration of grid x.
Soil conservationSoil conservation module in InVEST S E D R E T x = R K L S x U S L E x R K L S x = R x × K x × L S x U S L E x = R x × K x × L S x × C x × P x
SEDRETx represents the soil conservation amount of grid x. RKLSx represents the actual soil erosion of grid x. USLE represents sediment retention intercepted by grid x. Rx is rainfall erosivity of grid x. Kx is soil erodibility of grid x. LSx is slope length gradient factor. Cx is the vegetation coverage factor of grid x. Px is the grid x management factor.
Carbon sequestrationCASA model N P P ( x , t ) = A P A R × ε ( x , t )
NPP(x,t) is the net primary productivity of grid x in month t. APAR(x,t) is the photosynthetically active radiation absorbed by grid x in month t. ε(x,t) is the actual light energy utilization ratio of grid x in month t.
Food supplyFood supply calculation model G i = A i × N i , N i = F i / S i
Gi is the total output value of food i. Ai is the area of food i. Ni is the output value per unit area of food i. Fi is the total output value of food. Si is the total area of land use type.

References

  1. Bai, Y.; Jiang, B.; Alatalo, J.M.; Zhuang, C.; Wang, X.; Cui, L.; Xu, W. Impacts of land management on ecosystem service delivery in the Baiyangdian river basin. Environ. Earth Sci. 2016, 75, 258. [Google Scholar] [CrossRef]
  2. Costanza, R.; d’Arge, R.; de Groot, R.; Farber, S.; Grasso, M.; Hannon, B.; Limburg, K.; Naeem, S.; O’Neill, R.V.; Paruelo, J.; et al. The value of the world’s ecosystem services and natural capital. Nat. Int. Wkly. J. Sci. 1997, 387, 253–260. [Google Scholar] [CrossRef]
  3. Fernandes, L.F.S.; Fernandes, A.C.P.; Ferreira, A.R.L.; Cortes, R.M.V.; Pacheco, F.A.L. A partial least squares—Path modeling analysis for the understanding of biodiversity loss in rural and urban watersheds in Portugal. Sci. Total Environ. 2018, 626, 962–970. [Google Scholar] [CrossRef]
  4. Pasquale, B.; Michael, M.; Brigitta, S. Modelling post-tree-harvesting soil erosion and sediment deposition potential in the Turano River Basin (Italian Central Apennine). Land Degrad. Dev. 2015, 26, 356–366. [Google Scholar]
  5. Mehri, A.; Salmanmahiny, A.; Tabrizi, A.R.M.; Mirkarimi, S.H.; Sadoddin, A. Investigation of likely effects of land use planning on reduction of soil erosion rate in river basins: Case study of the Gharesoo River Basin. Catena 2018, 167, 116–129. [Google Scholar] [CrossRef]
  6. Erskine, P.D.; Fletcher, A.T. Novel ecosystems created by coal mines in central Queensland’s Bowen Basin. Ecol. Processes 2013, 2, 33. [Google Scholar] [CrossRef] [Green Version]
  7. Frazier, A.E.; Bryan, B.A.; Buyantuev, A.; Chen, L.; Echeverria, C.; Jia, P.; Liu, L.; Li, Q.; Ouyang, Z.; Wu, J. Ecological civilization: Perspectives from landscape ecology and landscape sustainability science. Landsc. Ecol. 2019, 34, 1–8. [Google Scholar] [CrossRef]
  8. Hou, L.; Wu, F.; Xie, X. The spatial characteristics and relationships between landscape pattern and ecosystem service value along an urban-rural gradient in Xi’an city, China. Ecol. Indic. 2020, 108, 105720–105721. [Google Scholar] [CrossRef]
  9. Rahmonov, O.; Abramowicz, A.; Pukowiec-Kurda, K.; Fagiewicz, K. The link between a high-mountain community and ecosystem services of juniper forests in Fann Mountains (Tajikistan). Ecosyst. Serv. 2021, 48, 101255. [Google Scholar] [CrossRef]
  10. Santos-Martín, F.; Zorrilla-Miras, P.; Palomo, I.; Montes, C.; Benayas, J.; Maes, J. Protecting nature is necessary but not sufficient for conserving ecosystem services: A comprehensive assessment along a gradient of land-use intensity in Spain. Ecosyst. Serv. 2019, 35, 43–51. [Google Scholar] [CrossRef]
  11. Dadashpoor, H.; Azizi, P.; Moghadasi, M. Land use change, urbanization, and change in landscape pattern in a metropolitan area. Sci. Total Environ. 2019, 655, 707–719. [Google Scholar] [CrossRef] [PubMed]
  12. Byun, E.; Sato, H.; Cowling, S.A. Extensive wetland development in mid-latitude North America during the Bølling-Allerød. Nat. Geosci. 2020, 14, 30–35. [Google Scholar] [CrossRef]
  13. Adnan, M.; Abdullah, A.; Dewan, A.; Hall, J.W. The effects of changing land use and flood hazard on poverty in coastal Bangladesh. Land Use Policy 2020, 99, 104868. [Google Scholar] [CrossRef]
  14. Chen, W.; Zeng, J.; Chu, Y.; Liang, J. Impacts of landscape patterns on ecosystem services value: A multiscale buffer gradient analysis approach. Remote Sens. 2021, 13, 2551. [Google Scholar] [CrossRef]
  15. Worie, A.W.; Getnet, E.B.; Ayalew, W. The impacts of land-use and land-cover change on wetland ecosystem service values in peri-urban and urban area of Bahir Dar City, Upper Blue Nile Basin, Northwestern Ethiopia. Ecol. Processes 2021, 10, 39. [Google Scholar]
  16. Yohannes, H.; Soromessa, T.; Argaw, M.; Dewan, A. Impact of landscape pattern changes on hydrological ecosystem services in the Beressa watershed of the Blue Nile Basin in Ethiopia. Sci. Total Environ. 2021, 793, 148559. [Google Scholar] [CrossRef] [PubMed]
  17. Li, H.; Niu, X.; Wang, B.; Zhao, Z. Coupled coordination of ecosystem services and landscape patterns: Take the Grain for Green Project in the Wuling Mountain Area as an example. Acta Ecol. Sin. 2020, 40, 4316–4326. [Google Scholar]
  18. Hu, Z.; Yang, X.; Yang, J.; Yuan, J.; Zhang, Z. Linking landscape pattern, ecosystem service value, and human well-being in Xishuangbanna, southwest China: Insights from a coupling coordination model. Glob. Ecol. Conserv. 2021, 27, e1583. [Google Scholar] [CrossRef]
  19. Zhang, J.; Qu, M.; Wang, C.; Zhao, J.; Cao, Y. Quantifying landscape pattern and ecosystem service value changes: A case study at the county level in the Chinese Loess Plateau. Glob. Ecol. Conserv. 2020, 23, e1110. [Google Scholar] [CrossRef]
  20. Mitchell, M.G.E.; Suarez-Castro, A.F.; Martinez-Harms, M.; Maron, M.; McAlpine, C.; Gaston, K.J.; Johansen, K.; Rhodes, J.R. Reframing landscape fragmentation’s effects on ecosystem services. Trends Ecol. Evol. 2015, 30, 190–198. [Google Scholar] [CrossRef] [PubMed] [Green Version]
  21. Liang, X.; Guan, Q.; Keith, C.C.; Liu, S.; Wang, B.; Yao, Y. Understanding the drivers of sustainable land expansion using a patch-generating land use simulation (PLUS) model: A case study in Wuhan, China. Comput. Environ. Urban Syst. 2021, 85, 101569. [Google Scholar] [CrossRef]
  22. Neil, B.C.O.; Elmar, K.; Kristie, L.E.; Eric, K.B.; Keywan, R.; Dale, S.R.; Bas, J.V.R.; Detlef, P.V.V.; Joern, B.; Kasper, K.; et al. The roads ahead: Narratives for shared socioeconomic pathways describing world futures in the 21st century. Glob. Environ. Change 2014, 42, 169–180. [Google Scholar]
  23. Zhang, F.; Deng, X.; Xie, L.; Xu, N. China’s energy-related carbon emissions projections for the shared socioeconomic pathways. Resour. Conserv. Recycl. 2021, 168, 105456. [Google Scholar] [CrossRef]
  24. Xu, X.; Zhang, Y.; Chen, Y. Projecting China’s future water footprint under the shared socio-economic pathways. J. Environ. Manag. 2020, 260, 110102. [Google Scholar] [CrossRef]
  25. Graham, N.T.; Davies, E.G.R.; Hejazi, M.I.; Calvin, K.; Kim, S.H.; Helinski, L.; Wilhelm, F.R.M.; Clarke, L.; Kyle, P.; Patel, P.; et al. Water Sector Assumptions for the Shared Socioeconomic Pathways in an Integrated Modeling Framework. Water Resour. Res. 2018, 54, 6423–6440. [Google Scholar] [CrossRef]
  26. Chen, G.; Li, X.; Liu, X.; Chen, Y.; Liang, X.; Leng, J.; Xu, X.; Liao, W.; Qiu, Y.; Wu, Q.; et al. Global projections of future urban land expansion under shared socioeconomic pathways. Nat. Commun. 2020, 11, 537. [Google Scholar] [CrossRef] [PubMed] [Green Version]
  27. Rohat, G.; Wilhelmi, O.; Flacke, J.; Monaghan, A.; Gao, J.; Dao, H.; van Maarseveen, M. Characterizing the role of socioeconomic pathways in shaping future urban heat-related challenges. Sci. Total Environ. 2019, 695, 133941. [Google Scholar] [CrossRef]
  28. Xu, W.; Wang, J.; Zhang, M.; Li, S. Construction of landscape ecological network based on landscape ecological risk assessment in a large-scale opencast coal mine area. J. Clean. Prod. 2021, 286, 125523. [Google Scholar] [CrossRef]
  29. Lin, Y.; Qiu, R.; Yao, J.; Hu, X.; Lin, J. The effects of urbanization on China’s forest loss from 2000 to 2012: Evidence from a panel analysis. J. Clean. Prod. 2019, 214, 270–278. [Google Scholar] [CrossRef]
  30. Qiu, B.; Zeng, C.; Chen, C.; Zhang, C.; Zhong, M. Vegetation distribution pattern along altitudinal gradient in subtropical mountainous and hilly river basin, China. J. Geogr. Sci. 2013, 23, 247–257. [Google Scholar] [CrossRef]
  31. Ying, L.; Wang, J.; Zhou, Y. Ecological-environmental problems and solutions in the Minjiang River basin, Fujian Province, China. Acta Ecol. Sin. 2019, 39, 8857–8866. [Google Scholar]
  32. Liu, J.; Liu, M.; Tian, H.; Zhuang, D.; Deng, X. Spatial and temporal patterns of China’s cropland during 1990–2000: An analysis based on Landsat TM data. Remote Sens. Environ. 2005, 98, 442–456. [Google Scholar] [CrossRef]
  33. Song, S.; Liu, Z.; He, C.; Lu, W. Evaluating the effects of urban expansion on natural habitat quality by coupling localized shared socioeconomic pathways and the land use scenario dynamics-urban model. Ecol. Indic. 2020, 112, 106071. [Google Scholar] [CrossRef]
  34. Jiang, T.; Zhao, J.; Cao, L.; Wang, Y.; Su, B.; Jing, C.; Wang, R.; Gao, C. Projection of national and provincial economy under the shared socioeconomic pathways in China. Clim. Change Res. 2018, 14, 50–58. [Google Scholar]
  35. Jiang, T.; Zhao, J.; Jing, C.; Cao, L.; Wang, Y.; Sun, H.; Wang, A.; Huang, J.; Su, B.; Wang, R. National and provincial population projected to 2100 under the shared socioeconomic pathways in China. Clim. Change Res. 2017, 13, 128–137. [Google Scholar]
  36. Wang, B.; Liao, J.; Zhu, W.; Qiu, Q.; Wang, L.; Tang, L. The weight of neighborhood setting of the FLUS model based on a historical scenario: A case study of land use simulation of urban agglomeration of the Golden Triangle of Southern Fujian in 2030. Acta Ecol. Sin. 2019, 39, 4284–4298. [Google Scholar]
  37. Lin, Y.; Hu, X.; Zheng, X.; Hou, X.; Zhang, Z.; Zhou, X.; Qiu, R.; Lin, J. Spatial variations in the relationships between road network and landscape ecological risks in the highest forest coverage region of China. Ecol. Indic. 2019, 96, 392–403. [Google Scholar] [CrossRef]
  38. Zhang, W.; Chang, W.J.; Zhu, Z.C.; Hui, Z. Landscape ecological risk assessment of Chinese coastal cities based on land use change. Appl. Geogr. 2020, 117, 102174. [Google Scholar] [CrossRef]
  39. Hou, M.; Ge, J.; Gao, J.; Meng, B.; Li, Y.; Yin, J.; Liu, J.; Feng, Q.; Liang, T. Ecological risk assessment and impact factor analysis of Alpine Wetland ecosystem based on LUCC and boosted regression tree on the Zoige Plateau, China. Remote Sens. 2020, 12, 368. [Google Scholar] [CrossRef] [Green Version]
  40. Mo, W.; Wang, Y.; Zhang, Y.; Zhuang, D. Impacts of road network expansion on landscape ecological risk in a megacity, China: A case study of Beijing. Sci. Total Environ. 2017, 574, 1000–1011. [Google Scholar] [CrossRef] [Green Version]
  41. Ju, H.; Niu, C.; Zhang, S.; Jiang, W.; Zhang, Z.; Zhang, X.; Yang, Z.; Cui, Y. Spatiotemporal patterns and modifiable areal unit problems of the landscape ecological risk in coastal areas: A case study of the Shandong Peninsula, China. J. Clean. Prod. 2021, 310, 127522. [Google Scholar] [CrossRef]
  42. Wang, B.; Ding, M.; Li, S.; Liu, L.; Ai, J. Assessment of landscape ecological risk for a cross-border basin: A case study of the Koshi River Basin, central Himalayas. Ecol. Indic. 2020, 117, 106621. [Google Scholar] [CrossRef]
  43. Sun, C.; Zhang, S.; Song, C.; Xu, J.; Fan, F. Investigation of Dynamic Coupling Coordination between Urbanization and the Eco-Environment—A Case Study in the Pearl River Delta Area. Land 2021, 10, 190. [Google Scholar] [CrossRef]
  44. Sharp, R.; Chaplin-Kramer, R.; Wood, S.; Guerry, A.; Douglass, J. InVEST User’s Guide. 2018. Available online: https://invest-userguide.readthedocs.io/_/downloads/en/3.6.0/pdf/ (accessed on 4 October 2021).
  45. Chen, K.; Han, Y.; Cao, S.; Ma, J.; Cao, G.; Lu, H. The study of vegetation carbon storage in Qinghai Lake valley based on remote sensing and CASA model. Procedia Environ. Sci. 2011, 10, 1568–1574. [Google Scholar]
  46. Hao, M.; Ren, Z.; Sun, Y.; Zhao, S. The dynamic analysis of trade-off and synergy of ecosystem services in the Guanzhong Basin. Geogr. Res. 2017, 36, 592–602. [Google Scholar]
  47. Shang, Y.; Liu, S. Spatial-temporal coupling coordination relationship between urbanization and green development in the coastal cities of China. Sustainability 2021, 13, 5339. [Google Scholar] [CrossRef]
  48. Gao, B.; Li, C.; Wu, Y.; Zheng, K.; Wu, Y. Landscape ecological risk assessment and influencing factors in ecological conservation area in Sichuan-Yunnan provinces, China. Chin. J. Appl. Ecol. 2021, 32, 1603–1613. [Google Scholar]
  49. Grêt-Regamey, A.; Rabe, S.; Crespo, R.; Lautenbach, S.; Ryffel, A.; Schlup, B. On the importance of non-linear relationships between landscape patterns and the sustainable provision of ecosystem services. Landsc. Ecol. 2014, 29, 201–212. [Google Scholar] [CrossRef]
  50. Fang, L.; Wang, L.; Chen, W.; Sun, J.; Cao, Q.; Wang, S.; Wang, L. Identifying the impacts of natural and human factors on ecosystem service in the Yangtze and Yellow River Basins. J. Clean. Prod. 2021, 314, 127995. [Google Scholar] [CrossRef]
  51. Xie, X.; Fang, B.; Xu, H.; He, S.; Li, X. Study on the coordinated relationship between Urban Land use efficiency and ecosystem health in China. Land Use Policy 2021, 102, 105235. [Google Scholar] [CrossRef]
  52. Feng, Y.; He, S.; Li, G. Interaction between urbanization and the eco-environment in the Pan-Third Pole region. Sci. Total Environ. 2021, 789, 148011. [Google Scholar] [CrossRef] [PubMed]
  53. Fan, J.; Wang, H.; Chen, D.; Zhang, W.; Wang, C. Discussion on sustainable urbanization in Tibet. Chin. Geogr. Sci. 2010, 20, 258–268. [Google Scholar] [CrossRef] [Green Version]
  54. Li, T.; Li, W.; Qian, Z. Variations in ecosystem service value in response to land use changes in Shenzhen. Ecol. Econ. 2008, 69, 1427–1435. [Google Scholar]
  55. Liu, H.; Liu, Y.; Wang, C.; Zhao, W.; Liu, S. Landscape pattern change simulations in Tibet based on the combination of the SSP-RCP scenarios. J. Environ. Manag. 2021, 292, 112783. [Google Scholar] [CrossRef] [PubMed]
  56. Jiang, C.; Yang, Z.; Wen, M.; Huang, L.; Liu, H.; Wang, J.; Chen, W.; Zhuang, C. Identifying the spatial disparities and determinants of ecosystem service balance and their implications on land use optimization. Sci. Total Environ. 2021, 793, 148472. [Google Scholar] [CrossRef]
  57. Ouyang, X.; Tang, L.; Wei, X.; Li, Y. Spatial interaction between urbanization and ecosystem services in Chinese urban agglomerations. Land Use Policy 2021, 109, 105587. [Google Scholar] [CrossRef]
Figure 1. Geographical location, risk unit division, and county boundary in the Min River Basin.
Land 11 00222 g001
Figure 2. (ac) Spatial distribution map of landscape ecological risk from 2000 to 2020.
Land 11 00222 g002
Figure 3. Percentage of each landscape ecological risk level during 2000 to 2030.
Land 11 00222 g003
Figure 4. (ae) Spatial distribution of landscape ecological risk in 2030 under SSPs scenario. Notes: (a) SSP1 scenario; (b) SSP2 scenario; (c) SSP3 scenario; (d) SSP4 scenario; (e) SSP5 scenario.
Land 11 00222 g004
Figure 5. (ac) Spatial distribution of ecosystem services from 2000 to 2020.
Land 11 00222 g005
Figure 6. Percentage of each ecosystem service level during 2000 to 2030.
Land 11 00222 g006
Figure 7. Spatial distribution of ecosystem services in 2030 under SSPs scenario.
Land 11 00222 g007
Figure 8. Spatial distribution of coupling coordination degree between landscape ecological risk and ecosystem services from 2000 to 2030.
Land 11 00222 g008
Table 1. Coupling coordination degree of landscape ecological risk and ecosystem service.
Year/ScenarioESLERCoupling
Correlation Degree
Comprehensive
Coordination
Index
Coupling
Coordination
Degree
Type
20000.4470.5150.8770.6760.770medium coordination
20100.4330.4780.9080.5170.685medium coordination
20200.4560.3760.9550.4270.639medium coordination
SSP1 scenario0.4740.4360.9180.7160.811high-level coordination
SSP2 scenario0.4700.4410.9480.6850.806high-level coordination
SSP3 scenario0.4630.4450.9810.6140.776medium coordination
SSP4 scenario0.4660.4420.9660.6400.786medium coordination
SSP5 scenario0.461 0.438 0.9780.5650.743medium coordination
Publisher’s Note: MDPI stays neutral with regard to jurisdictional claims in published maps and institutional affiliations.

