
The Spatiotemporal Non-Stationary Effect of Industrial Agglomeration on Urban Land Use Efficiency: A Case Study of Yangtze River Delta, China


Abstract
:1. Introduction
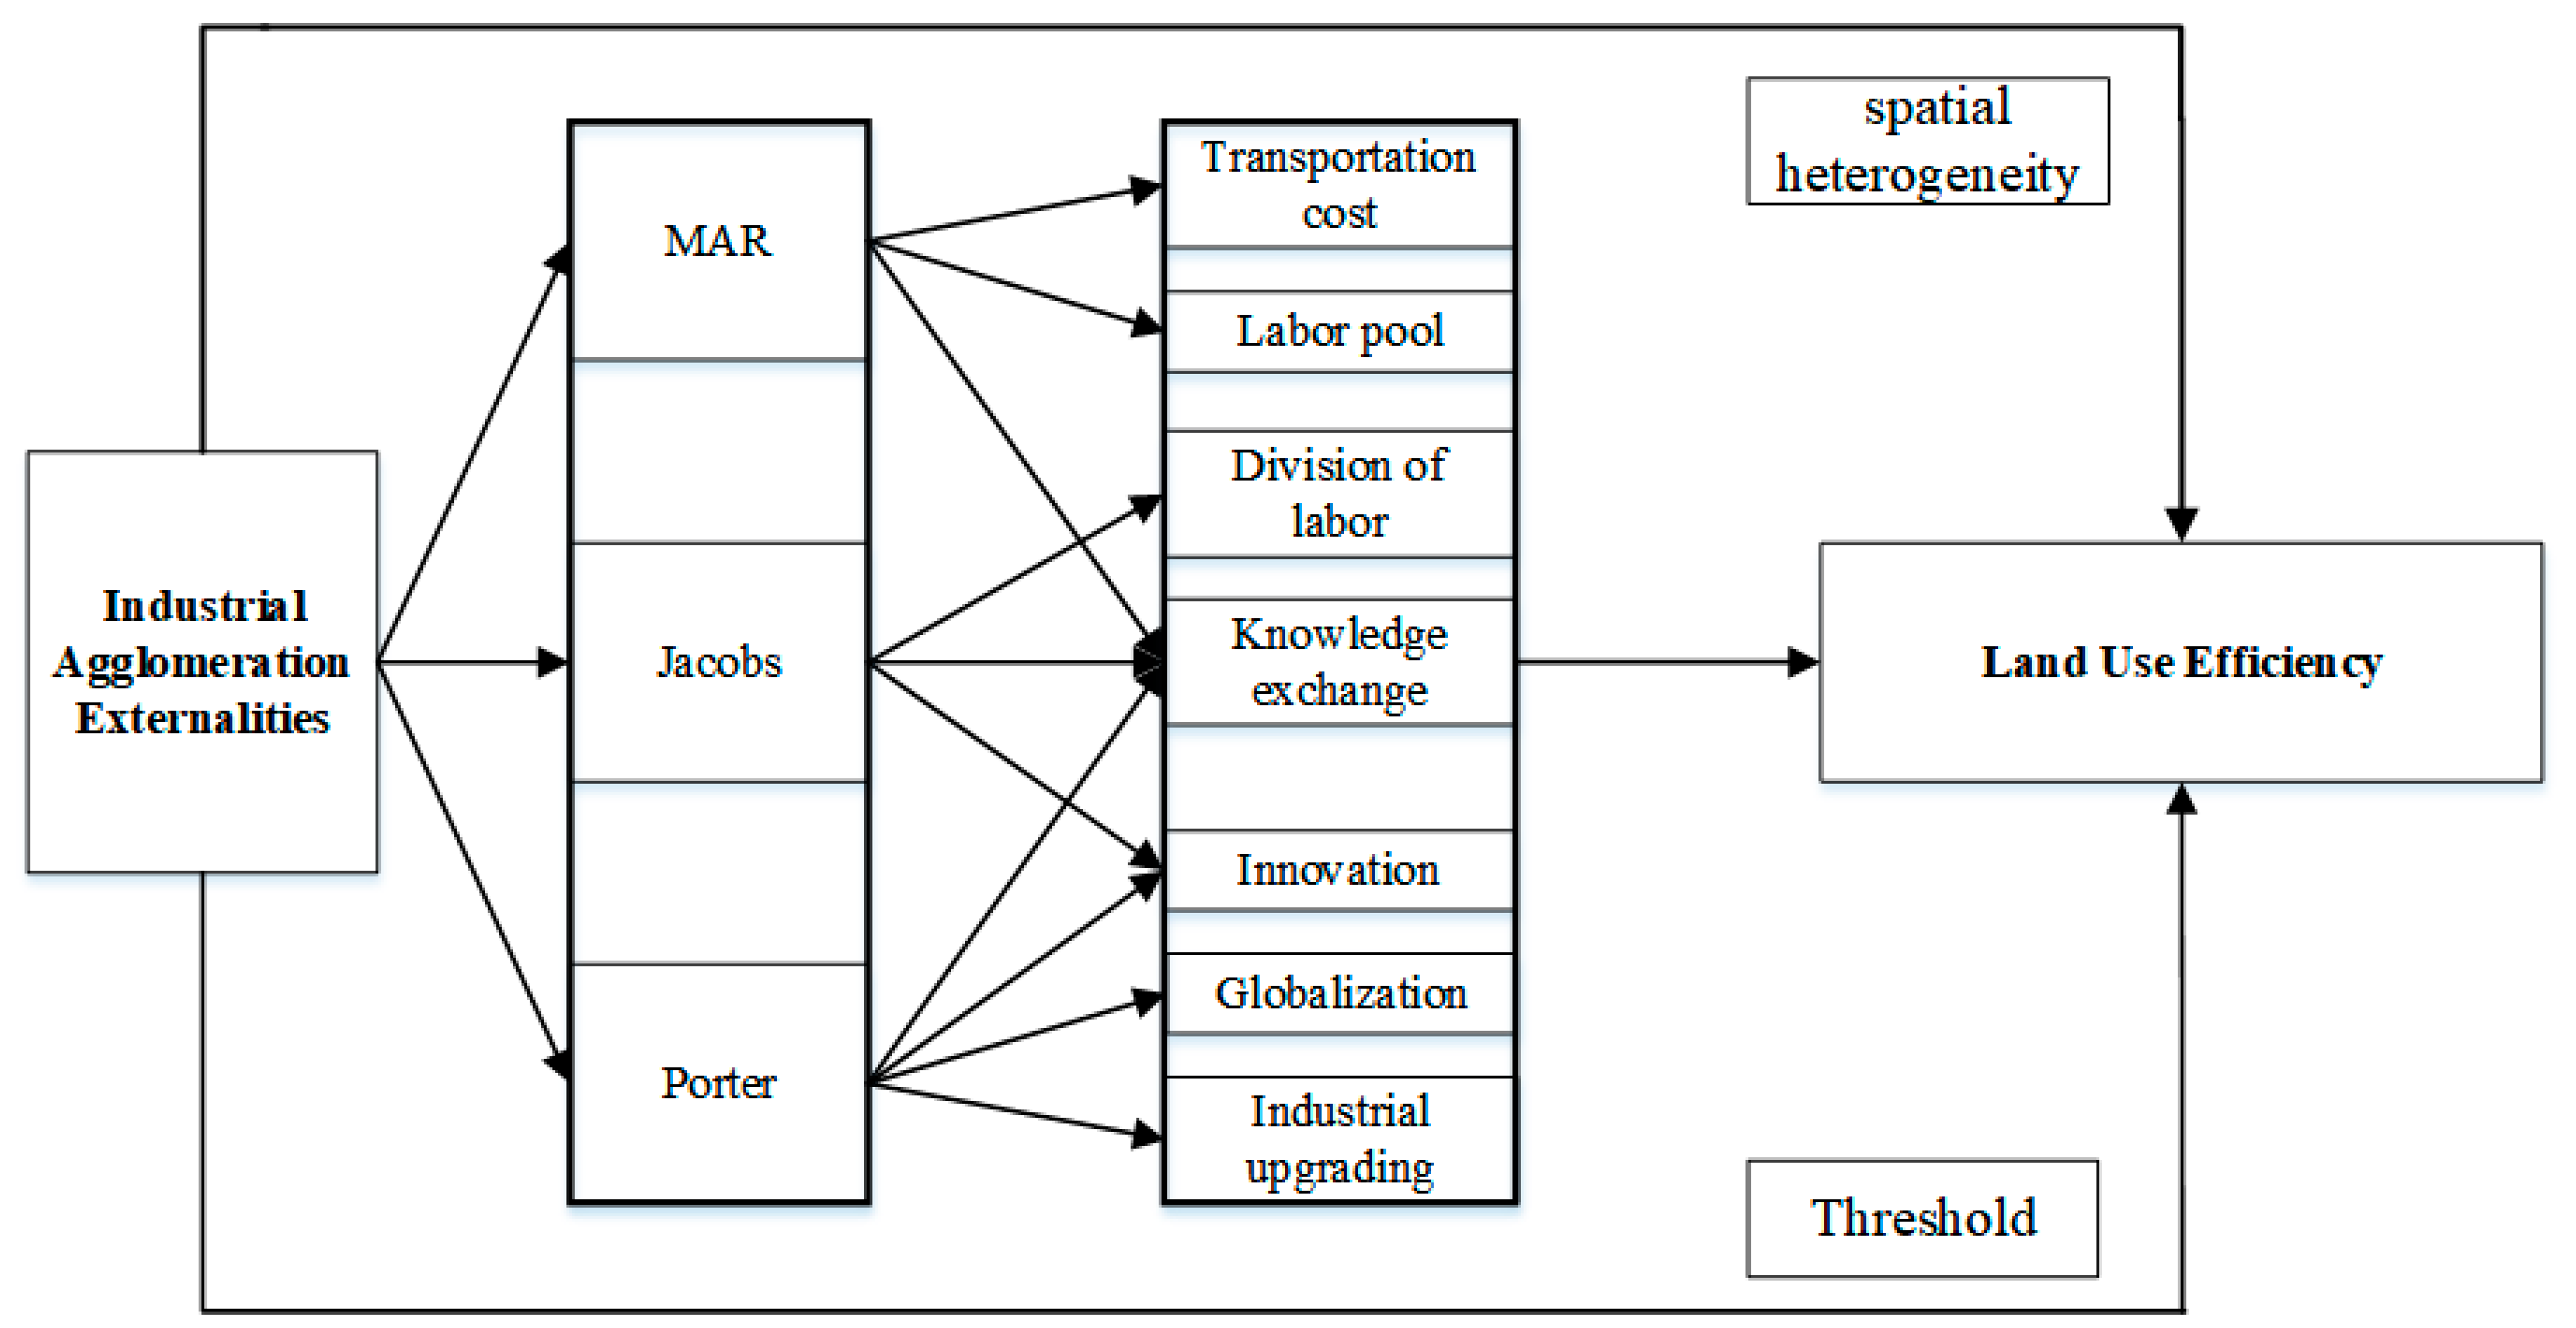
2. Mechanism of Industrial Agglomeration Externalities on ULUE
3. Methods and Data
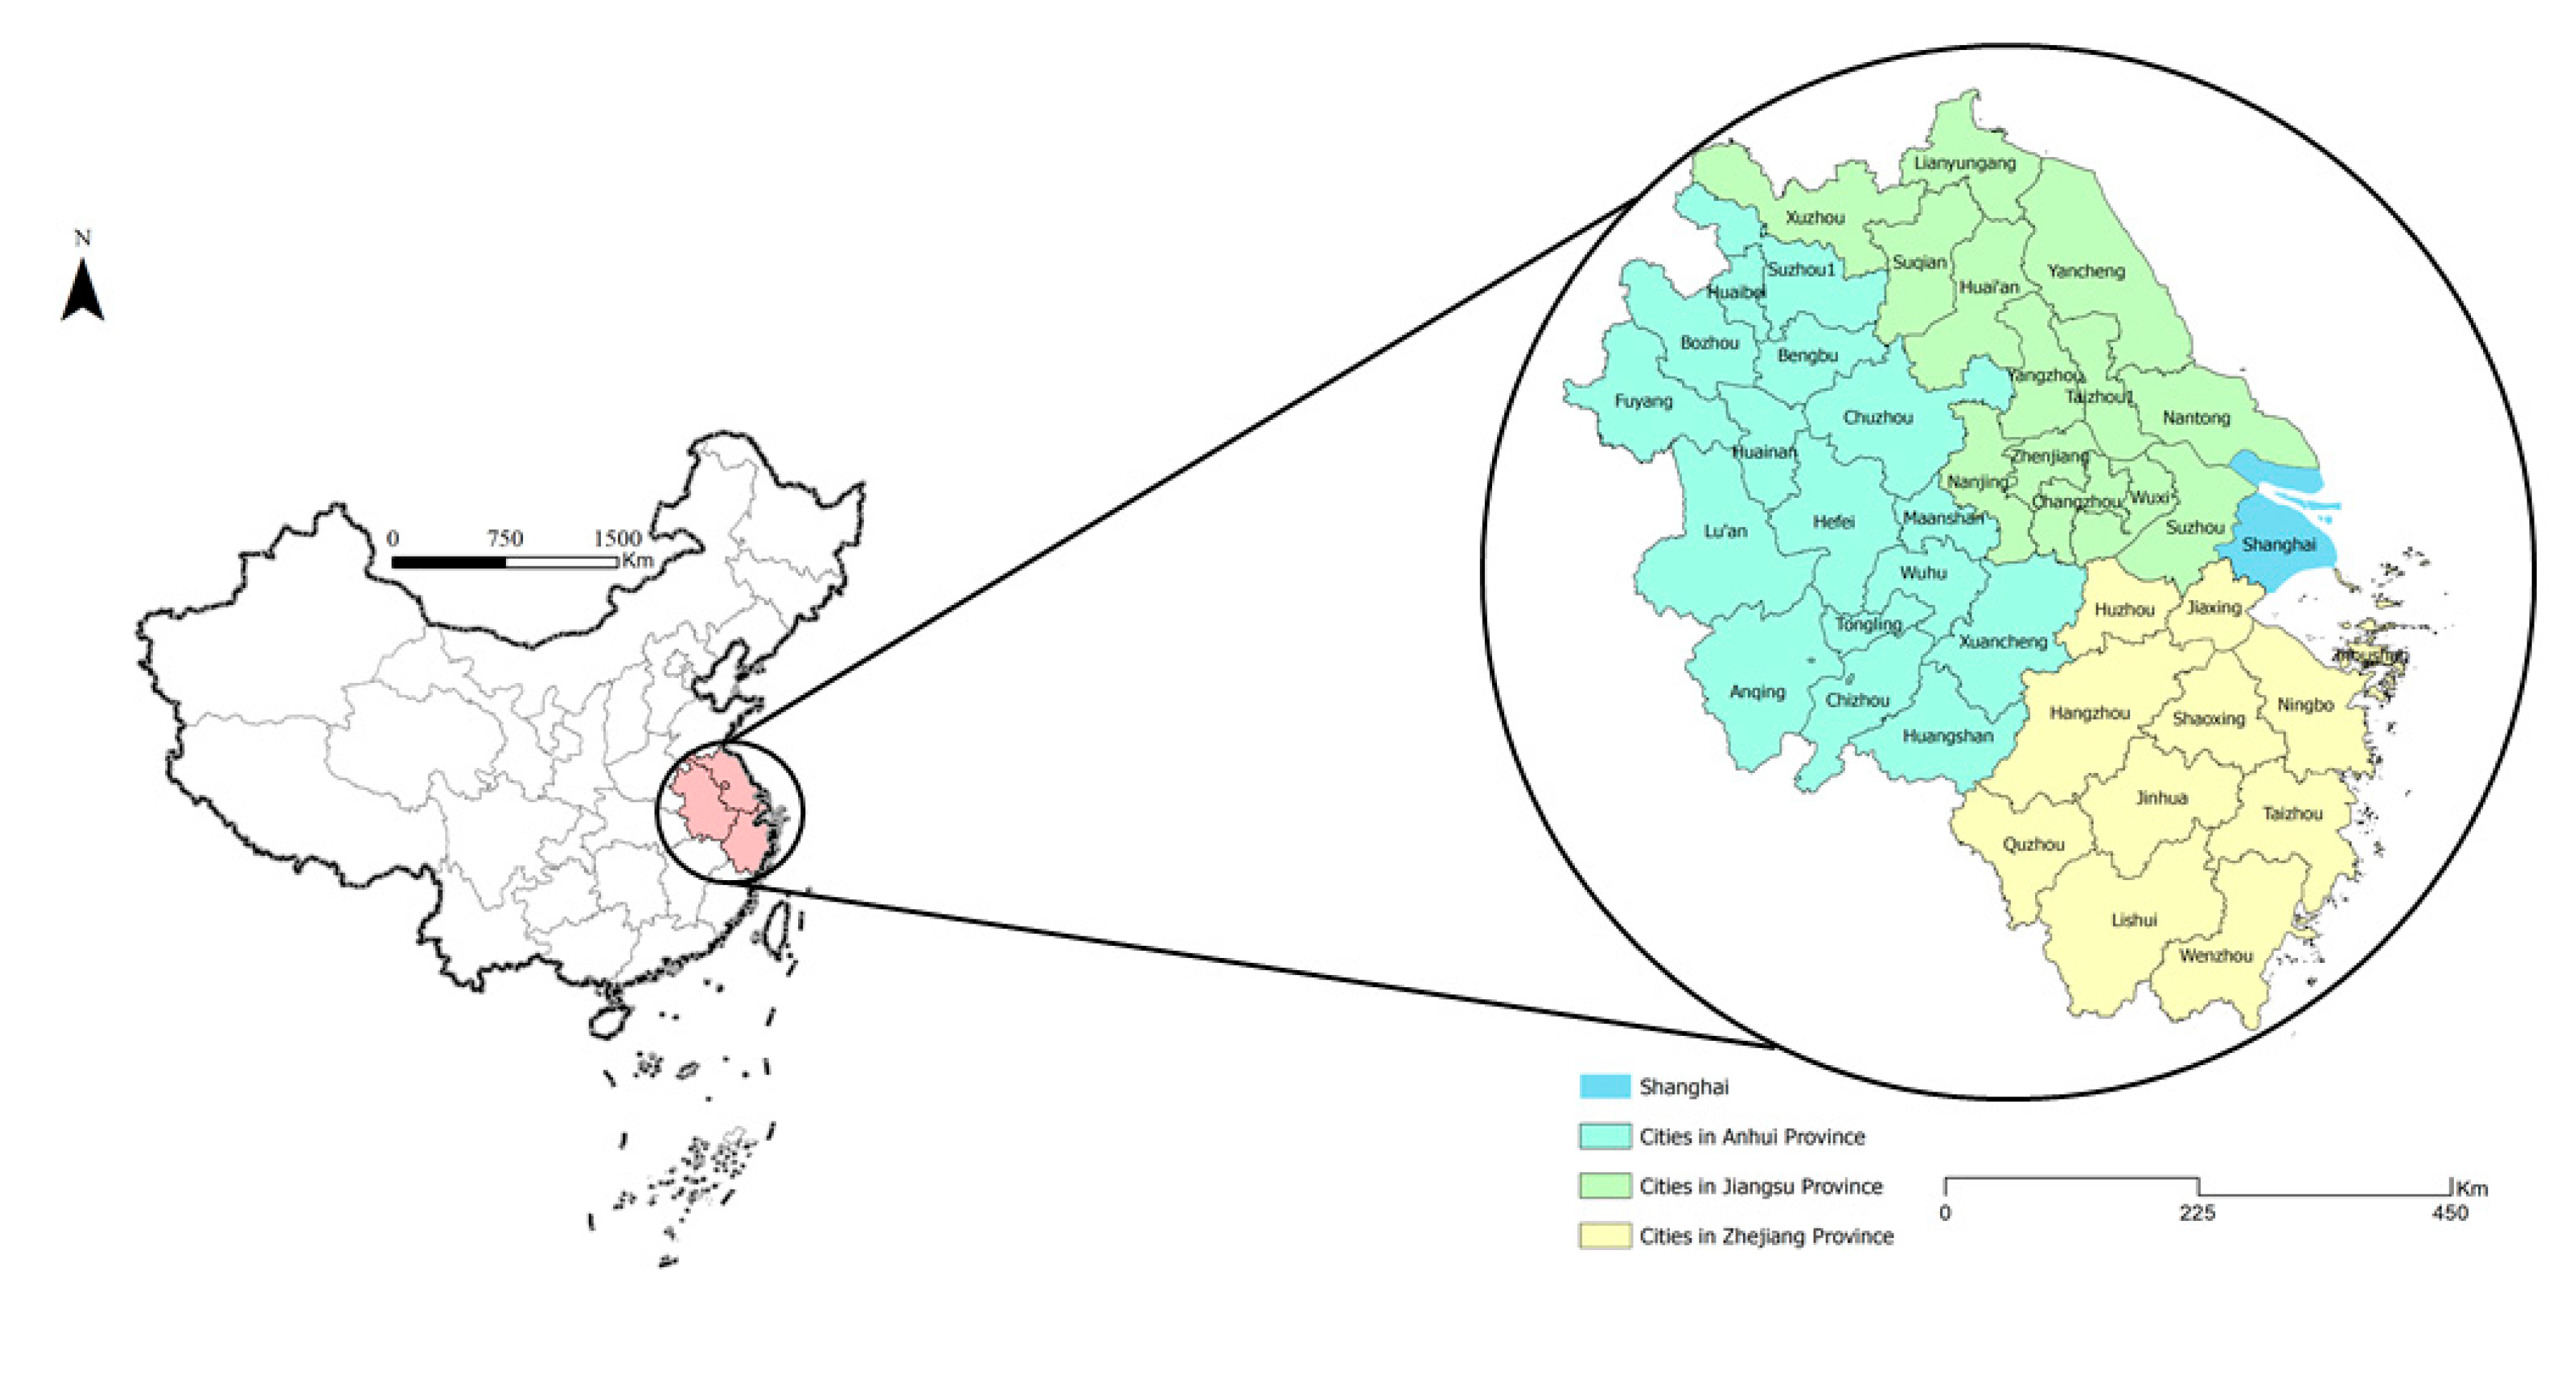
3.1. Study Area
3.2. GTWR Model
3.3. Variable Selection and Data Processing
3.3.1. ULUE Evaluation
3.3.2. Agglomeration Externalities
- (1)
- Specialization agglomeration externalities (MAR)
- (2)
- Diversity agglomeration externalities (Jacobs)
- (3)
- Competition agglomeration externalities (Porter)
3.3.3. Control Variables
4. Results
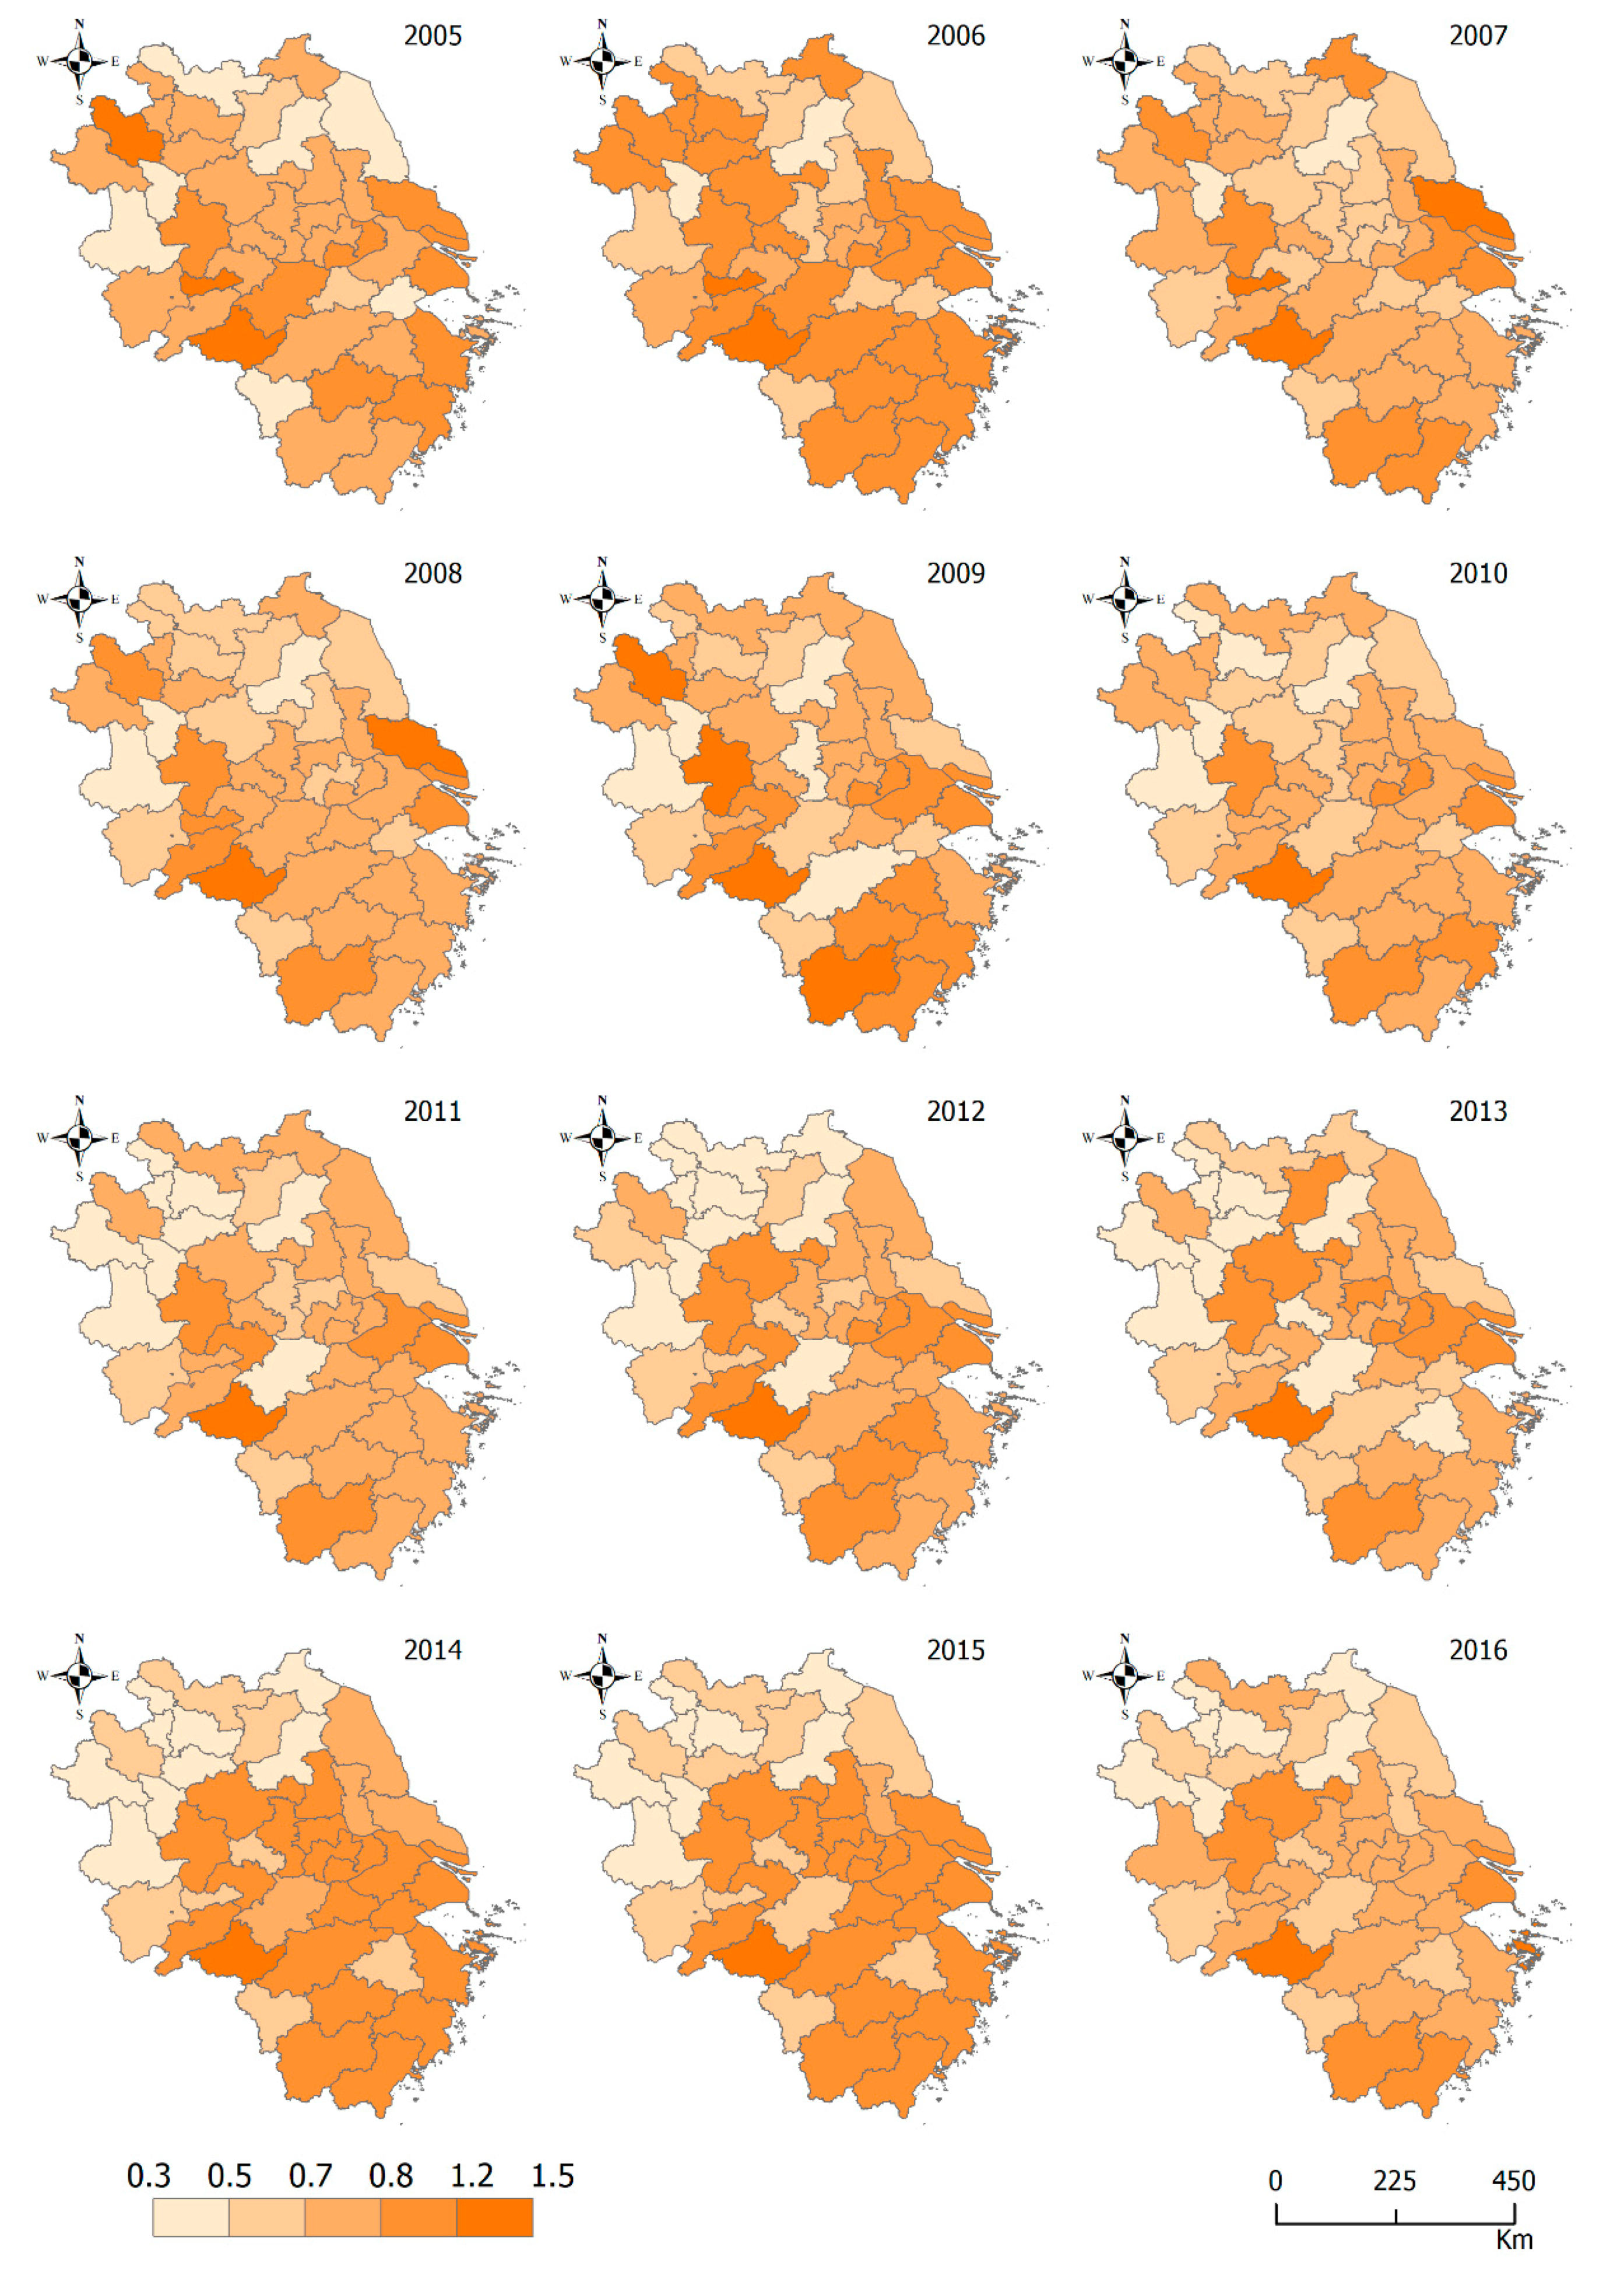
4.1. Spatiotemporal Distribution of ULUE
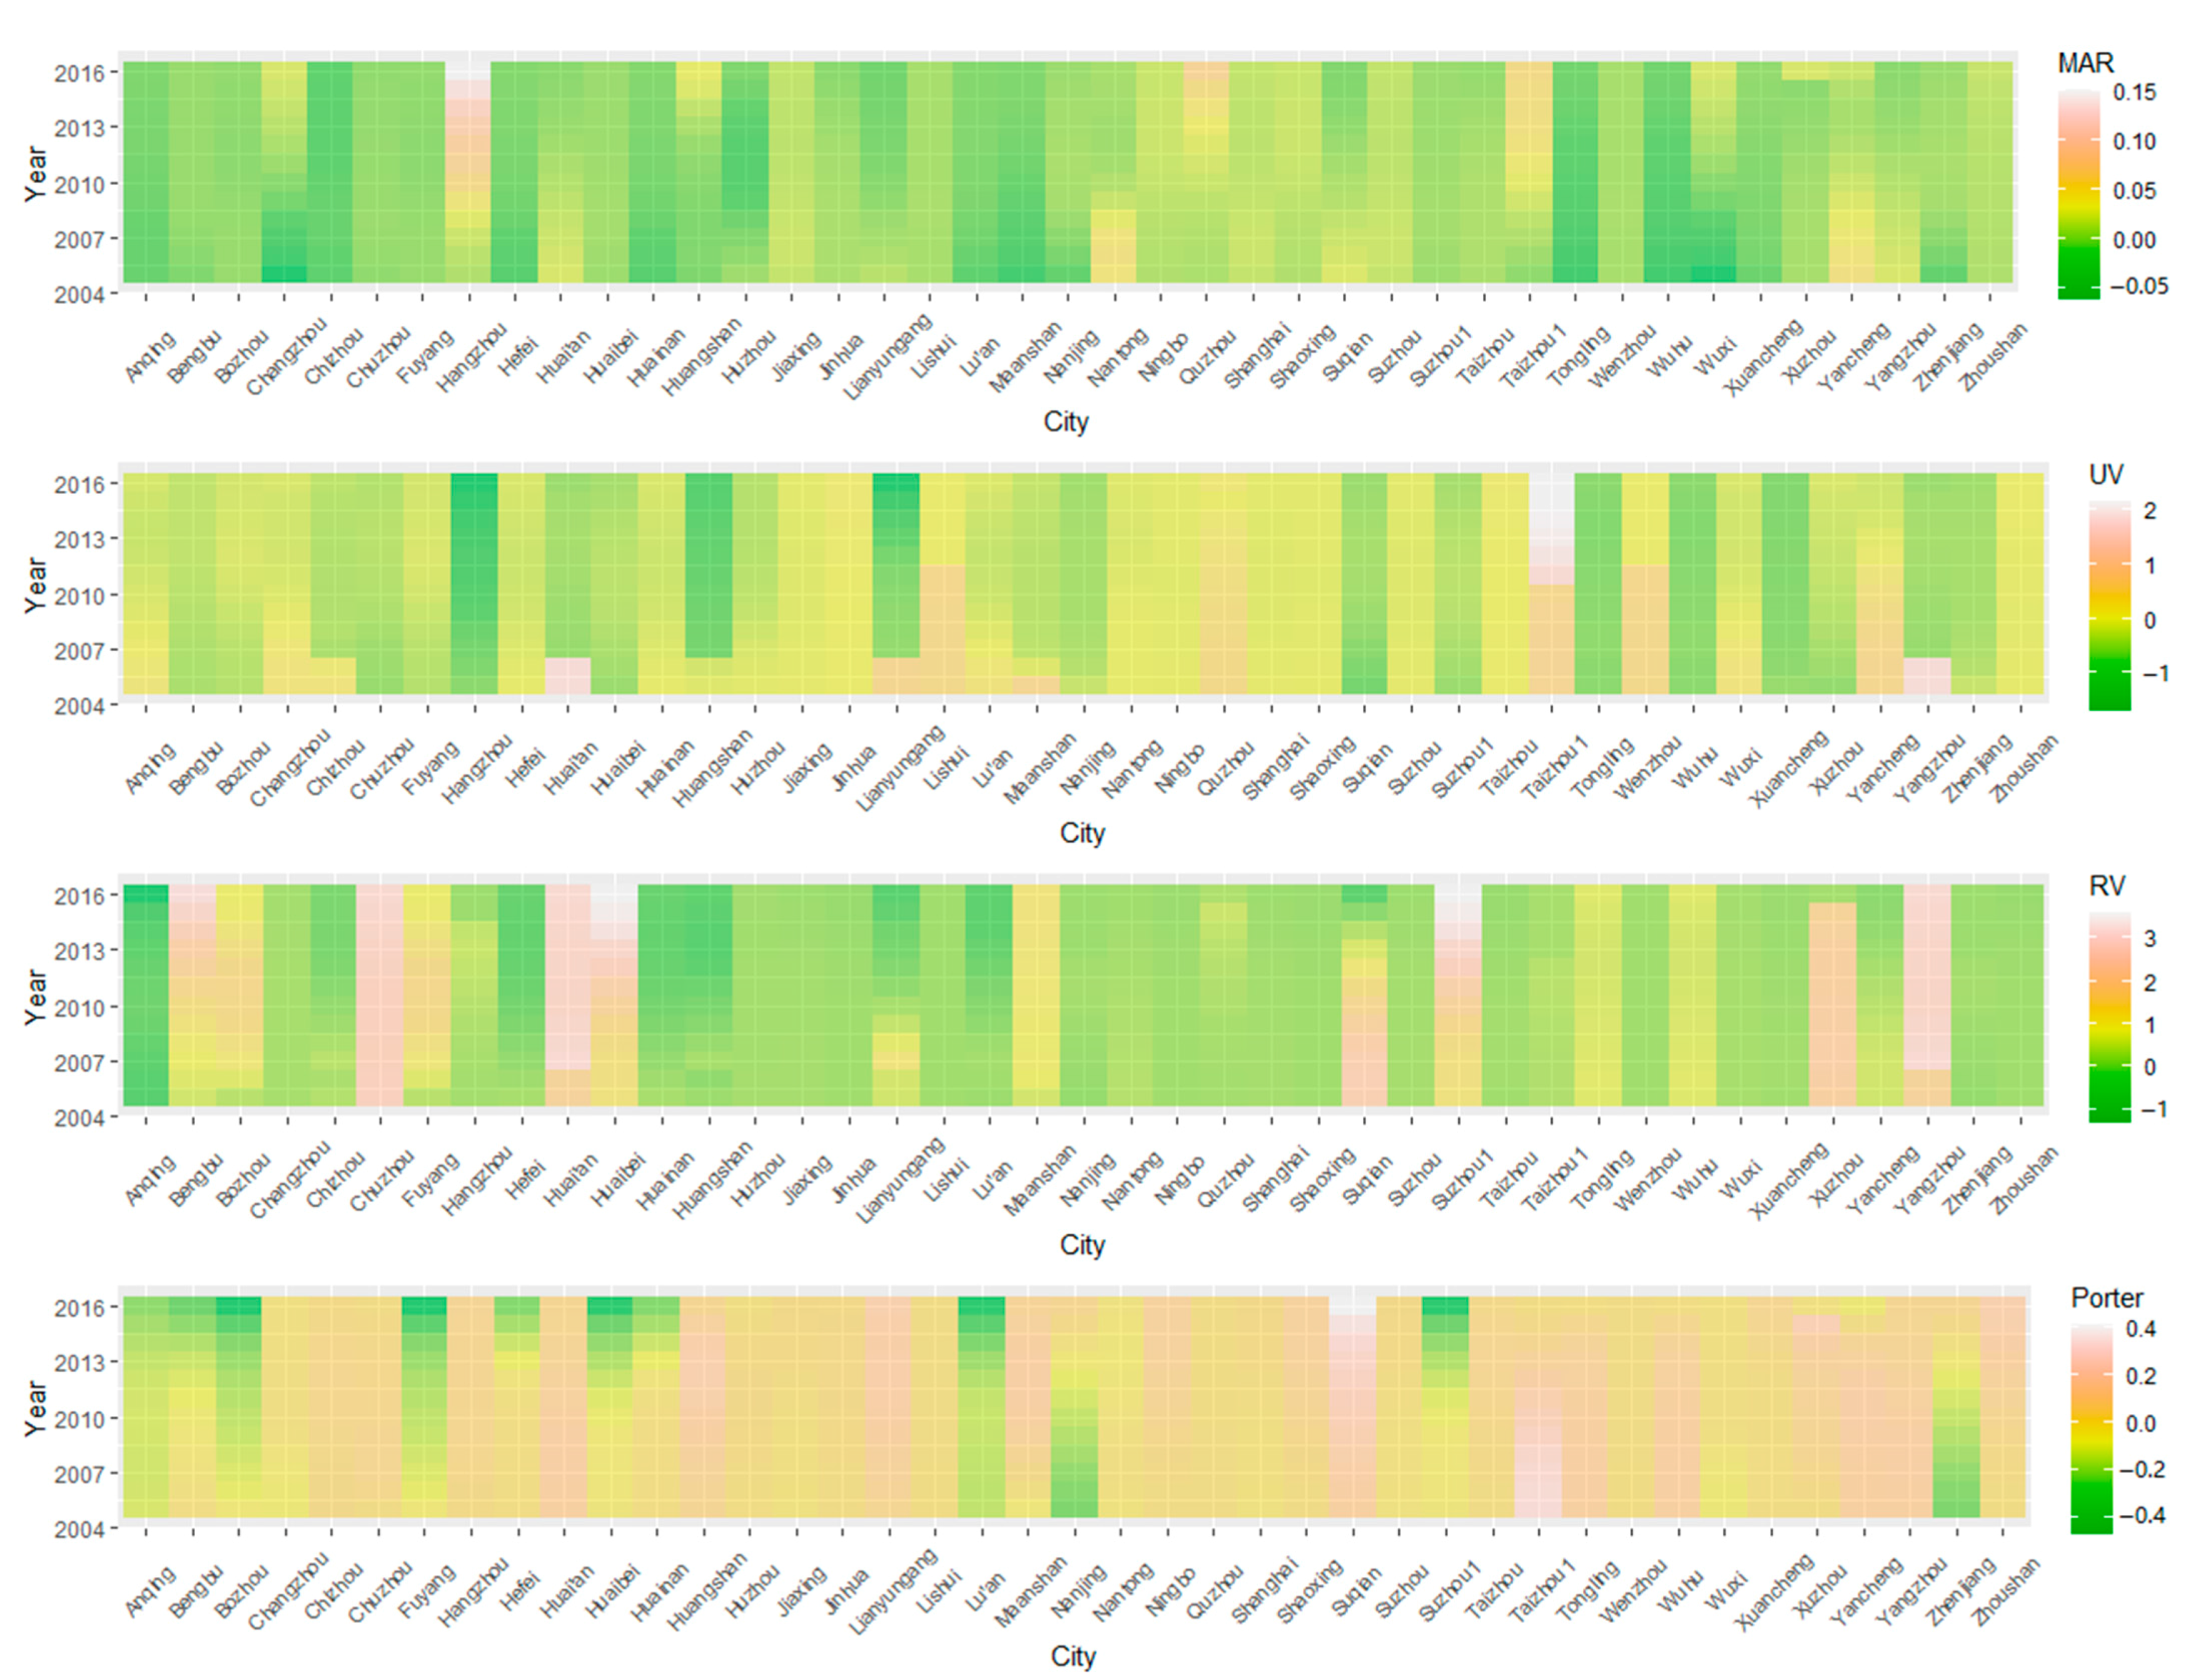
4.2. Spatiotemporal Distribution of Three Agglomeration Externalities
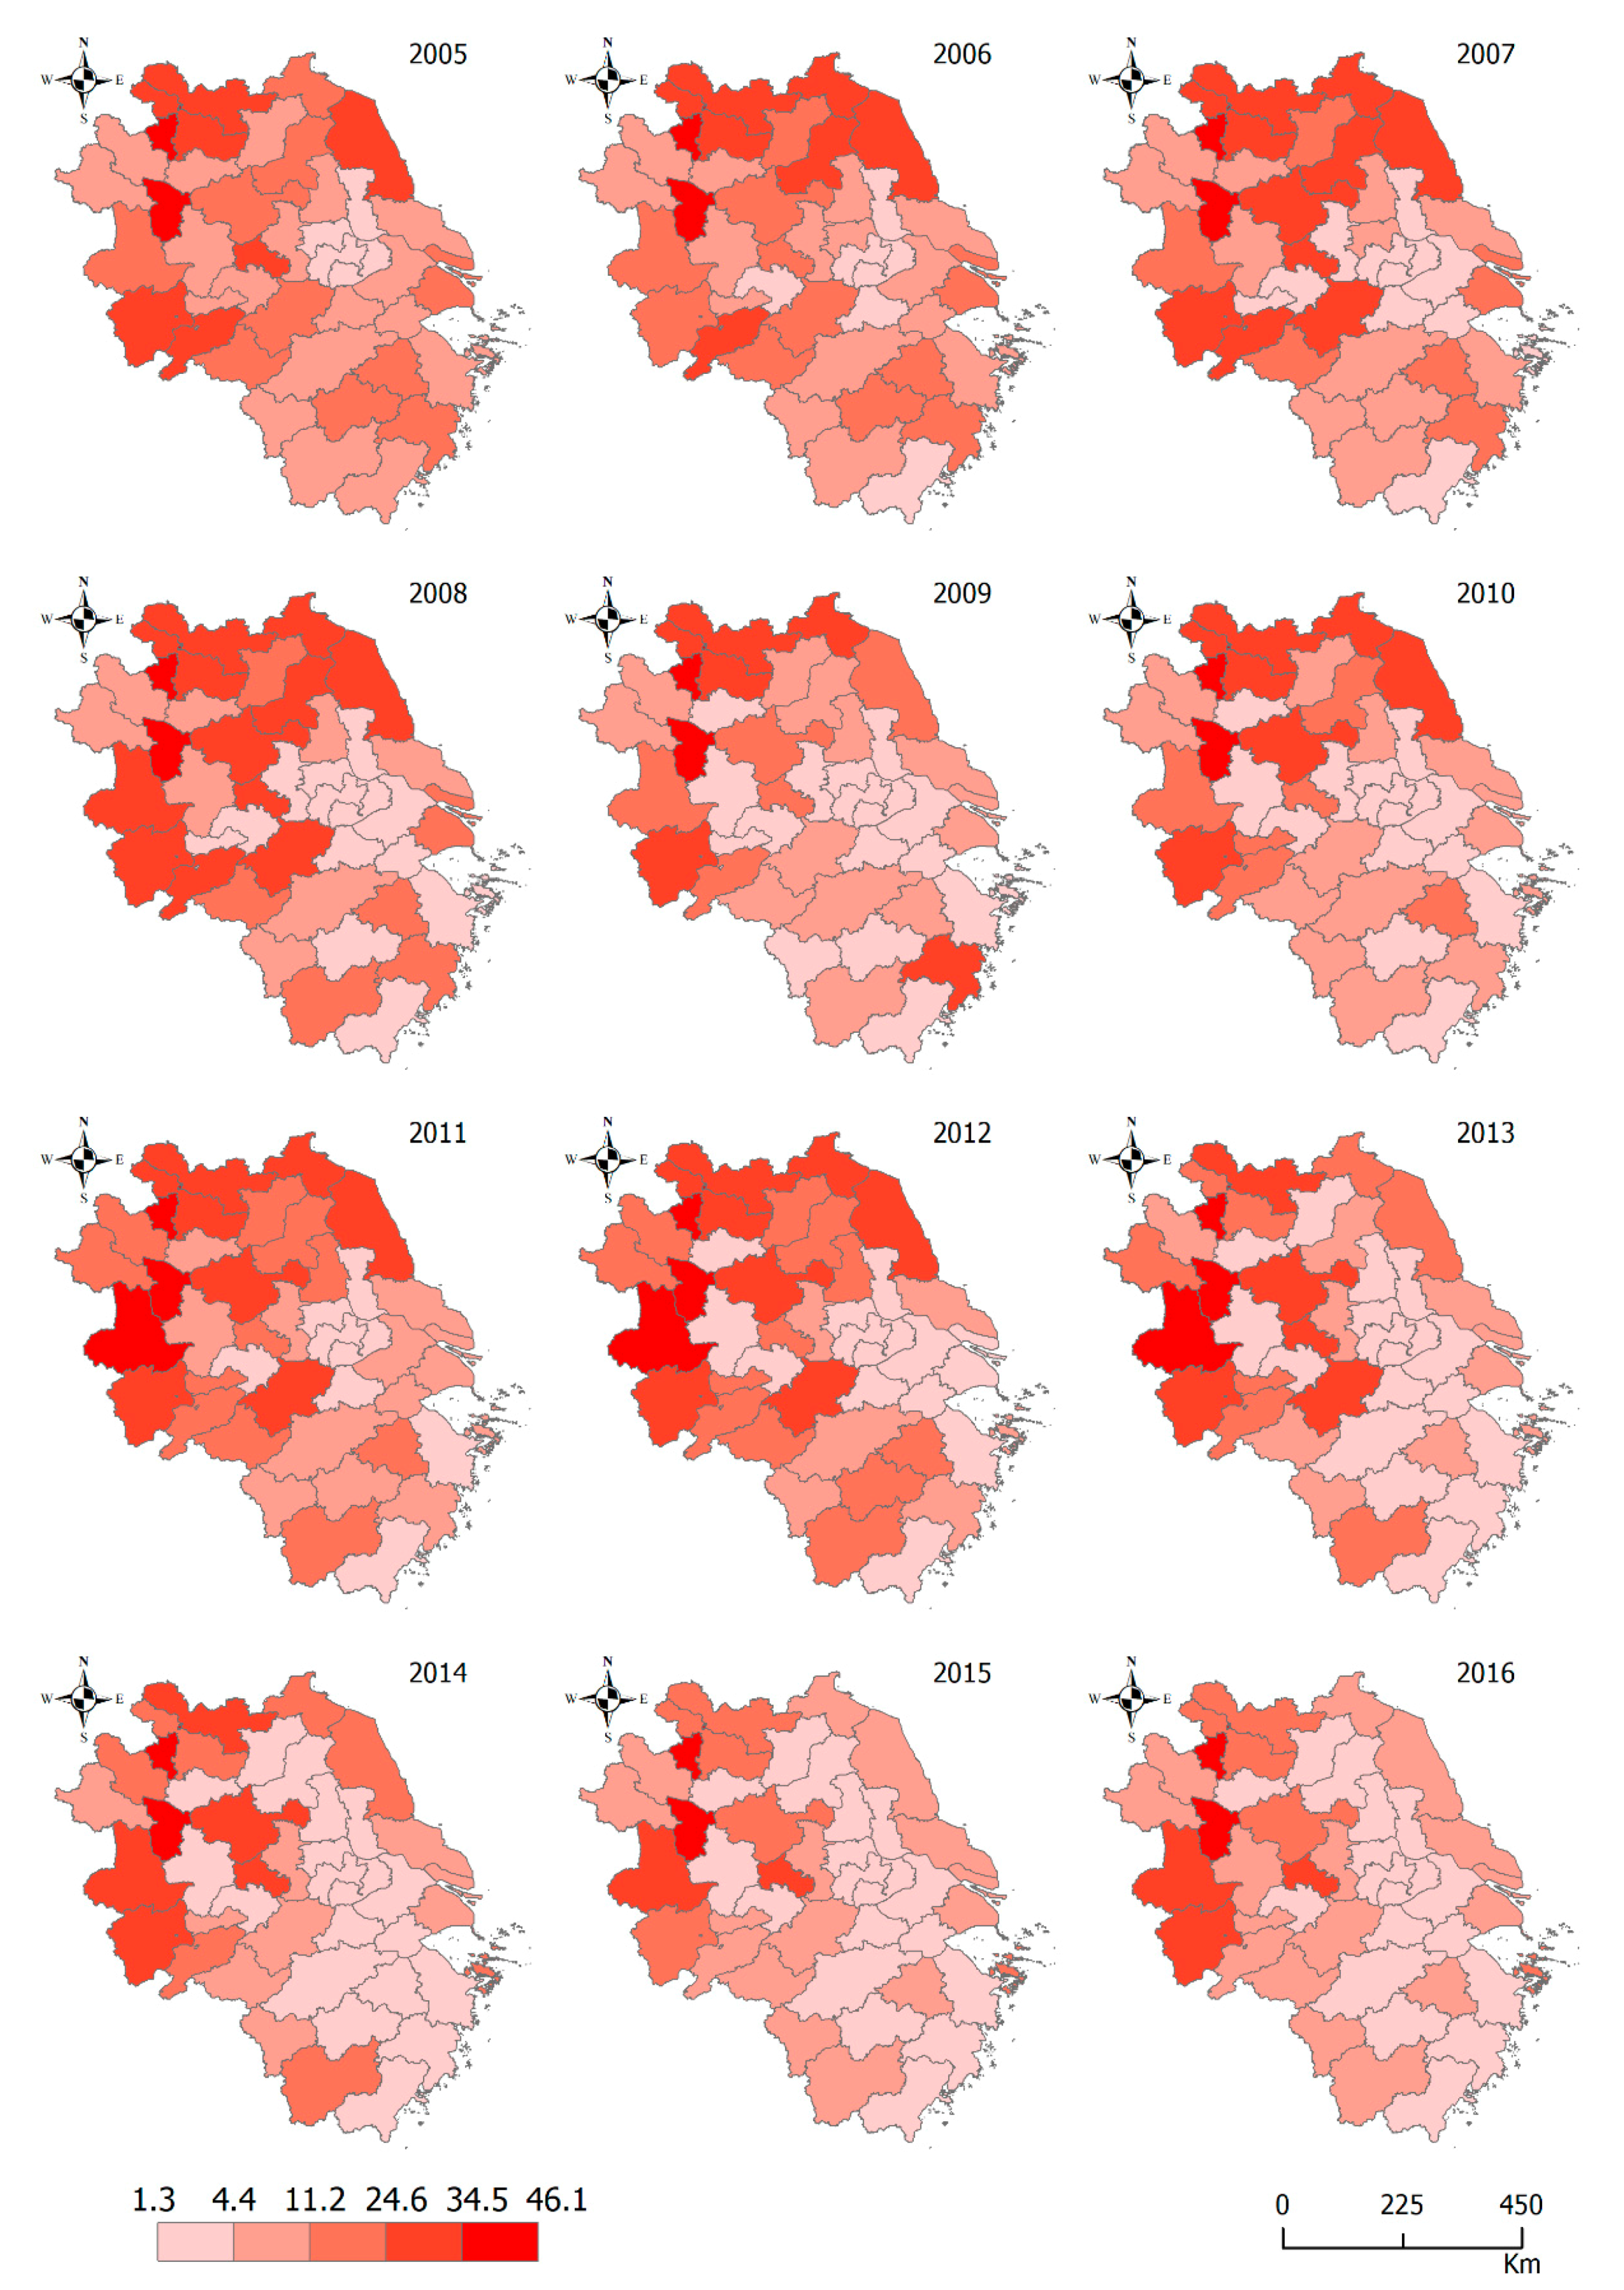
4.2.1. Spatiotemporal Distribution of MAR
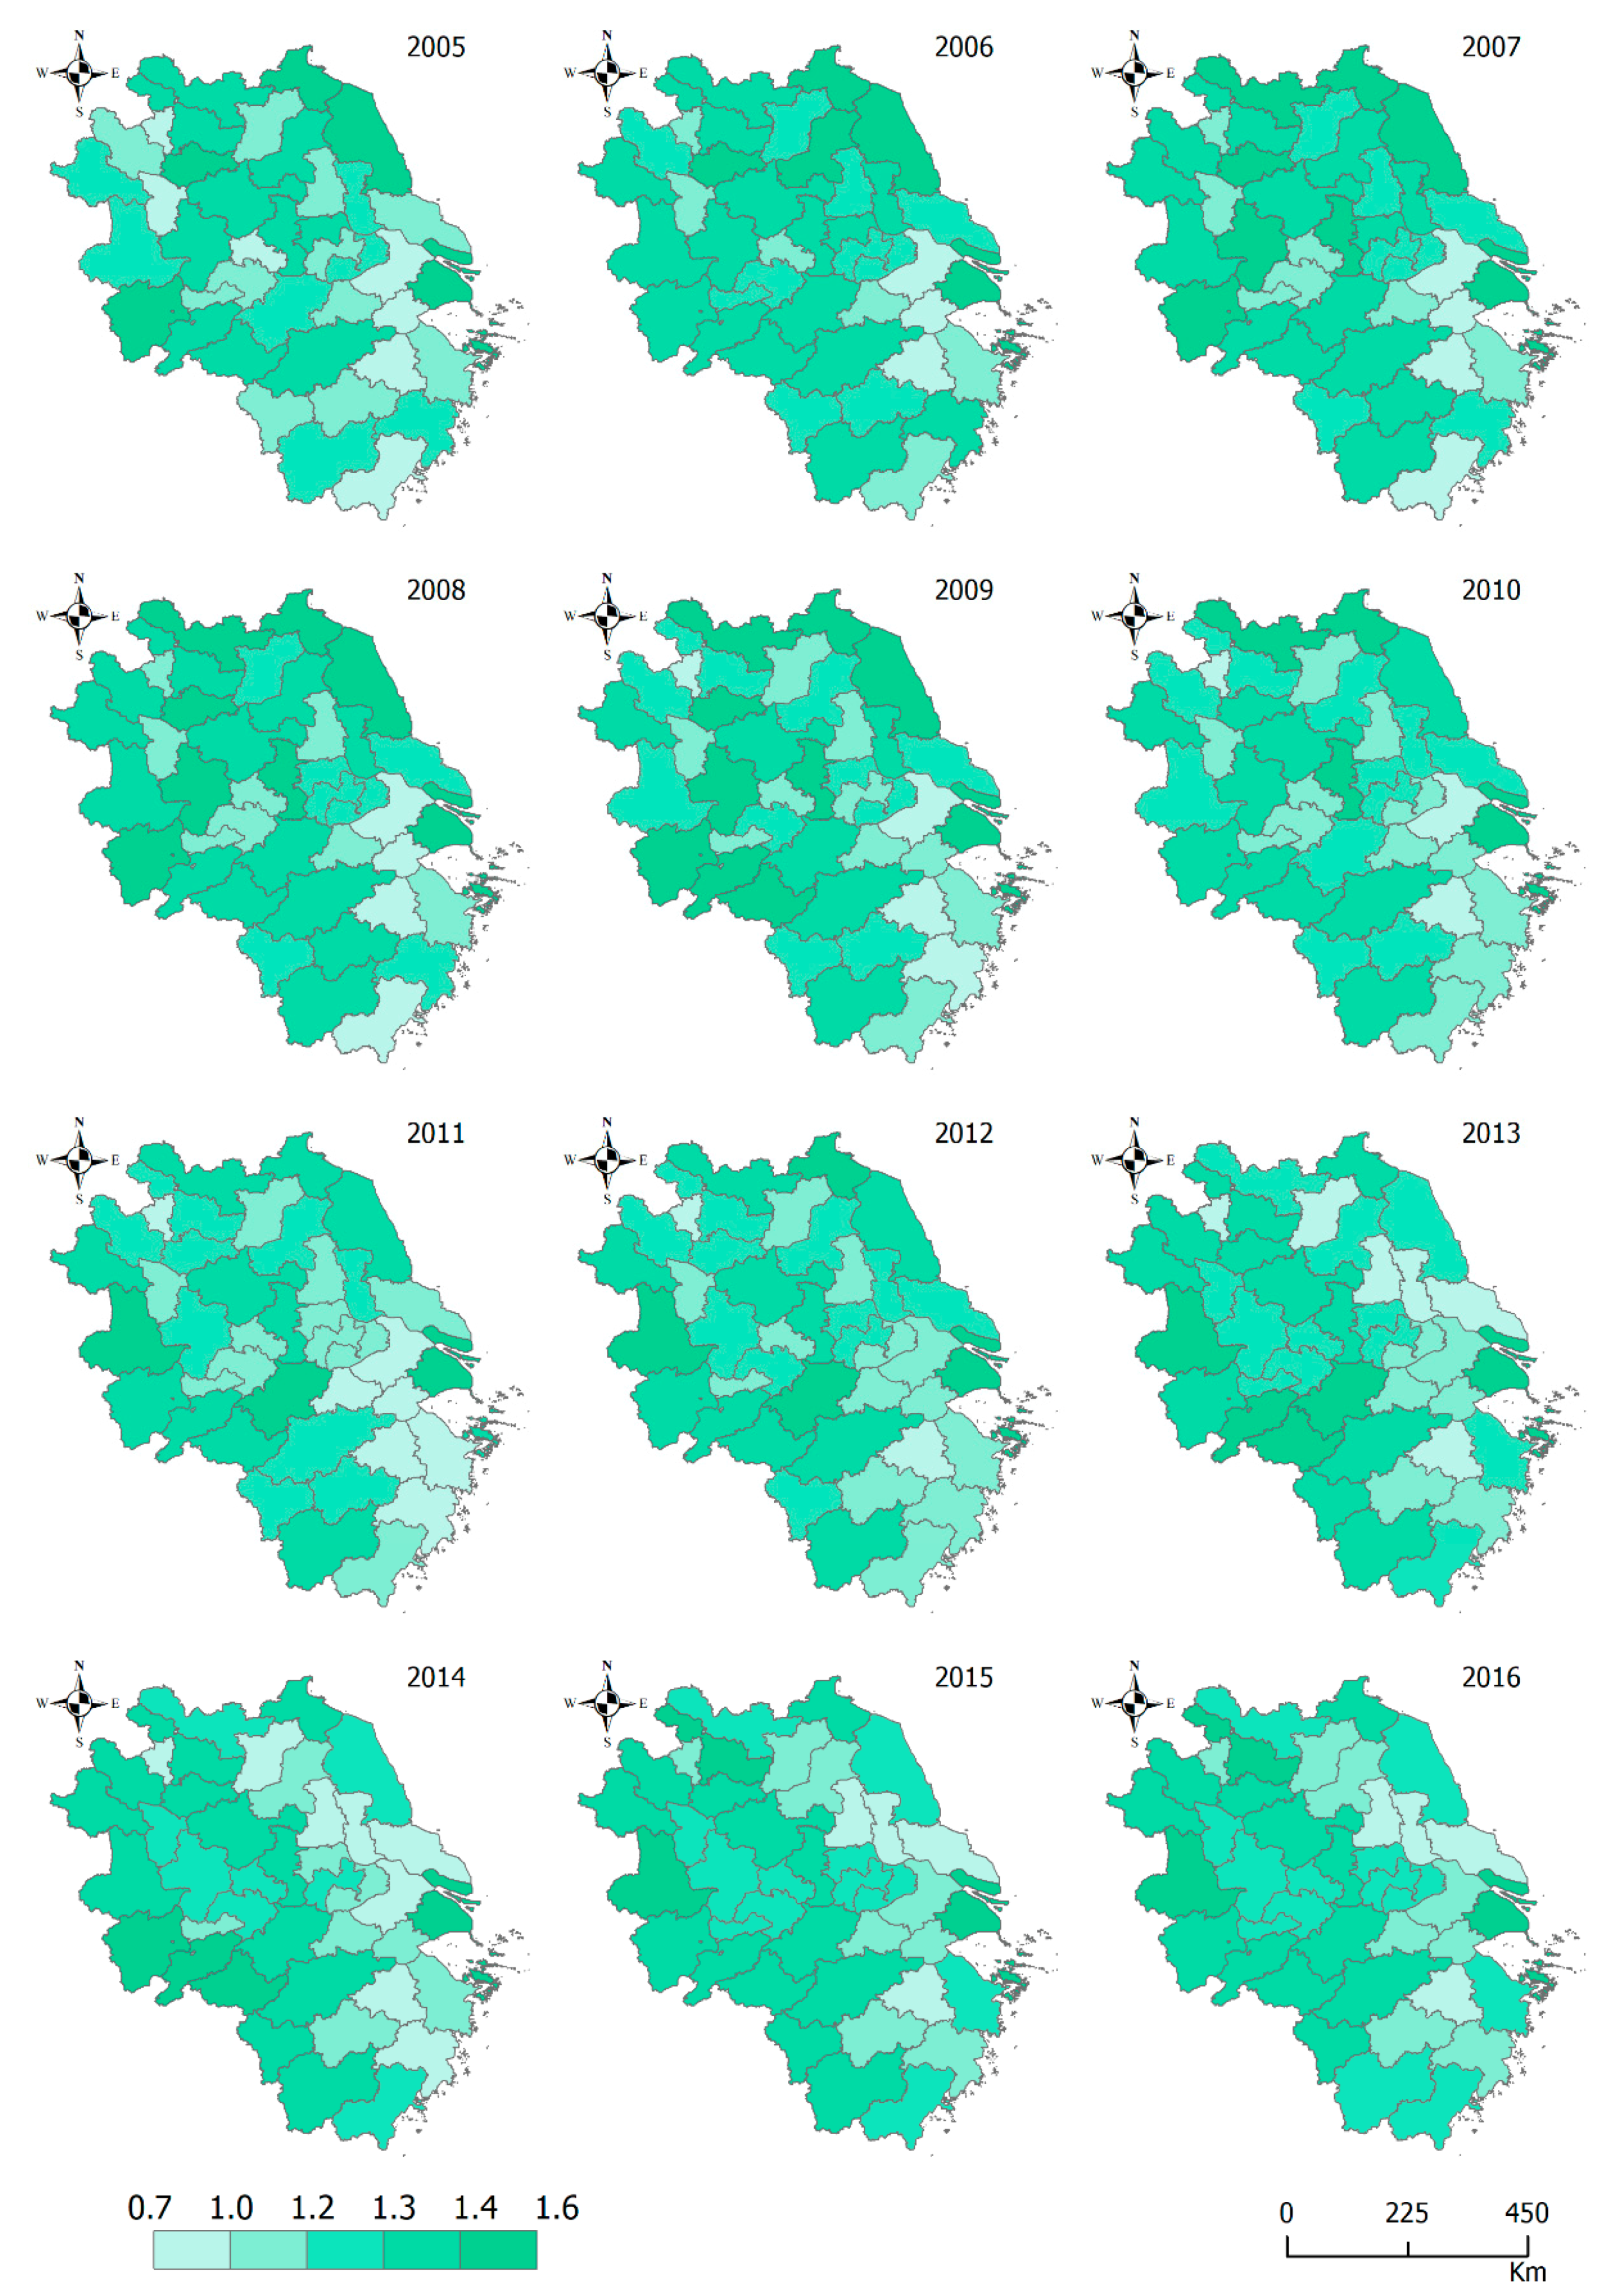
4.2.2. Spatiotemporal Distribution of UV
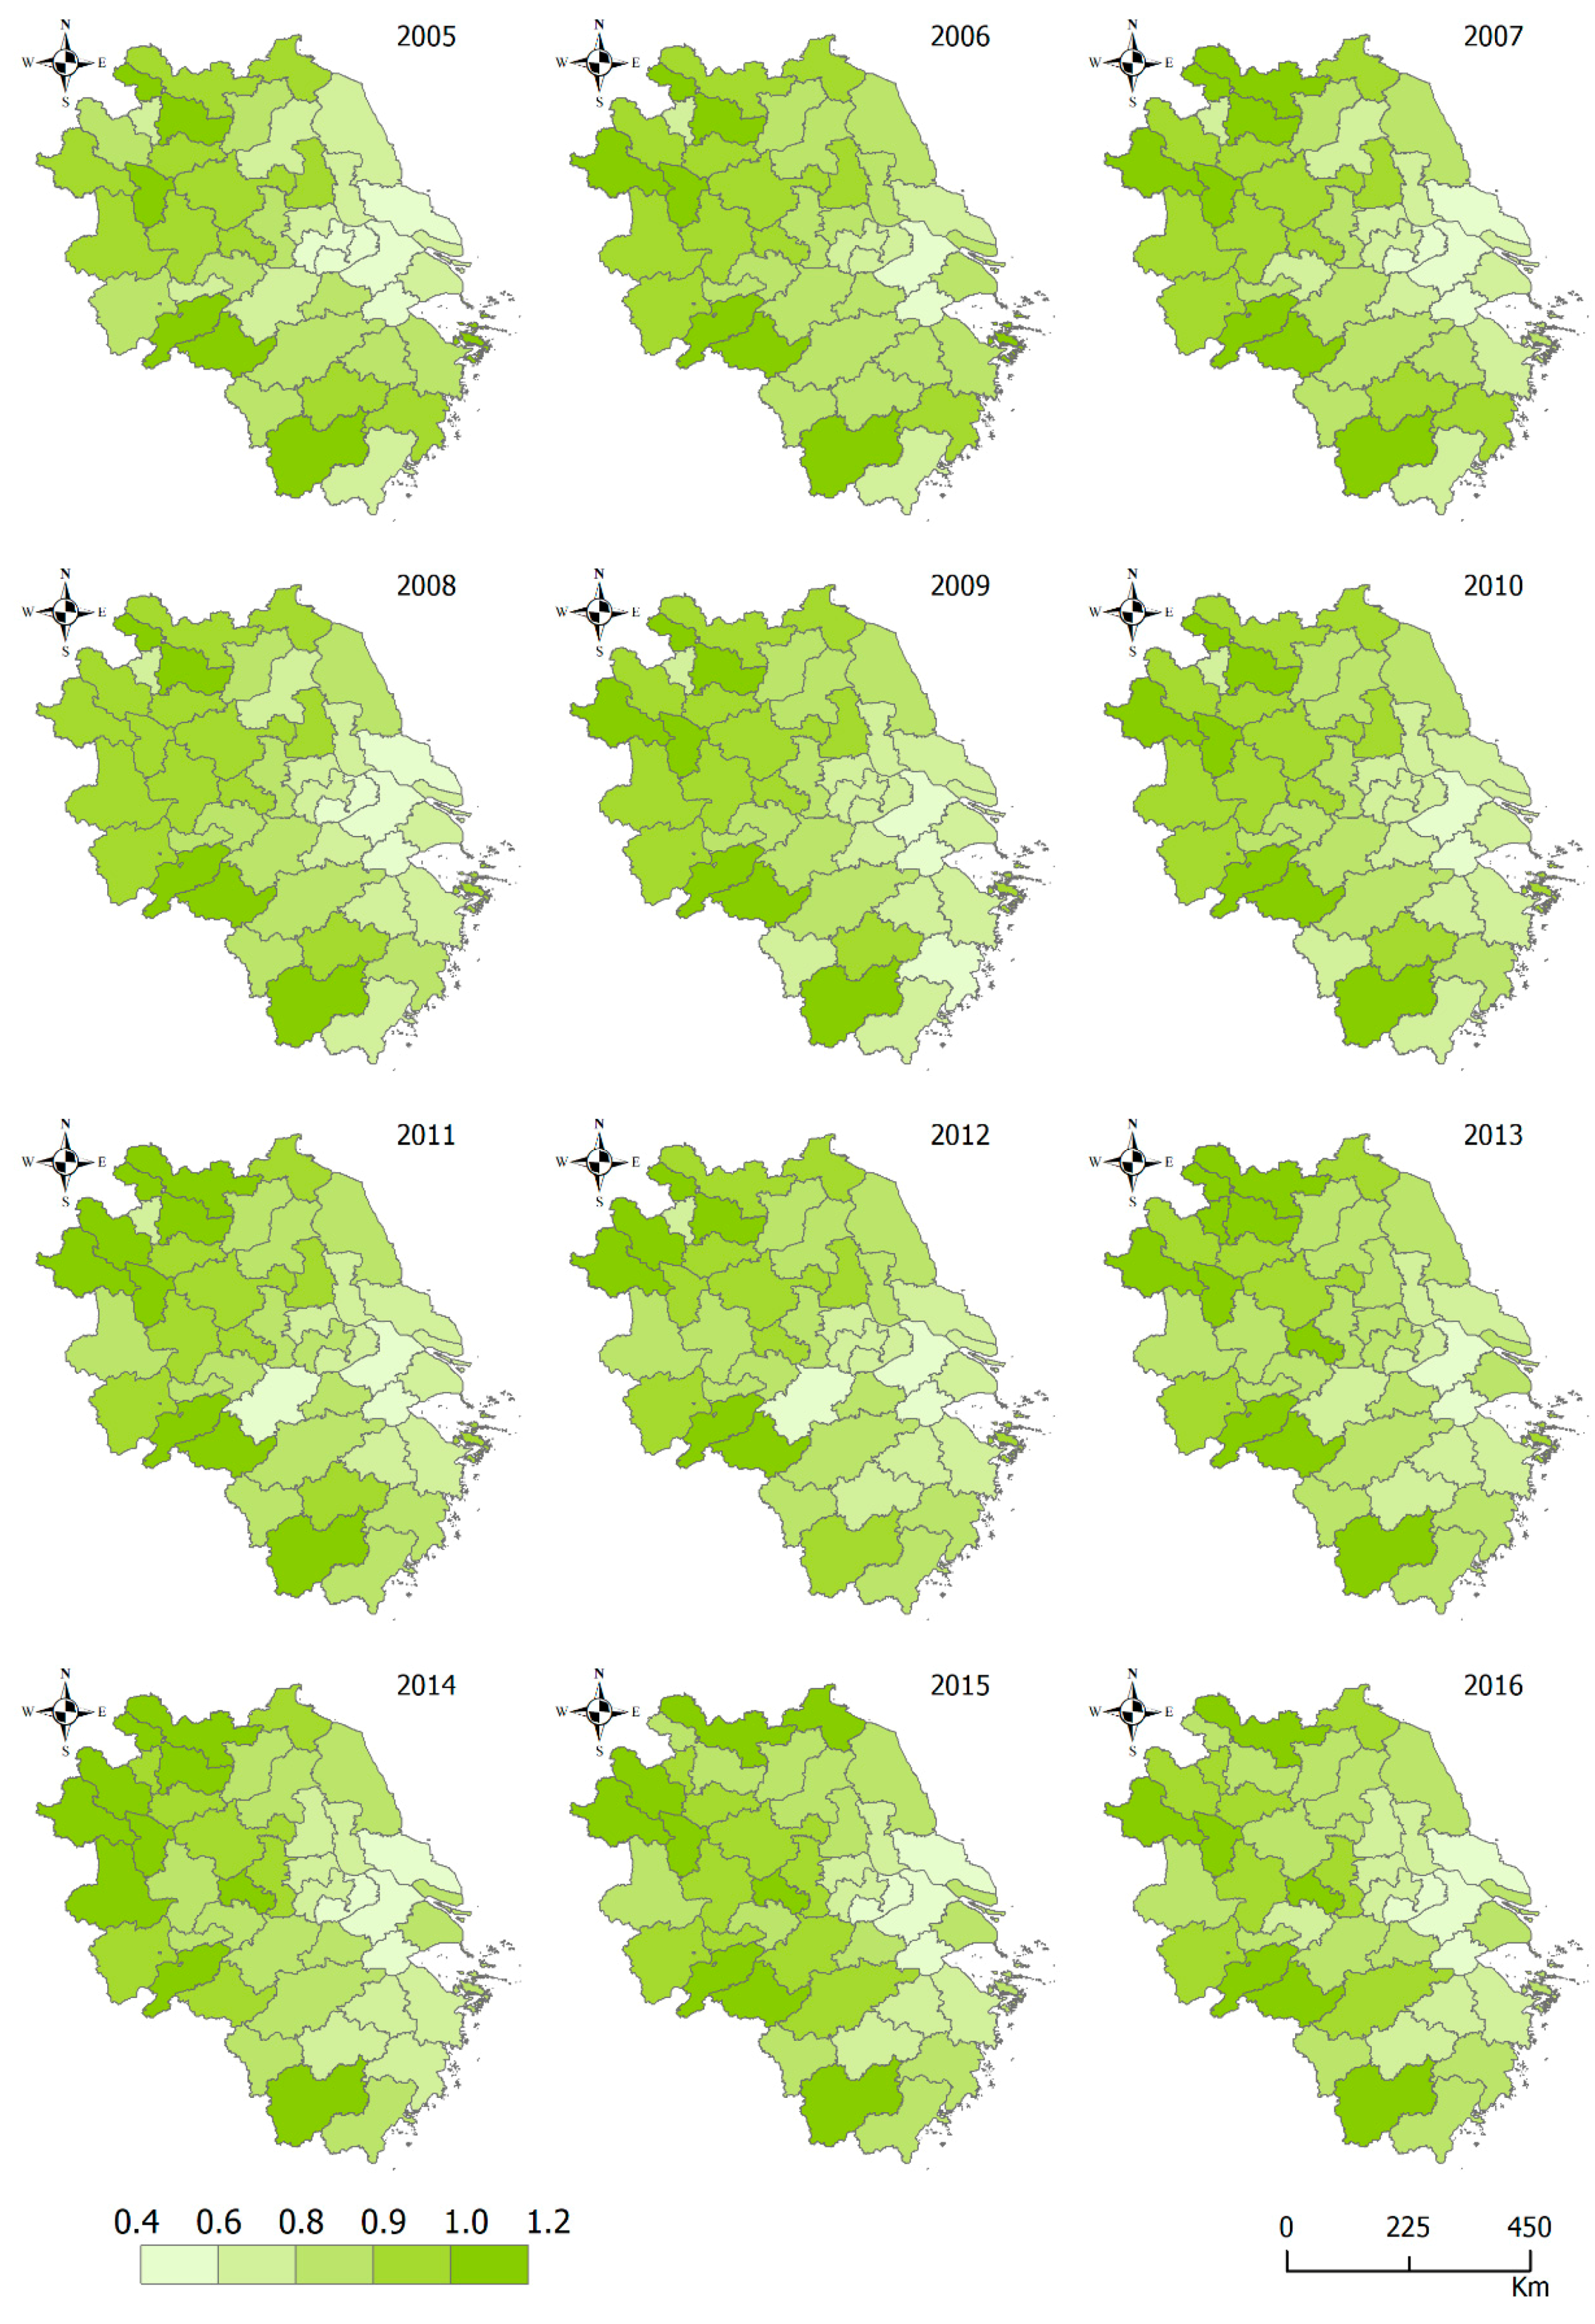
4.2.3. Spatiotemporal Distribution of RV
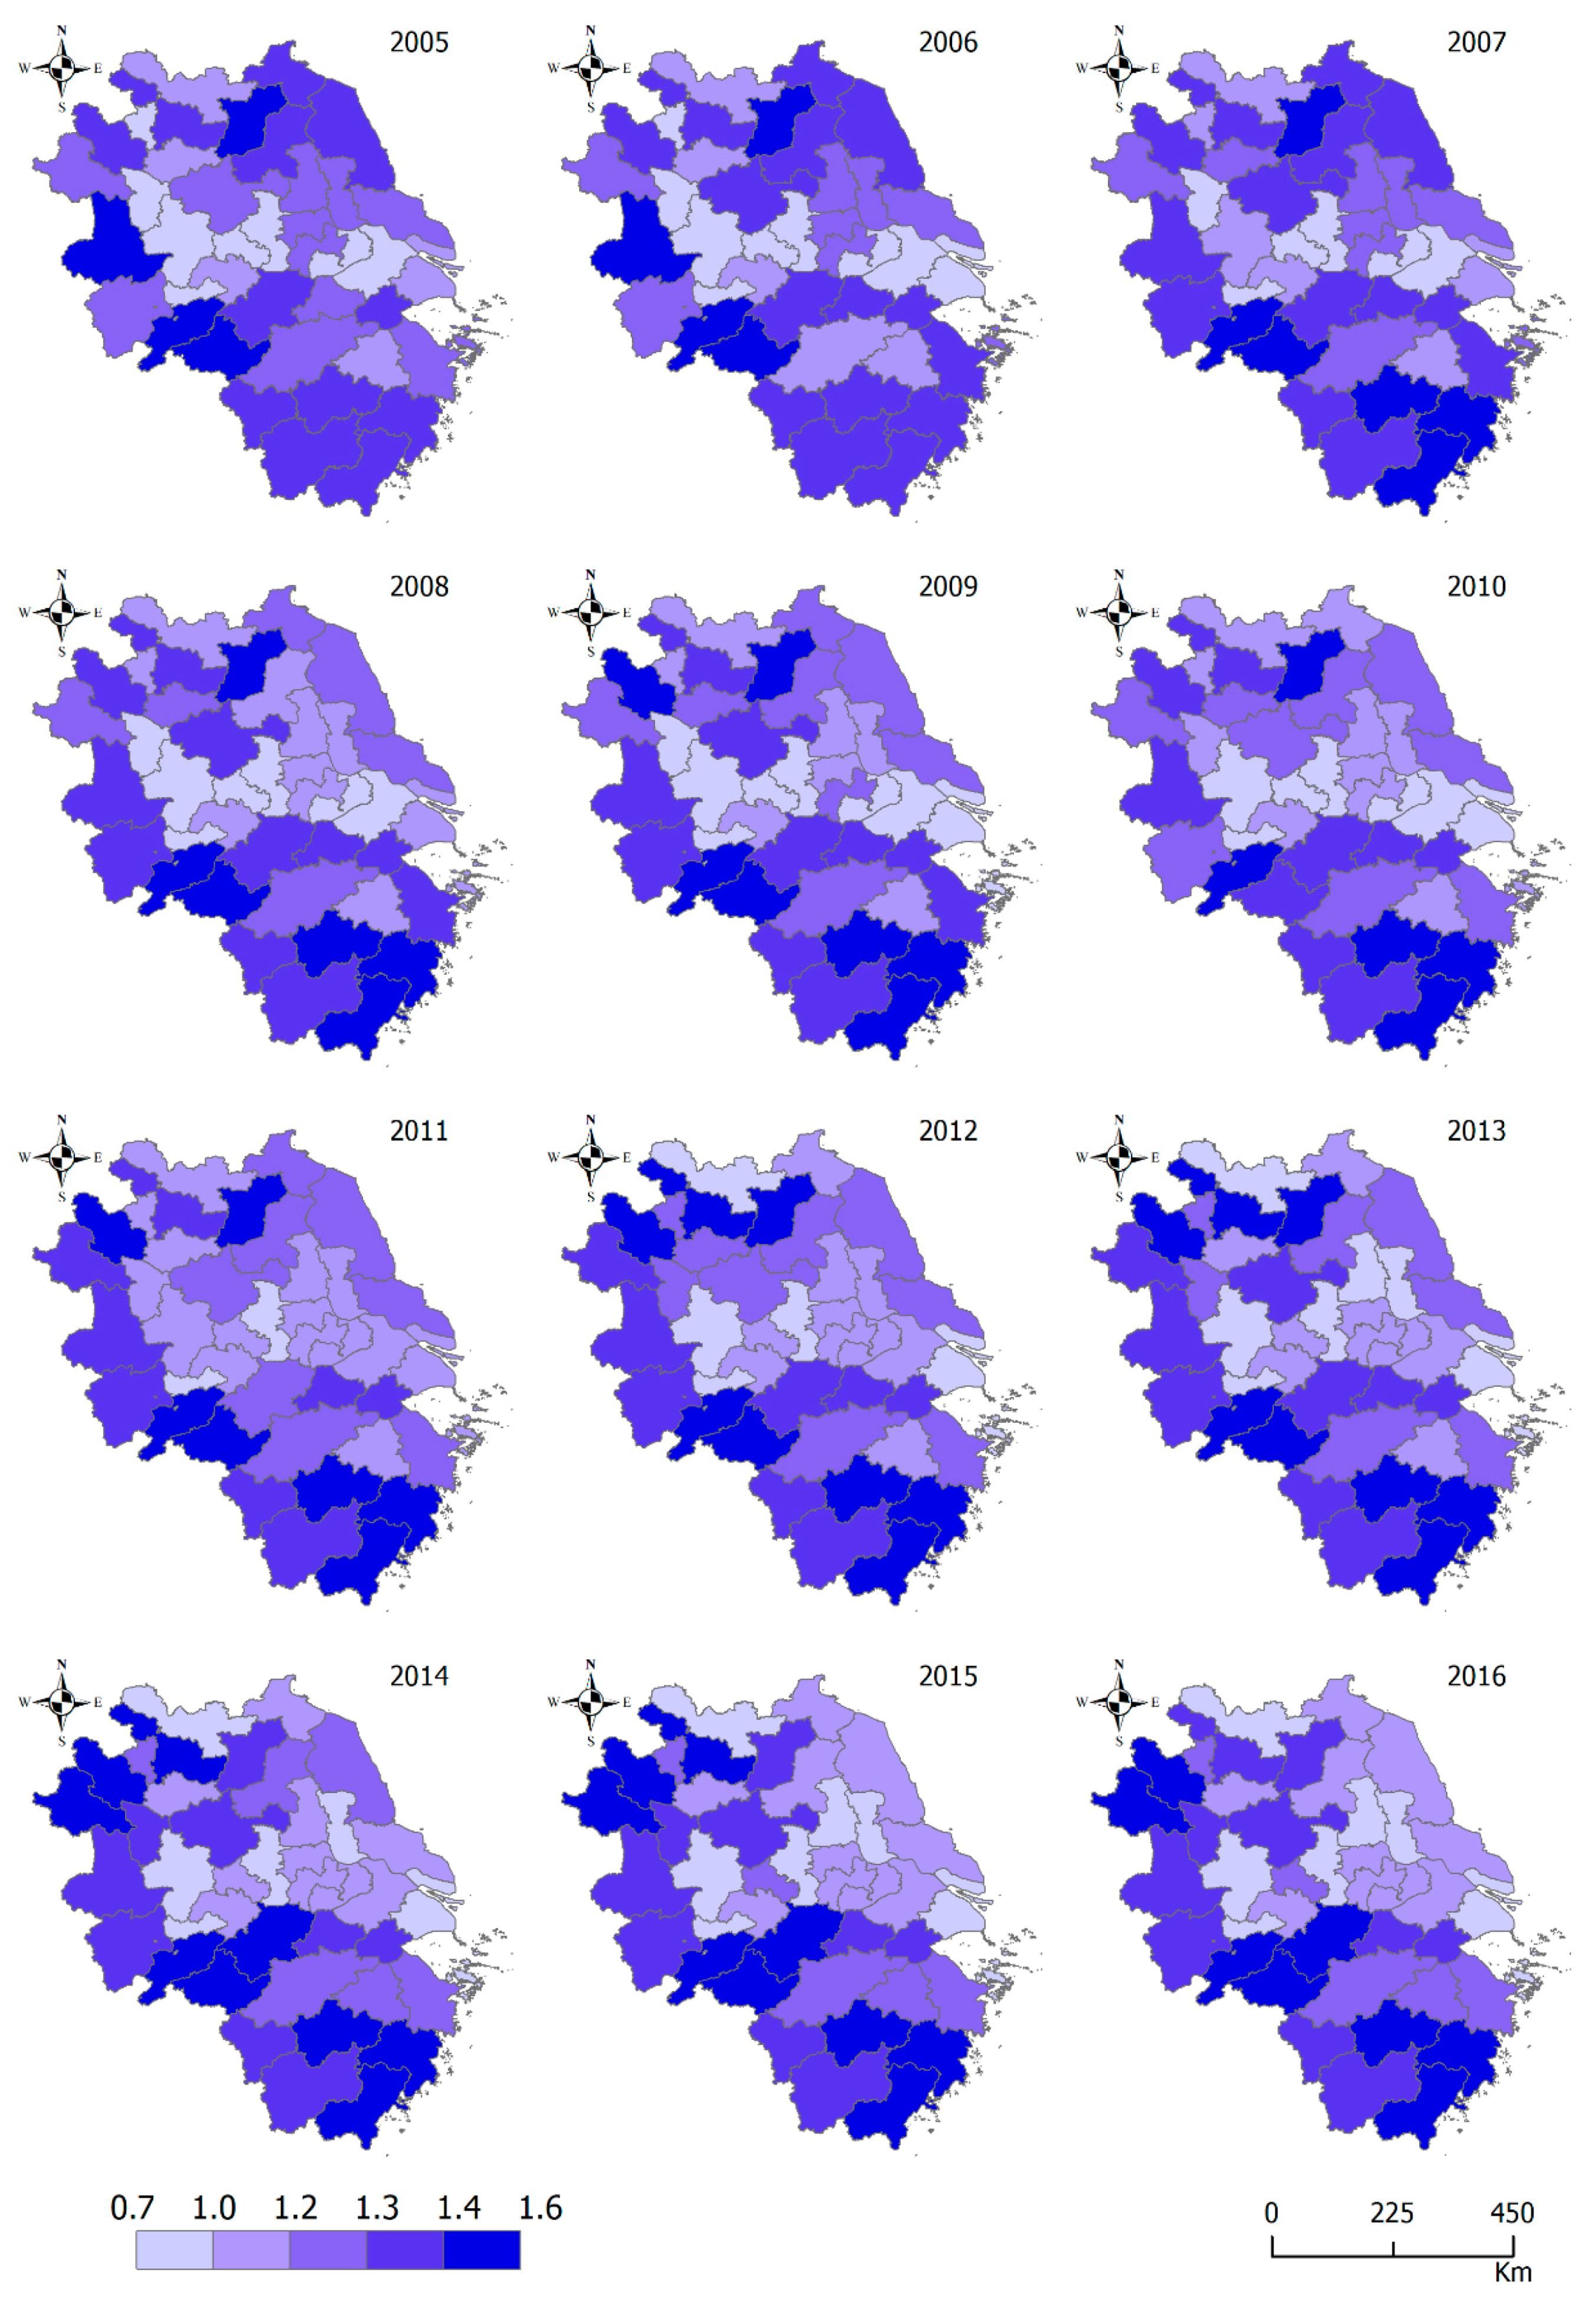
4.2.4. Spatiotemporal Distribution of Porter
4.3. Spatial Autocorrelation Analysis
4.4. Estimation Results of OLS and GTWR Model
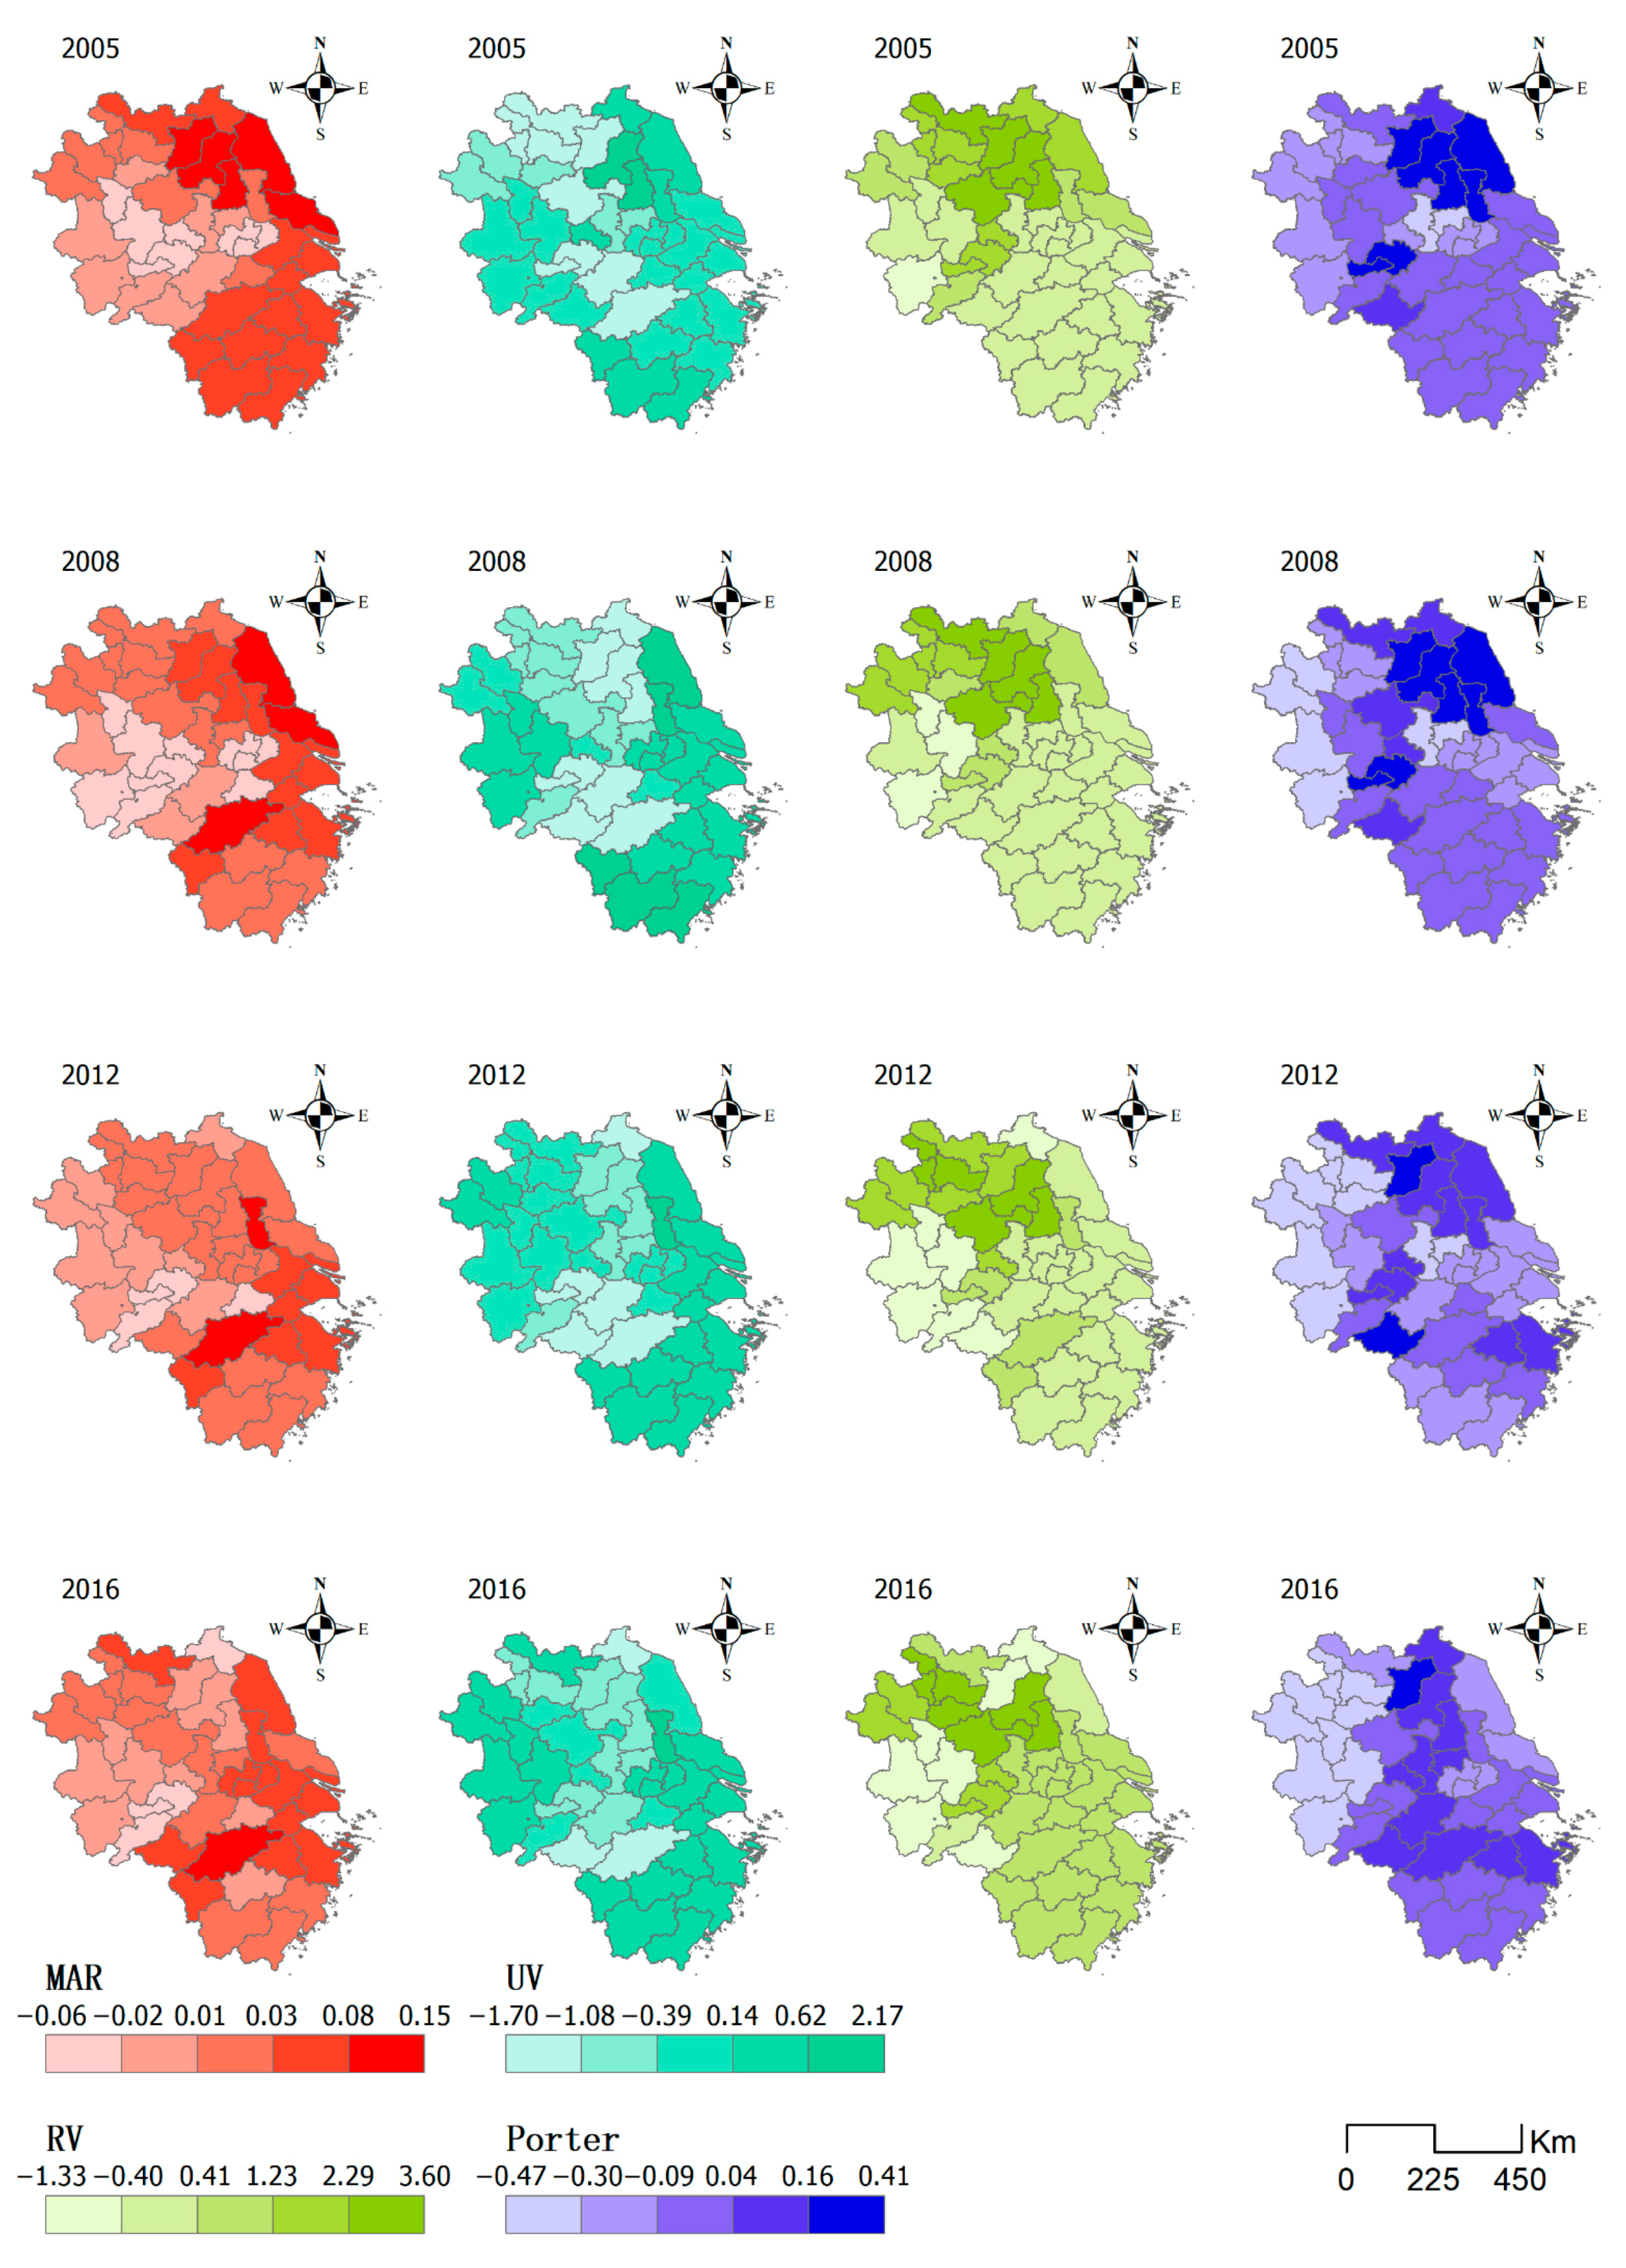
4.5. Spatiotemporal Impacts of Three Agglomeration Externalities on ULUE
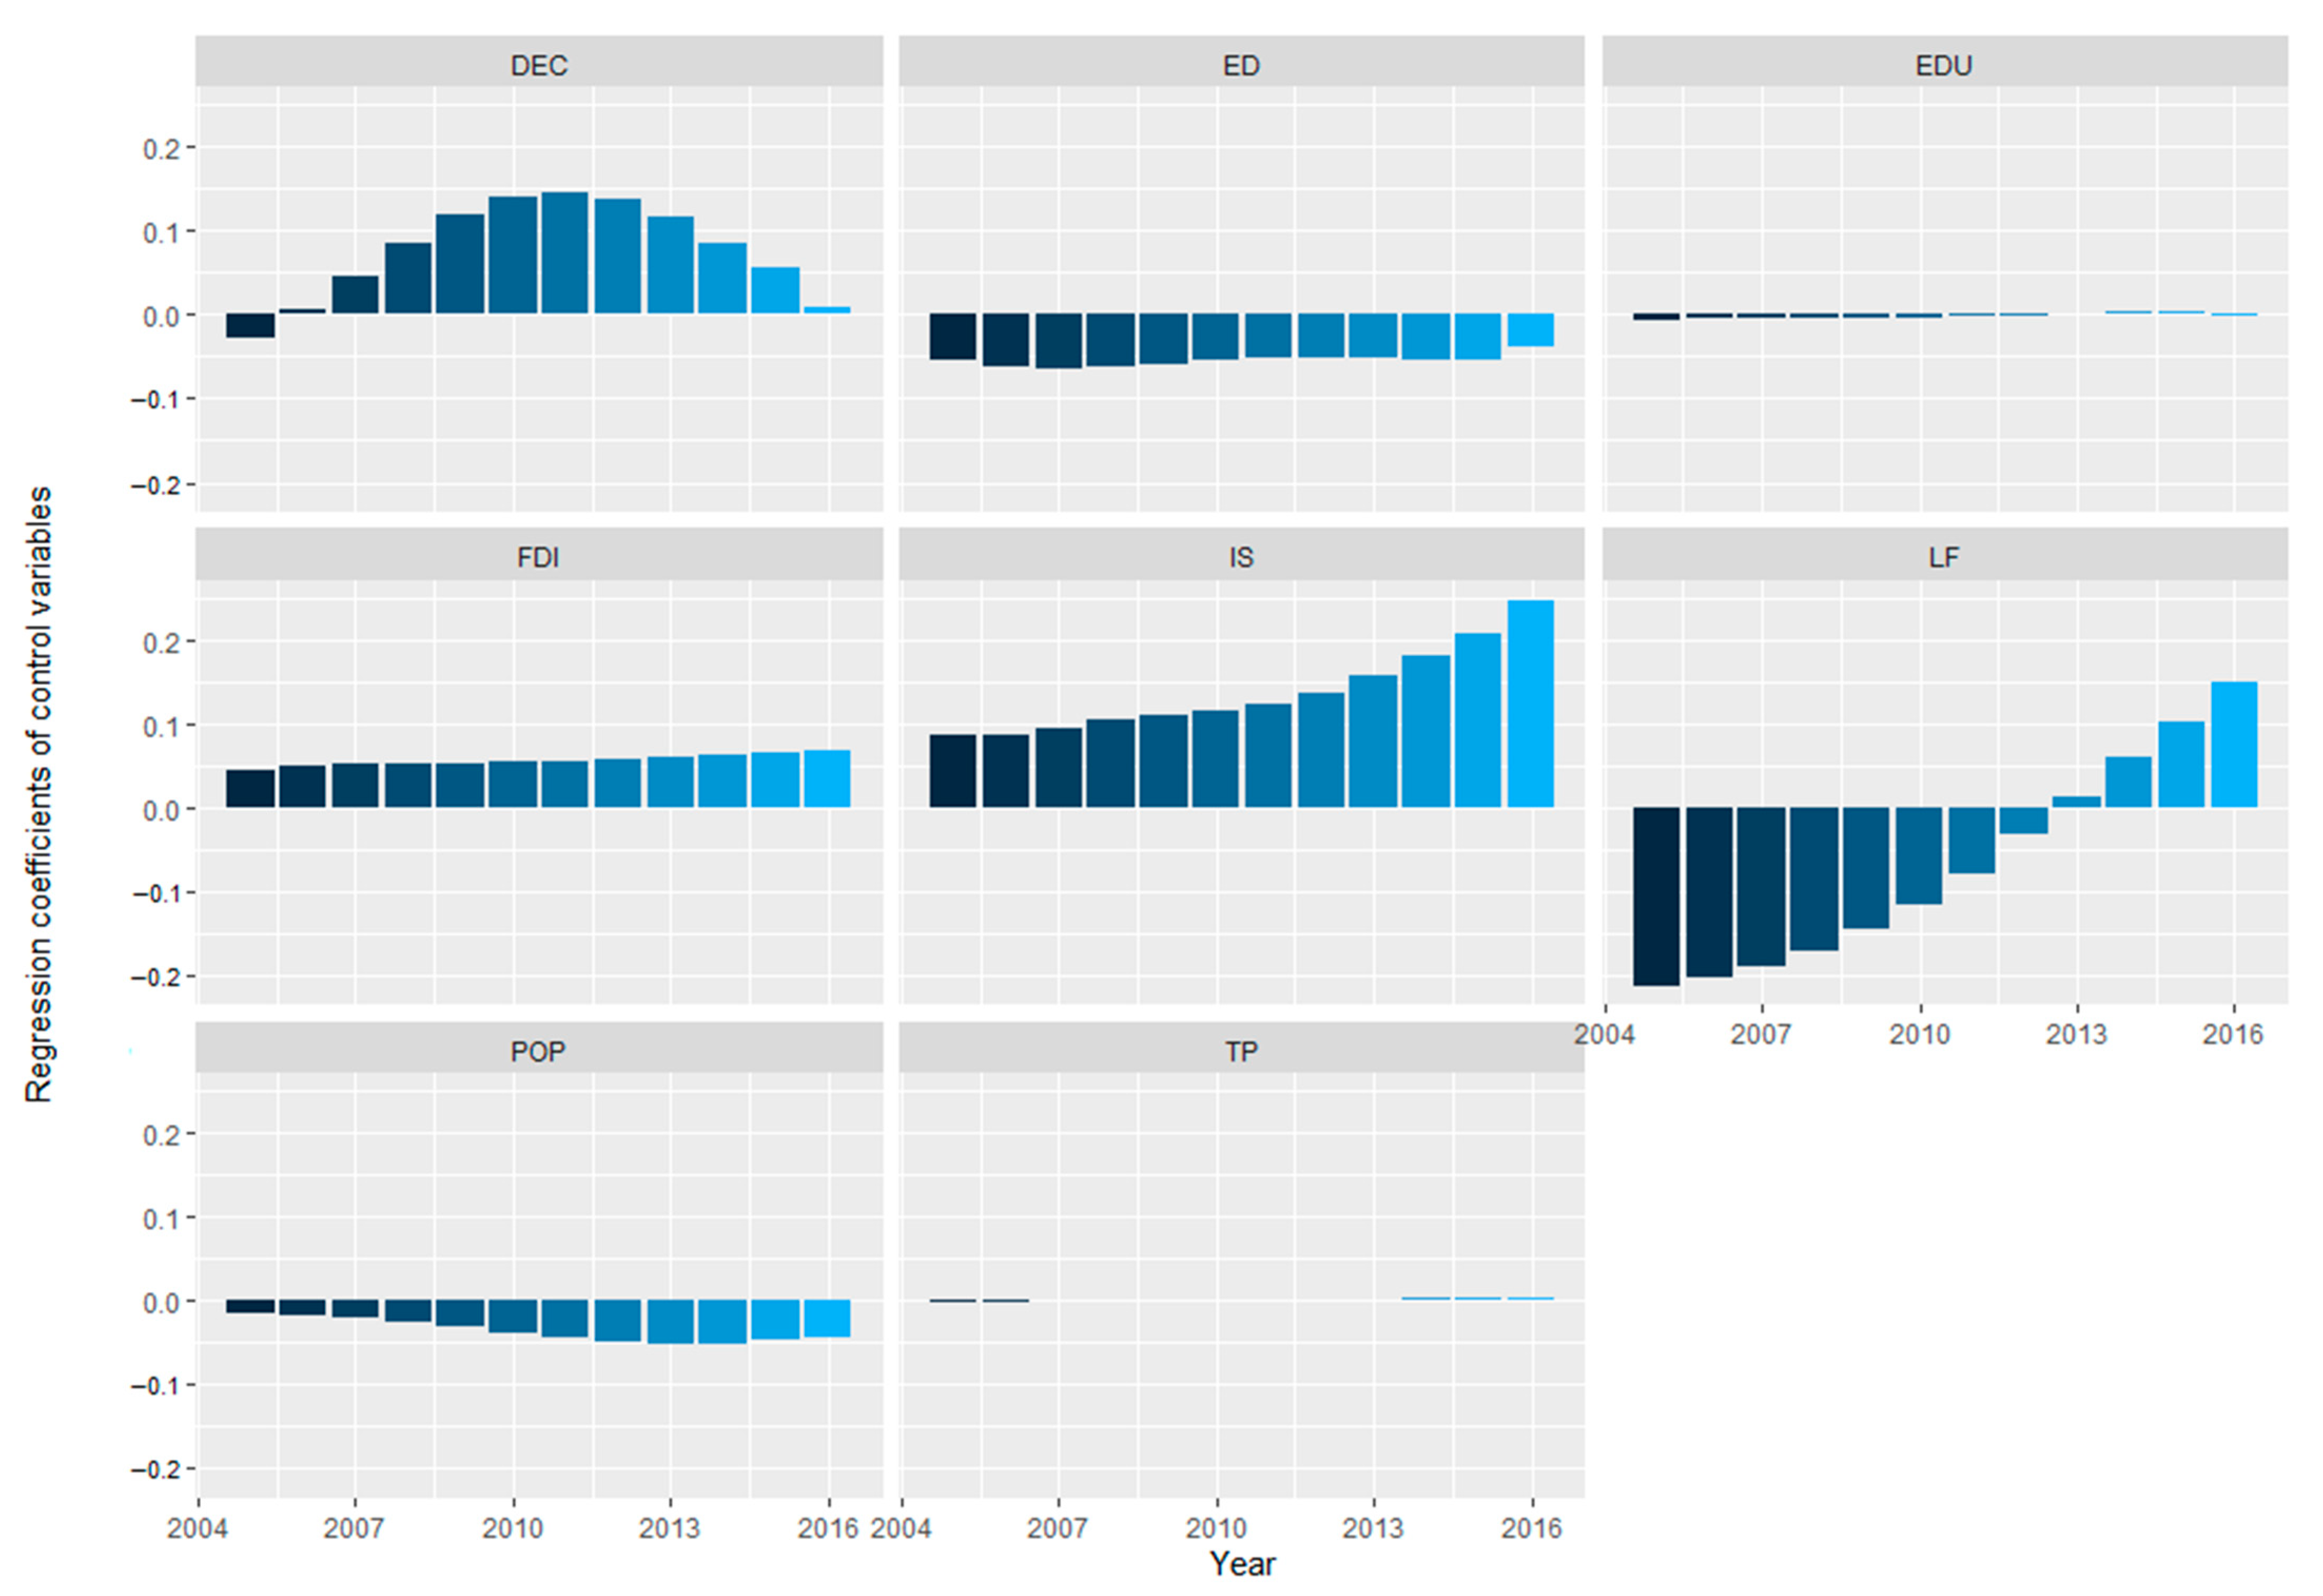
4.6. Impacts of the Control Variables on ULUE
5. Discussion
- (1)
- Selectively cultivating agglomeration externalities according to the status quo of local industries. Although agglomeration externalities have been proven by many scholars to be beneficial to urban development, not all agglomeration externalities can be beneficial to local economic activities. Specialization, diversity or competition externalities may not affect or even hinder the development of the city. For cities with incomplete infrastructure, it is still recommended to focus on cultivating some related industries, rather than advocating a balanced development of each industry.
- (2)
- Following the laws of industry cycle and giving support to enterprises in industrial transformation. Industrial transformation is still a trend within the Yangtze River Delta urban agglomeration, but in the process of industrial transformation, the environment faced by each economic subject will undergo drastic changes, and the agglomeration externalities that previously played an important role in urban development may become an obstacle to development. To this end, local governments need to provide subsidies to enterprises within their capacity to promote the smooth transformation of local enterprises.
- (3)
- Regulating market order and achieving healthy competition. Local governments should pay attention to the internal development of local enterprises and impose severe sanctions against monopolies, vicious competition and other behaviors that destroy the market environment, so as to guide the free flow of production factors and cultivate the international competitiveness of enterprises.
- (4)
- Looking to the future and purposefully cultivate diversified industries. Diversified industries help cities develop in the long run, but many cities do not have the resources to do so now. To this end, local governments should take a progressive reform approach on the basis of respecting basic economic laws and develop diversified industries with the purpose to lay a foundation for long-term urban development.
6. Conclusions
Author Contributions
Funding
Institutional Review Board Statement
Informed Consent Statement
Data Availability Statement
Conflicts of Interest
References
- Tu, F.; Yu, X.; Ruan, J. Industrial land use efficiency under government intervention: Evidence from Hangzhou, China. Habitat Int. 2014, 43, 1–10. [Google Scholar] [CrossRef]
- Zitti, M.; Ferrara, C.; Perini, L.; Carlucci, M.; Salvati, L. Long-Term Urban Growth and Land Use Efficiency in Southern Europe: Implications for Sustainable Land Management. Sustainability 2015, 7, 3359. [Google Scholar] [CrossRef] [Green Version]
- Masini, E.; Tomao, A.; Barbati, A.; Corona, P.; Serra, P.; Salvati, L. Urban Growth, Land-use Efficiency and Local Socioeconomic Context: A Comparative Analysis of 417 Metropolitan Regions in Europe. Environ. Manag. 2019, 63, 322–337. [Google Scholar] [CrossRef] [PubMed]
- Williams, N.S.; Schwartz, M.W.; Vesk, P.A.; McCarthy, M.A.; Hahs, A.K.; Clemants, S.E.; Corlett, R.T.; Duncan, R.P.; Norton, B.A.; Thompson, K. A conceptual framework for predicting the effects of urban environments on floras. J. Ecol. 2009, 97, 4–9. [Google Scholar] [CrossRef]
- Yu, S.; Zhu, Y.; Li, X. Trace metal contamination in urban soils of China. Sci. Total Environ. 2012, 421, 17–30. [Google Scholar]
- Maroušek, J.; Maroušková, A.; Zoubek, T.; Bartoš, P. Economic impacts of soil fertility degradation by traces of iron from drinking water treatment. Environ. Dev. Sustain. 2022, 24, 4835–4844. [Google Scholar] [CrossRef]
- Al-Mulali, U.; Fereidouni, H.G.; Lee, J.Y.; Sab, C.N.B.C. Exploring the relationship between urbanization, energy consumption, and CO2 emission in MENA countries. Renew. Sustain. Energy Rev. 2013, 23, 107–112. [Google Scholar] [CrossRef]
- Behera, S.R.; Dash, D.P. The effect of urbanization, energy consumption, and foreign direct investment on the carbon dioxide emission in the SSEA (South and Southeast Asian) region. Renew. Sustain. Energy Rev. 2017, 70, 96–106. [Google Scholar] [CrossRef]
- Zheng, S.; Shan, J.; Singh, R.P.; Wu, Y.; Pan, J.; Wang, Y.; Lichtfouse, E. High spatio-temporal heterogeneity of carbon footprints in the Zhejiang Province, China, from 2005 to 2015: Implications for climate change policies. Environ. Chem. Lett. 2020, 18, 931–939. [Google Scholar] [CrossRef]
- Deng, X.; Huang, J.; Scott, R.; Uchida, E. Economic Growth and the Expansion of Urban Land in China. Urban Stud. 2009, 47, 813–843. [Google Scholar] [CrossRef]
- Lichtenberg, E.; Ding, C. Local officials as land developers: Urban spatial expansion in China. J. Urban Econ. 2009, 66, 57–64. [Google Scholar] [CrossRef] [Green Version]
- Mariola, M.J. Losing ground: Farmland preservation, economic utilitarianism, and the erosion of the agrarian ideal. Agric. Hum. Values 2005, 22, 209–223. [Google Scholar] [CrossRef]
- Song, W.; Pijanowski, B.C. The effects of China’s cultivated land balance program on potential land productivity at a national scale. Appl. Geogr. 2014, 46, 158–170. [Google Scholar] [CrossRef]
- Yang, H.; Hu, Y.; Wang, Q. Evaluation of land use efficiency in three major urban agglomerations of China in 2001–2012. Sci. Geogr. Sin. 2015, 35, 1095–1100. (In Chinese) [Google Scholar]
- Zhu, X.; Li, Y.; Zhang, P.; Wei, Y.; Zheng, X.; Xie, L. Temporal–spatial characteristics of urban land use efficiency of China’s 35mega cities based on DEA: Decomposing technology and scale efficiency. Land Use Policy 2019, 88, 104083. [Google Scholar] [CrossRef]
- Wu, D.; Mao, H.; Zhang, X.; Huang, J. Assessment of Urban Land Use Efficiency in China. Acta Geogr. Sin. 2011, 66, 1111–1121. (In Chinese) [Google Scholar]
- Dye, C. Health and Urban Living. Science 2008, 319, 766–769. [Google Scholar] [CrossRef]
- Jenks, M.; Burton, E.; Williams, K. The Compact City: A Sustainable Urban Form? 1st ed.; Routledge: London, UK, 1996. [Google Scholar]
- Chourabi, H.; Nam, T.; Walker, S.; Gil-Garcia, J.R.; Mellouli, S.; Nahon, K.; Pardo, T.A.; Scholl, H.J. Understanding Smart Cities: An Integrative Framework. In Proceedings of the 2012 45th Hawaii International Conference on System Sciences, Maui, HI, USA, 4–7 January 2012; pp. 2289–2297. [Google Scholar]
- Guastella, G.; Pareglio, S.; Sckokai, P. A spatial econometric analysis of land use efficiency in large and small municipalities. Land Use Policy 2017, 63, 288–297. [Google Scholar] [CrossRef] [Green Version]
- Estoque, R.C.; Ooba, M.; Togawa, T.; Hijioka, Y.; Murayama, Y. Monitoring global land-use efficiency in the context of the UN 2030 Agenda for Sustainable Development. Habitat Int. 2021, 115, 102403. [Google Scholar] [CrossRef]
- Chakraborty, S.; Maity, I.; Dadashpoor, H.; Novotnẏ, J.; Banerji, S. Building in or out? Examining urban expansion patterns and land use efficiency across the global sample of 466 cities with million+ inhabitants. Habitat Int. 2022, 120, 102503. [Google Scholar] [CrossRef]
- Stull, W.J. Land Use and Zoning in an Urban Economy. Am. Econ. Rev. 1974, 64, 337–347. [Google Scholar]
- Wey, W.-M.; Hsu, J. New Urbanism and Smart Growth: Toward achieving a smart National Taipei University District. Habitat Int. 2014, 42, 164–174. [Google Scholar] [CrossRef]
- Färe, R.; Grosskopf, S. Modeling undesirable factors in efficiency evaluation: Comment. Eur. J. Oper. Res. 2004, 157, 242–245. [Google Scholar] [CrossRef]
- Aigner, D.; Lovell, C.A.K.; Schmidt, P. Formulation and estimation of stochastic frontier production function models. J. Econ. 1977, 6, 21–37. [Google Scholar] [CrossRef]
- Charnes, A.; Cooper, W.W.; Rhodes, E. Measuring the efficiency of decision making units. Eur. J. Oper. Res. 1978, 2, 429–444. [Google Scholar] [CrossRef]
- Reinhard, S.; Knox Lovell, C.A.; Thijssen, G.J. Environmental efficiency with multiple environmentally detrimental variables; estimated with SFA and DEA. Eur. J. Oper. Res. 2000, 121, 287–303. [Google Scholar] [CrossRef]
- Seto, K.C.; Fragkias, M.; Güneralp, B.; Reilly, M.K. A meta-analysis of global urban land expansion. PLoS ONE 2011, 6, e23777. [Google Scholar] [CrossRef] [PubMed]
- Needham, B.; Louw, E.; Metzemakers, P. An economic theory for industrial land policy. Land Use Policy 2013, 33, 227–234. [Google Scholar] [CrossRef]
- Barbosa, J.A.; Bragança, L.; Mateus, R. Assessment of land use efficiency using BSA tools: Development of a new index. J. Urban Plan. Dev. 2015, 141, 04014020. [Google Scholar] [CrossRef]
- Osman, T.; Divigalpitiya, P.; Arima, T. Driving factors of urban sprawl in Giza Governorate of Greater Cairo Metropolitan Region using AHP method. Land Use Policy 2016, 58, 21–31. [Google Scholar] [CrossRef]
- Wagner, J. Exports and productivity: A survey of the evidence from firm-level data. World Econ. 2007, 30, 60–82. [Google Scholar] [CrossRef] [Green Version]
- Schminke, A.; Van Biesebroeck, J. Using export market performance to evaluate regional preferential policies in China. Rev. World Econ. 2013, 149, 343–367. [Google Scholar] [CrossRef] [Green Version]
- He, C.; Zhu, S. Economic Transition and Industrial Restructuring in China: Structural Convergence or Divergence? Post-Communist Econ. 2007, 19, 317–342. [Google Scholar] [CrossRef]
- Huang, Z.; Wei, Y.D.; He, C.; Li, H. Urban land expansion under economic transition in China: A multi-level modeling analysis. Habitat Int. 2015, 47, 69–82. [Google Scholar] [CrossRef]
- Wu, C.; Wei, Y.D.; Huang, X.; Chen, B. Economic transition, spatial development and urban land use efficiency in the Yangtze River Delta, China. Habitat Int. 2017, 63, 67–78. [Google Scholar] [CrossRef]
- He, S.; Yu, S.; Li, G.; Zhang, J. Exploring the influence of urban form on land-use efficiency from a spatiotemporal heterogeneity perspective: Evidence from 336 Chinese cities. Land Use Policy 2020, 95, 104576. [Google Scholar] [CrossRef]
- Buckley, P.J.; Clegg, J.; Wang, C. The Impact of Inward FDI on the Performance of Chinese Manufacturing Firms. J. Int. Bus. Stud. 2002, 33, 637–655. [Google Scholar] [CrossRef]
- Ho, S.P.S.; Lin, G.C.S. Emerging Land Markets in Rural and Urban China: Policies and Practices. China Q. 2003, 175, 681–707. [Google Scholar] [CrossRef] [Green Version]
- Chen, Y.P. Land use rights, market transitions, and labour policy change in China (1980–84). Econ. Transit. Inst. Chang. 2012, 20, 705–743. [Google Scholar] [CrossRef]
- Zhu, J. The impact of industrial land use policy on industrial change. Land Use Policy 2000, 17, 21–28. [Google Scholar] [CrossRef]
- Wu, Y.; Zhang, X.; Skitmore, M.; Song, Y.; Hui, E.C.M. Industrial land price and its impact on urban growth: A Chinese case study. Land Use Policy 2014, 36, 199–209. [Google Scholar] [CrossRef] [Green Version]
- Liu, J.; Hou, X.; Wang, Z.; Shen, Y. Study the effect of industrial structure optimization on urban land-use efficiency in China. Land Use Policy 2021, 105, 105390. [Google Scholar] [CrossRef]
- López, E.; Monzón, A.; Ortega, E.; Quintana, S.M. Assessment of Cross-Border Spillover Effects of National Transport Infrastructure Plans: An Accessibility Approach. Transp. Rev. 2009, 29, 515–536. [Google Scholar] [CrossRef]
- Wei, Y.; Huang, C.; Lam, P.T.I.; Yuan, Z. Sustainable urban development: A review on urban carrying capacity assessment. Habitat Int. 2015, 46, 64–71. [Google Scholar] [CrossRef]
- Zhu, X.; Qian, T.; Wei, Y. Do high-speed railways accelerate urban land expansion in China? A study based on the multi-stage difference-in-differences model. Socio-Econ. Plan. Sci. 2020, 71, 100846. [Google Scholar] [CrossRef]
- Lu, X.; Chen, D.; Kuang, B.; Zhang, C.; Cheng, C. Is high-tech zone a policy trap or a growth drive? Insights from the perspective of urban land use efficiency. Land Use Policy 2020, 95, 104583. [Google Scholar] [CrossRef]
- Gong, Q.; Guo, G.; Li, S.; Liang, X. Examining the Coupling Coordinated Relationship between Urban Industrial Co-Agglomeration and Intensive Land Use. Land 2021, 10, 499. [Google Scholar] [CrossRef]
- Lall, S.V.; Shalizi, Z.; Deichmann, U. Agglomeration economies and productivity in Indian industry. J. Dev. Econ. 2004, 73, 643–673. [Google Scholar] [CrossRef] [Green Version]
- Devereux, M.P.; Griffith, R.; Simpson, H. The geographic distribution of production activity in the UK. Reg. Sci. Urban Econ. 2004, 34, 533–564. [Google Scholar] [CrossRef]
- Wen, M. Relocation and agglomeration of Chinese industry. J. Dev. Econ. 2004, 73, 329–347. [Google Scholar] [CrossRef] [Green Version]
- Ge, Y. Globalization and Industry Agglomeration in China. World Dev. 2009, 37, 550–559. [Google Scholar] [CrossRef]
- Sun, Y.; Ma, A.; Su, H.; Su, S.; Chen, F.; Wang, W.; Weng, M. Does the establishment of development zones really improve industrial land use efficiency? Implications for China’s high-quality development policy. Land Use Policy 2020, 90, 104265. [Google Scholar] [CrossRef]
- Liu, T.; Cao, G.; Yan, Y.; Wang, R.Y. Urban land marketization in China: Central policy, local initiative, and market mechanism. Land Use Policy 2016, 57, 265–276. [Google Scholar] [CrossRef]
- Glaeser, E.L.; Kallal, H.D.; Scheinkman, J.A.; Shleifer, A. Growth in Cities. J. Political Econ. 1992, 100, 1126–1152. [Google Scholar] [CrossRef]
- de Groot, H.L.F.; Poot, J.; Smit, M.J. Which Agglomeration Externalities Matter Most and Why? J. Econ. Surv. 2016, 30, 756–782. [Google Scholar] [CrossRef]
- Han, W.; Zhang, Y.; Cai, J.; Ma, E. Does Urban Industrial Agglomeration Lead to the Improvement of Land Use Efficiency in China? An Empirical Study from a Spatial Perspective. Sustainability 2019, 11, 986. [Google Scholar] [CrossRef] [Green Version]
- Dong, F.; Wang, Y.; Zheng, L.; Li, J.; Xie, S. Can industrial agglomeration promote pollution agglomeration? Evidence from China. J. Clean. Prod. 2020, 246, 118960. [Google Scholar] [CrossRef]
- Krugman, P. Geography and Trade; The MIT Press: Cambridge, MA, USA, 1992; Volume 59. [Google Scholar]
- Henderson, V. Externalities and Industrial Development. J. Urban Econ. 1997, 42, 449–470. [Google Scholar] [CrossRef] [Green Version]
- Arrow, K.J. The Economic Implications of Learning by Doing. In Readings in the Theory of Growth: A Selection of Papers from the Review of Economic Studies; Hahn, F.H., Ed.; Palgrave Macmillan: London, UK, 1971; pp. 131–149. [Google Scholar]
- Romer, P.M. Increasing Returns and Long-Run Growth. J. Political Econ. 1986, 94, 1002–1037. [Google Scholar] [CrossRef] [Green Version]
- Giddings, F.H. PRINCIPLES OF ECONOMICS. By Alfred Marshall, Professor of Political Economy in the University of Cambridge. MacMillan & Co., London and New York, 1890. Vol. I, pp. xxviii, 754. Ann. Am. Acad. Political Soc. Sci. 1986, 1, 332–337. [Google Scholar] [CrossRef] [Green Version]
- Jacobs, J. The economy of the cities. Natl. Civ. Rev. 1969, 58, 447–448. [Google Scholar] [CrossRef]
- Combes, P.-P. Economic Structure and Local Growth: France, 1984–1993. J. Urban Econ. 2000, 47, 329–355. [Google Scholar] [CrossRef]
- Duranton, G.; Puga, D. Chapter 8—Urban Land Use. In Handbook of Regional and Urban Economics; Duranton, G., Henderson, J.V., Strange, W.C., Eds.; Elsevier: Amsterdam, The Netherlands, 2015; Volume 5, pp. 467–560. [Google Scholar]
- Klein, A.; Crafts, N. Agglomeration externalities and productivity growth: US cities, 1880–1930. Econ. Hist. Rev. 2020, 73, 209–232. [Google Scholar] [CrossRef]
- Porter, M. The Competitive Advantage of Nations; Harvard Business School Publishing: Brighton, MA, USA, 1998. [Google Scholar]
- Ma, J.; Wang, J.; Szmedra, P. Economic Efficiency and Its Influencing Factors on Urban Agglomeration—An Analysis Based on China’s Top 10 Urban Agglomerations. Sustainability 2019, 11, 5380. [Google Scholar] [CrossRef] [Green Version]
- Robinson, J. Capitalism, Socialism and Democracy. Econ. J. 1943, 53, 381–383. [Google Scholar] [CrossRef] [Green Version]
- Aghion, P.; Griffith, R. Competition and Growth; Palgrave Macmillan: London, UK, 2005. [Google Scholar]
- Arnott, R. Congestion tolling with agglomeration externalities. J. Urban Econ. 2007, 62, 187–203. [Google Scholar] [CrossRef] [Green Version]
- Brülhart, M.; Mathys, N.A. Sectoral agglomeration economies in a panel of European regions. Reg. Sci. Urban Econ. 2008, 38, 348–362. [Google Scholar] [CrossRef] [Green Version]
- Tian, G.; Jiang, J.; Yang, Z.; Zhang, Y. The urban growth, size distribution and spatio-temporal dynamic pattern of the Yangtze River Delta megalopolitan region, China. Ecol. Model. 2011, 222, 865–878. [Google Scholar] [CrossRef]
- Shao, S.; Tian, Z.; Yang, L. High speed rail and urban service industry agglomeration: Evidence from China’s Yangtze River Delta region. J. Transp. Geogr. 2017, 64, 174–183. [Google Scholar] [CrossRef]
- Xiangming, C. A Tale of Two Regions in China: Rapid Economic Development and Slow Industrial Upgrading in the Pearl River and the Yangtze River Deltas. Int. J. Comp. Sociol. 2007, 48, 167–201. [Google Scholar] [CrossRef]
- Huang, B.; Wu, B.; Barry, M. Geographically and temporally weighted regression for modeling spatio-temporal variation in house prices. Int. J. Geogr. Inf. Sci. 2010, 24, 383–401. [Google Scholar] [CrossRef]
- Tone, K. A slacks-based measure of efficiency in data envelopment analysis. Eur. J. Oper. Res. 2001, 130, 498–509. [Google Scholar] [CrossRef] [Green Version]
- Browning, H.L.; Singelmann, J. The Transformation of the U.S. Labor Force: The Interaction of Industry and Occupation. Politics Soc. 1978, 8, 481–509. [Google Scholar] [CrossRef]
- Frenken, K.; Van Oort, F.; Verburg, T. Related Variety, Unrelated Variety and Regional Economic Growth. Reg. Stud. 2007, 41, 685–697. [Google Scholar] [CrossRef] [Green Version]
- Wu, S.; Li, S. The relationship between specialization, diversification and industrial growth: An empirical study based on Chinese provincial manufacturing panel data. Quant. Tech. Econ. Res. 2011, 28, 21–34. (In Chinese) [Google Scholar]
- Ye, C.; Zhu, J.; Li, S.; Yang, S.; Chen, M. Assessment and analysis of regional economic collaborative development within an urban agglomeration: Yangtze River Delta as a case study. Habitat Int. 2019, 83, 20–29. [Google Scholar] [CrossRef]
- Yew, C.P. Pseudo-Urbanization? Competitive government behavior and urban sprawl in China. J. Contemp. China 2012, 21, 281–298. [Google Scholar] [CrossRef]
- Neffke, F.; Henning, M.; Boschma, R.; Lundquist, K.-J.; Olander, L.-O. The Dynamics of Agglomeration Externalities along the Life Cycle of Industries. Reg. Stud. 2011, 45, 49–65. [Google Scholar] [CrossRef] [Green Version]
- Harvie, C. Economic transition: What can be learned from China’s experience. Int. J. Soc. Econ. 1999, 26, 1091–1123. [Google Scholar] [CrossRef] [Green Version]
- Wang, J. China’s consumer-goods manufacturing clusters, with reference to Wenzhou footwear cluster. Innovation 2006, 8, 160–170. [Google Scholar] [CrossRef]
- He, C.; Pan, F. Economic Transition, Dynamic Externalities and City-industry Growth in China. Urban Stud. 2009, 47, 121–144. [Google Scholar] [CrossRef]


| Composition of Indicator | Description | Unit | Sources | N | Mean | Max | Min | SD | |
|---|---|---|---|---|---|---|---|---|---|
| Inputs | Land | The area of urban built-up area | km2 | 492 | 191.6 | 2916 | 13 | 402.5 | |
| Capital | The gross investment in fixed assets | 10,000 yuan | 492 | 14,800,000.00 | 67,500,000.00 | 756,084.00 | 14,200,000.00 | ||
| Labor | The number of jobholders in secondary and tertiary sectors | 10,000 people | 492 | 68.98 | 724.9 | 6.24 | 90.46 | ||
| Outputs | Output value | Output value of secondary and tertiary sectors | 100 million yuan | 492 | 2458 | 28,069 | 84.55 | 3351 | |
| Road | The per capita urban road area | m2 | CHINA CITY STATISTICAL YEARBOOK | 492 | 12.78 | 37.95 | 1.43 | 5.957 | |
| Green area | The green ratio of a built-up area | % | China Urban Construction Statistical Yearbook | 492 | 39.67 | 49.78 | 14.18 | 5.176 | |
| Undesirable outputs | Wastewater | The volume of discharged industrial wastewater | 10,000 tons | 492 | 13,105 | 85,735 | 626 | 15,396 | |
| soot | The volume of discharged industrial soot emissions | tons | CHINA CITY STATISTICAL YEARBOOK | 492 | 55,654 | 496,377 | 1925 | 55,725 | |
| The volume of discharged industrial SO2 emissions | tons | 492 | 25,335 | 131,433 | 971 | 20,369 | |||
| Industry Categories | Specific Industries | |
|---|---|---|
| Primary industry | Agriculture, forestry, animal husbandry and fishery | |
| Secondary industry | Mining, manufacturing, electricity, gas and water production and supply and construction | |
| Tertiary industry | Producer Services | Finance, real estate, leasing and business services |
| Consumer Services | Accommodation and catering, residential and other services, culture, sports and entertainment | |
| Circulation Services | Transportation, warehousing and postal services, information transmission, computer services and software, wholesale and Retail | |
| Social Services | Scientific research and technical services, qualified exploration, water conservancy environment and public facilities management, education, health and social security and social welfare, public administration and social organizations | |
| Layer | Layer 2 | Variable | N | Mean | Max | Min | SD |
|---|---|---|---|---|---|---|---|
| Dependent variables | ULUE | 492 | 0.88 | 1.534 | 0.314 | 0.264 | |
| Independent variables | MAR | 492 | 4.526 | 46.06 | 1.255 | 5.958 | |
| UV | 492 | 1.199 | 1.558 | 0.667 | 0.181 | ||
| RV | 492 | 0.923 | 1.168 | 0.377 | 0.142 | ||
| Porter | 492 | 1.275 | 2.707 | 0.25 | 0.545 | ||
| Control variables | Globalization | FDI | 492 | 6.232 | 9.951 | 2.52 | 1.034 |
| Marketization | LF | 492 | 0.136 | 1.841 | 0.0022 | 0.206 | |
| Government behavior | DEC | 492 | 0.664 | 1.174 | 0.0686 | 0.245 | |
| Urbanization | POP | 492 | 7.694 | 9.149 | 5.226 | 0.535 | |
| IS | 492 | 0.831 | 2.339 | 0.313 | 0.254 | ||
| TP | 492 | 7.573 | 21.05 | 0.43 | 4.386 | ||
| ED | 492 | 10.54 | 11.7 | 9.318 | 0.461 | ||
| EDU | 492 | 10.84 | 13.63 | 7.445 | 1.102 |
| Year | Moran’s I | z | p-Value * |
|---|---|---|---|
| 2005 | −0.044 | −0.247 | 0.403 |
| 2006 | −0.034 | −0.115 | 0.454 |
| 2007 | −0.019 | 0.081 | 0.468 |
| 2008 | 0.066 | 1.193 | 0.116 |
| 2009 | −0.077 | −0.679 | 0.248 |
| 2010 | 0.090 * | 1.502 | 0.067 |
| 2011 | 0.183 ** | 2.703 | 0.003 |
| 2012 | 0.271 *** | 3.838 | 0.000 |
| 2013 | 0.076 * | 1.298 | 0.097 |
| 2014 | 0.348 *** | 4.833 | 0.000 |
| 2015 | 0.355 *** | 4.906 | 0.000 |
| 2016 | 0.257 *** | 3.638 | 0.000 |
| VARIABLES | OLS | GTWR | ||
|---|---|---|---|---|
| Coef. | Max | Min | Mean | |
| MAR | −0.012 *** | 0.1508711132 | −0.0607905963 | −0.0052732571 |
| UV | 0.227 ** | 2.1743913471 | −1.6965369279 | −0.2644367352 |
| RV | −0.179 | 3.6012901471 | −1.3257455998 | 0.4657644234 |
| Porter | −0.168 *** | 0.4097858984 | −0.4741365000 | −0.0058395606 |
| FDI | 0.047 *** | 0.3582414797 | −0.0915614750 | 0.0560940909 |
| LF | −0.037 | 2.0845341573 | −2.2141543222 | −0.0683669281 |
| DEC | −0.222 * | 2.1450094485 | −2.0230748214 | 0.0766327641 |
| POP | 0.043 | 0.4790694941 | −0.4903563348 | −0.0364431313 |
| IS | 0.296 *** | 1.4901585525 | −1.0841017332 | 0.1370764120 |
| TP | 0.002 | 0.0473856253 | −0.0255634035 | 0.0011525221 |
| ED | −0.101 *** | 0.2626034279 | −0.4263408446 | −0.0544773004 |
| EDU | −0.054 | 0.2802125440 | −0.3129669496 | −0.0019328456 |
| R2 | 0.186 | 0.804 | ||
| Bandwidth | - | 0.111311 | ||
| CV | - | 23.5291 |
Publisher’s Note: MDPI stays neutral with regard to jurisdictional claims in published maps and institutional affiliations. |
© 2022 by the authors. Licensee MDPI, Basel, Switzerland. This article is an open access article distributed under the terms and conditions of the Creative Commons Attribution (CC BY) license (https://creativecommons.org/licenses/by/4.0/).
Share and Cite
Hu, H.; Pan, L.; Jing, X.; Li, G.; Zhuo, Y.; Xu, Z.; Chen, Y.; Wang, X. The Spatiotemporal Non-Stationary Effect of Industrial Agglomeration on Urban Land Use Efficiency: A Case Study of Yangtze River Delta, China. Land 2022, 11, 755. https://0-doi-org.brum.beds.ac.uk/10.3390/land11050755
Hu H, Pan L, Jing X, Li G, Zhuo Y, Xu Z, Chen Y, Wang X. The Spatiotemporal Non-Stationary Effect of Industrial Agglomeration on Urban Land Use Efficiency: A Case Study of Yangtze River Delta, China. Land. 2022; 11(5):755. https://0-doi-org.brum.beds.ac.uk/10.3390/land11050755
Chicago/Turabian StyleHu, Hangang, Lisha Pan, Xin Jing, Guan Li, Yuefei Zhuo, Zhongguo Xu, Yang Chen, and Xueqi Wang. 2022. "The Spatiotemporal Non-Stationary Effect of Industrial Agglomeration on Urban Land Use Efficiency: A Case Study of Yangtze River Delta, China" Land 11, no. 5: 755. https://0-doi-org.brum.beds.ac.uk/10.3390/land11050755