
Impact of Ecological Compensation on Farmers’ Livelihood Strategies in Energy Development Regions in China: A Case Study of Yulin City


1
School of Geography and Planning, Ningxia University, Yinchuan 750021, China
2
School of Economics and Management, Northwest University, Xi’an 710127, China
*
Author to whom correspondence should be addressed.
Land 2022, 11(7), 965; https://0-doi-org.brum.beds.ac.uk/10.3390/land11070965
Submission received: 10 May 2022
/
Revised: 15 June 2022
/
Accepted: 16 June 2022
/
Published: 23 June 2022
(This article belongs to the Special Issue Land Consolidation and Rural Revitalization)
Abstract
:Ecological compensation affects farmers’ livelihoods, as well as sustainability and social equity. Yulin City is the core area of the energy “Golden Triangle” in China. The farmers livelihood strategy model was used to analyse data from a household survey and interviews with selected farmers. The paper analyses the current livelihood strategies of farmers and impact of ecological compensation from the perspective of participation and income. The results showed that: (1) the significant difference between the coal resource development and oil and gas resource development was agricultural planting. Migrant work and non-agricultural self-employment in the coal resource development region were higher than that of the oil and gas resource development region. (2) The income from agricultural planting in the coal resource development region was significantly lower than that of the oil and gas resource development region. The labour, non-agricultural self-employment, and transfer incomes were higher in the coal resource development region than that in the oil and gas resource development region. (3) Ecological compensation has a significant negative effect on participation and income from agricultural planting, as well as a positive effect on participation and income from non-agricultural self-employment. We have proposed measures to strengthen ecological compensation mechanisms and improve the farmers’ livelihoods, in order to inform decision-making and high-quality sustainable development in energy development region.
1. Introduction
Energy security is a strategic issue related to global sustainable development and regional economic and social development [1]. From a global perspective, energy demand is confronted with various uncertainties [2], such as the aftermath of COVID-19, which has had a substantial impact on the global energy system. China has become the world’s biggest energy producer and consumer [3,4]. With the abundance of coal, electricity, oil, natural gas, new energy resources, and renewable energy development, as well as significant improvements and advances in technology and equipment, productivity and living conditions have improved significantly. Although China has made great strides in energy development, it also faces many challenges, such as increased pressure on energy demand, many constraints on energy supply, outdated energy technology, and serious damage to the ecological environment, caused by energy production and consumption [5,6].
In the context of such development, locally and globally, in 2020, China announced the goal of carbon peak and carbon neutral, based on the inherent requirement of promoting sustainable development and responsibility of building a community with a shared future for humankind. The “dual carbon” target will have a significant impact on society and the economy. In particular, the energy development zones are key sources of carbon emissions and have become the focus, in order to achieve the “dual carbon” target in the future [7].
Currently, energy development in energy-rich areas has brought many benefits to local areas, such as increased investment, increased employment, and the development of extractive, transportation, and manufacturing industries. However, energy development also brings ecological impacts, resulting in the decline of groundwater levels, surface collapse, vegetation degradation, water pollution, and other problems [8]. As the conflict between human activities and the ecological environment increases, ecological compensation has become an important means to promote green and low-carbon development, promote the overall green transformation of economic and social development, and realise the harmonious coexistence between man and nature [9,10,11]. Most publications begin with a concept definition and explore ecological compensation mechanisms [12,13,14]. Comprehensive studies and discussions on ecological compensation have been undertaken from different perspectives, including an evaluation framework for the standard for watershed ecological compensation [15], forest ecological compensation [16,17], and ecological compensation in mining areas [18]. The studies assess the sustainability of these ecological compensation projects. Scholars have adopted the social network analysis and synthetic control methods, as well as other policy or event effect assessment methods, to evaluate the environmental benefits of ecological compensation [19,20] and quantify the economic impact [21] and poverty reduction effect [22].
In recent years, China’s ecological compensation projects aimed to achieve ecological restoration and targeted poverty alleviation [23,24]. Farmers are the main providers of ecosystem services and main participants of ecological compensation projects. Ecological compensation, as a comprehensive policy adjustment mechanism to solve livelihood and environmental problems, has a significant impact on farmers [25,26]. Research on ecological compensation has focused on the willingness of farmers to participate in the projects and impact on farmers’ production and lifestyle [27,28]. Some studies determine key factors that prompt farmers to participate in local ecological compensation projects [29,30] and how to stimulate farmers’ willingness to participate through effective incentive measures, such as cash compensation [31,32]. Other studies focus on the impact of participating in ecological compensation projects on farmers, mostly based on the changes in farmers’ income [33] or livelihood capital [34]. Most studies describe the overall characteristics of ecological compensation and analyse the impact of ecological compensation on local farmers, in terms of livelihood capital.
In summary, previous studies on the impact of ecological compensation on farmers’ livelihood mainly considered the impact of participation in ecological compensation projects but did not directly examine the direct impact on the farmers’ livelihood. In addition, ecological compensation research mostly focuses on household livelihood capital. However, in the framework of sustainable livelihoods, the change of livelihood capital is an intermediate link in the livelihood chain [35], and sustainable livelihoods require the reallocation of capital in other production activities. Therefore, analysis of the choices and changes of farmers’ livelihood strategies after the implementation of ecological compensation can better reflect the impact on farmers’ sustainable livelihoods.
Yulin City, as the core of the “golden triangle” area, is a typical energy and mineral resources enrichment area, with a fragile ecological environment and impoverished rural areas. Implementation of ecological compensation projects directly affects the local farmers’ livelihood capital and strategies, based on project sustainability and social equity. This paper constructs a livelihood strategy index system based on the sustainable livelihood framework for a typical energy and resources development zone (six counties in the north of Yulin). The results are used to assess farmers’ livelihood strategies, in terms of the rational decision-making mechanism behind farmers’ economic behaviour. The data obtained from the household survey were used to compare and analyse the current livelihood strategies of farmers in different energy development zones and counties. Then, the logistic regression and multiple linear regression models were used to quantitatively analyse the impact of ecological compensation on farmers’ livelihood strategies, from the perspective of livelihood activity participation and income. In addition, relevant policy proposals are put forward to strengthen the ecological compensation mechanism and improve the livelihoods of farmers, toward the realization of high-quality sustainable development in energy-rich areas.
2. Materials and Method
2.1. Study Area
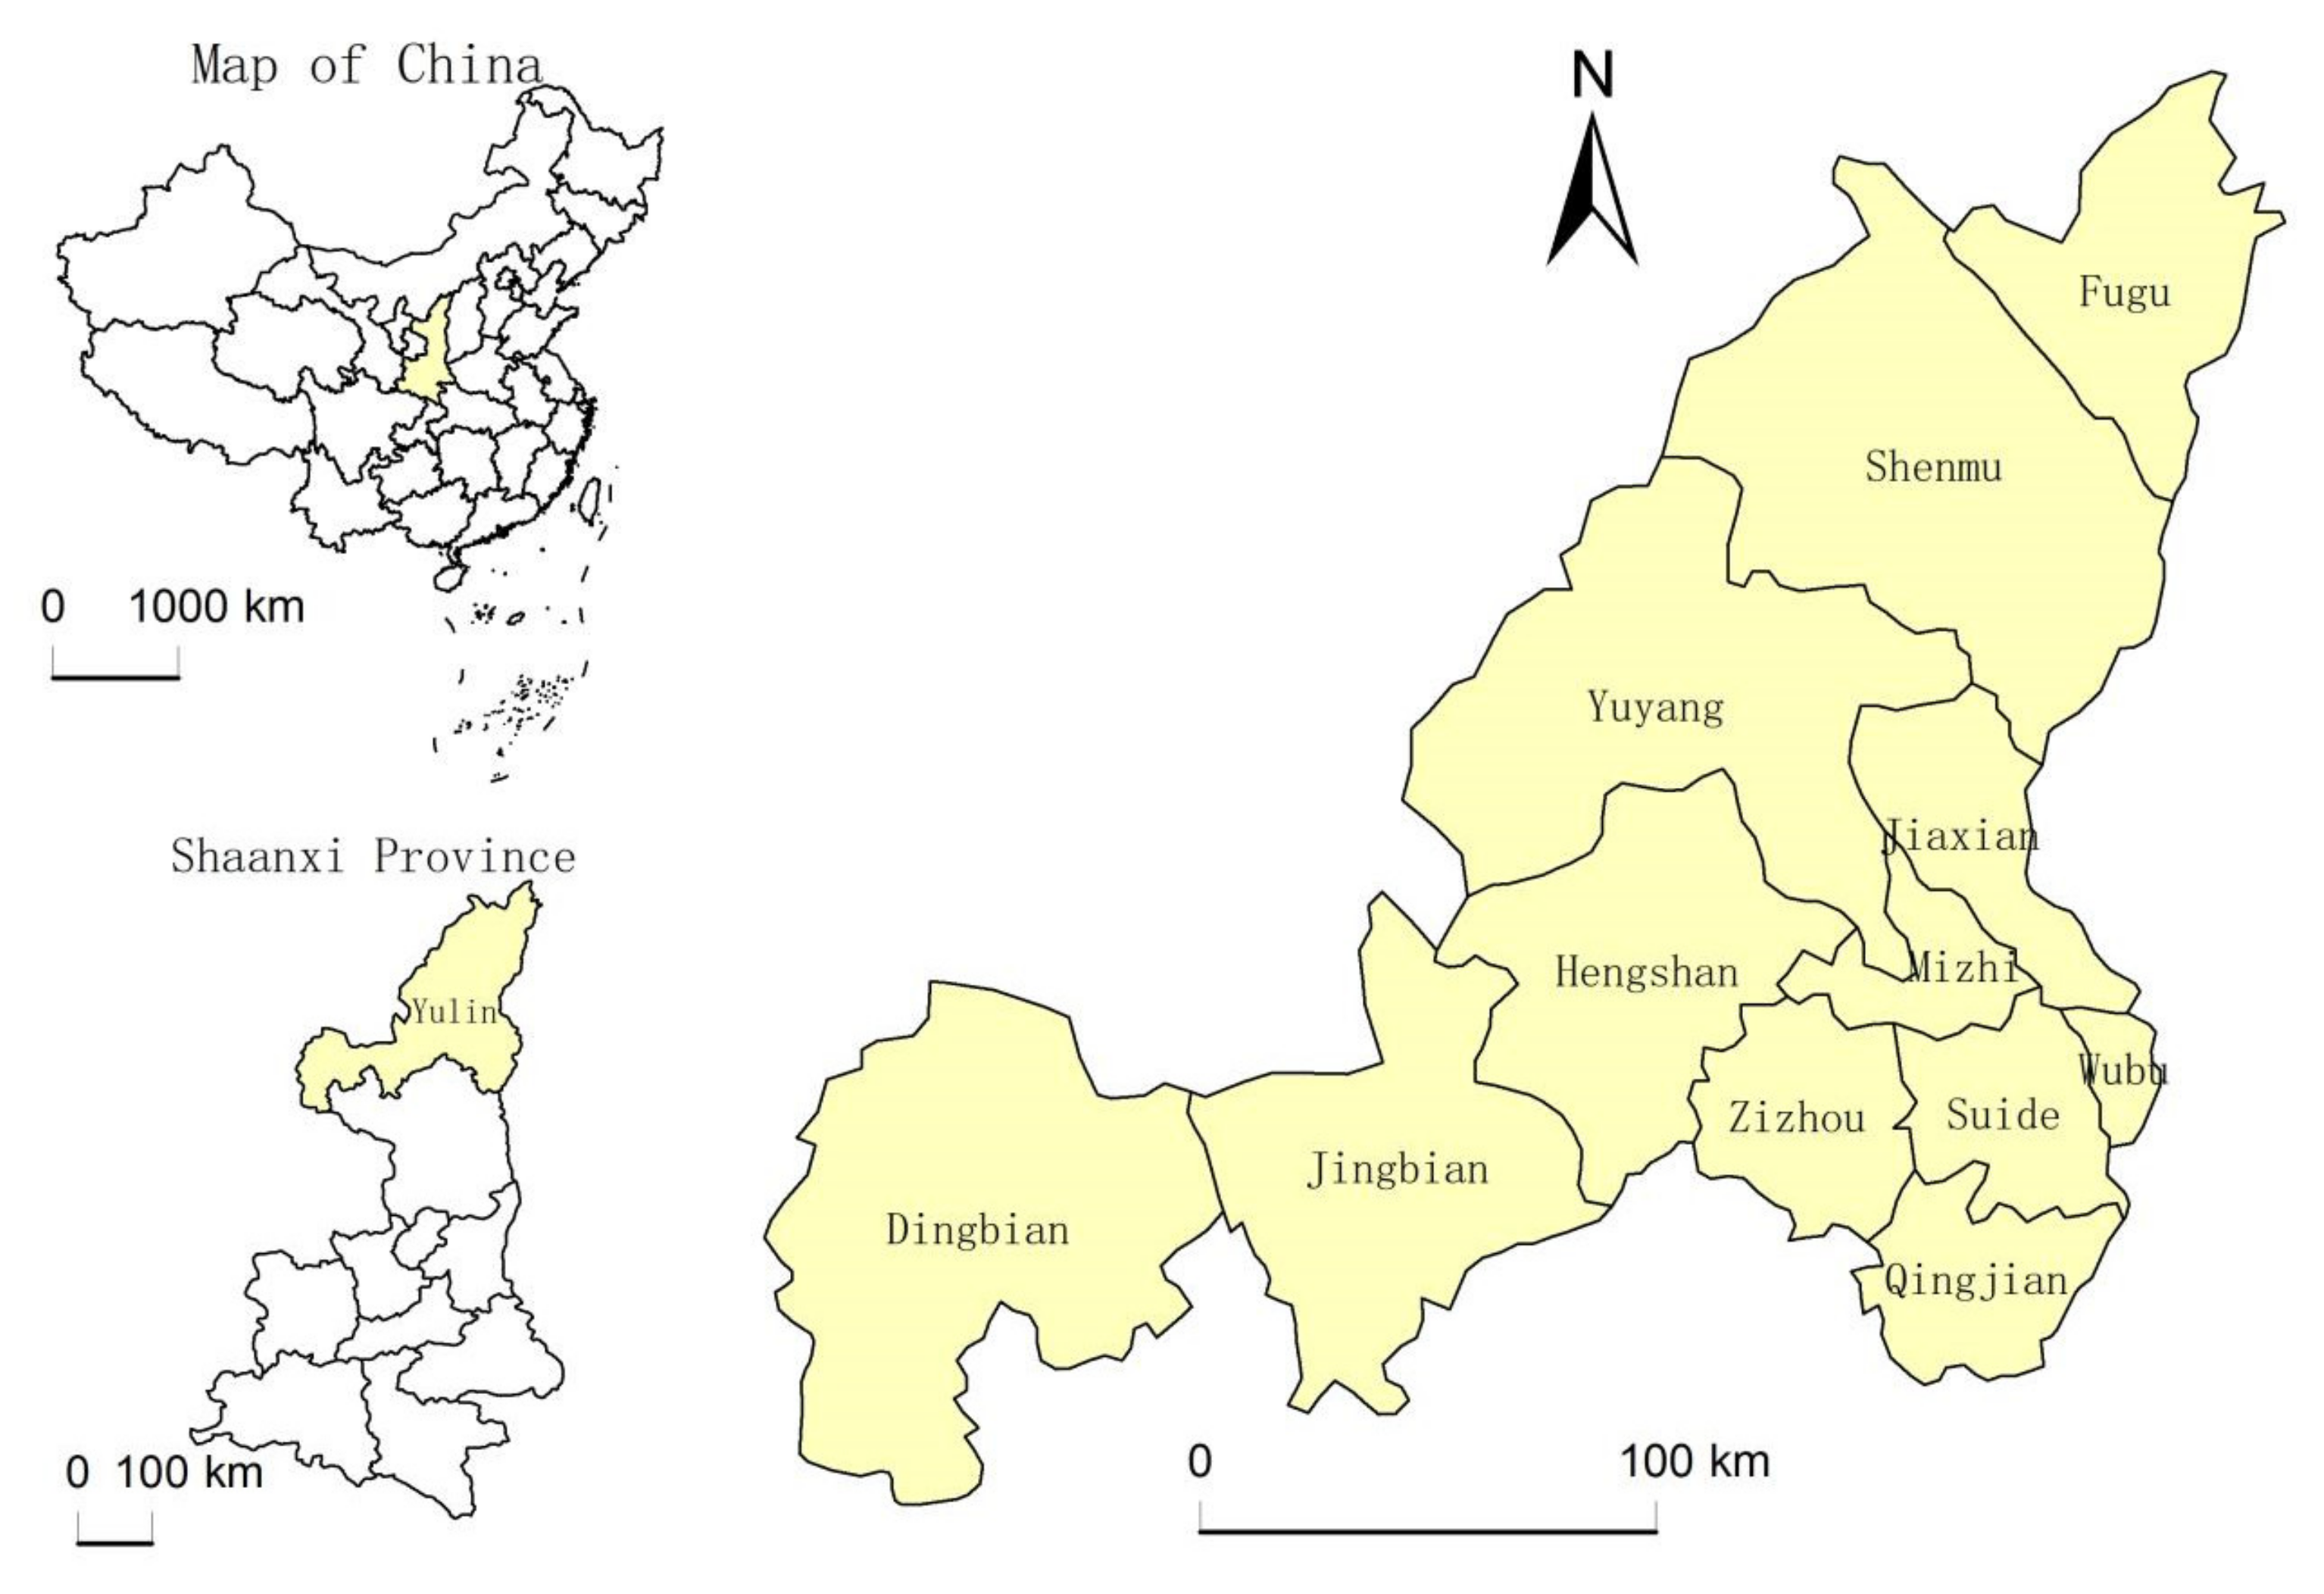
Yulin City is located in the northernmost part of Shaanxi Province, between 36°57′ to 39°34′ north latitude and 107°28′ to 111°15′ east longitude, at an altitude of 1907 m (Figure 1). It has an arid, semi-dry early continental monsoon climate. Yulin City borders Inner Mongolia in the north, Shanxi across the Yellow River in the east, and Ningxia and Gansu in the west; it is connected with Yan’An City in the south. Yulin City has abundant reserves of coal, oil, natural gas, rock salt, and other energy minerals, with 6.22 million tons of coal, 14,000 tons of oil, 100 million cubic meters of natural gas, and an average of 140 million tons of rock salt per square kilometre underground. The territory is wide in the east and narrow in the west, covering a total area of 43,578 km2, accounting for about 21% of the total area of Shaanxi Province. Yulin City has jurisdiction over 10 counties, 222 towns, and 5625 administrative villages. By the end of 2020, the total resident population of the city had reached 3,624,800 [36].
2.2. Data Source
The data relating to farmer households were obtained from a field survey of the study area in September 2016. Multi-stage stratified sampling was adopted to select two types of coal-, oil-, and gas-rich areas for typical county classification and typical village sampling; then, farmer households were sampled according to the 95% confidence interval. The participatory farmer evaluation method (PRA) was used to conduct a questionnaire survey on sample farmers in six counties (districts) in the north of Yulin City. A total of 510 questionnaires were distributed before and after the implementation of the ecological compensation projects, of which, 500 were collected, with an effective rate of 98.04%. Other macroeconomic data used in this paper were derived from the Yulin Statistical Yearbook and Yulin Statistical Bulletin of the National Economy.
2.3. Variable Selection
Ecological compensation projects are important initiatives in energy development zones [37]. The implementation of ecological compensation in Yulin, as well as the regional context, is the “double-edged sword” that affects the livelihood of local farmers. The implementation of enterprises’ compensation, government subsidies, and improvement in livelihoods enhance the capital accumulation of farmers but also have adverse effects. The compensation standards are generally based on compensation for land use and collapse. As such, farmers obtain compensation for the loss of land resources, and this loss of natural capital is the most important adverse impact. The ecology of the study area is fragile, and the change in natural capital affect the farmers’ livelihoods. The choice of livelihood strategy for farmers is crucial.
The strategy implies the interaction between the initiative and adaptability of farmers in the face of livelihood pattern changes caused by ecological compensation and rational decisions of families. According to Chamber and Conway’s definition [38], livelihood strategy is an action in which households choose to participate in different livelihood activities by virtue of their own resource elements and create the income level needed for survival. In this paper, livelihood strategy is defined as livelihood activity selection and associated income creation and reflects the impact of ecological compensation. The livelihood activities of farmers are divided into four categories: agricultural and forestry planting, animal husbandry, out-migrating for work, and non-agricultural self-employment. Among these, agricultural planting has always been the most important livelihood activity of farmers in the study area, while animal husbandry is an important auxiliary livelihood activity, both of which have a strong dependence on natural resources. Labour mobility has become an important demographic feature in China’s transition period, and the study area is no exception. In particular, due to pressure on natural resources, migrant work has become an important source of income for some local farmers. Non-agricultural self-employment has a certain capital or technical threshold, hindering access and participation by farmers.
Previous studies have shown that the livelihood capital status determines the livelihood strategy choice and type of non-agricultural activities adopted by farmers (Bhandari, 2013). Farmers have livelihood capital (including natural, financial, material, human, and social capital) and form livelihood capacity through resource allocation, the basis for response to the external environment and choice of livelihood strategies under ecological compensation.
Variables were set to assess the impact of ecological compensation on farmers’ livelihood strategies and combined with the actual situation of the study area. The dependent variables were divided into livelihood activity participation (Y1–Y4) and activity income (Y5–Y8), and the independent variables included ecological compensation (P) and livelihood capital (X) (Table 1 and Table 2).
Agricultural planting includes traditional food crops, such as corn, potatoes, and beans, as well as commercial forestry and fruit industries, such as jujube trees and apricots. Animal husbandry mainly refers to the raising of livestock for sale or domestic consumption, such as cattle, sheep, and pigs. Migrant work refers to household members working outside the farm for more than 3 months over a year, excluding where household registration changes due to work, schooling, marriage, military, or other factors. Off-farm local self-employment includes running shops, restaurants, repair shops, and individual transportation. Dependent variables include livelihood activity choice and income. The livelihood activity choice variables include “participation in agriculture”, “participation in livestock farming”, “if there were any migrant workers (Farmers who stopped farming and went to work)”, and “participation in the non-agricultural self-employment”, and they are virtual variables (=1 involved in the livelihood activity, not involved in the livelihood activity = 0). Income from livelihood activities is the proportion of income from various livelihood activities.
2.4. Model Construction
According to the sustainable livelihood framework and actual situation of the study area, the livelihood strategies of the sample farmers are affected by ecological compensation and livelihood capital. The livelihood results were obtained. Based on the actual survey data of the research area, the logistic regression model and general multiple linear regression model were selected for correlation analysis.
2.4.1. Logistic Regression Model
In the regression model, when the explained variables are dichotomous variables (e.g., livelihood strategy and livelihood result), the logistic regression model is usually used for research and analysis. The logistic regression model predicts the probability of occurrence or non-occurrence of the event. It can screen out the more significant factors affecting the occurrence, or not, of the event and, at the same time, eliminate the insignificant factors and generate regression coefficients for each significant factor [39,40]. Where P is the time occurrence probability and the value range is 0–1, then 1 − P is the probability of non-occurrence of the event. The econometric equation of the model is as follows:
The logistic function is a covariant nonlinear function. To obtain the regression coefficient, logit transformation is performed on Formula (1); that is, logarithm ln[P/(1 − P)] of the ratio P/(1 − P) is denoted as logit(P).
In Formula (3), the left side of the model is logit, which is the natural logarithm of the occurrence probability of events. Parameters β0, β1–β18 are the regression coefficients to be obtained. P and X are independent variables, X1–X3, X4–X6, X7–X9, X10–X13, and X14–X17 represent the farmers’ natural, physical, financial, human, and social capital, respectively. P is the ecological compensation policy variable, either “participation in ecological compensation (participation = 1)” or the continuous variable of “ecological compensation fund”. These variables were used to measure and analyse the impact of the implementation of ecological compensation policy on the farmers’ livelihoods.
2.4.2. General Multiple Linear Regression Model
In this study, continuous variables in livelihood strategies were taken as explained variables, and the livelihood capital and ecological compensation measures of farmers were taken as explanatory variables (livelihood capital as control variables, exogenous variables as ecological compensation policies and measures). The general multiple linear regression model was used to analyse the influence of the ecological compensation policy on the explained variables under the control of household livelihood capital and other factors. The established model equation is as follows:
In Formula (4), I represents each farm household sample, β1–β18 represents the coefficient to be determined, and β0 represents the intercept term. Yi represents the explained variable, including the continuous variable in the livelihood activity and income index of the livelihood activity to be studied; P and X are explanatory variables. X1–X3, X4–X6, X7–X9, X10–X13, and X14–X17, respectively, represent the variables of farmers’ natural, physical, financial, human, and social capital, respectively. P is the ecological compensation policy variable, either the dichotomous variable “whether to participate in ecological compensation (participation = 1)” or continuous variable “ecological compensation fund”. is a random interference term, indicating all other factors that may affect the explained variable that are not included in the model.
When the dependent variable is “participation in livelihood activities” (Y1, Y2, Y3, Y4, dichotomous variables), the logistic regression model was used to conduct regression analysis on the relevant data of the sample farmers. When the dependent variable is “income from livelihood activities” (Y5, Y6, Y7, Y8, continuous variables), the general multiple linear regression model was adopted. For each dependent variable Yi, two models were fitted, respectively. The ecological compensation variable P in the independent variables of the two models needs to be changed. The ecological compensation variable in model 1 is “whether to participate in ecological compensation”, and the independent variable group is P1 and X1–X17. In model 2, the variable of ecological compensation is “per capita ecological compensation fund”, and the independent variable group is P2 and X1–X17. During the regression model fitting process, correlation tests were carried out on the model.
3. Results and Analysis
3.1. Sample Characteristics
The sample survey involved 24 administrative villages of 12 towns in 6 counties (districts). The types of ecological compensation were government, local enterprises, and the combination of enterprises and government. The compensation methods included cash, policy, material, and technical compensation. The farmers in the study area were divided into the coal resource and oil and gas resource development zones. The ratio of male to female farmers participating in the survey was 56.87:43.13. The dominant age group was 51–60 years old, accounting for 41.4%, and those over 60 years old accounted for 25.2%. The proportions of households headed by 41–50 and 31–40 year olds were 18.6% and 11.2%, respectively. Households headed by persons under 30 years of age accounted for the smallest proportion, only 3.6% (Table 3). The educational level of household heads was mainly in primary school and below, accounting for 47.4%, with junior high school followed by 172 households, accounting for 34.4%. The proportion of high school education was 13%, with college education or above being the lowest, with only 26 households, accounting for 5.2%. Most of the 231 households were farmers, accounting for 46.2%. The second category was migrant workers, accounting for 33.2%. Self-employed households were the lowest, accounting for 20.6%.
3.2. Selection of Livelihood Activities
There are significant differences between the participation of farmers in livelihood activities in the coal resource and oil and gas resource development zones (Table 4), especially in agricultural planting. The proportion of farmers participating in agricultural and forestry planting in the oil and gas resource development zones reached 71%, significantly higher than that of the coal resource development zones (34%). In terms of non-agricultural self-employment, the degree of participation in the coal resource development zones was significantly higher than that of oil and gas resource development zones, at 37.5% and 22%, respectively. There was a marginal difference in the degree of participation in animal husbandry and migrant work between the coal and oil and gas resource development zones. Land collapse and soil pollution caused by coal resource development can seriously affect farmers and cause them to change their livelihood activity. Farmer households that cannot maintain or improve their livelihood by relying on the original land resources turn to non-agricultural self-employment by going out for work or using compensation funds. The exploitation of oil and gas resources occurs through drilling wells, which occupy less farming land, enabling planting and breeding activities to continue. Traditional agricultural production remains the dominant activity, and the proportion of non-agricultural self-employment is small. Therefore, farmers in the oil and gas resource development zones are more engaged in agricultural business activities, while farmers in the coal resource development zones are more likely to choose non-agricultural livelihoods.
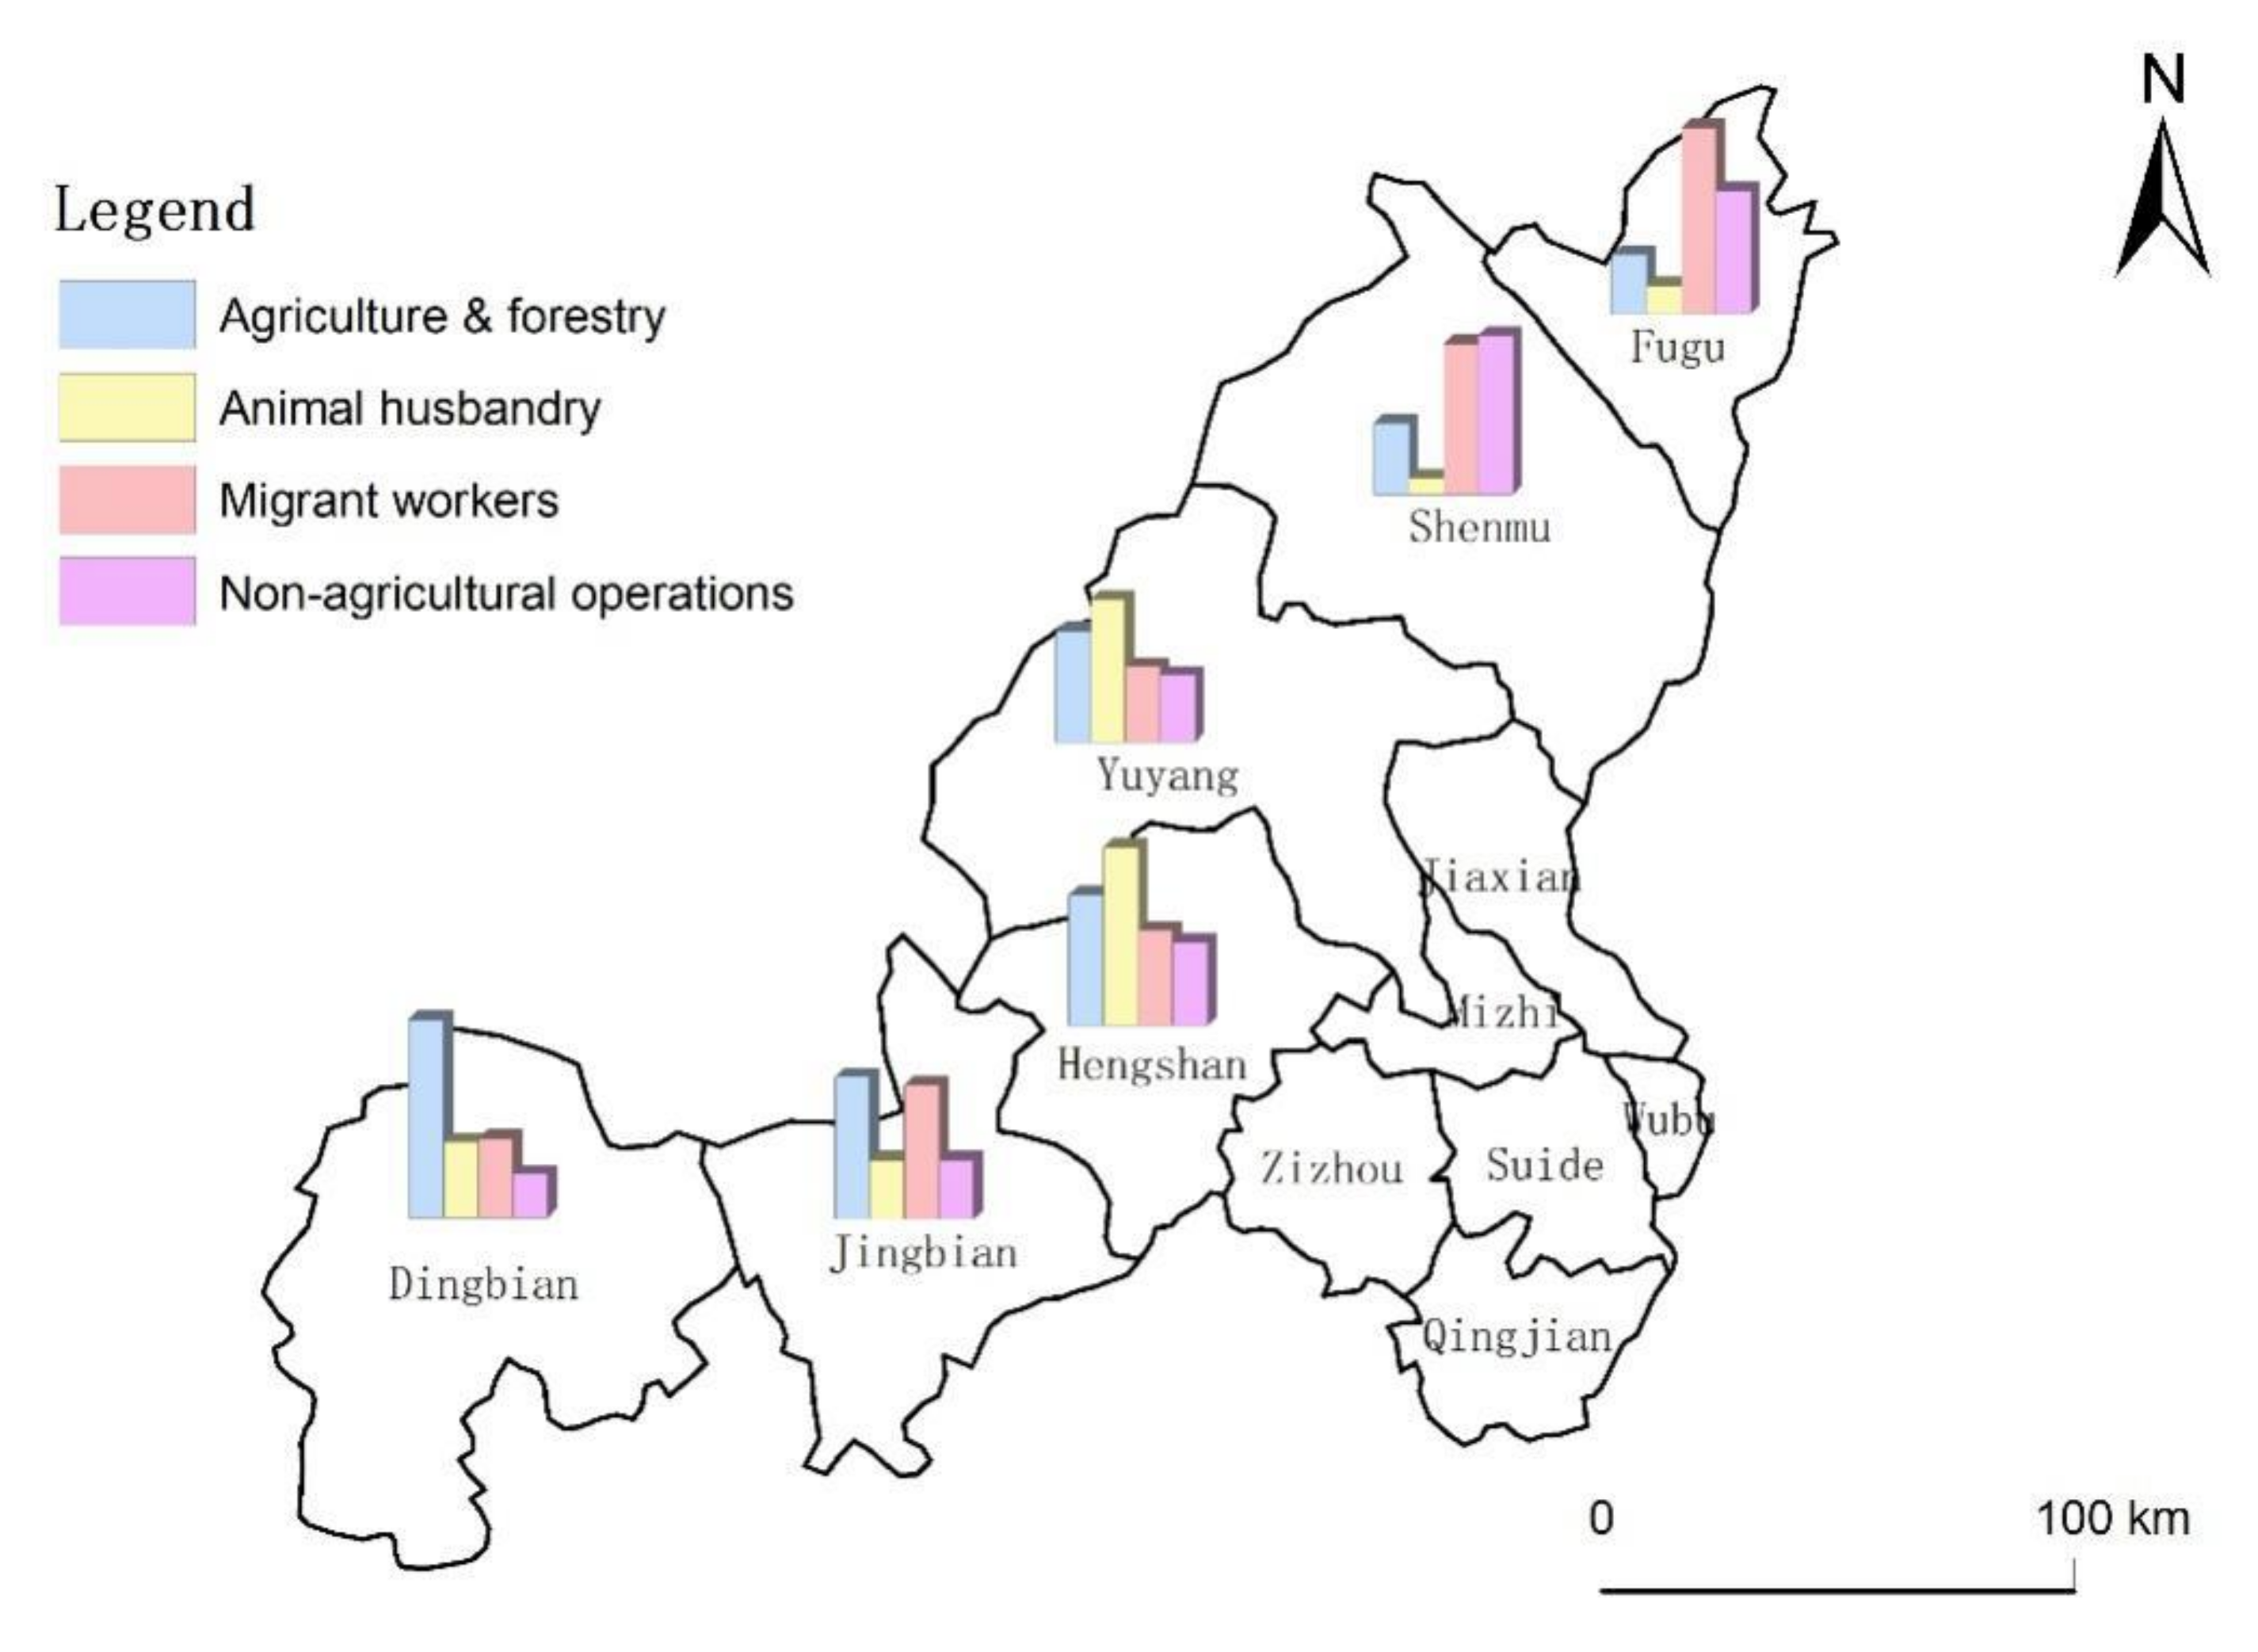
There were significant differences in the participation of farmers in various livelihood activities across the different counties (Figure 2). In terms of agricultural and forestry planting, Dingbian County had the highest participation, accounting for 80%. Fugu County had the lowest participation of farmers, accounting for 20%. In the aspect of animal husbandry, Yuyang District had the highest degree of participation, accounting for 60%; Shenmu County had the lowest participation, with only 6%. Dingbian County had the lowest number of migrant workers, accounting for 32%. The participation rate of other counties in migrant work was relatively high, with marginal differences between the counties. In terms of non-agricultural self-employment, Shenmu County had the highest degree of participation, accounting for 58%; Fugu County accounted for 42%, while the rest of the counties had less than 20% participation. The results show that the degree of participation in migrant work in each county was relatively high, and the difference was small. The difference in participation in agricultural and forestry planting, animal husbandry, and non-agricultural self-employment was greater. Shenmu County and Fugu County consisted of mainly migrant workers and those in non-agricultural self-employment, and the degree of participation in planting and animal husbandry was relatively low. The dominant livelihood activity in Yuyang District was animal husbandry, with participation in non-agricultural self-employment. In Dingbian County, agricultural and forestry planting were the main livelihood activities, with low participation in migrant work and non-agricultural self-employment.
3.3. Income Level of Livelihood Activities
In addition to the above four livelihood activities, farmers’ income sources include transfer income, such as government subsidies, ecological compensation funds, and other income. There were significant differences in the income levels of farmers’ livelihood activities across the energy development zones (Table 5). In terms of income from agriculture and forestry, the income level and proportion of total household income in the oil and gas resource development zones (7458 yuan, 30.71%) were significantly higher than that of the coal resource development zones (2651.48 yuan, 11.02%). Non-agricultural self-employment income and the proportion of total household income in the coal resource development zones were 12,385 yuan, 18.96% higher than that of the oil and gas development zones (6420.75 yuan, 11.55%). In terms of migrant workers’ income, there was a significant difference in migrant workers’ income between the coal resource and oil and gas resource development zones. However, the proportions of migrant workers’ total household income in the coal resource and oil and gas resource development zones were 30.52% and 28.54%, respectively, and the difference was minimal. Farmers in the oil and gas resource development zones have a large area of cultivated land and rely on traditional agricultural planting as their main source of income. The overall cultural quality and skill level of these farmers are low, and the migrant workers mainly do menial jobs, with low and unstable income. In response to coal development and ecological compensation policy, farmers in the coal resource development zone change their livelihood activities and turn to migrant work and non-agricultural self-employment as their main source of income. In addition, a higher ecological compensation standard increases the transfer income level and size of the coal development zone.
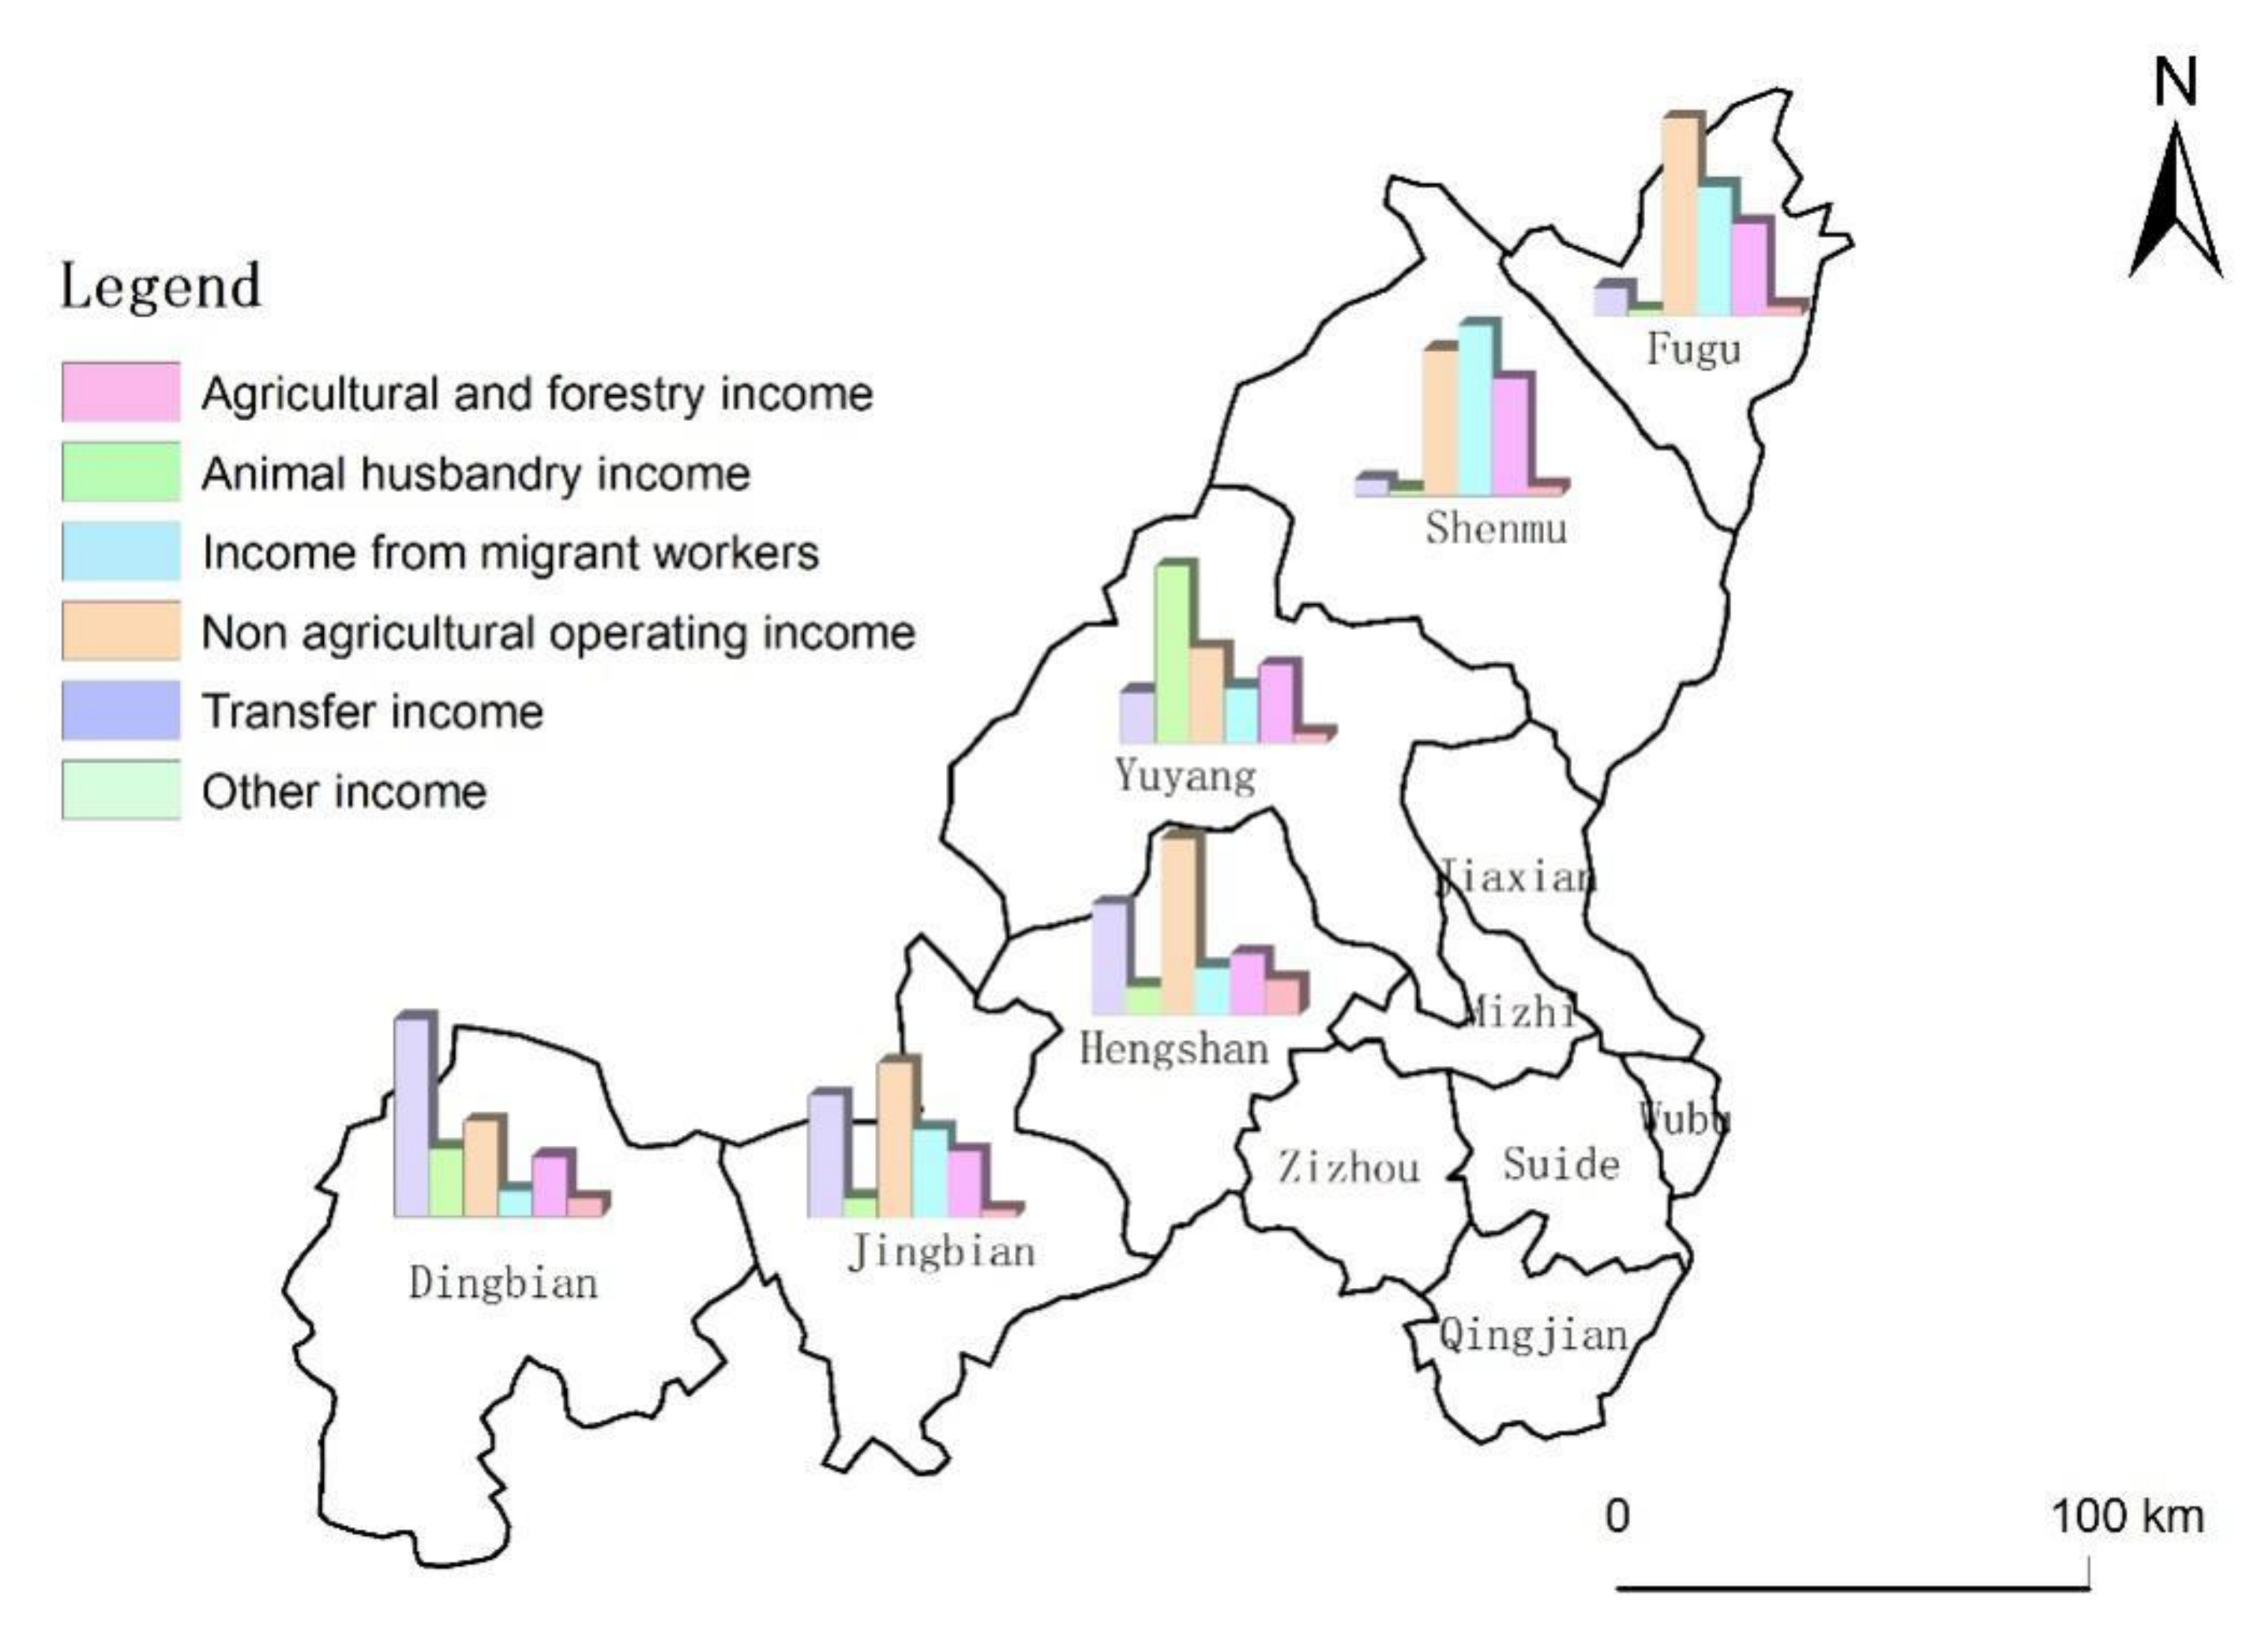
There are significant differences in the contributions of livelihood income across the counties (Figure 3). The contribution rate of income from work to household income is relatively high, with an average of 31.67%. The contribution rate of agricultural planting and non-agricultural self-employment varies greatly among counties. In terms of agricultural planting, Dingbian County had the highest contribution rate of 42.71%. Shenmu County’s contribution rate was only 3.44 percent, and 50 percent of counties contributed less than 20 percent. In the aspect of animal husbandry, the contribution rate of the Yuyang District was the highest (38.16%), and the contribution rate of other counties and districts was generally low. In terms of labour, Fugu County has the highest contribution rate of 42.69%; a total of 67% of counties contributed more than 30%, and Dingbian County had the lowest contribution rate of 14.56%. In terms of non-agricultural self-employment, Dingbian County contributed the least, only 5.54%; Shenmu County had the highest contribution rate of 36.79%. After the implementation of ecological compensation, Fugu County farmers are mainly engaged in energy work directly or indirectly, and the contribution rate of agricultural and forestry planting and breeding is small. Most of the farmers in Shenmu County used high compensation funds to independently emigrate, invest, buy carsand engage in non-agricultural self-employment, such as opening shops, restaurants, and repair shops. Large areas of land were abandoned, and agricultural planting participation and income levels were low. Yuyang District farmers use compensation funds to expand the scale of breeding; there are also some young people engaged in the transportation of self-employed, migrant workers, so the contribution rate of animal husbandry is the highest.
3.4. Impact of Ecological Compensation on Farmers’ Choice of Livelihood Activities
3.4.1. Influence on Agricultural Planting
From the perspective of participation and compensation value, ecological compensation has a negative impact on farmers’ participation in agricultural planting (Y1), which is significant at 1%, with values of −0.919 and −0.673, respectively (Table 6). This indicates that the more farmers participate in ecological compensation, the lower their participation in agricultural planting. Because the ecological compensation standard applied in the study area is mainly land compensation, farmers obtain compensation funds at the cost of cultivated land resources, and the loss of cultivated land resources promotes participation in other, more profitable livelihood activities. From the perspective of livelihood capital, natural resources have the most significant positive impact on farmers’ participation in agricultural planting, which was significant at 1%. The size of the male labour force has a negative impact on farmers’ participation in agricultural planting, which is significant at 5%, with a value of −0.483. This is because natural capital, especially cultivated land resources, is the basis of farmers’ agricultural production. The area and quality of cultivated land directly affect farmers’ willingness to participate in agricultural planting, as well as their productivity. With ecological compensation and loss of natural resources, farmer households with a greater male labour force see the greatest changes in livelihood, compared to households with a smaller male labour force, who remain highly dependent on traditional agricultural planting.
3.4.2. Influence on Animal Husbandry
The influence of ecological compensation on farmers’ participation in animal husbandry (Y2) was not significant and did not pass the significance test. From the perspective of compensation funds, the negative impact had a low significance, at 10%, with a regression coefficient of −0.451 (Table 6). The participation of farmers in livestock farming depends on the combined influence of the local natural environment, production conditions, and household production methods. Participation is restricted by the grazing prohibition policy. The degree of participation of the farmers in livestock farming across most counties was lower. The impact of ecological compensation is not significant. Grassland area, animal husbandry quantity, and labour force level were the most significant factors affecting farmers’ participation in animal husbandry, which are all significant at 1%. Natural capital, such as the extent of grassland, extent of cultivated land, and quality of the resources provide the means for the animal husbandry and breeding industries. The size of the labour force will have a great impact on benefits of animal husbandry.
3.4.3. Influence on Migrant Work
The effect of ecological compensation on farmers’ participation in migrant work (Y3) has a significant positive effect and passes the significance test of 1%, with a regression coefficient of 1.467 (Table 6). The type of compensation fund has a negative effect, which was significant at 5%, and the regression coefficient was −1.224. Farmers’ participation in ecological compensation is largely at the cost of land resources, and the loss of cultivated land increases participation in migrant work. On the other hand, the higher the compensation value, the more likely the farmers will shift to non-agricultural activities. With higher livelihood capital, the more migrant workers there are. Livelihood capital, specifically human capital, influences farmers’ participation in migrant work, which was significant at 1%. Both natural capital and animal husbandry quantity have significant negative effects on farmers’ participation in migrant work, which also passed the significance test and was significant at 1% confidence level. The loss of natural capital, especially cultivated land, promotes a shift in livelihood, increasing participation in other livelihood strategies, such as migrant work.
3.4.4. Influence on Non-Agricultural Self-Employment
The positive effect of ecological compensation on farmers’ participation in non-agricultural self-employment (Y5) was only significant at 10%, and the regression coefficient was 1.294. The type of compensation fund had a significant positive effect, which was significant at 1%, with a regression coefficient of 1.315 (Table 6). This is because non-agricultural self-employment requires greater capital investment. The type of compensation fund had a more significant impact on participation in non-agricultural self-employment. The higher the compensation, the greater the participation in non-agricultural self-employment. Financial capital had the most significant positive impact on farmers’ participation in non-agricultural self-employment, while natural capital and livestock quantity factors had significant negative effects, significant at 1%. In addition, education level, health, and access to transportation have a positive impact on farmers’ participation in non-agricultural self-employment, which is significant at 5%.
3.5. Impact of Ecological Compensation on Farmers’ Income from Livelihood Activities
3.5.1. Influence on Agricultural Planting Income
The value of ecological compensation had a negative effect on agricultural planting participation and income level (Y5), which was significant at 1%, with regression coefficients of −0.063 and −0.067, respectively (Table 7). The higher the ecological compensation standards, the more likely there will be a change in livelihood. With the implementation of an immigrant relocation compensation policy or increase in the value of passive or active compensation, farmers will choose other livelihood strategies, and farming activity participation and income level will decrease. Natural and human capital were the most significant positive factors impacting agricultural planting income, which were significant at 1%. The number of livestock and credit opportunities had a significant negative effect, which was significant at 1%. While natural capital, such as cultivated land area and quality, can directly affect the output value and agricultural planting income, human capital, especially the size of the labour force, affected the participation in and scale of agricultural planting. Although an increase in the extent of animal husbandry increases the extent of planting, forage crops negatively impact agricultural planting income level and participation.
3.5.2. Influence on Animal Husbandry Income
The impact of ecological compensation on participation in animal husbandry (Y6) is not significant and did not pass the significance test. The type of compensation fund had a positive effect on participation in animal husbandry, which was significant at a 5% level, with a regression coefficient of 0.047 (Table 7). Although the implementation of ecological compensation had little effect on participation in animal husbandry, the type of compensation fund can support participation and investment in animal husbandry, through expanding the scale of breeding and increasing animal husbandry income. Natural capital, livestock quantity, and transportation accessibility were the most significant positive factors affecting livestock income, which were all significant at 1%. Natural capital, such as arable land and grassland, can support animal husbandry, thus improving the income toward livelihood. In addition, convenient transportation brings information about development to farmers.
3.5.3. Influence on the Migrant Work Income
Ecological compensation on the income (Y7) positively affects participation in migrant work, which is significant at 1%, with a regression coefficient of 0.005. However, compensation funds have a negative effect on participation in migrant work, also significant at 1%, with a regression coefficient of −0.094 (Table 7). Ecological compensation can directly or indirectly cause farmers to shift their mode of production, thus increasing participation in migrant work, especially for those not willing or able to engage in non-agricultural self-employment and are strongly dependent on migrant work income. While compensation funds can provide sufficient economic support for farmers to engage in higher-income independent non-agricultural work and further improve the overall income level of the household, ecological compensation can negatively impact the degree of participation in, and income from, migrant work. Various human capital factors had a significant positive impact on household migrant work income, which were significant at 1%. The quantity and quality of the household labour force, especially the number of males, support participation in migrant work and allow for the optimal allocation of the labour force within the household, increasing the overall income from migrant work.
3.5.4. Influence on Non-Agricultural Self-Employment Income
Ecological compensation policy has an obvious positive effect on participation in non-farm self-employment and income levels (Y8), as well as compensation funds, which were significant at 1%, with regression coefficients of 0.112 and 0.181, respectively (Table 7). Because non-agricultural self-employment requires capital investment, farmers who receive greater compensation funds will optimise configuration. Household labour will shift to a more profitable non-agricultural self-employment, thus improving their level of participation and income. Financial capital and transportation accessibility were the most significant positive factors affecting non-farm self-employment income, which were significant at 1%. Human factors, such as labour force level, education level, and health status, also have a significant positive impact on non-agricultural self-employment income, which were significant at 5%. The influence of natural capital on non-agricultural self-employment income is less significant.
4. Discussion and Conclusions
4.1. Disscusion
In September 2020, General Secretary Xi Jinping made a solemn commitment to peak carbon and carbon neutrality at the General Debate of the 75th Session of the United Nations General Assembly. The realization of carbon peak and neutrality requires an extensive and profound economic and social systemic transformation. The energy structure and system face enormous changes, and the related costs to energy security will be felt in the short term. The implementation of the “dual carbon” strategic goals requires a transition to low-carbon energy systems and economy, particularly in the energy development zones. Ecological compensation is an important means to promote regional development and people’s income [41,42,43,44]. The following discussion is based on the results of this paper:
There are obvious differences in the livelihood strategies in different energy development regions. The number of participants of agricultural planting in the livelihood in the oil and gas development zone (71%) is significantly higher than that of the coal development zone (34%). The proportion of non-agricultural self-employment, animal husbandry, and migrant livelihood in the coal development zone is higher than that of the oil and gas development zone. In terms of migrant labour activities, the proportion of coal resource development zones is significantly higher than that of oil and gas resource development zones. In terms of income from livelihood activities, the income from labour, non-agricultural self-employment, and transfer income in coal resource development zones are higher than those in oil and gas resource development zones. This situation will push farmers to change their livelihood strategies and diversify their livelihoods [34,45].
There are significant differences in the farmers’ choice of livelihood strategies and income levels in different counties. The highest participation of farmers in agricultural planting, migrant work, and non-agricultural self-employment are Dingbian County (80%), Fugu County (64%), and Shenmu County (58%). The farmers in Yuyang County have the highest participation in animal husbandry. The highest income contribution from the sum of agricultural planting, animal husbandry, migrant work, and non-agricultural self-employment are Dingbian (42.71%), Yuyang (38.16%), Fugu (42.69%) and Shenmu (36.79%). This shows that farmers’ livelihoods are heavily dependent on natural assets, and the conditions of natural assets are difficult to change in a short period of time. Therefore, farmers’ livelihood strategies and income levels will remain different in various types or regions [46,47].
The livelihood strategies vary with the factors affecting farmers’ participation and amount of compensation funds of ecological compensation. The way of farmers’ participation and amount of compensation have a negative impact on planting activities and positive impact on non-agricultural self-employment activities, and they are significant at the 1% level. Participation in ecological compensation has a significantly negative effect on agricultural planting income, which is significant at the 1% level. The amount of compensation has a significant positive effect on the income of animal husbandry and non-agricultural self-employment, and has a negative effect on the income of migrant work and agricultural planting, both of which are significant at the 1% level. Therefore, farmers do not necessarily increase livelihood assets in ecological compensation [34,48], although farmers understand the benefits of ecological strategies, as economic benefits still largely dominate farmers’ livelihood strategies [49].
4.2. Conlusions
The paper constructed a livelihood strategy index system based on the sustainable livelihood framework for the Yulin energy and resource development zones (six counties in the north). A comparative analysis was undertaken regarding the livelihood strategy status of farmers in the different energy development zones and counties using data obtained from a household survey. Then, the logistic regression model and multiple linear regression model were used to quantitatively analyse the impact of ecological compensation on farmers’ livelihood strategies in the study area, in terms of livelihood activity participation and income. The conclusion is as follows.
The significant difference between the development of coal resources and oil and gas resources lies in agricultural planting. The number of migrant workers and non-agricultural self-employment in the coal resource development zone is higher than that of the oil and gas resource development zone. There are obvious differences in the income composition of farmers in the coal resource and oil and gas resource development zones. Furthermore, for farmers with different livelihood strategies, ecological compensation has significantly different impacts on their participation and income.
4.3. Countermeasures
Design flexible ecological compensation by region. Ecological compensation is the relationship between the subject and object of compensation. According to the results of the household survey and interviews, the current ecological compensation policy in the study area focuses on financial compensation and material compensation, with little emphasis on relevant technical training and policy support. Most of the compensation funds are derived from leasing land, which has poor stability and affects the sustainable development of the project. The optimal design of ecological compensation should be informed by the national energy distribution system, regional energy development types, degree of ecological impact, programme of implementation, industrial structure, and farmers’ livelihood characteristics. This will enable farmers to participate in ecological compensation projects and improve their livelihoods.
Implement market-based and diversified methods of ecological compensation. Ecological compensation projects reduce the natural capital of farmers in the energy development zones, weaken subsistence agriculture and food security, reduce the income of farmers engaged in agricultural planting as their main livelihood, and change the inherent livelihood capital pattern of farmers. The ecological compensation mechanism can be diversified and improved through cash compensation, establishing industrial parks, optimizing forestry, the transformation of energy production and energy development zone enterprises, and expanding the cultivated area of cash crops. On this basis, farmers could improve their income from ecological compensation projects, and the sustainability and social equity of these projects would be enhanced.
Promote the development of ecological compensation systems. The development of energy resources is aimed at revitalizing the region. The rational development of resources and establishment of ecological compensation mechanisms are necessary for regional coordination and sustainable development. Ecological compensation is compensation for the damage to environmental resources, balancing resource exploitation and protection of the environment. Ecological compensation mechanisms should be developed with multi-stakeholder participation. The carbon neutral goal should be incorporated into development projects, and the green transformation of energy should focus on the continuous improvement of environmental governance and energy security.
There are obvious differences between the study area and other energy development zones, in terms of ecological compensation methods, standards, and values. These differences have varying degrees of impact on farmers’ livelihood strategies and capital.
4.4. Limitations and Future Research
The deficiencies of this paper are mainly manifested in the following aspects: on the one hand, this paper needs to visit and investigate in the process of research. Due to subjective and objective reasons, the case materials and data will inevitably be insufficient, especially the long-term livelihood data in the process of ecological compensation. On the other hand, the research area selected in this paper has a certain representativeness, but there are still limitations, due to the different conditions of energy development zones in the country.
According to the shortcomings of this paper, this paper will continue to study the following aspects to make up for the shortcomings. First, continue to pay attention to the promotion of ecological compensation policies and farmers’ livelihood strategies in China’s energy development zones. Expand the study of typical cases, visit and investigate more typical cases, enhance the feasibility of case studies, and dig deep-level mechanisms. Try a multi-regional comprehensive study to compare the differences in ecological compensation and farmers’ livelihood strategies among energy development regions. Second, try a multi-regional comprehensive study to compare the differences in ecological compensation and farmers’ livelihood strategies among energy development regions. Finally, the research period is extended to analyse the complete action process of the policy, in order to better predict future trends.
Author Contributions
Conceptualization, Q.W. and J.F.; methodology, X.L.; software, J.F.; formal analysis, F.S.; investigation, X.L.; data curation, J.F.; writing—original draft preparation, Q.W. and X.L.; writing—review and editing, J.F. and F.S.; supervision, F.S.; funding acquisition, Q.W. and F.S. All authors have read and agreed to the published version of the manuscript.
Funding
National Natural Science Foundation of China (42161037),Shaanxi Innovation Research Team for Science and Technology [grant numbers 2021TD-35]. Natural Science Foundation of Ningxia (2021AAC03434).
Institutional Review Board Statement
Not applicable.
Informed Consent Statement
Informed consent was obtained from all subjects involved in the study.
Data Availability Statement
The data are available from the corresponding author upon reasonable request.
Conflicts of Interest
The authors declare no conflict of interest.
References
- Sutrisno, A.; Nomaler, O.; Alkemade, F. Has the global expansion of energy markets truly improved energy security? Energy Policy 2020, 148, 111931. [Google Scholar] [CrossRef]
- Mouraviev, N. Energy security in Kazakhstan: The consumers’ perspective. Energy Policy 2021, 155, 112343. [Google Scholar] [CrossRef]
- Yu, J.; Yang, T.; Ding, T.; Zhou, K. “New normal” characteristics show in China’s energy footprints and carbon footprints. Sci. Total Environ. 2021, 785, 147210. [Google Scholar] [CrossRef] [PubMed]
- Qiu, S.; Lei, T.; Wu, J.; Bi, S. Energy demand and supply planning of China through. Energy 2021, 234, 121193. [Google Scholar] [CrossRef]
- Lin, B.; Zhou, Y. Does energy efficiency make sense in China? Based on the perspective of economic growth quality. Sci. Total Environ. 2021, 804, 149895. [Google Scholar] [CrossRef]
- Peng, C.; Chen, H.; Lin, C.; Guo, S.; Yang, Z.; Chen, K. A framework for evaluating energy security in China: Empirical analysis of forecasting and assessment based on energy consumption. Energy 2021, 234, 121314. [Google Scholar] [CrossRef]
- Tang, R.; Zhao, J.; Liu, Y.; Huang, X.; Zhang, Y.; Zhou, D.; Ding, A.; Nielsen, C.P.; Wang, H. Air quality and health co-benefits of China’s carbon dioxide emissions peaking before. Nat. Commun. 2022, 13, 1008. [Google Scholar] [CrossRef]
- Huang, C.; Zhang, Z.; Li, N.; Liu, Y.; Chen, X.; Liu, F. Estimating economic impacts from future energy demand changes due to climate change and economic development in China. J. Clean. Prod. 2021, 311, 127576. [Google Scholar] [CrossRef]
- Liu, S.; Zhang, J.; Zhang, J.; Guo, Y. Simultaneously tackling ecological degradation and poverty challenges: Evidence from desertified areas in northern China. Sci. Total Environ. 2022, 815, 152927. [Google Scholar] [CrossRef]
- Giefer, M.M.; An, L.; Chen, X. Normative, livelihood, and demographic influences on enrollment in a payment for ecosystem services program. Land Use Policy 2021, 108, 105525. [Google Scholar] [CrossRef]
- Yu, H.; Xie, W.; Yang, L.; Du, A.; Almeida, C.M.; Wang, Y. From payments for ecosystem services to eco-compensation: Conceptual change or paradigm shift? Sci. Total Environ. 2019, 700, 134627. [Google Scholar] [CrossRef]
- Turpie, J.; Marais, C.; Blignaut, J. The working for water programme: Evolution of a payments for ecosystem services mechanism that addresses both poverty and ecosystem service delivery in South Africa. Ecol. Econ. 2008, 65, 788–798. [Google Scholar] [CrossRef] [Green Version]
- Chang, Y.; Zhang, Z.; Yoshino, K.; Zhou, S. Farmers’ tea and nation’s trees: A framework for eco-compensation assessment based on a subjective-objective combination analysis. J. Environ. Manag. 2020, 269, 110775. [Google Scholar] [CrossRef] [PubMed]
- Izquierdo-Tort, S.; Corbera, E.; Cruz, A.B.; Naime, J.; Vázquez-Cisneros, P.A.; Lillo, J.C.; Castro-Tovar, E.; Rosas, F.O.; Rubio, N.; Knoop, L.T.; et al. Local responses to design changes in payments for ecosystem services in Chiapas, Mexico. Ecosyst. Serv. 2021, 50, 101305. [Google Scholar] [CrossRef]
- Wendland, K.J.; Honzák, M.; Portela, R.; Vitale, B.; Rubinoff, S.; Randrianarisoa, J. Targeting and implementing payments for ecosystem services: Opportunities for bundling biodiversity conservation with carbon and water services in Madagascar. Ecol. Econ. 2010, 69, 2093–2107. [Google Scholar] [CrossRef]
- Kang, M.J.; Siry, J.P.; Colson, G.; Ferreira, S. Do forest property characteristics reveal landowners’ willingness to accept payments for ecosystem services contracts in southeast Georgia, U.S.? Ecol. Econ. 2019, 161, 144–152. [Google Scholar] [CrossRef]
- Pei, S.; Zhang, C.; Liu, C.; Liu, X.; Xie, G. Forest ecological compensation standard based on spatial flowing of water services in the upper reaches of Miyun Reservoir, China. Ecosyst. Serv. 2019, 39, 100983. [Google Scholar] [CrossRef]
- Shan-Shan, F.; Jiang, C.; Bo, Y.; Zhong-Shu, D. Re-use strategy of subsided land based on urban space ecological compensation: Case study for Xuzhou mining area for example. Procedia Earth Planet. Sci. 2009, 1, 982–988. [Google Scholar] [CrossRef] [Green Version]
- Villarroya, A.; Puig, J. Ecological compensation and Environmental Impact Assessment in Spain. Environ. Impact Assess. Rev. 2010, 30, 357–362. [Google Scholar] [CrossRef]
- Chen, Y.; Dou, S.; Xu, D. The effectiveness of eco-compensation in environmental protection -A hybrid of the government and market. J. Environ. Manag. 2020, 280, 111840. [Google Scholar] [CrossRef]
- Kangas, J.; Ollikainen, M. Economic Insights in Ecological Compensations: Market Analysis With an Empirical Application to the Finnish Economy. Ecol. Econ. 2019, 159, 54–67. [Google Scholar] [CrossRef]
- Rentschler, J. Incidence and impact: The regional variation of poverty effects due to fossil fuel subsidy reform. Energy Policy 2016, 96, 491–503. [Google Scholar] [CrossRef] [Green Version]
- Costanza, R.; d’Arge, R.; de Groot, R.; Farber, S.; Grasso, M.; Hannon, B.; Limburg, K.; Naeem, S.; O’Neill, R.V.; Paruelo, J.; et al. The value of the world’s ecosystem services and natural capital. Nature 1997, 387, 253–260. [Google Scholar] [CrossRef]
- Deng, X.; Yan, S.; Song, X.; Li, Z.; Mao, J. Spatial targets and payment modes of win–win payments for ecosystem services and poverty reduction. Ecol. Indic. 2022, 136, 108612. [Google Scholar] [CrossRef]
- Home, R.; Balmer, O.; Jahrl, I.; Stolze, M.; Pfiffner, L. Motivations for implementation of ecological compensation areas on Swiss lowland farms. J. Rural Stud. 2014, 34, 26–36. [Google Scholar] [CrossRef]
- Qiu, L.; Dong, Y.; Liu, H. Integrating Ecosystem Services into Planning Practice: Situation, Challenges and Inspirations. Land 2022, 11, 545. [Google Scholar] [CrossRef]
- Morri, E.; Santolini, R. Ecosystem Services Valuation for the Sustainable Land Use Management by Nature-Based Solution (NbS) in the Common Agricultural Policy Actions: A Case Study on the Foglia River Basin (Marche Region, Italy). Land 2021, 11, 57. [Google Scholar] [CrossRef]
- Pérez-Rubio, I.; Flores, D.; Vargas, C.; Jiménez, F.; Etxano, I. To What Extent Are Cattle Ranching Landholders Willing to Restore Ecosystem Services? Constructing a Micro-Scale PES Scheme in Southern Costa Rica. Land 2021, 10, 709. [Google Scholar] [CrossRef]
- Gabel, V.M.; Home, R.; Stolze, M.; Pfiffner, L.; Birrer, S.; Köpke, U. Motivations for swiss lowland farmers to conserve biodiversity: Identifying factors to predict proportions of implemented ecological compensation areas. J. Rural Stud. 2018, 62, 68–76. [Google Scholar] [CrossRef]
- Lee, J.-H.; Choi, H. An Analysis of Public Complaints to Evaluate Ecosystem Services. Land 2020, 9, 62. [Google Scholar] [CrossRef] [Green Version]
- Alarcon, G.G.; Fantini, A.C.; Salvador, C.H.; Farley, J. Additionality is in detail: Farmers’ choices regarding payment for ecosystem services programs in the Atlantic forest, Brazil. J. Rural Stud. 2017, 54, 177–186. [Google Scholar] [CrossRef]
- Li, G.; Sun, F.; Fu, B.; Deng, L.; Yang, K.; Liu, Y.; Che, Y. How to promote the public participation in eco-compensation in transboundary river basins: A case from Planned Behavior perspective. J. Clean. Prod. 2021, 313, 127911. [Google Scholar] [CrossRef]
- Zhang, J.; Brown, C.; Qiao, G.; Zhang, B. Effect of Eco-compensation Schemes on Household Income Structures and Herder Satisfaction: Lessons From the Grassland Ecosystem Subsidy and Award Scheme in Inner Mongolia. Ecol. Econ. 2019, 159, 46–53. [Google Scholar] [CrossRef]
- Liu, M.; Yang, L.; Bai, Y.; Min, Q. The impacts of farmers’ livelihood endowments on their participation in eco-compensation policies: Globally important agricultural heritage systems case studies from China. Land Use Policy 2018, 77, 231–239. [Google Scholar] [CrossRef]
- Chambers, R.; Conway, G. Sustainable Rural Livelihoods: Practical Concepts for the 21st Century; Institute of Development Studies: Falmer, UK, 1992; Available online: https://opendocs.ids.ac.uk/opendocs/handle/20.500.12413/775 (accessed on 9 May 2022).
- Yulin Bureau of Statistics. Yulin Statistical Yearbook; China Statistical Publishing House: Beijing, China, 2021. Available online: http://tjj.yl.gov.cn/article/1211228091658 (accessed on 9 May 2022).
- Hansen, K.; Duke, E.; Bond, C.; Purcell, M.; Paige, G. Rancher Preferences for a Payment for Ecosystem Services Program in Southwestern Wyoming. Ecol. Econ. 2018, 146, 240–249. [Google Scholar] [CrossRef]
- Bhandari, P.B. Rural livelihood change? Household capital, community resources and livelihood transition. J. Rural Stud. 2013, 32, 126–136. [Google Scholar] [CrossRef] [Green Version]
- Hu, X.; Luo, H.; Guo, M.; Wang, J. Ecological technology evaluation model and its application based on Logistic Regression. Ecol. Indic. 2022, 136, 108641. [Google Scholar] [CrossRef]
- Muench, S.; Bavorova, M.; Pradhan, P. Climate Change Adaptation by Smallholder Tea Farmers: A Case Study of Nepal. Environ. Sci. Policy 2020, 116, 136–146. [Google Scholar] [CrossRef]
- Yang, X.; Zhou, X.; Shang, G.; Zhang, A. An evaluation on farmland ecological service in Jianghan Plain, China --from farmers’ heterogeneous preference perspective. Ecol. Indic. 2022, 136, 108665. [Google Scholar] [CrossRef]
- Zhen, H.; Qiao, Y.; Zhao, H.; Ju, X.; Zanoli, R.; Waqas, M.A.; Lun, F.; Knudsen, M.T. Developing a conceptual model to quantify eco-compensation based on environmental and economic cost-benefit analysis for promoting the ecologically intensified agriculture. Ecosyst. Serv. 2022, 56, 101442. [Google Scholar] [CrossRef]
- Yang, H.-J.; Gou, X.-H.; Yin, D.-C.; Du, M.-M.; Liu, L.-Y.; Wang, K. Research on the coordinated development of ecosystem services and well-being in agricultural and pastoral areas. J. Environ. Manag. 2021, 304, 114300. [Google Scholar] [CrossRef] [PubMed]
- Dong, X.; Wang, X.; Wei, H.; Fu, B.; Wang, J.; Uriarte-Ruiz, M. Trade-offs between local farmers’ demand for ecosystem services and ecological restoration of the Loess Plateau, China. Ecosyst. Serv. 2021, 49, 101295. [Google Scholar] [CrossRef]
- Sponagel, C.; Angenendt, E.; Piepho, H.-P.; Bahrs, E. Farmers’ preferences for nature conservation compensation measures with a focus on eco-accounts according to the German Nature Conservation Act. Land Use Policy 2021, 104, 105378. [Google Scholar] [CrossRef]
- Liu, M.; Rao, D.; Yang, L.; Min, Q. Subsidy, training or material supply? The impact path of eco-compensation method on farmers’ livelihood assets. J. Environ. Manag. 2021, 287, 112339. [Google Scholar] [CrossRef]
- Hou, C.; Zhou, L.; Wen, Y.; Chen, Y. Farmers’ adaptability to the policy of ecological protection in China—A case study in Yanchi County, China. Soc. Sci. J. 2018, 55, 404–412. [Google Scholar] [CrossRef]
- Wu, Z.; Dai, X.; Li, B.; Hou, Y. Livelihood consequences of the Grain for Green Programme across regional and household scales: A case study in the Loess Plateau. Land Use Policy 2021, 111, 105746. [Google Scholar] [CrossRef]
- Trevisan, A.; Schmitt-Filho, A.; Farley, J.; Fantini, A.; Longo, C. Farmer perceptions, policy and reforestation in Santa Catarina, Brazil. Ecol. Econ. 2016, 130, 53–63. [Google Scholar] [CrossRef]
Figure 1.
Location map of the study area.

Figure 2.
Livelihood activities of farmers in different counties.

Figure 3.
Differences in revenue contribution in various counties.


Table 1.
Dependent variables used in the models and their definitions.
| Dependent Variable | Code | Variable Name | Variable Meaning and Assignment |
|---|---|---|---|
| Livelihood activity participation | Y1 | Participation in farming | participate in = 1 not participate = 0 |
| Y2 | Participation in animal husbandry | ||
| Y3 | Participation in migrant work | ||
| Y4 | Participation in non-farming self-employment | ||
| Livelihood activity income | Y5 | Agricultural income level | Proportion of planting income in total household income |
| Y6 | Income level of animal husbandry | Livestock farming income in total household income proportion | |
| Y7 | Income level of workers | Proportion of income from work in total household income | |
| Y8 | Level of non-farming self-employment income | Non-farm self-employed income in total household income |
Table 2.
Independent variables used in the models and their definitions.
| Independent Variables | Code | Variable Name | Variable Description |
|---|---|---|---|
| Ecological compensation P | P1 | Whether to participate in ecological compensation | 2/5000 To participate in = 1, not involved in = 0 |
| P2 | Ecological compensation value | Per capita ecological compensation value /RMB | |
| Livelihood capital X | X1 | Arable land | Per capita cultivated area |
| X2 | Grassland area | ||
| X3 | Grassland area per capita | ||
| X4 | Cultivated land quality | ||
| X5 | Maize yield per unit area | ||
| X6 | Livestock number | ||
| X7 | Cow = 0.8, pig = 0.6, sheep = 0.4, chicken = 0.1 | ||
| X8 | Building area | ||
| X9 | Between house number | ||
| X10 | Household durable consumer goods | Illiterate = 0, primary school = 1, junior high school = 2, senior high school, technical secondary school = 3, junior college and above = 4 | |
| X11 | Household labour force | ||
| X12 | Per capita income | ||
| X13 | Male labour force | ||
| X14 | Whether we can raise the money | ||
| X15 | As a percentage of health care spending | ||
| X16 | Whether there are credit opportunities | ||
| X17 | The values are 5, 4, 3, 2, and 1, respectively, according to the relationship between them |
Table 3.
Basic characteristics of sample rural households.
| Household Characteristics | Description | Frequency (Unit) | Ratio (%) |
|---|---|---|---|
| Householder age | ≤30 age | 18 | 3.6 |
| 31–40 age | 56 | 11.2 | |
| 41–50 age | 93 | 18.6 | |
| 51–60 age | 207 | 41.4 | |
| 60 more age | 126 | 25.2 | |
| Household head education level | Primary and below | 237 | 47.4 |
| Junior high school | 172 | 34.4 | |
| High school | 65 | 13.0 | |
| Junior college or above | 26 | 5.2 | |
| Head of the household profession | Farming | 231 | 46.2 |
| Migrant worker | 166 | 33.2 | |
| Businessman | 103 | 20.6 |
Table 4.
Livelihood activities of farmers in different energy development zones.
| Participation Rate of Livelihood Activities (%) | Difference T-Test | |||
|---|---|---|---|---|
| Coal Resource Development Zone | Oil and Gas Resource Development Zone | T Value | Sig Value | |
| Agro forestry | 34 | 71 | −3.97 *** | 0.00 |
| Animal husbandry and aquaculture | 22 | 28 | −1.43 ** | 0.05 |
| Migrant work | 52.5 | 45 | 1.05 * | 0.07 |
| Non-agricultural self-employment | 37.5 | 22 | 2.86 *** | 0.00 |
Note: *, **, and *** represent significance at the statistical levels of 10%, 5%, and 1%, respectively.
Table 5.
Level and composition of income in different energy development zones.
| Income Level and Ratio (%) | |||
|---|---|---|---|
| Coal Resource Development Zone | Oil and Gas Resource Development Zone | ||
| Agricultural and forestry planting income | Income level (RMB) | 2651.48 | 7458 |
| Ratio (%) | 11.02 | 30.71 | |
| Income from animal husbandry | Income level (RMB) | 4611.39 | 1448 |
| Ratio (%) | 13.77 | 8.63 | |
| Income of migrant workers | Income level (RMB) | 20,658.42 | 15,440 |
| Ratio (%) | 30.52 | 28.54 | |
| Non-farming self-employment income | Income level (RMB) | 12,385 | 27,625 |
| Ratio (%) | 18.96 | 11.55 | |
| Transfer income | Income level (RMB) | 18,670.13 | 9420.75 |
| Ratio (%) | 20.57 | 15.78 | |
| Other income | Income level (RMB) | 658.42 | 2943.75 |
| Ratio (%) | 5.16 | 4.79 | |
Table 6.
Regression results of the impact of ecological compensation on choice of livelihood activities.
Table 6.
Regression results of the impact of ecological compensation on choice of livelihood activities.
| Y1 | Y2 | Y3 | Y4 | ||||||
|---|---|---|---|---|---|---|---|---|---|
| MODEL 1 | MODEL 2 | MODEL 1 | MODEL 2 | MODEL 1 | MODEL 2 | MODEL 1 | MODEL 2 | ||
| P | P1 | −0.919 *** | −0.624 | 1.467 ** | 1.294 ** | ||||
| P2 | −0.673 *** | −0. 451 * | −1.224 *** | 1.315 *** | |||||
| Natural capital | X1 | 2.743 *** | 2.589 *** | 0.092 ** | 0.064 ** | −0.106 *** | −0.149 *** | −0.057 *** | −0.026 *** |
| X2 | 1.959 * | 1.685 * | 47.366 *** | 62.603 *** | 0 | 0 | −0.793 *** | −0.786 *** | |
| X3 | 0.521 *** | 0.506 * | −0.01 | −0.132 | −0.282 *** | −0.219 *** | 0 | 0 | |
| Material capital | X4 | 0.103 ** | 0.084 ** | 19.442 *** | 20.752 *** | −0.047 *** | −0.051 *** | −0.040 *** | −0.043 *** |
| X5 | −0.086 | −0.022 | 9.015 | 7.004 | −0.143 | −0.062 | 0.221 ** | 0.229 ** | |
| X6 | 0.006 | 0.026 | 7.751 | 7.891 | −0.047 | −0.073 | 0.347 * | 0.397 * | |
| Financial capital | X7 | 0.023 | 0.016 * | 0.003 | 0.106 | 0.653 | 0.542 | 0.411 *** | 0.436 *** |
| X8 | 1.067 * | 0.736 | 1.007 | 2.583 | 1.051 | 0.543 | 0.587 *** | 0.233 *** | |
| X9 | 0.14 | 0.259 | 69.248 | 86.325 | 0.317 | 0.784 | 0.305 *** | 0.350 *** | |
| Human capital | X10 | −0.189 | −0.139 | −57.889 ** | −73.995 ** | 0.632 ** | 0.781 ** | 0.271 * | 0.301 * |
| X11 | 0.379 * | 0.281 | 1.452 *** | 1.063 *** | 0.101 *** | −0.033 | −0.262 | −0.265 | |
| X12 | −0.483 ** | −0.432 ** | −2.112 | −1.484 | 1.439 *** | 1.485 *** | 0.688 | 0.714 | |
| X13 | 2.825 *** | 2.738 *** | 1.053 ** | 1.562 ** | 9.562 *** | 9.945 *** | 381 | 1.019 | |
| Social capital | X14 | 0.223 | 0.145 | 12.026 | 22.999 | −0.516 | −0.641 | 0.161 | 0.226 |
| X15 | −0.632 * | −0.678 * | −27.806 | −56.228 | −0.125 | −0.324 | 0.125 * | 0.097 * | |
| X16 | 1.165 | 1.099 | −3.973 | −4.781 | −45.693 * | −45.408 * | 2.521 | 2.517 | |
| X17 | 0.83 | 0.648 | 1.001 | 1.133 | 20.466 | 21.355 | −1.017 * | −1.013 * | |
| Adj-R2 | 0.533 | 0.538 | 0.638 | 0.638 | 0.626 | 0.632 | 0.574 | 0.263 | |
Note: *, **, and *** were statistically significant at 0.1, 0.05, and 0.01, respectively.
Table 7.
Regression results of impact of ecological compensation on income from livelihood activities.
Table 7.
Regression results of impact of ecological compensation on income from livelihood activities.
| Y5 | Y6 | Y7 | Y8 | ||||||
|---|---|---|---|---|---|---|---|---|---|
| MODEL 1 | MODEL 2 | MODEL 1 | MODEL 2 | MODEL 1 | MODEL 2 | MODEL 1 | MODEL 2 | ||
| P | P1 | −0.063 *** | −0.005 | 0.005 *** | 0.112 *** | ||||
| P2 | −0.067 *** | 0.047 ** | −0.094 *** | 0.181 *** | |||||
| Natura l capital | X1 | 0.027 *** | 0.015 *** | −0.037 | −0.048 | −0.122 * | −0.146 * | −0.077 ** | −0.032 ** |
| X2 | −0.036 | −0.042 | 0.207 *** | 0.198 *** | −0.025 | −0.019 | −0.060 | −0.088 | |
| X3 | 0.822 *** | 0.83 *** | 0.033 *** | 0.032 *** | 0.008 * | 0.032 * | 0.001 | 0.007 | |
| Material capital | X4 | −0.103 *** | −0.089 *** | 0.749 *** | 0.749 *** | −0.183 *** | −0.199 *** | −0.040 *** | −0.040 *** |
| X5 | 0.008 | 0.010 | −0.016 | −0.001 | −0.073 * | −0.051 | 0.044 ** | 0.056 ** | |
| X6 | −0.004 | −0.030 | 0.063 * | 0.076 * | 0.086 | 0.093 | 0.032 * | 0.080 * | |
| Financial capital | X7 | −0.014 | −0.010 | 0.003 | 0.019 | 0.024 | 0.035 * | 0.040 *** | 0.041 *** |
| X8 | 0.096 * | 0.056 * | 0.028 | 0.019 | −0.017 | −0.004 | 0.081 *** | 0.141 *** | |
| X9 | −0.070 *** | −0.051 *** | 0.066 ** | 0.058 ** | −0.008 | 0.000 | 0.013 *** | 0.062 *** | |
| Human capital | X10 | −0.053 ** | −0.015 ** | 0.033 | 0.033 | 0.082 *** | 0.080 *** | 0.067 ** | 0.043 ** |
| X11 | 0.202 *** | 0.148 *** | −0.128 * | −0.118 * | 0.283 *** | 0.289 *** | 0.070 ** | 0.145 ** | |
| X12 | −0.101 ** | −0.092 ** | 0.153 * | 0.144 * | 0.045 *** | 0.077 *** | 0.057 ** | 0.092 ** | |
| X13 | 0.022 *** | 0.041 *** | 0.042 ** | 0.042 ** | 0.041 ** | 0.033 ** | 0.041 ** | 0.053 ** | |
| Social capital | X14 | 0.022 | 0.051 | 0.055 * | 0.06 * | −0.066 * | −0.073 | −0.076 | −0.063 |
| X15 | −0.03 * | −0.057 * | 0.033 *** | 0.045 *** | 0.004 | −0.032 | 0.043 *** | 0.063 *** | |
| X16 | 0.018 | −0.021 | 0.018 | 0.031 | −0.231 * | −0.255 * | 0.204 * | 0.320 * | |
| X17 | 0.048 | 0.057 | −0.062 ** | −0.065 ** | 0.312 * | 0.301 * | 0.010 | 0.053 | |
| Adj-R2 | 0.744 | 0.760 | 0.793 | 0.795 | 0.744 | 0.752 | 0.637 | 0.649 | |
Note: *, **, and *** were statistically significant at 0.1, 0.05, and 0.01, respectively.
Publisher’s Note: MDPI stays neutral with regard to jurisdictional claims in published maps and institutional affiliations. |
© 2022 by the authors. Licensee MDPI, Basel, Switzerland. This article is an open access article distributed under the terms and conditions of the Creative Commons Attribution (CC BY) license (https://creativecommons.org/licenses/by/4.0/).
Share and Cite
MDPI and ACS Style
Wen, Q.; Fang, J.; Li, X.; Su, F. Impact of Ecological Compensation on Farmers’ Livelihood Strategies in Energy Development Regions in China: A Case Study of Yulin City. Land 2022, 11, 965. https://0-doi-org.brum.beds.ac.uk/10.3390/land11070965
AMA Style
Wen Q, Fang J, Li X, Su F. Impact of Ecological Compensation on Farmers’ Livelihood Strategies in Energy Development Regions in China: A Case Study of Yulin City. Land. 2022; 11(7):965. https://0-doi-org.brum.beds.ac.uk/10.3390/land11070965
Chicago/Turabian StyleWen, Qi, Jie Fang, Xia Li, and Fang Su. 2022. "Impact of Ecological Compensation on Farmers’ Livelihood Strategies in Energy Development Regions in China: A Case Study of Yulin City" Land 11, no. 7: 965. https://0-doi-org.brum.beds.ac.uk/10.3390/land11070965
Note that from the first issue of 2016, this journal uses article numbers instead of page numbers. See further details here.