Article

Estimation of Soil Erosion Rates and Eroded Sediment in a Degraded Catchment of the Siwalik Hills, Nepal

by
Sohan Kumar Ghimire
1,*,
Daisuke Higaki
2 and
Tara Prasad Bhattarai
3
1
James Hutton Institute, Aberdeen AB15 8QH, UK
2
Faculty of Agriculture and Life Science, Hirosaki University, Hirosaki, Aomori 036-8560, Japan
3
ERMC Geotech Services P. Ltd, Kathmandu 12419, Nepal
*
Author to whom correspondence should be addressed.
Submission received: 26 April 2013 / Revised: 25 June 2013 / Accepted: 9 July 2013 / Published: 19 July 2013

Abstract

:
The Siwalik Hills is one of the most fragile and vulnerable ecosystems in the Nepalese Himalaya where soil erosion and land degradation issues are fundamental. There is very limited knowledge on soil erosion processes and rates in this region in comparison to other regions of the Himalaya. The aims of the present paper are to document, measure and interpret key soil erosion processes and provide an estimate of erosion rates in the Khajuri Stream catchment located in the eastern Siwalik Hills. We used erosion pins to monitor sheet erosion, gully erosion, landslides and stream bank erosion over the period from 2002 to 2004. Sheet erosion from forest and shrubs generally varied from 0.8–1.2 mm·yr−1 with a mean erosion rate of ~16 t·ha−1·yr−1. Gully erosion rate was estimated to be ~14 t·ha−1·yr−1. Erosion from landslides was significantly higher which was estimated to be ~26 t·ha−1·yr−1. Stream bank erosion varied widely from 0.03 to 0.25 m·yr−1 with a mean erosion rate of ~8 t·ha−1·yr−1. Based on these rates, it was estimated that ~21,000 m3 (64 t·ha−1) of sediment was being eroded within the catchment annually. In comparison to the erosion rates of other regions of the Himalaya these rates are significantly higher.

1. Introduction

Soil erosion is one of the key environmental issues of mountain ecosystems [1]. Soil erosion may lead to loss of top soil, decrease of soil water capacity, soil fertility and also inhibit vegetation growth [2,3,4]. Knowledge of the interaction of geomorphologic drivers within a catchment in relation to soil erosion and land degradation has been developed by many studies around the world [1,5,6]. Over the past few decades Nepal Himalaya has been the focus of numerous research studies exploring the relationships between different components of the hydrology and geomorphology particularly rainfall, runoff, soil erosion, sediment loss, land use and socio-economic impacts at a broad range of spatial and temporal scales. There has been considerable research on soil erosion issues mostly focused on the Middle Mountain region [7,8,9,10,11,12] and a few in the High Himalaya [13,14]. Gabet et al. [13] explored the potential relationship between rainfall, erosion, tectonics and topography by analysing flow data from 10 river gauging station in the High Himalayas and found that annual erosion rates increased with flow discharge and precipitation. Average erosion rates varied from 0.3 to 2 mm·yr−1.
Soil loss from landslides is the most significant type of erosion in steep hilly landscapes [8]. Many studies have suggested that sediment contribution from landslides in the steep hill catchments is significantly higher than from sheet erosion, e.g., [15]. In addition, gully erosion may represent an important sediment source in a range of environments [16,17] and also act as a sensitive indicator of environmental change [18]. Gullies can remove a large quantity of soil even though gully densities are not usually high. Poesen et al. [17] reported that gully erosion can contribute between 10 and 94 percent of overall soil loss from an area. Chaplot et al. [19] reported gully erosion rates of slopping crop land system of northern Laos where linear erosion (rills and gullies) varied from 0.1 to 2.4 t·ha−1·yr−1. Various processes of landslides and mass movement have also been widely studied, e.g., [9,20]. However, measurement of erosion and quantification of sediment production from these processes is limited. Gafur et al. [21] reported a sediment loss rate of 30 t·ha−1·yr−1 from the upland part of a catchment in Bangladesh due to shifting cultivation while the regional average sediment yield associated with shifting cultivation was estimated to be 1.2 t·ha−1·yr−1. These facts indicate that soil erosion and sediment loss rates significantly vary depending on the type of sediment sources and other factors related to land cover, topography, climate and land use management.
The Siwalik Hills is considered one of the most fragile and vulnerable ecosystems in the Himalaya [22] where soil erosion and landslide processes are very active partly due to its location within the zone of active crustal movement [23]. However, comparatively there is very limited knowledge on soil erosion rates and processes in this region. The Siwalik Hills is a geologically recent tropical mountain range characterised by steep and highly dissected terrain. Known as the foothills of the Himalayas, the region is located between the lowland Terai plain and the Middle Mountain range. Intense monsoon-driven rainfall regime, higher local relief and weak geological formation has led to the formation of landforms such as rills, gullies, shallow landslides and stream cut banks [22]. The proportion of these landforms in the Siwalik Hills was found to be 10 times higher than the Middle Mountain region even though both regions belong to a similar rainfall regime [24]. Because of these active erosion processes, the region loses a significant amount of sediment every year, leading to land degradation in the region itself and sediment deposition further downstream on the lowland Terai plain [25]. Hence, understanding of soil erosion and sediment mobilisation processes in the Siwalik Hills is of greater significance.
Forest degradation, manifested through decline in forest cover, and the resulting soil erosion, is a serious problem in Nepal [26]. Over the last few decades, deforestation has become widespread and significant areas of forests have been degraded due to the growth of population, its re-settlement, and accompanying infrastructure development [27]. In this region, studies mainly focused on the understanding of land use change, erosion processes such as landslides and gullies, e.g., [7,28] and modelling long-term soil erosion [29] but very few studies are available that focus on the estimation of eroded sediment from these processes [30]. There have been almost no studies that focus on the understanding of various types of sediment sources and quantification of erosion rates based on direct field measurements and observation. The aims of the present paper are to document, measure and interpret key soil erosion processes and estimate erosion rates in a study catchment of the Siwalik Hills. The data and information collected in the field and the output from this study would be helpful for planning and designing erosion control measures in order to prevent land degradation and protect the environment of the Siwalik Hills.

2. Study Area

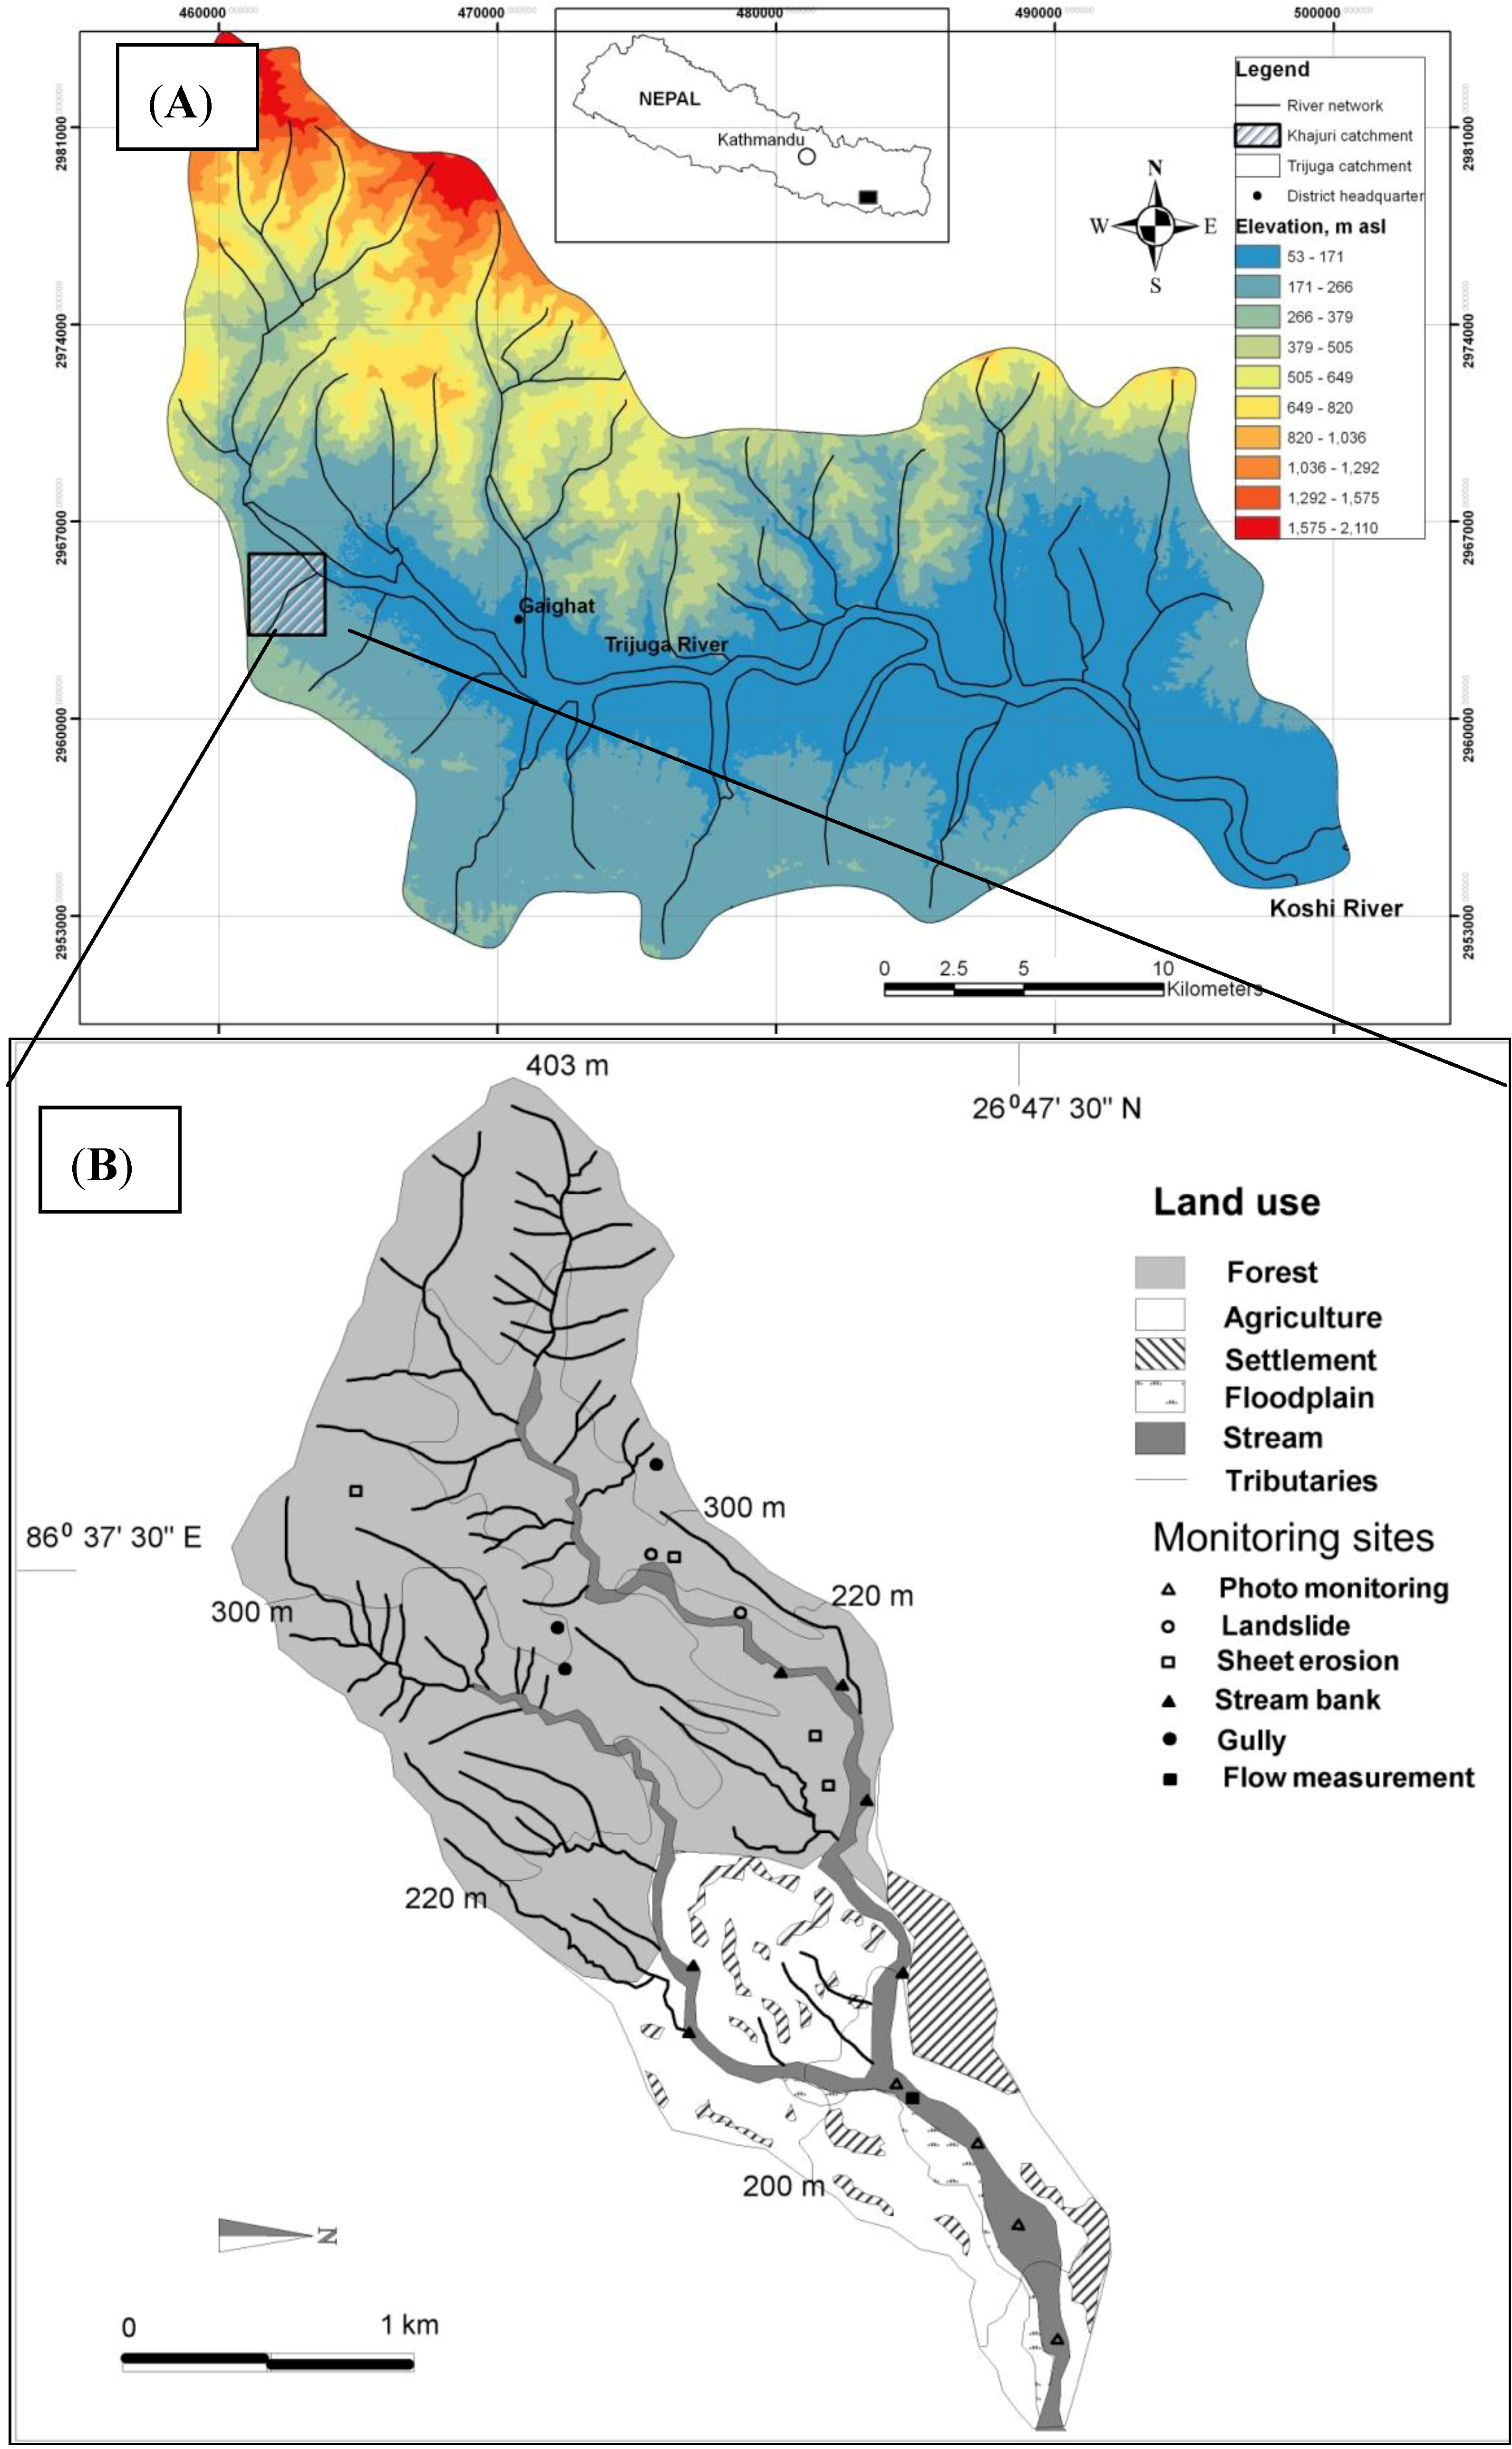
The study catchment (named Khajuri, ~4.6 km2) is a sub-catchment of the Trijuga River valley, eastern Nepal (26°47′35″N, 86°39′11″E) (
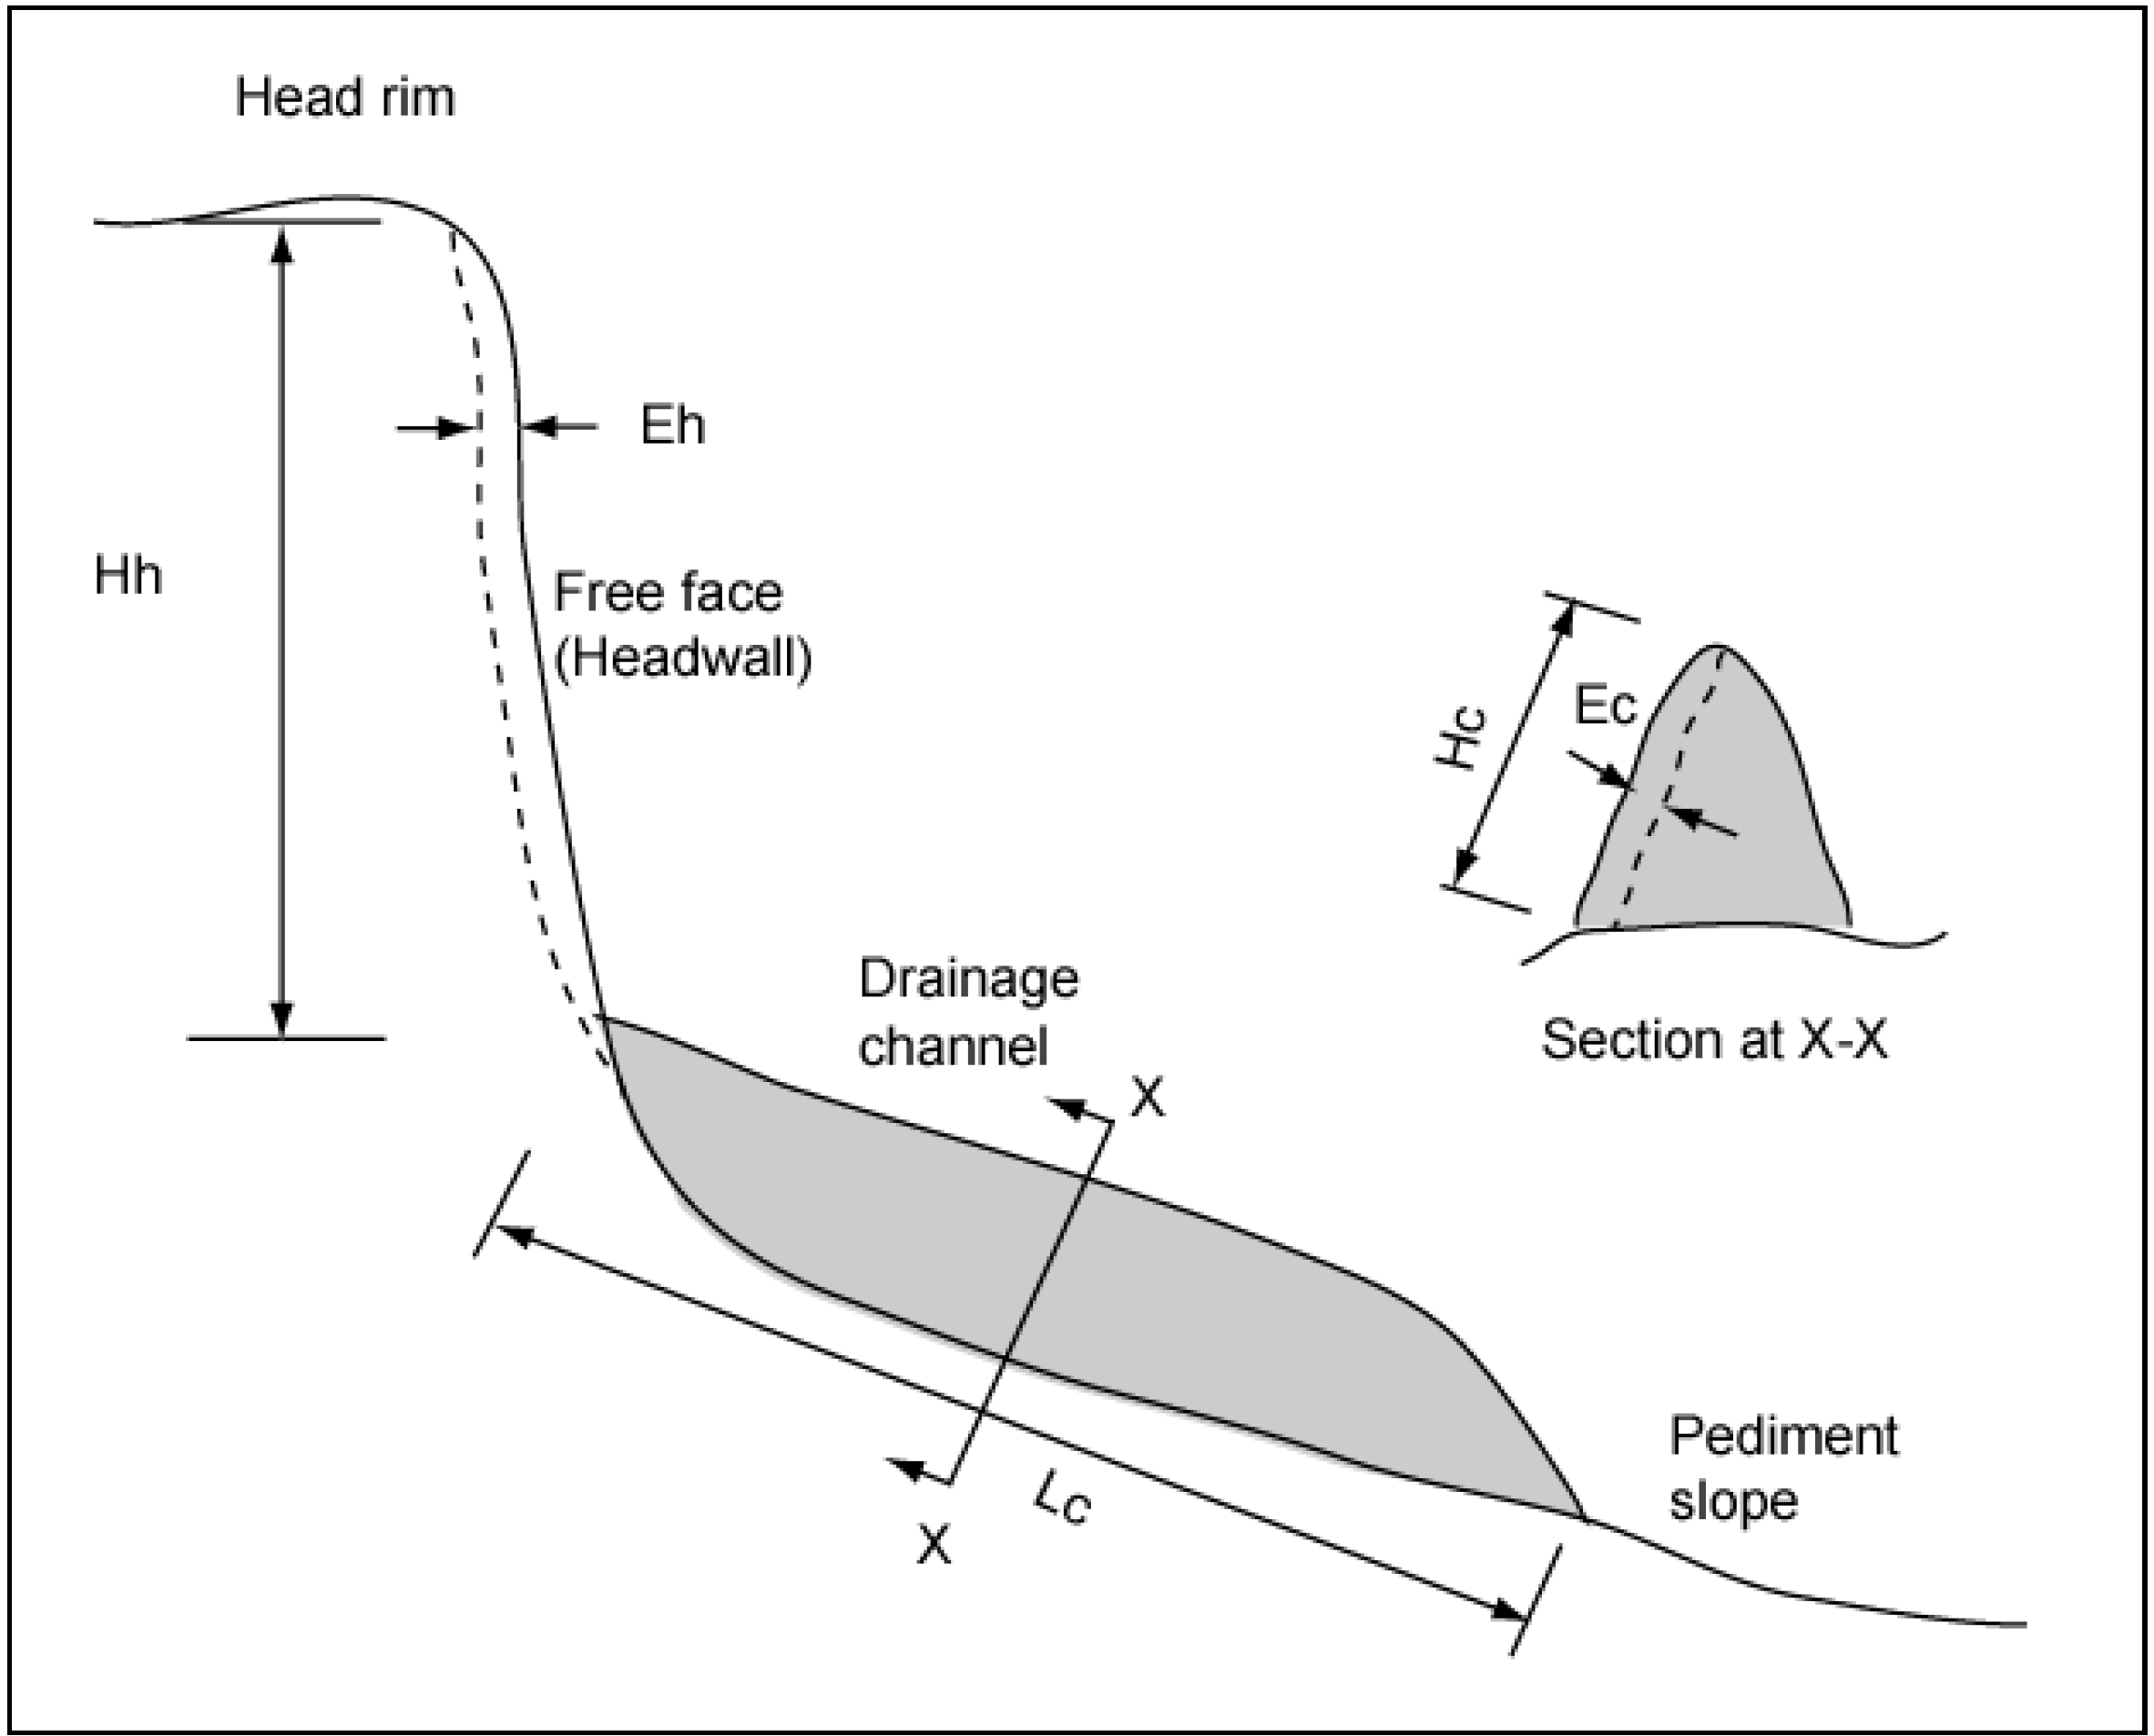
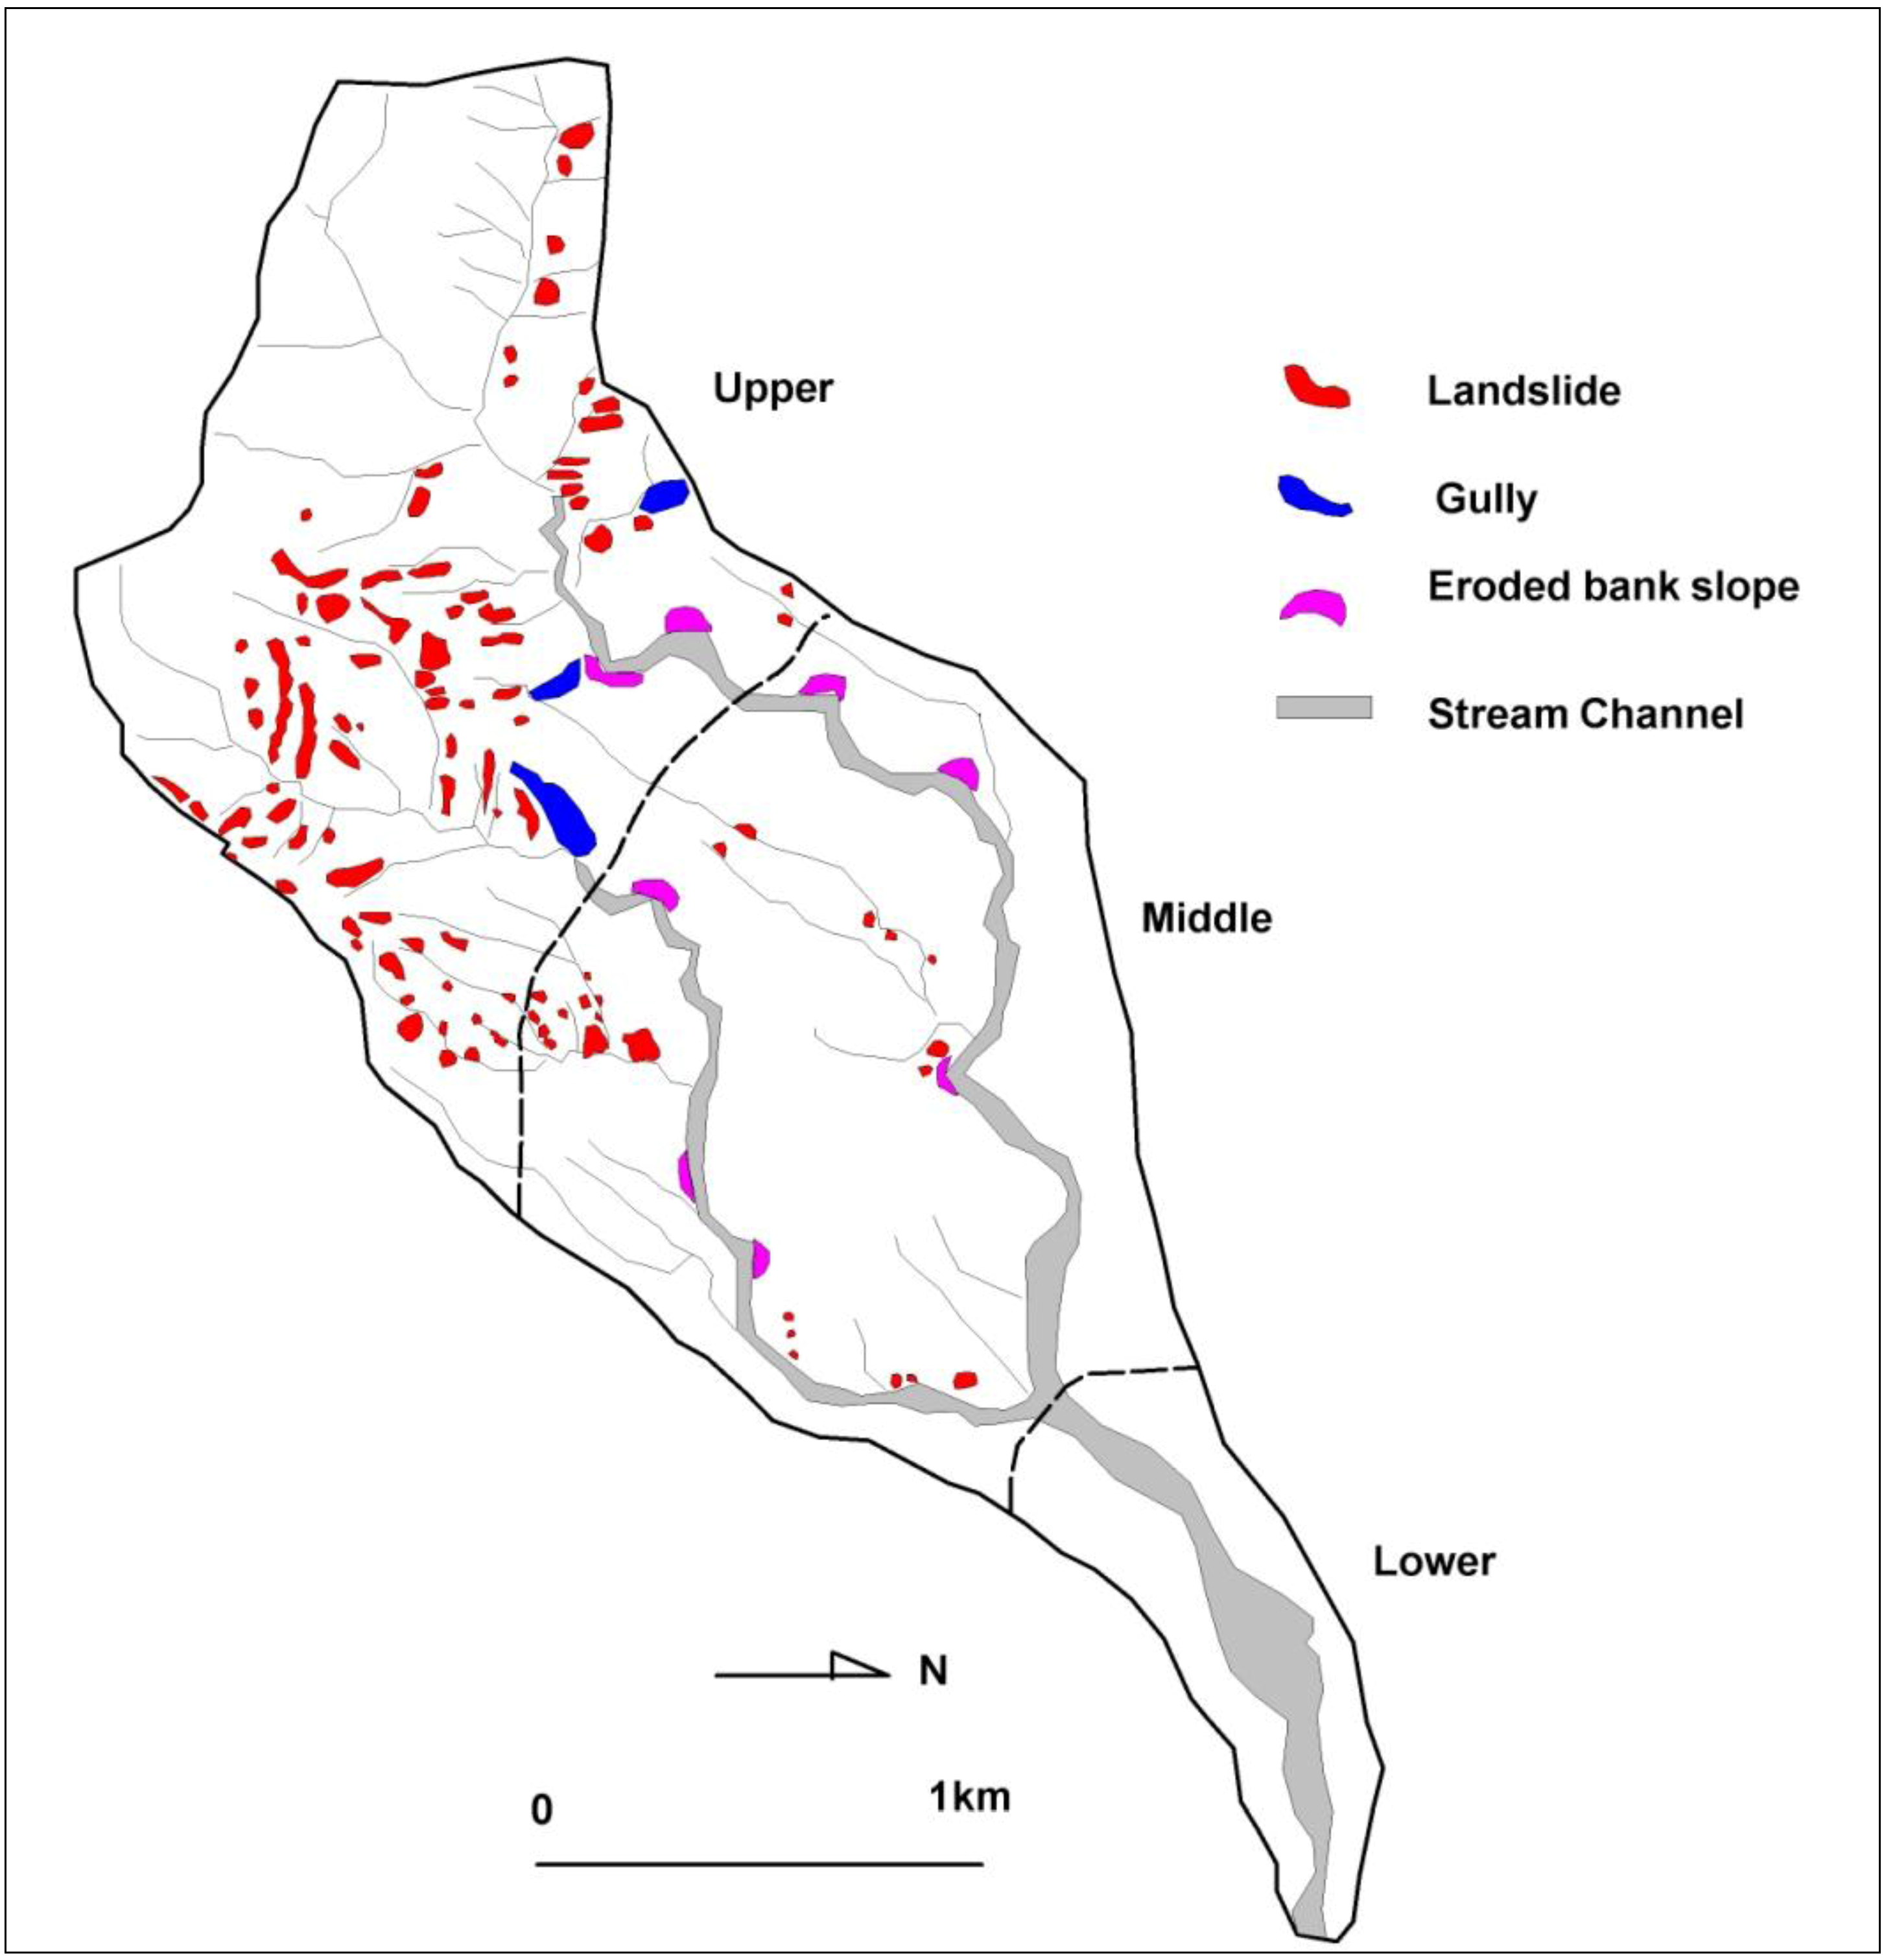
Figure 1A). The Khajuri catchment has an elevation ranging from ~165 m a.s.l. on the low-lying floodplain to ~370 m a.s.l. on the ridge. Geomorphological classification indicated three distinct divisions: Hills (>280 m a.s.l.), Terraces (200–280 m a.s.l.) and Floodplain (<200 m a.s.l.) called hereafter as upper, middle and lower reaches, respectively. The upper reach is composed of relatively coarser and loose boulders, mostly dominated by landslides despite good vegetation cover. Rainfall induced gullies were predominant in this part of the catchment making it a major source of downstream sediment. Further downstream where slopes are gentler and floodplains wider, eroded stream banks were the dominant sources of sediment.
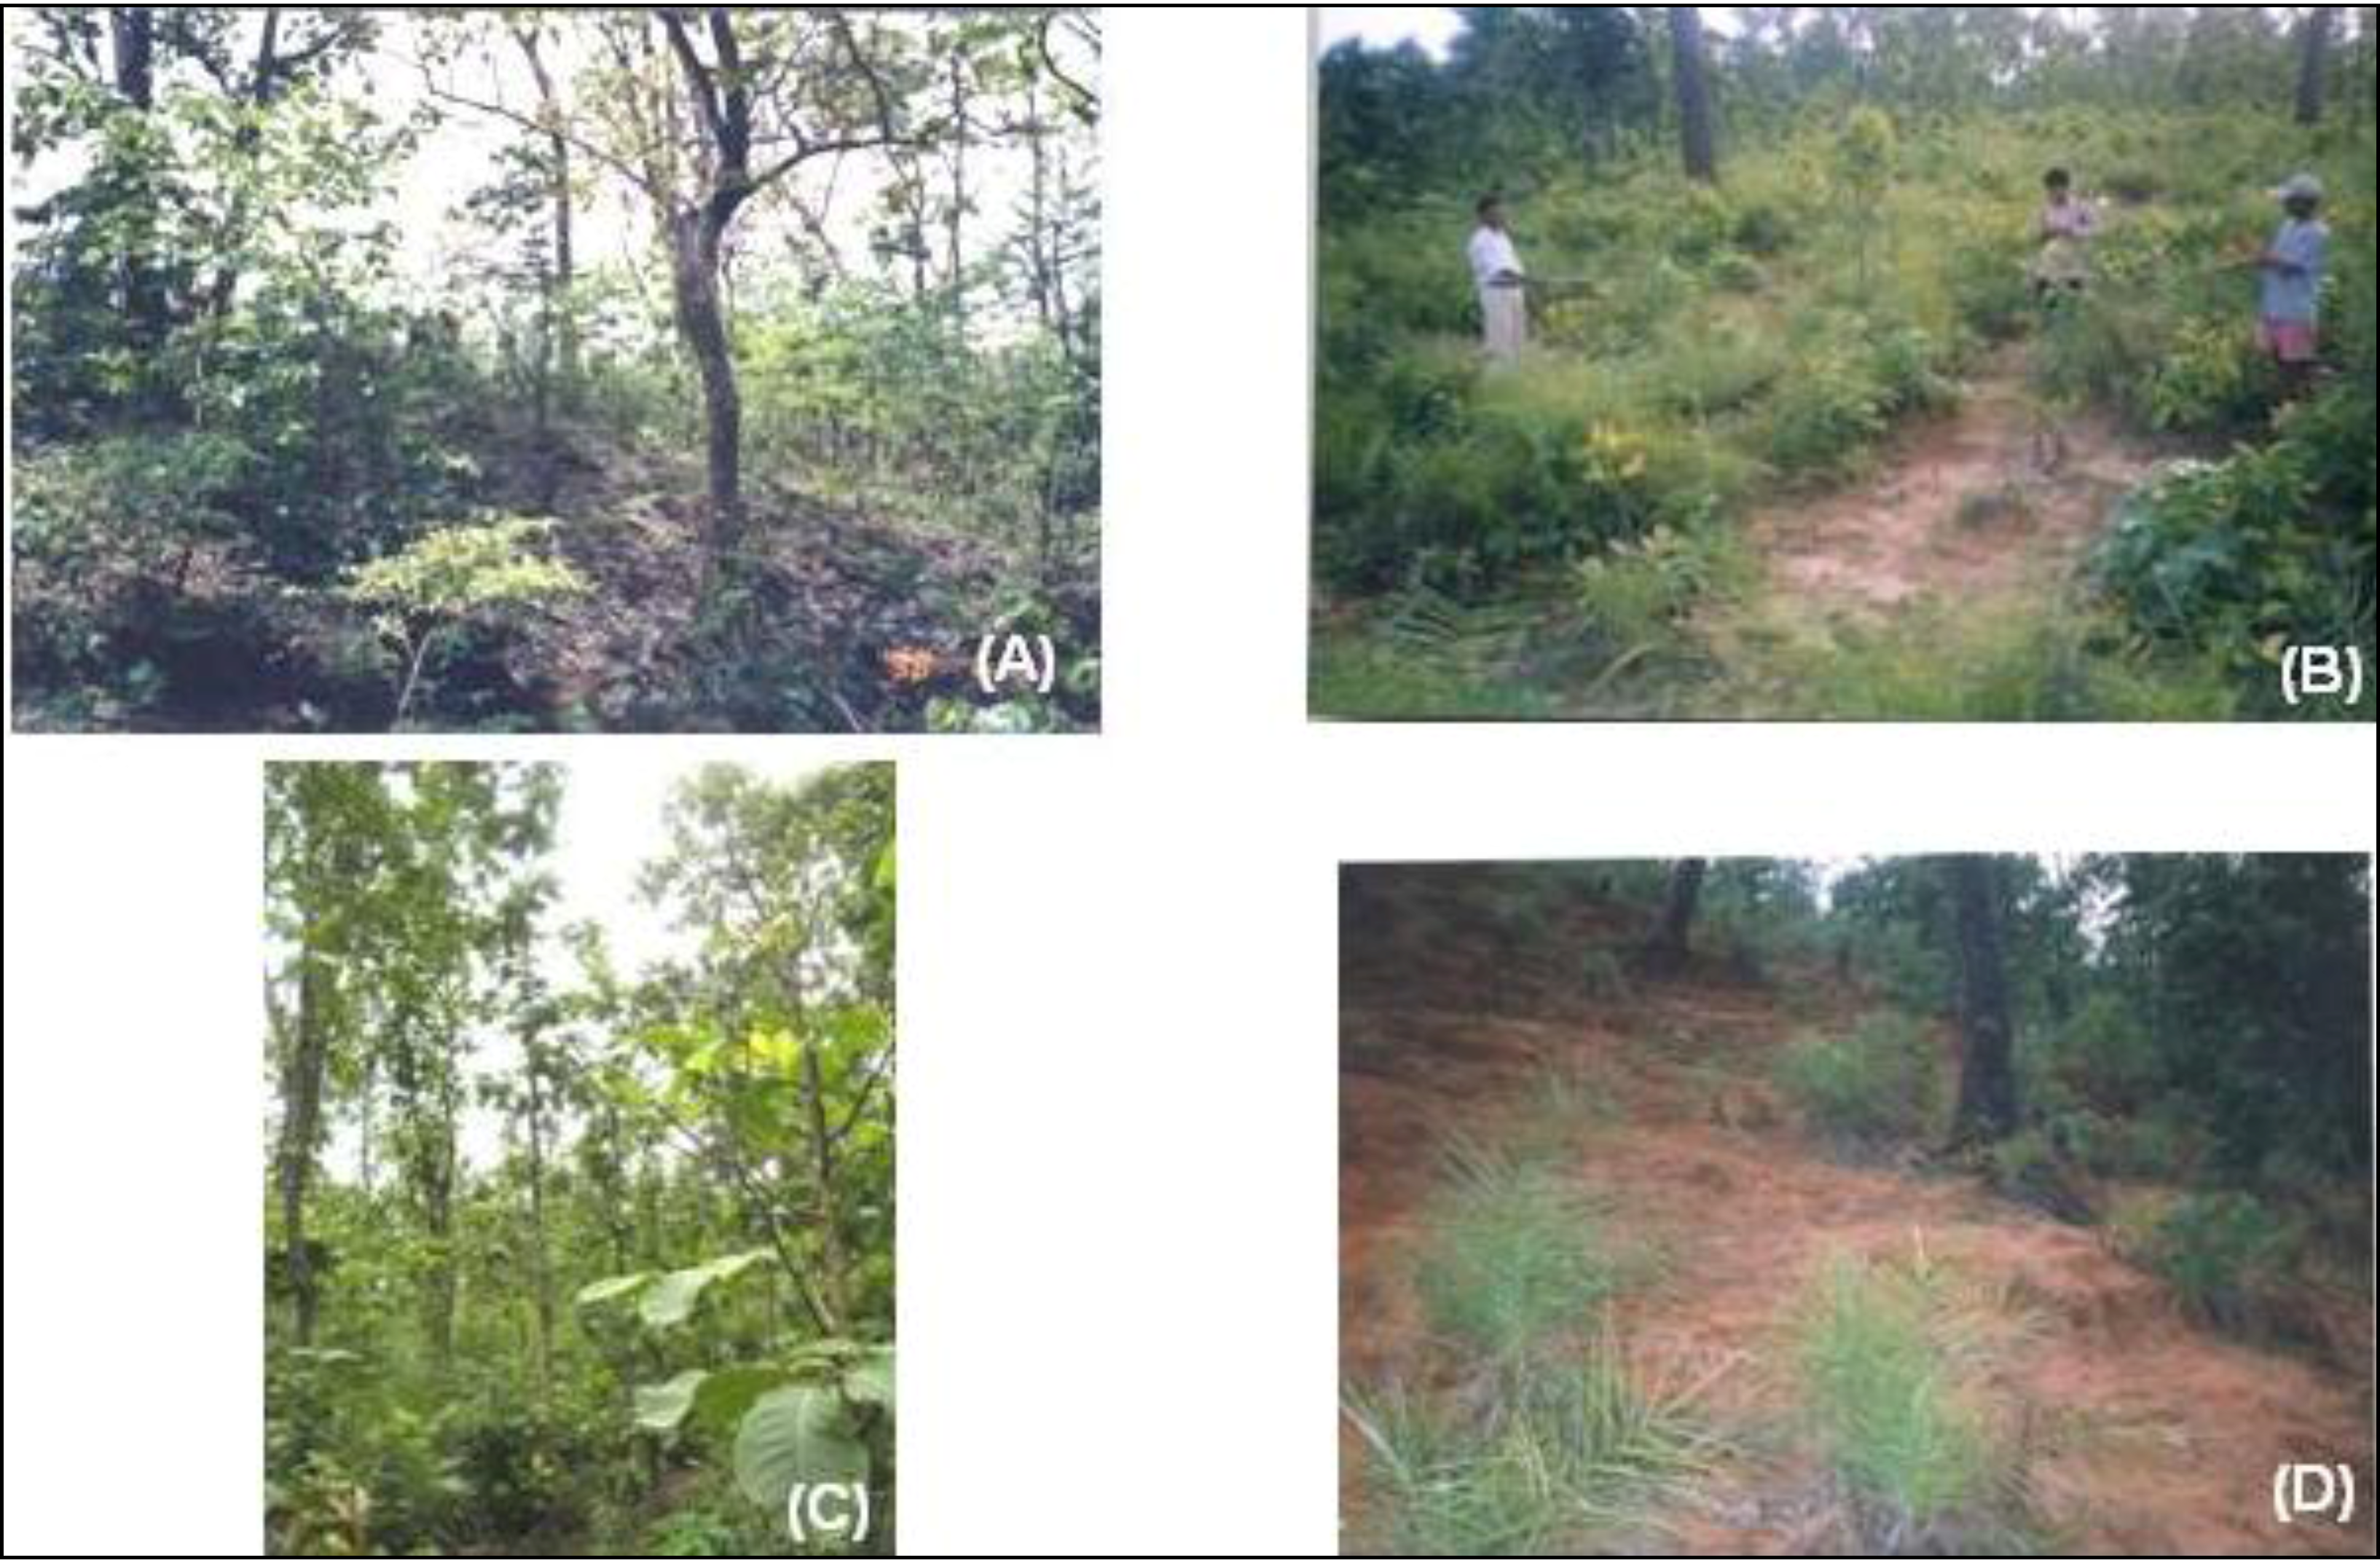
Tropical deciduous forest cover (mainly Shorea Robusta) dominates the upper reach of the catchment [31] whereas the middle reach comprises a combination of forest, shrubs and terrace cultivation (Figure 1B). The lower reach mostly consists of a combination of human settlement and cultivation. This region is characterised by humid tropical climatic conditions where mean winter daytime temperatures are between 22 °C and 27 °C and summer temperatures exceed 37 °C [
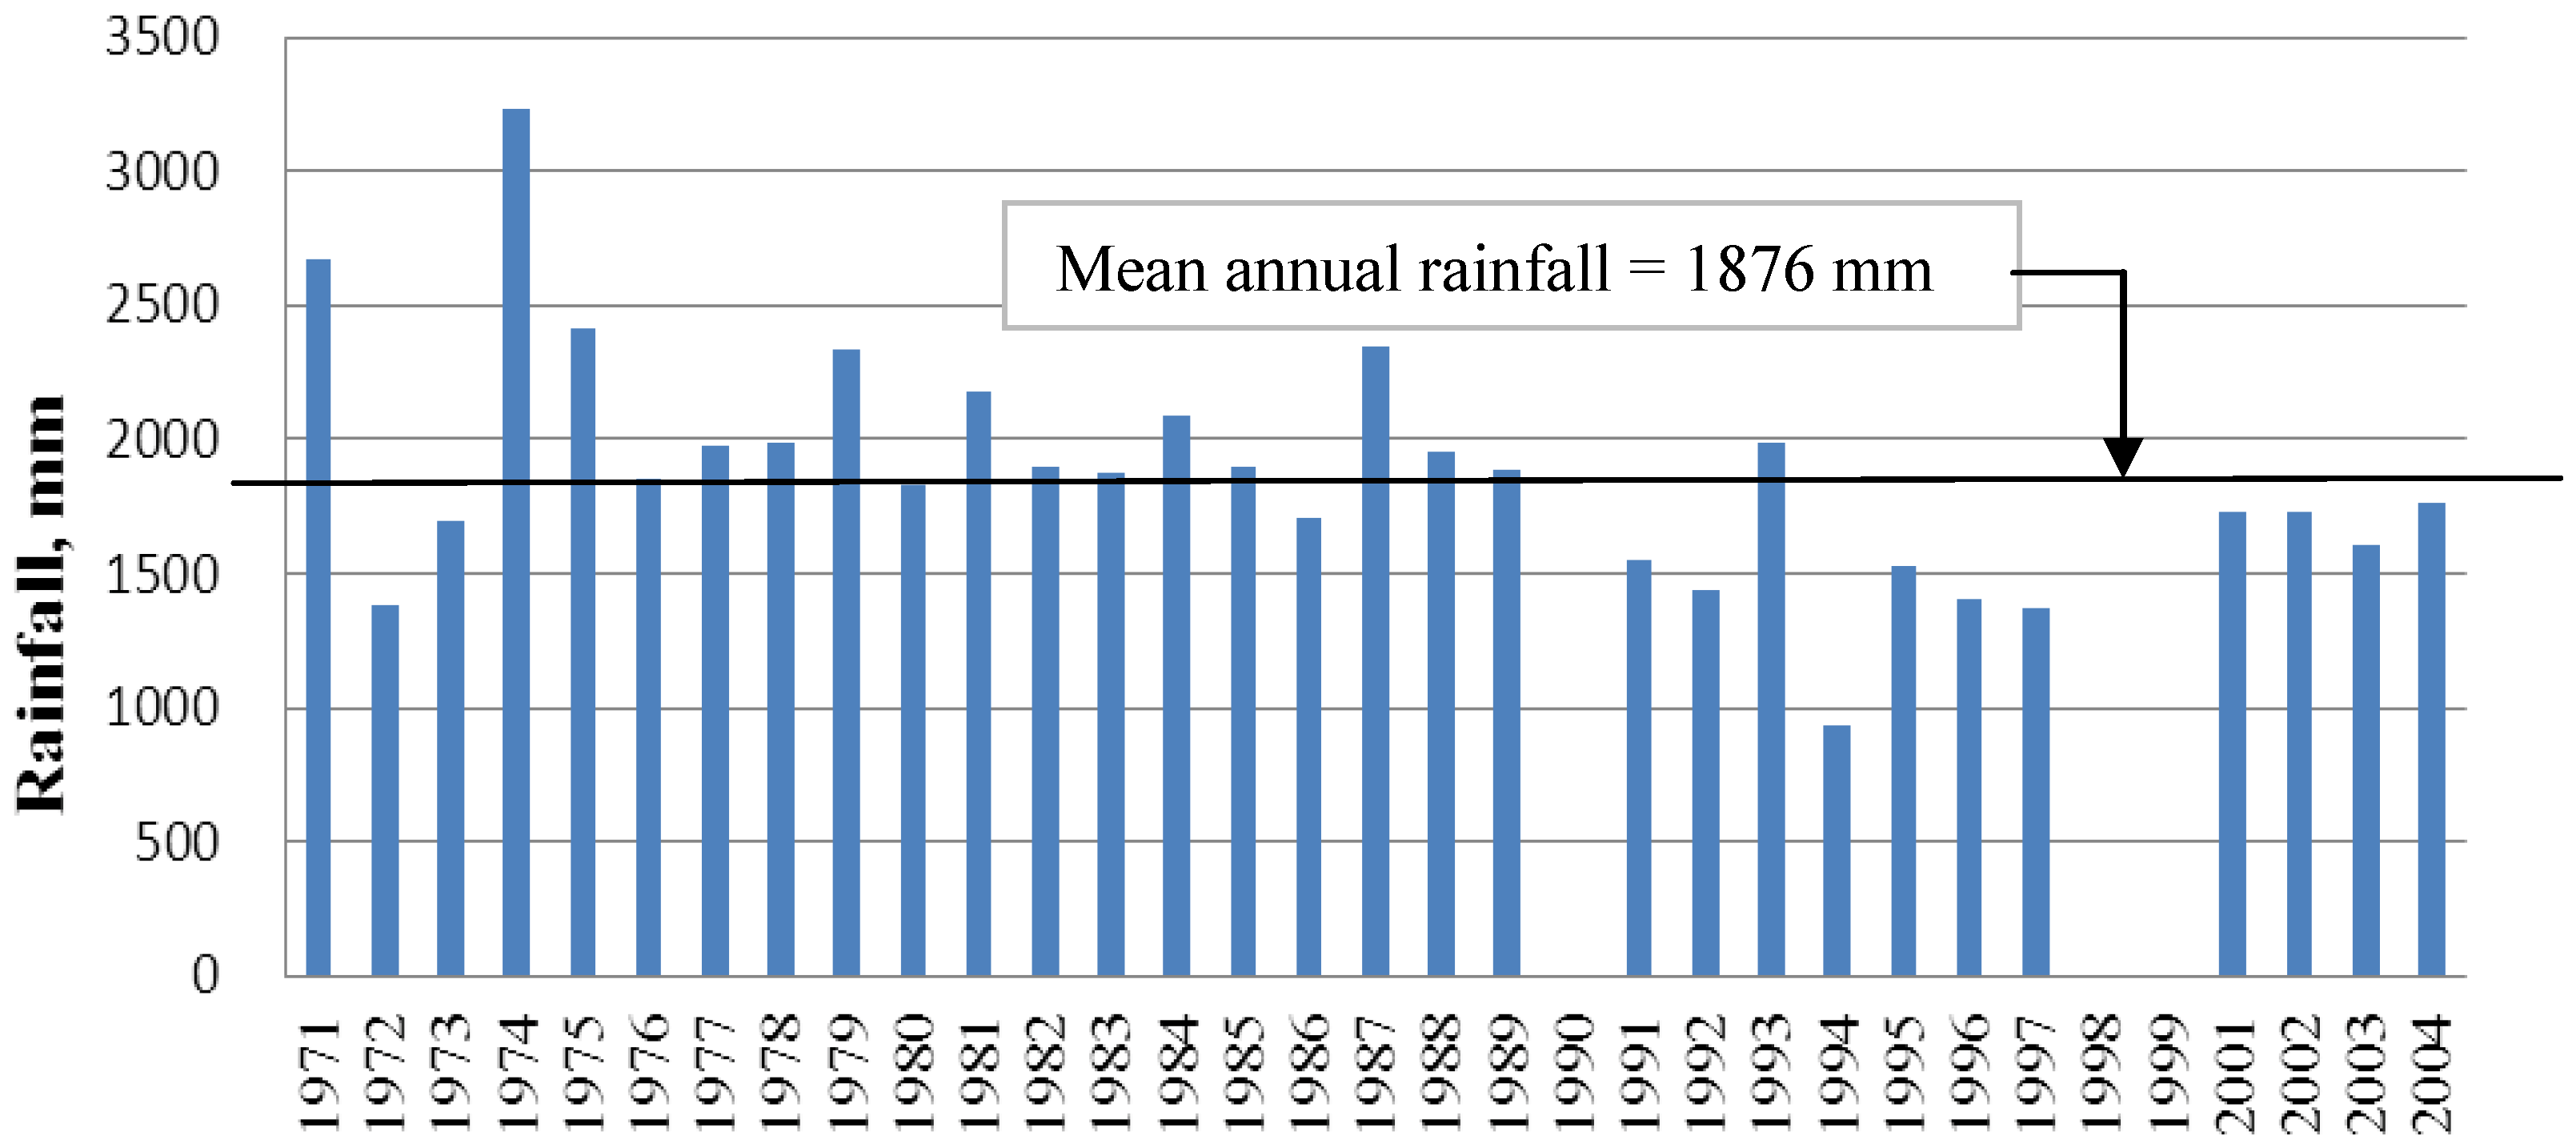
27]. The average annual rainfall is 1,875 mm as measured at Lahan and Gaighat [
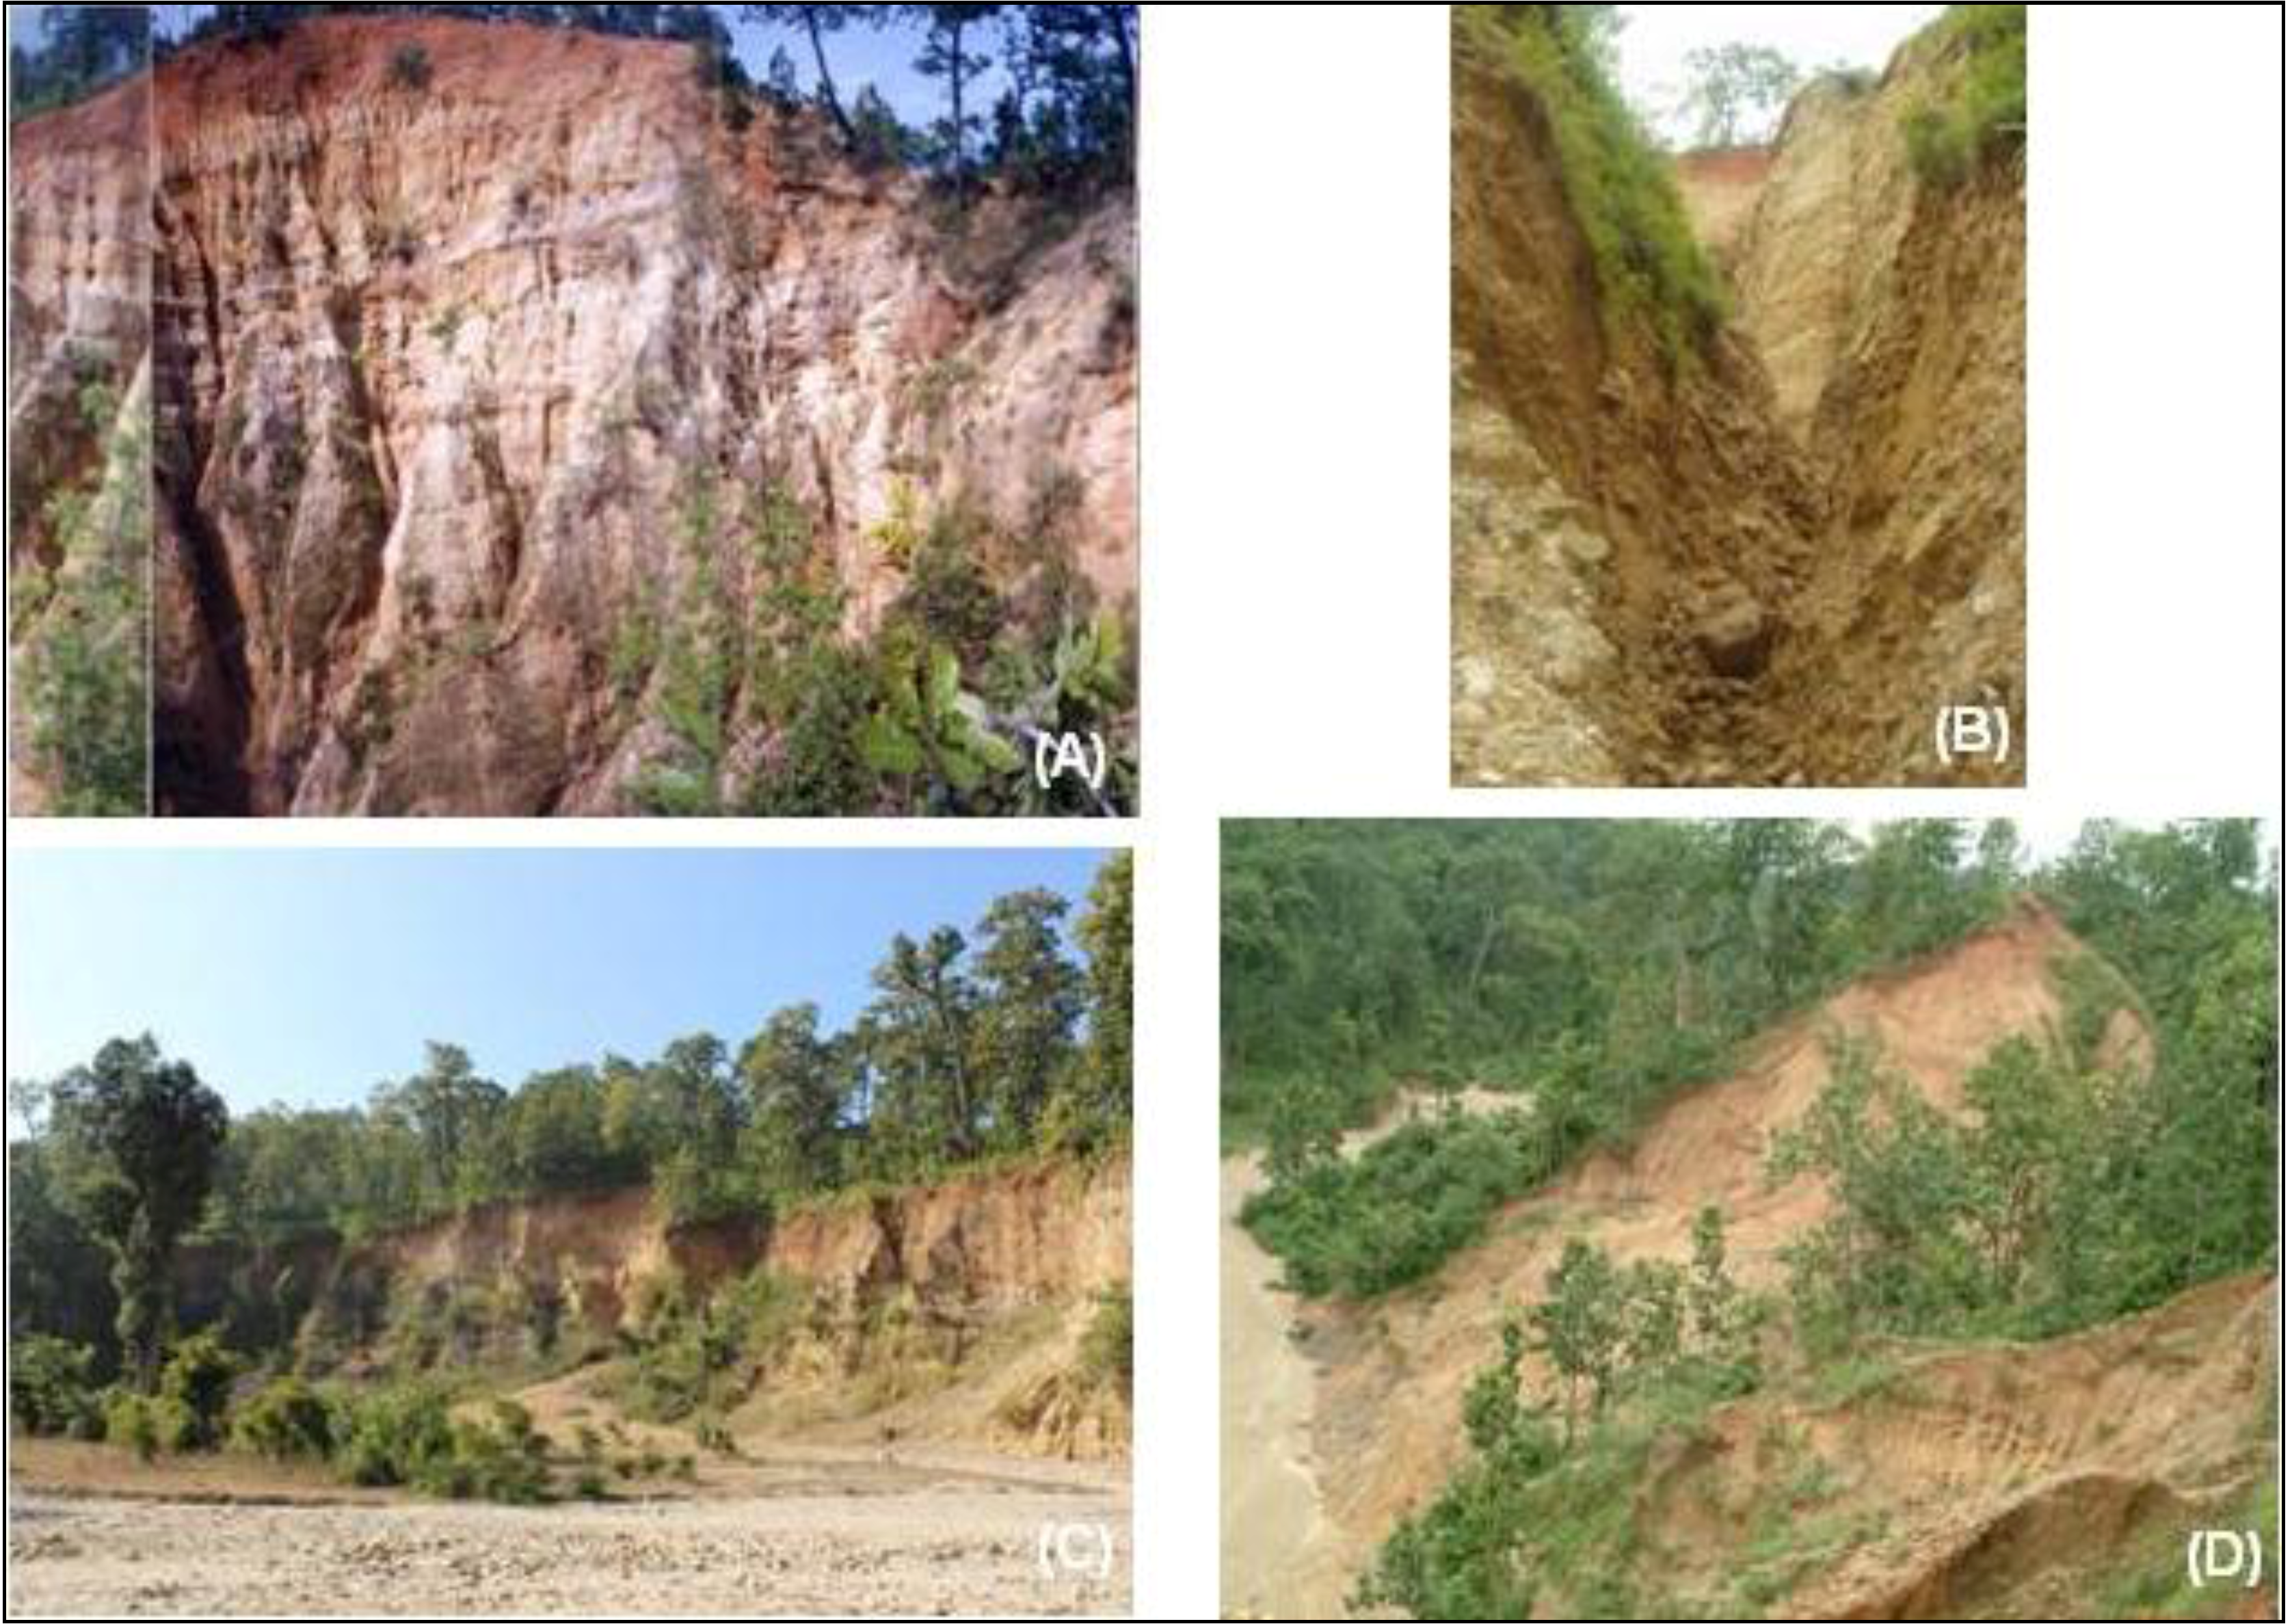
32]. The catchment has many tributary watercourses and numerous drainage flow paths that mostly originate from the upper and middle reach of the catchment. Various types of soil erosion were evident within the catchment, predominantly sheet erosion, gully erosion, river bank erosion and landslides (Figure 2).
Figure 1. (A) Location map; (B) Land use map of Khajuri catchment.
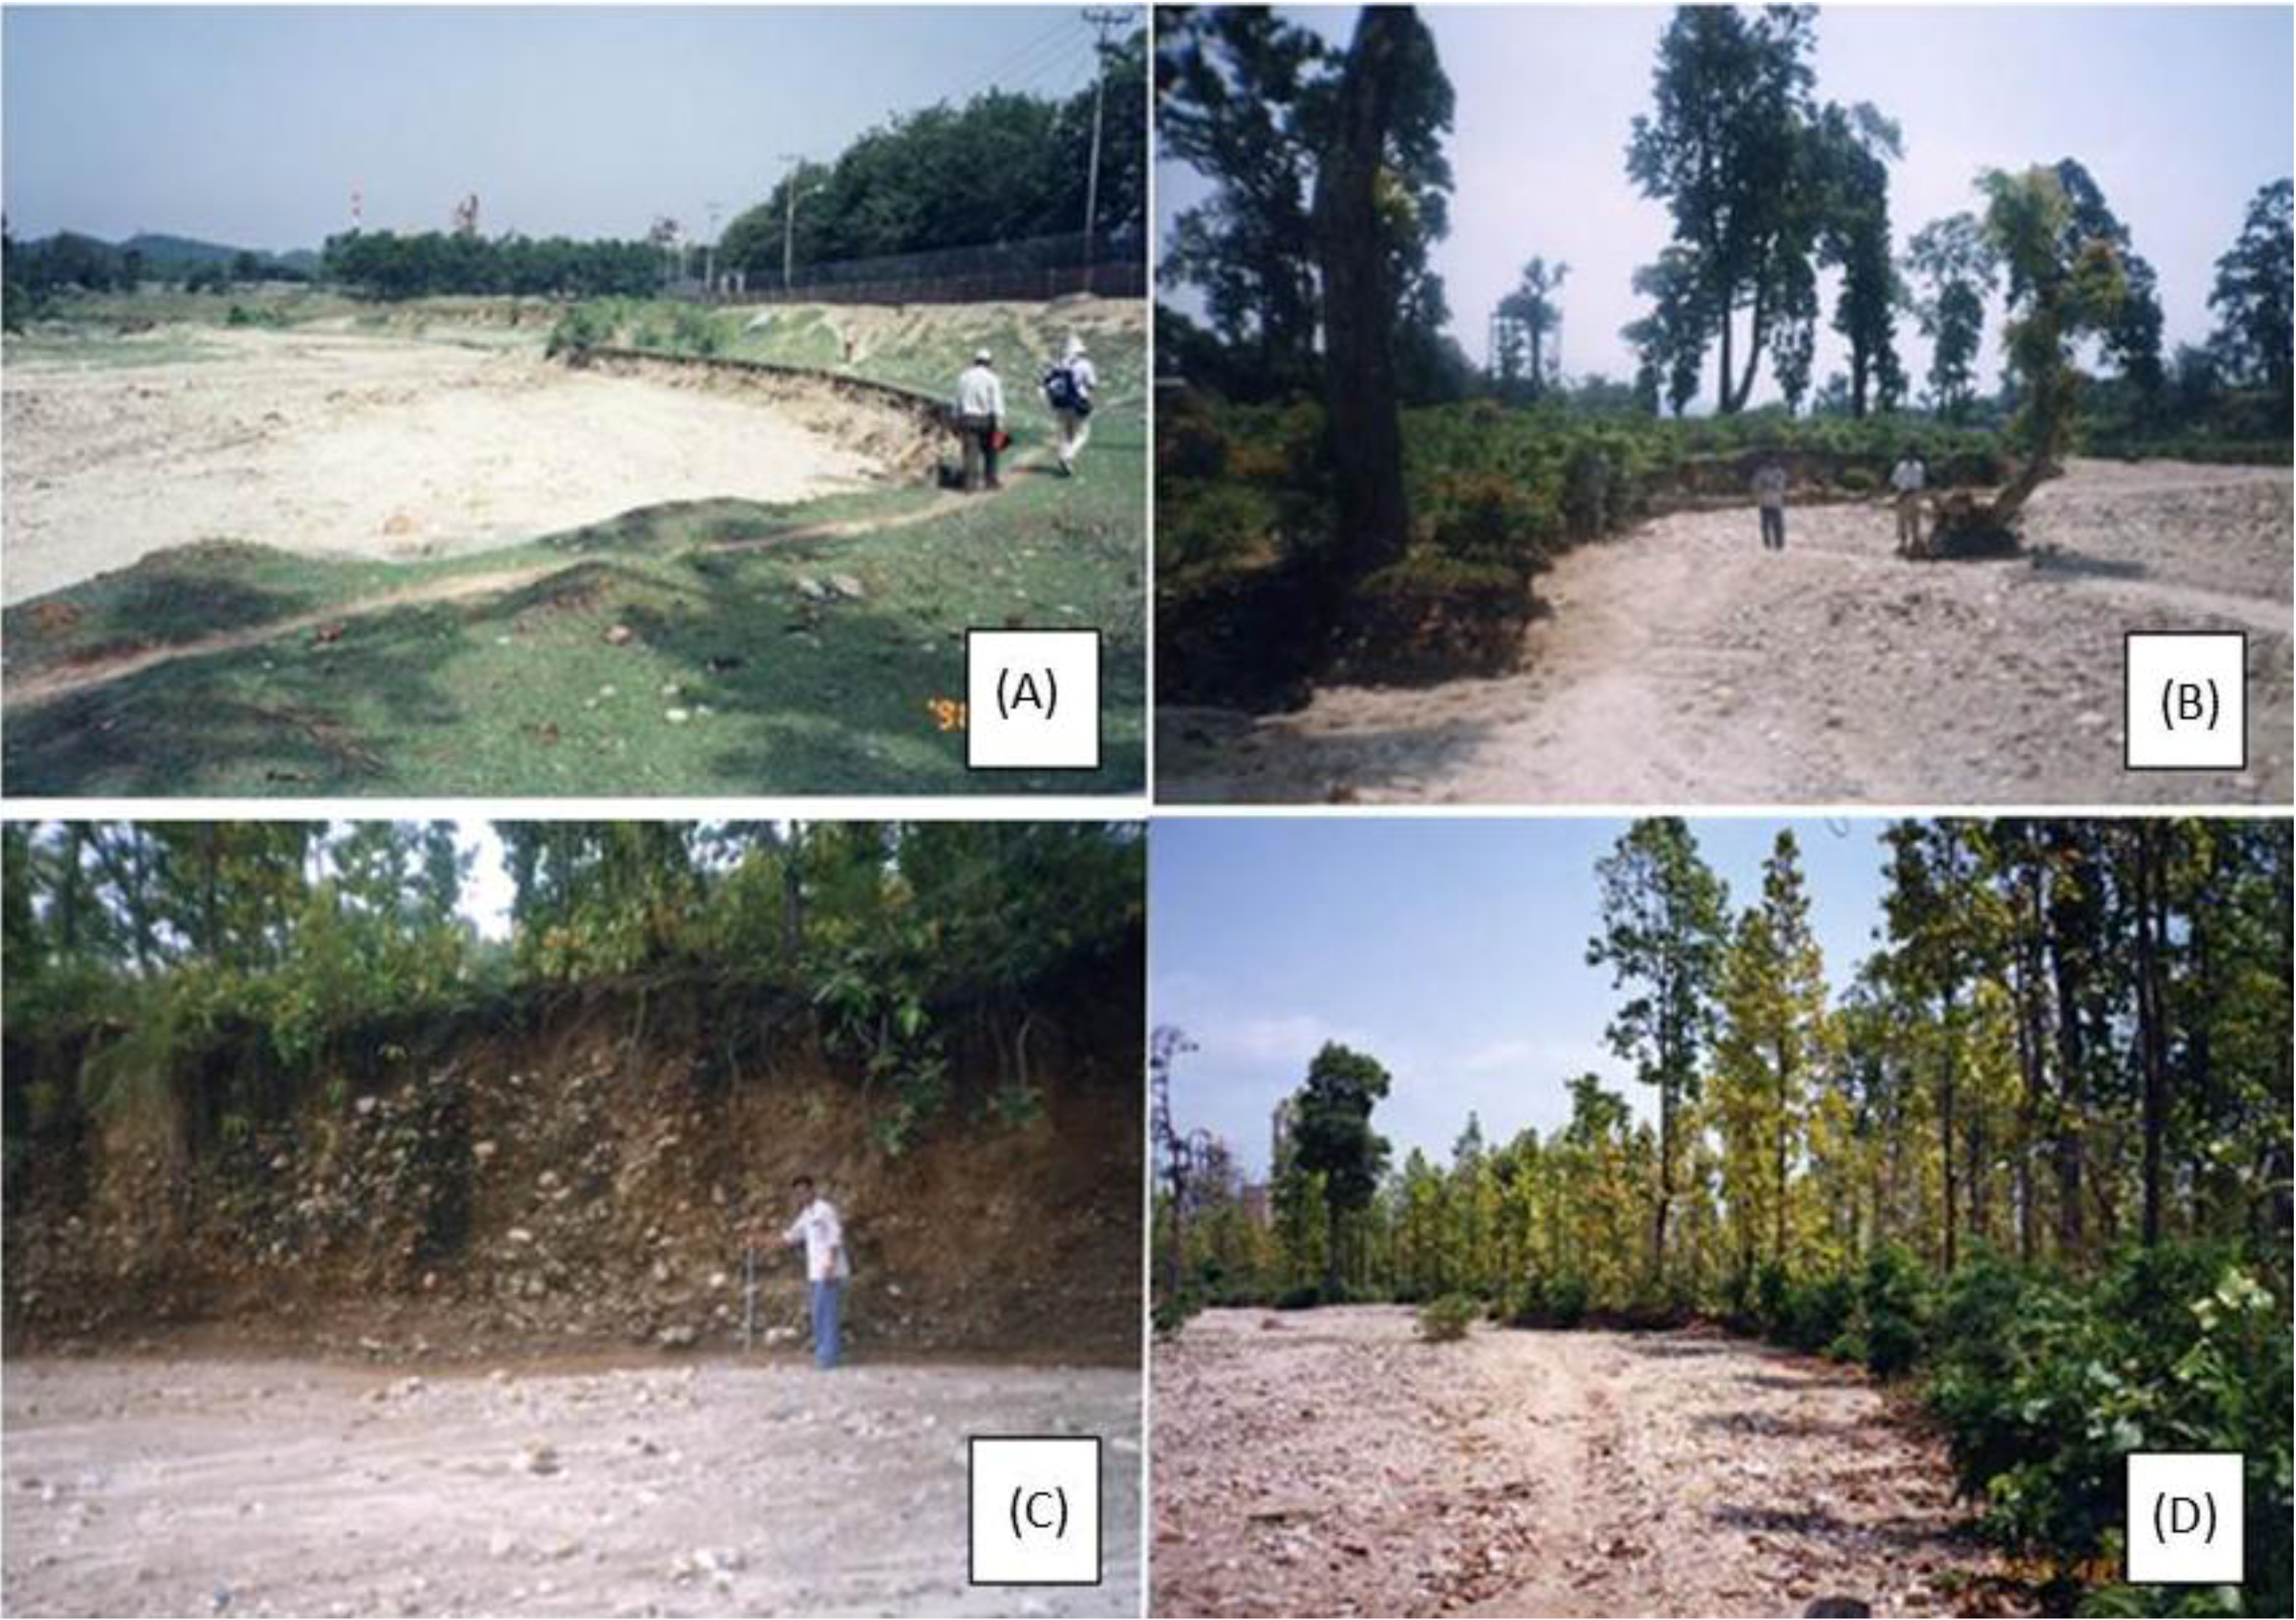
Land 02 00370 g001
Figure 2. Different types of sediment sources: (A) gully head; (B) gully channel side slopes; (C) eroded bank slope; (D) landslide.
Land 02 00370 g002

3. Methodology

Measurement of Erosion

Erosion pins were used to monitor erosion from ground surface (sheet erosion), gullies, landslides and stream banks. Erosion pins made up of iron nails were used with a length ranging from 30 to 50 cm and diameter of 8 to 12 mm. Many studies have employed this technique to measure erosion [33,34,35,36,37]. The method is simple, cheap and effective, which can be applied for assessing temporal and spatial patters of soil erosion in a wide range of fluvial environments [38,39].
Boix-Fayos et al. [40] provided a review of the sources of errors and variation of erosion measurement. The main issues are related to (i) temporal and spatial scales; (ii) representation of natural conditions; (iii) the disturbance of natural conditions; and (iv) account of the complexity of ecosystem interactions all of which are thoroughly considered while taking measurements. Although relatively easy and simple to apply, the erosion pin method is less accurate than other methods such as using a collector trench in assessing soil loss from a hill slope [37]. There may be various sources of error. Insertion of erosion pins may lead to the soil surface becoming loose to some extent which can produce excessive and misleading erosion. Also, the erosion pins may be disturbed by ant activities. Sometimes erosion pins can be lost due to disturbances by humans. In order to minimize the first source of error, thin iron nails (8 mm diameter) were used. Care was taken while inserting the pins into the soil surface. They were inserted with uniform impacts of hammering in order to minimize the soil disturbance. For minimizing the disturbance of ants, the sites were fixed away from the area of ant activities. Around 10 erosion pins were found missing from the sheet erosion sites and seven pins from bank erosion sites during the monitoring period as a result of human and animal activities; however they were replaced immediately in order to establish continuous data throughout the monitoring period.
Data accuracy depends on the measurement method as erosion amounts are relatively small, especially in the forest and vegetation cover. Therefore, measurement was carried out using a hand tape with precision of 1 mm. This precision is suitable since it is difficult to accurately measure erosion less than 1 mm. In order to identify the erosion pins clearly on the ground, the component of the pins exposed above ground surface was enamel painted. This aided the rapid identification of erosion or deposition. The method was therefore useful for representing the erosion processes with reasonable accuracy. In order to account for the overall error estimates, the erosion rates and corresponding sediment production were estimated within a 1 standard deviation of the error bounds.

Sheet Erosion

A total of four monitoring sites were established considering different land covers (Figure 3, Table 1). The local slope gradient of these sites varied from 10 to 35 degrees and slope length from 9 to 38 m which were representative of the typical land topography of the Siwalik Hills. The sites located on the forest and shrubs generally consisted of black soil containing mostly silt and fine sand. The site on the bare land however comprised of red soil with silt and fine sand. Erosion pins were inserted into the soil along five slope transects with 3–5 m intervals across the slope. For each transect, five pins were spaced at 5 m intervals downslope. The lengths of the pins that were left exposed above the soil surface were measured two times a year (during summer and winter) using a measuring tape with a precision of 1 mm. The bulk density of the surface soil at each site was also measured. Thus, the mass of soil eroded or deposited per unit area (kg·m−2) can be calculated by multiplying the change of length of the pins left above the soil surface, by the bulk density of the soil layer [39].
Figure 3. Sheet erosion monitoring sites: (A) dense forest; (B) shrub and bush; (C) dense forest with shrub; (D) bare ground.
Land 02 00370 g003
Table 1. Characteristics of sheet erosion sites.
SiteLand UseMean Slope Gradient
(degree)
Size
(m × m)
Slope Length
(m)
Soil TypeNo. of Erosion Pins
KH1Partially dense forest3015 × 99Black soil, Silt and fine sand19
KH2Shrub and bush1038 × 1038Silt and fine sand11
KH3Partially dense forest with shrub2019 × 1119Black soil, Silt and fine sand15
MH1Bare3524 × 1224Red soil, Silt and fine sand21
The volume of eroded sediment from sheet erosion was estimated by multiplying mean erosion depth and surface area. The estimate was based on two broad land cover categories in the catchment: forest and agricultural land. As erosion from agricultural land was not monitored, an average value of 2 mm·yr−1 was assumed for gently sloping rain-fed terrace land. A similar rate was reported by [15] in the Middle Hills who estimated an erosion of 1–2 mm·yr−1 for the outward-sloped agricultural terrace lands.

Gully Erosion

There were several types of gullies in the catchment in terms of size and geometry. As large and active gullies generate significant amounts of sediment, the study focused on erosion measurement of such gullies. Active gullies were characterised by eroding headwalls without vegetation cover and sediment deposited fan. Three gullies named Khjuri-1 (KG1), Khajuri-2 (KG2) and Musahar-1 (MG1) were selected for field measurement and monitoring (Figure 1). Gully erosion takes place by retreating vertical face (headwall erosion) and erosion of channel side slopes [30] (Figure 2A,B). Headwall erosion was monitored by repetitively measuring the distance between the edge of the gully head and benchmark pins established around the gully head. It should be noted that headwall erosion of KG2 could not be measured as the gully head was inaccessible. Benchmark pins (7 no. at KG1 and 6 no. at MG1) were used at a spacing of ~5 m. Erosion of channel side walls was measured by inserting iron pins normal to the side slope surface and repeatedly measuring the exposed segment. The pins were revisited annually during the monsoon (June–September) and winter (December–February) from 2002 to 2004. The details on the measured gully parameters are shown in Figure 4.
The volume of eroded soil mass was estimated using the following equation:
V = (Lh × Hh × Eh) + N × (2 × Lc × Hc × Ec)
where,
  • V-Total volume of eroded soil, m3;
  • Lh-The length of the headwall, m;
  • Hh-Height of gully headwall, m;
  • Eh-Erosion depth of headwall, m;
  • Lc-Length of channel, m;
  • Hc-Slope length of channel side wall, m;
  • Ec-Erosion depth of channel side wall, m;
  • N-Number of channels.
The parameters Lh, Hh, Lc, Hc and N were obtained from field measurements. The multiplication factor of 2 is for taking account of erosion from two side slopes of a channel.
Figure 4. Measurement parameters of gully erosion.
Land 02 00370 g004

Landslides

Landslides were mapped using black and white aerial photographs dated to 1992 (1:50,000) and topographic map (1:25,000) obtained from the Department of Survey of Nepal (Figure 5). Using ERDAS Imagine (version 8.5), the topographic map was first geo-referenced to the Universal Transverse Mercator (UTM) system by selecting permanent ground control points. Polynomial rectification of the aerial photograph was performed using the same software by registering many ground control points both on the topographic map and the aerial photograph. This process of rectification involved the stretching or compression of the image in as uniform a manner as possible in order to match the base map locations of ground control points. Field verification of the landslides was done in December 2004.
It is important to note that some minor errors and discrepancies were detected in the rectified images. For this, residual geo-referencing error was estimated by fixing as many ground control points as possible leaving others “free” and then comparing the actual and mapped location of the free points, the method adopted by [41]. This procedure was repeated for various ground control points to generate spatially variable uncertainty estimates. Residual spatial error (difference between actual and mapped location of a feature) estimated for the aerial photograph was ±7 m. As the size of the mapped landslides was much bigger than the spatial error, it was reasonable to consider that the magnitude of the error did not have significant impact on the assessment. This value is contrasted to errors of up to 47 m for non-rectified images of the same scale. There might be some errors in tracing the landslide boundaries, but working in a digital format allowed us to closely zoom into the features, which could reduce the potential errors significantly.
Figure 5. Mapping of landslides and other sediment sources in Khajuri Stream using 1:50,000 black and white aerial photos taken in 1992.
Land 02 00370 g005
Three landslides (named L1, L2, and L3) were selected for monitoring erosion. Erosion pins were inserted on the landslide slopes at a spacing of 2 m. Erosion monitoring occurred from May 2002 to December 2003, annually. A total of 13, 11 and 10 pins were used at L1, L2 and L3, respectively. Several pins were lost (12 in the first year and 9 in the second year), which were immediately replaced to allow continuous measurement.
Surface area of each of the landslides was determined from landslide mapping using the 1992 aerial photograph (Figure 5). Amount of eroded sediment from a landslide was estimated using the following equation:
VL = AL × Dmean
where,
  • VL-Total eroded sediment volume, m3;
  • AL-surface area of individual landslide, m2;
  • Dmean-Mean erosion depth, m.
The total sediment eroded volume from the landslides within the catchment was estimated by summing up estimated sediment from each landslide mapped on the aerial photograph. It is important to note that, while estimating eroded sediment from the landslides, it was assumed that erosion took place uniformly throughout the landslide slope. In addition, vegetation effects and other controlling factors were not considered in detail. These assumptions and approximations may lead to some inaccuracy in the estimation of eroded sediment volume from landslides. It is therefore cautioned that the resulting estimate of sediment from landslides should be treated as indicative.

StreamBank Erosion

Stream banks can be divided based on soil composition into four types: bedrock, cohesion-less banks, cohesive banks and stratified or inter-bedded banks. Of them, bedrock and stratified banks were mostly prevalent in the area. Most bedrock stream banks were found within the upper reach. Stratified banks were prevalent within the middle reach. The stratified stream banks consisted of bed materials of various size, permeability and cohesion. The stratified formation consisted of inter-bedded layers of silt, fine sand and coarse materials (gravel and boulder). Generally, the bed layer is composed of silt or clay.
Three types of near-bank vegetation can be found: dense forest, shrubs and grass, and bare land. In the upper and middle reaches, the majority of the banks consisted of forest cover, especially young Sal (Shorea Robusta) forest. Partially dense forest, shrubs and grass dominated the lower terraces. No vegetation cover could be witnessed further downstream leading to the exposure of the banks to either agricultural land or bare land. Examples of bank vegetation are presented in Figure 6.
Figure 6. Examples of different types of stream banks and vegetation ((A) bare land; (B) shrubs; (C) shrubs and grass; (D) dense forest).
Land 02 00370 g006
A total of nine bank transects were established along the upper and middle reach of the Khajuri Stream considering soil composition and bank vegetation (Figure 1B, Table 2). Bank erosion was measured using erosion pins perpendicular to the bank face at a height of 20–40 cm from the channel bed (Figure 7) [42]. In total, 94 pins were established for monitoring. The pins were driven into the soil normal to the local bank slope. Retreat of the bank top was determined by measuring the distance between the bank surface from a reference object such as a large boulder or a mature tree. The pins were revisited annually during the monsoon season (June–September) from 2002 to 2004 and follow up field observation occurred annually until December 2012.
Table 2. Characteristics of bank erosion transects established in the Khajuri catchment.
TransectLength (m)Height (m)Vegetation
KB1621.4bare
KB3333.2forest
KB4621.5forest
KB5392.25forest/roots
KB6161.5forest/roots
KB7201.75shrubs
KB8403.25shrubs
MB1706.5bare
MB2127.5forest
Figure 7. Measurement of stream bank erosion using erosion pins. Dt1 and Dt2 represent distances between bank face and reference object (e.g., large bounder) at time t1 and t2, respectively.
Land 02 00370 g007
Eroded sediment was estimated using the following equation:
VB = L × H × Dmean
where,
  • L-Bank length, m;
  • H-Bank height, m;
  • Dmean-Mean erosion, m.

4. Results and Discussion

4.1. Estimation of Soil Erosion Rates and Eroded Sediment

4.1.1. Sheet Erosion

Monitoring data indicated that sheet erosion from forest and shrubs generally varied from 0.8–1.2 mm·yr−1 (Table 3). In contrast to this, the erosion on the bare land was much higher (7 mm·y−1). This indicates that there was a strong influence of land cover on sheet erosion. Kukal et al. [43] also found that vegetation cover was more important than slope steepness in determining sheet erosion in the Siwalik Hills of Haryana-Panjab, India. Bare lands are prone to intensive weathering resulting in the formation of red soil. Due to lack of organic materials, red soils are particularly sensitive to degradation [44].
Table 3. Mean sheet erosion rates.
Land Use* Annual Mean Erosion (mm·yr−1)
Partially dense forest1.0 ± 0.6
Shrub and bush0.8 ± 1.8
Dense forest with shrub1.2 ± 0.7
Bare land7.0 ± 3.8
* Standard error limits are the 95% confidence interval limits.
Erosion rates of forest and shrub land varied from 0.8 to 1.2 mm·yr−1. An average value of 1.0 ± 1.0 was considered for the combination of forest and shrub land. Since erosion from agricultural land was not monitored, an estimated value of 2 mm·yr−1 was considered for gently sloping rain-fed terrace cultivated land. A similar rate was reported by [15] in the Middle Hills where down-sloped terrace lands suffered erosion ranging from 1 to 2 mm. Table 4 shows the estimation of eroded sediment based on the average erosion rates.
Table 4. Estimation of annual mean eroded sediment from sheet erosion.
Land CoverAreaMean Erosion RateEroded Sediment
(km2)(m2)(mm)(t·ha−1)(m3)
Forest and shrub land3.4643,464,0001.0 ±1.014 ± 143,464 ± 3,464
Agricultural land0.933933,0002.0281,866
Total eroded sediment, m35,330 ± 3,464
* Mean erosion rate, t·ha−1·yr−116.2 ± 10.5
* Total area of catchment is 460 ha. Bulk density of sediment is 1.4 t·m−3.
Vegetation is an important factor for soil conservation through its role in reducing the erosive impact of precipitation. A large number of studies concluded that the rate of soil erosion decreases as the vegetation cover increases, e.g., [2,3]. In addition, plant roots significantly increase soil cohesion and hence increase the soil's resistance to erosion [45]. The forest cover with a healthy growth of low height trees and shrubs plays an important role in reducing the soil loss [46]. The sites located in the forest and shrub land cover did not show significant difference in erosion rates mainly due to the fact that both contained low height plants. In addition, the sites were covered with fallen leaves and litters. Water run-off, infiltration capacity and soil erosion are highly dependent on the vegetal cover and leaf litter [47]. Sal trees (Shorea Robusta) mostly found in Terai and the Siwalik Hills are deciduous trees producing significant leaf litter, which significantly helps to control sheet erosion.

4.1.2. Gully Erosion

Two components of gully erosion were monitored and investigated—headwall erosion and channel side slope erosion. It was found that gully erosion varied remarkably each year and the mean headwall erosion (retreat) rates varied from 4 to 28 cm (Table 5). The channel side slope erosion ranged from 9–27 cm·yr−1. The details about the procedure used to estimate eroded sediment from gully erosion are given in Table 6 [30].
At the catchment scale, annual mean eroded sediment from the gullies was estimated by adding sediment from each gully (Table 7). As headwall erosion of KG2 could not be monitored, it was assumed that erosion rates were similar to that of KG1 as these gullies were very similar in terms of size, topography and land cover.
Table 5. Monitoring of headwall retreat and channel side slope erosion (All units are in cm).
GullyComponent 02-June-021-October-0216-April-0307-June-03
30-September-0215-April-0306-June-0325-September-03
KG1Headwall n = 7Min3.00.00.00.0
Max89.00.06.020.0
Mean28.0 ± 22.00.0 ± 0.01.4 ± 1.46.0 ± 5.7
Channel n = 8Min4.00.00.00.0
Max40.00.00.016.0
Mean22.0 ± 9.50.0 ± 0.00.0 ± 0.08.2 ± 4.4
KG2Headwall-----
Channel n = 13Min3.50.00.00.0
Max28.00.00.011.0
Mean8.8 ± 4.40.0 ± 0.00.0 ± 0.02.9 ± 2.2
MG1Headwall n = 6Min2.00.00.00.0
Max30.03.00.09.0
Mean16.0 ± 10.01.0 ± 1.00.0 ± 0.04.0 ± 3.0
Channel n = 10Min20.00.00.06.0
Max35.00.05.020.0
Mean27.0 ± 2.50.0 ± 0.01.0 ± 1.010.3 ± 3.4
Note: n: number of erosion pins, Min and Max: Minimum and Maximum erosion, Mean: Mean of all erosion pins. Error limits are 95% confidence limits.
Table 6. Estimation of eroded sediment by gully erosion.
Gully Component20022003
KG1KG2MG1KG1KG2MG1
Headwall Erosion
Length of head (Lh), m273208359273208359
Height of head (Hh), m322435322435
Av retreat (Eh), m0.28~0.160.07~0.04
Volume, m32,446 ± 126~2,010 ± 50612 ± 40~503 ± 15
Channel Side Slope Erosion
No of channel, N9121191211
Av length of channel (Lc), m25.018.021.025.018.021.0
Av side slope height (Hc), m 3.53.04.53.53.04.5
Av erosion (Ec), m0.220.090.270.080.030.11
* Volume, m3347 ± 75117 ± 26561 ± 21126 ± 3239 ± 13229 ± 42
Total eroded volume, m32,793 ± 201~2,572 ± 71738 ± 72~731 ± 57
** Total eroded weight, tones3,910 ± 281~3,600 ± 991,033 ± 101~1,024 ± 80
* Volume = 2 × N × Lc × Hc × Ec (for two side slopes); ** Bulk density of sediment as 1.4 t·m−3. The error limits are 95% confidence limits.
Table 7. Estimation of annual mean eroded sediment from gully erosion.
GullyMean Eroded Sediment Total Eroded SedimentMean Erosion Rate
(m3·yr−1)(m3·yr−1)(t·ha−1·yr−1)
KG11,766 ± 273
KG21,060 ± 1644,478 ± 56513.6 ± 1.7
MG11,652 ± 128

4.1.3. Landslides

Table 8 shows the characteristics of the selected landslides and mean erosion rates. The mean erosion rates varied from 0.05 to 0.06 m·yr−1. The erosion rates were much higher than the sheet erosion from a bare land due to the fact that landslide slopes were composed of boulder mixed loose soil materials. The total area of landslide (0.15 km2) was calculated from the landslide distribution map (Figure 5). The calculation indicated that the catchment-wide annual mean eroded sediment by landslides was 8,500 ± 4,500 m3 (Table 8). This estimate is approximately 1.5 times that of the sheet erosion and 2 times more than the gully erosion.
Table 8. Computation of sediment volume from landslides.
Landslide Surface Area (m2)Annual Erosion (m)Mean Annual Erosion (m)Total Landslide AreaMean Annual Erosion (m)Total Eroded Sediment (m3)* Mean Erosion Rate (t·ha−1·yr−1)
(km2)(m2)
L17680.06 ± 0.030.056 ± 0.030.15150,0000.056 ± 0.038,500 ± 4,50025.8 ± 13.6
L26860.06 ± 0.01
L34900.05 ± 0.01
* Total area of catchment is 460 ha. Bulk density of sediment is 1.4 t·m−3.

4.1.4. Stream Bank Erosion

The erosion rates of the stream bank sites are presented in Table 9. It indicates that annual mean erosion rates varied from 0.03 to 0.25 m. Because of the limited number of monitoring sites, the impacts of the governing factors such as bank geometry and vegetation were not clear. Based on the mean of all erosion rates, i.e., 0.16 m per year, eroded sediment was estimated as given in Table 10.
Table 9. Mean bank erosion rates.
SiteLength (m)Height (m)VegetationMean Erosion (m·yr−1)
KB1621.4bare0.23
KB3333.2forest0.03
KB4621.5forest0.25
KB5392.25forest/roots0.17
KB6161.5forest/roots0.18
KB7201.75shrubs0.24
KB8403.25shrubs0.18
MB1706.5bare0.08
MB2127.5forest0.11
Table 10. Estimation of annual mean eroded sediment from stream bank erosion.
StreamTotal Area of Mean Erosion Eroded Sediment Volume * Mean Erosion Rate
Bank (m2)(m·yr−1)(m3·yr−1)(t·ha−1)
Khajuri Stream13,6900.16 ± 0.042190 ± 5478.0 ± 1.9
Musahar Stream2,5930.16 ± 0.04415 ± 103
Total2,605 ± 650
* Total area of catchment is 460 ha. Bulk density of sediment is 1.4 t·m−3.

4.2. Soil Erosion at Catchment Scale

The annual mean erosion rates derived from the field measurement were used to estimate eroded sediment at the catchment scale. We acknowledge that scaling up of the erosion processes measured at a site-specific local scale to the catchment scale may lead to inaccuracies in the final estimates of the eroded sediment from the catchment [40]. However, as the size of the catchment is relatively small we can expect that the scaling effects will not be very significant.
The erosion rates derived from field measurement is presented in Figure 8 which indicates that landslides had the greatest erosion rate (~26 t·ha−1·yr−1). Sheet erosion and gully erosion rates were 16 t·ha−1·yr−1 and 14 t·ha−1·yr−1, respectively. Similarly, an erosion rate of 8 t·ha−1·yr−1 was estimated from stream bank erosion. Based on these mean erosion rates, it was estimated that ~21,000 m3 (64 t·ha−1 or 6,400 t·km−2) of sediment was being eroded within the catchment annually. This is equivalent to a mean erosion rate of ~ 5 mm·yr−1 across the catchment. The erosion rate is comparable to a study by [48] who found a denudation rate of ~3 mm per year in Ratu catchment located in the central Siwalik Hills. In the Middle Mountain region, studies have quantified erosion rates that vary from 1.2 to 1.6 mm·yr−1 and where the summer monsoon reaches its peak intensity of up to 5,000 mm·yr−1, an erosion rate of 5 mm·yr−1 has been reported [49]. In the Higher Himalaya, some studies reported erosion rates that varied from 0.1 to 2 mm·yr−1 [13]. This suggests that erosion rates of the study area were significantly higher than the rates in the other regions of the Nepal Himalaya.
We did not monitor sediment loss at the outlet of the catchment. However, a field observation in December 2012 indicated that over the last 10 years, significant sediment deposition occurred in the lower reach of the catchment. Also, we observed that no sediment deposition occurred in the upper and middle reaches mostly dominated by landslides, gullies and eroded banks. This suggests that eroded sediment from these sources is mostly transported downstream. This seems plausible as the stream channels have a high sediment transport capacity as a result of high local relief and a steep slope gradient [22].
Figure 8. Mean annual erosion rates in the Khajuri catchment. The horizontal bars indicate mean values and the vertical bars indicate 95% confidence limits.
Land 02 00370 g008

4.3. Analysing Rainfall Impacts on Erosion

Historical rainfall data from 1971 to 2004 were analysed to examine the effect of rainfall on erosion. Rainfall data from 1971 to 2001 were obtained from Department of Hydrology and Meteorology (DHM), Kathmandu. Rainfall data for 1990, 1998 and 1999 were missing. Rainfall data over the monitoring period (2002–2004) were obtained from a rain gauge (tipping bucket type) installed in the study area. There was a wide variation of mean annual rainfall ranging from 931–3,234 mm over the period from 1971 to 2004 (Figure 9). Mean annual rainfall over the entire period was 1,876 mm. Figure 9 also shows that the annual rainfall totals over the monitoring period (2002 to 2004) were slightly lower (6%–15%) than the mean annual rainfall.
Figure 9. Mean annual rainfall. Data obtained from Department of Hydrology and Meteorology (DHM), Kathmandu.
Land 02 00370 g009
An analysis of monthly rainfall indicated that majority of the rainfall occurred over the monsoon season (from June to September) (Figure 10). July was the wettest month with a mean monthly rainfall of 492 mm. July rainfall of 2002 and 2004 were 38% and 68% higher than the long-term mean rainfall whereas that of 2003 was approximately equal to the mean. Based on this, it was reasonable to consider that rainfall in 2002 and 2004 was more intense than in 2003 even though annual rainfall totals did not vary significantly. An analysis of annual mean erosion rates shows that there was no uniform trend of erosion over the monitoring period (Figure 11). Sheet erosion decreased from 25 t·ha−1·yr−1 in 2002 to 20 t·ha−1·yr−1 in 2003 and further decreased to 10 t ha−1·yr−1 in 2004. Also, gully erosion decreased from 20 t·ha−1·yr−1 in 2002 to 8 t·ha−1·yr−1 in 2003. Erosion from landslides, on the other hand, increased from 21 t·ha−1·yr−1 in 2002 to 31 t·ha−1·yr−1 in 2003. Bank erosion rates were almost identical in 2002 and 2003 (7 t·ha−1·yr−1 and 6 t·ha−1·yr−1); however, it increased to 12 t·ha−1·yr−1 in 2004. There was no consistency in erosion rate variations over the monitoring period which suggests that the impact of rainfall variation on erosion rates was not noticeable. The reason behind this is the fact that short-term monitoring cannot provide a reasonable explanation regarding the relationship between erosion rates and climatic factors, and short monitoring periods typically miss the extreme events that happen infrequently [13]. In addition, there may be other controlling factors such as geology, topography and land use which work together to produce a combined effect.
Figure 10. Mean monthly rainfall over the period from 1971 to 2004.
Land 02 00370 g010
Figure 11. Annual mean erosion rates from 2002 to 2004. Note that landslides and gully erosion were monitored only over two year period (2002–2003).
Land 02 00370 g011

5. Conclusions

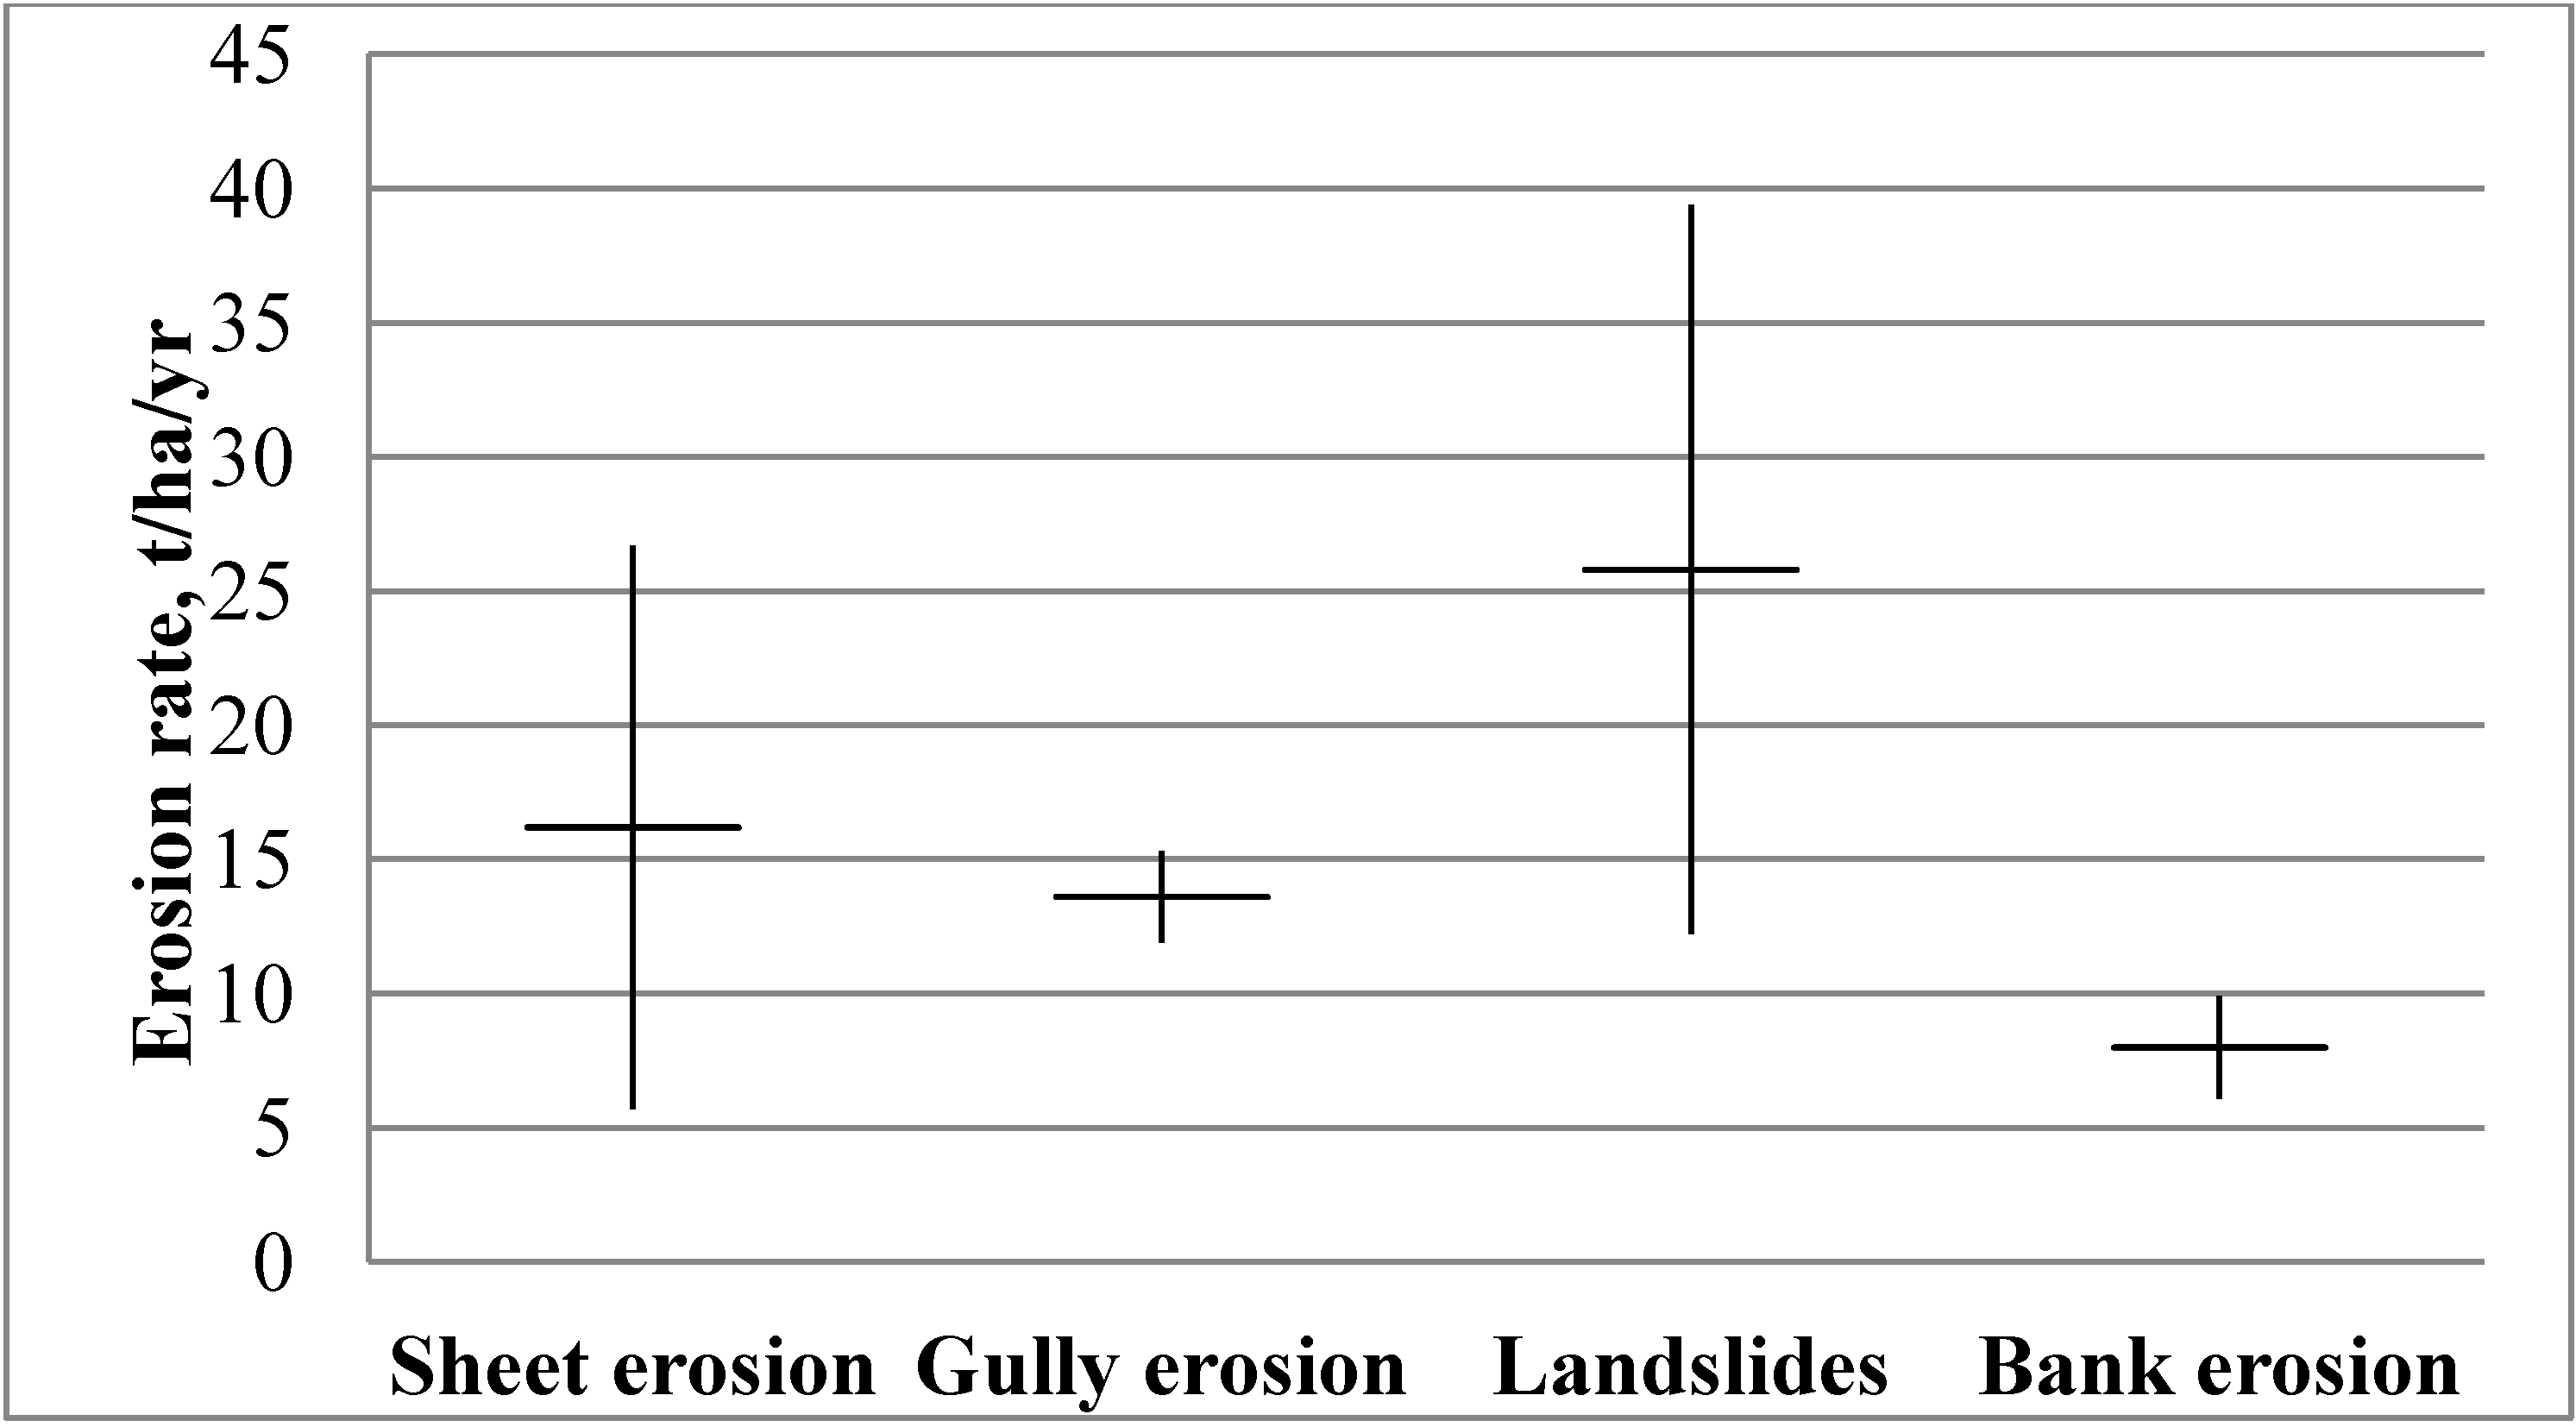
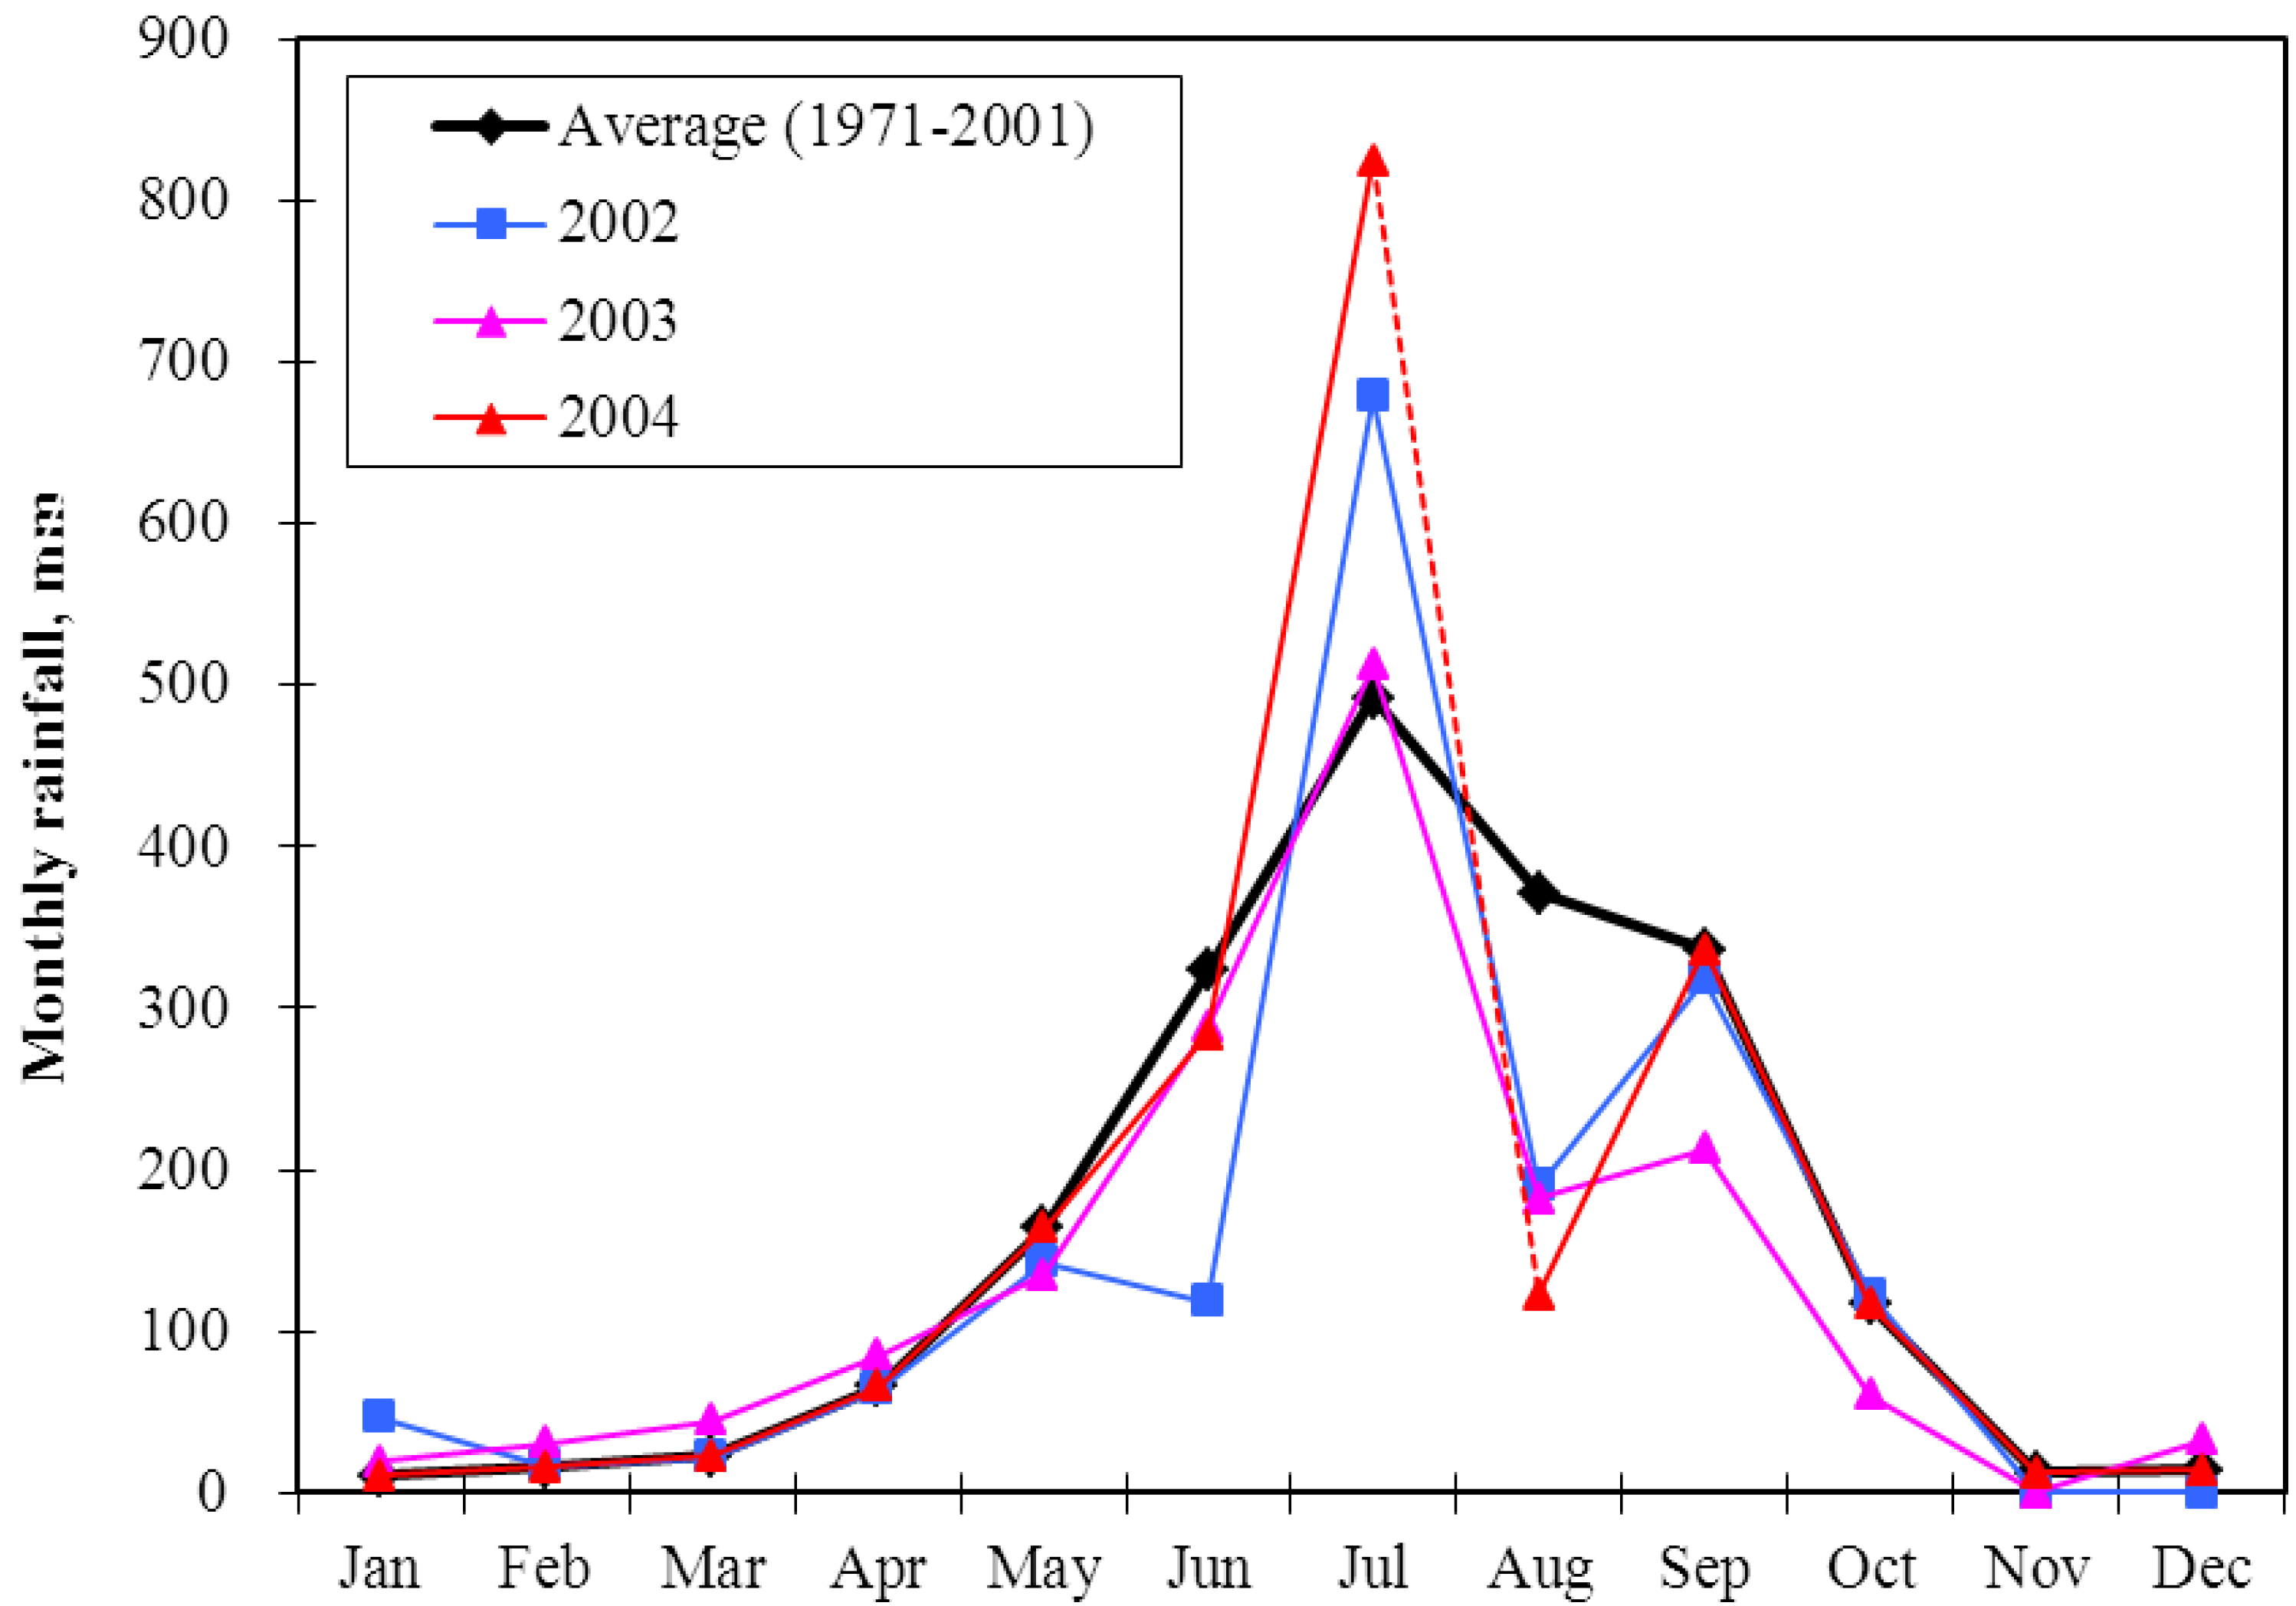
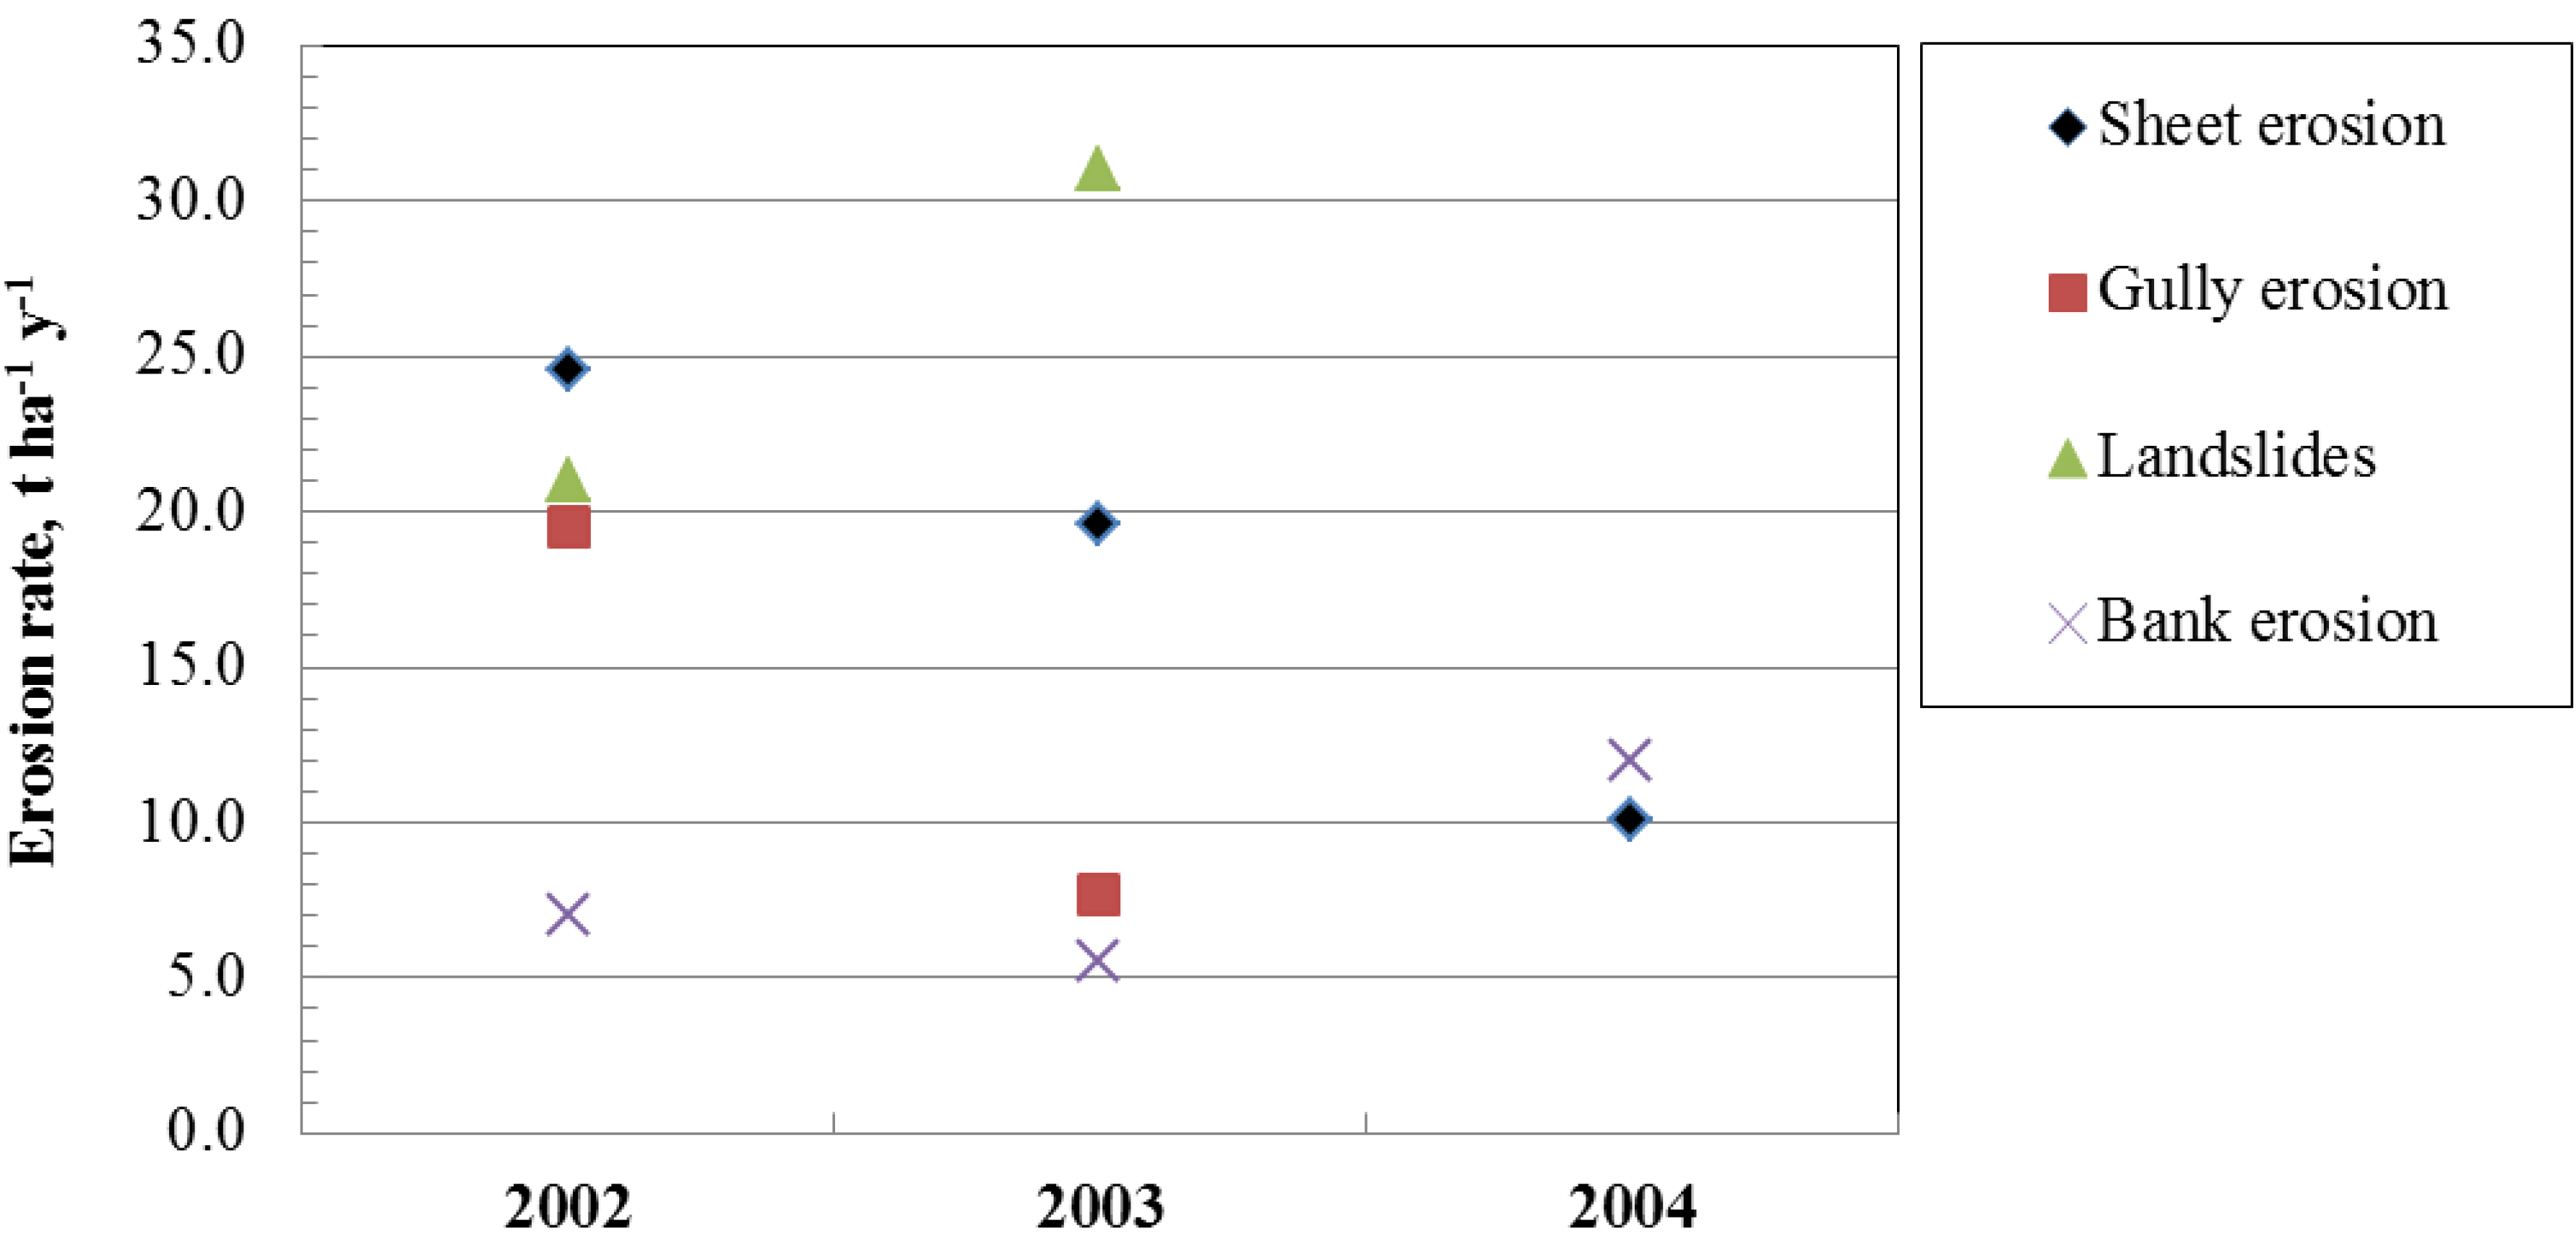
There were four types of erosion which were considered the most significant sources of sediment in the Khajuri catchment: sheet erosion, gully erosion, landslides and stream bank erosion. Field monitoring indicated that sheet erosion from forest and shrubs generally varied from 0.8 to 1.2 mm·yr−1. Erosion from bare land was much higher, i.e., 7 mm·yr−1. Mean erosion rate of ~16 t·ha−1·yr−1 was estimated for the entire catchment. Gully erosion rate was estimated to be ~14 t·ha−1·yr−1. Erosion from landslides was significantly higher which was estimated to be ~26 t·ha−1·yr−1. Stream bank erosion varied widely from 0.03 to 0.25 m·yr−1 with a mean erosion rate of ~8 t·ha−1·yr−1. Based on these mean erosion rates, it was estimated that ~21,000 m3 (64 t·ha−1 or 6,400 t·km−2) of sediment was being eroded within the catchment, annually. This is equivalent to a mean erosion rate of ~5 mm·yr−1 across the catchment, which is much higher compared to erosion in other regions of Nepal Himalaya. Analysis of rainfall data indicated that there was no clear impact of rainfall variation on the erosion rates.
The study quantifies various erosion rates and provides an estimate of eroded sediment based on field measurement and observation. The data will be invaluable for further developing the studies in the Siwalik Hills where systematic field-based monitoring data and scientific evidences are non-existent. Further studies would be required to evaluate the effectiveness of appropriate conservation measures to minimise soil erosion taking account of geomorphological processes at the catchment scale.

Acknowledgements

The research was partly supported by funding from Sabo Technical Centre, Japan which is gratefully acknowledged. We would also acknowledge the help and support from the Department of Water Induced Disaster Prevention (DWIDP), Kathmandu during the field works. We thank the local people of Deuri Udayapur for their help and support during field monitoring and evaluation works.

Conflict of Interest

The authors declare no conflict of interest.

References

  1. Nyssen, J.; Poesen, J.; Deckers, J. Land degradation and soil and water conservation in tropical highlands, mekelle, ethiopia. Soil Tillage Res. 2006, 103, 197–202. [Google Scholar] [CrossRef]
  2. Vásquez-Méndez, R.; Ventura-Ramos, E.; Oleschko, K.; Hernández-Sandoval, L.; Parrot, J.; Nearing, M.A. Soil erosion and runoff in different vegetation patches from semiarid Central Mexico. Catena 2010, 80, 162–169. [Google Scholar] [CrossRef]
  3. Mohammad, A.G.; Adam, M.A. The impact of vegetative cover type on runoff and soil erosion under different land uses. Catena 2010, 81, 97–103. [Google Scholar] [CrossRef]
  4. Zhou, Z.C.; Shangguan, Z.P.; Zhao, D. Modeling vegetation coverage and soil erosion in the Loess Plateau Area of China. Ecol. Modell. 2006, 198, 263–268. [Google Scholar] [CrossRef]
  5. Nunes, A.N.; Almeida, A.C.; Coelho, C.O.A. Impacts of land use and cover type on runoff and soil erosion in a marginal area of Portugal. Appl. Geogr. 2011, 31, 687–699. [Google Scholar] [CrossRef]
  6. García-Ruiz, J.M. The effects of land uses on soil erosion in Spain: A review. Catena 2010, 81, 1–11. [Google Scholar] [CrossRef]
  7. Kayastha, P.; Dhital, M.R.; Smedt, F.D. Application of the analytical hierarchy process (AHP) for landslide susceptibility mapping: A case study from the Tinau Watershed, West Nepal. Comput. Geosci. 2013, 52, 398–408. [Google Scholar] [CrossRef]
  8. Fort, M.; Cossart, E.; Cossart, A.; Arnaud-Fassetta, G. Hillslope-channel coupling in the Nepal Himalayas and threat to man-made structures: The Middle Kali Gandaki Valley. Geomorphology 2010, 124, 178–199. [Google Scholar] [CrossRef]
  9. Dahal, R.K.; Hasegawa, S.; Nonomura, A.; Yamanaka, M.; Dhakal, S.; Paudyal, P. Predictive modelling of rainfall-induced landslide hazard in the Lesser Himalaya of Nepal based on weights-of-evidence. Geomorphology 2008, 102, 496–510. [Google Scholar] [CrossRef]
  10. Merz, J.; Dangol, P.M.; Dhakal, M.P.; Dongol, B.S.; Nakarmi, G.; Weingartner, R. Rainfall-runoff events in a middle mountain catchment of Nepal. J. Hydrol. 2006, 331, 446–458. [Google Scholar] [CrossRef]
  11. Matthews, R.B.; Pilbeam, C. Modelling the long-term productivity and soil fertility of maize/millet cropping systems in the mid-hills of Nepal. Agr. Ecosyst. Environ. 2005, 111, 119–139. [Google Scholar] [CrossRef]
  12. Gardner, R.A.M.; Gerrard, A.J. Runoff and soil erosion on cultivated rain-fed terraces in the Middle Hills of Nepal. Appl. Geogr. 2003, 23, 23–45. [Google Scholar] [CrossRef]
  13. Gabet, E.J.; Burbank, D.W.; Pratt-Sitaula, B.; Putkonen, J.; Bookhagen, B. Modern erosion rates in the High Himalayas of Nepal. Earth Planet. Sci. Lett. 2008, 267, 482–494. [Google Scholar] [CrossRef]
  14. Paudel, K.P.; Andersen, P. Assessing rangeland degradation using multi temporal satellite images and grazing pressure surface model in Upper Mustang, Trans Himalaya, Nepal. Remote Sens. Environ. 2010, 114, 1845–1855. [Google Scholar] [CrossRef]
  15. Merz, J. Water Balances, Floods and Sediment Transport in the Hindu Kush-Himalayas: Data Analyses, Modeling and Comparison of Selected Meso-Scale Catchments. Ph.D. Thesis, University of Berne, Berne, Switzerland, 2004. [Google Scholar]
  16. Maaoui, M.A.; Felfoul, M.S.; Boussema, M.R.; Snane, M.H. Sediment yield from irregularly shaped gullies located on the Fortuna lithologic formation in semi-arid area of Tunisia. Catena 2012, 93, 97–104. [Google Scholar] [CrossRef]
  17. Poesen, J.; Nachtergaele, J.; Verstraeten, G.; Valentin, C. Gully erosion and environmental change: Importance and research needs. Catena 2003, 50, 91–133. [Google Scholar] [CrossRef]
  18. Oostwoud Wijdenes, D.J.; Bryan, R. Gully-head erosion processes on a semi-arid valley floor in Kenya: A case study into temporal variation and sediment budgeting. Earth Surf. Process. Landf. 2001, 26, 911–933. [Google Scholar] [CrossRef]
  19. Chaplot, V.; Coadou le Brozec, E.; Silvera, N.; Valentin, C. Spatial and temporal assessment of linear erosion in catchments under sloping lands of northern Laos. Catena 2005, 63, 167–184. [Google Scholar] [CrossRef]
  20. Dhakal, A.S.; Sidle, R.C. Distributed simulations of landslides for different rainfall conditions. Hydrol. Process. 2004, 18, 757–776. [Google Scholar] [CrossRef]
  21. Gafur, A.; Raunsø Jensen, J.; Borggaard, O.; Petersen, L. Runoff and losses of soil and nutrients from small watersheds under shifting cultivation (Jhum) in the Chittagong Hill Tracts of Bangladesh. J. Hydrol. 2003, 274, 30–46. [Google Scholar] [CrossRef]
  22. Higaki, D. Landslides and Erosion Study in Siwalik Region Using Geomorphological Approach, 1st ed.; Seminar of Nepal Landslide Society (NLS): Kathmandu, Nepal, 2003. [Google Scholar]
  23. Hurtrez, J.E.; Lucazeau, F.; Lavé, J.; Avouac, J.P. Investigation of the relationships between basin morphology, tectonic uplift, and denudation from the study of an active fold belt in the Siwalik Hills, central Nepal. J. Geophys. Res.-Solid Earth 1999, 104, 12779–12796. [Google Scholar] [CrossRef]
  24. Land Resources Mapping Project (LRMP). In Land Utilization and Agriculture-Forestry Reports; LRMP-Kenting Earth Sciences Ltd.: Ottawa, ON, Canada, 1986.
  25. Upreti, B.N. The Physiographic and Geology of Nepal and their Bearing on the Landslide Problem. In Landslide Hazard Mitigation in the Hindu Kush-Himalaya; Tianchi, L., Chalise, S.R., Upreti, B.N., Eds.; ICIMOD: Kathmandu, Nepal, 2001. [Google Scholar]
  26. Sitaula, B.K.; Sankhayan, P.L.; Bajracharya, R.M.; Singh, B.R. A systems analysis of soil and forest degradation in a mid-hill watershed of Nepal using a bio-economic model. Land Degrad. Dev. 2005, 16, 435–446. [Google Scholar] [CrossRef]
  27. Bhattarai, K.; Conway, D.; Yousef, M. Determinants of deforestation in Nepal’s central development region. J. Environ. Manag. 2009, 91, 471–488. [Google Scholar] [CrossRef]
  28. Ghimire, M. Landslide occurrence and its relation with terrain factors in the Siwalik Hills, Nepal: Case study of susceptibility assessment in three basins. Nat. Hazards 2011, 56, 299–320. [Google Scholar] [CrossRef]
  29. Shrestha, S.; Babel, M.S.; Gupta, A.D.; Kazama, F. Evaluation of annualized agricultural nonpoint source model for a watershed in the Siwalik Hills of Nepal. Environ. Model. Softw. 2006, 21, 961–975. [Google Scholar] [CrossRef]
  30. Ghimire, S.K.; Higaki, D.; Bhattarai, T.P. Gully erosion in the Siwalik Hills, Nepal: Estimation of sediment production from active ephemeral gullies. Earth Surf. Process. Landf. 2006, 31, 155–165. [Google Scholar] [CrossRef]
  31. Vetaas, O.R.; Grytnes, J. Distribution of vascular plant species richness and endemic richness along the Himalayan elevation gradient in Nepal. Glob. Ecol. Biogeogr. 2002, 11, 291–301. [Google Scholar] [CrossRef]
  32. Rainfall Data Records of Lahan and Udayapur; Department of Hydrology and Meteorology: Kathmandu, Nepal, 2004.
  33. Couper, P.; Stott, T.; Maddock, A. Insights into river bank erosion processes derived from analysis of negative erosion-pin recordings: Observations from three recent UK studies. Earth Surf. Process. Landf. 2002, 27, 59–79. [Google Scholar] [CrossRef]
  34. Lawler, D.M.; Couperthwaite, J.; Bull, L.; Harris, N.M. Bank erosion events and processes in the Upper Severn Basin. Hydrol. Earth Surf. Sci. 1997, 1, 523–534. [Google Scholar] [CrossRef]
  35. Stott, T. A comparison of stream bank erosion processes on forested and moorland streams in the Balquhidder catchments, Central Scotland. Earth Surf. Process. Landf. 1997, 22, 383–399. [Google Scholar] [CrossRef]
  36. Ashbridge, D. Processes of River Bank Erosion and their Contribution to the Suspended Sediment Load of the River Culm, Devon. In Sediment and Water Quality in River Catchment Systems; Foster, I.D.L., Gunell, A.M., Webb, B.W., Eds.; Wiley: Chichester, UK, 1995; pp. 229–245. [Google Scholar]
  37. Tervuren, J.M. Soil loss by rainwash: A case study from Rwanda. Z. Geomorphologie N.F. 1990, 34, 385–408. [Google Scholar]
  38. Harden, C.P.; Foster, W.; Morris, C.; Chartrand, K.J.; Henry, E. Rates and processes of streambank erosion in tributaries of the Little River, Tennessee. Phys. Geogr. 2009. [Google Scholar] [CrossRef]
  39. Shi, Z.; Wen, A.; Zhang, X.; Yan, D. Comparison of the soil losses from 7Be measurements and the monitoring data by erosion pins and runoff plots in the Three Gorges Reservoir region, China. Appl. Radiat. Isot. 2011, 69, 1343–1348. [Google Scholar] [CrossRef]
  40. Boix-Fayos, C.; Martínez-Mena, M.; Arnau-Rosalén, C.; Castillo, E.A.; Albaladejo, V. Measuring soil erosion by field plots: Understanding the sources of variation. Earth Sci. Rev. 2006, 78, 267–285. [Google Scholar] [CrossRef]
  41. Micheli, E.R.; Kirchner, J.W. Effects of wet meadow riparian vegetation on streambank erosion—1. Remote sensing measurements of streambank migration and erodibility. Earth Surf. Process. Landf. 2002, 27, 627–639. [Google Scholar] [CrossRef]
  42. Hupp, C.R.; Schenk, E.R.; Richter, J.M.; Peet, R.K.; Townsend, P.A. Bank erosion along the dam-regulated lower Roanoke River, North Carolina. Geol. Soc. Am. 2009, 451, 97–108. [Google Scholar]
  43. Kukal, S.S.; Sur, H.S.; Gill, S.S. Factors responsible for soil erosion hazard in submontane Punjab, India. Soil Use Manag. 1991, 1, 38–44. [Google Scholar] [CrossRef]
  44. Shah, P.B.; Schreier, H.; Nakarmi, G. Rehabilitation of Degraded Lands. In The People and Resource Dynamic Project, The First Three Years (1996–1999); Allen, R., Schreier, H., Brown, S., Shah, P.B., Eds.; ICIMOD: Kathmandu, Nepal, 2000; pp. 139–148. [Google Scholar]
  45. De Baets, S.; Torri, D.; Poesen, J.; Meersmans, J. Modelling increased soil cohesion due to roots with EUROSEM. Earth Surf. Process. Landf. 2008, 33, 1948–1963. [Google Scholar] [CrossRef]
  46. Zheng, F. Effect of vegetation changes on soil erosion on the loess plateau. Pedosphere 2006, 16, 420–427. [Google Scholar] [CrossRef]
  47. Singh, Y. Geo-ecology of the Trans Satluj Punjab-Haryana Siwalik Hills, NW India. ENVIS Bull. Himal. Ecol. 2001, 9, 19–38. [Google Scholar]
  48. Honda, K.; Samarakoon, L.; Ishibahi, A.; Mabuchi, Y.; Miyajima, S. Remote Sensing and GIS Technologies for Denudation Estimation in a Siwalik Watershed of Nepal. In Proceedings of of the 17th Asian Conference on Remote Sensing, Colombo, Sri Lanka, 4–8 November 1996; pp. B21–B26.
  49. Garzanti, E.; Vezzoli, G.; Andò, S.; Lavé, J.; Attal, M.; France-Lanord, C.; DeCelles, P. Quantifying sand provenance and erosion (Marsyandi River, Nepal Himalaya). Earth Planet. Sci. Lett. 2007, 258, 500–515. [Google Scholar] [CrossRef]

