Article

Revealing Regional Deforestation Dynamics in North-Eastern Madagascar—Insights from Multi-Temporal Land Cover Change Analysis

Centre for Development and Environment, University of Bern, Hallerstrasse 10, CH-3012 Bern, Switzerland
*
Author to whom correspondence should be addressed.
Submission received: 25 March 2015 / Revised: 21 May 2015 / Accepted: 21 May 2015 / Published: 29 May 2015

Abstract

:
The north-eastern escarpment of Madagascar harbours the island’s last remaining large-scale humid forest massifs surrounded by a small-scale agricultural mosaic. There is high deforestation, commonly thought to be caused by shifting cultivation practiced by local land users to produce upland rice. However, little is known about the dynamics between forest and shifting cultivation systems at a regional level. Our study presents a first attempt to quantify changes in the extent of forest and different agricultural land cover classes, and to identify the main dynamics of land cover change for two intervals, 1995–2005 and 2005–2011. Over the 16-year study period, the speed of forest loss increased, the total area of upland rice production remained almost stable, and the area of irrigated rice fields slightly increased. While our findings seem to confirm a general trend of land use intensification, deforestation through shifting cultivation is still on the rise. Deforestation mostly affects the small forest fragments interspersed in the agricultural mosaic and is slowly leading to a homogenization of the landscape. These findings have important implications for future interventions to slow forest loss in the region, as the processes of agricultural expansion through shifting cultivation versus intensified land use cannot per se be considered mutually exclusive.

1. Introduction

Human needs for food, fibre, and other services from natural and cultivated ecosystems are driving worldwide land cover (LC) changes [1]. Combined, the resulting LC changes have tremendous impacts on the planet’s climate system, water and nutrient cycles, and human societies [2]. The most widely discussed LC change of global importance is probably deforestation. In the tropics, forest was the most important source of agricultural land expansion towards the end of the 20th century, raising concerns about the loss of ecosystem services and biodiversity [3]. Despite a surge in conservation actions around the globe, tropical forest loss has still increased during the last decade [4]. Local smallholders and their subsistence food production systems, often based on shifting cultivation, have long been held accountable for tropical deforestation [5,6]. More recently, indirect factors such as economic incentives [7] and globalized demands for commercial crop cultivation have been identified as increasingly important factors of tropical deforestation [8,9,10]. This global trend of land use intensification has led to the demise of shifting cultivation in many places, mostly in South-East Asia and East Africa [11].
One prominent exception to this trend is Madagascar. In Madagascar, agriculture along the humid forest frontier is still dominated by traditional smallholder systems. While concern about deforestation and shifting cultivation dates back to colonial times [12], surprisingly little is known about the dynamics between forest and shifting cultivation systems at a regional level. These dynamics are most obvious along the north-eastern escarpment, which harbours the island’s last remaining large-scale humid forest massifs, surrounded by a matrix of small-scale agricultural patches. The few studies focusing on shifting cultivation in this area [13,14,15] and the general deforestation discourse [16,17] point to the persistence or even expansion of shifting cultivation. A wide range of stakeholders from various levels and sectors have therefore been involved in trying to slow deforestation, mainly by establishing protected areas and promoting intensification of other land use practices such as irrigated permanent rice production and agroforestry (e.g., [18,19,20]).
Due to the strong global empathy with Madagascar’s largely endemic fauna and flora, for which the island was labelled one of the “hottest” global biodiversity hotspots [21], national-scale LC change analysis has so far focused strongly on deforestation rates [22], which were found to be decreasing (e.g., [23,24,25,26]). By contrast, local-scale deforestation studies from the north-east found increased forest loss [27,28]. However, both types of study—national and local-scale—have limited their analysis of changes from forest to non-forest LC classes. What is missing so far are LC change studies on a regional scale, which would consider various agricultural classes and thus enable us to better understand deforestation dynamics. This knowledge could then be used to plan more sustainable interventions to slow forest loss.
This study seeks to fill the important gap between local and national-scale LC change studies. It provides new information on deforestation dynamics along the north-eastern escarpment of Madagascar, based on a regional-scale assessment of multi-temporal LC change dynamics between 1995 and 2011. The main objectives of the study were (i) to quantify major changes in the extent of forest and different agricultural LC classes; and (ii) to identify and understand the main dynamics between different LC classes.

2. Materials and Methods

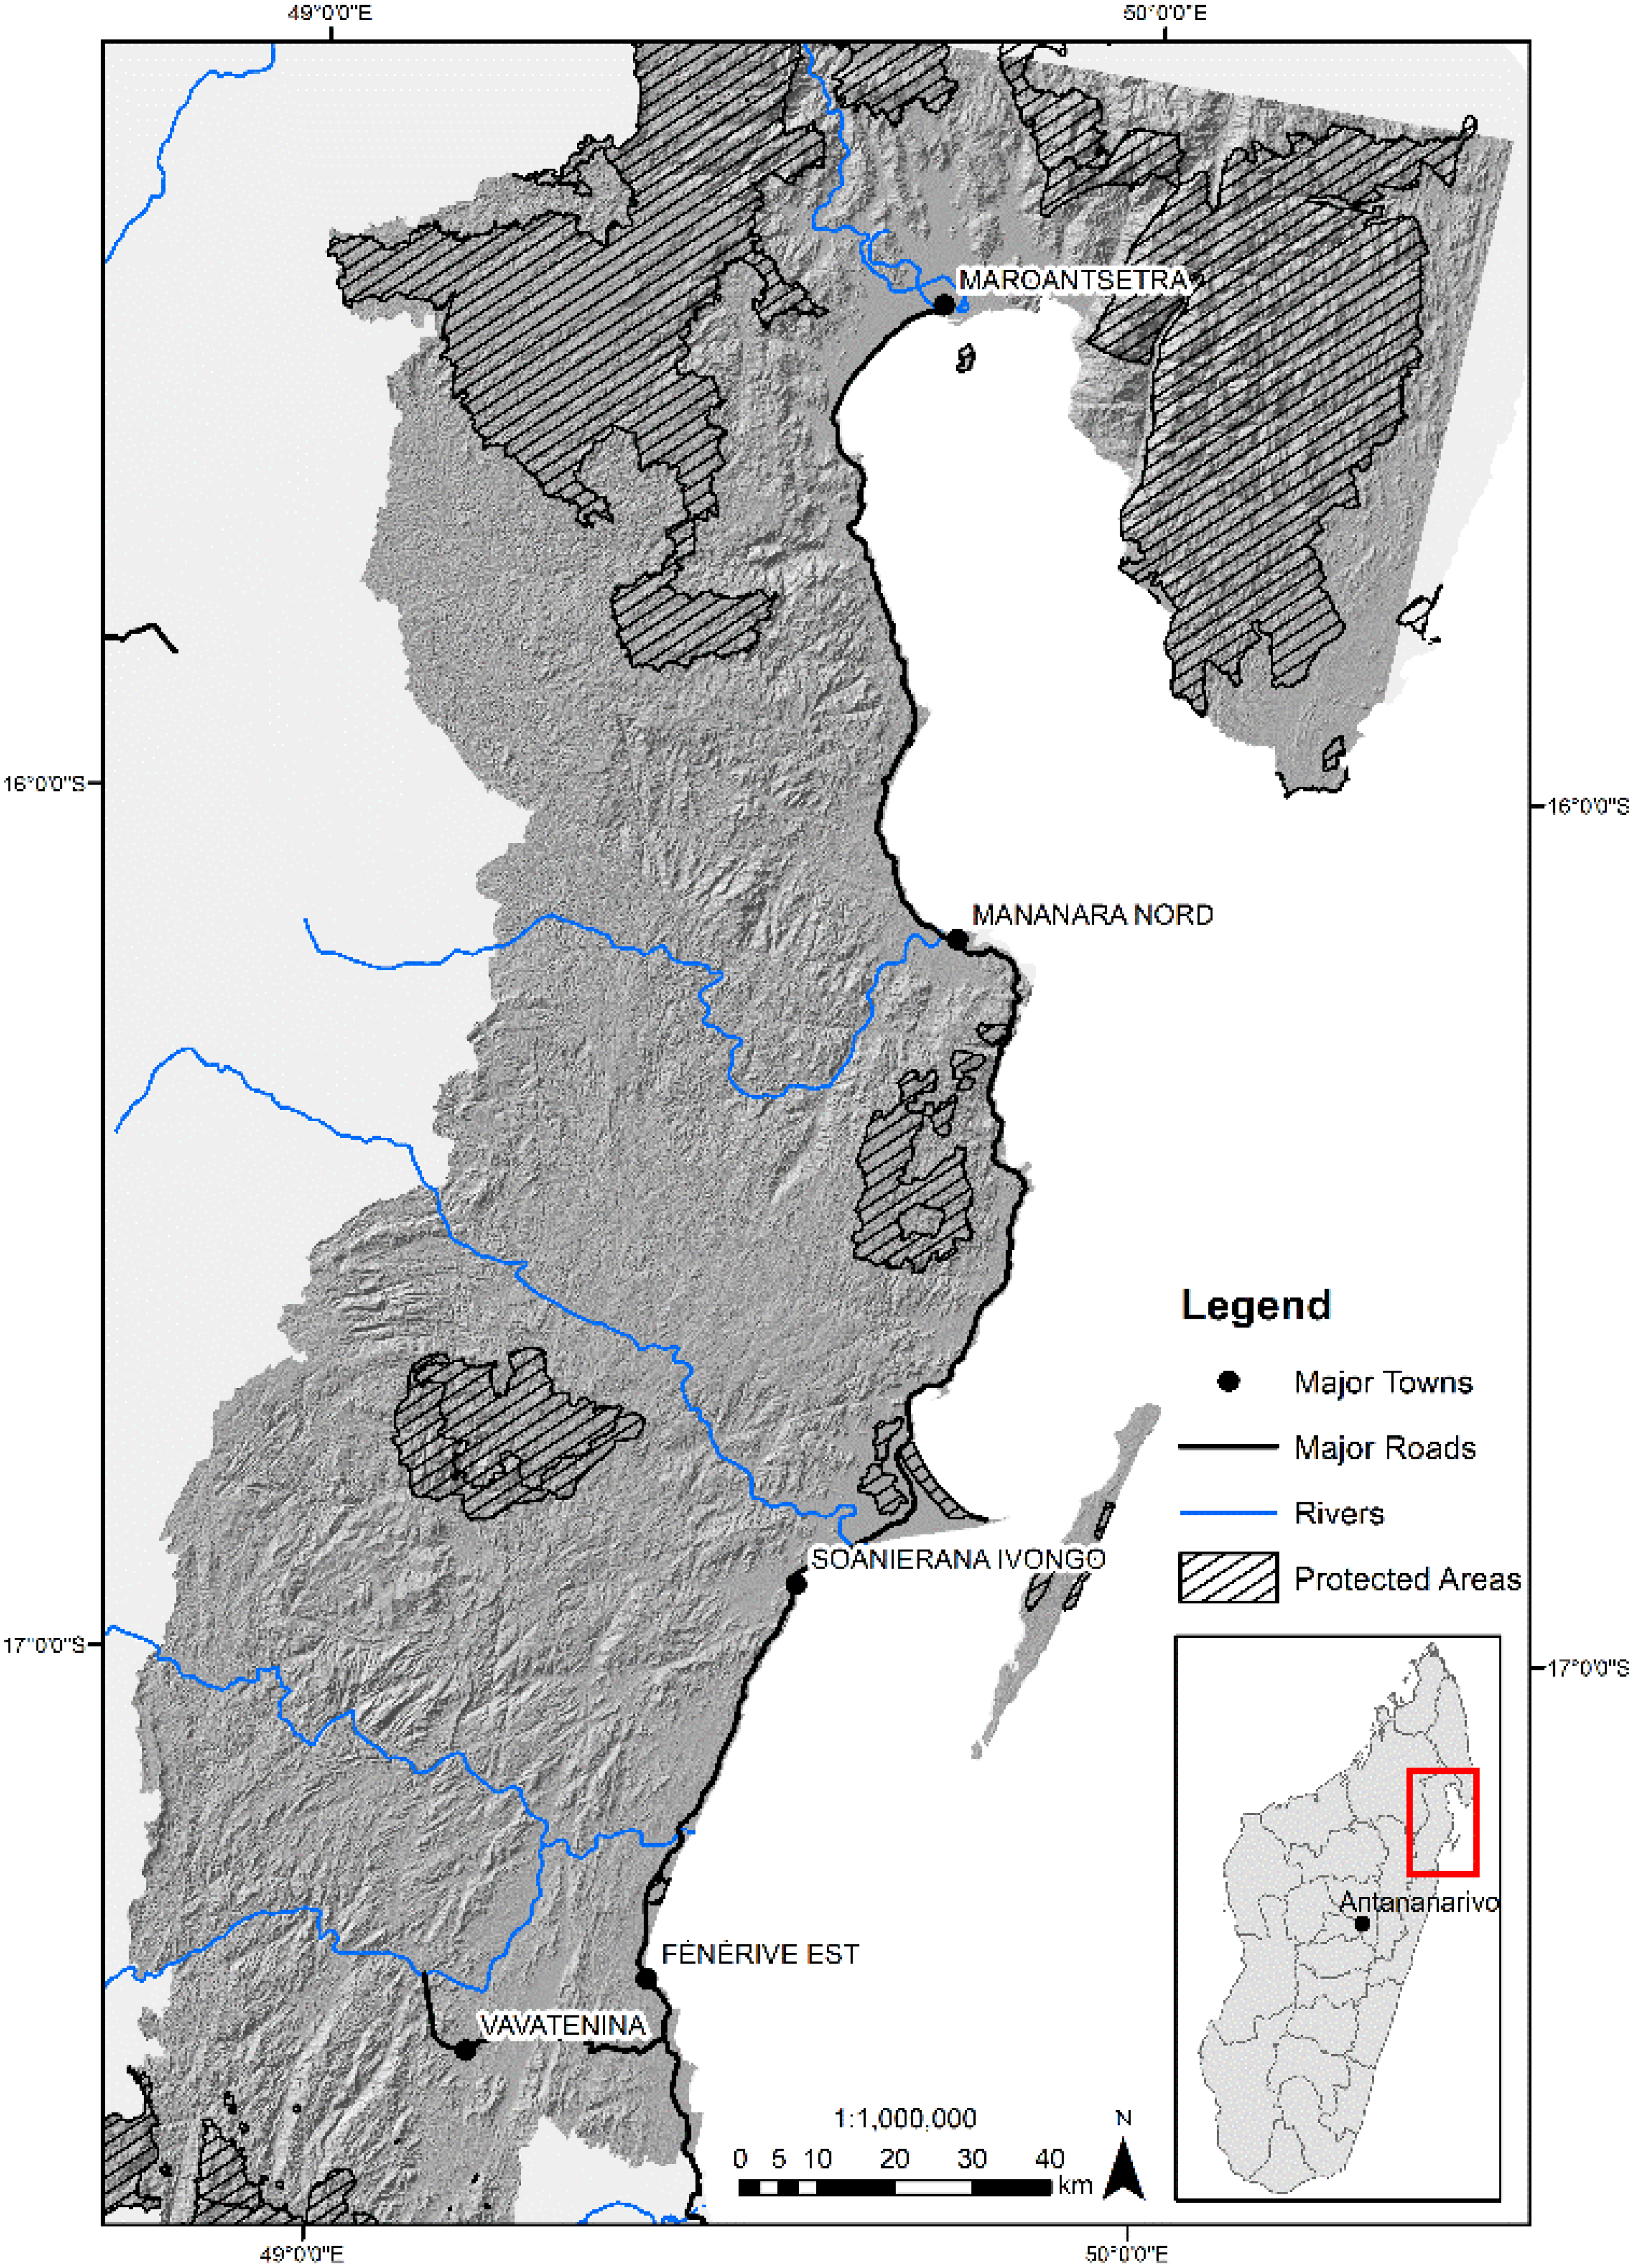
2.1. The Study Region

The 24,200 km2 study region is located in north-eastern Madagascar (Figure 1) and comprises the hilly escarpment between the highlands in the west and the Indian Ocean in the east. It corresponds largely to the administrative region of Analanjirofo plus the Masoala peninsula, although the eastern coastline of the Masoala peninsula is not included as the available satellite images did not extend this far.
Figure 1. Study region location in north-eastern Madagascar showing major towns, roads, rivers, and protected areas.
Land 04 00454 g001
The study region has a humid climate with 3600 mm of rainfall per year and an average annual temperature of 24 °C [29]. Its landscape consists of a few large forest massifs surrounded by a mosaic of small patches, reflecting diverse land use activities. The rural population, ethnically dominated by the Betsimisaraka people, applies a mixed production system, cultivating both rain-fed and irrigated rice mainly for subsistence, and commercial crops such as clove, vanilla, coffee, and lychee for income generation [30]. Large annual fluctuations in producer prices present an important challenge to local land users [31]. Rain-fed upland rice cultivation takes place on moderate to steep slopes through shifting cultivation. While there are several terms to describe this land use system in the literature, e.g., slash-and-burn or swidden agriculture, we use the relatively neutral term “shifting cultivation”, to emphasize its spatially dynamic character. Through this system, small plots are cleared, burned, and planted for a single year and then left fallow for several years. While the rice can be intercropped with other annuals (mainly maize), tuber crops such as cassava or sweet potatoes are often planted as a second season crop after the rice harvest [14]. Irrigated rice is cultivated in paddies at the valley bottoms: depending on need, labour availability, and fertility, this may be once or twice a year, or paddies may be left fallow for one or several years. This form of rice cultivation is generally limited by lack of flat terrain and access to water for irrigation [30]. Cultivation of clove trees, coffee, and lychee can either be in the form of dense agroforests combined with a diverse mix of other fruit trees and tuber crops for subsistence, or in the form of monocultural stands (mainly for clove). Vanilla is usually cultivated within agroforests shaded by a few large trees. Land use as pasture is rare in this region. Zebu cattle rearing is of little importance and mainly concentrated in the plains around the city of Maroantsetra, where zebus usually graze on clove fields, in irrigated rice paddies after harvest, and along footpaths.
In the study region, a mixed ownership system prevails for agricultural land. Land rights for shifting cultivation are traditionally lineage based: the person who first cuts a piece of forest enables all their descendants to hold the right to use this land for shifting cultivation. Elders allocate plots for rice cultivation to individual households within their extended family on a year-by-year basis [32]. Rights to permanent agricultural land such as irrigated rice paddies or agroforests can be individual or family-based; they are usually inherited and sometimes purchased [14]. Land zoning for forest conservation is very common: protected areas cover 23% of the study region, the largest being Makira Natural Park (since 2005), Masoala National Park (since 1997), Ambatovaky Special Reserve (since 1958), and Mananara Nord National Park (since 1989) [33]. While local land users have restricted access to these protected areas, enforcement is generally weak due to limited accessibility and lacking funds. Outside protected areas, community-managed “sacred forests” and family-owned forests consisting of small fragments are common [32].

2.2. Satellite Data Preprocessing and Classification

Landsat 5 Thematic Mapper (TM) and Landsat 7 Enhanced Thematic Mapper+ (ETM+) satellite data were ordered from the US Geological Survey (USGS) Earth Explorer website (available at http://earthexplorer.usgs.gov). Availability of data for north-eastern Madagascar is low, as the area is often cloud-covered. This makes it difficult to monitor land change in this region, and also posed challenges for our study. Moreover, to differentiate between permanent agriculture and burnt plots in a shifting cultivation cycle, we specifically required satellite images taken between December and March, when new fields are freshly burnt and irrigated rice fields still flooded. In the long-term Landsat data archive we located four-albeit, partially clouded-pairs of Landsat 5 TM and Landsat 7 ETM+ scenes that represent the study area in 1995, 2005, and 2011. For 2005, we classified and merged a Landsat TM and Landsat ETM+ (SLC-off) data set acquired within less than a month of each other: despite large cloud-covered areas in both, they complemented the majority of the areas covered by the Landsat TM scene. We downloaded Landsat Level 1T products, whose processing includes radiometric calibration and geometric correction incorporating ground control points and a digital elevation model [34]. The satellite scene pairs we used are listed in Table 1.
Table 1. Acquisition dates, sensor, and coverage of the used satellite scenes.
Acquisition DatePath/RowSensorReference Data
24 January 1995158/71, 158/72Landsat 5 TMvisual interpretation
8 March 2005158/71, 158/72Landsat 5 TMGoogle Earth
12 February 2005158/71, 158/72Landsat 7 ETM+ (SLC-off)Google Earth
21 February 2011158/71, 158/72Landsat 5 TMfield data, Google Earth
For radiometric correction we used the ATCOR3 procedure developed by Richter [35], correcting topographic influences as well as atmospheric absorption and scattering using the Shuttle Radar Topography Mission (SRTM) digital elevation model. After radiometric preprocessing, we mosaicked the scenes and checked for geometric matching. To correct a shift in the 2005 and 2011 TM mosaic, we applied a third order polynomial adjustment to the other well-matching mosaics. Finally, we projected all mosaics obtained from UTM Zone 39S into the Laborde map projection used in Madagascar.
The classification scheme (Table 2) was defined according to the present LC in the study region and, partly, to local communities’ specific land use. At this point, we would like to stress the importance of differentiating between LC and land use. While LC can be derived from the analysis of satellite images, land use reflects human-environment interactions and requires other methods of detection, representing a challenge for the understanding of land change processes [36]. By opting to use the neutral terms “low-height” or “medium-height” vegetation for two of the LC classes, our aim was to avoid a premature interpretation of changes in land use that the terms “fallow” or “secondary” vegetation might imply. Low-height vegetation represents primarily non-woody vegetation such as grasses, herbaceous plants, and ferns, while medium-height vegetation represents medium-growth stands of trees mixed with shrubs and large herbaceous plants. These different statuses in vegetation cover result in different spectral signatures.
Through field work in 2013, we obtained training and verification data for the supervised classification and verification of the 2011 mosaic. Additionally, we digitized samples from Google Earth imagery acquired in 2011 and a WorldView-2 scene acquired in December 2012, selecting stratified random sampling. Training and verification data for the 2005 mosaic were digitized from Google Earth imagery acquired in 2005. The high-resolution imagery for 2011 and 2005 cover two representative LC and land use subsets to the north and south of the study region. All four subsets have a size of about 20 km by 12 km. To guarantee the independence of training and verification data, half of the obtained reference samples for each year were used to train the maximum likelihood classifier, and the other half to verify the classification results. For the 1995 data set, we defined classification samples through visual interpretation of the Landsat satellite data itself and local expert knowledge, since no independent reference data such as aerial photos exist for 1995.
Table 2. LC classification scheme and possible attribution to land use.
LC ClassDescriptionPossible Attribution to Land Use
ForestPrimary and degraded or disturbed dense high-growth tree stands, mainly big forest massifs but also fragmentsDifferent protection/management status and use rights: from governmental to non-governmental to customary, communal, or family
Flooded vegetationFlooded low-growth and non-woody vegetation Cultivation of irrigated rice once/twice a year
Burnt plotsRecently cleared and burnt plots with little or no vegetation coverAgricultural fields that are part of the shifting cultivation cycle: after burning they are usually cultivated with rain-fed rice and often abandoned to fallow after one year of cultivation
Low-height vegetationLow-height, non-woody vegetation such as grasses, herbaceous plants and ferns Mainly used as fallows in the shifting cultivation cycle. They can be transformed into clove tree plantations which, in a few cases, are simultaneously used as pastures
Medium-height vegetationMedium-height stands of trees often mixed with shrubs and large herbaceous plantsMainly agroforests with a diverse mix of planted trees and shrubs as well as monocultural clove tree plantations. Could in some cases also represent secondary or degraded forest
Bare landBare soil areas, rocksVillages, roads, beaches, empty riverbeds
GrasslandGrassland (only in the dry transition zone towards the highlands)Pastoral use
WaterWater bodies and wetlands
No dataClouds and cloud shadows
Next, we performed supervised maximum likelihood classification, inputting all spectral bands of our satellite data as well as the Normalized Difference Vegetation Index (NDVI). We further improved and confirmed classification of the large forest areas and the many smaller forest fragments by reclassifying areas within a threshold-based forest mask based on bands 4, 5, and 7. We visually checked the forest masks in detail before reclassifying the areas into (a) forest; (b) medium-height vegetation; and (c) low-height vegetation. All classification results were sieve-filtered with a minimum homogeneous patch size of three four-connected pixels. The filter replaces those pixel class values with their largest neighbouring class value to reduce the salt-and-pepper effect [37] caused by mixed pixel values leading to classification errors. The minimum patch size was defined based on visual comparison with landscape field sizes clearly visible in Google Earth imagery. Areas with cloud cover or shadow were generously masked in all three mosaics. We also masked and manually corrected inconsistent class assignments, in view of our main goal of generating highly accurate LC maps for later spatial analysis at landscape level.

2.3. Assessing Map Accuracy

To assess the accuracy of the two classification results for 2005 and 2011, we used the reference samples which were not used for training of the classification. The 2011 verification data set consisted of about 10,800 pixels covering an area of about 10 km2. The 2005 verification data set consisted of about 26,400 pixels covering an area of about 24 km2. For the 1995 classification, no verification data set was available, but we estimated the accuracy to be similar to that of the 2005 and 2011 classifications, as we used the same classification algorithm. To account for the different sampling intensities in our differently sized LC categories, we weighted the accuracies with the proportion of the LC categories in the respective maps. We then calculated producer accuracy (PA), user accuracy (UA), and overall accuracy (OA) directly from the resulting error matrices, presenting stratified estimators incorporating area proportions as recommended by Olofsson et al. [38]. For comparison, we also computed the unweighted PA and OA from the error matrices based on sample counts [39].

2.4. Quantifying LC Change

To capture the full dynamics and underlying processes of LC change, analysis must include cross-tabulation matrices and not only net-change proportions of LC classes [40]. Therefore, we applied a post-classification pixel-to-pixel comparison in ArcGIS by overlaying LC maps from 1995, 2005, and 2011 to detect from–to transitions between different LC classes [41]. In the resulting cross-tabulation matrices for the 1995–2005 and 2005–2011 intervals, rows show the LC classes from the first time point while columns show classes from the subsequent time point. As the two intervals varied in length, changes were always presented as a percentage of the analysed area per year. The rather long intervals analysed mean that certain changes occurring within those intervals may have been missed.
When trying to detect the most systematic LC changes, it is also necessary to account for the different sizes of LC classes. A large transition between two large classes does not necessarily imply the most systematic LC change, as a large transition would be expected even under a random process of change. Aldwaik and Pontius Jr. [42] therefore propose analysing annual transition intensities, as this method provides a means to account for the different proportions of LC classes. Transition intensities are first calculated relative to the size of the LC class in the initial year (i.e., from a perspective of gains) and then relative to the size of the LC class in the subsequent year (i.e., from a perspective of losses). The obtained value is called the observed annual transition intensity. To detect if a certain transition can be considered systematic, the observed annual transition intensity is compared to the uniform annual transition intensity. Uniform intensity is what would be observed if the gain of a class in the subsequent year were distributed uniformly across the available LC classes in the initial year, or the loss of a class in the initial year were distributed uniformly across the available LC classes in the subsequent year [42]. In our case, forest and low-height vegetation are the two largest classes and therefore even a uniform process of LC change would result in a large transition from forest to low-height vegetation. The difference between observed and uniform intensity indicates whether an observed change between two classes can be considered rather uniform (the closer the value is to zero) or systematic (the further the value is from zero). To detect the most dominant signals of change, we added the difference between observed and uniform transition intensities from the perspective of gains and the perspective of losses.
For the assessment of LC change, we only used the part of the study region that was cloud-free during all three years. Further, we assumed the three LC classes of bare land, grassland, and water to be relatively stable and of no specific interest for our study. We therefore excluded them from the change analysis as well as from the accuracy assessment. The total area for which LC change was assessed thus comprised 14,842 km2, which corresponds to about 61% of the entire study region (Figure 1) and will be referred to as the “analysed area” in this paper.

3. Results

3.1. Classification Accuracy

The error matrices of the estimated area proportions are presented in Table 3. For each year, PA and OA as calculated from the estimated area proportions [38] are compared to the PA and OA derived from the error matrix based on sample counts.
Table 3. Error matrices with cell entries expressed as the estimated proportion of area for the 2005 (above) and 2011 classifications (below). For comparison, the last row in each matrix presents PA based on sample counts.
2005Reference CategoriesTotalUA
ForFldBurLhvMhv
Map
categories
For0.49650.00000.00500.00660.00000.510.98
Fld0.00020.05230.00910.00320.00000.060.81
Bur0.00000.00060.01900.00190.00010.020.88
Lhv0.00050.00300.02160.24180.00020.270.91
Mhv0.00000.00440.00010.00080.04450.050.89
Total0.500.060.050.250.04 OA   0.85
OA* 0.91
PA (strat. estim.)1.000.860.330.960.99
PA (sample count)1.000.840.710.610.97
2011
Map
categories
For0.44760.00040.00000.01490.02450.490.92
Fld0.00000.06610.00060.00490.00070.070.91
Bur0.00000.00080.02890.00300.00050.030.87
Lhv0.00050.00740.00640.25910.03470.310.84
Mhv0.00000.00060.00060.02430.07260.100.74
Total0.450.080.040.310.13 OA   0.87
OA* 0.86
PA (strat. estim.)1.000.880.790.850.55
PA (sample count)1.000.880.830.880.56
LC classes: For = Forest, Fld = Flooded vegetation, Bur = Burnt plots, Lhv = Low-height vegetation, Mhv = Medium-height vegetation. * OA based on sample counts.
In the 2005 map, the lowest UA was obtained for the flooded vegetation class, as it was difficult to tell flooded vegetation apart from burnt plots and low-height vegetation. PA based on the stratified estimator was very low for the burnt plot class, as this class covers only 2% of the 2005 map and therefore greatly reduces the accuracy when used as a weighting factor. The PA based on sample count yielded a much better result for this class, which shows that it is important to account for the different sizes of LC categories in the accuracy assessment. For a very small class such as burnt plots, the omission of even relatively small areas has a much larger effect on the map area of this class than in the case of a large class. It should therefore be kept in mind that the area of burnt plots in 2005 was probably largely underestimated. The lowest PA based on sample counts was found for low-height vegetation. In 2011 both UA and PA were lowest for the class of medium-height vegetation which was mistaken for low-height vegetation. There were only small differences between the PA based on the stratified estimator versus sample count. The large omission error associated with medium-height vegetation signifies that the area of medium-height vegetation was underestimated because part of it was classified mainly as low-height vegetation and sometimes as forest. PA for forest was very high for both years, since most forest samples lie within large forest massifs which were also classified as such.

3.2. Observing Net LC Changes

Table 4 presents LC shares of the analysed area in 1995, 2005, and 2011. Forest comprised the largest share in each year, followed by low-height vegetation. In 1995, the study area was dominated by forest whereas the rest of the area was under agricultural use. Among the non-forest classes, low-height vegetation had the largest share, followed by medium-height vegetation. Flooded vegetation and burnt plots covered only relatively small parts of the analysed area.
Table 4. LC shares (in km2 and percentage of total analysed area) and net area of change (as percentage of total analysed area) for the years 1995, 2005, and 2011.
LC Class199520052011Net Area of Change (%)
km2%km2%km2%1995–20052005–20111995–2011
Forest889459.9803054.1723448.7−5.8−5.4−11.2
Flooded vegetation8105.59646.510777.31.00.81.8
Burnt plots4653.13312.24923.3−0.91.10.2
Low-height vegetation294819.9477432.2457630.812.3−1.311.0
Medium-height vegetation172411.67435.014629.9−6.64.8−1.8
Total14,84210014,84210014,842100
From 1995 to 2005, forest and medium-height vegetation decreased, while low-height vegetation experienced a large increase. Very little net change was observed for flooded vegetation (slight increase) and burnt plots (slight decrease). During the second interval, from 2005 to 2011, forest area further decreased. However, contrary to the first interval, low-height vegetation also somewhat decreased, while medium-height vegetation experienced a large increase. Flooded vegetation and burnt plots both experienced small net increases.
Overall, from 1995 to 2011, only forest decreased consistently while flooded vegetation increased. The largest net decrease in forest was compensated for by a net increase in low-height vegetation. Net LC shares of the three other classes remained almost unchanged during the entire study period. Although by 2011 forest still represented the largest single LC class, agricultural LC classes covered more than half of the analysed area. In the next section we examine the change dynamics of the different LC classes, in order to reveal the underlying processes behind the observed net LC changes.

3.3. Assessing Detailed LC Change Dynamics

Figure 2 reveals the overall change dynamics of each LC class.
During the first interval, the largest loss was experienced by medium-height vegetation followed by forest, and the largest gain by far was made by low-height vegetation. Low-height vegetation experienced, simultaneously, the largest loss and gain during the second interval. This type of change is referred to as a “swap”, and depicts vegetation loss occurring in one location while gain occurs in another [43]. The classes of flooded vegetation and burnt plots were also characterized by a swap rather than by net change.
Figure 2. Gain and loss for each LC class as percentage of analysed area per year from 1995–2005 (left) and 2005–2011 (right). LC classes: For = Forest, Fld = Flooded vegetation, Bur = Burnt plots, Lhv = Low-height vegetation, Mhv = Medium-height vegetation.
Land 04 00454 g002
Next, we distributed the gains and losses of every LC class among the remaining classes, to detect the dynamics of change between LC classes (Table 5). The LC change matrix reveals that the two classes with the largest losses during the first interval (Figure 2)—medium-height vegetation and forest—were transformed mainly into low-height vegetation. The large gain experienced by low-height vegetation originated almost equally from medium-height vegetation and forest area. Flooded vegetation experienced the second largest gain, mainly from low-height vegetation and medium-height vegetation.
Table 5. LC change matrix for two intervals: 1995–2005 (left) and 2005–2011 (right), in percentage of the total analysed area per year.
2005Class n2011Class j
1995ForFldBurLhvMhv2005ForFldBurLhvMhv
Class iFor5.200.070.060.630.03Class mFor7.940.100.130.560.29
Fld0.030.230.020.220.04Fld0.010.650.030.320.06
Bur0.020.040.020.220.02Bur0.010.030.030.260.04
Lhv0.070.180.081.490.17Lhv0.150.360.333.610.91
Mhv0.090.130.040.660.24Mhv0.020.060.030.390.34
LC classes: For = Forest, Fld = Flooded vegetation, Bur = Burnt plots, Lhv = Low-height vegetation, Mhv = Medium-height vegetation.
During the second interval, however, the large gross loss experienced by low-height vegetation was transformed mainly into medium-height vegetation. The second largest loss was again experienced by forest, which, as during the previous interval, lost mostly to low-height vegetation. In terms of gains, low-height vegetation gained mainly from forest while medium-height vegetation gained mainly from low-height vegetation. Although some gain was observed for forest during both intervals, this can mostly be attributed to regrowth of Traveller’s Palm (Ravenala madagascariensis) in the floodplain north of Maroantsetra.

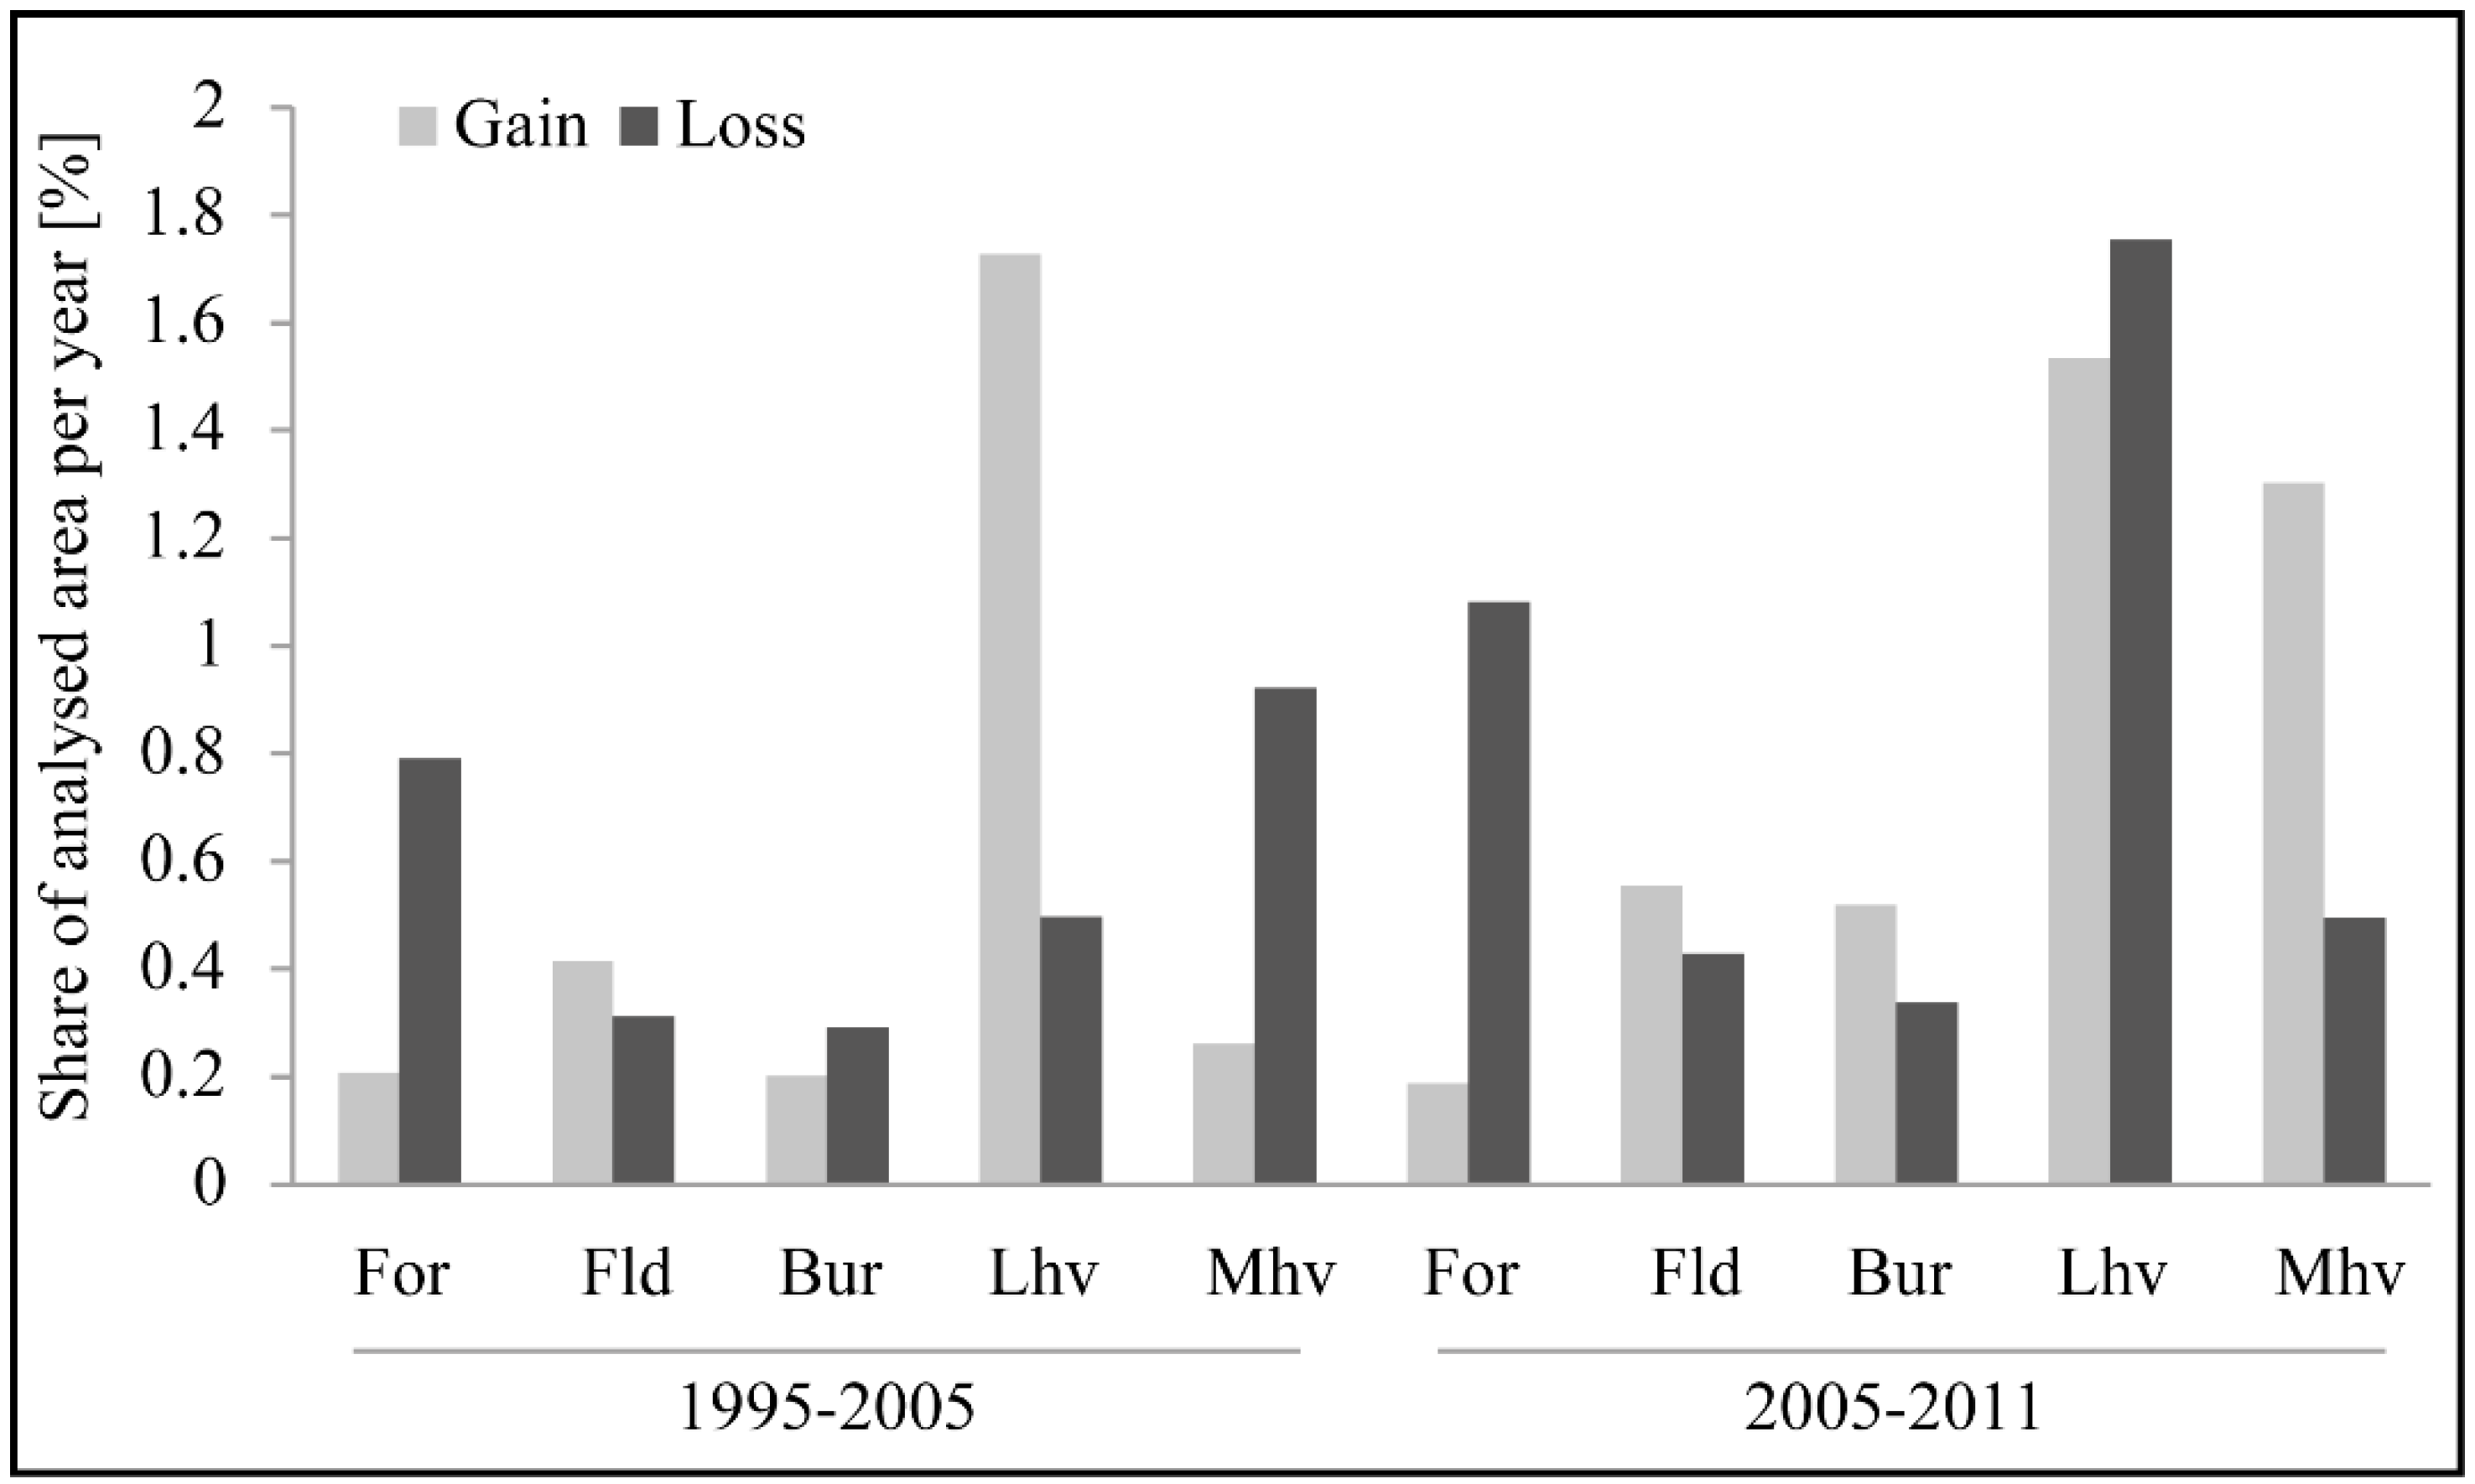
3.4. Assessment of LC Transition Intensities from the Perspective of Gains and Losses

While the LC change matrix in Table 5 gives some indication of key patterns of change, it remains unclear whether the observed transitions from one class to another occurred as a result of processes that are systematically more or less intensive than uniform processes [42]. Therefore, we have to consider differences in class size when trying to identify the most systematic LC transitions [43]. With this purpose, we applied the intensity analysis proposed by Aldwaik and Pontius Jr. [42] to transitions between different LC classes.
Table 6 presents three values for every transition: observed intensity (row i), uniform intensity (row ii), and the difference between observed and uniform intensity (row iii). To detect for each class from which other class it gained most intensively, we compared the values in row (iii) within every class column. During both intervals, the most intensive transition was for low-height vegetation, which gained most intensively from burnt plots. Low-height vegetation also gained intensively from medium-height vegetation and flooded vegetation. Only during the second interval did medium-height vegetation also gain intensively from low-height vegetation. All other gains were far less intensive, and no class systematically gained from forest.
Table 6. Transition intensity analysis from the perspective of gains for the intervals 1995–2005 (left) and 2005–2011 (right): (i) Observed intensity: annual area of gain of class n from class i relative to the size of class i in 1995 (left table) and of class j from class m relative to the size of class m in 2005 (right table); (ii) Uniform intensity: area of gross gain of class n relative to the area of all non-n classes in 1995 (left table) and of class j relative to the area of all non-j classes in 2005 (right table); (iii) difference between observed and uniform intensity.
2005Class n2011Class j
1995ForFldBurLhvMhv2005ForFldBurLhvMhv
Class iFor(i) 0.120.101.050.05Class mFor(i) 0.190.231.040.53
(ii) 0.440.212.150.30(ii) 0.590.532.261.37
(iii) −0.32−0.11−1.1−0.25(iii) −0.4−0.3−1.22−0.84
Fld(i)0.58 0.423.940.77Fld(i)0.17 0.515.000.93
(ii)0.52 0.212.150.30(ii)0.41 0.532.261.37
(iii)0.06 0.211.790.47(iii)−0.24 −0.022.74−0.44
Bur(i)0.541.15 6.920.73Bur(i)0.371.41 11.551.80
(ii)0.520.44 2.150.30(ii)0.410.59 2.261.37
(iii)0.020.71 4.770.43(iii)−0.040.82 9.290.43
Lhv(i)0.340.890.43 0.85Lhv(i)0.471.121.03 2.84
(ii)0.520.440.21 0.30(ii)0.410.590.53 1.37
(iii)−0.180.450.22 0.55(iii)0.060.530.50 1.47
Mhv(i)0.791.100.325.72 Mhv(i)0.371.240.577.71
(ii)0.520.440.212.15 (ii)0.410.590.532.26
(iii)0.270.660.113.57 (iii)−0.040.650.045.45
LC classes: For=Forest, Fld = Flooded vegetation, Bur = Burnt plots, Lhv = Low-height vegetation, Mhv = Medium-height vegetation.
Second, we calculated transition intensities with respect to losses (Table 7). By comparing the values of row (iii) within each class row, we can detect the most intensive transitions in terms of losses for each class. The most intensive transition during both intervals was from low-height vegetation to burnt plots. During both intervals, low-height vegetation also lost intensively to medium-height vegetation and flooded vegetation. The only other relatively intense transitions in terms of loss were from medium-height vegetation to low-height vegetation during the first interval and from forest to burnt plots during the second. The other transitions were much less intensive.
At this stage, we would like to point to the additional insights provided through the intensity analysis as compared to the conventional change matrix (Table 5) alone. By taking into account the large size differences of land cover categories, especially those of forest and burnt plots, the intensity analysis with respect to losses (Table 7) reveals that forest lost most intensively to burnt plots during both intervals. From the change matrix alone, we would conclude that the transition from forest to burnt plots was less important, as in terms of area, forest lost much more to low-height vegetation and to flooded vegetation. The intensity analysis further shows that low-height vegetation experienced the most gain from burnt plots, whereas in terms of area, low-height vegetation gained mostly from medium-height vegetation in the first interval and from forest during the second.
Table 7. Transition intensity analysis from the perspective of losses for the intervals 1995–2005 (left) and 2005–2011 (right): (i) Observed intensity: annual area of loss from class i to class n relative to the size of class n in 2005 (left table), and from class m to class j relative to the size of class j in 2011 (right table); (ii) Uniform intensity: area of gross loss of class i relative to the area of all non-i classes in 2005 (left table) and of class m relative to the area of all non-m classes in 2011 (right table); (iii) difference between observed and uniform intensity.
2005Class n2011Class j
1995ForFldBurLhvMhv2005ForFldBurLhvMhv
Class iFor(i) 1.152.571.960.56Class mFor(i) 1.413.801.832.92
(ii) 1.721.721.721.72(ii) 2.112.112.112.11
(iii) −0.570.850.24−1.16(iii) −0.701.69−0.280.81
Fld(i)0.06 1.020.670.84Fld(i)0.02 1.001.050.61
(ii)0.33 0.330.330.33(ii)0.46 0.460.460.46
(iii)−0.27 0.690.340.51(iii)−0.44 0.540.590.15
Bur(i)0.030.55 0.670.46Bur(i)0.020.43 0.840.41
(ii)0.300.30 0.300.30(ii)0.350.35 0.350.35
(iii)−0.270.25 0.370.16(iii)−0.330.08−0.350.490.06
Lhv(i)0.122.723.78 3.35Lhv(i)0.314.959.97 9.28
(ii)0.730.730.73 0.73(ii)2.542.542.54 2.54
(iii)−0.611.993.05 2.62(iii)−2.232.417.43 6.74
Mhv(i)0.171.961.692.070.17Mhv(i)0.040.860.871.250.04
(ii)0.970.970.970.970.97(ii)0.550.550.550.550.55
(iii)−0.800.990.721.10−0.80(iii)−0.510.310.320.70−0.51
LC classes: For = Forest, Fld = Flooded vegetation, Bur = Burnt plots, Lhv = Low-height vegetation, Mhv = Medium-height vegetation.

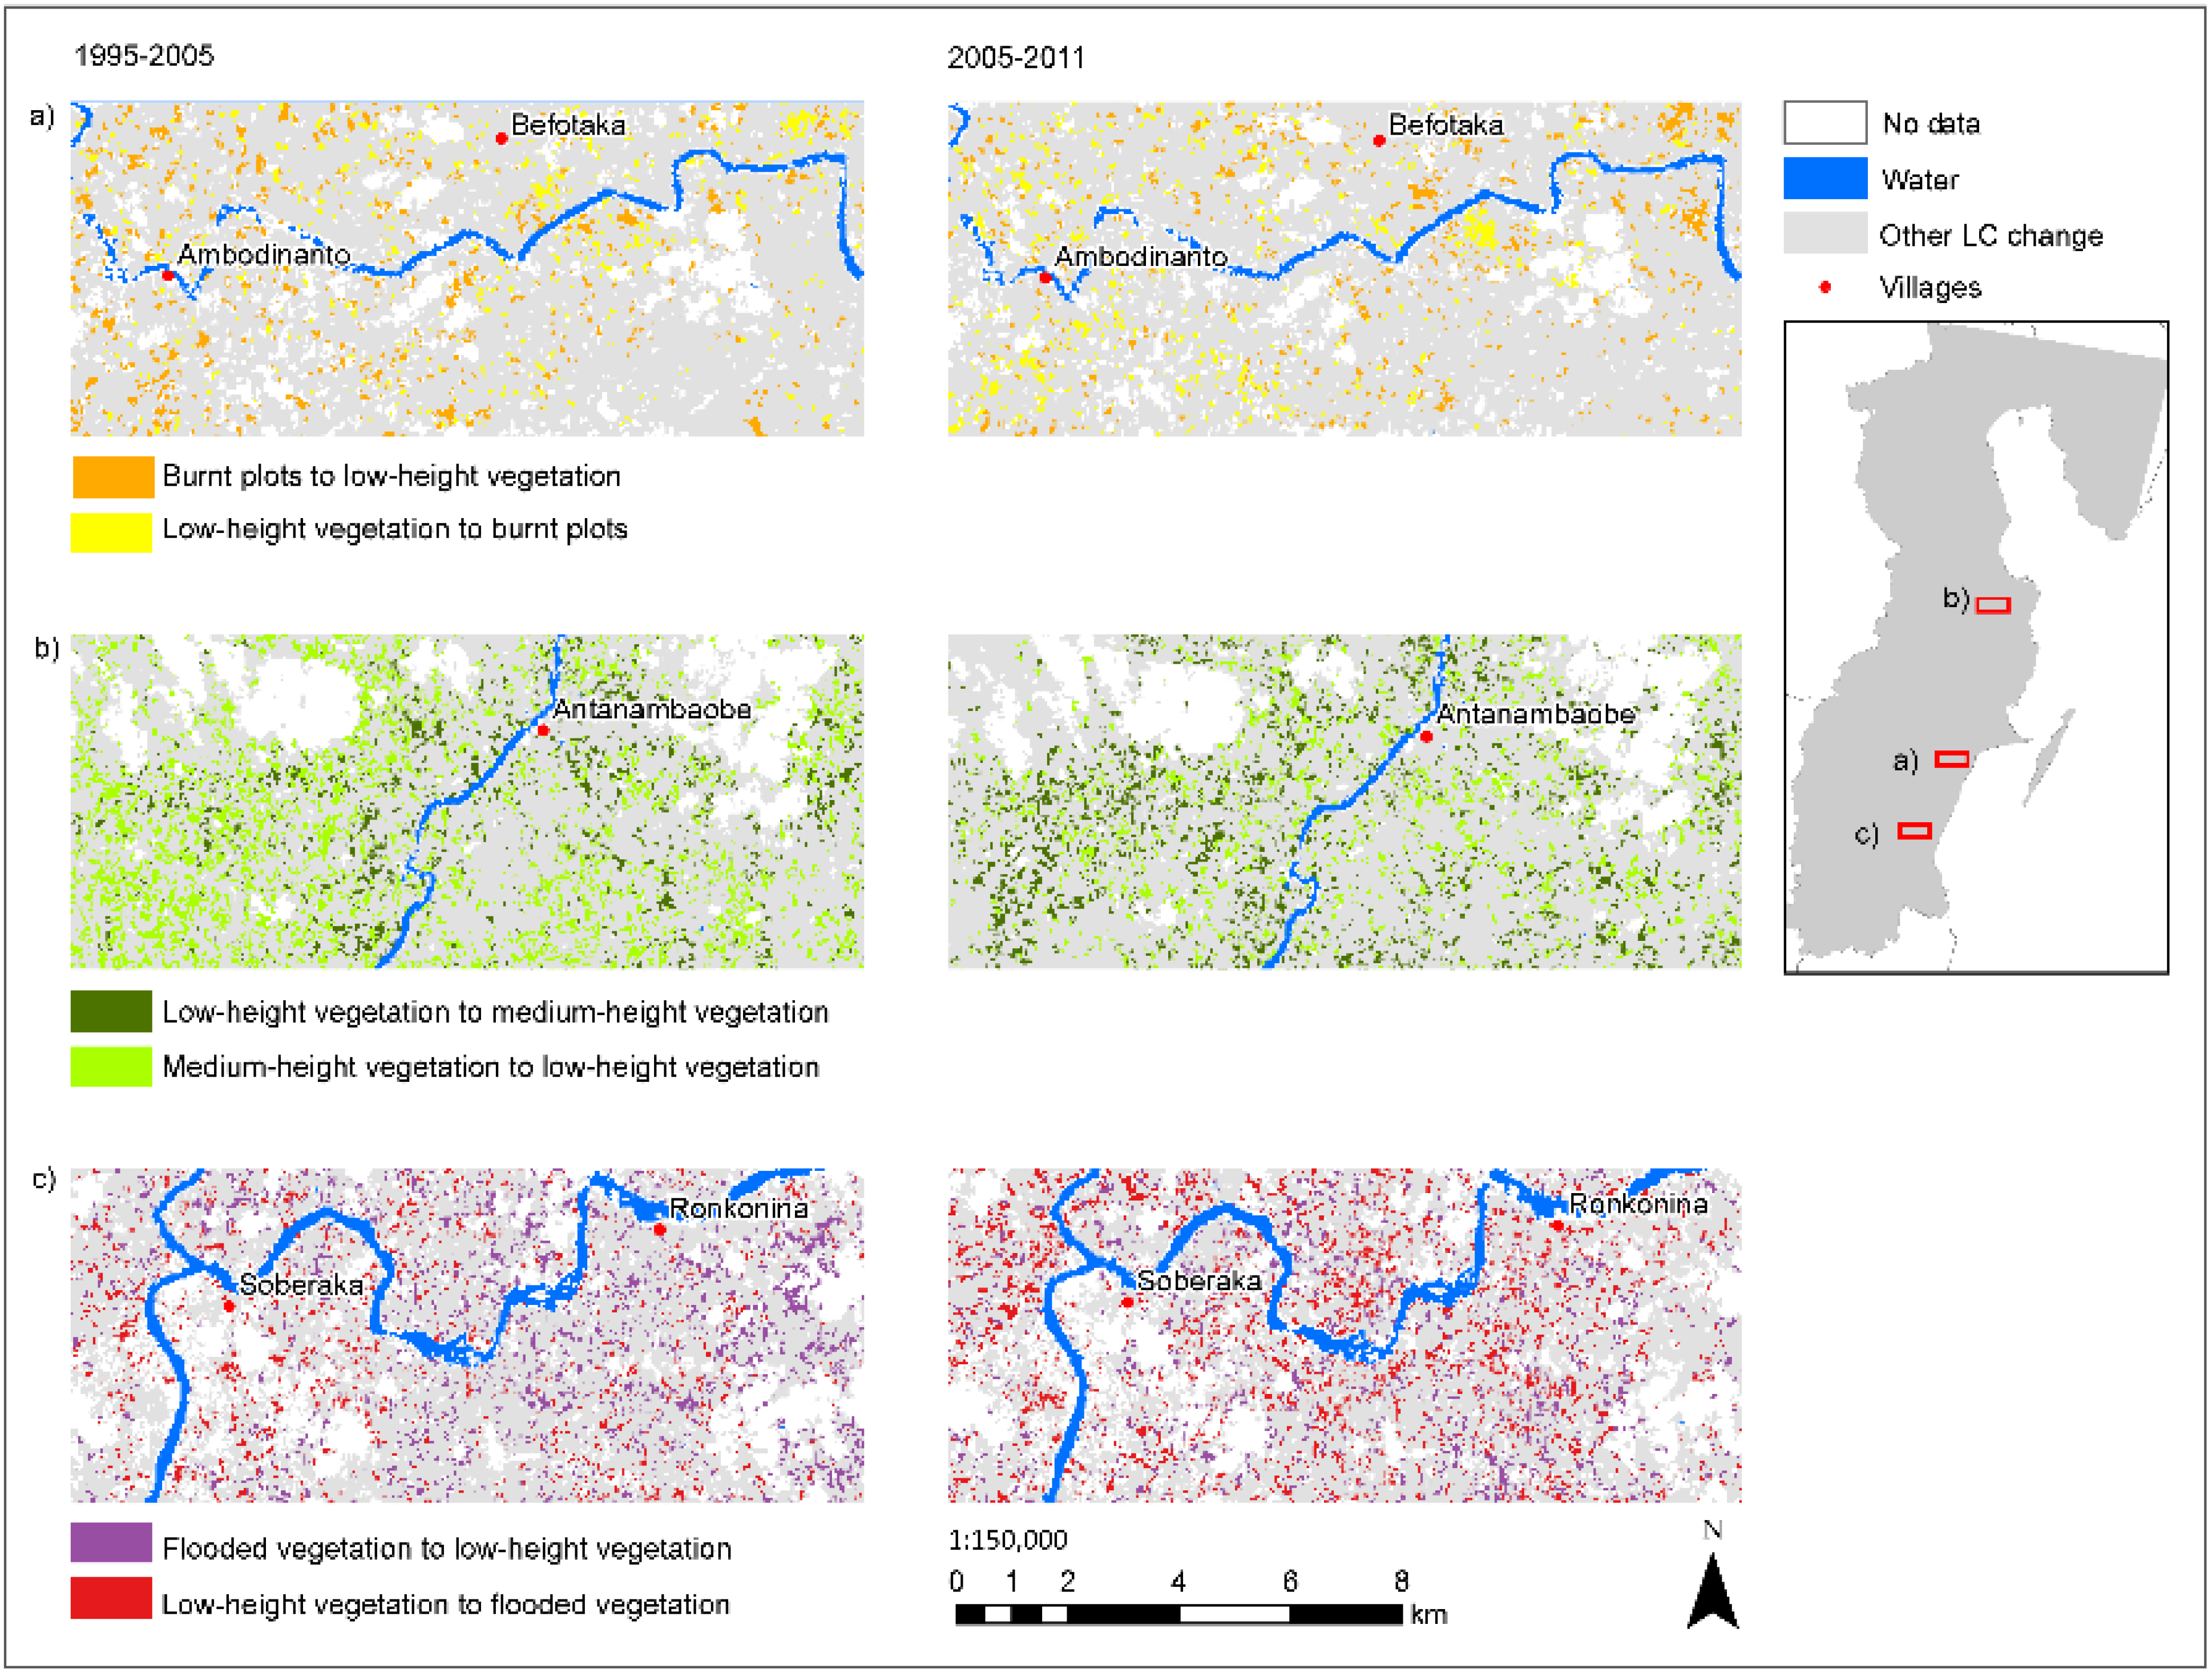
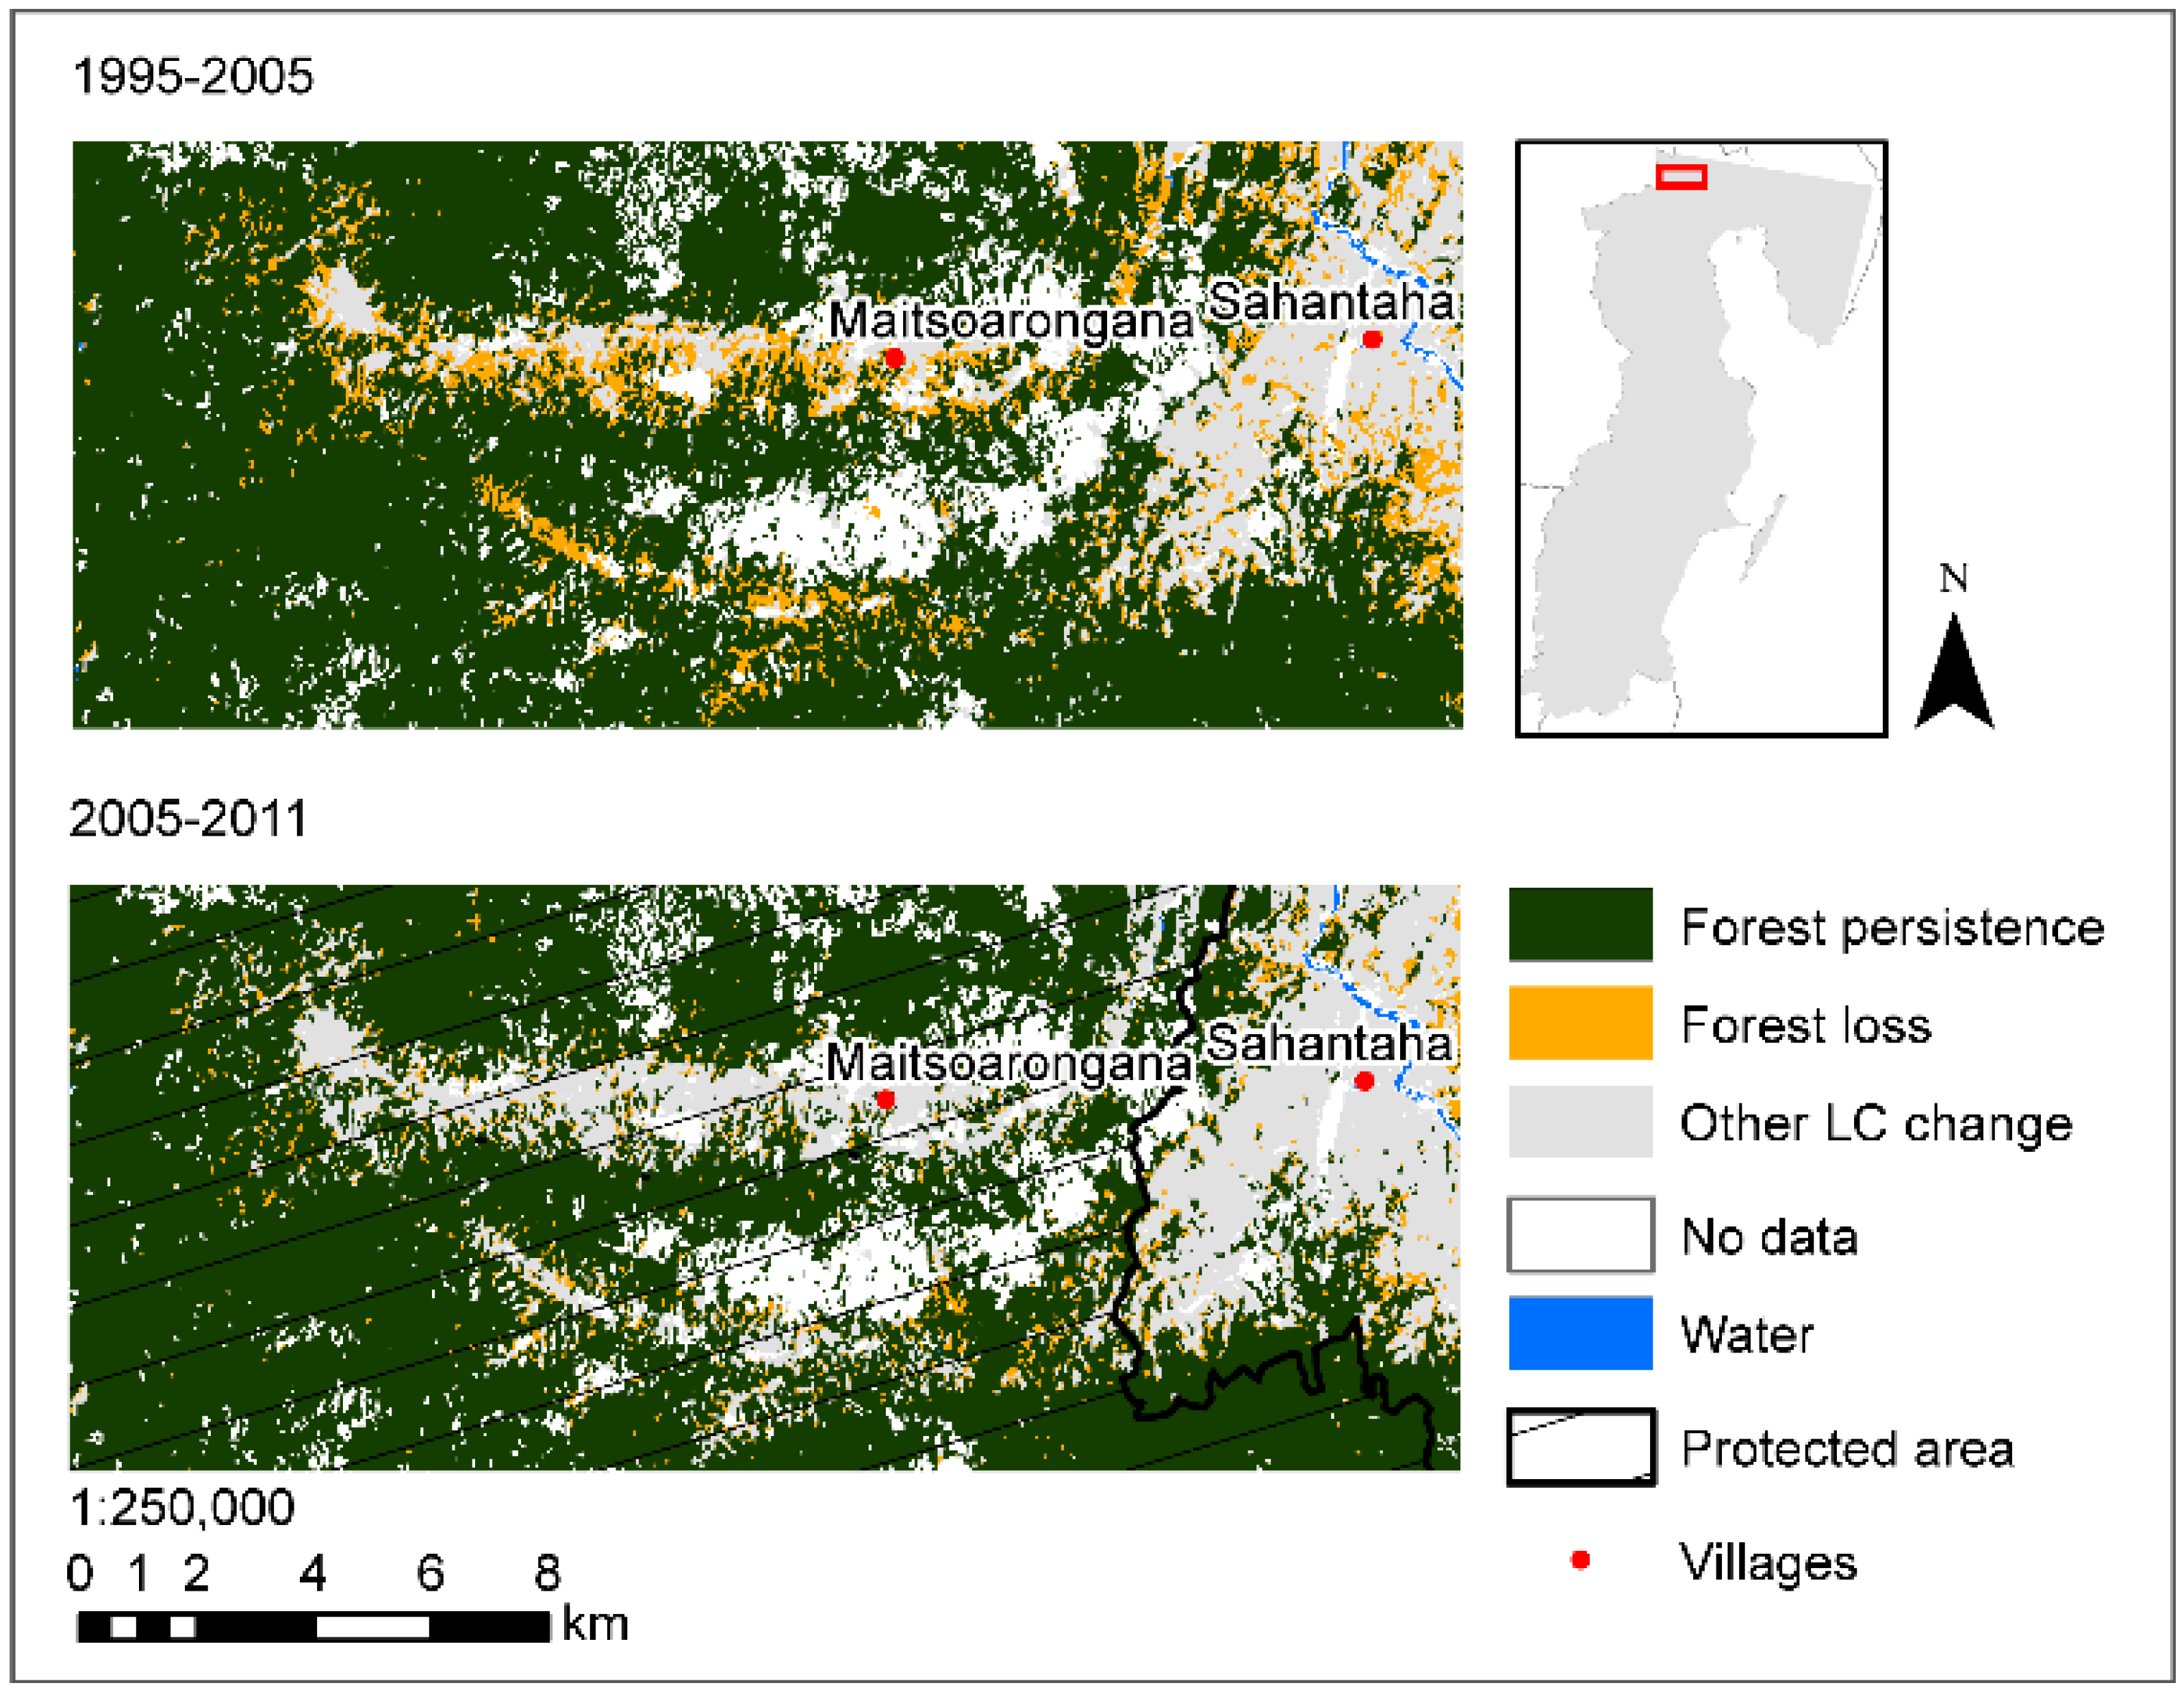
3.5. Revealing the Most Dominant Signals of Change

Combining the intensity of gains (Table 6) with the intensity of losses (Table 7), we can reveal the most dominant signals of change (Table 8). The farther the numbers are from zero, the more systematic the transition.
Table 8. Transition matrix for two intervals, 1995–2005 (left) and 2005–2011 (right), showing added differences between observed and uniform intensity for gain (Table 6) and loss (Table 7).
2005Class n2011Class j
1995ForFldBurLhvMhv2005ForFldBurLhvMhv
Class iFor −0.890.74−0.86−1.41Class mFor1.101.39−1.50−0.03
Fld−0.21 0.92.130.98Fld−0.68 0.523.33−0.29
Bur−0.250.96 5.140.59Bur−0.370.90 9.780.49
Lhv−0.792.443.27 3.17Lhv−2.172.947.93 8.21
Mhv−0.531.650.834.67 Mhv−0.55 0.960.366.15
LC classes: For = Forest, Fld = Flooded vegetation, Bur = Burnt plots, Lhv = Low-height vegetation, Mhv = Medium-height vegetation.
Figure 3. The most dominant LC transitions during both intervals: (a) between burnt plots and low-height vegetation; (b) between low-height and medium-height vegetation; (c) between flooded and low-height vegetation.
Land 04 00454 g003
The most dominant signal of change during both intervals was the simultaneous transition between low-height vegetation and burnt plots and vice versa. This transition indicates a rotational shifting cultivation system where every year fallow plots are slashed and burned for upland rice cultivation in some locations, while in other locations upland rice fields are abandoned to fallow. Another simultaneous transition was observed between medium-height and low-height vegetation and vice versa. During the first interval, the decrease in biomass from medium-height to low-height vegetation was more intensive, while during the second interval the opposite process was more dominant. The third dominant transition during both intervals was from low-height vegetation to flooded vegetation and vice versa.
To illustrate the small-scale but highly dynamic character of these six transitions, three selected areas are shown in Figure 3.
Another three transition types were dominant mainly during one of the two intervals. During the first interval, medium-height vegetation was systematically transformed into flooded vegetation. During the second interval, deforestation to burnt plots and to flooded vegetation were also dominant transitions.

4. Discussion

4.1. Overall Trends in LC Change: Deforestation and Expansion of Agricultural Land

Deforestation on the eastern escarpment of Madagascar has long attracted the attention of scholars and conservation practitioners (e.g., [22,44]). Our analysis of net LC changes (Table 4) revealed that during the 16-year study period from 1995 to 2011, forest area decreased by about 11% and low-height vegetation, mainly representing fallow land, increased. The rate of annual forest loss accelerated over the two intervals, with 1% of the initial forest area lost every year from 1995 to 2005 and 1.7% from 2005 to 2011. Both increase and magnitude of our observed annual deforestation rate are in line with more local-scale studies conducted within our study region. In one of these studies, conducted in the northern part of Masoala National Park, Allnutt et al. [27] found that the annual rate of forest change increased from 0.99% during 2005 and 2008 to 1.27% from 2010 to 2011. In another, carried out in the Manompana forest corridor, the annual deforestation rate remained almost stable with 1.07% between 1991 and 2004 and 1.09% between 2004 and 2009 [28]. It should be noted though, that such averaged rates of change are of limited value for this study, as they conceal the high variability of change between the analysed time points. During both intervals of our study, forest loss occurred mainly outside today’s core zones of protected areas (92% from 1995 to 2005 and 88% from 2005 to 2011) and targeted mostly the small forest fragments that are part of the diverse landscape mosaic typical of north-eastern Madagascar. Although the importance of those fragments for the provision of forest products and services is acknowledged by local land users, they are primarily perceived as a land reserve for future cultivation and thus deforested once additional land is needed [32]. Since the majority of protected areas in our study region were established before 1995, we did not further investigate if those protected areas had any impact on forest change. However, for Makira Natural Park, established in 2005, we observed that in the valley of Maitsoarongana intense forest loss occurred between 1995 and 2005 but was no longer the case between 2005 and 2011 (Figure 4). Nonetheless, such local examples should be treated with caution, as they are not necessarily representative of broader trends.
Figure 4. Example of forest loss before and after establishment of Makira Natural Park in 2005.
Land 04 00454 g004
By considering agricultural LC classes in our analysis, we are able to add evidence to the scarce knowledge base on the development and current state of shifting cultivation on the north-eastern escarpment. The total area of burnt plots increased very little during the overall study period. This indicates that the area used for rain-fed rice production through shifting cultivation has remained at almost the same level as in 1995. The smaller area of burnt plots observed in early 2005 as compared to 1995 and 2011, however, should be regarded as a one-time phenomenon rather than as a manifestation of more profound changes. With very few fires, 2004 was an extreme outlier: Madagascar’s total burnt surface amounted to less than 10% of the average surface burnt between 1992 and 2007 [45]. The low occurrence of fires in 2004 was confirmed also by MODIS fire observations of the Analanjirofo region [46]. This might be explained by inter-annual rainfall variability: during periods of excessive rainfall, land users are unable to light the slashed vegetation. As December 2004 was the wettest December during our entire study period [47], this might have caused some land users to skip upland rice cultivation for one year and rely on irrigated rice harvests complemented by rice bought on the market, spending income from cash crops or wage labour. Furthermore, our accuracy assessment based on the stratified estimator indicates that the area of burnt plots in 2005 was underestimated on the map.
Low-height vegetation experienced by far the largest increase in net area during the study period. Assuming that low-height vegetation to a large part represents agricultural land under fallow (see Table 2 for the link between land cover and land use), this suggests that land users expanded their fallow land while the total area of burnt plots between 1995 and 2011 remained more or less stable. As a fallow is always preceded by a burnt plot, this result implies that at some point between 1995 and 2011 there was a peak in burnt plots which was omitted by our analysis (see Section 2.4.). A probable explanation for the expansion of fallows is that this constitutes the only option for land users to hold off shortening crop rotation cycles, and thus counteract fertility decline, in the absence of access to agricultural inputs and restricted time and labour availability [48]. Yet, shortened fallow cycles might also occur in some locations, as this aggregated result probably masks large differences among individual households’ access to land. Another possible explanation relates to the traditional land rights system which grants ownership to the person who first deforests a parcel of land for cultivation [32,49]. With increasing physical scarcity of forests as well as access restrictions in the study region, land users might engage in deforestation not only to bring land into production to cover immediate food requirements, but also to secure it for their descendants.

4.2. Detailed LC Change Dynamics

The most dominant change process in the analysed area was observed between low-height vegetation and burnt plots. While low-height vegetation regrew on formerly burnt plots, elsewhere low-height vegetation was burnt. Burnt plots gained more intensively from low-height vegetation than from forest (Table 6), especially during the second time interval. This exchange between the two classes reflects the rotational character that is typical of the shifting cultivation system along the north-east coast as opposed to a pioneering shifting cultivation system, where new rice fields are established in forest [50].
Nevertheless, pioneering shifting cultivation is still very widespread in the analysed area. In terms of area, forest was mainly transformed into low-height vegetation, but when taking into account the highly different sizes of the individual LC classes, the most intensive transition occurred from forest to burnt plots (Table 8). Additionally, the area of transition from forest to low-height vegetation can to a large extent also be attributed to agricultural expansion for shifting cultivation. The pixels classified as burnt plots in one year will be covered with low-height vegetation the next, and thus be missed by our analysis with intervals of 10 and six years. As we assume that the majority of burnt plots in the analysed area are indicative of shifting cultivation rather than logging, this result suggests that current deforestation in the analysed part of our study region occurs mainly to clear land for shifting cultivation. We do not mean to imply that the logging of precious timber species is of little concern in the study region, but this process of forest change was omitted by our analysis, as the logging of single trees requires higher-resolution spatial data for detection [27]. However, while the current illegal selective logging practices in our study region may have severe impacts on the forest’s biodiversity value [51], their contribution to large-scale LC change as analysed by our regional-level study is probably negligible. Contrary to most other shifting cultivation hotspots around the globe [11], in north-eastern Madagascar, shifting cultivation persists and its contribution to deforestation has probably even increased between 1995 and 2011.
Another important change process observed concerns the decrease in biomass from medium- to low-height vegetation during the first interval, and vice versa during the second. This might in part be related to extreme changes in producer prices for the main tree cash crops of coffee and clove in the study region. While producer prices for cloves in Madagascar experienced about a 10-fold increase between 1995 and 2002, the opposite trend was recorded for coffee prices during this period [31]. This might have incited some land users to uproot their coffee plantations and plant clove trees instead. A transformation such as this would have shown up in our analysis as a change from medium- to low-height vegetation and back again to medium-height. It should be noted though that the accuracy of the 2011 LC map is lowest for the class of medium-height vegetation, and that at least during the second interval part of this change might be attributable to confusion with low-height vegetation.
Lastly, the mutual transformation between flooded and low-height vegetation during each of our study intervals points to the importance of sociocultural factors influencing the dynamics of agricultural production systems in the region. Land users can only maintain irrigated rice production if they have access to irrigation water, and conflicts concerning the distribution of irrigation water as well as labour investments into irrigation infrastructure are very common in the region [14,30]. As a result, land users might let their irrigated rice fields lie fallow for some years until the conflict is resolved. While this could explain part of the swap between flooded and low-height vegetation, part of this change can be attributed to flooded vegetation being misclassified as low-height vegetation, due to annual differences in water levels during the three study years (see Table 3).

5. Conclusions

North-eastern Madagascar receives much international attention due to the extraordinary biodiversity and high carbon levels preserved in its shrinking humid rainforests. In this context, our analysis presents the first attempt to identify and understand the main dynamics of LC change at a regional scale. Overall, our results appear to confirm the general assumption that land use is intensifying in the study region. The total area under upland rice cultivation remained almost stable over the 16-year study period, while the area of irrigated rice fields slightly increased. However, our observations do not confirm the often-held assumption that land use intensification leads to less deforestation. On the contrary, we found that the rate of forest loss had increased between 1995 and 2011, with forest largely replaced through low-height vegetation. This contradictory trend suggests that even if more rice is produced in irrigated paddies, shifting cultivation will continue. This may be explained by differences in individual households’ access to land on the one hand (some only have access to land for shifting cultivation), and diversification strategies on the other (households with access to both types of land will use both to reduce risks, e.g., of crop failure due to cyclones). Furthermore, under customary law, slashing and burning forests is the most commonly used means of securing land for future generations.
The main cause of deforestation between 1995 and 2011 was shifting cultivation. While the large forest massifs enclosed by protected areas seemed to be comparatively well protected, deforestation predominantly occurred in the smaller forest fragments interspersed in the agricultural landscape. As the term “pioneering shifting cultivation” usually designates the establishment of new upland rice fields at the forest frontier, a new term might be needed to describe the process of landscape homogenization we observed in our study region. We therefore suggest the term “homogenizing shifting cultivation” to describe the process of shifting cultivation that removes the last forest fragments from the landscape. This may well be an outcome conservation organizations are prepared to accept as a side effect of preserving the few remaining forest massifs in strictly protected areas. However, little is known about the socio-economic, sociocultural, and ecological consequences should those fragments disappear.
To conclude, we would like to stress the importance of analysing and understanding the links between the different land use components of shifting cultivation, irrigated rice production, cash crop cultivation, animal husbandry, and forest use in an integrative way. To support the planning of more comprehensive interventions to slow forest loss in north-eastern Madagascar, it will be necessary to link the present LC information with land users’ socioecological interactions. A deepened understanding of land use processes and the actors influencing them could serve as a first step to negotiating land use trade-offs and ensuring the long-term existence of highly diverse landscapes fulfilling both ecological and sociocultural goals.

Acknowledgments

This research was supported by the Centre for Development and Environment (CDE), and the Institute of Geography, University of Bern, Switzerland, the Eastern and Southern Africa Partnership Programme (ESAPP), supported by the Swiss Agency for Development and Cooperation (SDC), as well as the Swiss Programme for Research on Global Issues for Development (r4d programme) supported by the Swiss National Science Foundation (SNSF) and SDC, grant number 400440 152167. We thank Tina Hirschbuehl for editing.

Author Contributions

Land cover classification was performed by Sandra Eckert. Main data analysis was performed by Julie G. Zaehringer. Sandra Eckert contributed to the materials and methods. Peter Messerli contributed to the discussion and conclusion. Julie G. Zaehringer wrote the paper.

Conflicts of Interest

The authors declare no conflict of interest.

References

  1. Foley, J.A.; DeFries, R.; Asner, G.P.; Barford, C.; Bonan, G.; Carpenter, S.R.; Chapin, F.S.; Coe, M.T.; Daily, G.C.; Gibbs, H.K.; et al. Global consequences of land use. Science 2005, 309, 570–574. [Google Scholar] [CrossRef] [PubMed]
  2. Turner, B.L.; Lambin, E.F.; Reenberg, A. The emergence of land change science for global environmental change and sustainability. Proc. Natl. Acad. Sci. USA 2007, 104, 20666–20671. [Google Scholar] [CrossRef] [PubMed]
  3. Gibbs, H.K.; Ruesch, A.S.; Achard, F.; Clayton, M.K.; Holmgren, P.; Ramankutty, N.; Foley, J.A. Tropical forests were the primary sources of new agricultural land in the 1980s and 1990s. Proc. Natl. Acad. Sci. USA 2010, 107, 16732–16737. [Google Scholar] [CrossRef] [PubMed]
  4. Hansen, M.C.; Potapov, P.V.; Moore, R.; Hancher, M.; Turubanova, S.A.; Tyukavina, A.; Thau, D.; Stehman, S.V.; Goetz, S.J.; Loveland, T.R.; et al. High-resolution global maps of 21st-century forest cover change. Science 2013, 342, 850–853. [Google Scholar] [CrossRef] [PubMed]
  5. Allen, J.C.; Barnes, D.F. The causes of deforestation in developing countries. Ann. Assoc. Am. Geogr. 1985, 75, 163–184. [Google Scholar] [CrossRef]
  6. Myers, N. Conversion of Tropical Moist Forests; U.S. National Research Council: Washington, DC, USA, 1980. [Google Scholar]
  7. Geist, H.J.; Lambin, E.F. Proximate causes and underlying driving forces of tropical deforestation: Tropical forests are disappearing as the result of many pressures, both local and regional, acting in various combinations in different geographical locations. BioScience 2002, 52, 143–150. [Google Scholar] [CrossRef]
  8. DeFries, R.S.; Rudel, T.; Uriarte, M.; Hansen, M. Deforestation driven by urban population growth and agricultural trade in the twenty-first century. Nat. Geosci. 2010, 3, 178–181. [Google Scholar] [CrossRef]
  9. Lambin, E.F.; Meyfroidt, P. Global land use change, economic globalization, and the looming land scarcity. Proc. Natl. Acad. Sci. USA 2011, 108, 3465–3472. [Google Scholar] [CrossRef] [PubMed]
  10. Rudel, T.K.; DeFries, R.; Asner, G.P.; Laurance, W.F. Changing drivers of deforestation and new opportunities for conservation. Conserv. Biol. 2009, 23, 1396–1405. [Google Scholar] [CrossRef] [PubMed]
  11. Van Vliet, N.; Mertz, O.; Heinimann, A.; Langanke, T.; Pascual, U.; Schmook, B.; Adams, C.; Schmidt-Vogt, D.; Messerli, P.; Leisz, S.; et al. Trends, drivers and impacts of changes in swidden cultivation in tropical forest-agriculture frontiers: A global assessment. Glob. Environ. Chang. 2012, 22, 418–429. [Google Scholar] [CrossRef]
  12. Scales, I.R. Conservation and Environmental Management in Madagascar; Earthscan Conservation and Development Series; Earthscan from Routledge: London, UK, 2014. [Google Scholar]
  13. Klanderud, K.; Mbolatiana, H.Z.H.; Vololomboahangy, M.N.; Radimbison, M.A.; Roger, E.; Totland, O.; Rajeriarison, C. Recovery of plant species richness and composition after slash-and-burn agriculture in a tropical rainforest in Madagascar. Biodivers. Conserv. 2010, 19, 187–204. [Google Scholar] [CrossRef]
  14. Messerli, P. Alternatives à la Culture sur Brûlis sur la Falaise Est de Madagascar: Stratégies en vue d’une Gestion Plus Durable des Terres; African Studies Series; Geographica Bernensia: Bern, Switzerland, 2004; Volume A17. [Google Scholar]
  15. Styger, E.; Rakotondramasy, H.M.; Pfeffer, M.J.; Fernandes, E.C.M.; Bates, D.M. Influence of slash-and-burn farming practices on fallow succession and land degradation in the rainforest region of Madagascar. Agric. Ecosyst. Environ. 2007, 119, 257–269. [Google Scholar] [CrossRef]
  16. Kull, C.A. Isle of Fire. The Political Ecology of Landscape Burning in Madagascar; University of Chicago Geography Research Papers: Chicago, IL, USA, 2004. [Google Scholar]
  17. Kull, C.A. Deforestation, erosion, and fire: Degradation myths in the environmental history of Madagascar. Environ. Hist. 2000, 6, 423–450. [Google Scholar] [CrossRef]
  18. Freudenberger, K. Paradise Lost? Lessons from 25 Years of USAID Environment Programs in Madagascar; International Resources Group: Washington, DC, USA, 2010. [Google Scholar]
  19. Pollini, J. Agroforestry and the search for alternatives to slash-and-burn cultivation: From technological optimism to a political economy of deforestation. Agric. Ecosyst. Environ. 2009, 133, 48–60. [Google Scholar] [CrossRef]
  20. Scales, I.R. The drivers of deforestation and the complexity of land use. In Conservation and Environmental Management in Madagascar; Scales, I.R., Ed.; Earthscan Conservation and Development Series; Earthscan from Routledge: London, UK, 2014; pp. 105–125. [Google Scholar]
  21. Ganzhorn, J.U.; Lowry, P.P.; Schatz, G.E.; Sommer, S. The biodiversity of Madagascar: One of the world’s hottest hotspots on its way out. Oryx 2001, 35, 346–348. [Google Scholar] [CrossRef]
  22. McConnell, W.J.; Kull, C.A. Deforestation in Madagascar. In Conservation and Environmental Management in Madagascar; Scales, I.R., Ed.; Earthscan Conservation and Development Series; Earthscan from Routledge: London, UK, 2014; pp. 67–104. [Google Scholar]
  23. Ministère de l’Environnement, des Forêts et du Tourisme (MEFT); United States Agency for International Development (USAID); Conservation International (CI). Evolution de la Couverture de Forêts Naturelles à Madagascar, 1990–2000–2005; MEFT, USAID et CI: Antananarivo, Madagascar, 2009; p. 132. Available online: http://www.bastamag.net/IMG/pdf/meft_usaid_ci_2009_etude_sur_la_de_forestation_de_1990_a_2005_2_.pdf (accessed on 30 October 2014).
  24. Grinand, C.; Rakotomalala, F.; Gond, V.; Vaudry, R.; Bernoux, M.; Vieilledent, G. Estimating deforestation in tropical humid and dry forests in Madagascar from 2000 to 2010 using multi-date Landsat satellite images and the random forests classifier. Remote Sens. Environ. 2013, 139, 68–80. [Google Scholar] [CrossRef]
  25. Harper, G.J.; Steininger, M.K.; Tucker, C.J.; Juhn, D.; Hawkins, F. Fifty years of deforestation and forest fragmentation in Madagascar. Environ. Conserv. 2007, 34, 325–333. [Google Scholar] [CrossRef]
  26. Office National pour l’Environnement (ONE); Direction Générale des Forêts (DGF); Foiben-Taosarintanin’i Madagasikara (FTM); Madagascar National Parks (MNP); Conservation International (CI). Evolution de la Couverture de Forêts Naturelles à Madagascar 2005–2010; ONE, DGF, FTM, MNP et CI: Antananarivo, Madagascar, 2013. Available online: http://www.pnae.mg/index.php/Autres/evolution-de-la-couverture-de-forets-naturelles-a-madagascar-2005–2010.html (accessed on 30 October 2014).
  27. Allnutt, T.F.; Asner, G.P.; Golden, C.D.; Powell, G.V.N. Mapping recent deforestation and forest disturbance in northeastern Madagascar. Trop. Conserv. Sci. 2013, 6, 1–15. [Google Scholar]
  28. Eckert, S.; Ratsimba, H.R.; Rakotondrasoa, L.O.; Rajoelison, L.G.; Ehrensperger, A. Deforestation and forest degradation monitoring and assessment of biomass and carbon stock of lowland rainforest in the Analanjirofo region, Madagascar. For. Ecol. Manag. 2011, 262, 1996–2007. [Google Scholar] [CrossRef]
  29. Jury, M.R. The climate of Madagascar. In The Natural History of Madagascar; Goodman, S.M., Benstead, J.P., Eds.; The University of Chicago: Chicago, IL, USA/London, UK, 2003; pp. 75–87. [Google Scholar]
  30. Locatelli, B. Pression Démographique et Construction du Paysage Rural des Tropiques Humides: L’exemple de Mananara (Madagascar); L’Ecole Nationale du Génie Rural, des Eaux et des Forêts Centre de Montpellier: Montpellier, France, 2000. [Google Scholar]
  31. Food and Agriculture Organization of the United Nations (FAO). FAOSTAT. Available online: http://faostat3.fao.org (accessed on 22 July 2014).
  32. Urech, Z.L.; Rabenilalana, M.; Sorg, J.-P.; Felber, H.R. Traditional use of forest fragments in Manompana, Madagascar. In Collaborative Governance of Tropical Landscapes; Colfer, C.J.P., Pfund, J.-L., Eds.; Earthscan: London, UK, 2011; pp. 133–155. [Google Scholar]
  33. International Union for Conservation of Nature (IUCN); United Nations Environment Programme (UNEP). The World Database on Protected Areas (WDPA). Available online: http://www.protectedplanet.net (accessed on 25 July 2014).
  34. Lee, D.S.; Storey, J.C.; Choate, M.J.; Hayes, R.W. Four years of Landsat-7 on-orbit geometric calibration and performance. IEEE Trans. Geosci. Remote Sens. 2004, 42, 2786–2795. [Google Scholar] [CrossRef]
  35. Richter, R. Atmospheric/Topographic Correction for Satellite Imagery (ATCOR-2/3 User Guide 8.3.1); DLR-IB 565–01/13; DLR: Wessling, Germany, 2014. [Google Scholar]
  36. Messerli, P.; Heinimann, A.; Epprecht, M. Finding Homogeneity in heterogeneity—A new approach to quantifying landscape mosaics developed for the Lao PDR. Hum. Ecol. 2009, 37, 291–304. [Google Scholar] [CrossRef] [PubMed] [Green Version]
  37. Lillesand, T.M.; Kiefer, R.W. Remote Sensing and Image Interpretation; John Wiley: New York, NY, USA, 1999. [Google Scholar]
  38. Olofsson, P.; Foody, G.M.; Stehman, S.V.; Woodcock, C.E. Making better use of accuracy data in land change studies: Estimating accuracy and area and quantifying uncertainty using stratified estimation. Remote Sens. Environ. 2013, 129, 122–131. [Google Scholar] [CrossRef]
  39. Congalton, R.G.; Green, K. Assessing the Accuracy of Remotely Sensed Data: Principles and Practices; Lewis Publishers: Boca Rotan, FL, USA, 1999. [Google Scholar]
  40. Heinimann, A.; Messerli, P.; Schmidt-Vogt, D.; Wiesmann, U. The dynamics of secondary forest landscapes in the Lower Mekong basin. Mt. Res. Dev. 2007, 27, 232–241. [Google Scholar] [CrossRef]
  41. Braimoh, A.K. Random and systematic land-cover transitions in northern Ghana. Agric. Ecosyst. Environ. 2006, 113, 254–263. [Google Scholar] [CrossRef]
  42. Aldwaik, S.Z.; Pontius, R.G., Jr. Intensity analysis to unify measurements of size and stationarity of land changes by interval, category, and transition. Landsc. Urban Plan. 2012, 106, 103–114. [Google Scholar] [CrossRef]
  43. Pontius, R.G., Jr.; Shusas, E.; McEachern, M. Detecting important categorical land changes while accounting for persistence. Agric. Ecosyst. Environ. 2004, 101, 251–268. [Google Scholar] [CrossRef]
  44. Green, G.M.; Sussman, R.W. Deforestation history of the eastern rain forests of Madagascar from satellite images. Science 1990, 248, 212–215. [Google Scholar] [CrossRef] [PubMed]
  45. Office National pour l’Environnement (ONE). Tableau de Bord Environnemental National; Ministère de l’Environnement et des Forêts: Antananarivo, Madagascar, 2008; Available online: http://www.pnae.mg/index.php/TBE-National/Voir-categorie.html (accessed on 27 January 2015).
  46. Cano, A. Carte de Feux en Forêt de 2002–2013 en Analanjirofo. 2014. Available online: ftp://newcabsftp.conservation.org/_public_perm/FAS/Region_Analanjirofo.pdf (accessed on 10 June 2014).
  47. IRI Data Library Standardized Precipitation Index. Available online: http://iridl.ldeo.columbia.edu/maproom/Global/Precipitation (accessed on 6 February 2015).
  48. Laney, R.M. Disaggregating induced intensification for land-change analysis: A case study from Madagascar. Ann. Assoc. Am. Geogr. 2002, 92, 702–726. [Google Scholar] [CrossRef]
  49. Keller, E. The banana plant and the moon: Conservation and the Malagasy ethos of life in Masoala, Madagascar. Am. Ethnol. 2008, 35, 650–664. [Google Scholar] [CrossRef]
  50. Castella, J.-C.; Lestrelin, G.; Hett, C.; Bourgoin, J.; Fitriana, Y.R.; Heinimann, A.; Pfund, J.-L. Effects of landscape segregation on livelihood vulnerability: Moving from extensive shifting cultivation to rotational agriculture and natural forests in northern Laos. Hum. Ecol. 2013, 41, 63–76. [Google Scholar] [CrossRef]
  51. Burivalova, Z.; Şekercioğlu, Ç.H.; Koh, L.P. Thresholds of logging intensity to maintain tropical forest biodiversity. Curr. Biol. 2014, 24, 1893–1898. [Google Scholar] [CrossRef] [PubMed]

