1. Introduction
Over the last two decades the Common Agricultural Policy (CAP) has been reformed and modified following economic, environmental and policy changes and the new challenges related to food security, climate change, and territorial and social cohesion. This is consistent with the aims of Europe 2020 and is guided by support for the agricultural sector as a key-component in a sustainable economy [
1]. Environmental concerns have been strengthened in the new CAP reform (2014–2020), which makes greening (permanent grassland, crop diversification, and ecological focus areas) compulsory in order to obtain direct payments (1st Pillar). Environmental issues are also becoming more important in EU Rural Development policies (2nd Pillar). The key element of the next programming period is Measure 10, the legal bases of which are in Art. 28 of Reg. (EU) 1305/2013 concerning the Agri-Environmental-Climate (AEC) measures. This set of measures provides payments to farmers making commitments related to environmental preservation and landscape maintenance. The aim of these measures is to encourage farmers to protect and enhance the environment on their farmland by compensating them for the provision of ecosystem services (ES). The main financial instrument for this is the European Agricultural Fund for Rural Development.
The identification of an adequate justification for AEC payments is a central issue of the Rural Development Programmes. As stated, AEC measures aim to preserve and promote the necessary changes to agricultural practices that make a positive contribution to the environment and climate. According to the technical guidelines on AEC measures [
2], the details of the commitments should be justified by evidence of likely environmental benefits. The European Court of Auditors [
3,
4] stated that this evidence (test plots, case studies, impact models,
etc.) is relevant as the effects of the measures depend on the specific characteristics and requirements of the areas where they are implemented. If the impact of given practices in given areas is unknown, it is impossible to decide whether their implementation will be effective. In any case, Rural Development payments compensate for the additional costs or income waived resulting from the commitments taken on and not for the ES they deliver. A justification based on these services could instead improve the effectiveness assessment of AEC measures and their capacity to deliver environmental benefits.
Whether AEC measures can efficiently enhance farmland biodiversity and ES delivery is still debated and the results of studies have been mixed [
5,
6,
7,
8,
9,
10,
11,
12,
13]. An EU-wide impact assessment of AEC is not yet available due to the differences among studies in terms of measure-design, site factors, and methodological issues [
14]. However, recent studies highlight the link between ES and AEC measures [
15,
16], suggesting that compromise strategies combining biodiversity and ecosystem service schemes may be the best solution for future AEC initiatives [
17], especially when operating at landscape scale [
18,
19]. While many examples exist of
ex-post assessment of AEC measure effects (e.g., [
20,
21,
22]), an ES-based approach has rarely been used for developing the measures and then defining funding. The present study represents a first attempt by the Management Authority of Trentino Province, responsible for the next Rural Programming period, to take ES into account in the economic justification for AEC payments.
When assessing the potential uptake of AEC measures, farmers’ behavior and motivations play a central role in terms of overall measure uptake and therefore policy success [
23]. The extensive literature referring to these issues, both in Italy [
24,
25] and other European countries [
26,
27,
28,
29,
30,
31,
32,
33,
34,
35], stresses the importance of a positive attitude towards nature conservation by farmers as one motivation for participation in AEC measures [
36]. With reference to Trentino Region, reference [
37] highlights that in the recent past farmers perceived voluntary agri-environment schemes as a key policy instrument to support their activity. Despite this they felt requirements in order to receive the payments were too demanding, mainly due to the commitment for a minimum period of at least five years and related costs.
Given the environmental importance of grasslands in Trentino, permanent meadows on livestock farms have been selected as an agri-environmental scheme. Previous studies [
38] explored which ES could be referred to meadows in the specific Trentino context, by looking at both management features and different ES (
i.e., not just provisioning ones). The integrated analysis aims to verify the existence of a link between ES deriving from sustainable farm management (where “sustainable” means a more extensive management that can maintain biodiversity, soil fertility and the traditional landscape) and the different level of payments provided for the next programming period. An approach based on ES is developed, where production and ecological processes of livestock farming systems are modelled according to different scenarios using resources available through the ARtificial Intelligence for Ecosystem Services (ARIES) platform. The results are then compared with those obtained from an economic analysis of the national Farm Accountancy Data Network (FADN) database, which permits calculation of the additional costs and income waived due to changing livestock management practices. This methodology can be considered as “evidence” of whether a practice is sustainable or not and would help stakeholders and policymakers to include ES in designing future environmental policies.
The AEC economic justification for payments performed using the FADN database should demonstrate that there is a relationship between farming practices and returns. Since there should be no direct relationship between more expensive sub-measures and greater environmental benefits, further analysis is required. The use of the ARIES platform helps to quantify the ES related to different meadow management practices and the expected environmental impact under different scenarios.
The integration of economic and environmental aspects in the payment justification can highlight the importance of maintaining specific ecosystems, giving prominence to their strategic role in biodiversity conservation, the value of which does not emerge from economic analysis alone. For instance: biodiversity is negatively affected by landscape homogenization due to agricultural intensification or abandonment [
39] and positively affected by the use of low-input, heterogeneous and restored pasture-based livestock systems [
40]. As regards aesthetic preferences, some studies [
41] concluded that environmental appreciation would be greater in grazed areas, because they sustain significantly higher plant species richness. Multifunctional grasslands deliver not only greater aesthetic value but also more diverse ES flows [
42].
The paper is organized as follows:
Section 2 provides a short description of livestock farming in Trentino and its structural changes deriving on the one hand from the adoption of more intensive farming practices and, on the other, from an increase in more sustainable livestock management especially in those areas where the most intensive practices are implemented. In order to encourage these practices, very important for the related ecosystem services, the next Rural Development Programme includes a specific operation within the framework of Measure 10 (AEC measures) providing payments for the sustainable management of permanent meadows, on the basis of the type of grassland and animal density.
Section 3 describes the methodology used to evaluate the level of payments for the adoption of the specific AEC commitments. The structure of the Sustainable Fodder Production ARIES model is described (
Section 3.1) and populated with data (
Section 3.2) in order to quantify the ES and their range related to livestock farming; the FADN database (2008–2012), used to calculate the additional costs and income waived due to the environmental commitments deriving from the sustainable management of permanent grassland, is presented and its data sources described (
Section 3.3).
Results are reported in
Section 4: the model outputs are described (
Section 4.1) and then integrated by the economic results of the FADN analysis (
Section 4.2). Changes in farm management practices may involve changes in productivity and, as a consequence, in the farm gross margins. Results are then discussed and conclusions drawn with reference to the most relevant outcomes from the study.
2. Livestock Farming Systems in Trentino: An Overview
The Autonomous Province of Trento covers an area of 6207 km
2, classified as mountainous by the National Institute of Statistics (ISTAT). Its topography is variable, with a minimum altitude of 67 m a.s.l. (Lake Garda) and a maximum of 3796 m a.s.l. (Cevedale mountains). More than 70% of the territory is located above 1000 m a.s.l. Only 2.5% is considered as urban (city of Trento, 723 inhabitants/km
2), while 97.5% is classified as rural with development problems (68 inhabitants/km
2). According to the 6th National Agricultural Census returns [
43], the Utilized Agricultural Area (UAA) in Trentino amounts to 137,220 hectares: 2.6% of this consists of arable lands, 16.6% of permanent crops, and 81.0% of permanent meadows and pastures. Livestock farming is a very important sector both for the socio-economic impacts on mountainous and rural areas and the delivery of important ES of public interest. In particular, the use of local forage and highland pastures helps to preserve the landscape from reforestation, maintaining open areas and contributing to the maintenance of biodiversity [
44]. Beyond their environmental importance, these services are linked with tourism in the area and the socio-economic development of rural communities. Within this framework, a key issue is the maintenance of profitable farms, capable of adapting their structure to environmental constraints and obtaining positive economic returns. In the last decades, the traditional dairy farming system has sought to achieve returns comparable with other sectors through an increase of herd size and cows’ milk yield, as well as by making investments [
45]. These changes have led to the abandoning of marginal areas and the intensification of farming in the most suitable valleys with rich soils and high fodder production. In both cases, there are important consequences in environmental terms that require good management of permanent meadows and pastures. In the marginal areas, the meadows rich in species, with low productivity but high ecological importance, are vulnerable to these changes. On the other hand, the consequence of intensification is the risk of soil erosion and a simplification of the floral composition of grasslands.
Dairy cattle rearing is the main component of the livestock sector in Trentino: out of a total of 1403 cattle farms recorded in the last Agricultural Census of 2010, about 1071 were dairy farms, while there were 580 sheep and goat rearing farms. There were 54,927 total Livestock Units (LSU). According to the data of the Statistical Service of Trento Province, the Gross Saleable Production (GSP) of the livestock sector was about 127.5 million euro (16.1% of total agricultural GSP in the Province) in 2011: 51.7% of this came from milk and 13.7% from meat. Between 2000 and 2011 the total GSP value of the livestock sector increased by 27.4%.
As previously mentioned the sector has undergone major reorganization to tackle the general crisis due to price slumps, increased foreign competition, farm management costs, and other structural problems related to farmland fragmentation. These changes are summarized in
Table 1 which compares the results of two Agricultural Censuses (2000 and 2010) [
43,
46], highlighting the decrease in number of livestock farms (−53.8%) and increase in number of animals (+11.8%). As concerns cattle rearing, the decrease in number of farms (−19.4%) has not been followed by a decrease in number of animals (+0.8%) with a resulting increase in herd size (from 26 to 32 animals per farm).
Table 1.
Trends in livestock rearing in Trentino 2000–2010.
Table 1.
Trends in livestock rearing in Trentino 2000–2010.
| | Farms | Animals | Animals/Farm | ∆ Farms | ∆ Animals |
|---|
| | 2000 | 2010 | 2000 | 2010 | 2000 | 2010 | 2000–2010 (%) | 2000–2010 (%) |
| Livestock | 4848 | 2236 | 73,268 | 81,926 | 15 | 37 | −53.8 | 11.8 |
| Cattle | 1741 | 1403 | 45,147 | 46,158 | 26 | 32 | −19.4 | 0.8 |
| Sheep and goats | 899 | 580 | 26,105 | 33,166 | 29 | 57 | −34.5 | 27.0 |
| Others | 592 | 880 | 2016 | 3251 | 3 | 4 | 48.4 | 61.3 |
The cattle rearing sector in Trentino is characterized by different farm management models. Many farms follow the typical production model of mountainous areas,
i.e., small or medium-small and strictly linked to the local production of feed (mowing and grazing on high land during summer). There are also cattle farms in the valleys, with large herds and which can be considered intensive. About 58.8% of livestock farms and 11.5% of animals are included in the smallest class (1–20 animals), with six animals per farm on average. The medium-small class accounts for 21.0% of farms and 20.9% of animals (32 per farm on average) while the medium-large class covers 13.5% of farms and 28.0% of animals (67 per farm on average). Finally only 7% of farms and 39.5% of animals are included in the largest class, with less than 194 animals per farm on average. In general the average size in the whole territory corresponds to 32 head of cattle per farm (
Table 2).
Table 2.
Structure of cattle rearing in Trentino: Number of animals and farms per size class.
Table 2.
Structure of cattle rearing in Trentino: Number of animals and farms per size class.
| | Small | Medium-Small | Medium-Large | Large | |
|---|
| | 1–20 | 20–50 | 50–100 | 100+ | Total |
|---|
| Animals (n.) | 5236 | 9526 | 12,749 | 17,998 | 45,509 |
| Farms | 825 | 295 | 190 | 93 | 1403 |
| Animals/farm | 6 | 32 | 67 | 194 | 32 |
The most important cattle breeds are Bruna (35%) and Frisona (38%). Others—such as Rendena, Pezzata rossa, Grigia alpina—are less significant percentagewise but play a very important role in mountainous areas, especially in those where the relationships between livestock activities and biodiversity are more conflictual. Their importance is also economic, related to the increasing demand for typical products.
Unlike other agricultural sectors, the cattle rearing sector registers an increase in young farmers. On 21% of cattle farms the farmer is younger than 40 years of age (about 7% of farmers in the province are less than 35 years old); 60% are aged between 41 and 65 years.
As previously stated, an important environmental issue in Trentino is the intensification of livestock farming in some areas and the marginalization of other less productive ones. In both cases the good management of permanent meadows and pasture is crucial to maintain the environment and avoid a loss of biodiversity. In general, the management strategy followed by the local administration is to protect the high nature value areas (in terms of biodiversity) and promote sustainable farming activities in terms of number of animals per hectare. This strategy will be continued in the future by means of a specific intervention in the Rural Development Programme 2014–2020. More specifically, Art. 28 of Reg. (EU) 1305/2013 “Agri-enviroment-climate” (Measure 10) provides for support to preserve and promote the necessary changes to agricultural practices that make a positive contribution to the environment and climate.
The Rural Development Programme of Trento Province contains a specific operation (10.1.1) aimed at the differentiation of payment levels depending on the type of grassland (species rich meadows, sloping meadows, and valley floor meadows) and on the livestock farming system (in terms of animal density: extensive, intermediate, and intensive rearing systems). The combination between different kinds of grassland and animal density determines the type of farm management and, as a consequence, different economic returns and operation costs.
3. Methodology
The growing interest in the study of ES [
47,
48,
49] has stimulated an increasing demand for “tools” to identify, quantify, and assess them in order to facilitate and support policy and management decision-making. The spatially variable nature of ES in terms of generation and flow has led to the use of GIS systems to map and model them for planning purposes (e.g., [
50,
51]), to facilitate the creation of datasets for the evaluation of benefits transfer (e.g., [
52]) and to compute values derived from biophysical and economic models (e.g., [
53,
54,
55]). As a result, a wide range of tools and applications, with different promoters, aims, and contents, have been developed and are currently being used and tested. ARIES is a digital modelling platform in use since 2010 that aims to quantify ES in order to understand the dynamic complexity and its consequences [
56]. ARIES has the advantage of keeping models sufficiently simple and thus tractable, general and scalable to varying levels of detail and data availability. The structure of models developed with ARIES is not defined
a priori (as is the case for other tools, such as InVEST), it is rather a modelling platform that, while providing
ad hoc probabilistic Bayesian models [
57], allows the integration of existing ecological process models as well as the adaptation to local contexts. The system allows assessment and evaluation exercises to be performed by mapping the potential provision of ES (sources), their users (use), and biophysical features that can deplete service flows (sinks). Users can adapt the system according to their needs and specific knowledge by choosing appropriate variables, algorithms, scale, and input data. Furthermore ARIES follows the open source software paradigm that relies on extensible, distributed data and model repositories made available as online services by the ARIES team and other independent research groups. Users commit to sharing data, thus contributing to the growth of the system over time [
58]. Given the innovative nature of the tool, a relatively limited number of studies have so far been published [
59] and, with just a few exceptions (e.g., the pilot assessment of ES in the Tecchio and Mergola watersheds, in Molise), none of them refer to Italian case studies.
For the purposes of this paper the ARIES platform has been used to set up and run a probabilistic livestock model (the Sustainable Fodder Production model) fed with local-specific datasets, with the aim of identifying and mapping sustainably managed meadows potentially eligible for AEC payments. More specifically, we compared model outputs from a baseline scenario (
i.e., current state of meadows) and from a scenario defined on the basis of thresholds imposed through Operation 10.1.1 concerning meadows management in the next Rural Programming period. The model is presented in
Section 4.1 and
Section 4.2. For a better understanding of the model it is useful to describe the main constraints and limiting factors that have been addressed as well as the different steps undertaken during the development process. Given the limited number of published case studies implementing the ARIES platform, the methodological aspects and considerations reported in this paper could be of use to other scientists and practitioners.
3.1. Structure and Description of the Sustainable Fodder Production Model
When framing the probabilistic livestock model we addressed two main theoretical issues, i.e., (i) the identification of ES related to livestock activities; and (ii) the relationship between provisioning ES and human activities.
Concerning the first issue, the goal of livestock activities is animal/food production (i.e., milk and meat): the identification of related ES is not straightforward so we need to understand which ES to refer to. Animals involve many variables, such as livestock units, fodder crops, and grazing areas. It is important to distinguish between meadows used to produce fodder crops and pastures used to graze livestock: they cannot be considered within the same classification item because they serve different purposes. Meadows are intended for the production of fodder crops in large quantities and of good quality: the balance between quantities and quality depends on the sustainability of management practices. The management target for pastures is the good (healthy) state of grass, its maintenance where the initial conditions are good and its improvement where these are poor. We decided to focus on meadows and to model Sustainable Fodder Production because this is the main target for AEC payments, specifically of Operation 10.1.1 within the RDP.
Concerning the second theoretical issue, animal/food production is commonly classified as a provisioning ES [
47,
60,
61]. As for most provisioning ES, it is neither possible nor desirable to separate the natural ecosystem components from human activities. This also applies to this case study: livestock systems in Trentino have a long history of co-evolution with human activities. Meadows and pastures can be considered as man-made habitats and, as a consequence, as an agro-ecosystem delivering ES that depend on the kind of management implemented.
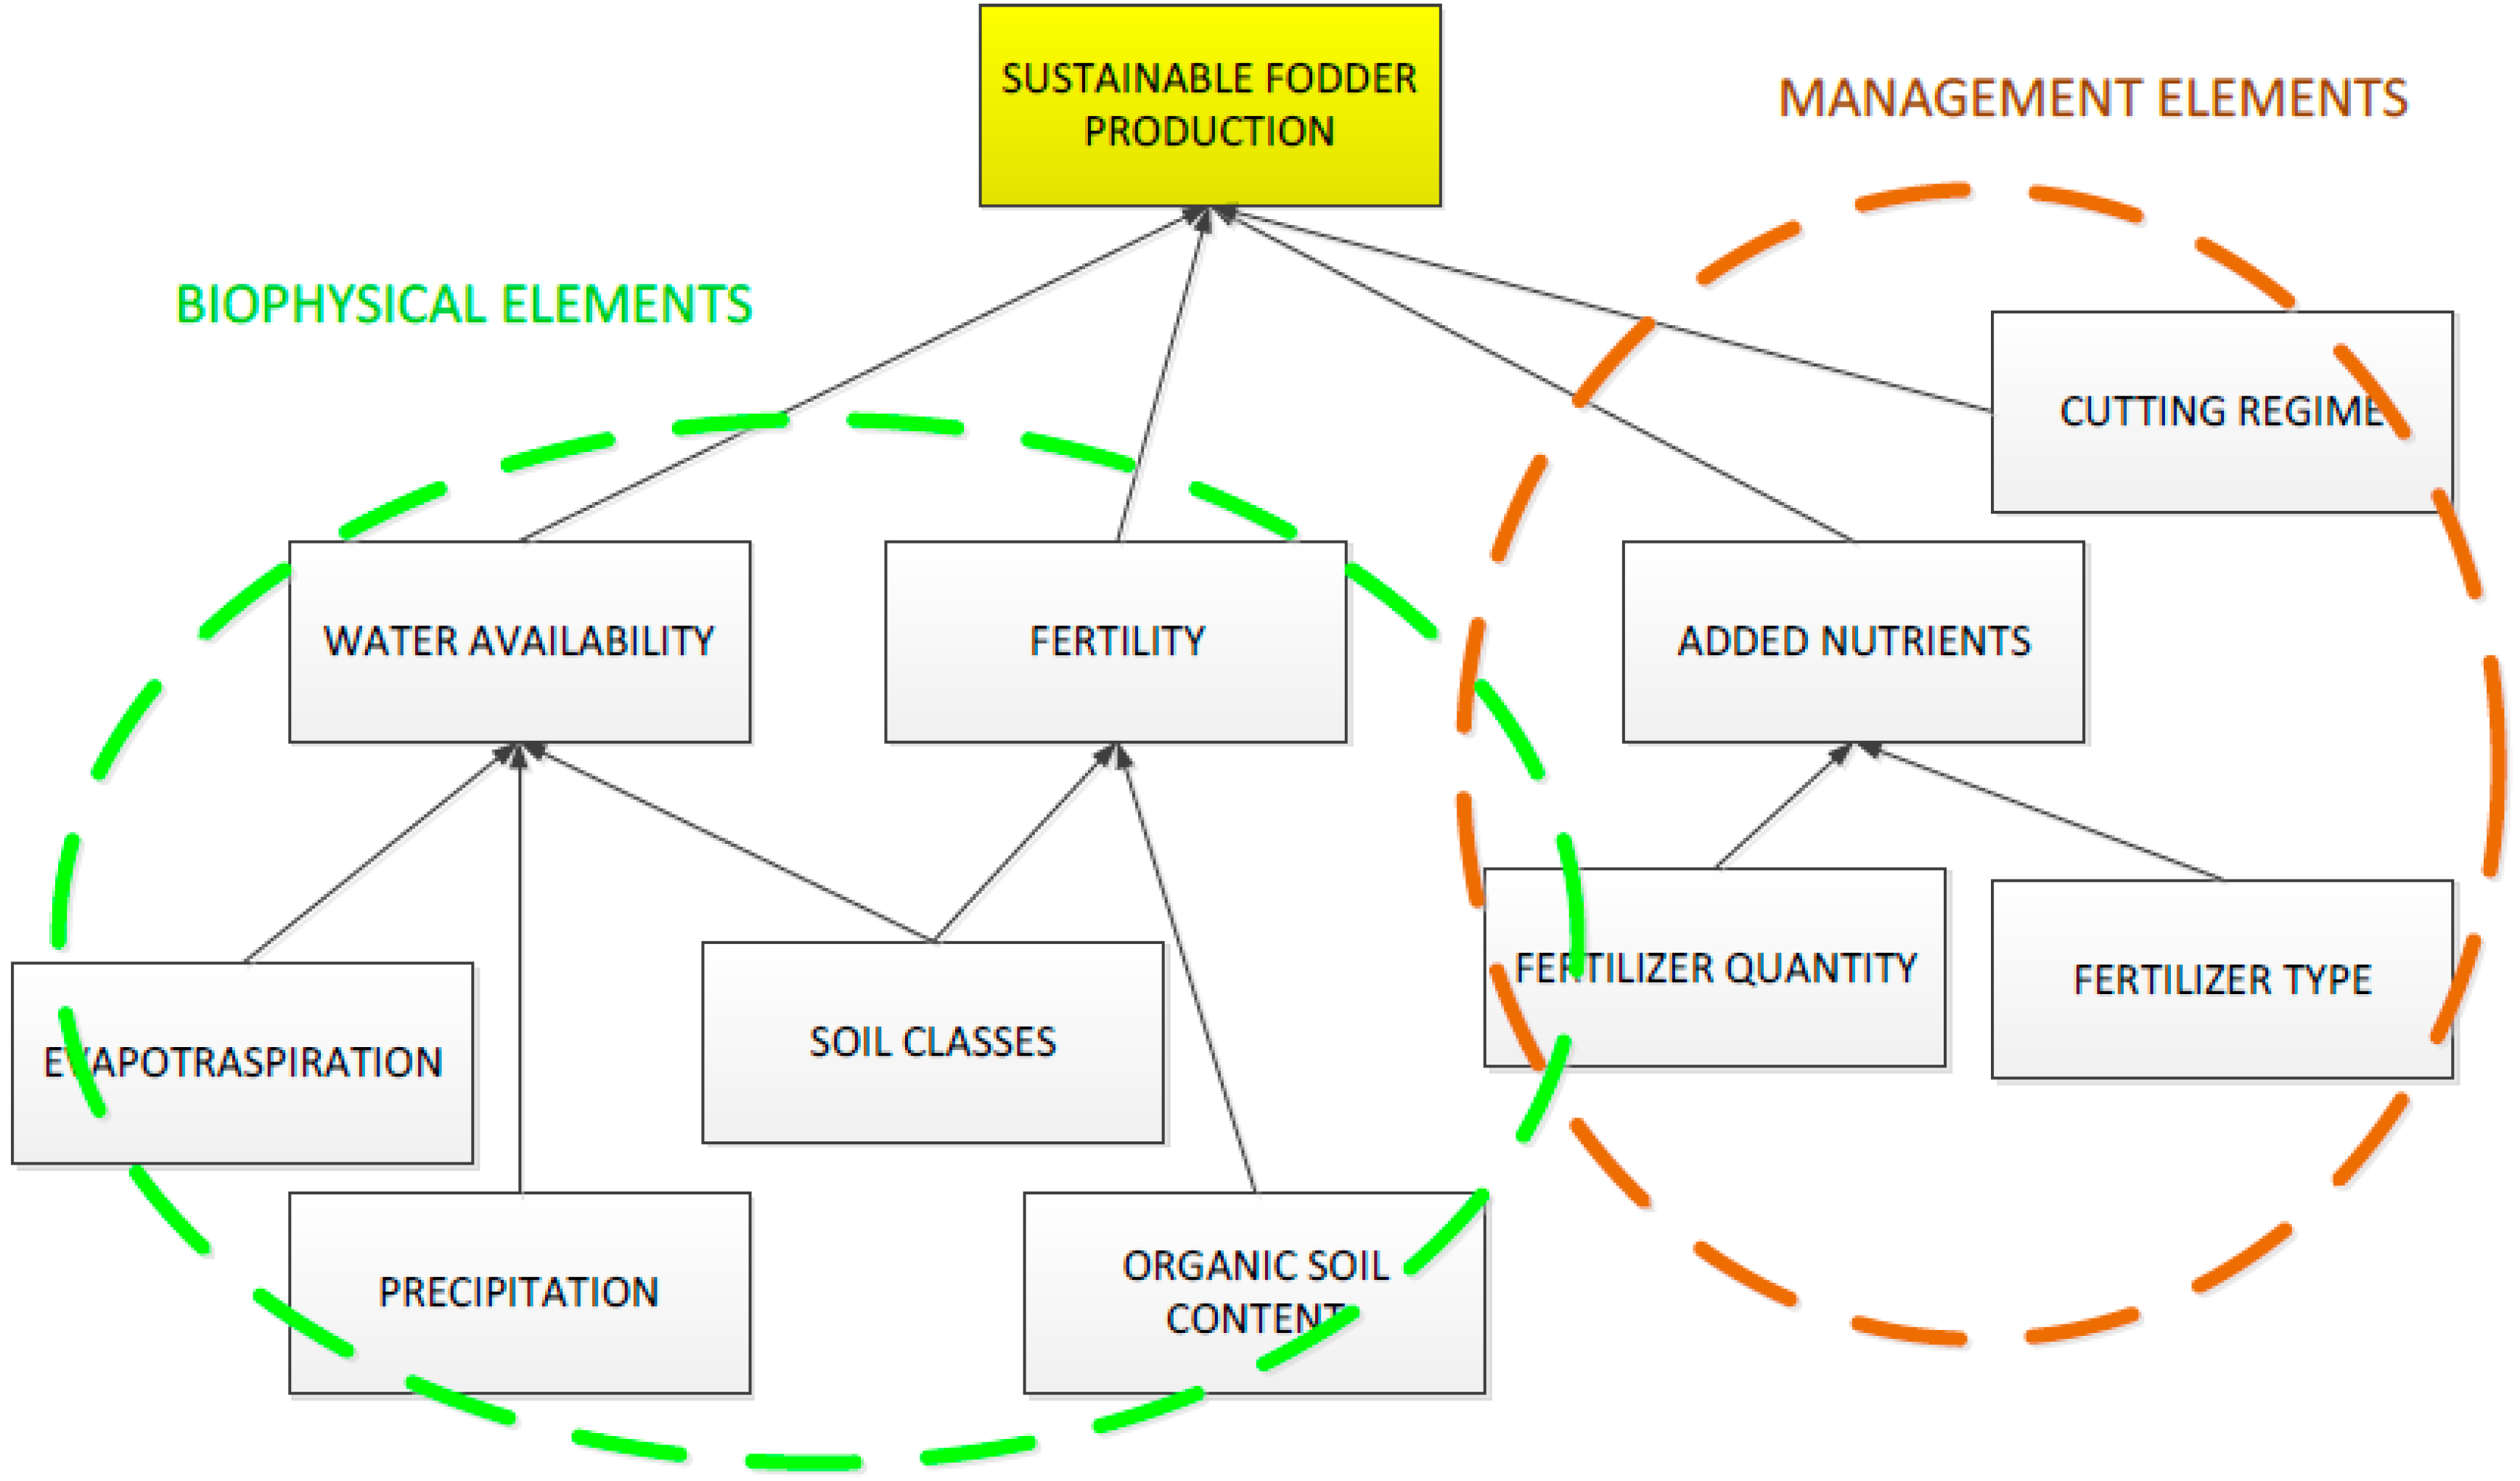
The model described in this paper includes two components: Biophysical elements and management practices. The model initially proposed includes:
Biophysical elements: Water availability (precipitation, evapotranspiration and soil classes) and soil fertility (classes and organic content);
Management practices: Added nutrients (quantity and type of nitrogen input) and cutting regimes (frequency and times).
This first theoretical hypothesis on the meadow model is shown in
Figure 1.
At this stage there are three practical issues to be addressed.
The first concerns the need to simplify the model in order to apply, implement, and refine the procedure. For this purpose reference is made to already available data and information. In particular, a very detailed botanical classification of meadow types, with a comprehensive description of each type as to terrain morphology, climatic conditions, geological and biological features, and management practices is already available for the entire Trento Province [
62].
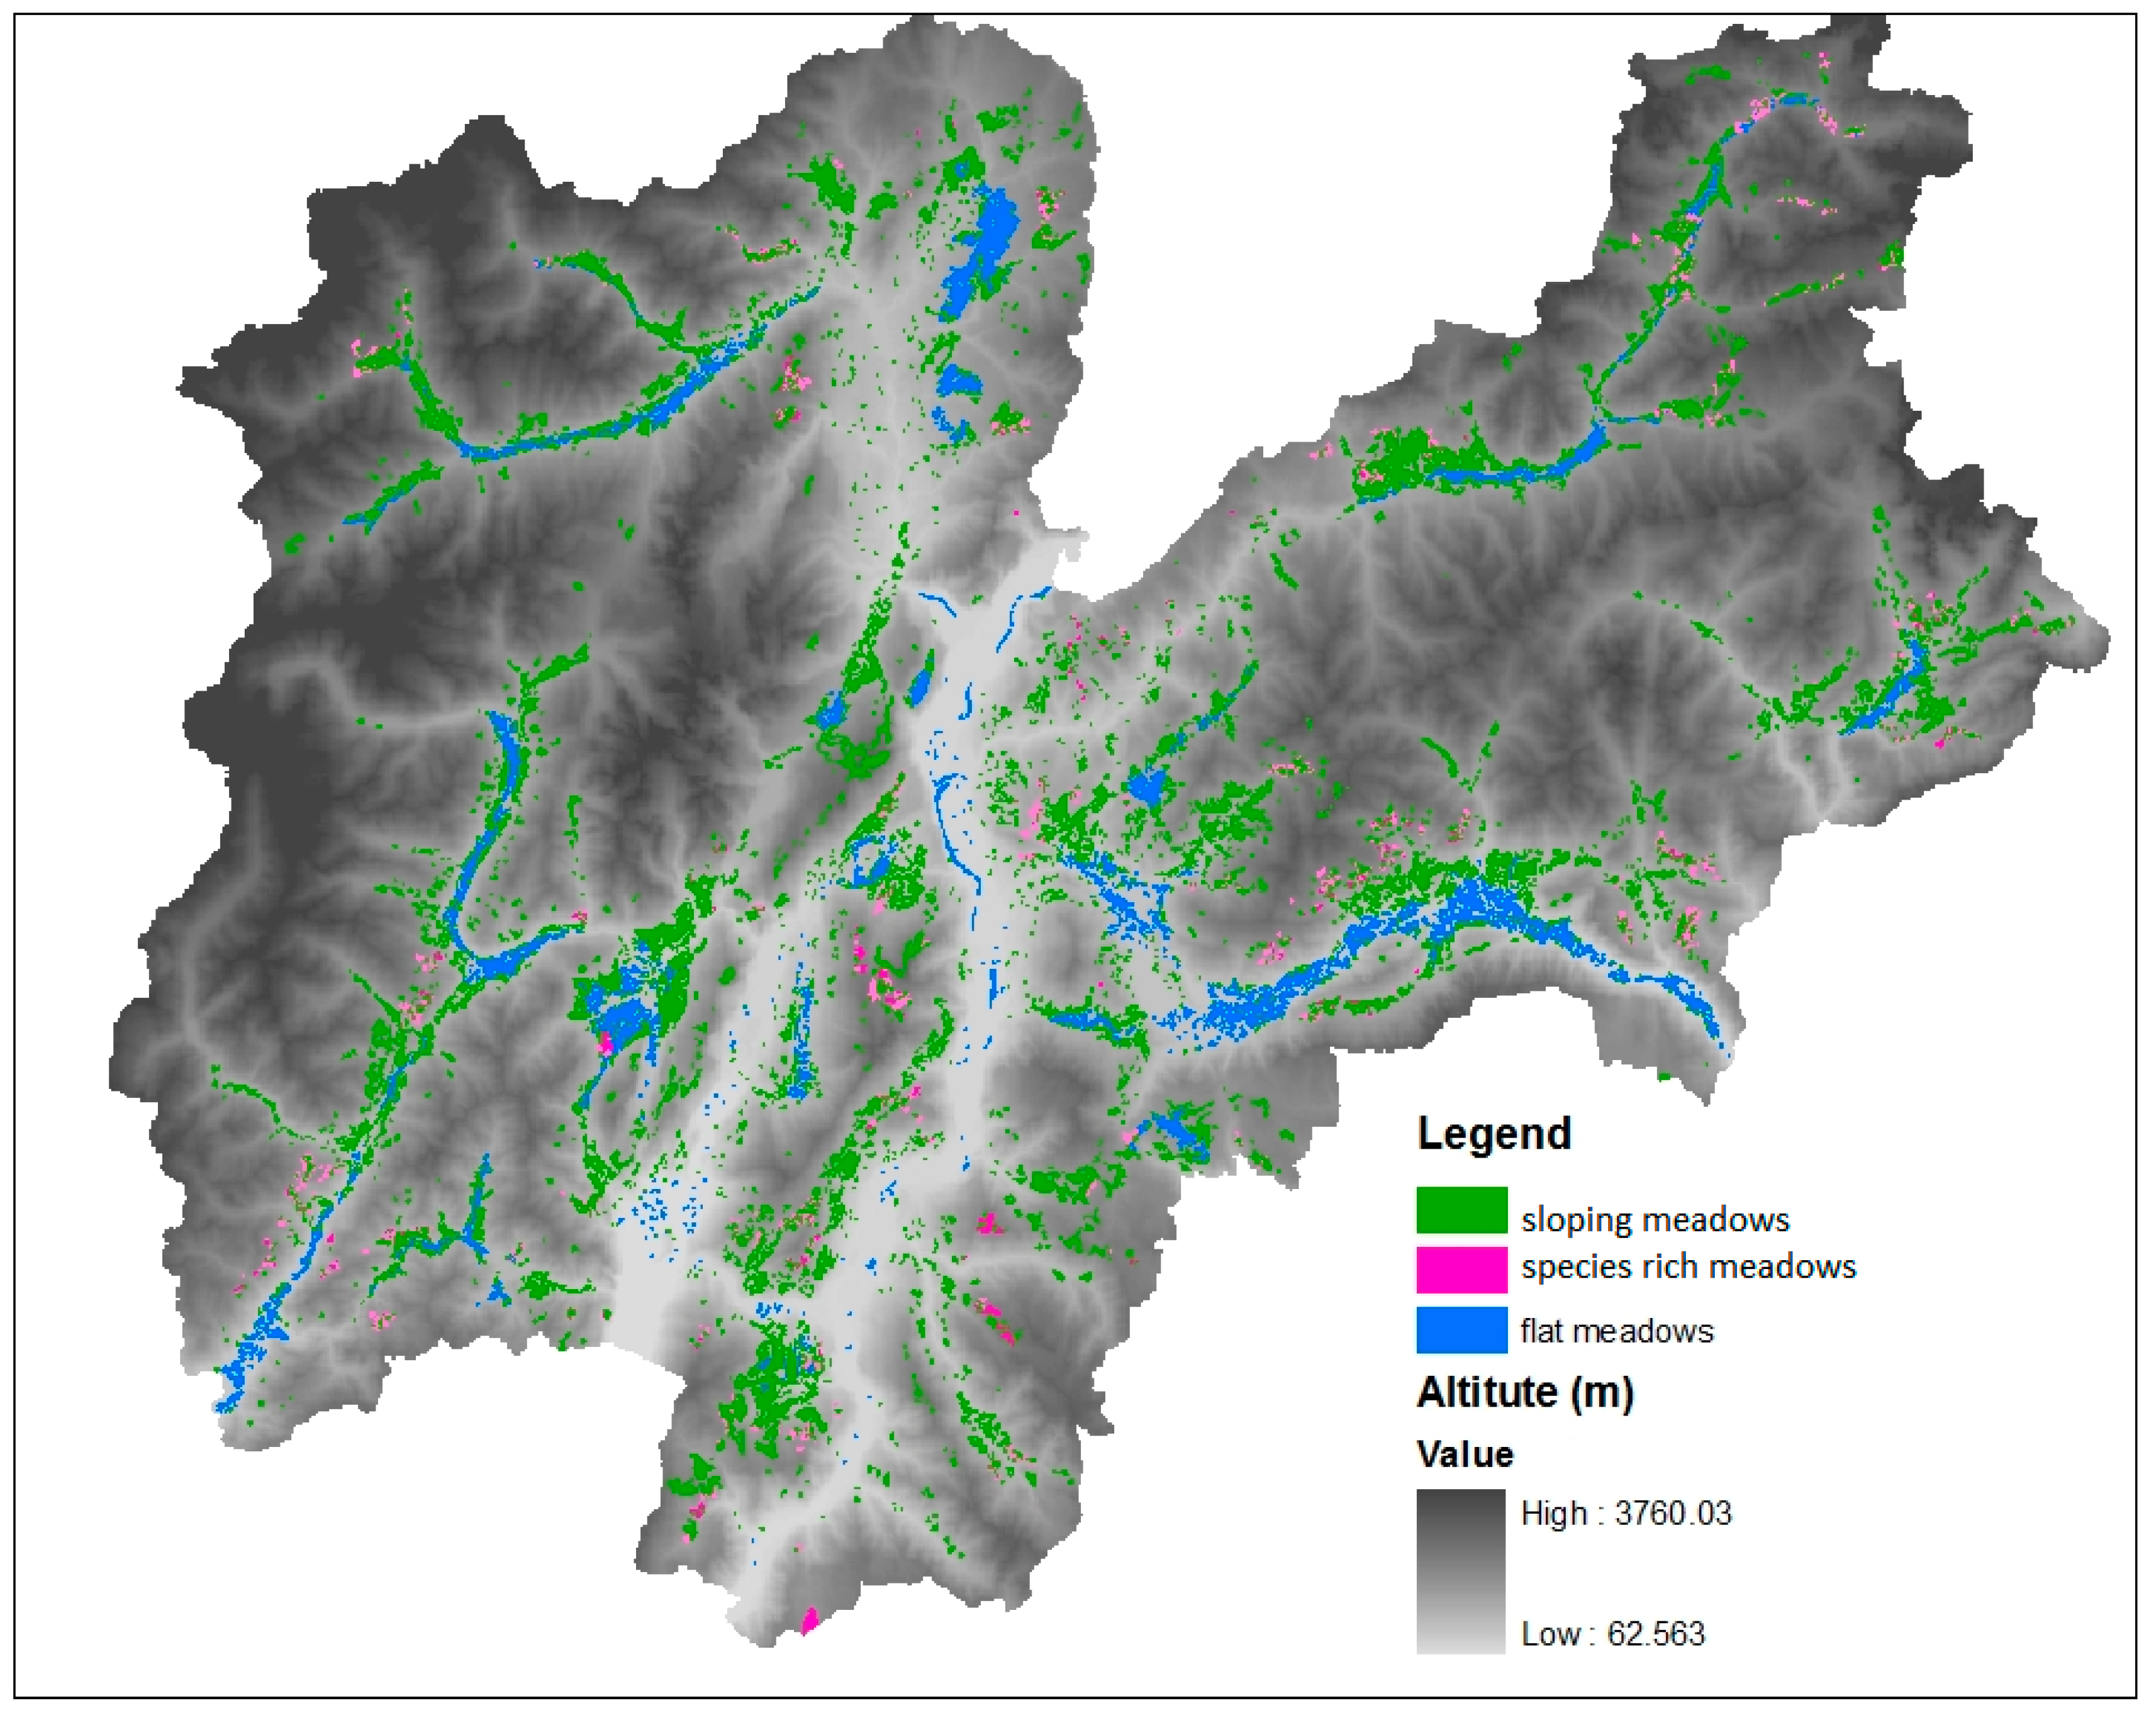
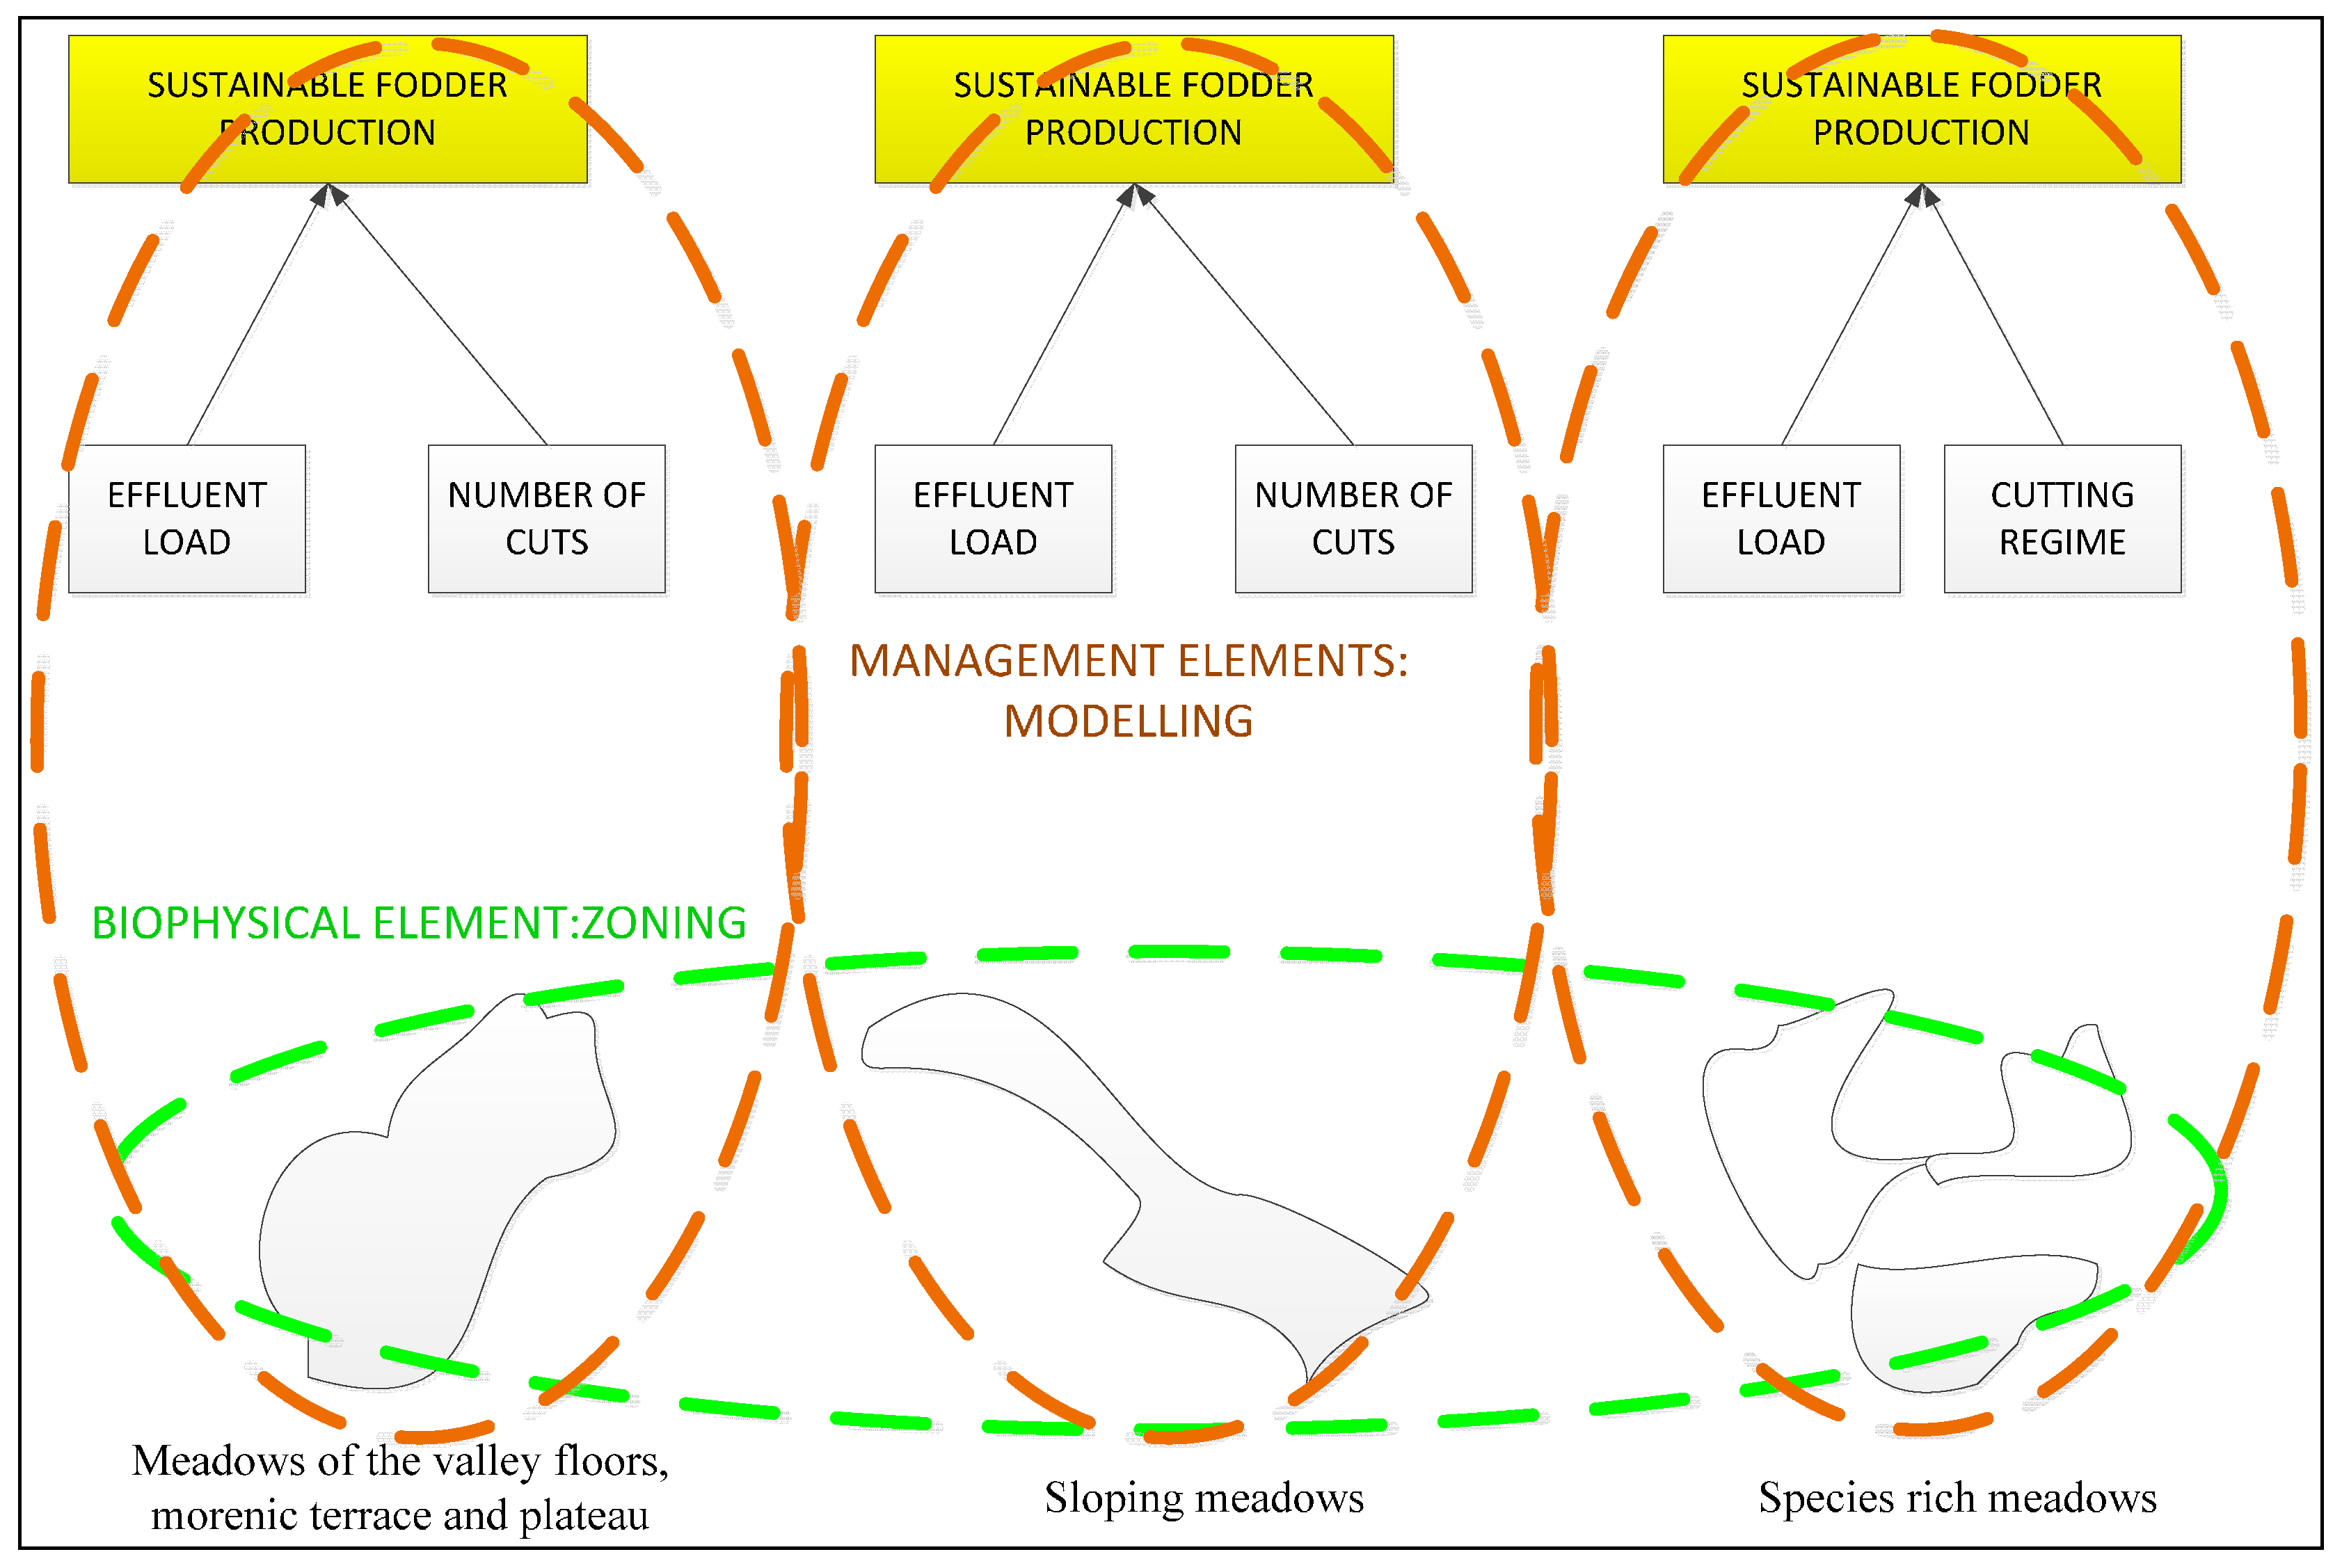
Following the zoning procedure described in [
38], the Province has been divided into three geographic macro-zones, corresponding to three main meadow categories described in
Figure 2:
The zoning procedure replaces the whole biophysical component of the model. The rationale behind this is to include meadows in a specific macro-zone with precise biophysical conditions in terms of soil, water, altitude, biodiversity,
etc. We can now differentiate actual and desirable management practices according to each zone. On the one hand this new formulation simplifies the model; on the other it leads to a static enclosure of biophysical components. This could be a problem if the biophysical variables were the object of projected changes that have to be checked and assessed, but this should not be the case: no change in the RDP framework should affect any of the biophysical variables included in the model shown in
Figure 1.
The second practical issue concerns data availability: due to budget constraints the model will include only data that are already available or collected on a regular basis for other purposes. The Province cannot be burdened with additional costs and in any case available datasets contain good quality data, with the only exception being quantities and types of fertilizers used.
Figure 1.
Theoretical hypothesis on the meadow model.
Figure 1.
Theoretical hypothesis on the meadow model.
Figure 2.
Distribution of meadow categories in Trentino.
Figure 2.
Distribution of meadow categories in Trentino.
The third practical issue refers to the RDP Regulation, which explicitly requires that each variable relevant for the measure has to be verifiable and controllable. This regards the management. In particular, meadow nitrogen inputs (quantity and type) are difficult to control in the whole area. As a consequence, a proxy is used for nitrogen inputs. Referring to the existing literature [
63], the LSU (Livestock Unit) is used as a proxy for the effluent produced and thus approximates nitrogen inputs.
Considering the simplifications adopted, the initial model (
Figure 1) changes, thus evolving into the one shown in
Figure 3.
Figure 3.
Meadow model (hypothesis corrected).
Figure 3.
Meadow model (hypothesis corrected).
3.2. Data Input in the Sustainable Fodder Production Model
A detailed study undertaken in Trentino [
62] classifies the main meadow types (
Table 3). The added nutrient allowed is expressed as kg·ha
−1·yr
−1, production is expressed as Mg·ha
−1·yr
−1, the proxy LSU/ha is calculated considering as standard, a cow of 0.64 tonnes generating 95 kg of N·yr
−1 [
63].
Following the baseline conditions of AEC payments, animal density has to range between 0.5–4 LS/ha. Specific thresholds are established and differentiated according to the type of meadow as eligibility conditions in terms of LSU/ha. Finally, with regard to commitments, a cutting regime is imposed on the beneficiaries of AEC payments and is differentiated according to the type of meadow.
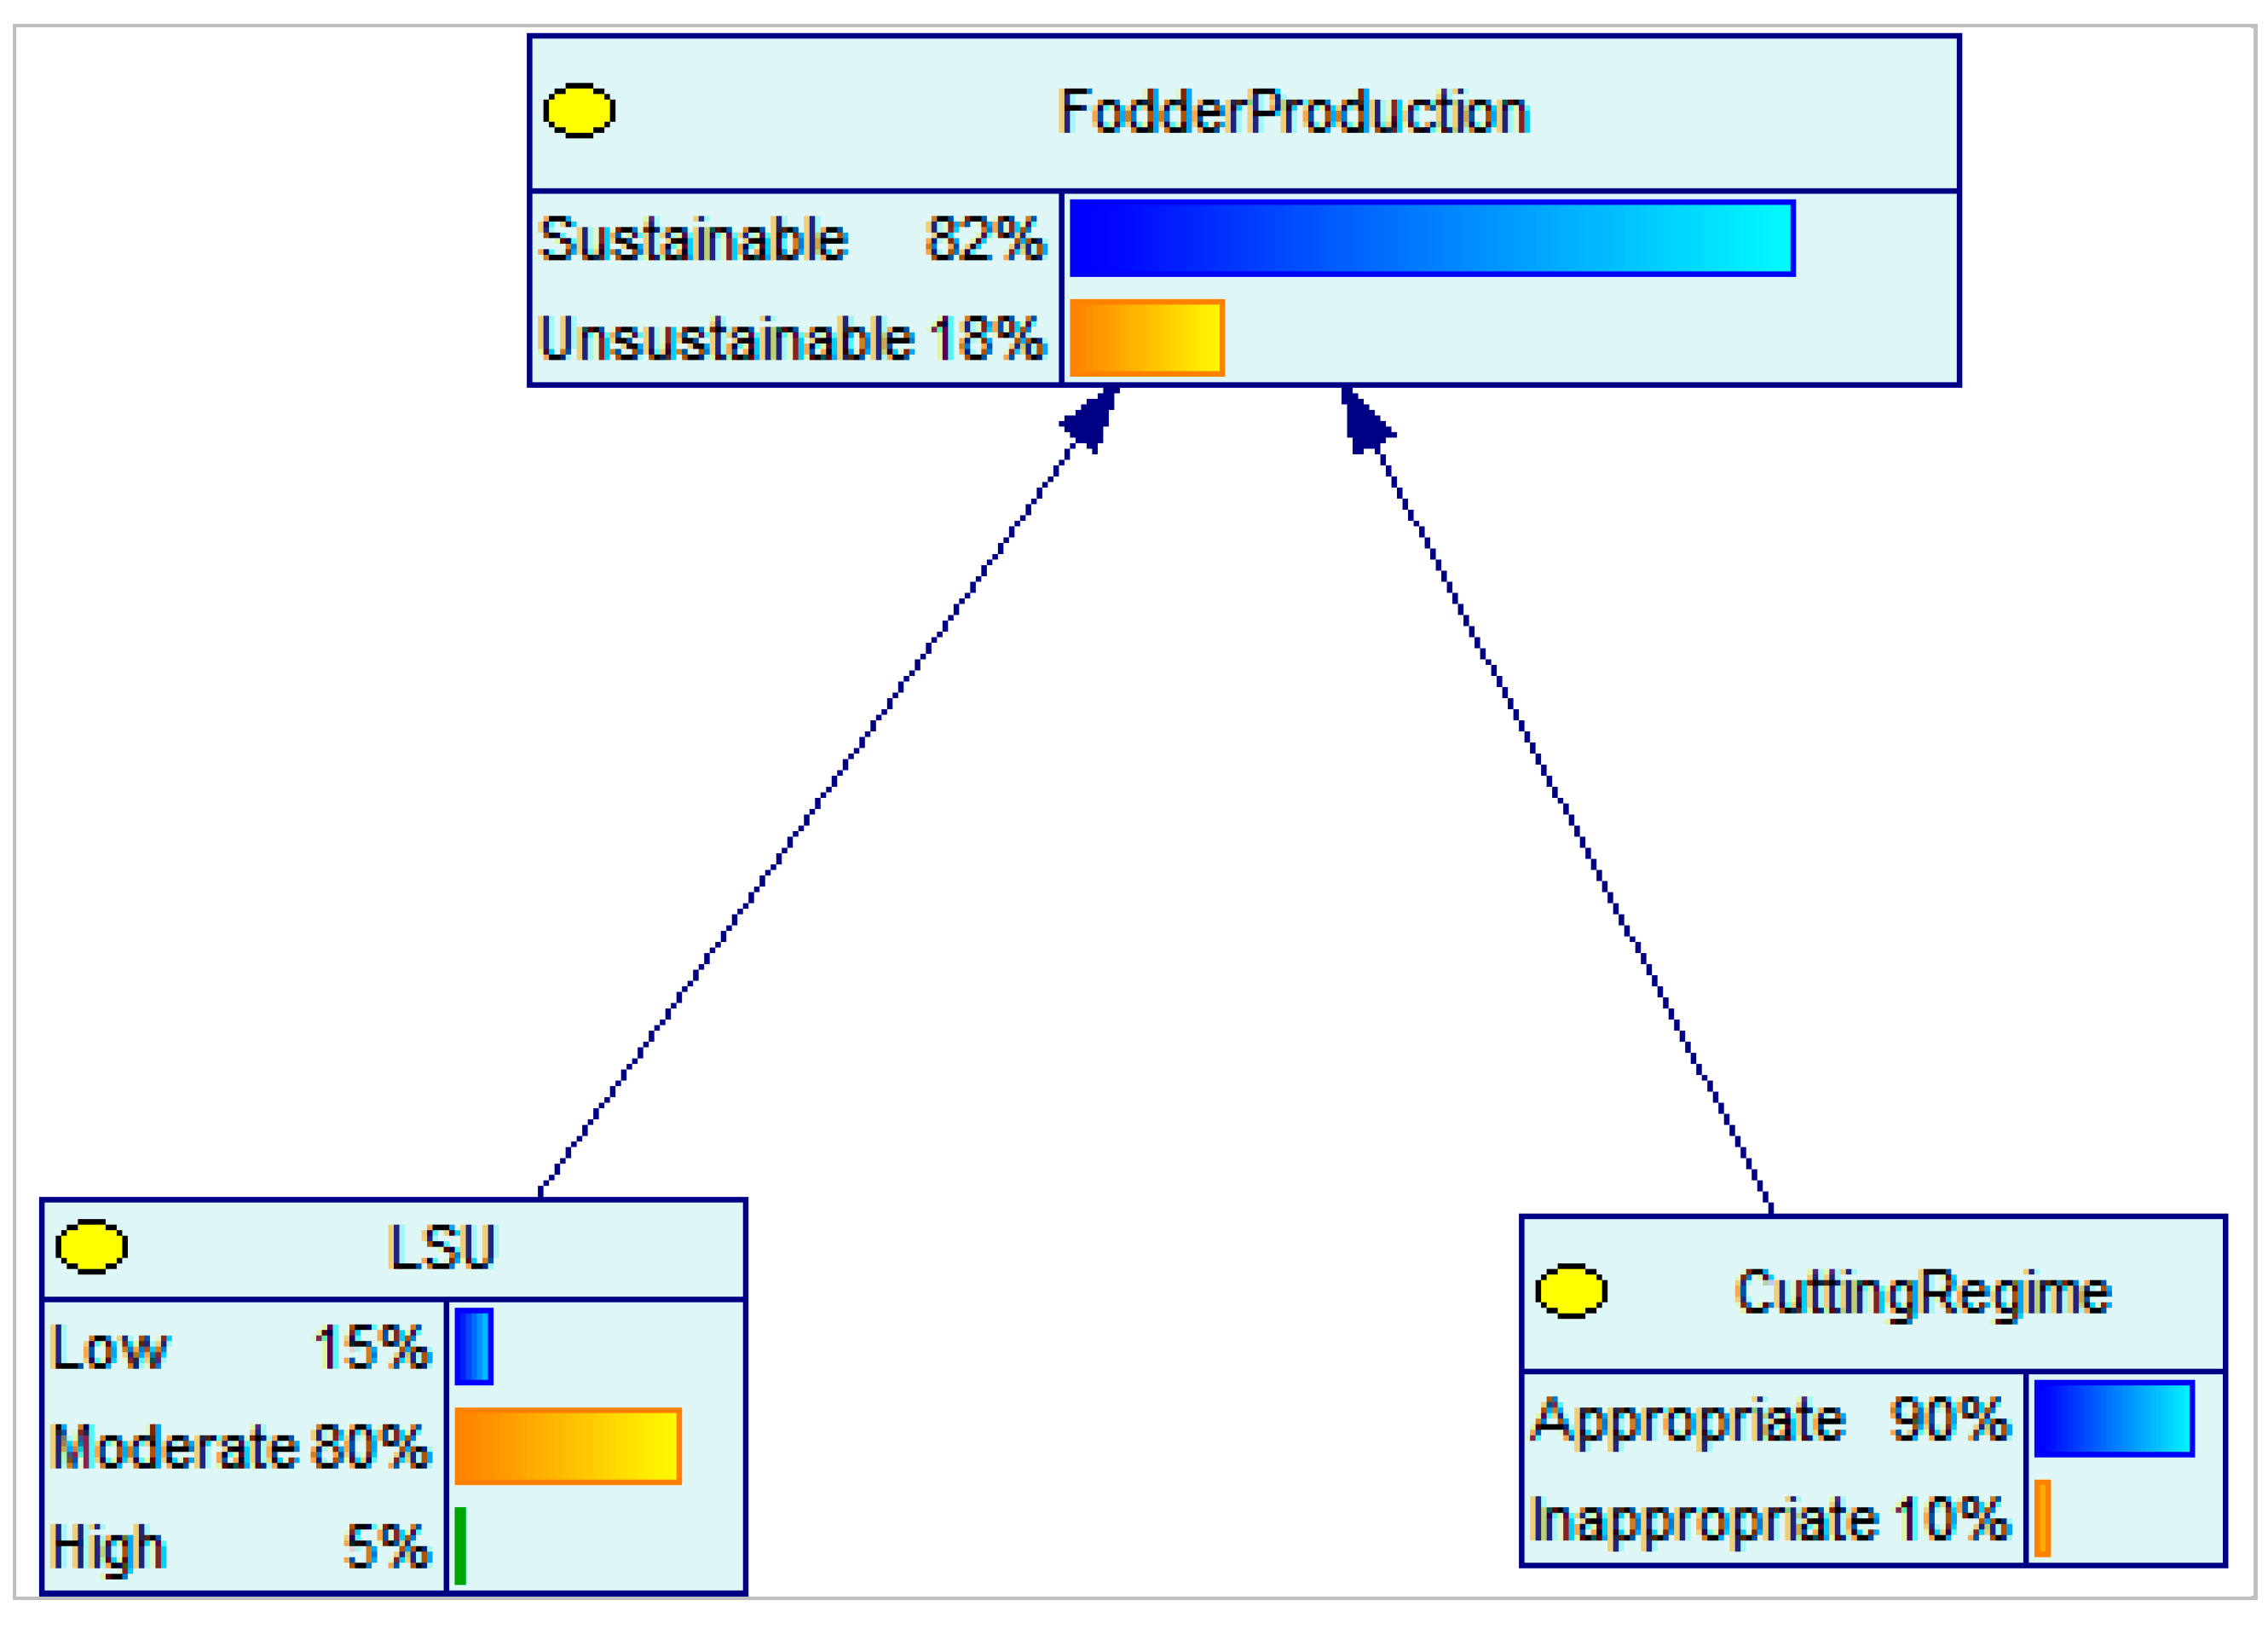
The biophysical justification in terms of environmental benefits is provided through the Sustainable Fodder Production model that has its scientific basis in the work of [
62] and its framework in the probabilistic model shown in
Figure 4. With reference to the latter, Bayesian Networks are built for the management elements: effluent load, and cutting regime. Different reference values are established for these variables according to macro-zones, as listed in
Table 4.
Table 3.
Types of meadows, main features. (LSU = Livestock Units).
Table 3.
Types of meadows, main features. (LSU = Livestock Units).
| | Added Nutrient Allowed | Number of Cuts | Production | Fodder Quality | Zoning Class | Proxy LSU/ha |
|---|
| Bromion erecti | <25 | 1 | 4.5–5.0 | low | species rich | 0.26 |
| Arrhenathrion elatioris | 25–50 | 2 | 5.8–6.2 | low | species rich | 0.53 |
| Festuca rubra | 0–50 | 1 or 2 | 4.5–5.0 | low-medium | species rich | 0.53 |
| Centaureo transalpinae | 0–50 | 1 | 4.4–4.8 | low-medium | sloping | 0.53 |
| Centaureo carniolicae | 75–100 | 2 | 5.8–6.4 | medium | sloping | 1.05 |
| Anthoxantho | 50–75 | 2 | 6.0–6.5 | low | sloping | 0.79 |
| Arrhenatheretum elatioris | 100–150 | 2 or 3 | 7.6–8.0 | high | sloping | 1.58 |
| Arrhenatheretum el. facies | 225–275 | 3 or 4 | 7.5– 8.4 | high | valley floor | 2.89 |
| Ranunculo repentis | 200–225 | 2 or 3 | 7.0–7.4 | high | valley floor | 2.37 |
| Lolietum multiflorae | 200–250 | 3 | 9.2–9.6 | high | valley floor | 2.63 |
| Agropyron repens | 200–275 | 2 or 3 | 8.0–9.0 | high | valley floor | 2.89 |
Figure 4.
Sustainable Fodder Production model.
Figure 4.
Sustainable Fodder Production model.
Table 4.
Management elements of the model: variables set in the Agri-Environment-Climate (AEC) Measure.
Table 4.
Management elements of the model: variables set in the Agri-Environment-Climate (AEC) Measure.
| | LSU/ha | Cutting Frequency |
|---|
| Species rich meadows | 1.5 | 1 |
| Sloping meadows | 2.0 | 2 |
| Valley floor meadows | 2.5 | 3 |
The Conditional Probability Tables of the Bayesian Networks built for Sustainable Fodder Production are presented in
Table 5 and
Table 6.
“Correct density” for effluent load and “Enough” for cutting regime refer to the outcomes of the study undertaken by [
62] as ideal situation, a summary of which is provided in
Table 3. These values are identified as follows:
LSU/ha: the correct density should range between 1.7 and 2.5 for flat meadows, between 0.53 and 1.7 for sloping meadows, and between 0.3 and 0.7 for species rich meadows;
Cutting regime: frequent enough corresponds to two or three cuts for both flat and sloping meadows, and at least one cut for species rich meadows.
Table 5.
Conditional probability table for effluent load and cutting regime.
Table 5.
Conditional probability table for effluent load and cutting regime.
| Effluent Load |
|---|
| High density | 0.05 |
| Correct density | 0.80 |
| Low Density | 0.15 |
| Cutting regime |
| Enough | 0.80 |
| Not enough | 0.20 |
Table 6.
Conditional probability table for sustainable fodder production.
Table 6.
Conditional probability table for sustainable fodder production.
| Effluent Load | High Density | Correct Density | Low Density |
|---|
| Cutting regime | Enough | Not enough | Enough | Not enough | Enough | Not enough |
| Sustainable production | 0.3 | 0.1 | 0.9 | 0.5 | 0.7 | 0.3 |
| Not sustainable production | 0.8 | 0.9 | 0.1 | 0.5 | 0.3 | 0.7 |
The scenario hypotheses applied to the meadow model affect the cutting regime and effluent load. The scenario compares current practices with the sustainable practices that represent eligibility conditions (LSU/ha) and the commitment (cutting regime) for the AEC payments. The final aim is to check whether the sustainable production of meadows improves as a consequence of the new “rules” imposed through AEC, having as a reference for sustainability the limits advised by the experts who made an accurate survey and analysis of the territory (
Table 3).
3.3. The Economic Analysis of Livestock Farming System
The results of the probabilistic model developed through ARIES platform have been integrated with the economic results at farm level with the aim of calculating the additional costs and income waived due to the environmental commitments deriving from the sustainable management of permanent meadows in livestock farming. The micro-economic results of livestock activities in Trentino are estimated using the Italian FADN database named RICA (Rete di Informazione Contabile Agricola). FADN is an important source of micro-economic information for evaluating the income of agricultural holdings and the impacts of agricultural and rural development policies. Its legal basis was established in 1965 and updated over time. All EU Member States collect accountancy data from a sample of their agricultural holdings every year and follow the same bookkeeping principles. In Italy data are collected using GAIA (Gestione Aziendale delle Imprese Agricole), a software developed since 2008. GAIA collects different variables: physical and structural (location, crop areas, livestock numbers, labor force, etc.) as well as economic and financial data (value of production, sales, purchases, costs, subsidies, etc.).
One of the characteristics of the Italian survey system is the integration of agricultural holdings and territorial databases (georeferencing) and the allocation of costs in farm production processes. The allocation of costs is one of the main issues in accounting procedures because it permits the calculation of the gross margins for crops and livestock. More specifically, for each production process, RICA indicates revenues, yields, variable costs, gross margin (resulting from the difference between costs and revenues), LSU and UAA.
All the data are available in a single database, organized in different tables. The table of livestock production processes has been used, analyzing costs and revenues of dairy production and calculating the variation of some important economic indicators depending on animal density and meadow management. In particular, to highlight how the different kinds of meadows can influence the economic results of dairy farms, the RICA database has been crossed with the zoning list containing the different meadow types on every farm.
Only specialized cattle rearing systems with permanent meadows and pastures are considered in the analysis. The animal density refers to three thresholds:
Extensive breeding systems: less than 1.5 LSU per hectare of UAA
Intermediate breeding systems: between 1.5 and 2.5 LSU per hectare of UAA
Intensive breeding systems: more than 2.5 LSU per hectare of UAA.
The value of 2.5 LSU/ha separates extensive and intensive management.
As concerns meadow management characteristics, the meadow classification used in the Sustainable Fodder Production model has been applied in the RICA analysis: species rich, sloping and flat. To explain the influence of management activities on the farm economic results, the variables have been calculated referring to two different classes depending on the meadow area percentage of the total land area at farm scale:
In total, 225 cases/farms have been selected for the 2008–2012 period.
4. Results
The following section presents the outputs of the Sustainable Fodder Production model and the economic analysis performed through the Italian FADN integrated with the biophysical assessment.
4.1. Application of the Sustainable Fodder Production Model
The Sustainable Fodder Production model has been applied to a sample of 673 farms, corresponding to 90% of cattle farms in the Province. These farms received 85% of AEC payments in the past (since 2000). Total meadow area on these farms corresponds to about 67% of the meadow area in the Province.
The Sustainable Fodder Production model is firstly run on the baseline situation data for each type of meadow. The baseline is then compared with the results obtained running the model on the basis of LSU/ha and number of cuts imposed by Operation 10.1.1 of the RDP (
Table 4).
Table 7 summarizes the sustainability thresholds considered for effluent load (
i.e., the proxy LSU/ha) and cutting regime (
i.e., number of cuts), while
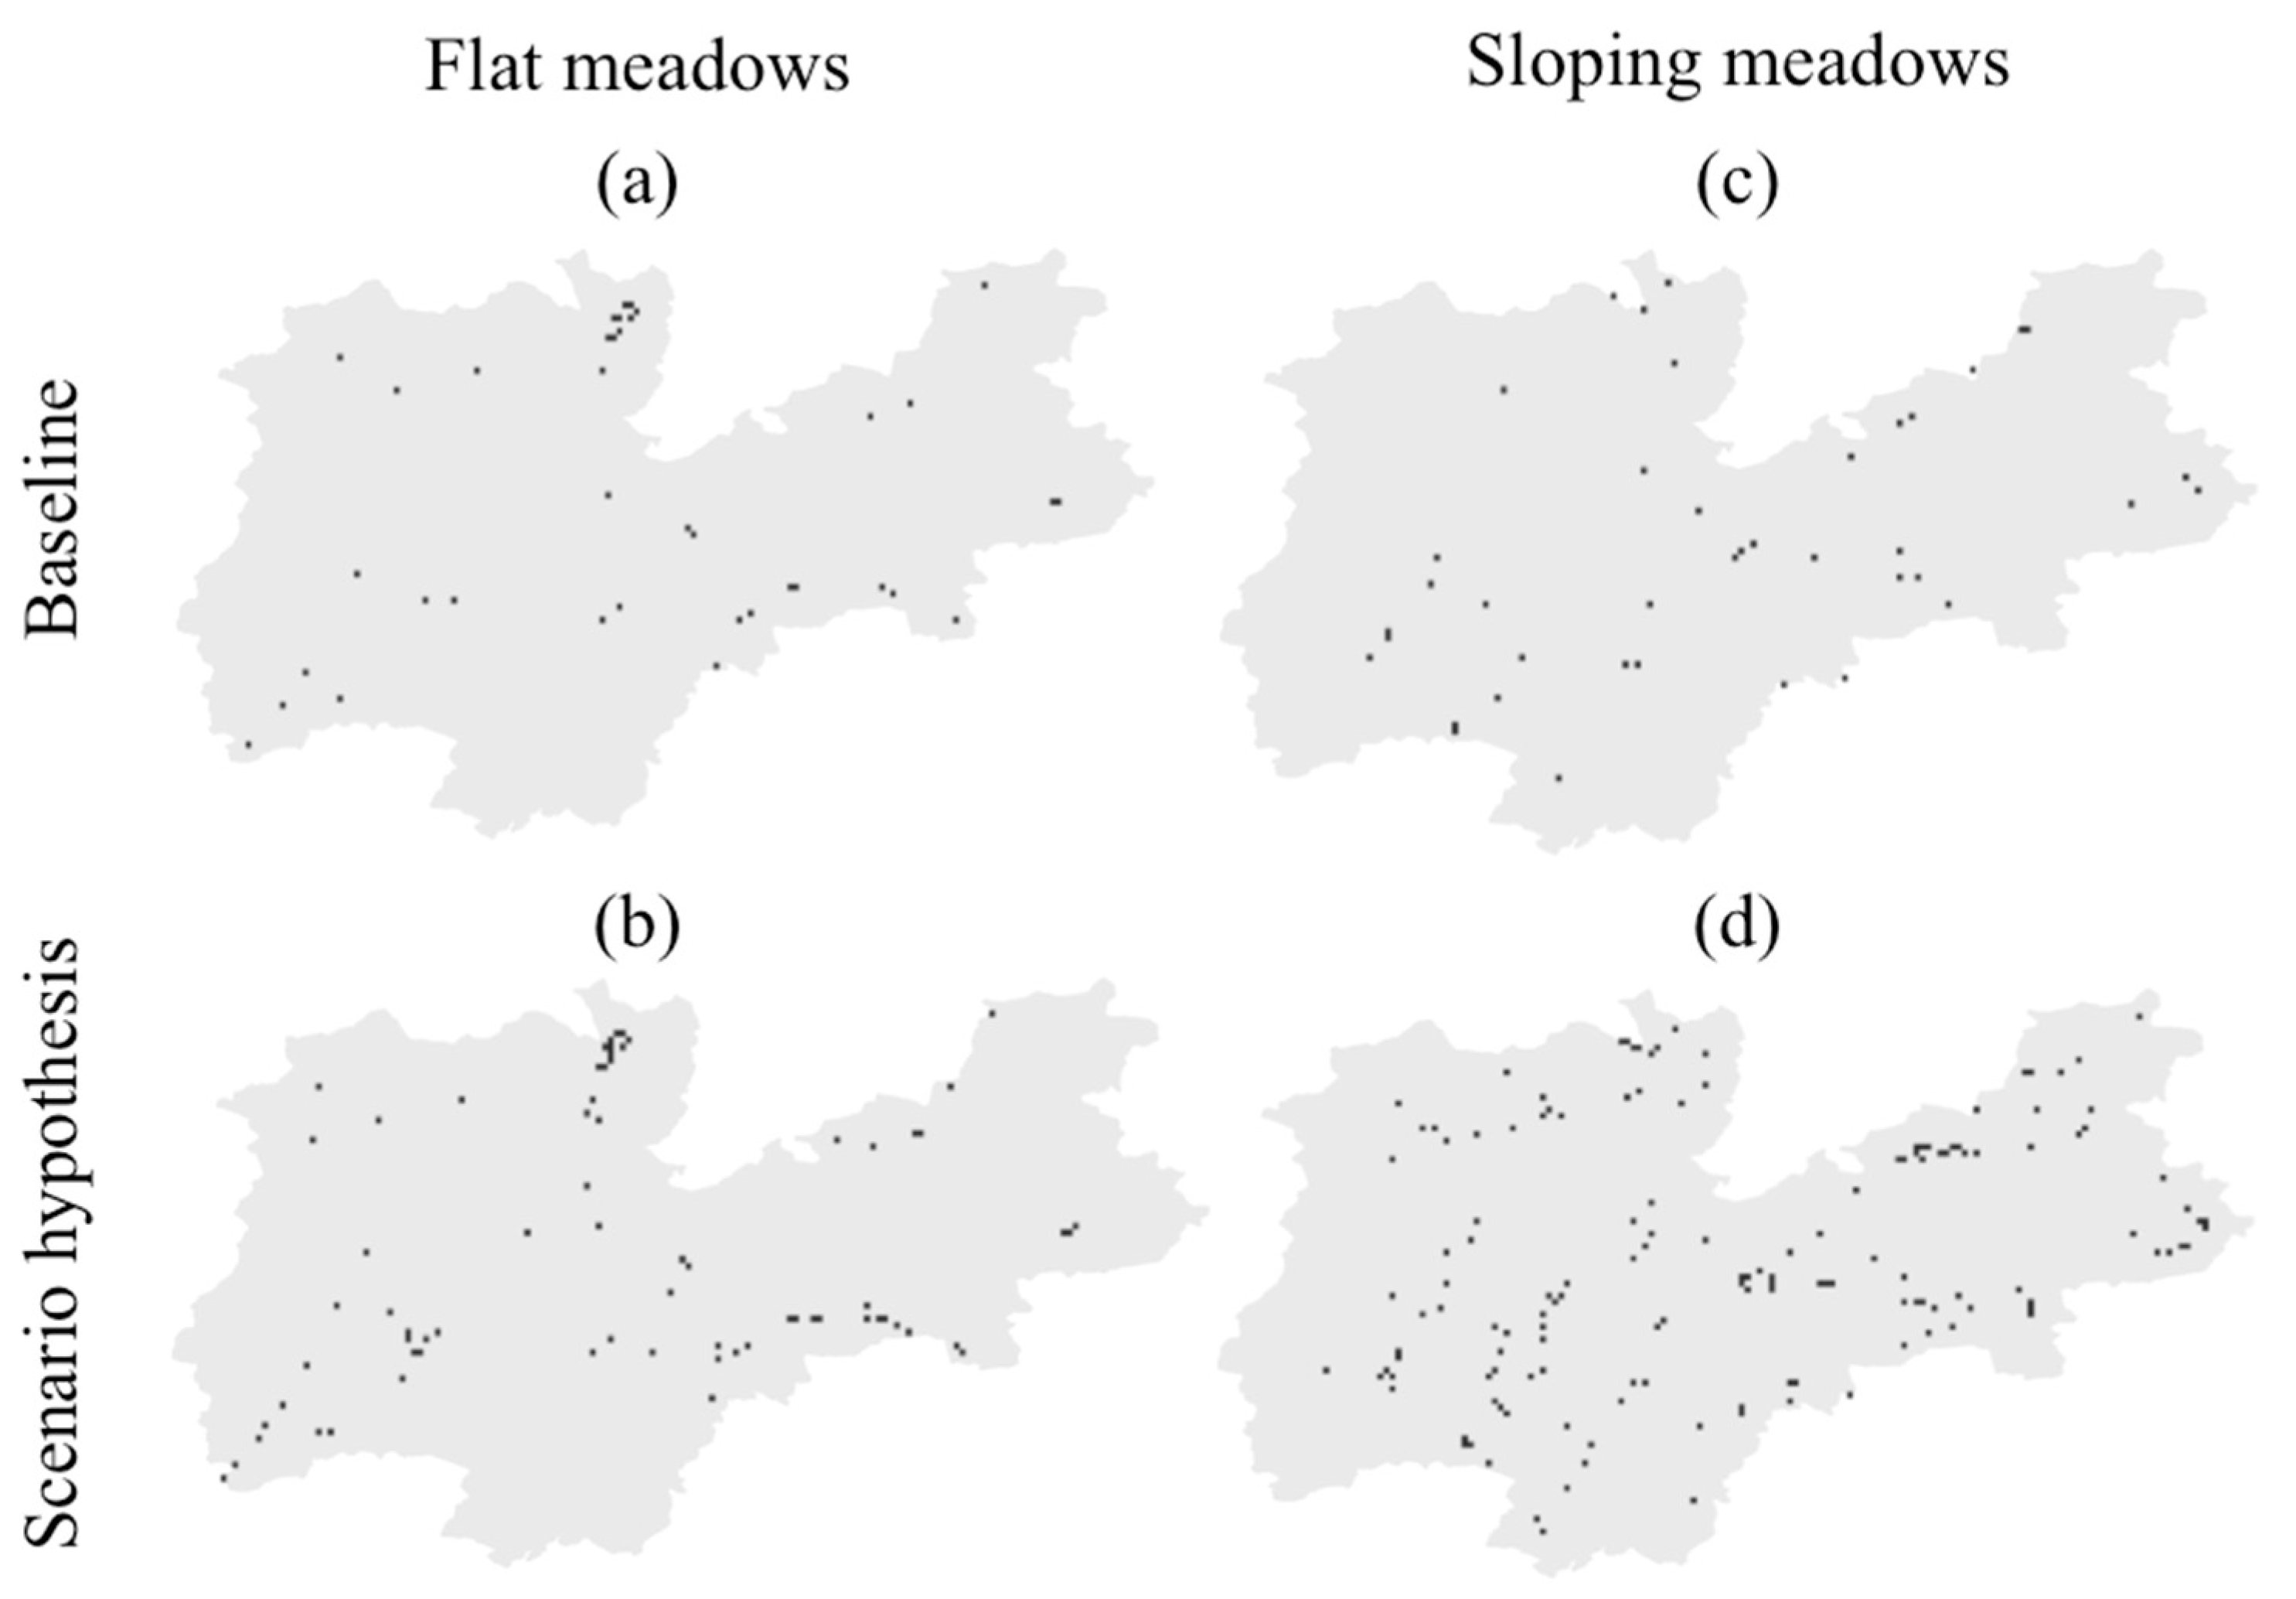
Figure 5 highlights the outputs of the ThinkLab runs for flat (left column) and sloping meadows (right column): dark areas correspond to meadows that are sustainably managed under baseline conditions (first row) and scenario hypothesis (second row).
Table 7.
Sustainability thresholds imposed in the Sustainable Fodder Production model.
Table 7.
Sustainability thresholds imposed in the Sustainable Fodder Production model.
| | Flat Meadows | Sloping Meadows | Species Rich Meadows |
|---|
| Effluent load (LSU/ha) | Low if <1.7, | Low if <0.5, | Low if <0.3, |
| Moderate if 1.7 to 2.5, | Moderate if 0.5 to 1.7, | Moderate if 0.3 to 0.7, |
| High if >2.5 | High if >1.7 | High if >0.7 |
| Cutting regime (n. cuts) | 3 | 2 | 1 |
Figure 5.
Outputs of ThinkLab runs for flat ((a) Baseline; (b) Scenario hypothesis) and sloping meadows ((c) Baseline; (d) Scenario hypothesis).
Figure 5.
Outputs of ThinkLab runs for flat ((a) Baseline; (b) Scenario hypothesis) and sloping meadows ((c) Baseline; (d) Scenario hypothesis).
For the flat meadows, the scenario hypothesis (
Figure 5b) leads to an 86% improvement in terms of sustainably managed area compared to the baseline situation (
Figure 5a). About 1502 ha are currently managed sustainably: after running the scenario hypothesis this area increases to 2807 ha. This is due to the cutting regime being respected for all flat meadows and the fact that the limit imposed by the AEC operation for effluent load (2.5 LSU/ha) lies within the sustainability threshold.
For sloping meadows, the scenario hypothesis (
Figure 5d) leads to a huge improvement compared to the baseline situation (
Figure 5c). Currently the area managed sustainably covers 1582 ha, while after running the scenario hypothesis it reaches 5812 ha. Once more this is due to the respect of the cutting regime for all sloping meadows, while the limit imposed by the AEC operation for effluent load (2.0 LSU/ha) is only slightly higher than the sustainability threshold (1.7 LSU/ha). As a consequence, there are not many with a LSU/ha value between 1.7 and 2.0 LSU/ha. Furthermore, we must consider that the majority of meadows are sloping (sloping count: 99,315, flat count: 55,823, species rich count: 15,329) so a reduction of the mean load per hectare over 27% of all sloping meadows implies a shift to sustainable management on almost 27,420.
For the species rich meadows the scenario does not generate any relevant change. Although the cutting regime becomes sustainable, the AEC limit on effluent load (1.5 LSU/ha) is well above the sustainable threshold (0.7 LSU/ha): there are too many meadows showing values between 0.7 and 1.5 LSU/ha. In order to obtain significant changes in terms of sustainability the upper limit should be considerably lowered. However, since the LSU/ha is calculated as farm average and a single farm can contain meadows belonging to different types, it is important to act on lowering the pressure on species rich meadows: this will lower the effluent load of the farm on meadows as a whole.
In general terms the improvement expected from AEC application is evident and we need to consider how this can be integrated with the economic justification based on FADN.
4.2. Economic Analysis
Table 8 highlights the characteristics of different rearing systems in Trentino depending on the animal density, considered as a proxy for effluent load (N). The different classes coincide with the thresholds defined as eligibility criteria in Measure 10 (Operation 10.1.1). The sample selected from RICA includes 225 farms, 63% of which were beneficiaries of Rural Development payments in the last Rural Programming period.
Almost 42% of farms can be classified as extensive rearing systems (less than 1.5 LSU/ha) on large areas (71.4 hectares on average) with a very low animal density (0.8 LSU/ha). The intermediate rearing systems (1.5–2.5 LSU/ha) account for 34% of the total sample, with intensive ones 24% (animal density is high on average, 2.9 LSU/ha). Intermediate and intensive rearing systems have almost the same land area while the animal density differs: 1.9 and 2.9 LSU/UAA respectively.
Regarding economic results, on average the GSP/ha increases with rearing intensity. The same trend can be observed for the gross margin per hectare, the value of which is very low for extensive rearing systems (739 €/ha) and higher than the Province average for intensive rearing systems (3026 €/ha).
Table 8.
Characteristics of rearing systems in Trentino depending on animal density. UAA = Utilized Agricultural Area.
Table 8.
Characteristics of rearing systems in Trentino depending on animal density. UAA = Utilized Agricultural Area.
| | Number | GSP/UAA (€/ha) | Variable Costs/UAA (€/ha) | Gross Margin/UAA (€/ha) | Yield (q/LSU) | LSU/UAA (n./ha) | UAA (ha) |
|---|
| Extensive rearing systems (<1.5 LSU/ha) | 95 | 1592 | 1189 | 739 | 67 | 0.8 | 75.8 |
| Intermediate rearing systems (1.5–2.5 LSU/ha) | 76 | 3416 | 2704 | 1445 | 68 | 1.9 | 19.2 |
| Intensive rearing systems (>2.5 LSU/ha) | 54 | 5456 | 3623 | 3026 | 65 | 2.9 | 21.8 |
| Average | 225 | 3488 | 2505 | 1737 | 66 | 1.9 | 38.9 |
Table 9 highlights the variation of some farm structural characteristics depending on the extension of the different kinds of meadows taken into account: the first size class includes farms where a single meadow class represents 30%–60% of the total meadow extension (
i.e., the sum of the three types) while the second refers to more than 60% of total extension.
Farms with a high percentage of species rich meadows (>60% of their total meadow surface) have a lower animal density and a smaller size in terms of UAA than those with a lower percentage. They are also normally located above 1000 m, i.e., in the highest parts of mountain areas. On the contrary, there are farms with flat meadows: the lower the altitude and UAA, the higher the presence of this kind of meadow. In between there are the sloping meadows: also in this case animal density decreases where sloping meadows area increases.
Table 9.
Structural characteristics related to three kinds of meadows. GSP = Gross Saleable Production.
Table 9.
Structural characteristics related to three kinds of meadows. GSP = Gross Saleable Production.
| | Number | GSP/UAA (€/ha) | Variable Costs/UAA (€/ha) | Gross Margin/UAA (€/ha) | Yield (q/LSU) | LSU/UAA (n./ha) | UAA (ha) |
|---|
| Extensive rearing systems (<1.5 LSU/ha) | 95 | 1592 | 1189 | 739 | 67 | 0.8 | 75.8 |
| Intermediate rearing systems (1.5–2.5 LSU/ha) | 76 | 3416 | 2704 | 1445 | 68 | 1.9 | 19.2 |
| Intensive rearing systems (>2.5 LSU/ha) | 54 | 5456 | 3623 | 3026 | 65 | 2.9 | 21.8 |
| Average | 225 | 3488 | 2505 | 1737 | 66 | 1.9 | 38.9 |
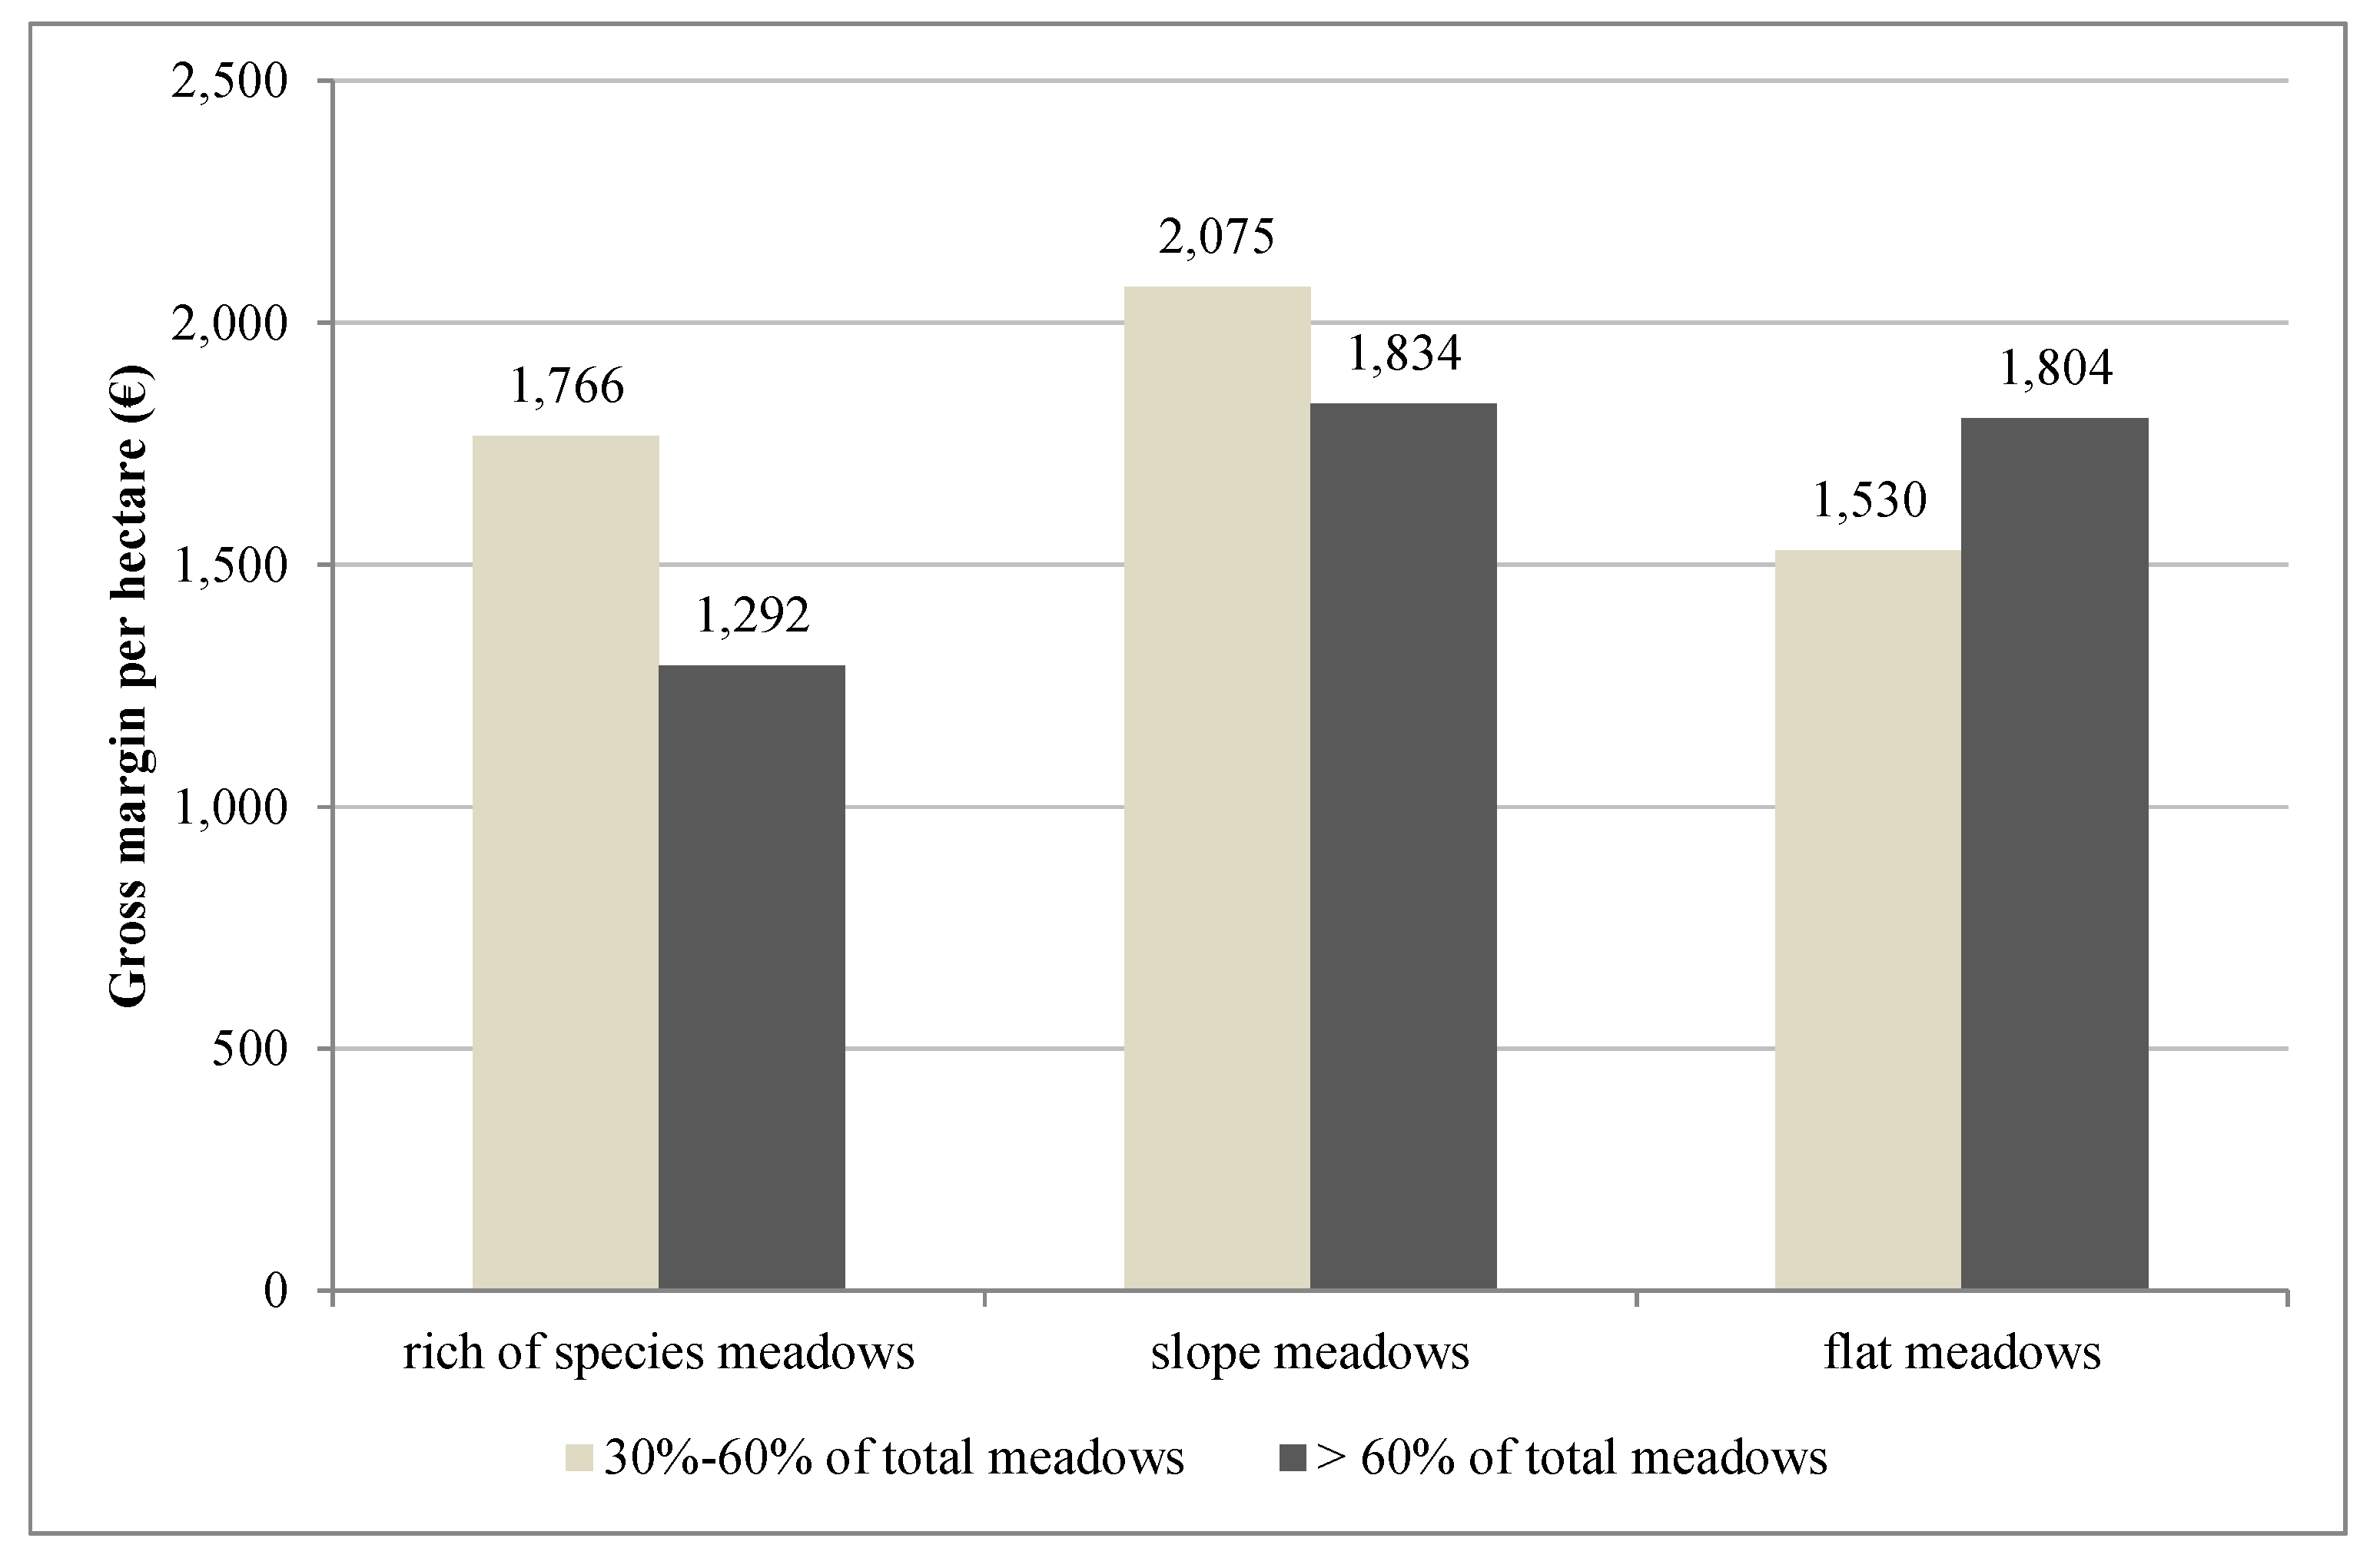
Figure 6 shows the gross margin per hectare for the different kinds of meadows, depending on their importance on total meadow area (in terms of percentage). An increase in the surface of species rich meadows, which can be considered as a biodiversity improvement, entails a decrease in the farm’s economic results (−474 €/ha of GM/ha). A similar variation concerns sloping meadows: farms with a higher percentage of sloping meadows have lower gross margin per hectare (−241 €/ha) that means more difficulties in farm management. In both cases farmers have to be compensated with an adequate payment per hectare in order to encourage them to provide the ES linked to biodiversity or to avoid radical changes in meadow management as in the case of sloping meadows.
The case of flat meadows is different: farms with a higher percentage of flat meadows have the highest gross margin per hectare (+274 €/ha). In this case, the main risk consists of intensification in terms of animal density. According to the results from our elaborations, the variation of gross margin per hectare due to intensification of the rearing system (considering 2.5 LSU/ha as threshold) is equal to 2186 €/ha.
Figure 6.
Gross margin per hectare in the different meadow types.
Figure 6.
Gross margin per hectare in the different meadow types.
These results highlight the relationship between farming practices and economic returns. Management based on the maintaining of a high level of biodiversity or on the protection of sloping lands, means high costs or low revenues for the farms. On the other hand, the intensification of farming practices increases the revenues and does not justify the support for AEC purposes.
5. Discussion
Agri-environment is the most financially significant rural development measure, to which approximately 20 billion euro have been allocated (a fifth of the total rural development budget for the 2007–2013 programming period) [
4]. At the same time, the lack of specific and appropriate information on expected impacts has been highlighted as one of main causes of errors in rural development funding during the last three years. Infringements of agri-environment commitments accounted for one eighth of the total error rate at EU scale (8.2%) and were primarily the result of non-respect of simple commitments (e.g., avoid overgrazing, adoption of best-practices, set-aside,
etc.), which significantly hampered the achievement of the desired environmental benefits [
4]. These come under the two main problematic issues economists have identified for policy design in the framework of principal-agent theory: adverse selection and moral hazard that are typically referred to under the heading of “asymmetric information”. These two problems have the same effects on policy outcomes,
i.e., they reduce cost-effectiveness [
65]. The availability of limited information about agri-environment measures and the high administrative burden cause problems to farmers wishing to access and implement EU funds, while the inadequacy or absence of monitoring activities on farmers’ commitments may allow cases of cheating. Moreover the lack of information about actual compliance cost can lead to a miscalculation of the payment levels [
21].
In modelling the Sustainable Fodder Production we did not use a conventional agronomic model, but built a probabilistic one based on Bayesian Networks. Bayesian Networks is an interesting approach that can be used when appropriate knowledge of local territorial resources, as well as detailed information, are available. A Bayesian Network approach can take advantage of the experience of technicians/experts operating in a certain area, using this as a valuable input for building, testing and running the model.
Another issue is that spatial datasets differ from farm statistics. The former are based on meadow polygons (many polygons can belong to a single farmer) and data (attributes) are reported for each meadow/polygon; the latter refers to farm costs and revenues. Both kinds of datasets are needed in order to include biophysical issues in the drawing up of the measure, while using appropriate economic information to justify payment level. We decided to bridge the two datasets by considering a percentage of the total meadow area (specifically >60%). It is interesting to check whether the two procedures undertaken using different datasets for the same spatial context are comparable and can support each other.
The integration of the two procedures has led to a better understanding of the payment justification required by the RDP. Following the results, application of the AEC limit on sloping meadows could increase the areas managed in a sustainable way by 4230 hectares that, according to the RICA results, means a loss of gross margin equal to almost 1.02 million euro. On flat meadows, the increase in surface area (+1305 hectares) could determine an increase in the total gross margin of livestock farming of 3.6 thousand euro, but in this case particular attention should be paid to avoid intensification in terms of animal density. In this case the payment per hectare will likely not compensate for the loss in gross margin (that is very high on average if farms exceed 2.5 LSU/ha) and farmers will not be compensated for the ES they deliver respecting the sustainability threshold. For species rich meadows the surface area seems to remain the same under the scenario hypothesis. Economic results suggest that farms with higher level of biodiversity have lower gross margin per hectare. In this case, payments will be aimed at maintaining the current situation and avoiding a loss of biodiversity due to a change in meadow management practices.
6. Conclusions
ES have become a hot issue on the international and EU policy agenda. Environment quality and climate-change are cross-cutting priorities among several policies at European level, including the Rural Development Policy, Biodiversity Strategy [
66], and EU Forest Strategy [
67]. The development and implementation of tools/methodologies that can identify and assess these services might provide support for a wide range of tools aiming to turn environmental policies into action. For the specific aims of RDP measures, the adoption of an ES-based approach for the definition of targets and thresholds could improve transparency in both the identification of potential beneficiaries and the distribution of public funds. This seems to be a priority for agri-environmental measures, for which EU expenditure amounted to nearly 20 billion euro in 2007–2013,
i.e., about 22% of the total expenditure for Rural Development [
68]. AEC payments are expected to increase these figures during the 2014–2020 period. Furthermore, ES gained additional indirect relevance in other RDP areas, such as the greening provisions in CAP pillar I.
As a final comment, it should be underlined that this study provided the chance to test a tool like ARIES and an ES approach within a local governmental agency. While this involved a strong need for simplification in order to keep procedures understandable, affordable, and replicable, it also raised a number of interesting points for discussion and gave the opportunity to develop alternative solutions to be implemented at local scale. The study represents a first step towards a wider approach to ES. The idea behind this is the willingness to link the key variables of the meadow model (LSU/ha and cutting regime) and the sustainable fodder production model to other services such as recreation, water purification, and aesthetic view, in order to further support and enhance the environmental benefits generated by extensive livestock farming systems. The process is currently ongoing and further research and pilot studies are needed.


