Using Historical Maps within a GIS to Analyze Two Centuries of Rural Landscape Changes in Southern Italy


SAFE School of Agricultural, Forest, Food and Environmental Sciences, University of Basilicata, Viale Ateneo Lucano, 10, 85100 Potenza, Italy
*
Author to whom correspondence should be addressed.
Land 2017, 6(3), 65; https://0-doi-org.brum.beds.ac.uk/10.3390/land6030065
Submission received: 30 July 2017
/
Revised: 9 September 2017
/
Accepted: 11 September 2017
/
Published: 19 September 2017
(This article belongs to the Special Issue Landscapes in the Eastern Mediterranean between the Future and the Past)
Abstract
:The current characteristics of a rural landscape may be better understood if suitable information related to its past is available. The availability of a Geographical Information System (GIS) can enable the analysis of landscape features in relation to several aspects, e.g., the evolution and mutual inter-relation among different ecosystems, the impact and sustainability of human activities, the visual characteristics of a landscape, etc. The analysis of geographical information, derived from historical maps, within a GIS could, therefore, prove to be a very powerful tool, for a better-informed decision-making and management of a rural landscape. With the aim to identify the land use changes in a rural area located in the Basilicata Region (Southern Italy), a territorial analysis was conducted through a GIS, in which data taken from historical maps—covering a period of 184 years, from 1829 to 2013—were implemented. Three-dimensional reconstruction of the rural landscape during different periods were obtained through digital terrain models (DTM). The land cover changes were also evaluated, demonstrating how they have affected the quality of the forest ecosystem in the area. The final results that were obtained comparing historical documents and current maps enabled the evaluation of the multi-temporal, morphological, and vegetation variations in this rural landscape. The analysis that was conducted has great potential for assessing and monitoring landscape diversity and typical changes of vegetation, even in different geographical locations, where appropriate interventions in landscape structures may be so planned.
1. Introduction
During the last decades, changes in land use and management have led to the degradation of several cultural landscapes in rural areas, mostly in those located in the Eastern Mediterranean, with relevant consequences for local populations, landscape functionality, and the maintenance of ecosystem services [1]. The analysis of rural land modifications, as well as the wider environment and landscape context in which they take place, is important in order to understand the profound transformations connected with human intervention and natural events [2,3].
The digitization of historical cartography allows for understanding the evolution of the landscape over time, and may account for the susceptibility of spaces to territorial transformations and provide insights to spatial and contextual specifics, which is an issue that is essential for appropriate spatial planning [4]. With the support of a GIS in which historical documents are input, a multi-temporal analysis of land is possible. This is a fundamental tool for monitoring landscape diversity and changes in vegetation and landscape structure [5,6,7].
Visibility analysis may serve as the starting point to evaluate the quality, fragility, and aptitude for the protection of the area’s biophysical units. This analysis has a two-fold importance: i.e., for planning purpose since it can be used to identify which biophysical units are in greater need of protection and where such protection is more likely to be effective, and because it provides a novel methodological basis for the analysis of visual aspects in biophysical units [8,9]. During the past two decades, especially in the Mediterranean Basin, three phenomena are re-drawing the configuration of rural areas: agricultural mechanization, the accelerating demise of traditional rural life, and an increase in the mobility of individuals [10]. In fact, in many developed countries, a particular land-cover change pattern has taken place: plains are being increasingly utilized for human activities, while mountain areas are being abandoned, so they are undergoing natural reforestation processes [11,12,13,14,15,16]. These generalized patterns can have significant impacts on biodiversity distribution and conservation [17].
Image processing techniques and landscape pattern metrics were applied to quantify the changes in forest cover patterns, while appropriate statistical descriptors were adopted to investigate the relationship between land-cover changes and topographical factors. New systems for the rational collection and analysis of forestry and agricultural land data are now available. GIS-based techniques, image processing, remote sensing, and other powerful technologies for the survey, planning, and management of land evolution are enabling a more accurate analysis of rural landscape and environment [18]. In particular, GIS are excellent tools for landscape modelling and three-dimensional analysis. They allow an easy digitization of geographical and non-geographical information, and facilitate visual representation. A GIS approach for territorial analysis, comparing historical maps with contemporary maps, may reveal essential clues for understanding landscape dynamics [2,4,10,19].
This paper presents a local study on the land use evolution using historical and recent maps. It is aimed to analyse, in a specific way, the land use dynamics and topographic changes from 1829 to 2013 by a comparative examination of different historical cartographic supports and more recent maps. This approach would enable to obtain conclusions about the rural landscape changes, their connection to human activities—agricultural production, in particular—as well as to natural events, and the consequences on the rural land. This analysis, by proposing a methodology supported in GIS tools to evaluate changes that make comparable maps from different dates and data sources, may, therefore, enable policy decisions that support sustainable development, acknowledging present and future development trends and their potential economic, social, and ecological impacts. The technical and spatial analysis methodologies applied could ensure both the proper management and planning of land [20].
2. Materials and Methods
2.1. Study Area
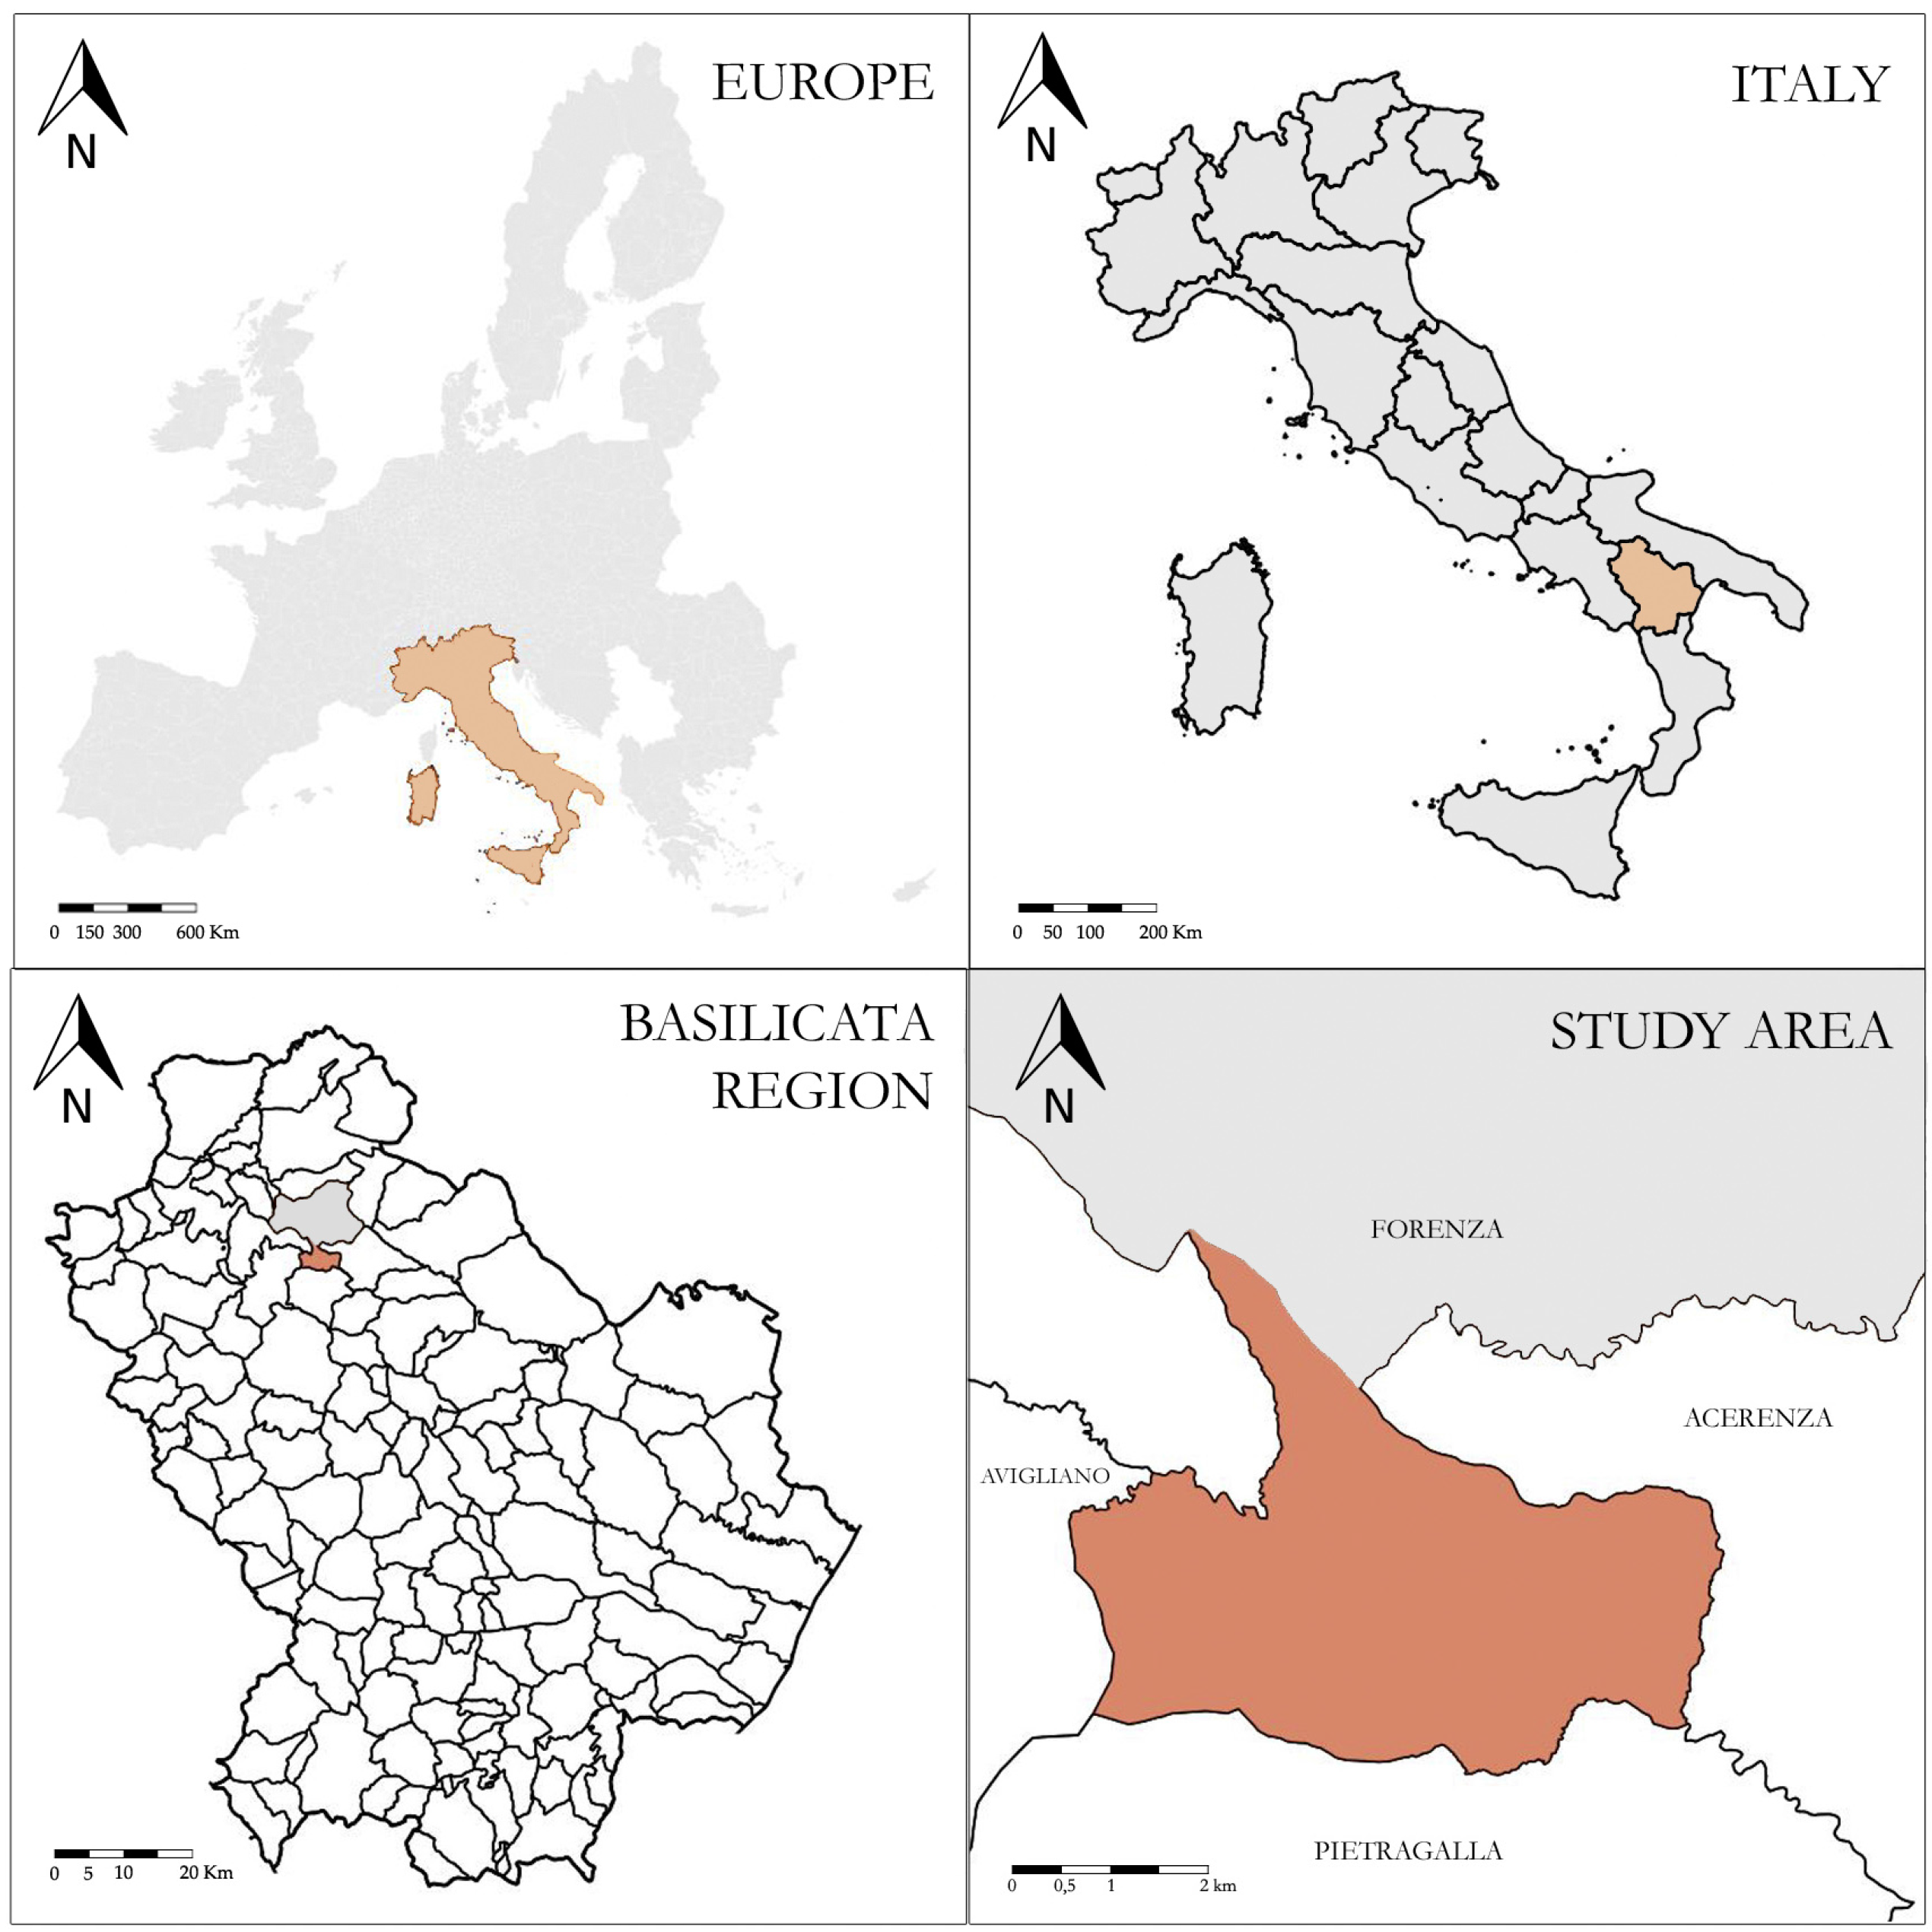
The study area (Figure 1) is located in the Basilicata region (Southern Italy). It spans about 18 km2, covering one part of the Forenza municipality (40°47′57″ N 15°51′39.4″ E, datum WGS84). It is about 5 km away from the urban centre, a hilly area often characterized by high slopes, forests and other semi-natural areas. The study area is part of the hydrographic basin of the Bradano River, which crosses the area from the northwest to the southeast for 6.5 km; after 2 km it flows into the Acerenza’s dam, then continuing its course towards the Ionian Sea. The altitude of the area ranges from 450 to 920 m above sea level (a.s.l.). The soil composition has, in turn, determined the topography of this area, which has influenced the socio-economic context through relevant agricultural activities. Considering the thermo-pluviometric data of the weather station located in Forenza, the annual rainfall is 660 mm in average (Hydrological Annals of Ministry), distributed into 86 rainy days with higher values during autumn and winter. The mean annual temperature is 12.8 °C, the average monthly temperature is lowest during January with 3.4 °C, whilst the hottest month is August with a monthly average of 22.8 °C.
The territory offers employment mainly in agricultural activities, many farms present in this area have livestock and cereal crops. The largest profit comes from cattle breeding and in particular the production and sale of dairy products. Moreover, fodder, olive groves, orchards and vineyards cover the hilly territory.
The wooded area is located in the San Giuliano area. The forest communities encountered are typical of the phytoclimatic area Castanetum [21] and Quercus-Tilia-Acer-mixed deciduous forest belt of Schmid. At lower altitudes, the vegetation characteristics are similar to those of the Mediterranean basin, while those at higher altitudes of the mountain are typical of the sub-mountain belt. With nearly 4000 ha of wood, Forenza is one of the municipalities with the largest wooded area in the whole Basilicata region.
2.2. Cartography
Land use change and geographical reconstruction of landscape were carried-out over a period of 184 years in four time steps: years 1829, 1876, 1955, and 2013. The specific cartography for each period was examined with the aim to create different base maps to make a comparison in time. The historical maps and aerial-photography were scanned first, and then imported and georeferenced into a GIS system.
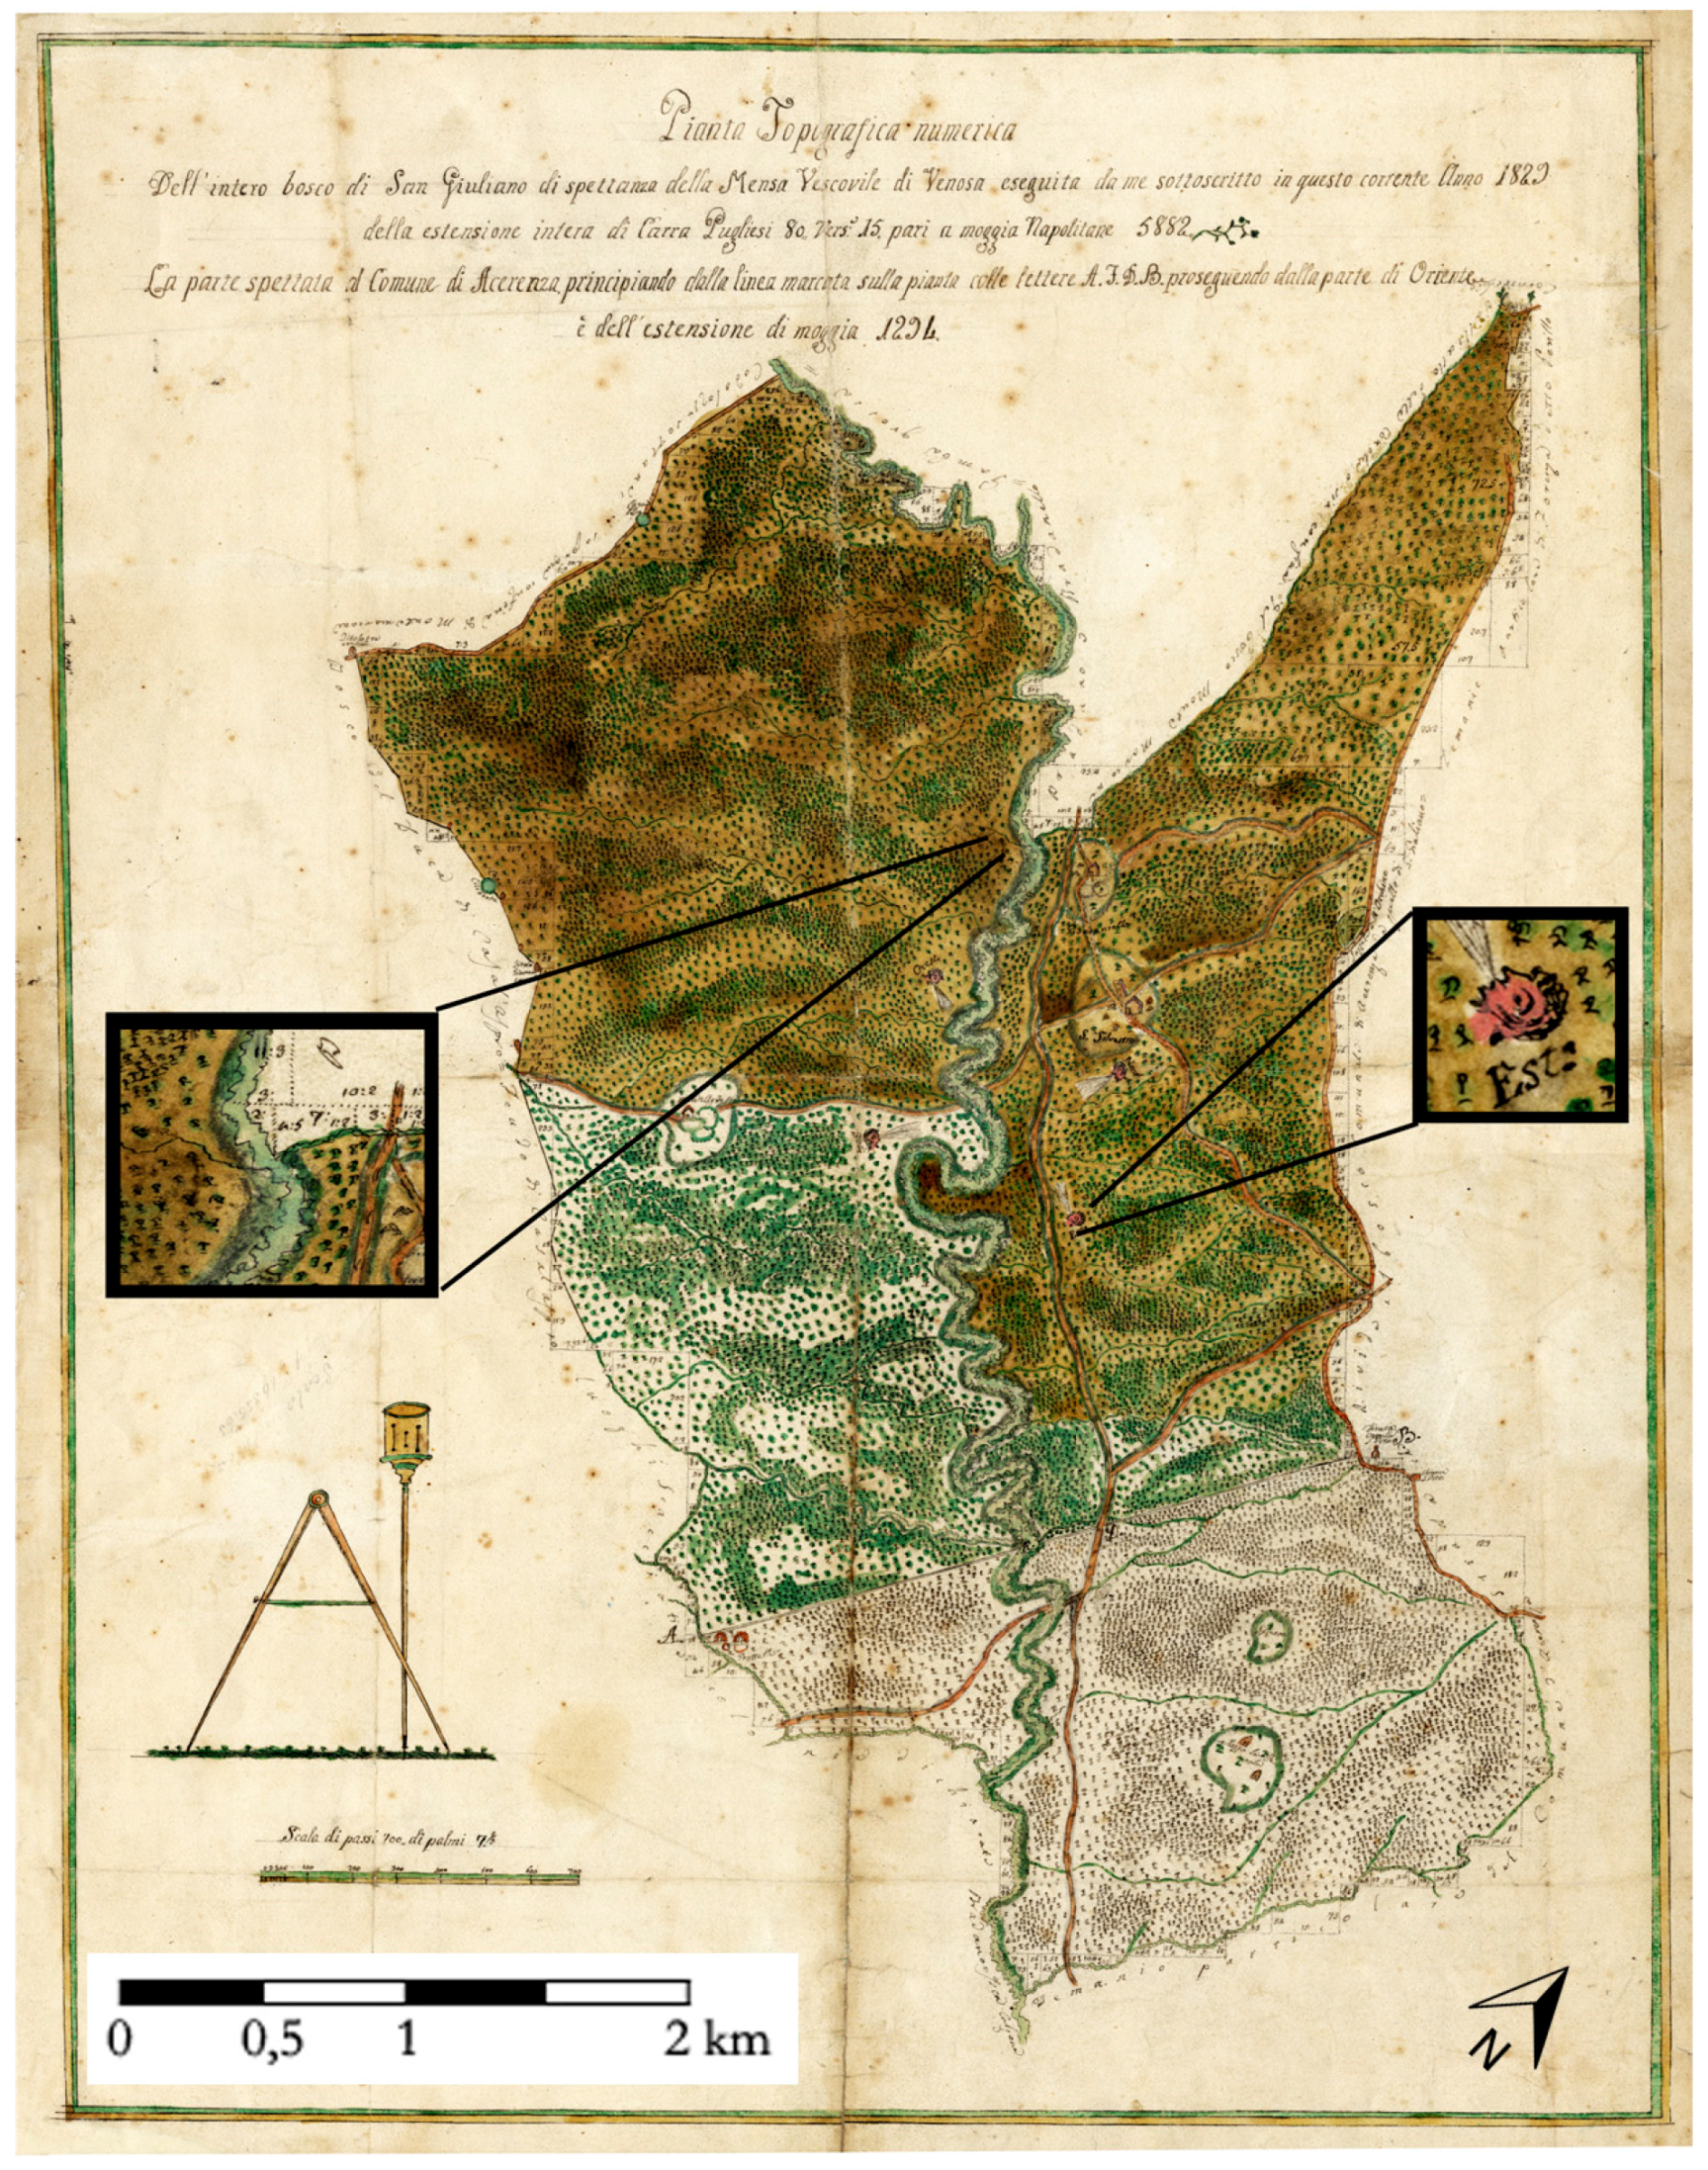
The historical map from 1829 is stored in the State Archive of Potenza: this map was produced in 1829 by legal experts to solve the division of domains after border disputes. Similar maps were realized in the whole Southern Italy as a result of the abolition of feudalism. These maps were drawn using legal documents and diplomatic sources, which showed land use rights and surveying on the ground (Figure 2). This historical map was manually drawn (577 × 440 mm2) and represents a part of the Forenza municipality (San Giuliano’s Wood). It shows, in yellow, the presence of agricultural land around the farms and the name of some farm districts. The evaluation through chromatic differences was possible thanks to the comparison with other similar historical maps (same period and surrounding areas), which had a more detailed description. In addition, from historical documents, some useful information were obtained, linked to the production of the map. They can be considered as ancillary data that can better describe the historical situation (Forenza Municipality, 1915).
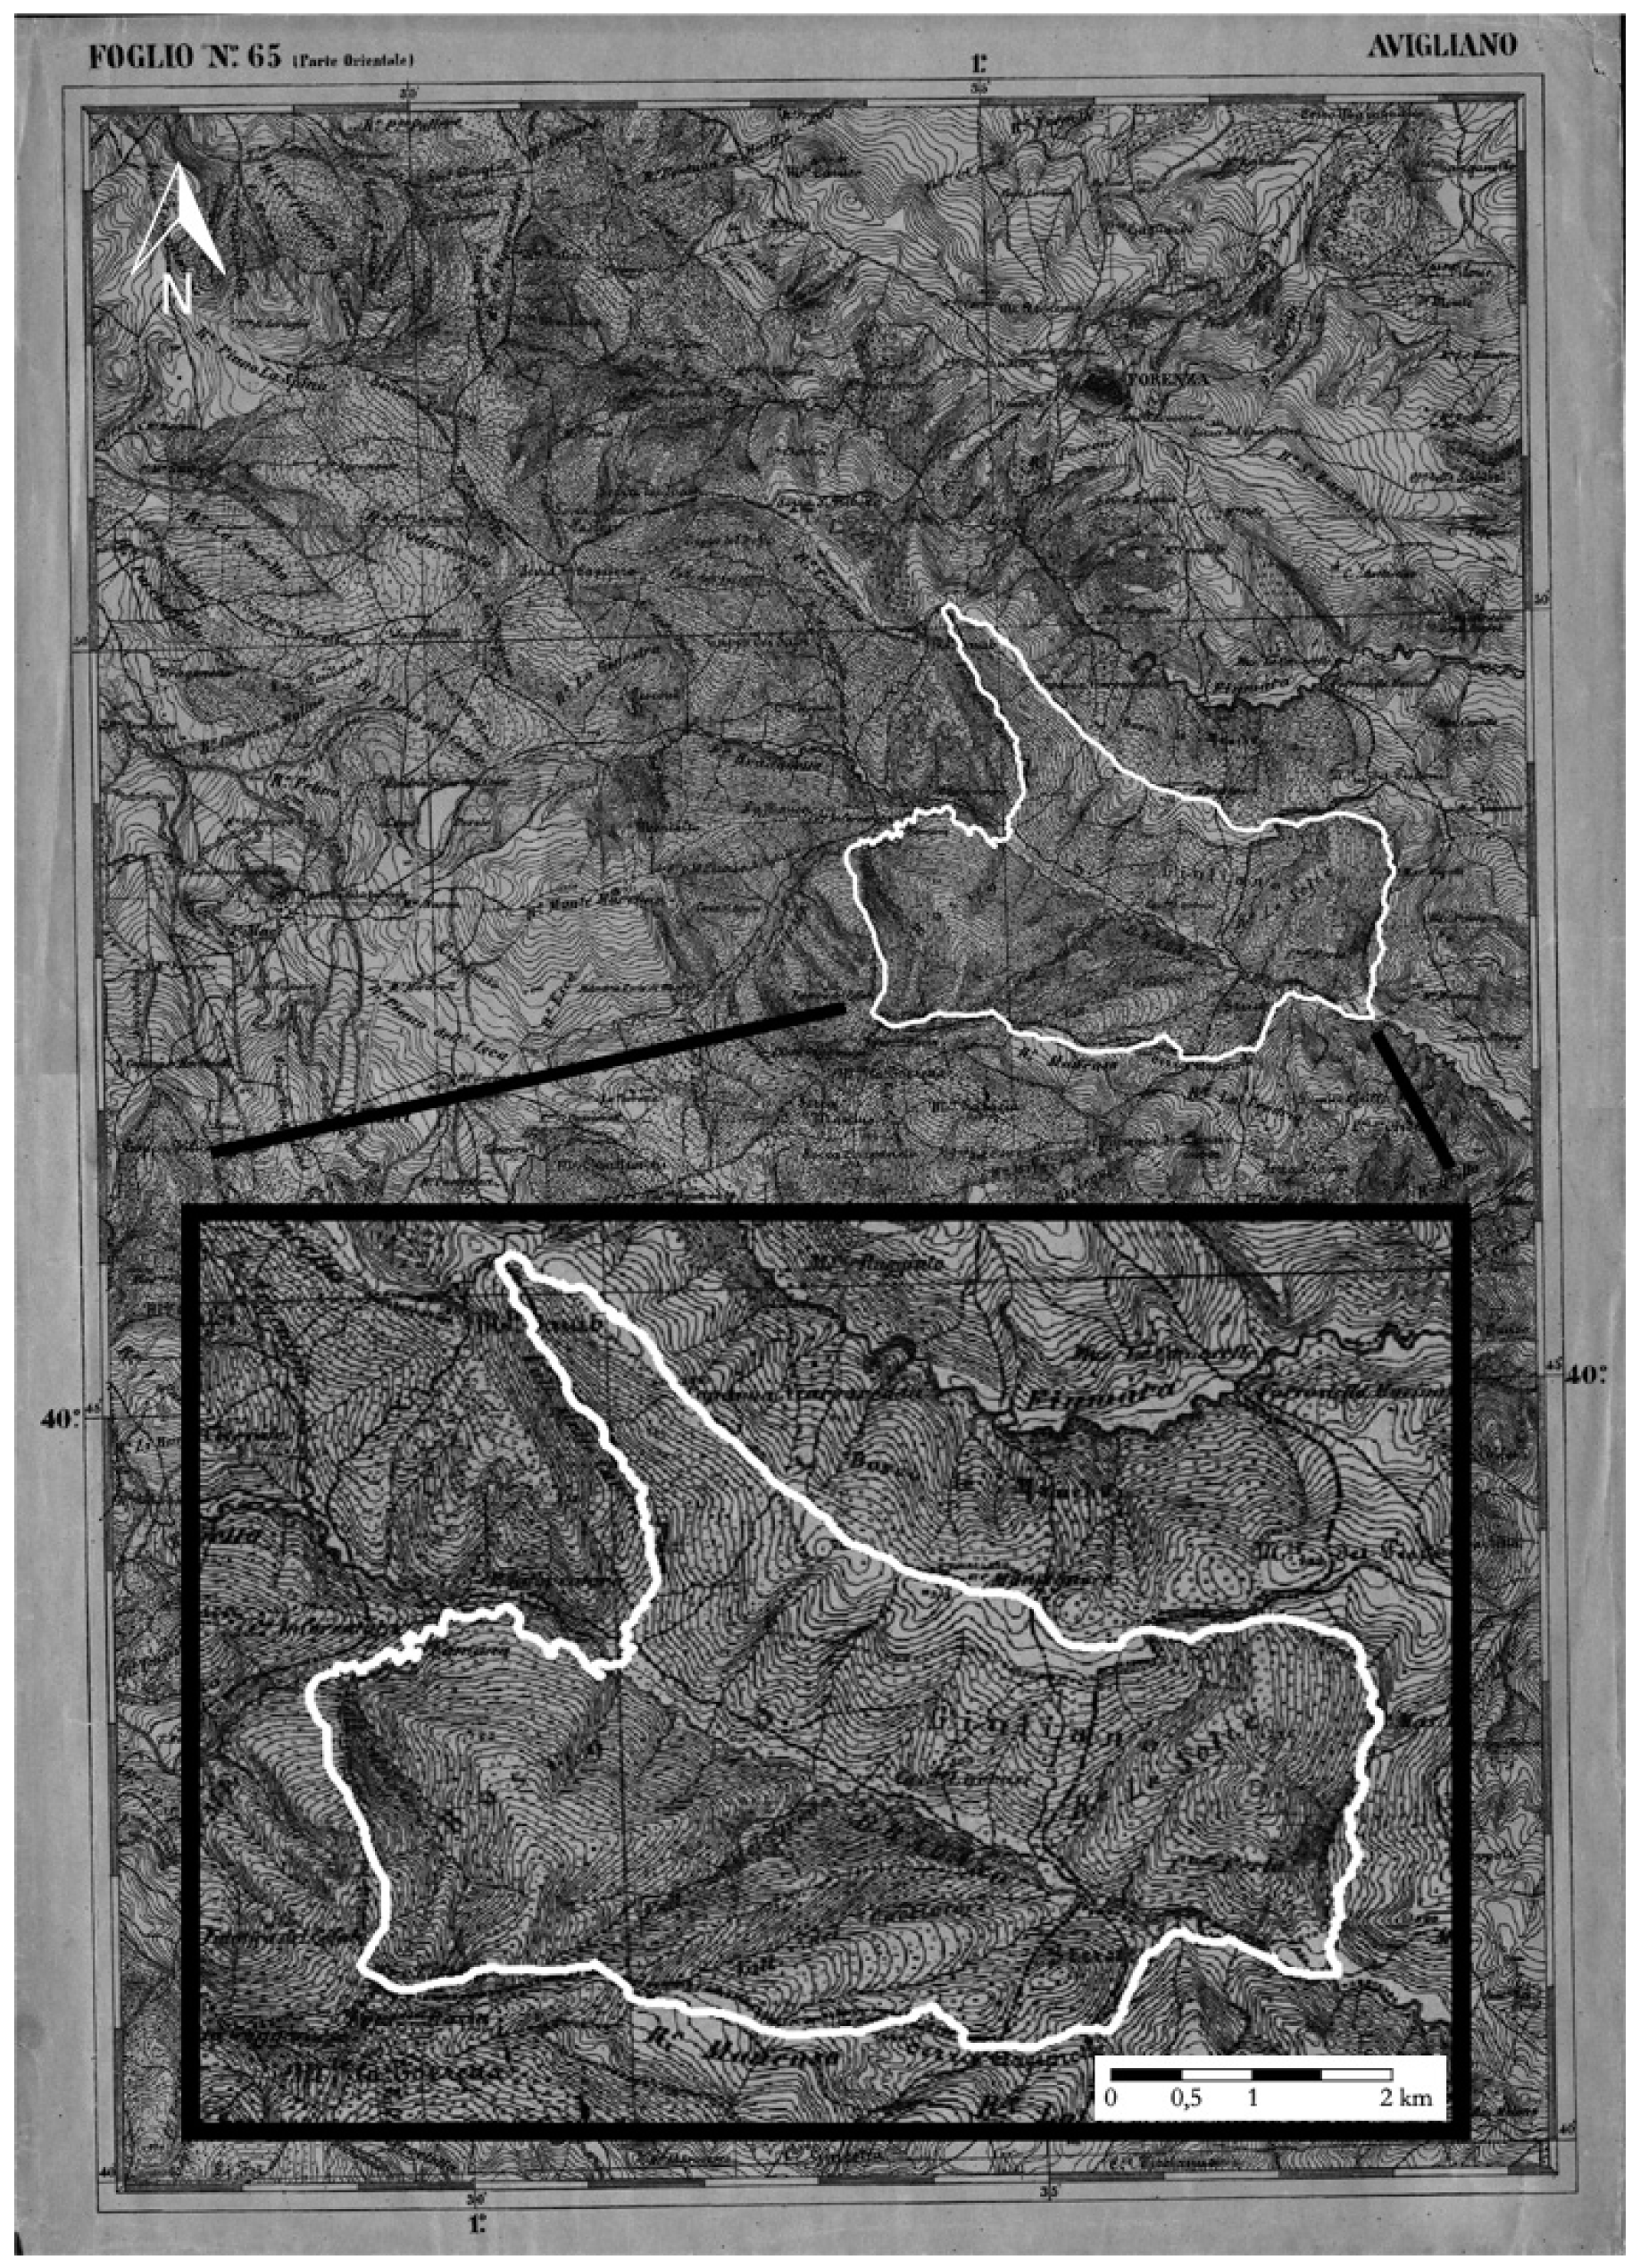
The historical topographic map of 1876—also stored in the same State Archive of Potenza—was produced by the Italian Geographical Military Institute (IGMI) to create a complete mapping of the Italian territory after its national unification. Geodetic surveying and topographic evaluation were highly accurate, and the IGMI decided to immediately print some drafts using a photolithography technique (Figure 3). This cartography consists of 174 sheets, the study area being located into Sheet no. 65—Avigliano, eastern part. The scale of the map is 1:50,000 and the altitude was represented with contour lines having an equidistance of 10 m, and elevation of the highest areas. The old maps are a source of important information, even if they require an accurate analysis to evaluate the topographic accuracy, chronometric accuracy, and planimetric completeness [22]. The first aspect indicates the quantity and quality of information about landscape objects. Each map contains only a selection of geographic features, which are symbolized by the cartographer according to the objective of the map. Then it is necessary to consider whether the map depicts all features of a certain class, and how accurately the cartographer classified the features thematically [23]. The second aspect refers to the dating of the map as a physical artefact (by watermark analyses or other techniques), and the dating of the information contained in the map. Dating the age of map information is often difficult, as the production or the revision of a map commonly takes several years. The third aspect is the planimetric completeness (or geometric accuracy) [24].
An aero-photogrammetric survey with black and white film for almost the whole Italian territory was carried out after the Second World War, in the period between 1954 and 1955 by the Italian Aeronautics Group, on behalf of the Italian Geographic Military Institute (IGMI) and the USA Army Map Service. For the coverage of this study, two photograms were used. Each of these photos has an overlapped portion and was shot in May with a Fairchild camera (focal length of 152 mm), the size of the photo is 230 × 230 mm, the flight altitude is around 6000 m, its approximate scale is 1:33,000. The quality of the survey allows an accurate geolocation and assessment of land use. The aerial photo from 1955 is stored in the archive of the School of Agriculture, Forestry, Food, and Environmental Sciences (SAFE) of the University of Basilicata, Italy.
The recent cartographic support of the year 2013 were downloaded in GeoTIFF (.tif) format from the Geographic Database of the Basilicata Region (under Italian Open Data License 2.0 (IODL 2.0)). Orthophotos mosaic in 1:5000 scale obtained from aerial photographs taken in the year 2013 (from April to September) were used to determine land use for the year 2013. Each orthophoto is made of four RGB visible bands or near infrared with an average pixel value of 0.2 m. It is geo-referenced in the UTM/WGS84 projection. These maps are under the IODL 2.0 license, which allows free use. They combine the image characteristics of a photograph with the geometric qualities of a map, i.e., the ground features are displayed in their true position, so it is possible to carry out direct measurement of distance, areas, angles, and positions [25].
2.3. Historical Documents
Historical records provide land managers with information that could be used to understand trajectories of land use change. According to Italian and foreign studies, the related historical documents mainly include chronicles, timber ledgers, tax records, census data, land survey records forest inventories, paleoecological records, government report, gazetteer, notes of surveyors, statistical inventories, genealogy, general description by travellers, paintings, farmers’ diaries, cultural histories, etc. [26]. The information reported in some historical documents may also support map reading, if there is not a legend, and explain some qualitative and quantitative data about historical land use. For this study, the historical documents analysed providing information on the main agricultural activities, forestry, and on the landscape and the environment; so it was possible to trace their evolution. Integrating a GIS methodology to quantify land use change with historical analyses makes it possible to identify the dynamics that led to the present landscaping situation. Some documents showing the relevant information for this study are reported: statistics of the Kingdom of Naples [27], a report on the ousting of St. Julian’s domain forest [28], historical documents from the Forenza municipality archive. Until the early 1900s forest management was not correct and illegal logging of public domains were common. The most frequent forest logging system identified was clear-cut with reserves of extensive areas. Documents reported significant logging and tillage into the forest, which was commissioned by the Forenza municipality to solve its financial problems.
2.4. Data Analysis
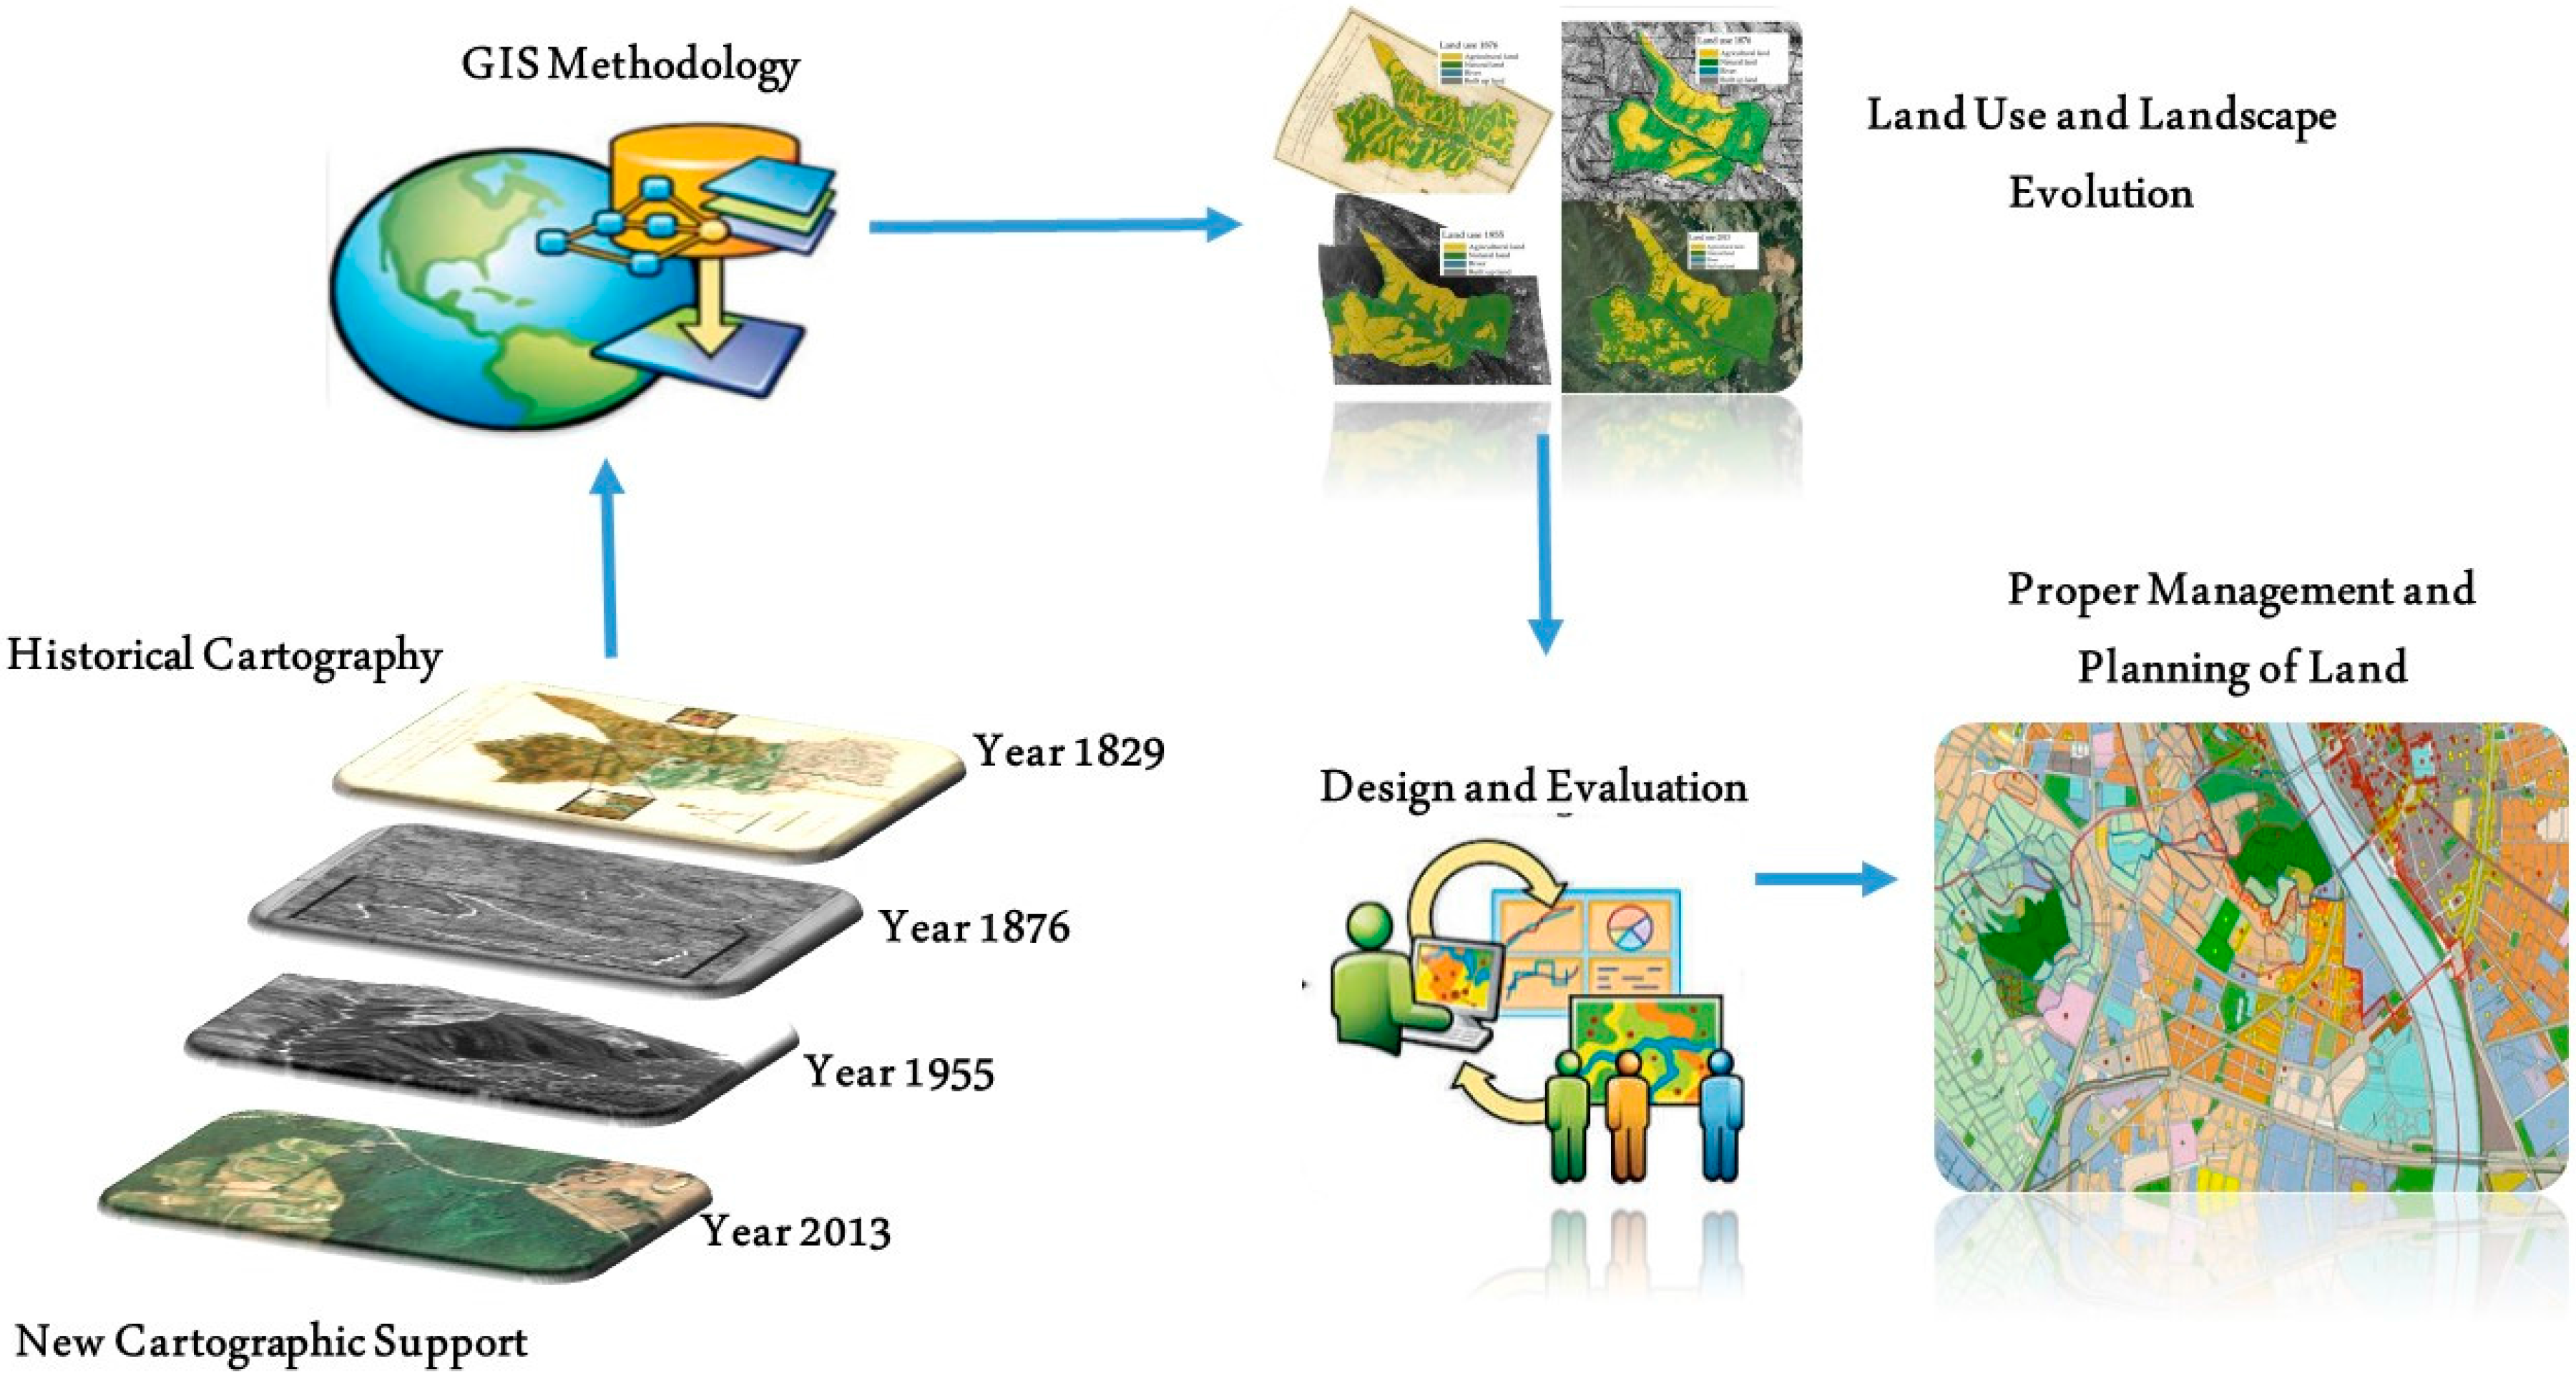
With the aim to analyse the evolution of land use in different time step (Figure 4), all maps have been converted into data, and each homogeneous area has been identified according to its relevant category of land use. The number and features of each map depend on its cartographic properties.
2.4.1. Georeferencing and Data Processing
According with Lefreniere and Rivet [29], working with historical maps is necessary in order to include many different aspects and problems that occurred over time. The first step has been to digitize the maps with a scan. Each map has been scanned into a TIFF file at a resolution of 300 dpi. These raster data have been imported in an open-source desktop software for geographic information system (QGIS 2.18.5 Las Palmas de Gran Canaria) to elaborate them. Every different temporal map was projected in the same coordinate system (EPSG: 32633-WGS 84/UTM zone 33N). To rectify historical maps (1829–1876) and aerial photos (1955), a sufficient number of control points on a geo-referenced map was identified (topographic maps of IGMI or orthophoto of year 2013). Today, a variety of transformation techniques are available, while different methods to compute and visualize distortion are possible [30,31]. In the present study, first- and third-order polynomial transformations were used. Five control points and a first-order polynomial transformation were used. Subsequently, a real geo-referencing has been performed in which seventeen control points—based on the analysis of the river, watersheds and roads—were added and a third-order polynomial transformation was used. The resulting ortho-rectification, after error checking, can be considered acceptable. Thanks to this data processing, it has been possible to make all maps comparable in terms of scale and land use classification and it has been possible to overlay them, in order to asses land use changes.
Planimetric and geodetic accuracy were evaluated and visualized with MapAnalyst, an open source application [24]. All raster maps were converted into vector data by visual interpretation and subsequent manual classification [32] and each homogeneous part of the area was identified with different categories of land use. The land use of the historical maps of 1829 was classified into five categories thanks to the interpretation and the integration with historical documents. The same categories have been used to digitize land use on the map of 1876.
Corine Land Cover (CLC) nomenclature guidelines [33] were used to assess land use. In order to have a more complete view of current land use, it has been carried out fieldwork was carried out to identify the types of land use and locate them through a GPS. The evolution of cartographic information in time has generated a progressive increase in the number of details and, therefore, the number of land use categories identified. Since the aim of this research was focused on the comparison between general categories of land use—differentiating natural areas (natural land, water lines) from those susceptible to human activities (agriculture, buildings, roads)—similar categories of land use in different time levels were aggregated into more general classes, so as to better compare homogeneous changes.
The most important categories identified in the study area have, therefore, been grouped according to the following five classes:
- natural land: includes forest (according to FAO definition) and transitional woodland-shrubs, an afforested land with conifers realized in the 1960s, transitional woodland-shrubs area (containing shrub or herbaceous vegetation with scattered trees and vegetation formations that may result from the degradation of the forest or a regeneration of the same for re-colonisation of non-forest areas);
- agricultural land: includes all types of cultivated areas, i.e., arable lands, vineyards, olive groves, permanent crops like orchards, permanent and natural pastures, natural pastures with spontaneous herbaceous vegetation, etc.;
- urbanized area: includes new and old farms, buildings and artificial surfaces next to farms. This category also includes infrastructure to regulate water flow;
- road network: includes only roads involving a significant surface and with an important traffic flow. Provincial and municipal roads are included, whilst all typologies of minor rural roads are not included; and
- river: includes the area corresponding to the bed of the Bradano river and the vegetation present along the river.
For each category, the total area expressed in hectares (ha) and the percentage of its variation over the time was calculated. The road network was also evaluated, the length calculated in meters (m).
2.4.2. DTM and Three-Dimensional Modelling
Through the digital processing of the maps it was possible to reconstruct the three-dimensional shape of the territory, thanks to a photo-mosaic procedure and virtual reconstructions of the land in different periods. Recently, 3D visualization has been receiving more attention as a useful tool to understand engineering phenomena, or to detect important elements that cannot be found in usual simulations.
Visualization in a virtual environment is a useful method that allows people to appreciate archaeological or historical objects through the computer [34].
2.4.3. Methods for Map Comparison and Correlation Analysis
Thanks to spatial analysis functions, it was possible to create a digital terrain model for the area. Overlapping photographic images, topographic maps and other cartographic data allowed the realization of a three-dimensional view, useful to appreciate landscape modification from different viewpoints. To create 3D reconstructions, a QGIS plugin (Qgis2threejs) was used. Moreover, through spatial analysis and image processing, using aerial photos from 1955, a historical reconstruction of 1829 was obtained, with a virtual jump of 184 years back. The analysis that was performed over the three-dimension images of the territory has been revealed to be a powerful mean of interpretation, since it allows some dynamic effects to be created in a virtual reality system, in which the operator has the opportunity to navigate as if he/she is walking or flying over the area at that time. Thus, the operator is able to visit—with a virtual jump backwards in time enabled by the simulation of an ante litteram flight—real-life scenarios, that would be otherwise difficult to imagine and/or reach. By doing so, all the aspects that characterized an area can be examined in suitable detail and completeness, starting from the analysis of topography and land cover and leading to anthropic components (buildings, roads, and railways, hydraulic infrastructure, such as dams, aqueducts, etc.).
By doing so, it is possible to appreciate qualitatively, in terms of land use and landform variations, the agro-forestry landscape changes, starting from a comparison between three-dimensional reconstructions of the area during different time layers. This virtual orthophoto of 1829 was realized through QGIS and free image processing software (GIMP—GNU Image Manipulation Program) which allows the preservation of geo-referencing.
3. Results
From the overlay of the different base maps, thanks to GIS technologies and the comparison between historical cartographic data and current situation, different categories of land use were identified.
3.1. Land Use
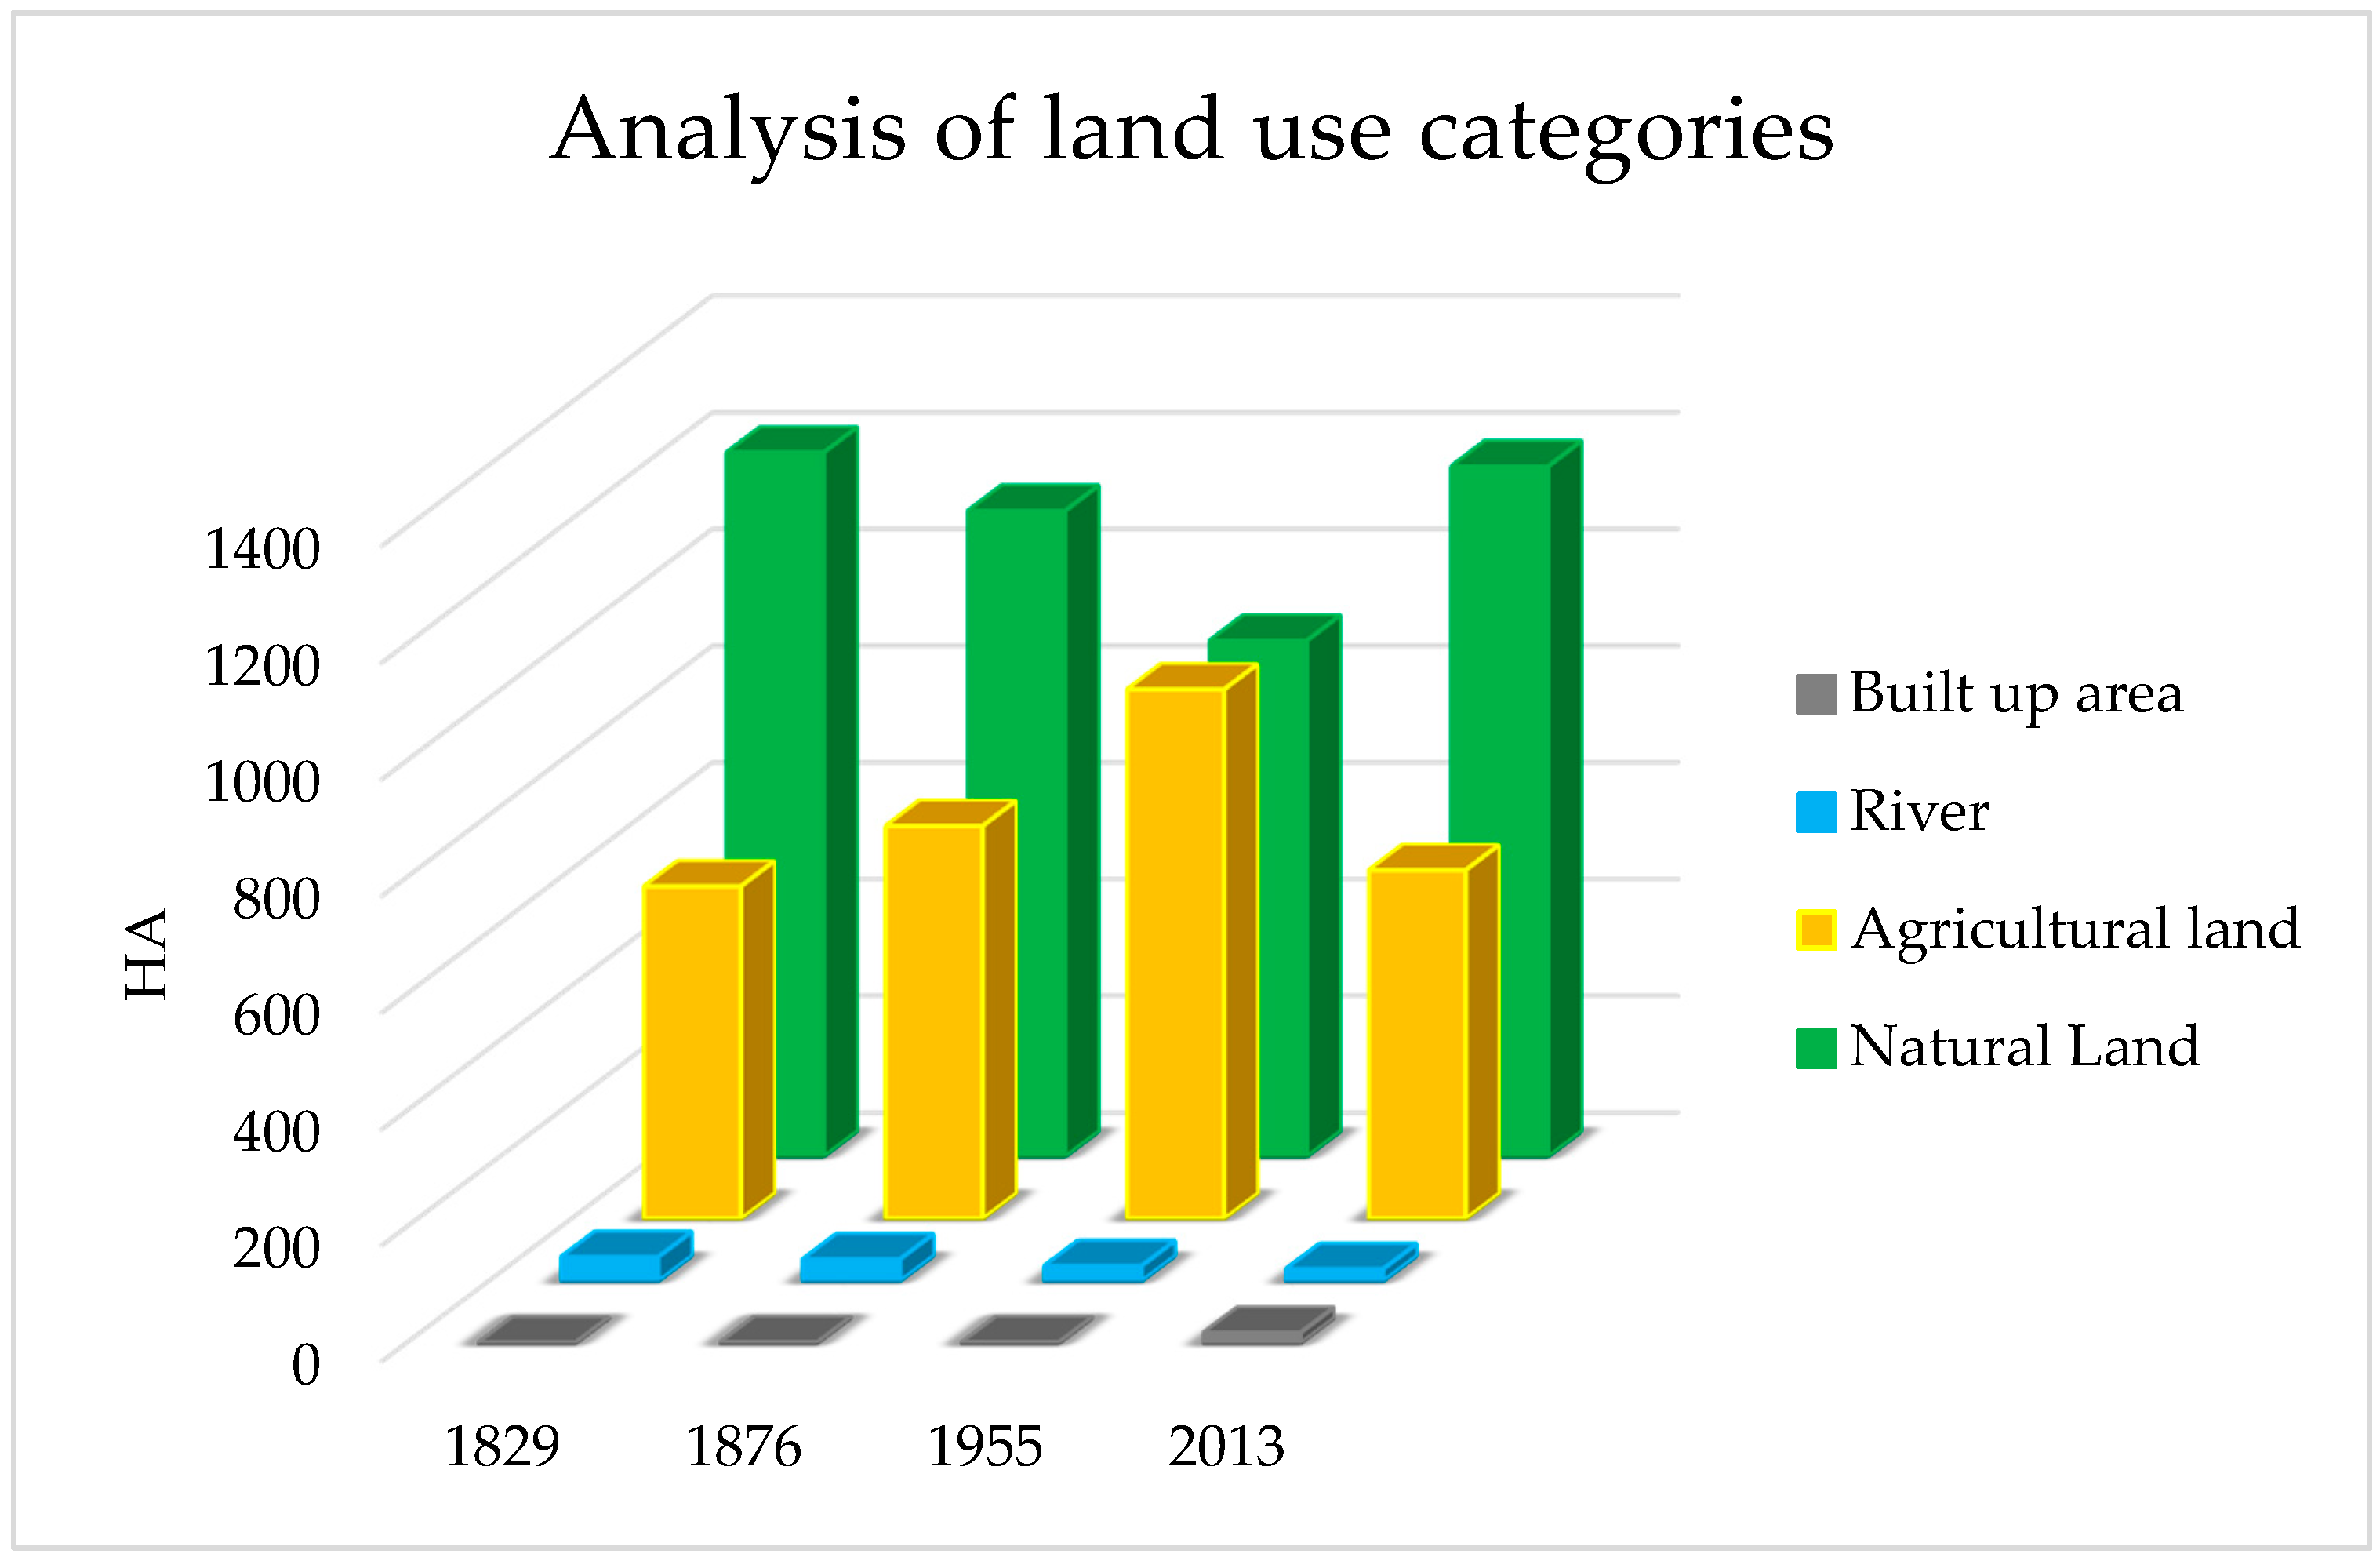
In 2013, the study area consisted of 65% natural area, 32.9% agricultural land, 1.1% river, 0.9% road network, and 0.1% built up area. The percentage of natural land decreased less intensively from the year 1829 to 1876, with a reduction of 100 ha (−5.4%), but more intensively from 1876 to 1955, with a reduction of 222 ha (−12.3%); agricultural land conversely increased from about 31% in 1829 to about 50% in 1955 (Table 1).
This trend reversed from 1995 to 2013: the analysis shows in fact a reduction of about 200 ha of the agricultural surface, almost counterbalanced by an increase of natural land from 48.6% to 65%. The main difference occurred highlights a mutual exchange between a reduction of the areas for agriculture and crops that gave more space to the natural area [25]. This is as a widespread trend detected in other different areas of the Basilicata region. The territorial extension of rivers decreased from about 41 ha in 1829 to about 20 ha in 2013 (Figure 5 and Figure 6). In particular, analysing each category without aggregation, woodland reduced from about 1206 ha in 1829 to 856 ha in 2013 with a minimum peak in the year 1955 (752 ha).
In year 1829, the pastures represented 98% of agricultural land, which covered more than 31% of the study area; on the contrary, from the year 1955 to 2013 the arable land (cereals and fodder crops) constituted the 93.6% and 88.9% of agricultural land. In 2013 the territory was also covered by olive groves and vineyards (about 23 ha and 15 ha). The introduction of these crops starting from the second half of the last centuries has visually impacted the landscape; human activities and agricultural practices have, thus, influenced the landscape structure, creating a mosaic of different land use categories with relevant consequences on the ecosystems of this area.
3.2. Infrastructure
The infrastructure was evaluated in terms of road network and farm buildings. The surface extension of the road network was estimated only in 2013; other historical maps did not allow the possibility to appropriately estimate this surface, since all roads within this study area were less than 6 m wide, so their width was not reported. Only the linear length of the road network has, therefore, been evaluated along the four analysed time steps. In the year 2013, about 0.9% of study area was crossed by roads (provincial and municipal roads that connect neighbouring towns) with a significant traffic flow. The total lengths of the road network has increased over the years; it passed from about 22 km in the year 1829 to 69 km in 2013, exclusively related to agricultural activities (paths and bridleways) until 1955 (Table 2). In 2013 about 20% of the roads were asphalted.
Farm buildings play a central role in the environmental characteristics of agricultural land over the centuries in many Eastern Mediterranean countries, since they have accompanied the development of the agricultural activities [35]. In the study area there has been an increase in their number and surface. In 1829 there were n. 13 buildings, occupying a total area of 0.8 ha, whereas in 2013 they were n = 55 and occupied an area of 2.1 ha, this value including many abandoned farms. Considering a field survey of the different buildings, it was observed that only 11 of the total 55 buildings are currently used as farms.
3.3. Landscape
Land use maps and DTM were adequately treated within the GIS to create, through spatial analysis procedures, suitable three-dimensional views, which may be used to appreciate the morphological and visual landscape variations. The overlapping of different thematic maps provides an additional database, by which a comparison of the visual aspect of the landscape with time is possible (Figure 7).
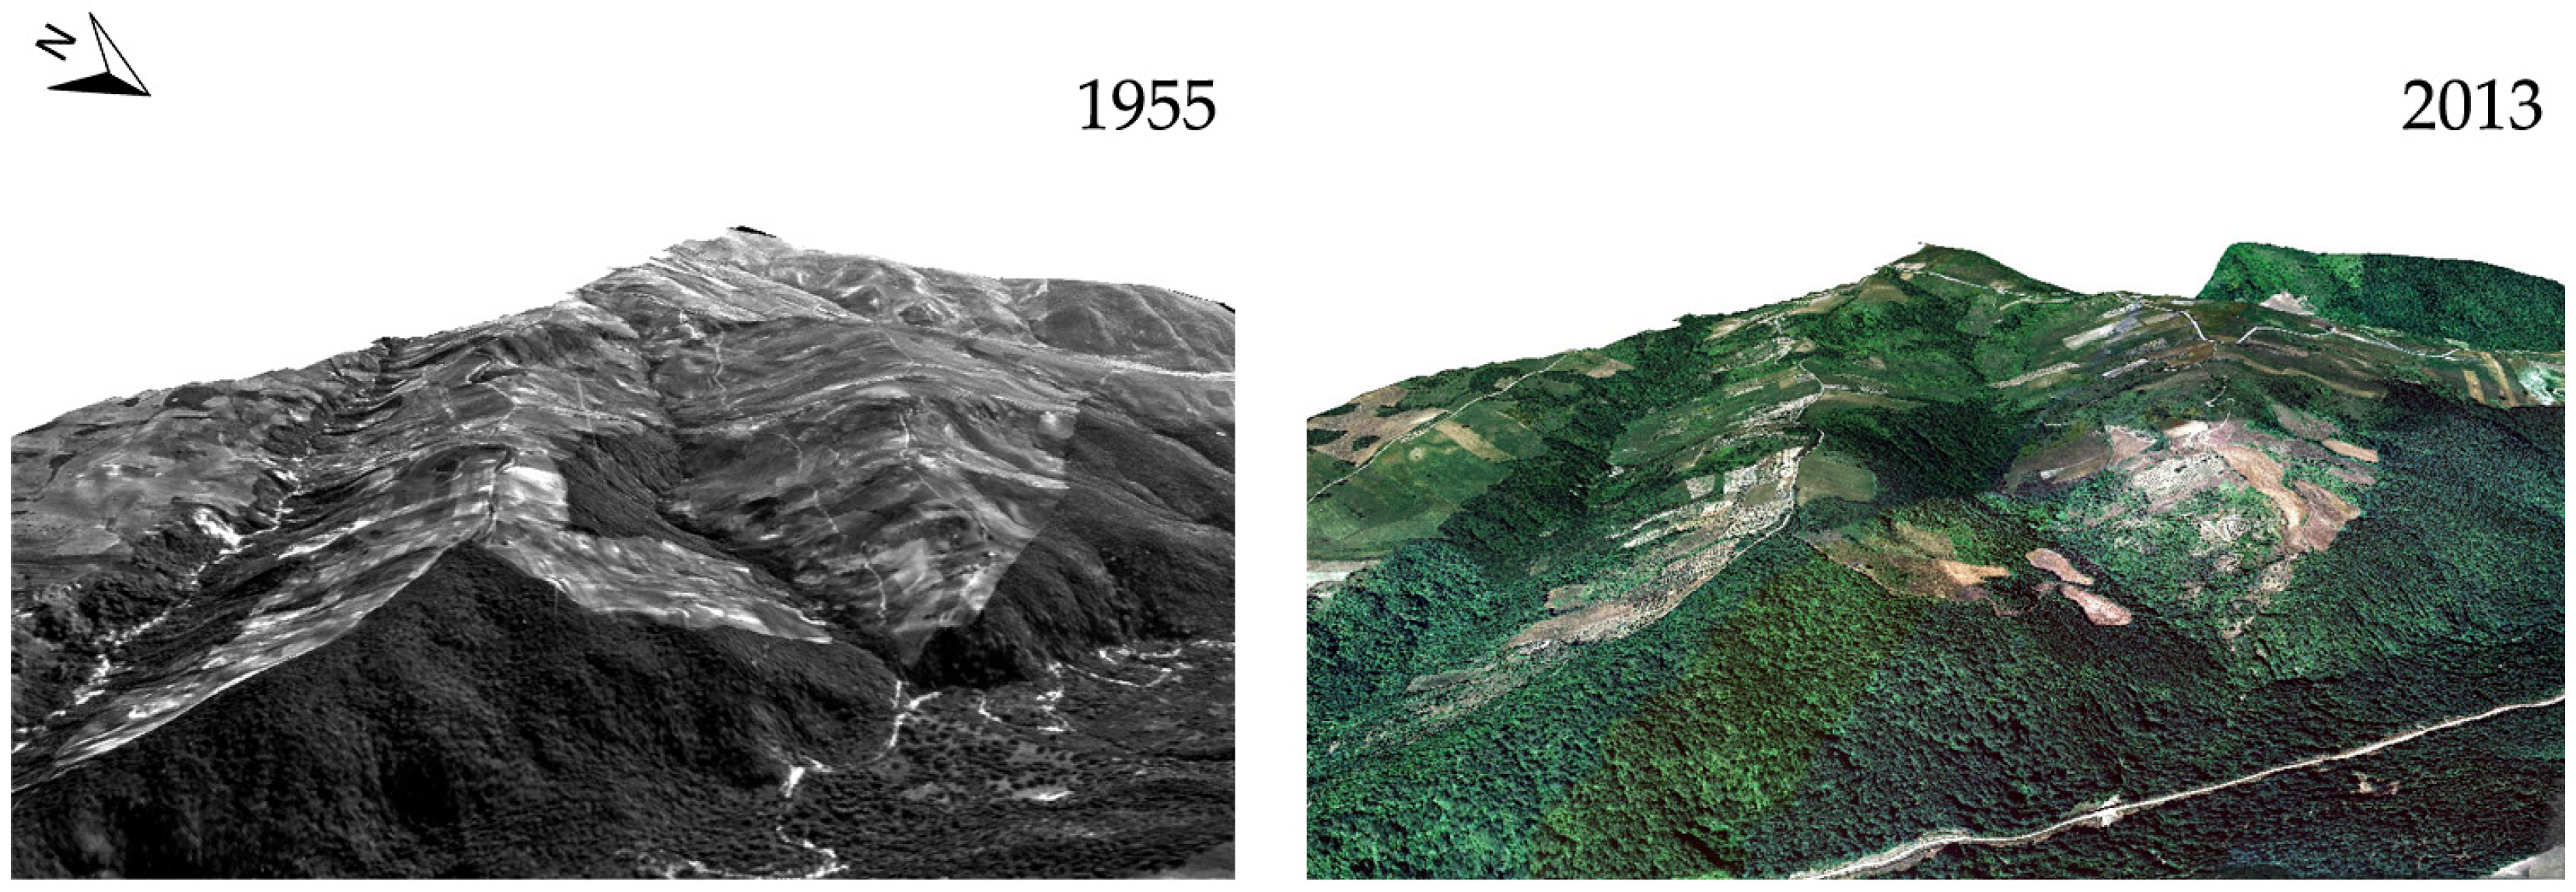
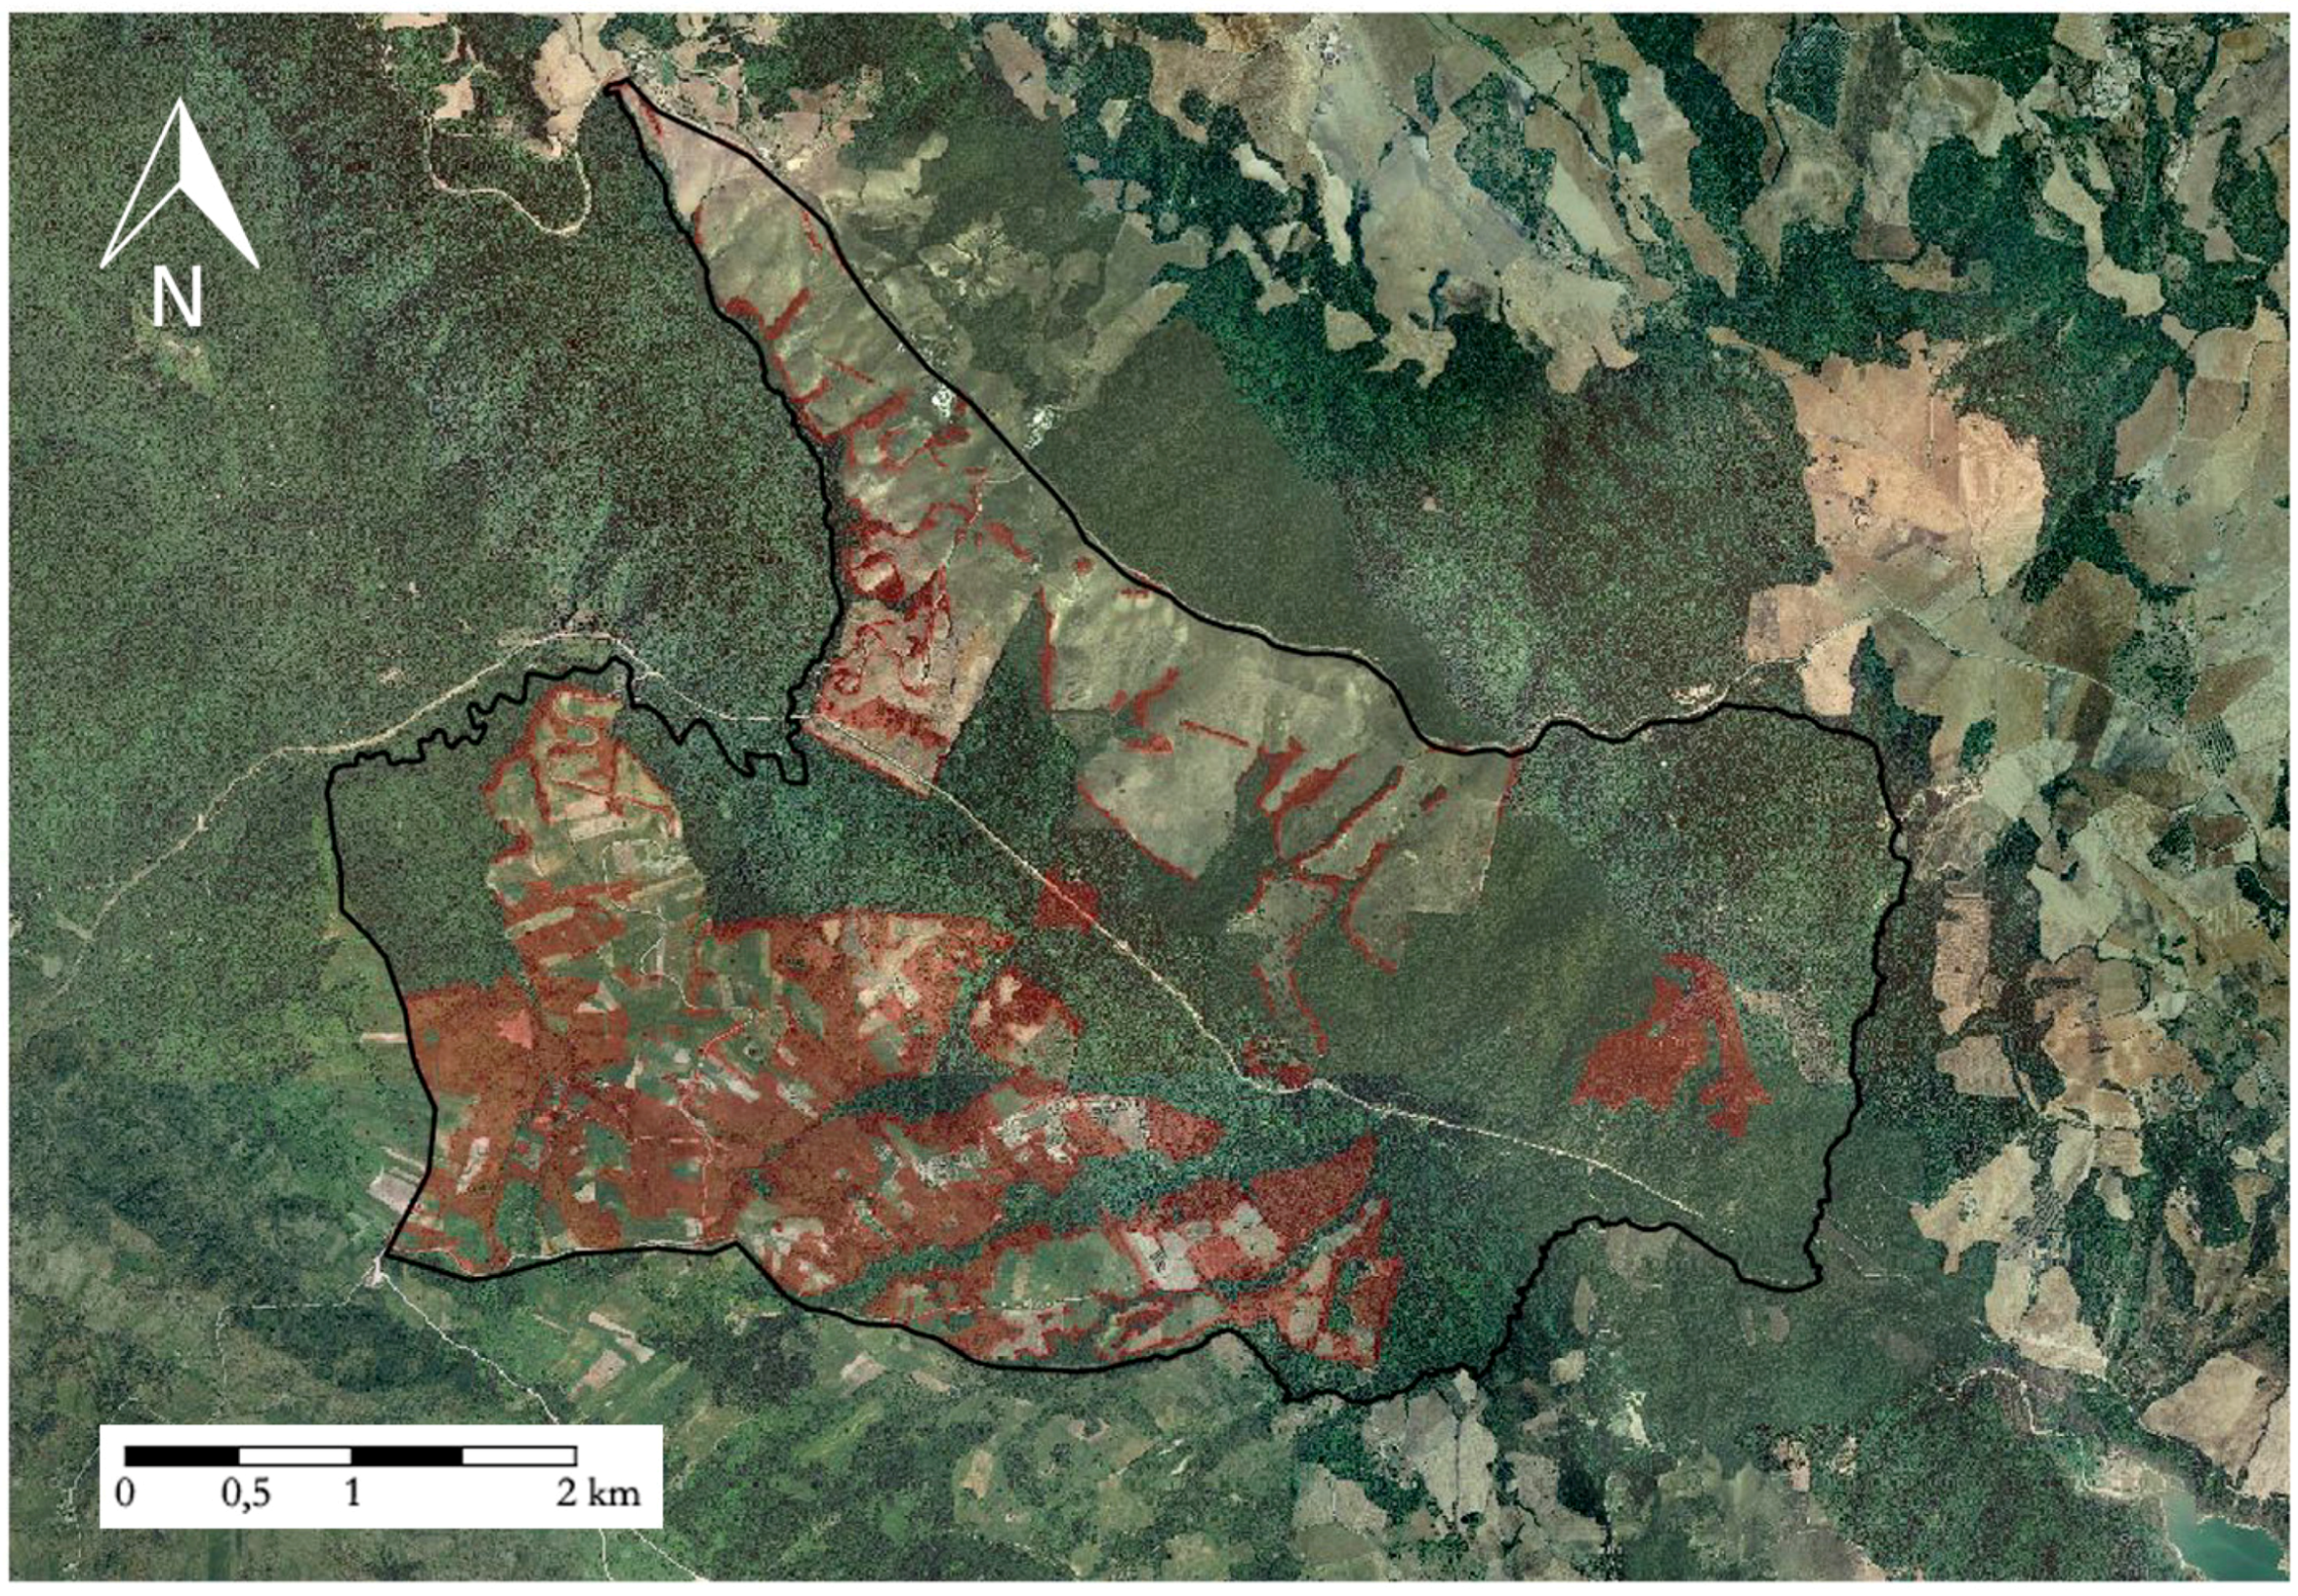
Starting from the DTM of years 1876 and 1955, a slope map was created (in percentage). This type of map has been used to correlate agricultural activities with the topography of the study area and, therefore, to identify the reasons that have influenced the landscape variation over time. This type of analysis shows that about 90% of the arable land occupied a surface with a slope less than 25% (moderately steep class) in 1876. Instead, in the 1955 this value decreased to 59%, and then increased again to 78% in 2013. Figure 6 shows a hypothetical virtual orthophoto, obtained with a cross-comparison between the land use categories in the year 1955 and in 2013; it is realized by using photo-mosaic and photo-editing processes. Finally, for each year, all cartographic support and the thematic maps have been overlaid on DTM to allow a three-dimensional reconstruction of the landscape over the years. In Figure 8 it is possible to notice the land transition from agricultural activities into natural areas in the period from 1955 to 2013.
4. Discussion
The analysis showed that in 1820 the landscape of the study area was mainly dominated by oak woods, with areas with a lower forest density canopy, where grazing was the predominant agricultural activity of Forenza municipality. The importance of this activity, in particular of sheep livestock, was reported in historical documents as well as in thematic cartography (food products map of the Kingdom of Two Sicilie’s continental provinces, 1859). Moreover, arable land was restricted around farms. The road network was not very extensive, since it was limited to a network of paths used for the connection between the neighbouring municipalities and farms. In 1829, the river was an important element for agriculture and livestock because some roads were parallel to its course, and its extension was higher than other years. After 47 years, during 1876, there was an increase of agricultural land due to higher food demand from the Forenza municipality population, which was gradually increasing. Arable lands were only extended nearby the main road network, where there were flatter and easily accessible areas.
Woodlands which, in addition, including natural meadows and transitional areas, still covered the most part of the study area at the time, were starting to become a source of income for the population, which carried out some intensive clear-cut (thanks to Bourbon forestry law that allowed deforestation with the release of 60 seed trees per hectare) aimed to solve economic problems.
After the Second World War, the landscape was significantly modified thanks to a general improvement of economic conditions and due to specific reforms targeted at the south of Italy, which resulted in radical changes in land management. In fact, land use was heavily influenced by the “Land reform”, having among its objectives the qualitative and quantitative improvement in land use and equity for farmers [36]. The arrival of extensive agriculture, the improvement of cultivation techniques, and public financing involved a change in the landscape structure, because marginal and steep areas were then cultivated. Consequently, with the increase of agricultural activities, roads and buildings have almost doubled. The current trend, as demonstrated by the analysis of land use in the 2013, showed a progressive decrease in the agricultural areas to the benefit of natural vegetation, that growth over the years, having spontaneously covered areas that, in the past, were cultivated. This phenomenon has steadily increased over the past decades, i.e., with the development of the so-called “set-aside” EU regime (EEC Regulation 1272/88) by the Common Agricultural Policy (CAP) aimed to control the overproduction of cereals and other crops, in order to avoid an excessive reduction in agricultural prices [37]. Agricultural land use change is often one of the causes, but it is not always possible to identify proximate causes for the agricultural change itself, except for urbanization and the development of natural areas [38].
The analysis has allowed an assessment of the land use evolution, on landscape changes and environmental modifications over the 184 years that were investigated in terms of vegetation, environmental, and visual impact. In 1829, the landscape was dominated by oak wood in which, especially in the area near the farms and the river, the cattle could graze. From an environmental viewpoint, pastures did not cause significant problems, since they were not intensive (i.e., wooded pastures), involving about 29% of the study area. Therefore, the forested areas were the main component of the landscape, more important than in the years 1955 and 2013, in which woodland covered, respectively, only about 41% and 47% of the study area. The environmental and landscape quality also are demonstrated by the low impact that human activities had on this area: low-intensity agricultural land use, agricultural activities more suitable within the local territorial context, as well as a limited areal extent affected by rural settlements.
The increase of the population’s needs, from an economic point of view, triggered landscape changes, and the study area was transformed from a (semi-)natural zone to an agricultural area. From 1876 to 1955, this over-exploitation of the forest resources has led to negative impacts on the landscape and the environment, with a significant change of its features. Using three-dimensional modelling, it has been possible to verify that land use changes and deforestation had resulted in significant modifications in the visual aspect of the rural landscape, since the forested areas of 1829 were partly replaced by arable lands (Figure 7).
Currently the area is covered by a conifer plantation (40 ha) planted during the 1960s to protect the soil, to reinforce the slopes, and to reduce the water runoff in mountainous and hilly areas [39].
A spatial overlay of the various areas, and in particular woodland, has made it possible to identify the areas that during the time period examined (i.e., 184 years) have never changed. Some degree of natural succession of vegetation has taken place depending on the time of abandonment. Species have reached considerable size and there has been a large build-up of biomass. In the last few years a decline in the vernacular farm buildings (“masserie”) has been observed due to the abandonment of agriculture and the changes in their character. In fact, small producers have disappeared (single families) and large owners living far from that area have bought many cultivated land. This has unfortunately led to an important increase in abandoned buildings, which have considerable historical and architectural value.
5. Conclusions
In the last decades the area of Forenza has undergone significant land use changes. The rural landscape was subjected to significant, and often damaging, modifications in addition to changes resulting from new agricultural and environmental policies. These dynamics, in order to be correctly assessed, require detailed studies, advanced by computer technologies that can be used as decisive tools for the creation of appropriate instruments for the representation and simultaneous management of all landscape aspects. GIS allows the implementation of historical models, for quantitative and qualitative studies, in order to understand the evolution of landscape, with the aim to address appropriate spatial planning, as well as proper land use management policies. In this paper the historical analysis showed that significant changes occurred in terms of land use, during a period of about two centuries.
Compared to the situation in 1829, the natural area of Forenza municipality decreased, overall. However, during the last decades the re-vegetation of the abandoned agricultural areas occurred, a common phenomenon widespread in the south of Italy and, particularly, in the Basilicata region. Many studies show the consequences of the grassland, pastures and woodland recovery after land abandonment. The major problems related to this phenomenon have been identified: biodiversity loss, increase of fire frequency and intensity, soil erosion; and desertification, loss of cultural and/or aesthetic values, reduction of landscape diversity and of water provision [25,40]. The extraordinary properties of representation offered by GIS technologies increase the perception of the study areas and improve the informational aspects and the opportunities of visual simulation of the land use evolution.
The approach which was implemented herein may be equally applied to other areas in the Eastern Mediterranean in which there is the availability of datasets which could be analysed within a GIS, so as to assess the changes that have occurred over time in those landscapes. The areas of Eastern Mediterranean basin are indeed being profoundly transformed by human activity [40]. Agricultural lands, evergreen woodlands and maquis habitats, that dominate the present landscape of the Mediterranean basin, are the result of anthropogenic disturbances over millennia [41]. Many common factors contribute to landscape modifications: the abandonment of the countryside in the last decades is due to socio-economic changes occurred during the last decades; these changes were linked with the shift from traditional agricultural systems, characterized by a high landscape complexity, to new agricultural schemes supported by modern technology [42]. The comparison between past and present land use represents a straightforward approach for identifying landscape changes and quantifying the relationships among anthropogenic, agricultural, and forest systems, as well as fostering sound land use policies to other regions and local situations in this common territorial context.
Author Contributions
The design and conduct of this research is equally shared among the authors, who jointly performed the bibliographic analysis, the experimental study, and the discussion of the results.
Conflicts of Interest
The authors declare no conflict of interest.
References
- Rescia, A.J.; Willaarts, A.B.; Schmitz, M.F.; Aguilera, P.A. Changes in land uses and management in two Nature Reserves in Spain: Evaluating the social-ecological resilience of cultural landscapes. Landsc. Urban Plan. 2010, 98, 26–35. [Google Scholar] [CrossRef]
- Statuto, D.; Tortora, A.; Picuno, P. Spatial modeling and image processing of historical maps for rural landscape planning. In Proceedings of the International Conference of Agricultural Engineering-EurAgEng 2014, Zurich, Switzerland, 6–10 July 2014. [Google Scholar]
- Pelorosso, R.; Leone, A.; Boccia, L. Land cover and land use change in the Italian central Apennines: A comparison of assessment methods. Appl. Geogr. 2009, 29, 35–48. [Google Scholar] [CrossRef]
- Schneeberger, N.; Bürgi, M.; Kienast, P.D.F. Rates of landscape change at the northern fringe of the Swiss Alps: Historical and recent tendencies. Landsc. Urban Plan. 2007, 80, 127–136. [Google Scholar] [CrossRef]
- Yeh, C.T.; Huang, S.L. Investigating spatiotemporal patterns of landscape diversity in response to urbanization. Landsc. Urban Plan. 2009, 93, 151–162. [Google Scholar] [CrossRef]
- Statuto, D.; Tortora, A.; Picuno, P. Analysis of the evolution of landscape and land use in a GIS approach. In Proceedings of the First International Symposium Article on Agricultural Engineering—ISAE 2013, Session VI, Belgrade, Serbia, 4–6 October 2013; pp. 25–33. [Google Scholar]
- Mutoko, M.C.; Hein, L.; Bartholomeus, H. Integrated analysis of land use changes and their impacts on agrarian livelihoods in the western highlands of Kenya. Agric. Syst. 2014, 128, 1–12. [Google Scholar] [CrossRef]
- Tveit, M.; Ode, A.; Fry, G. Key visual concepts in a framework for analyzing visual landscape character. Landsc. Res. 2006, 31, 229–255. [Google Scholar] [CrossRef]
- Franch-Pardo, I.; Cancer-Pomar, L.; Napoletano, B.M. Visibility analysis and landscape evaluation in Martin river cultural park (Aragon, Spain) integrating biophysical and visual units. J. Maps 2017, 2, 415–424. [Google Scholar] [CrossRef]
- Domon, G. Landscape as resource: Consequences, challenges and opportunities for rural development. Landsc. Urban Plan. 2011, 100, 338–340. [Google Scholar] [CrossRef]
- Ales, R.F.; Martin, A.; Ortega, F.; Ales, E. Recent changes in landscape structure and function in a Mediterranean region of SW Spain (1950–1984). Landsc. Ecol. 1992, 7, 3–18. [Google Scholar] [CrossRef]
- García-Ruiz, J.M.; Lasanta, T.; Ruiz-Flano, P.; Ortigosa, L.; White, S.; Gonzales, C.; Martì, C. Land-use changes and sustainable development in mountain areas: A case study in the Spanish Pyrenees. Landsc. Ecol. 1996, 11, 267–277. [Google Scholar] [CrossRef]
- Debussche, M.; Lepart, J.; Dervieux, A. Mediterranean landscape changes: Evidence from old postcards. Glob. Ecol. Biogeogr. 1999, 8, 3–15. [Google Scholar] [CrossRef]
- MacDonald, D.; Crabtree, J.R.; Wiesinger, G.; Dax, T.; Stamou, N.; Fleury, P.; GutierrexLazpita, J.; Gibon, A. Agriculture abandonment in mountain areas of Europe: Environmental consequences and policy response. J. Environ. Manag. 2000, 59, 47–69. [Google Scholar] [CrossRef]
- Santos, C.P. Succession of breeding bird communities after the abandonment of agricultural fields in southeast, Portugal. Ardeola 2000, 47, 171–181. [Google Scholar]
- Lambin, E.F.; Geist, H.J.; Lepers, E. Dynamics of land use and land cover change in tropical regions. Annu. Rev. Environ. Resour. 2003, 28, 205–241. [Google Scholar] [CrossRef]
- Covas, R.; Blondel, J. Biogeography and history of the Mediterranean bird fauna. Ibis 1998, 140, 395–407. [Google Scholar] [CrossRef]
- Picuno, P.; Tortora, A.; Capobianco, R.L. Analysis of plasticulture landscapes in Southern Italy through remote sensing and solid modelling. Landsc. Urban Plan. 2011, 100, 45–56. [Google Scholar] [CrossRef]
- Statuto, D.; Tortora, A.; Picuno, P. A GIS approach for the quantification of forest and agricultural biomass in the Basilicata region. J. Agric. Eng. 2013, XLIV, 627–631. [Google Scholar] [CrossRef]
- Statuto, D.; Picuno, P. Valorisation of vernacular farm buildings for the sustainable development of rural tourism in mountain areas of the Adriatic-Ionian macro-region. J. Agric. Eng. 2017, 48, 21–26. [Google Scholar] [CrossRef]
- De Philippis, A. Classificazione ed Indici del Clima in Rapporto Alla Vegetazione Forestale Italiana; Società Botanica Italiana: Firenze, Italy, 1937. [Google Scholar]
- Blakemore, M.J.; Harley, J.B. Concepts in the history of cartography. A review and perspective. Cartographica 1980, 17, 1–120. [Google Scholar]
- Laxton, P. The Geodetic and topographical evaluation of English county maps, 1740–1840. Cartogr. J. 1976, 13, 37–54. [Google Scholar] [CrossRef]
- Jenny, B.; Hurni, L. Studying cartographic heritage: Analysis and visualization of geometric distortions. Comput. Graph. 2011, 35, 402–411. [Google Scholar] [CrossRef]
- Tortora, A.; Statuto, D.; Picuno, P. Rural landscape planning through spatial modelling and image processing of historical maps. Land Use Policy 2015, 42, 71–82. [Google Scholar] [CrossRef]
- Yang, Y.; Zhang, S.; Yang, J. A review of historical reconstruction methods of land use/land cover. J. Geogr. Sci. 2014, 24, 746–766. [Google Scholar] [CrossRef]
- De Marco, D. La Statistica Del Regno Di Napoli Nel 1811—Volume III (1900); Accademia Naz. dei Lincei: Rome, Italy, 1990; pp. 24–25, 54–59, 228–233, 474–477. [Google Scholar]
- Forenza Municipality. Relazione Sulle Usurpazioni Del Bosco Demaniale Di San Giuliano; Stab. Tipografico “Fulgur”: Potenza, Italy, 1915. [Google Scholar]
- Lafreniere, D.; Rivet, D. Rescaling the Past through Mosaic Historical Cartography. J. Maps 2010, 6, 417–422. [Google Scholar] [CrossRef]
- Boùùaert, M.C.; De Baets, B.; Vervust, S.; Neutens, T.; De Maeyer, P.; Van de Weghe, N. Computation and visualisation of the accuracy of old maps using differential distortion analysis. Int. J. Geogr. Inf. Sci. 2016, 30, 1225–1280. [Google Scholar]
- Statuto, D.; Cillis, G.; Picuno, P. Analysis of the effects of agricultural land use change on rural environment and landscape through historical cartography and GIS tools. J. Agric. Eng. 2016, 47, 28. [Google Scholar] [CrossRef]
- Lautenbach, S.; Kugel, C.; Lausch, A.; Seppelt, R. Analysis of historic changes in regional ecosystem service provisioning using land use data. Ecol. Indic. 2011, 11, 676–687. [Google Scholar] [CrossRef]
- Kosztra, B.; Arnold, S. Proposal for Enhancement of CLC Nomenclature Guidelines; ETC/SIA Deliverable EEA Subvention 2013 WAI Task 261_1_1: Applying EAGLE Concept to CLC Guidelines Enhancement. European Environment Agency Internal Report; EEA-European Environment Agency: Copenhagen, Denmark, 2013. [Google Scholar]
- Kakiuchi, T.; Chikatsu, H. Reconstruction and visualization of original landscape on reverse mapping. Int. Arch. Photogram. Remote Sens. Spat. Inf. Sci. 2010, 38, 311–315. [Google Scholar]
- Picuno, P. Vernacular farm buildings in landscape planning: A typological analysis in a southern Italian region. J. Agric. Eng. 2012, 43, 130–137. [Google Scholar] [CrossRef]
- Italian Regulations for the Expropriation, Land Reclamation, Processing and Allocation of the Peasants’s Land. G.U. No. 249, 28/10/1950. Law of October 21, No. 841. 1950. Available online: http://www.edizionieuropee.it/LAW/HTML/10/zn2_02_033.html (accessed on 18 September 2017).
- Commission Regulation EEC No. 1272/88 Laying Down Detailed Rules for Applying the Set-Aside Incentive Scheme for Arable Land. Available online: http://research.omicsgroup.org/index.php/Set-aside (accessed on 18 September 2017).
- Van Vliet, J.; de Groot, H.L.F.; Rietveld, P.; Verburg, P.H. Manifestations and underlying drivers of agricultural land use change in Europe. Landsc. Urban Plan. 2015, 133, 24–36. [Google Scholar] [CrossRef]
- Gutzler, C.; Helming, K.; Balla, D.; Dannowski, R.; Deumlich, D.; Glemnitz, M.; Knierim, A.; Mirschel, W.; Nendel, C.; Paul, C.; et al. Agricultural land use changes—A scenario-based sustainability impact assessment for Brandenburg, Germany. Ecol. Indic. 2015, 48, 505–517. [Google Scholar] [CrossRef]
- Geri, F.; Amici, V.; Rocchini, D. Human activity impact on the heterogeneity of a Mediterranean landscape. Appl. Geogr. 2010, 30, 370–379. [Google Scholar] [CrossRef]
- Blondel, J. The ‘design’ of Mediterranean landscapes: A millennial story of humans and ecological systems during the historic period. Hum. Ecol. 2006, 34, 713–729. [Google Scholar] [CrossRef]
- Rühl, J.; Pasta, S.; La Mantia, T. Metodologia per lo studio delle successioni secondarie in ex-coltivi terrazzati: Il Caso studio di Pantelleria (Canale di Sicilia). For. J. Silvic. For. Ecol. 2005, 2, 388–398. [Google Scholar] [CrossRef]
Figure 1.
Location of the study area, coordinates 4517330 N 572110 E, EPSG: 32633-WGS 84/UTM zone 33N.
Figure 1.
Location of the study area, coordinates 4517330 N 572110 E, EPSG: 32633-WGS 84/UTM zone 33N.

Figure 2.
Historical map of the Municipality of Forenza (1829).

Figure 3.
Historical map of the Municipality of Forenza (1876).

Figure 4.
Applied methodology.

Figure 5.
Analysis of land use categories in different periods.

Figure 6.
Spatial analysis of land use categories in different periods.
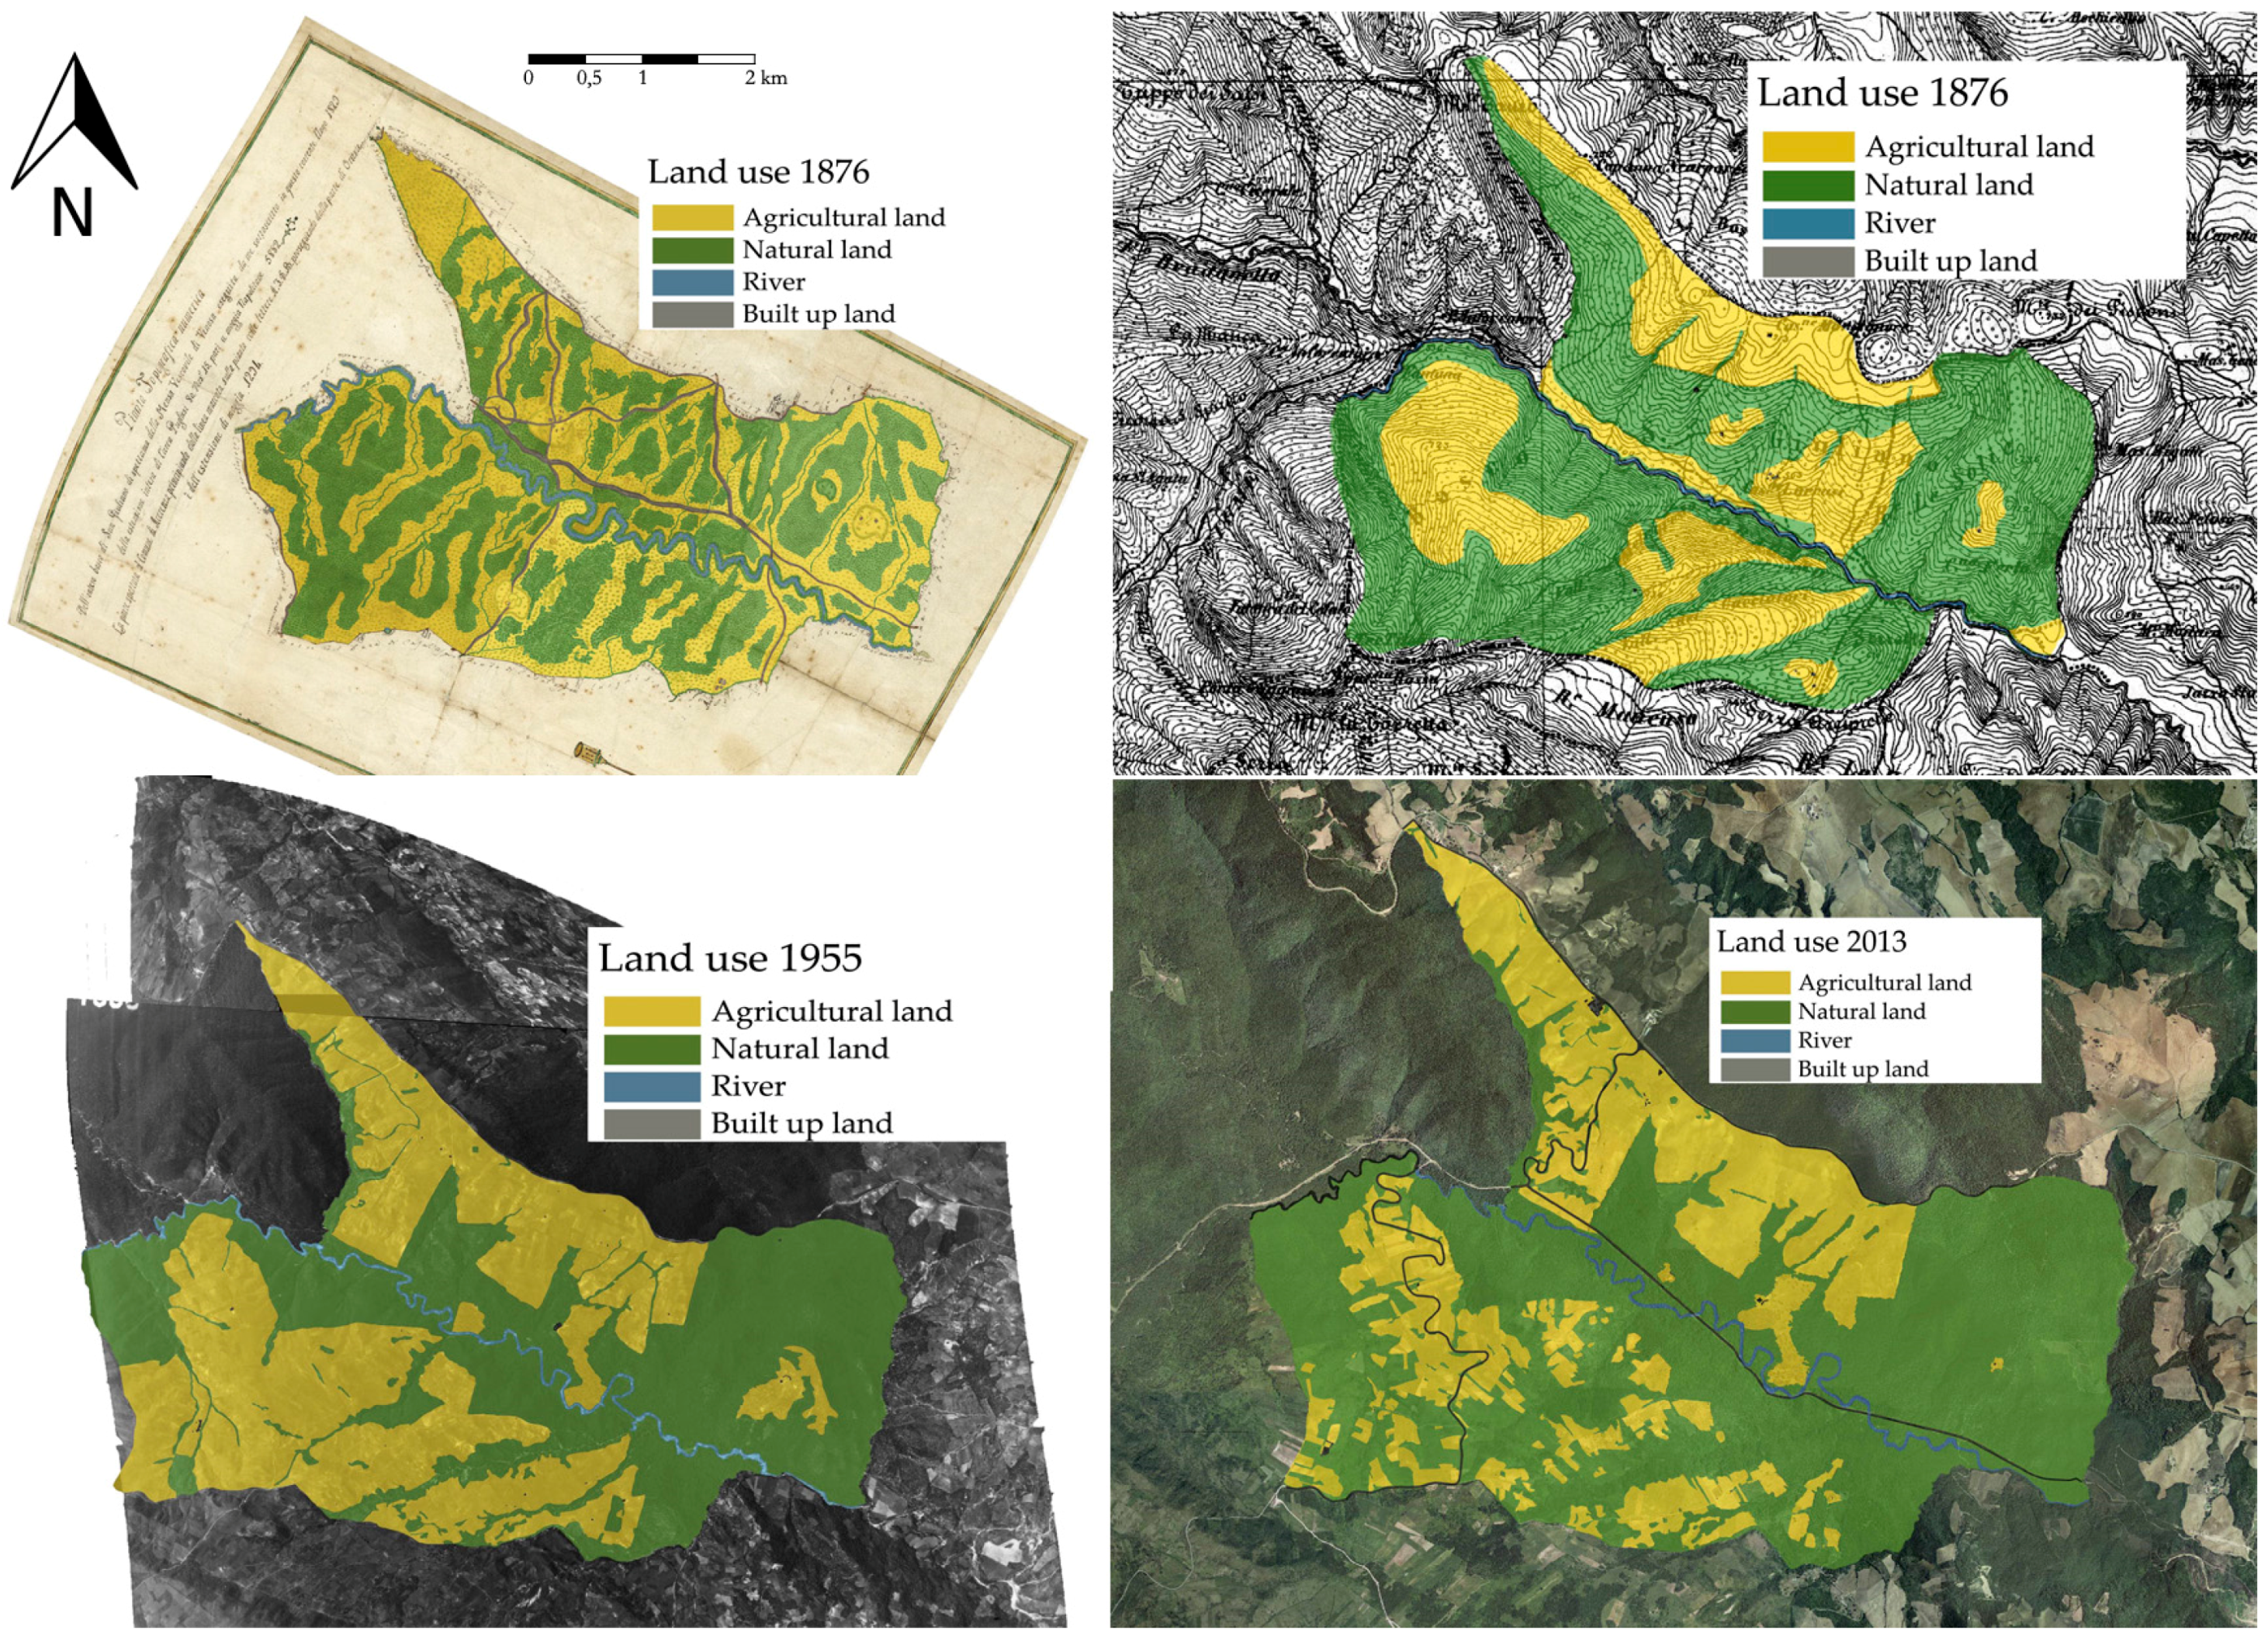
Figure 7.
Three-dimensional visualization of the landscape.

Figure 8.
In red, the land transitions from agricultural activities to natural areas in the period from 1955 to 2013.
Figure 8.
In red, the land transitions from agricultural activities to natural areas in the period from 1955 to 2013.


Table 1.
Analysis of land use categories in percentage (%) and surface (ha).
| Land Use Categories | Years | |||||||
|---|---|---|---|---|---|---|---|---|
| 1829 | 1876 | 1955 | 2013 | |||||
| ha | % | ha | % | ha | % | ha | % | |
| Natural Land | 1206.15 | 66.3 | 1106.55 | 60.9 | 883.94 | 48.6 | 1182.51 | 65.0 |
| Agricultural land | 570.3 | 31.4 | 673.60 | 37.0 | 907.84 | 49.9 | 598.04 | 32.9 |
| River | 40.9 | 2.2 | 36.90 | 2.0 | 25.30 | 1.4 | 19.96 | 1.1 |
| Built up area | 0.8 | 0.0 | 1.10 | 0.1 | 1.07 | 0.1 | 17.64 | 1.0 |
| Total | 1818.15 | 100 | 1818.15 | 100 | 1818.15 | 100 | 1818.15 | 100 |
Table 2.
Variations of the linear extension of the road network and of building number.
| Categories | ||
|---|---|---|
| Years | Road Network (meters) | Building Number (n) |
| 1829 | 22,736 | 13 |
| 1876 | 29,162 | 18 |
| 1955 | 63,862 | 38 |
| 2013 | 69,129 | 55 |
© 2017 by the authors. Licensee MDPI, Basel, Switzerland. This article is an open access article distributed under the terms and conditions of the Creative Commons Attribution (CC BY) license (http://creativecommons.org/licenses/by/4.0/).
Share and Cite
MDPI and ACS Style
Statuto, D.; Cillis, G.; Picuno, P. Using Historical Maps within a GIS to Analyze Two Centuries of Rural Landscape Changes in Southern Italy. Land 2017, 6, 65. https://0-doi-org.brum.beds.ac.uk/10.3390/land6030065
AMA Style
Statuto D, Cillis G, Picuno P. Using Historical Maps within a GIS to Analyze Two Centuries of Rural Landscape Changes in Southern Italy. Land. 2017; 6(3):65. https://0-doi-org.brum.beds.ac.uk/10.3390/land6030065
Chicago/Turabian StyleStatuto, Dina, Giuseppe Cillis, and Pietro Picuno. 2017. "Using Historical Maps within a GIS to Analyze Two Centuries of Rural Landscape Changes in Southern Italy" Land 6, no. 3: 65. https://0-doi-org.brum.beds.ac.uk/10.3390/land6030065
Note that from the first issue of 2016, this journal uses article numbers instead of page numbers. See further details here.