Impact of Soil Depth and Topography on the Effectiveness of Conservation Practices on Discharge and Soil Loss in the Ethiopian Highlands


Abstract
:
1. Introduction
2. Materials and Methods
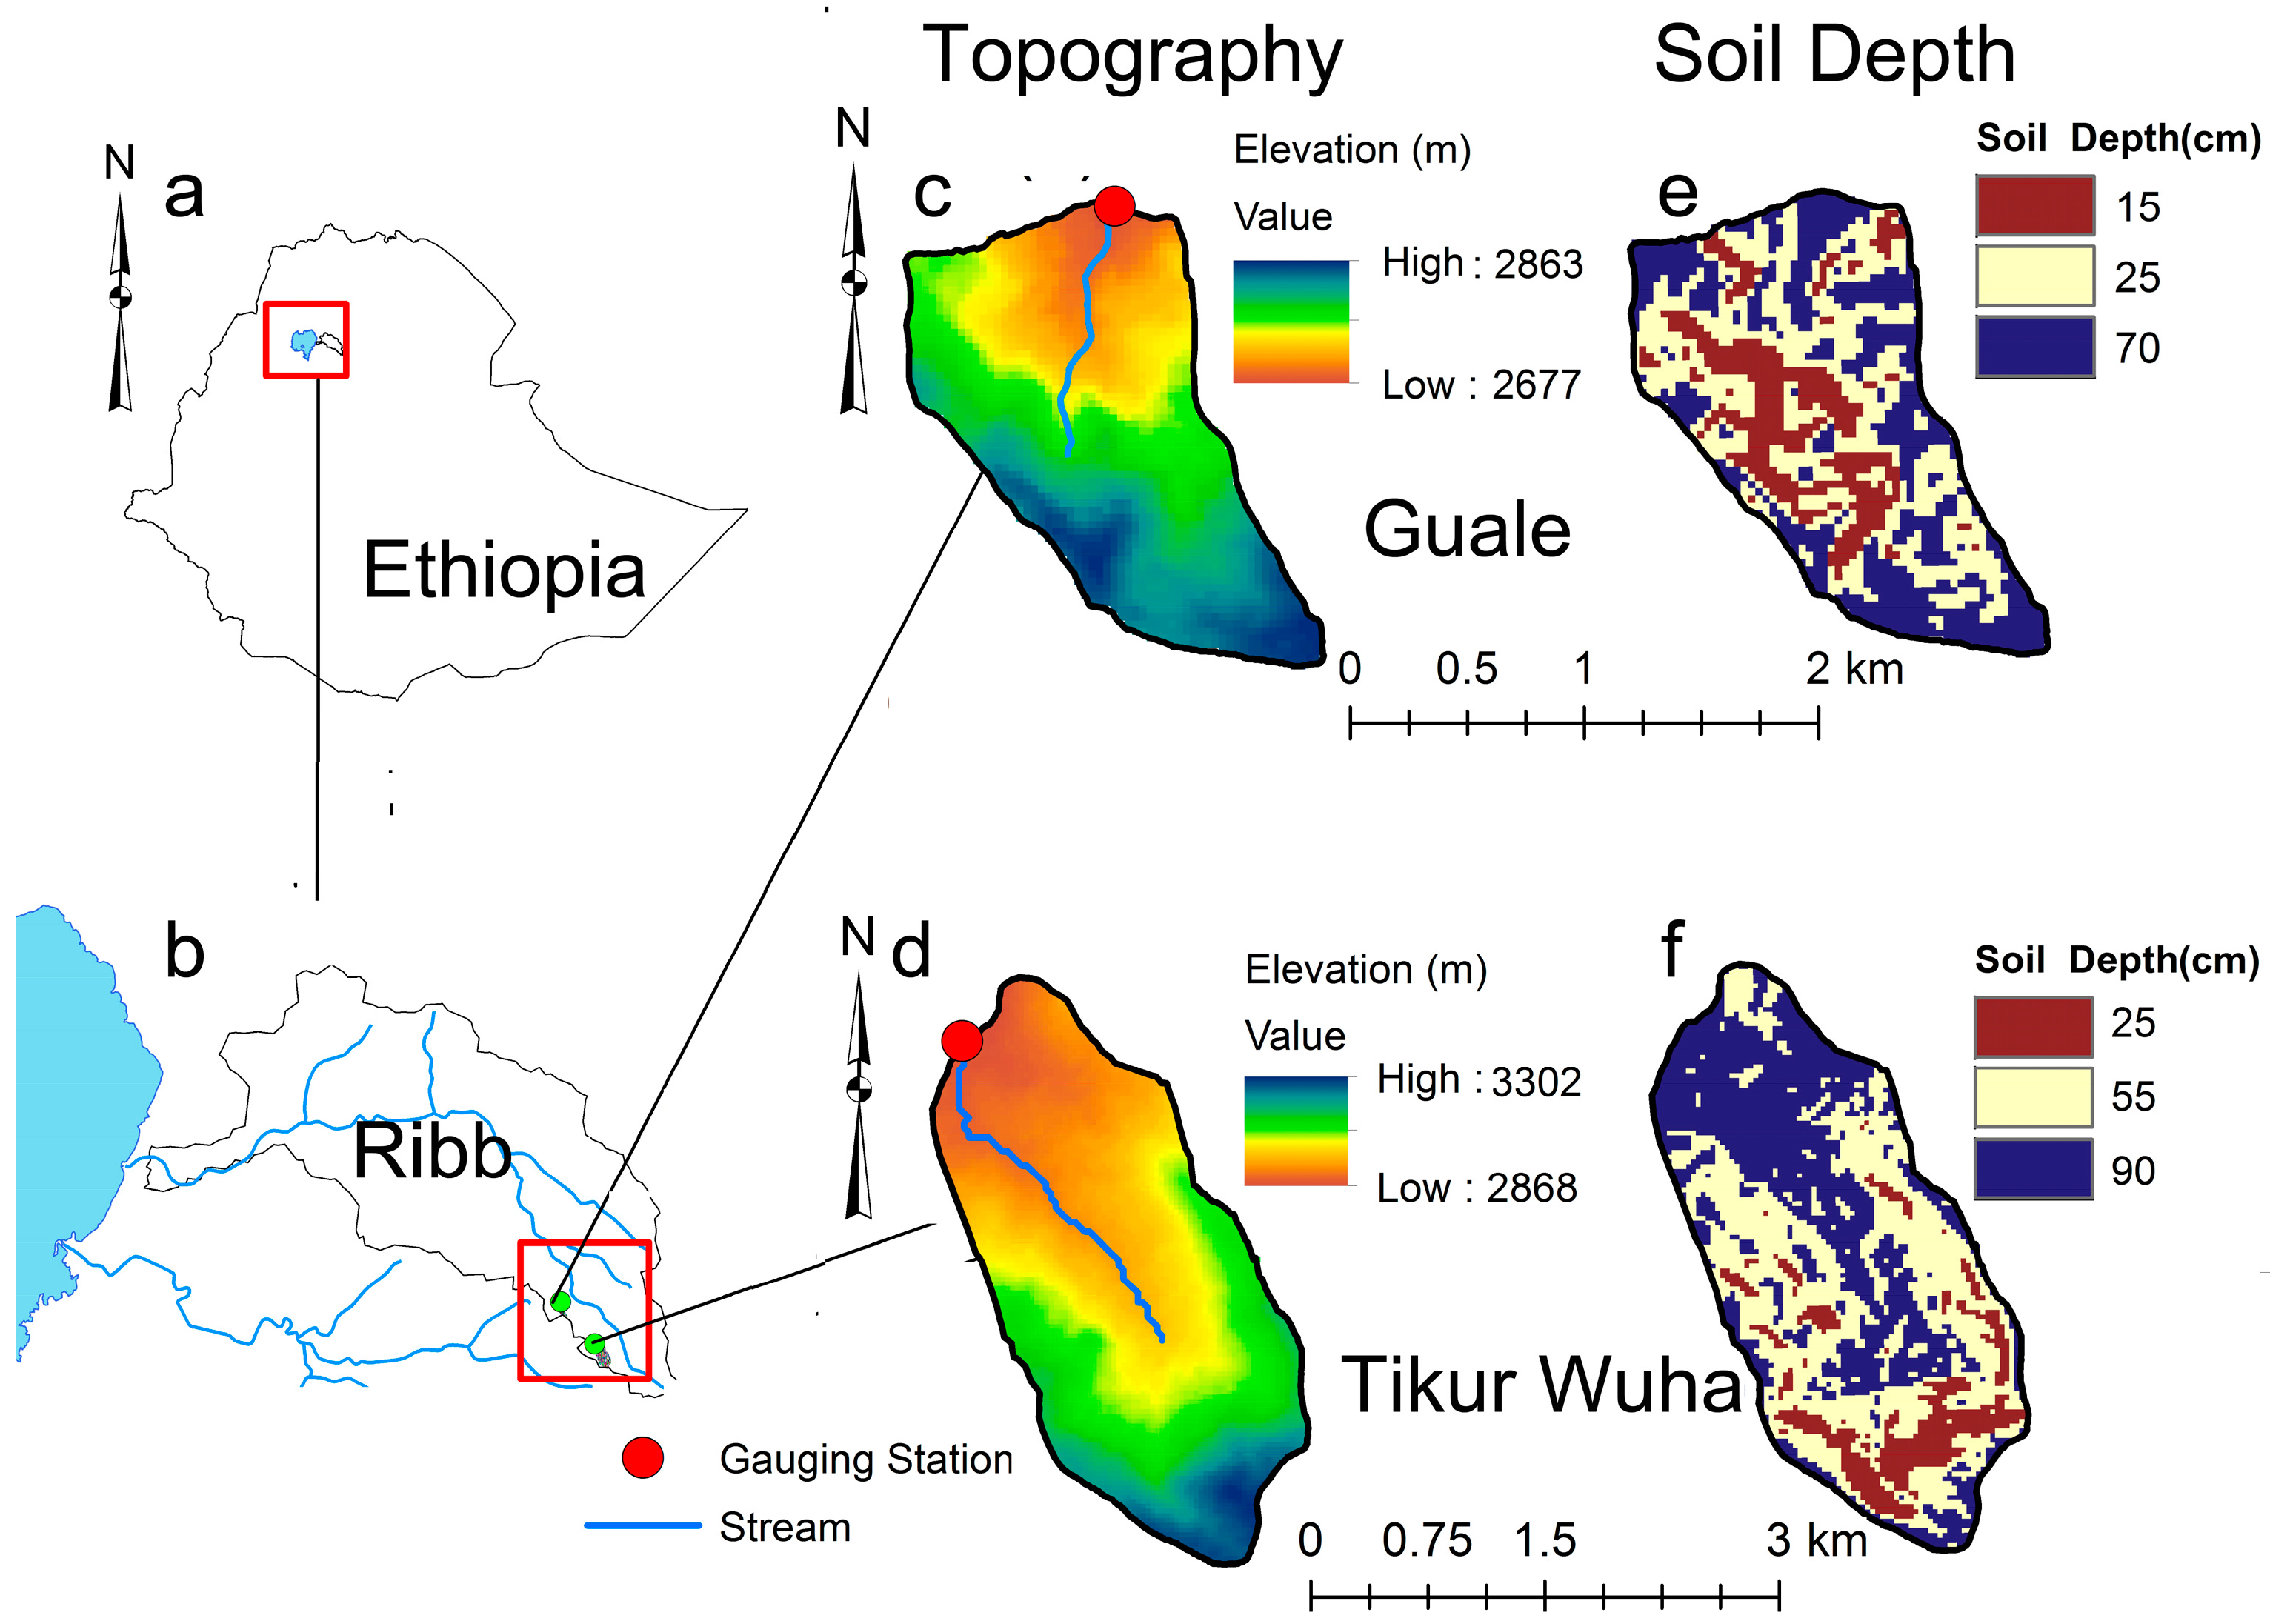
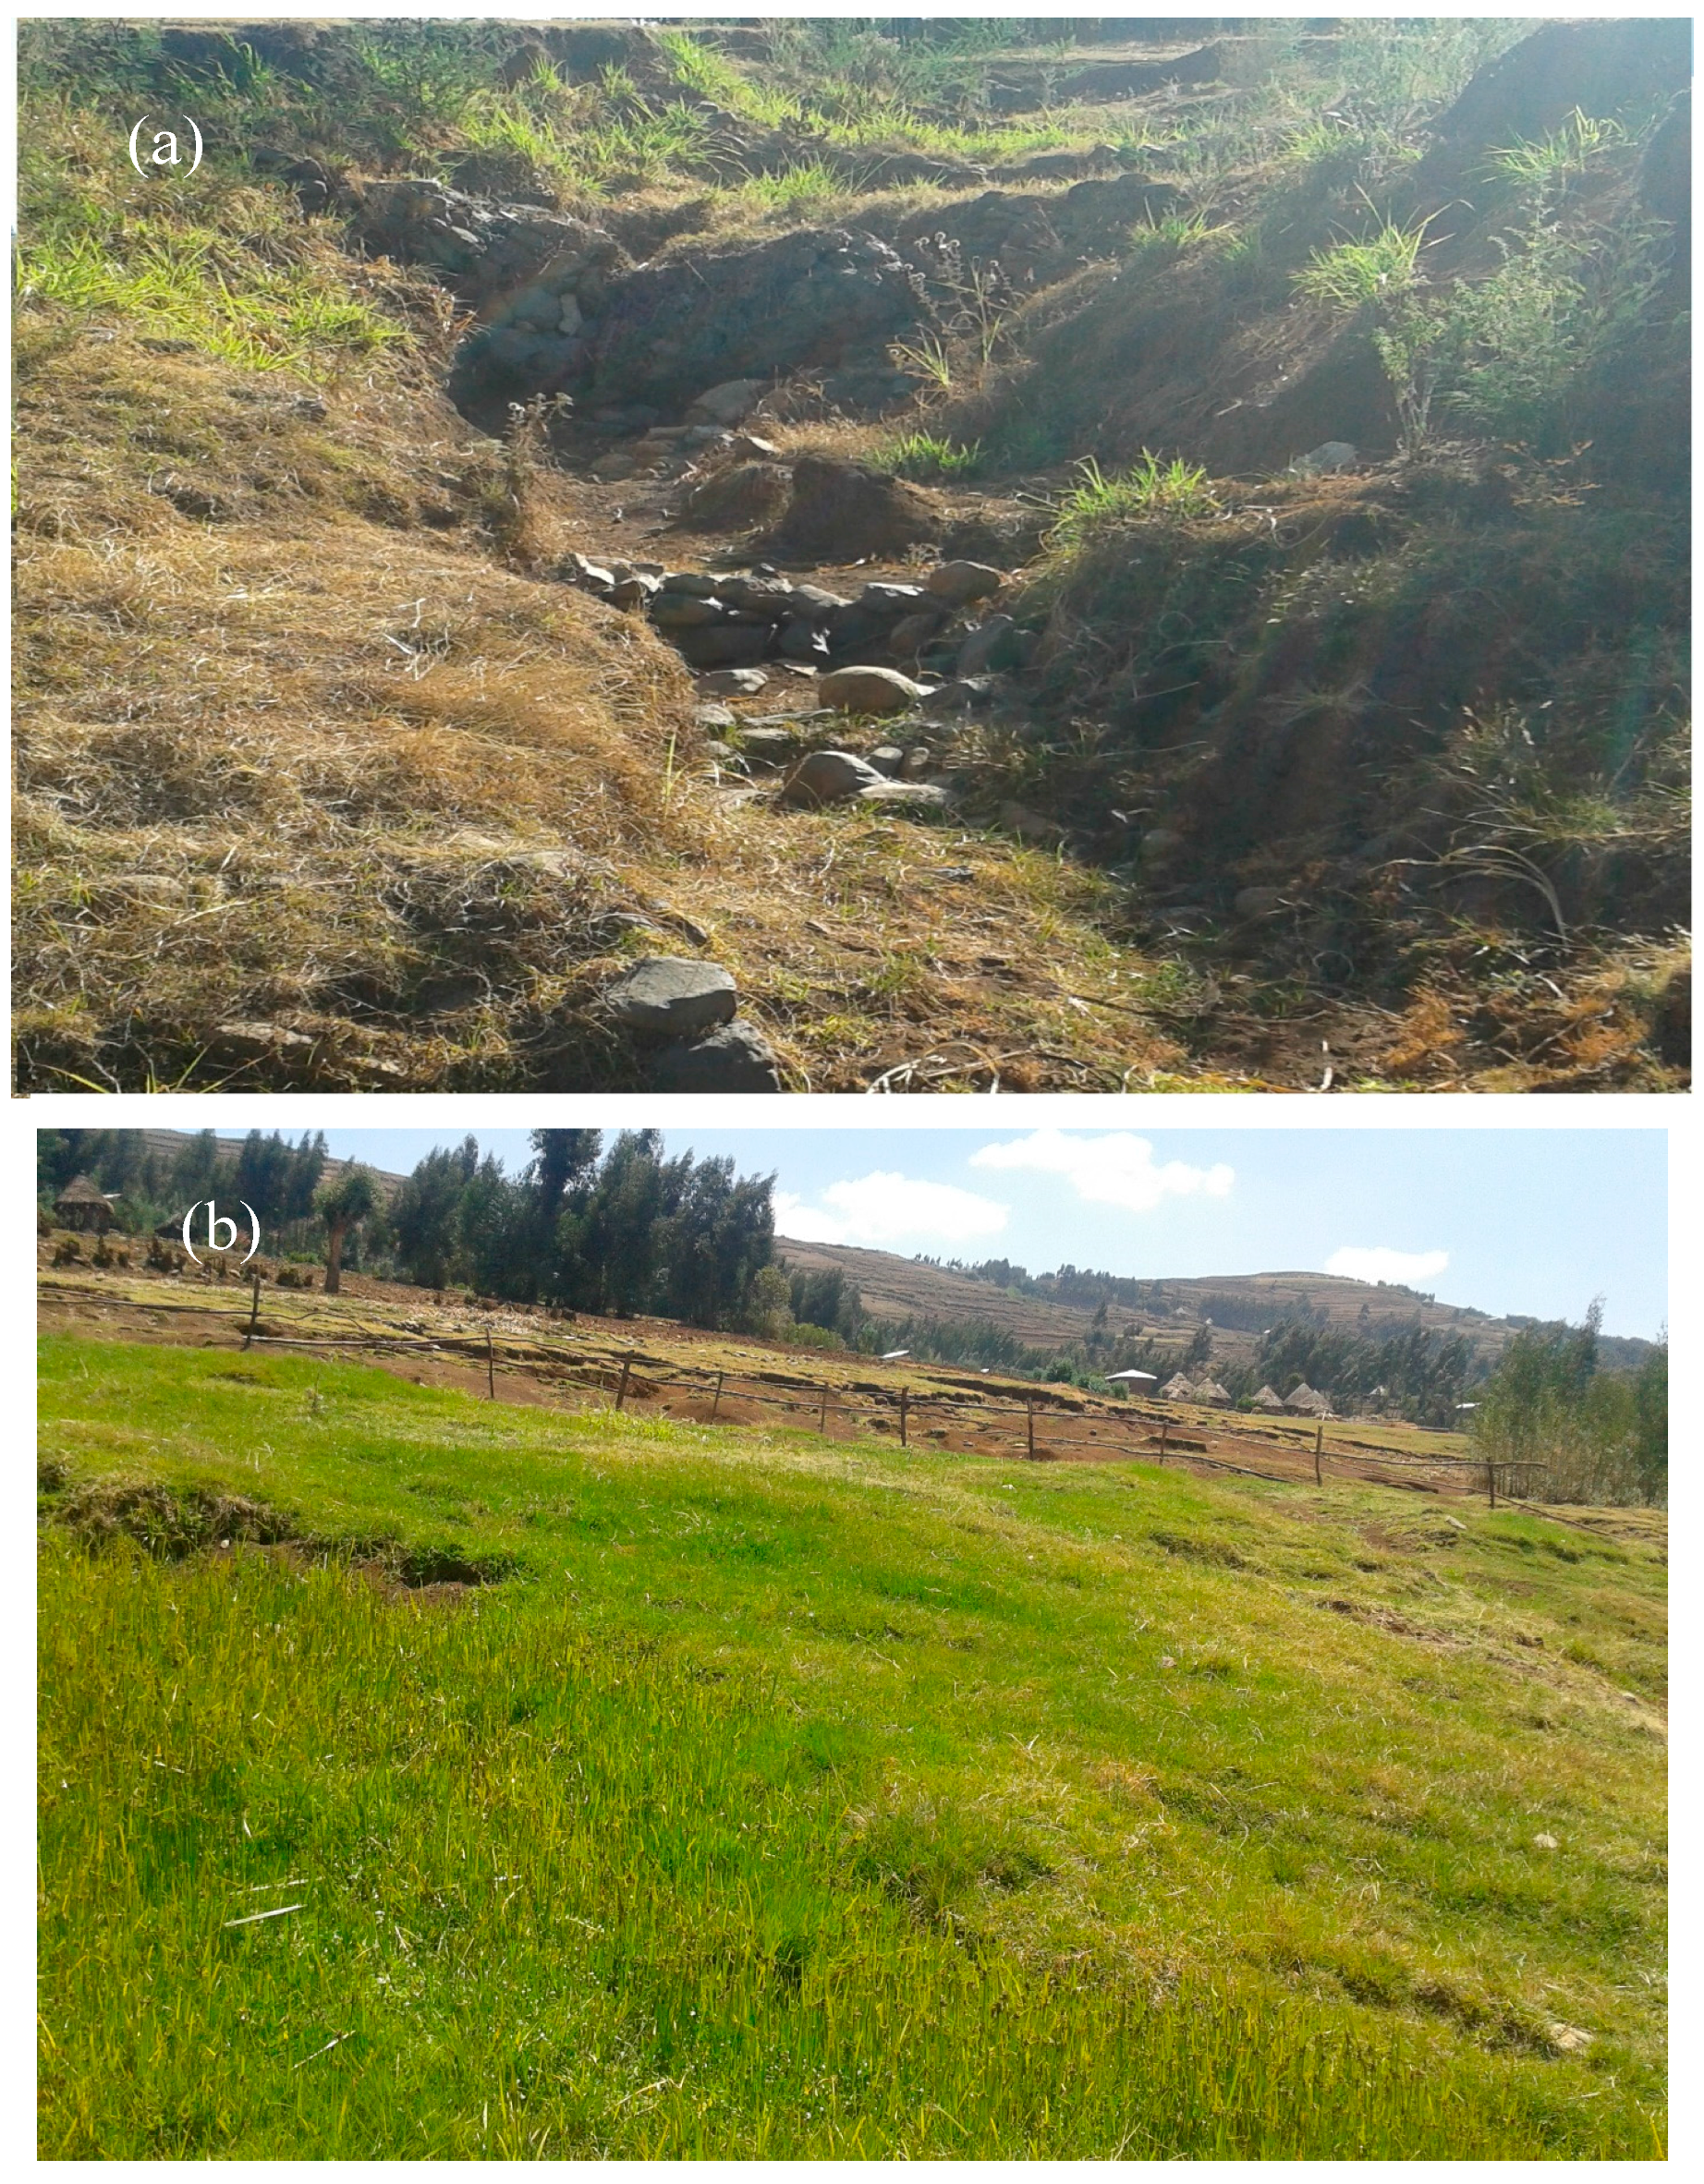
2.1. Description of the Study Area
2.2. Data Collection
2.3. Data Analysis
3. Results
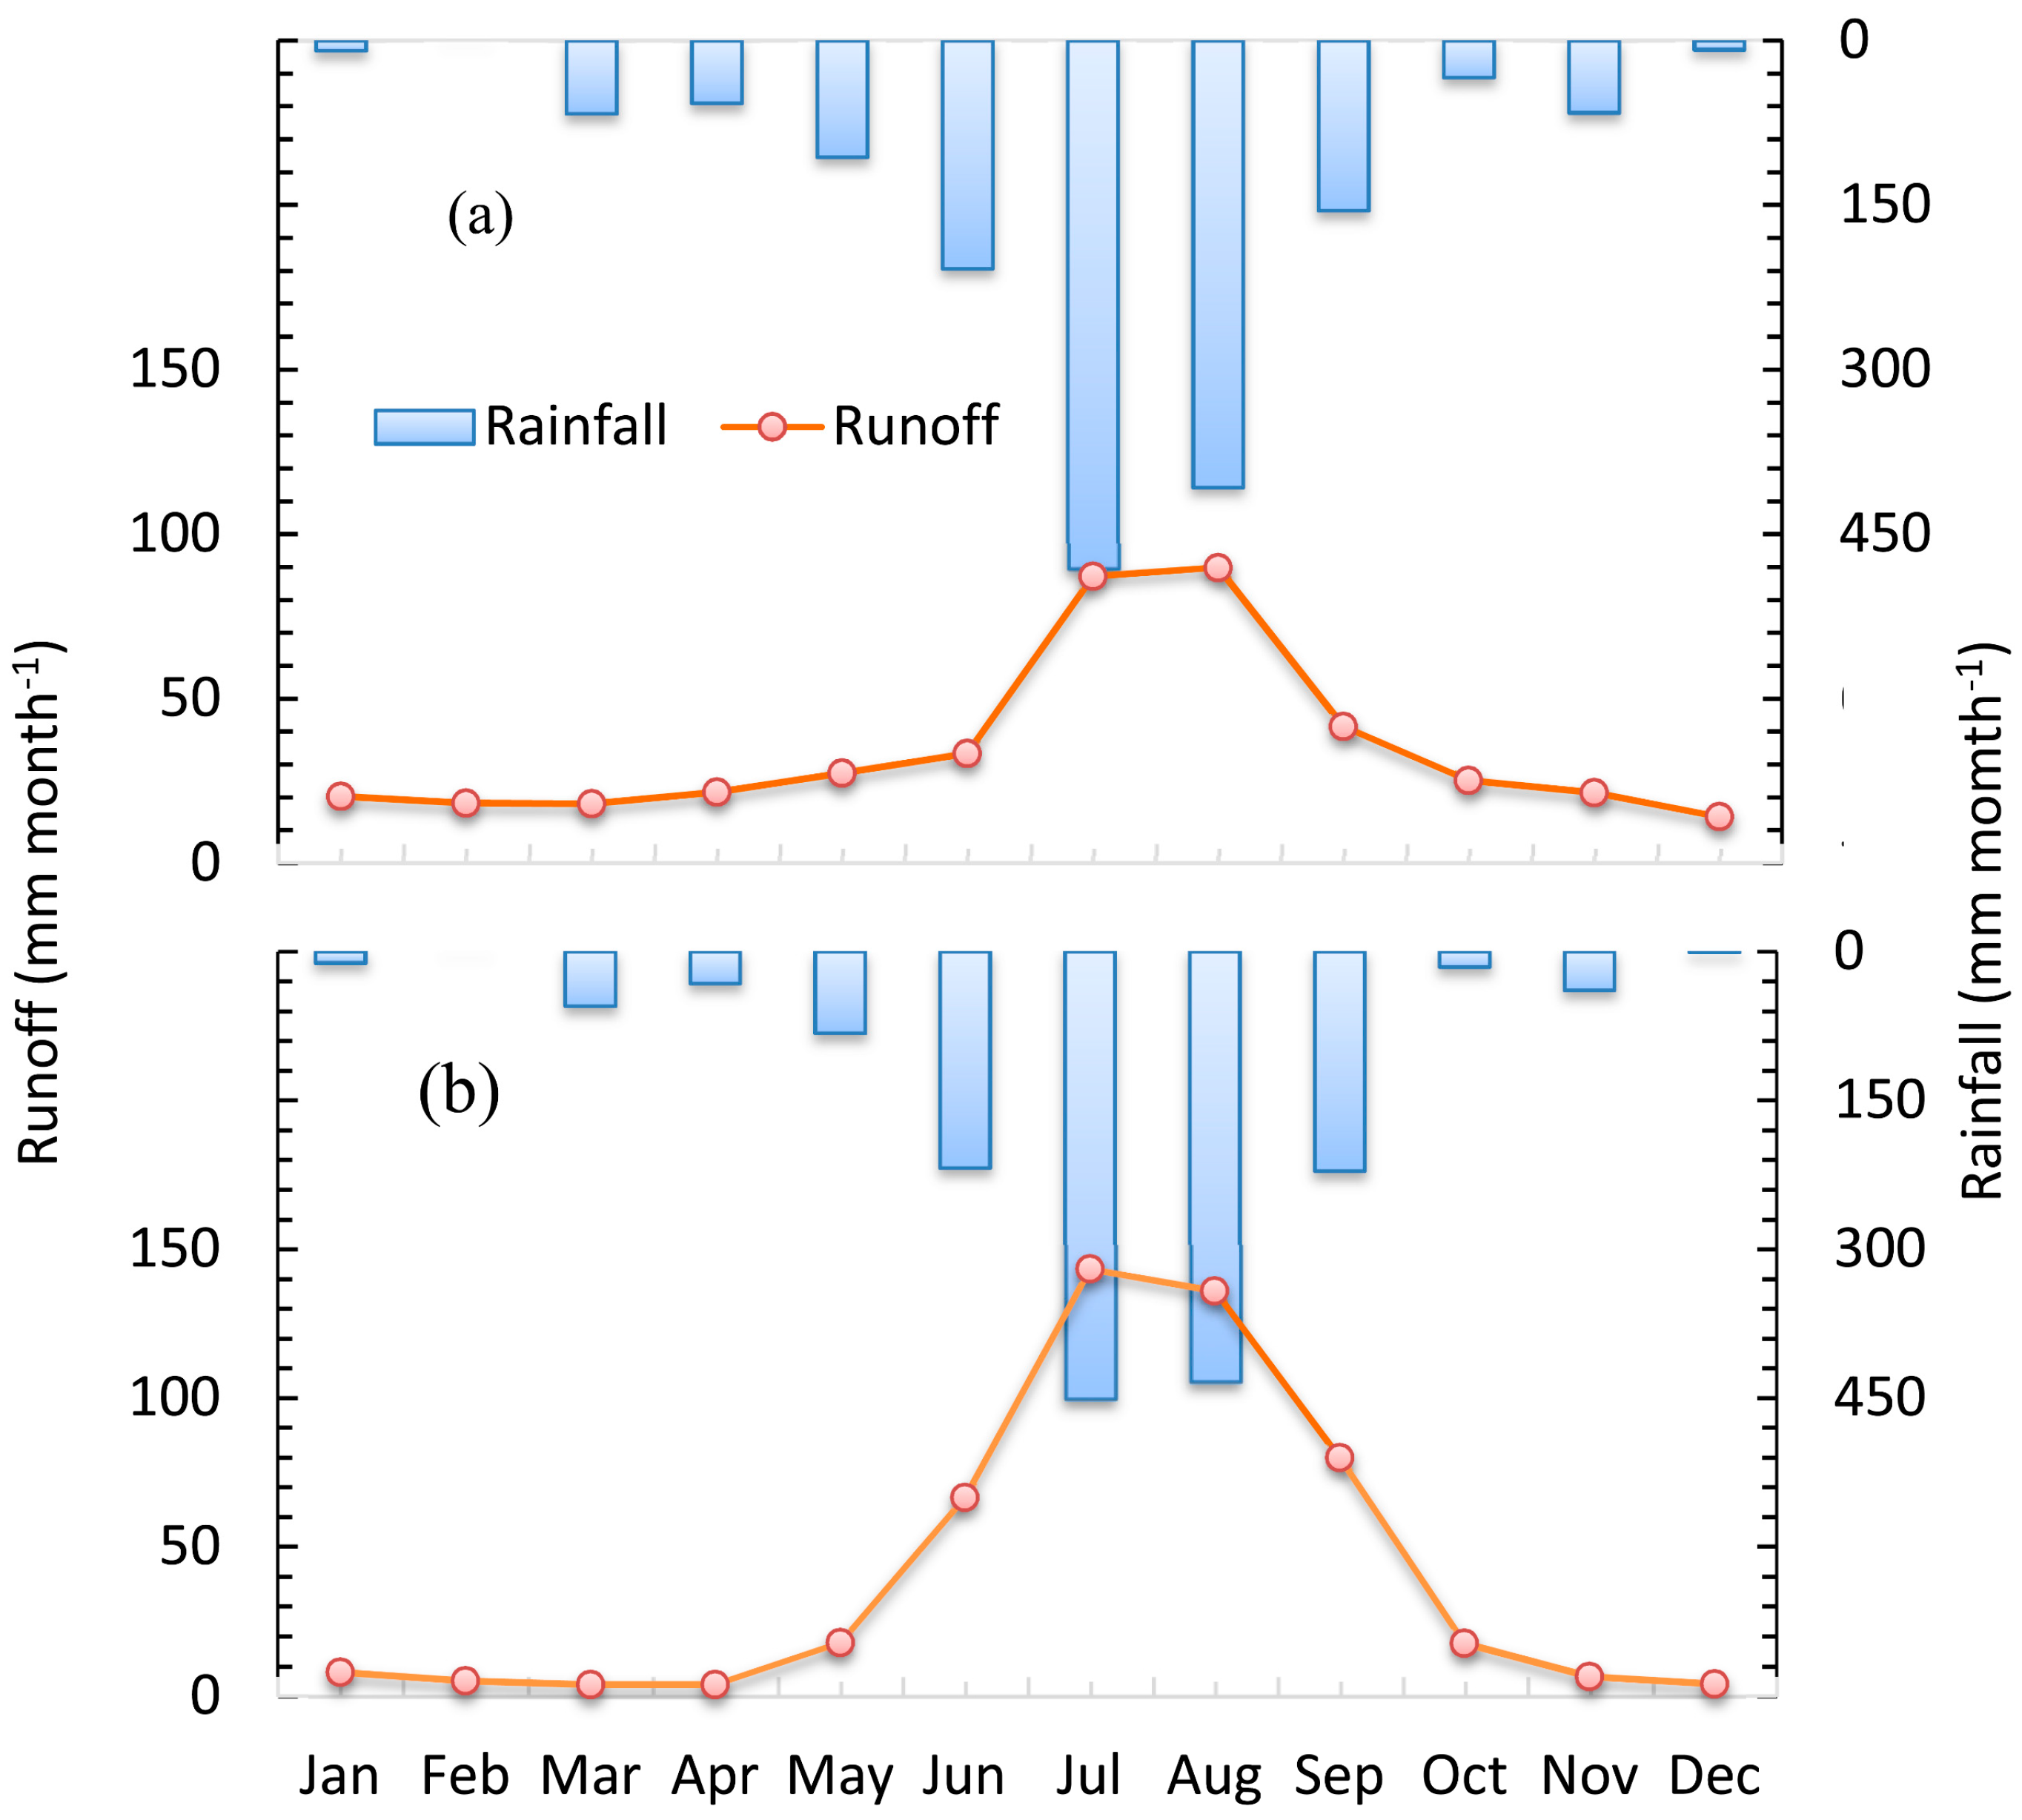
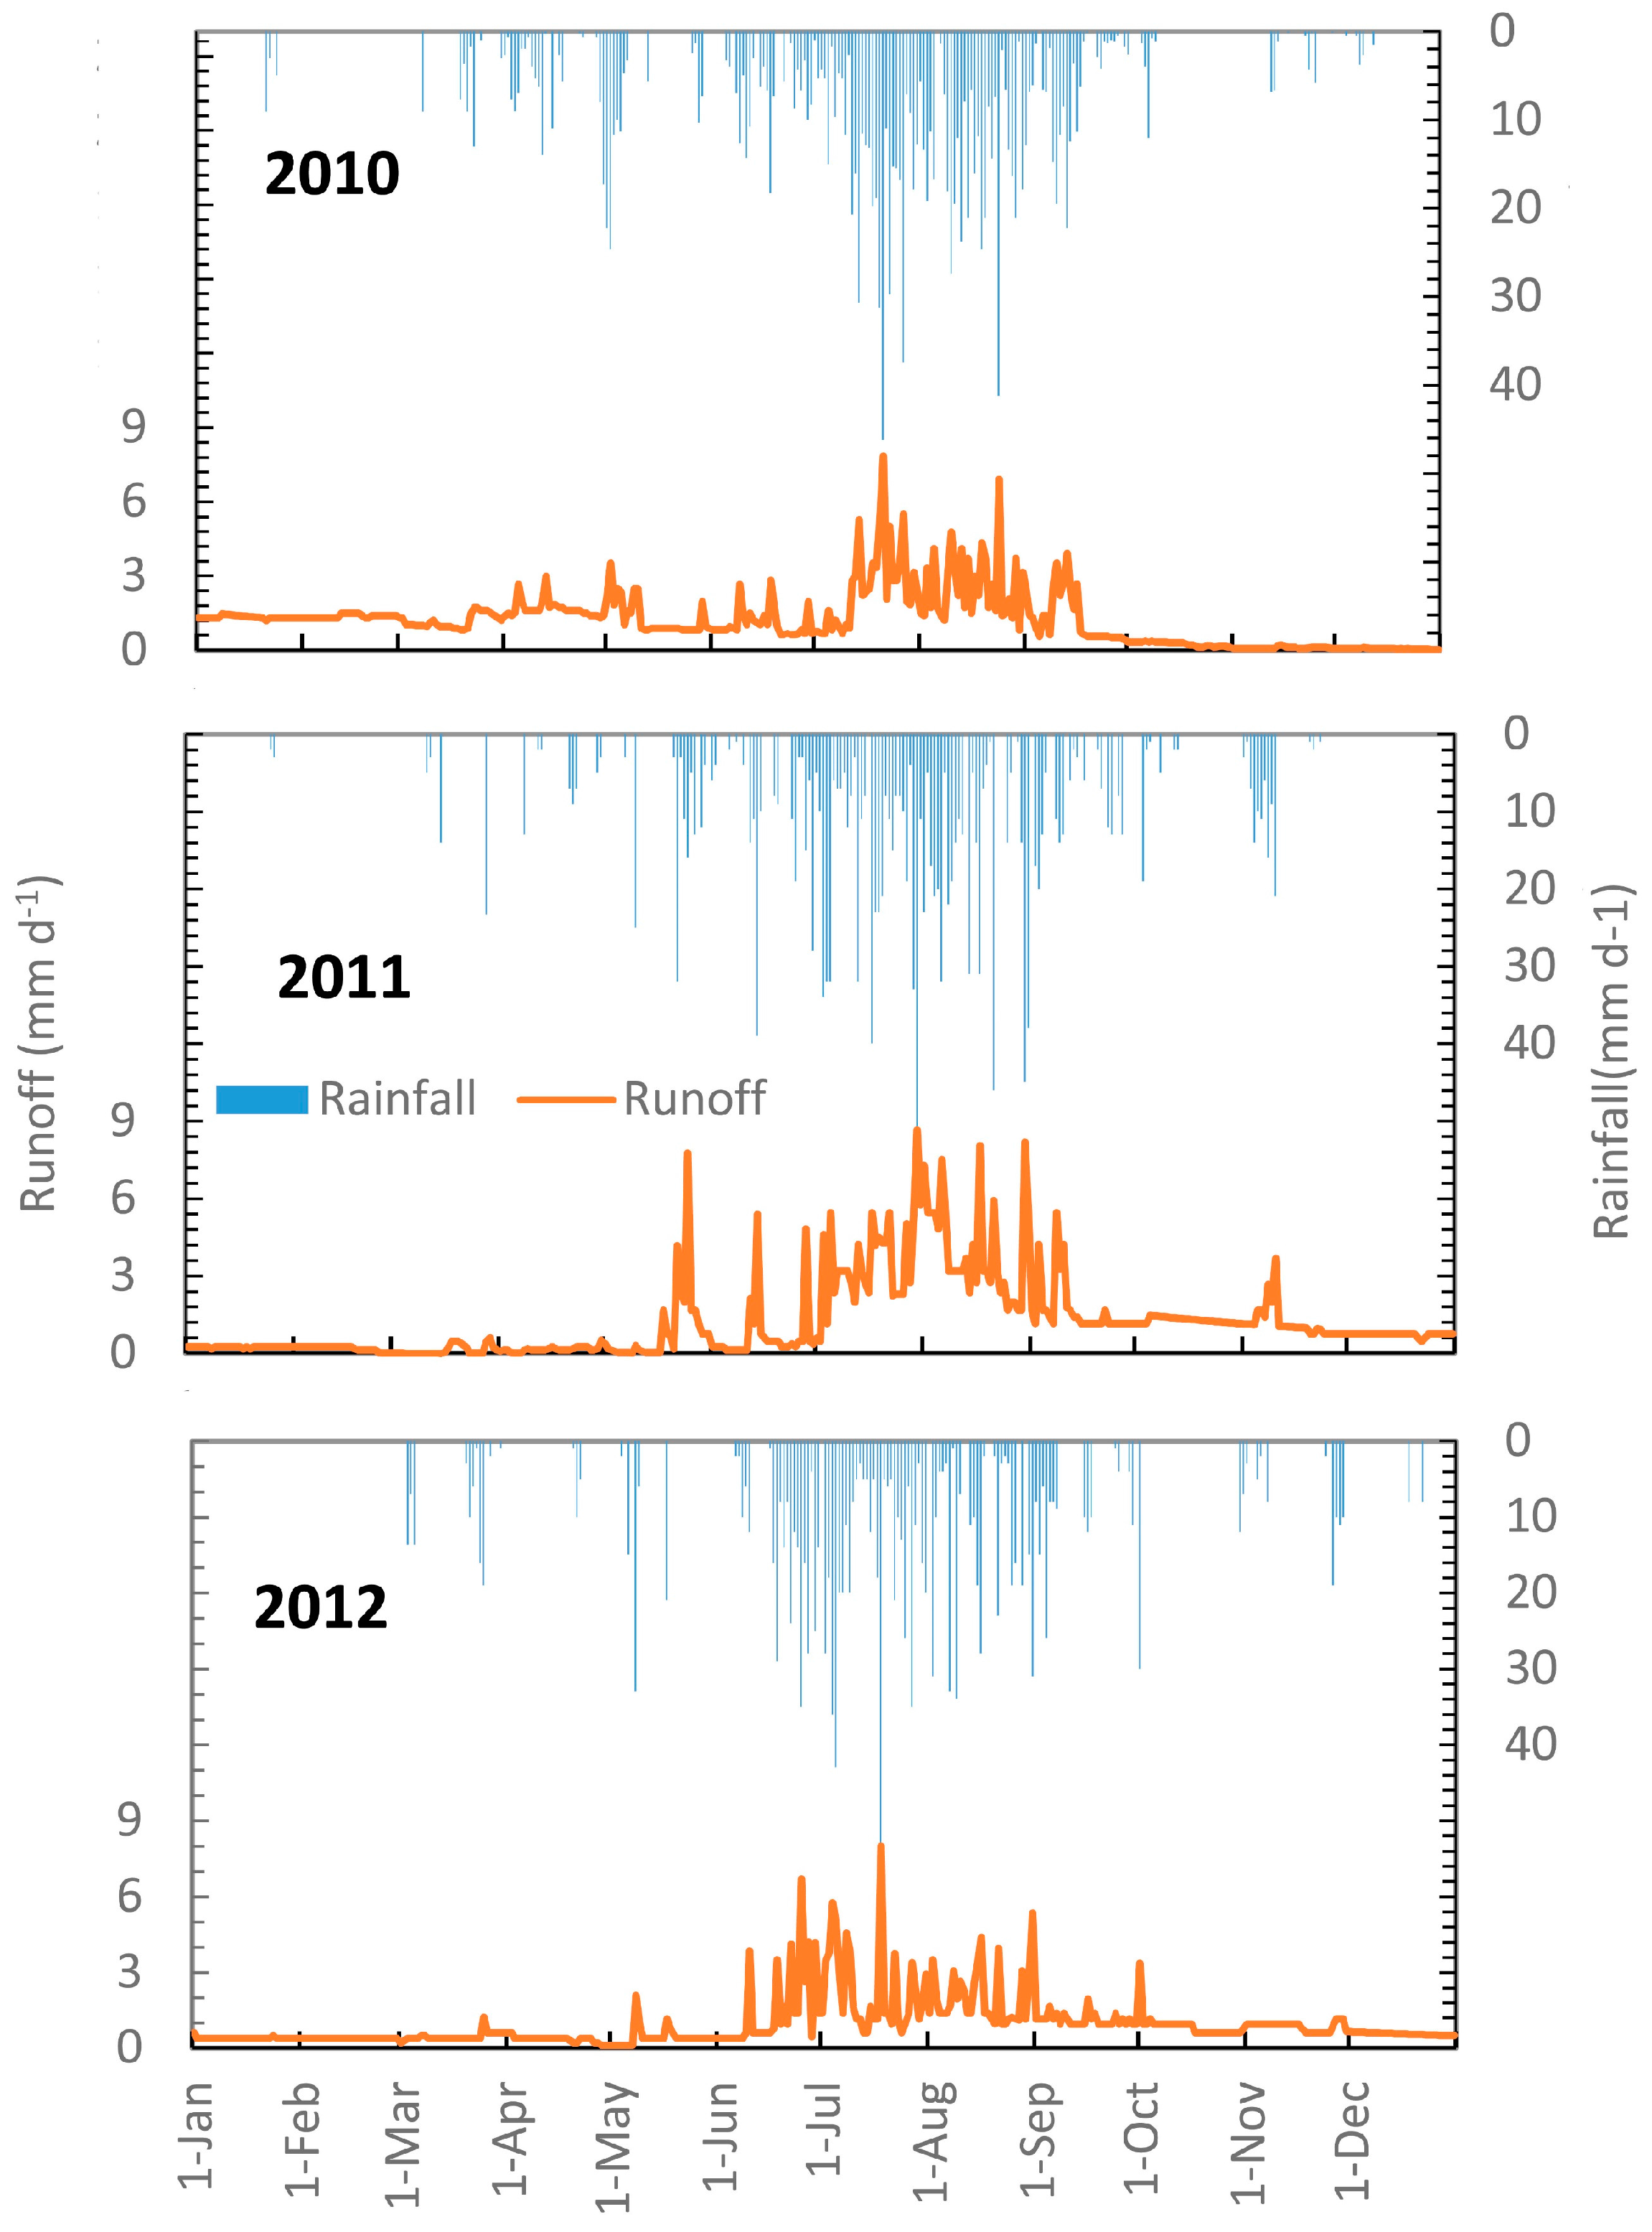
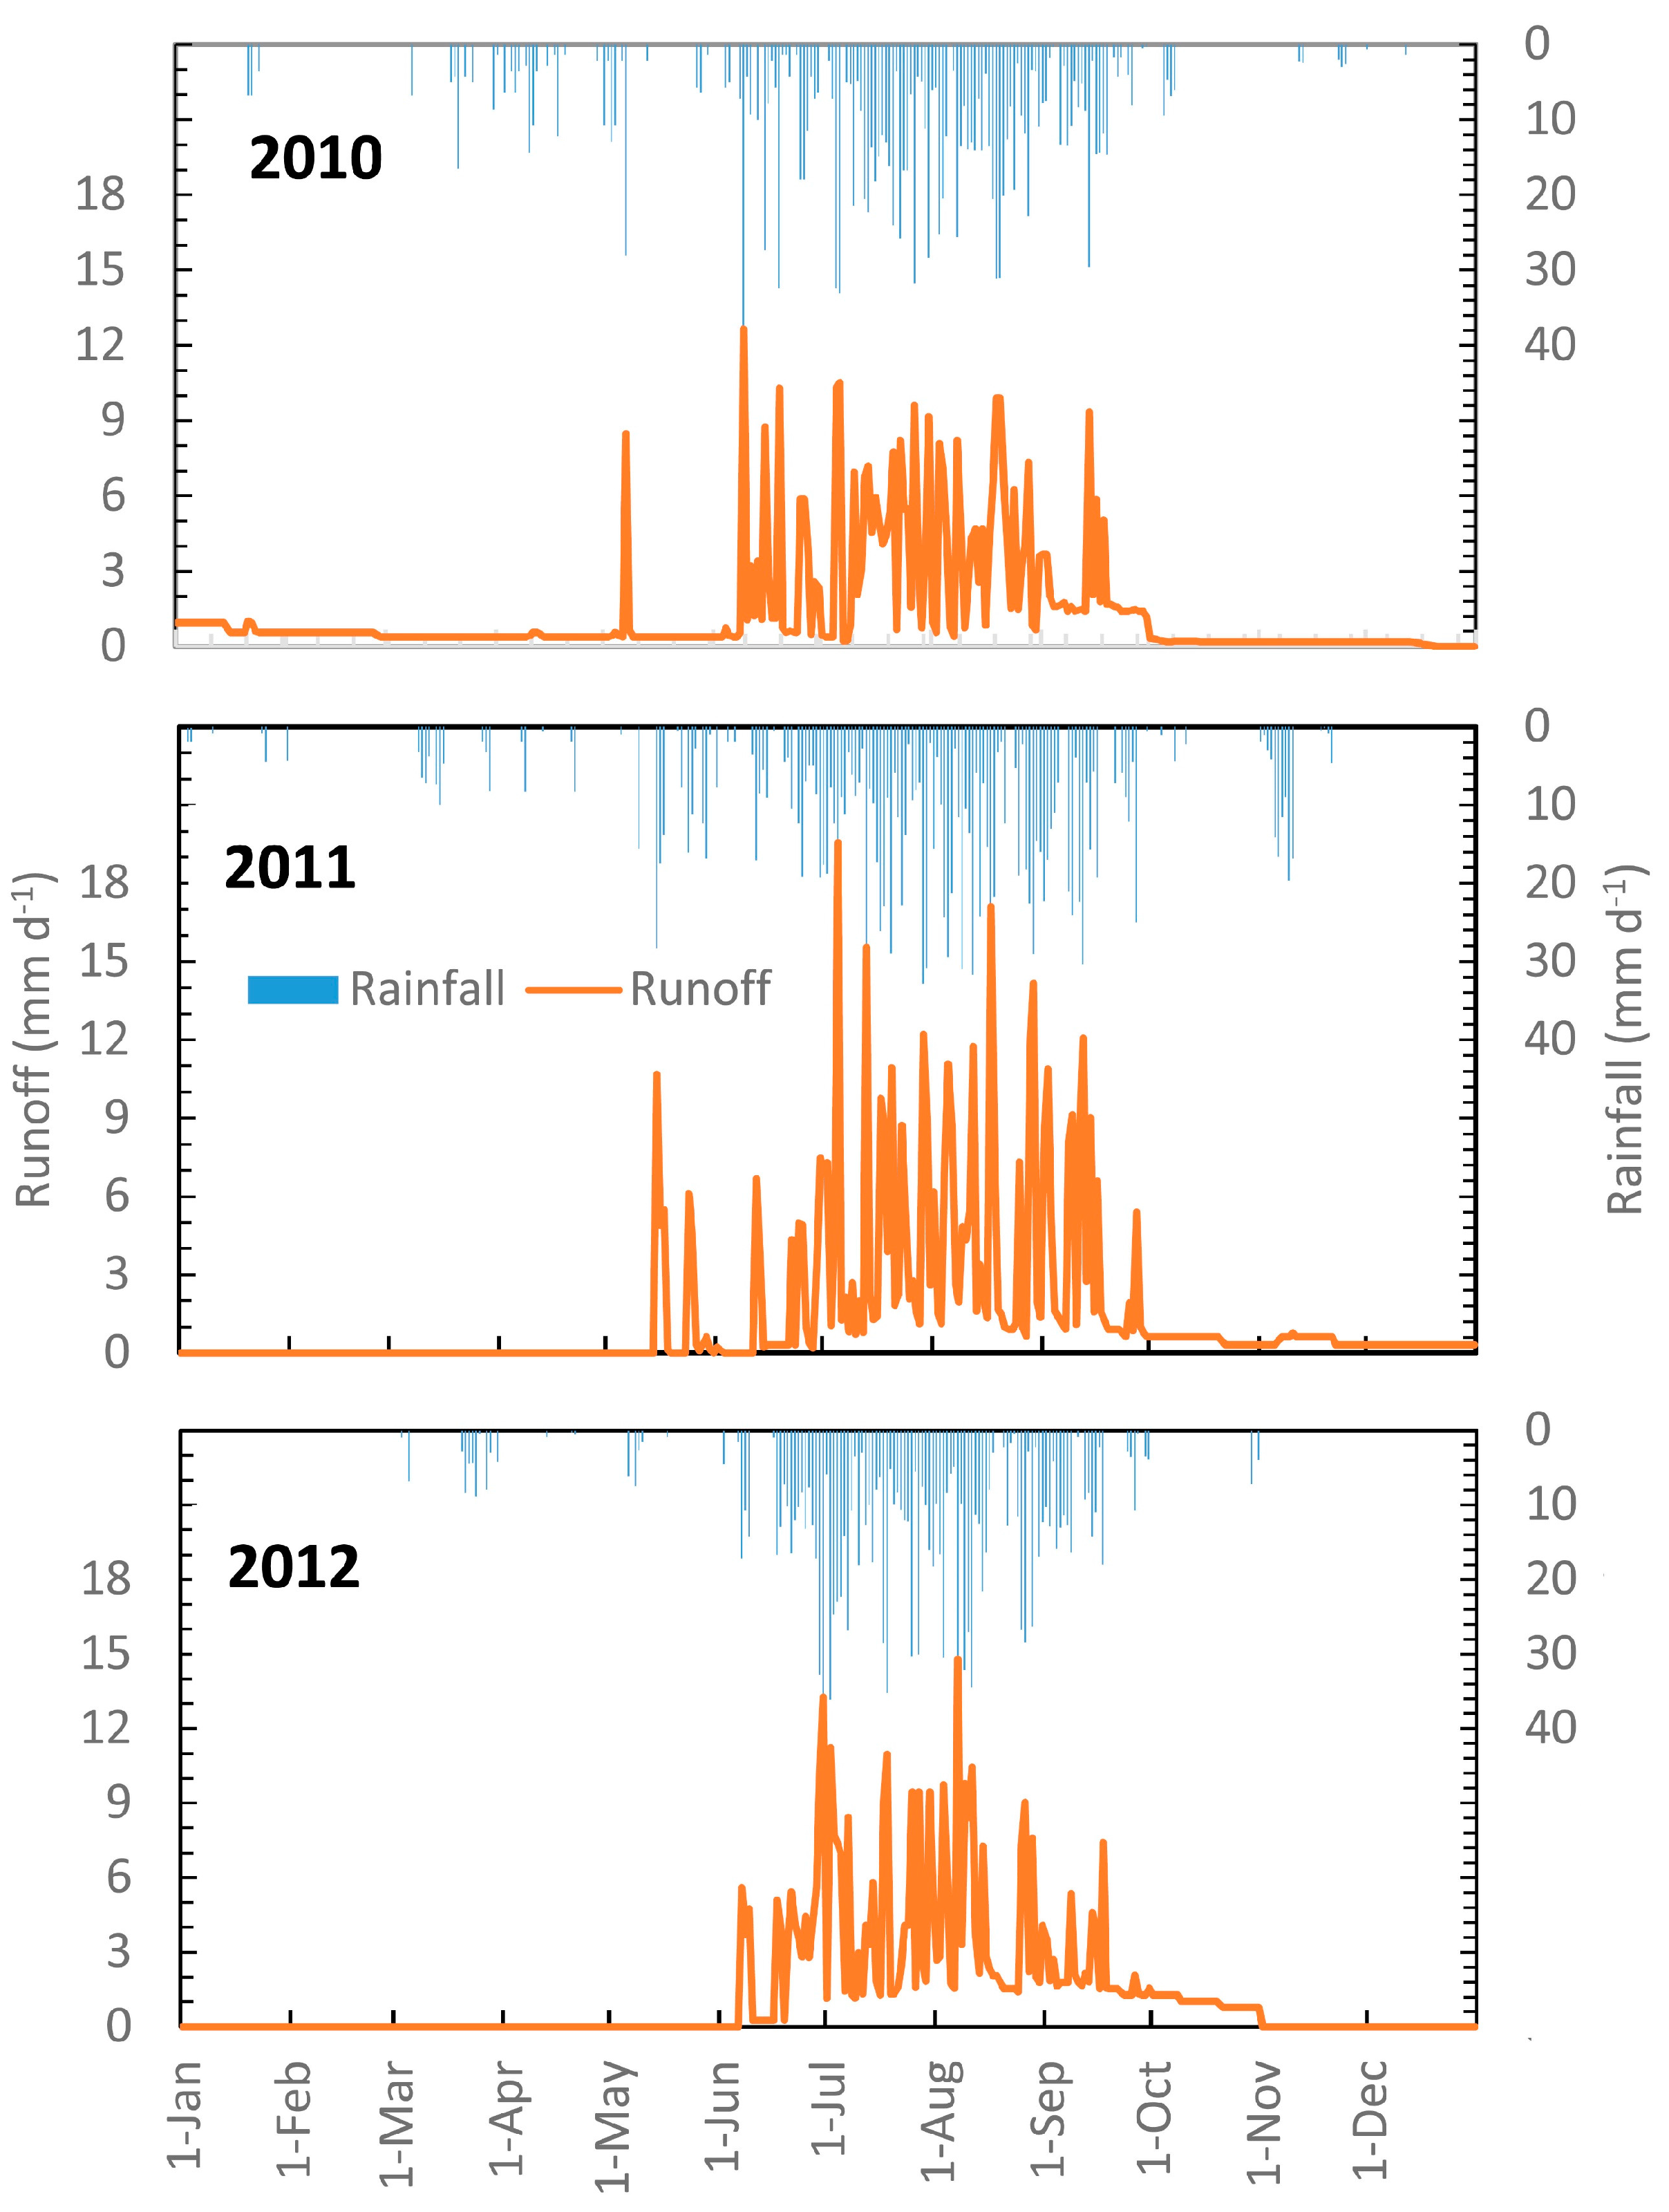
3.1. Precipitation
3.2. Discharge
3.2.1. Runoff Coefficients
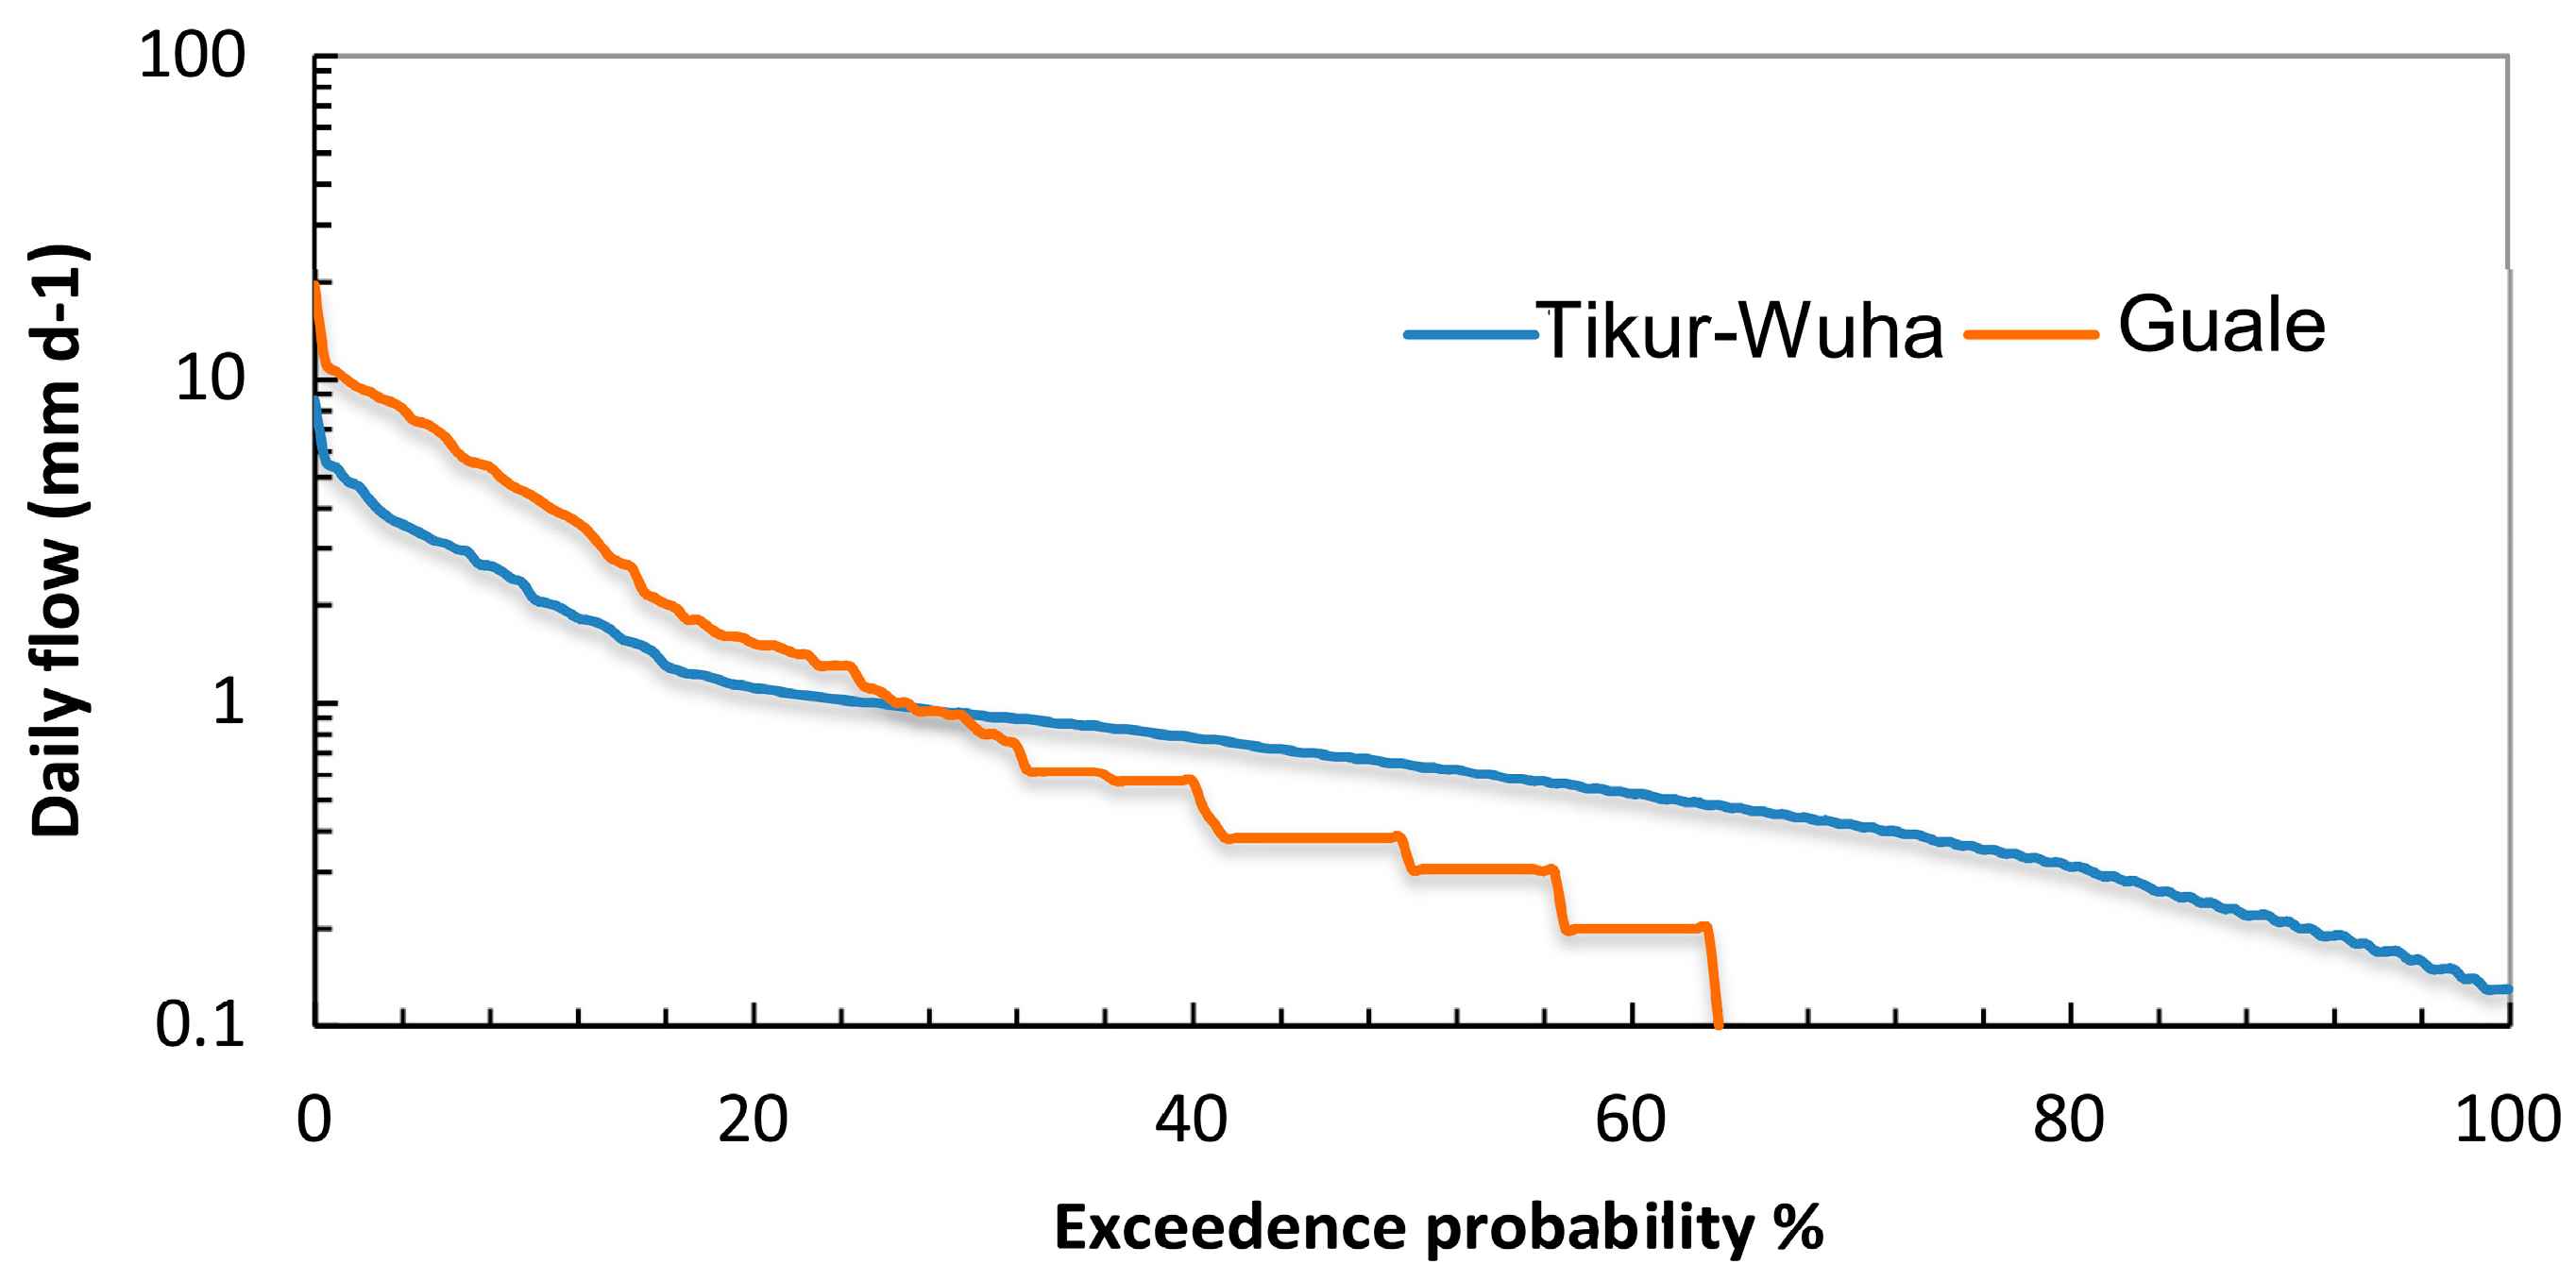
3.2.2. Flow Duration Curve
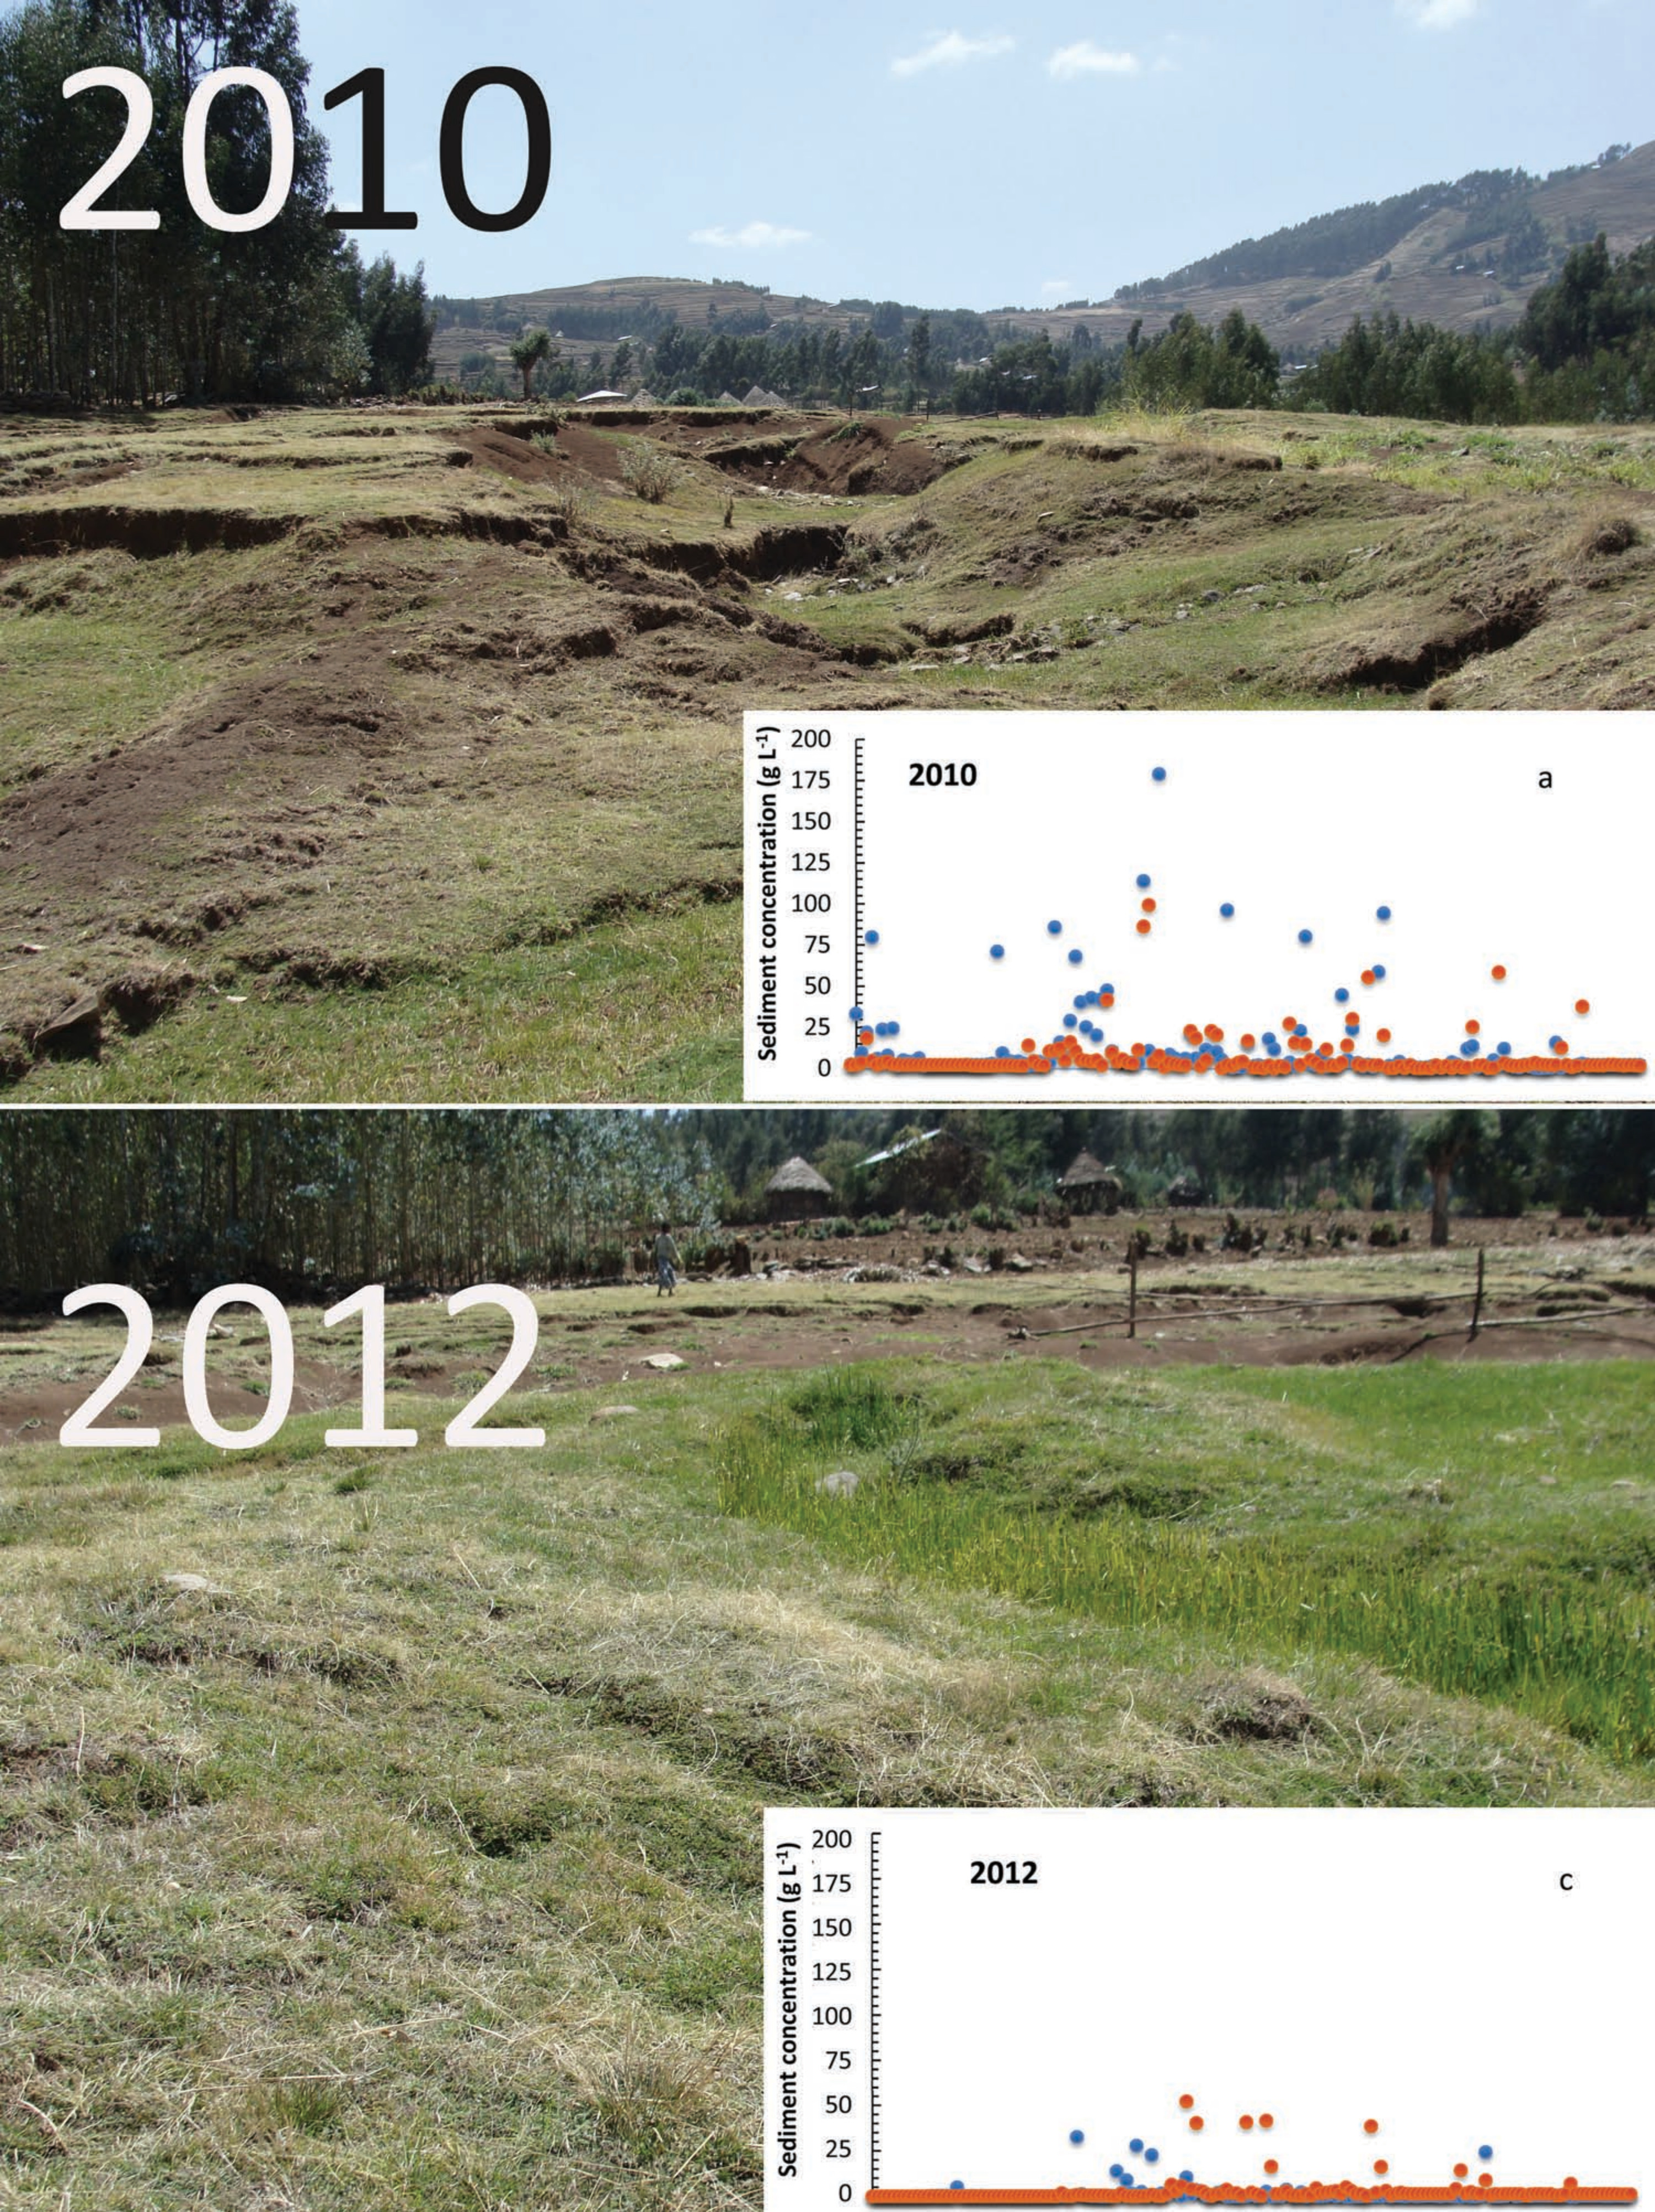
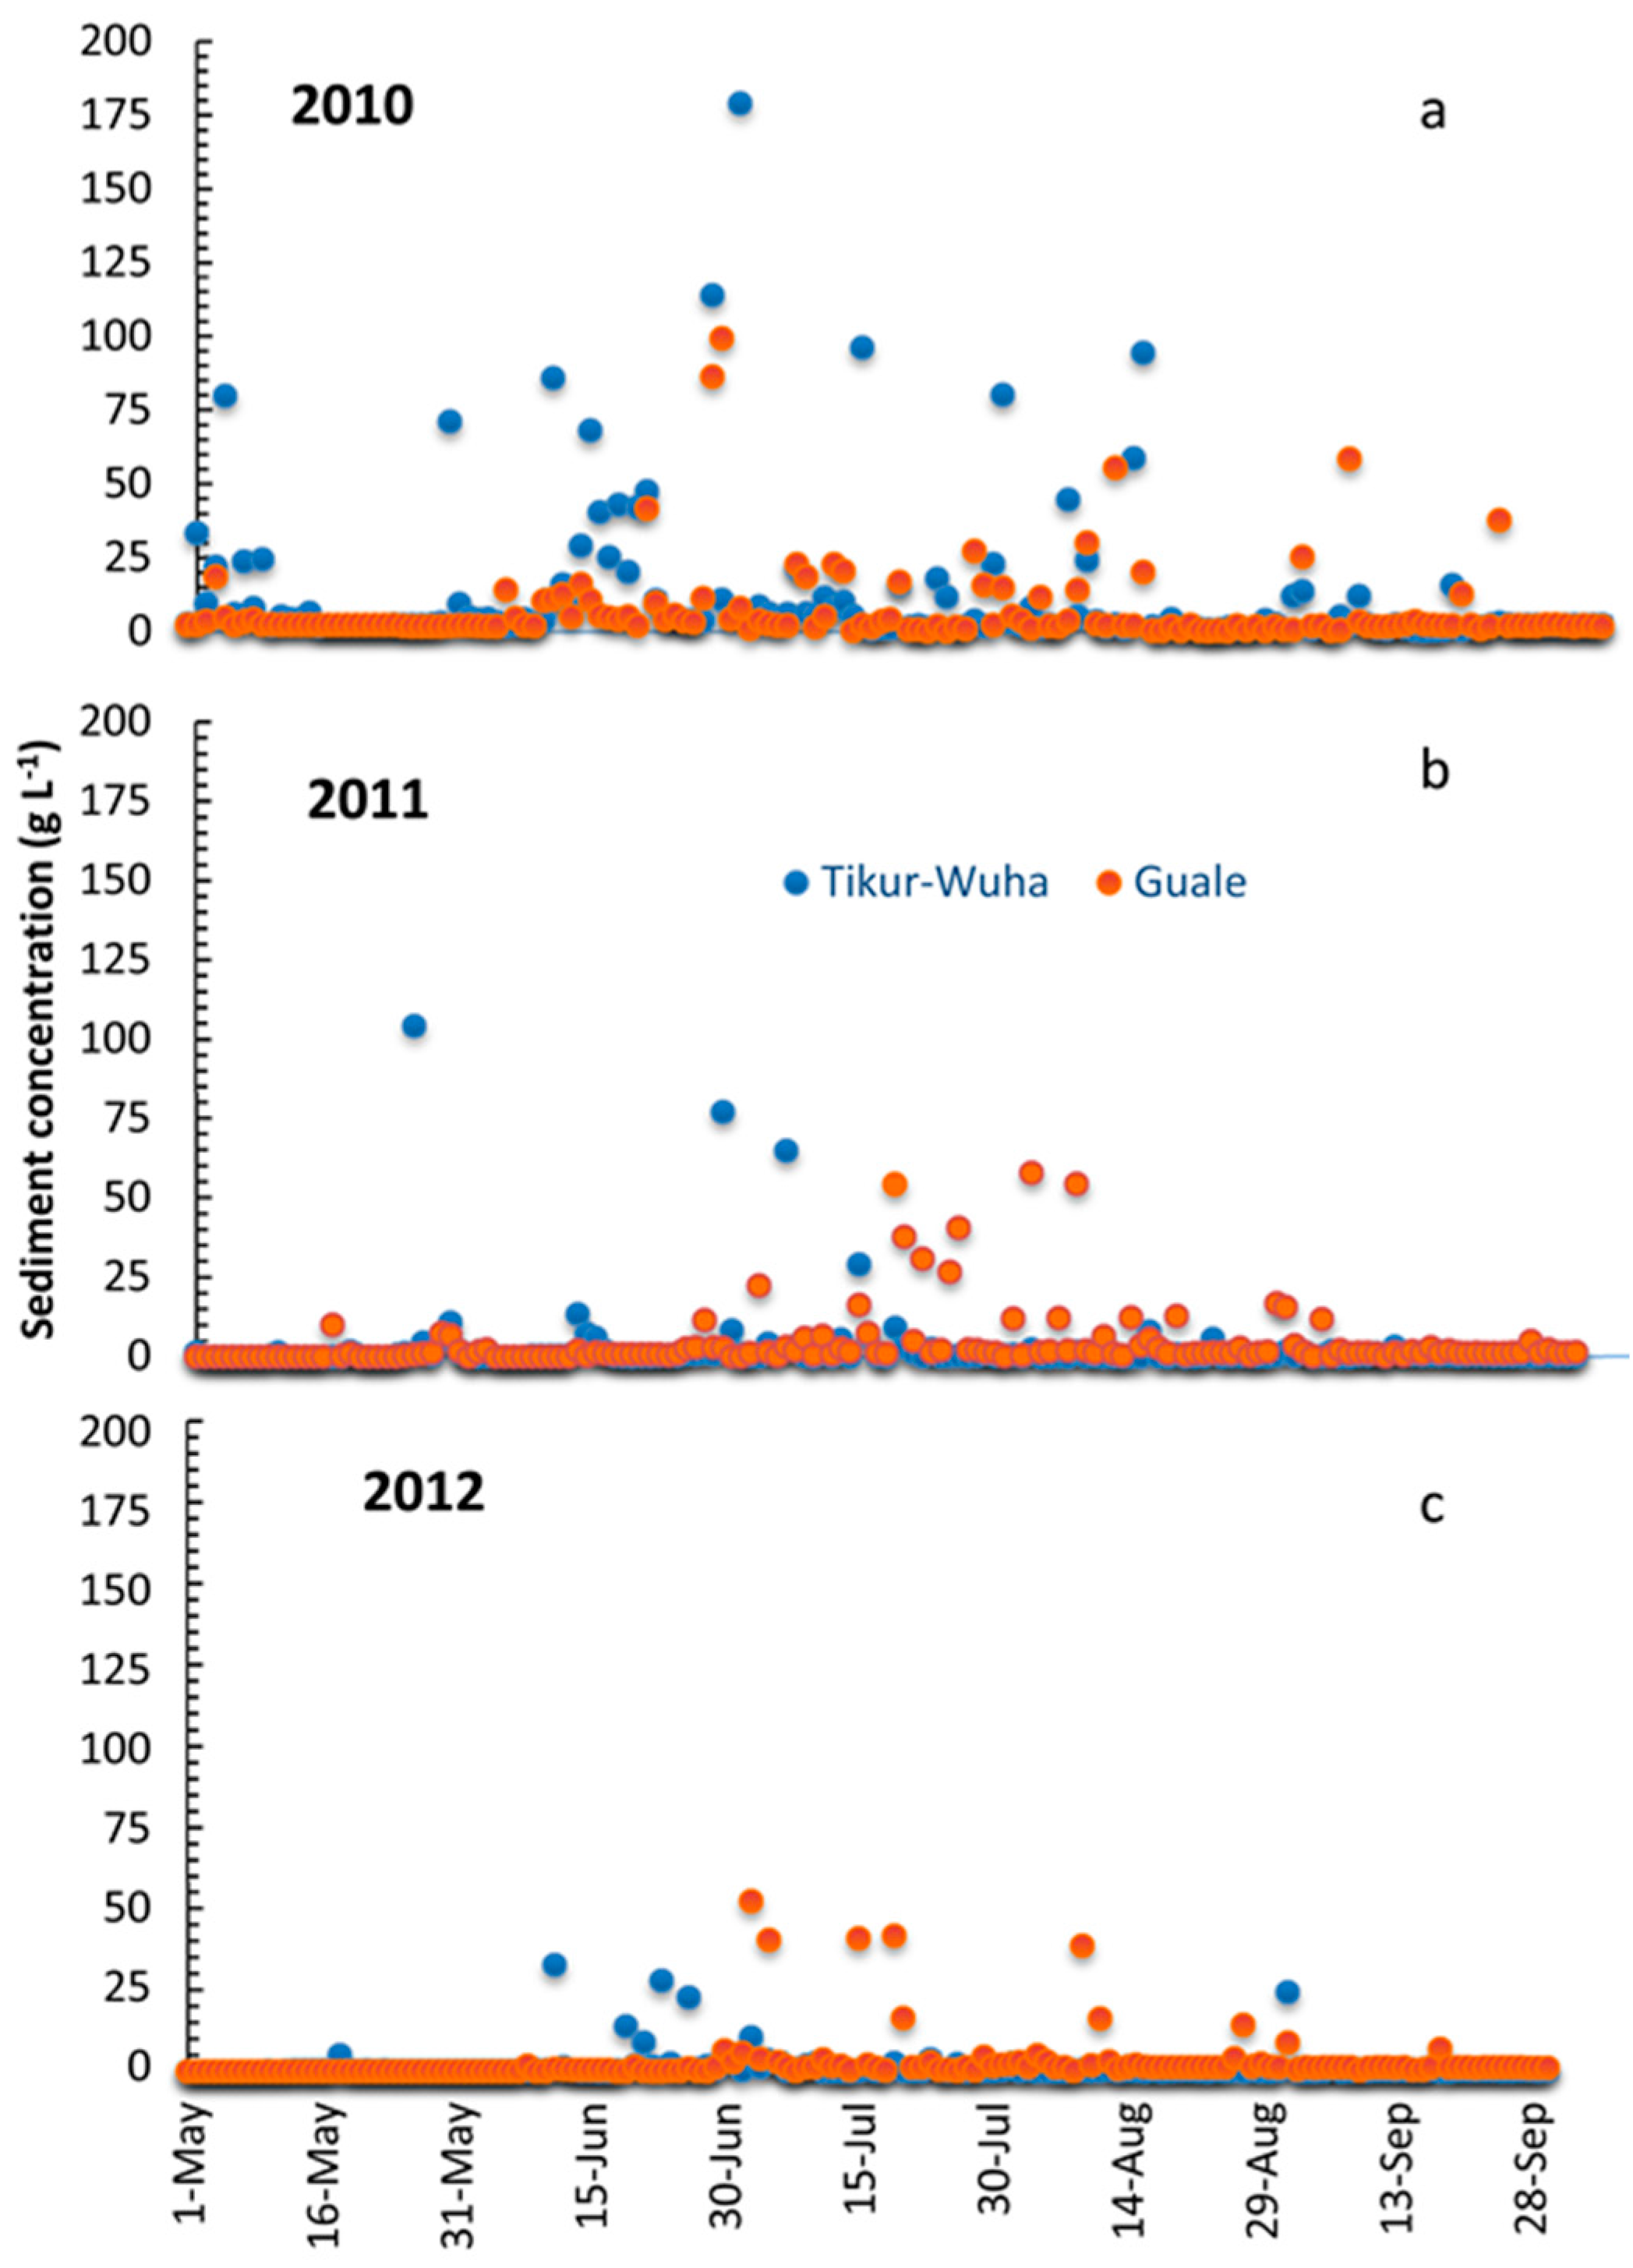
3.3. Sediment
3.3.1. Sediment Concentrations
3.3.2. Sediment Yield
4. Discussion
4.1. Overall Impact of Soil and Water Conservation on Hydrological Response of Watersheds
4.2. Effect of Topography and Soil Depth on Effectiveness of Soil and Water Conservation Works
4.2.1. Discharge
4.2.2. Sediment Loss
5. Conclusions
Supplementary Materials
Acknowledgments
Author Contributions
Conflicts of Interest
References
- Lieskovský, J.; Kenderessy, P. Modeling the effect of vegetation cover and different tillage practices on soil erosion in vineyards: A case study en Vráble (Slovakia) using WATER/SEDEM. Land Degrad. Dev. 2014, 25, 288–296. [Google Scholar] [CrossRef]
- Kim, J.; Choi, J.; Choi, C.; Park, S. Impacts of changes in climate and land use/land cover under IPCC RCP scenarios on stream flow in the Hoeya River Basin, Korea. Sci. Total Environ. 2013, 452, 181–195. [Google Scholar] [CrossRef] [PubMed]
- Setegn, S.G.; Srinivasan, R.; Dargahi, B.; Melesse, A.M. Spatial delineation of soil erosion vulnerability in the Lake Tana Basin, Ethiopia. Hydrol. Process. 2009, 23, 3738–3750. [Google Scholar] [CrossRef]
- Kassie, M.; Pender, J.; Yesuf, M.; Kohlin, G.; Bluffstone, R.; Mulugeta, E. Estimating returns to soil conservation adoption in the northern Ethiopian highlands. Agric. Econ. 2008, 38, 213–232. [Google Scholar] [CrossRef]
- Pimentel, D.; Burgess, M. Soil erosion threatens food production. Agriculture 2013, 3, 443–463. [Google Scholar] [CrossRef]
- Huang, M.; Gallichand, J.; Zhang, P. Runoff and sediment responses to conservation practices: Loess Plateau of China. J. Am. Water Resour. Assoc. 2003, 39, 1197–1207. [Google Scholar] [CrossRef]
- García-Ruiz, J.M.; Nadal-Romero, E.; Lana-Renault, N.; Beguería, S. Erosion in Mediterranean landscapes: Changes and future challenges. Geomorphology 2013, 198, 20–36. [Google Scholar] [CrossRef] [Green Version]
- Kosmas, C.; Danalatos, N.; Cammeraat, L.H.; Chabart, M.; Diamantopoulos, J.; Farand, R.; Gutierrez, L.; Jacob, A.; Marques, H.; Martinez-Fernandez, J.; et al. The effect of land use on runoff and soil erosion rates under Mediterranean conditions. Catena 1997, 29, 45–59. [Google Scholar] [CrossRef]
- United States Department of Agriculture-Natural Resources Conservation Services (USDA-NRCS). Summary Report 2010 National Resources Inventory; Iowa State University Statistical Laboratory: Ames, IA, USA, 2013; p. 163.
- Constable, M.; Belshaw, D. The Ethiopian highlands reclamation study: Major findings and recommendations. In Towards a Food and Nutrition Strategy for Ethiopia: Proceedings of the National Workshop on Food Strategies for Ethiopia; ONCCP (Office of the National Committee for Central Planning): Addis Ababa, Ethiopia, 1986; pp. 8–12. [Google Scholar]
- Hurni, H.; Tato, K. (Eds.) Erosion, Conservation, and Small-Scale Farming; Geographical Bernensia: Bern, Switzerland, 1992. [Google Scholar]
- Tamene, L.; Vlek, P.L. Soil erosion studies in northern Ethiopia. In Land Use Soil Resources; Springer: Dordrecht, The Netherlands, 2008; pp. 73–100. [Google Scholar]
- Kidane, D.; Alemu, B. The effect of upstream land use practices on soil erosion and sedimentation in the Upper Blue Nile Basin, Ethiopia. Res. J. Agric. Environ. Manag. 2015, 4, 55–68. [Google Scholar]
- Bewket, W.; Teferi, E. Assessment of soil erosion hazard and prioritization for treatment at the watershed level: Case study in the Chemoga watershed, Blue Nile basin, Ethiopia. Land Degrad. Dev. 2009, 20, 609–622. [Google Scholar] [CrossRef]
- Haregeweyn, N.; Tsunekawa, A.; Poesen, J.; Tsubo, M.; Meshesha, D.T.; Fenta, A.A.; Nyssen, J.; Adgo, E. Comprehensive assessment of soil erosion risk for better land use planning in river basins: Case study of the Upper Blue Nile River. Sci. Total Environ. 2017, 574, 95–108. [Google Scholar] [CrossRef] [PubMed]
- Zimale, F.A.; Moges, M.A.; Alemu, M.L.; Ayana, E.K.; Ayana, E.K.; Demissie, S.S.; Tilahun, S.A.; Steenhuis, T.S. Budgeting suspended sediment fluxes in tropical monsoonal watersheds with limited data: The Lake Tana basin. J. Hydrol. Hydromech. 2017, in press. [Google Scholar]
- Assefa, T.T.; Jha, M.K.; Tilahun, S.A.; Yetbarek, E.; Adem, A.A.; Wale, A. Identification of erosion hotspot area using GIS and MCE technique for Koga watershed in the upper blue Nile Basin, Ethiopia. Am. J. Environ. Sci. 2015, 11, 245. [Google Scholar] [CrossRef]
- Devi, R.; Tesfahune, E.; Legesse, W.; Deboch, B.; Beyene, A. Assessment of siltation and nutrient enrichment of Gilgel Gibe dam, Southwest Ethiopia. Bioresour. Technol. 2008, 99, 975–979. [Google Scholar] [CrossRef] [PubMed]
- Nyssen, J.; Poesen, J.; Moeyersons, J.; Haile, M.; Deckers, J. Dynamics of soil erosion rates and controlling factors in the Northern Ethiopian Highlands–towards a sediment budget. Earth Surf. Process. Landf. 2008, 33, 695–711. [Google Scholar] [CrossRef] [Green Version]
- Tebebu, T.Y.; Bayabil, H.K.; Stoof, C.R.; Giri, S.K.; Gessess, A.A.; Tilahun, S.A.; Steenhuis, T.S. Characterization of degraded soils in the humid Ethiopian highlands. Land Degrad. Dev. 2016. [Google Scholar] [CrossRef]
- Tebebu, T.Y.; Steenhuis, T.S.; Dagnew, D.C.; Guzman, C.D.; Bayabil, H.K.; Zegeye, A.D.; Collick, A.S.; Langan, S.; McAllister, C.; Langendoen, E.J.; et al. Improving efficacy of landscape interventions in the (sub) humid Ethiopian highlands by improved understanding of runoff processes. Front. Earth Sci. 2015, 3, 49. [Google Scholar] [CrossRef]
- Osman, M.; Sauerborn, P. Soil and water conservation in Ethiopia. J. Soils Sediments 2001, 1, 117–123. [Google Scholar] [CrossRef]
- Dagnew, D.C.; Guzman, C.D.; Zegeye, A.D.; Tebebu, T.Y.; Getaneh, M.; Abate, S.; Zimale, F.A.; Ayana, E.K.; Tilahun, S.A.; Steenhuis, T.S. The impact of conservation practices on runoff and soil loss in the sub-humid Ethiopian Highlands: The Debre Mawi watershed. J. Hydrol. Hydromech. 2015, 63, 210–219. [Google Scholar] [CrossRef]
- Ministry of Finance and Economic Development (MOFED). Growth and Transformation Plan of Ethiopia (GTP), 2010/2011–2014/15 of the Federal Democratic Republic of Ethiopia (FDRE); MOFED: Addis Ababa, Ethiopia, 2010.
- Easton, Z.M.; Fuka, D.R.; White, E.D.; Collick, A.S.; Biruk Ashagre, B.; McCartney, M.; Awulachew, S.B.; Ahmed, A.A.; Steenhuis, T.S. A multi-basin SWAT model analysis of runoff and sedimentation in the Blue Nile, Ethiopia, Hydrol. Earth Syst. Sci. 2010, 14, 1827–1841. [Google Scholar] [CrossRef]
- Kebede, S.; Travi, Y.; Alemayehu, T.; Marc, V. Water balance of Lake Tana and its sensitivity to fluctuations in rainfall, Blue Nile basin, Ethiopia. J. Hydrol. 2006, 316, 233–247. [Google Scholar] [CrossRef]
- Dessie, M.; Verhoest, N.E.C.; Pauwels, V.R.N.; Admasu, T.; Poesen, J.; Adgo, E.; Deckers, J.; Nyssen, J. Analyzing runoff processes through conceptual hydrological modeling in the Upper Blue Nile basin, Ethiopia. Hydrol. Earth Syst. Sci. Dis. 2014, 11, 5287–5325. [Google Scholar] [CrossRef]
- Dagnew, D.C.; Guzman, C.D.; Zegeye, A.D.; Akal, A.T.; Moges, M.A.; Tebebu, T.Y.; Mekuria, W.; Ayana, E.K.; Tilahun, S.A.; Steenhuis, T.S. Sediment loss patterns in the sub-humid Ethiopian Highlands. Land Degrad. Dev. 2017, 28, 1795–1805. [Google Scholar] [CrossRef]
- Dagnew, D.C.; Guzman, C.D.; Akale, A.T.; Tebebu, T.Y.; Zegeye, A.D.; Mekuria, W.; Tilahun, S.A.; Steenhuis, T.S. Effects of land use on catchment runoff and soil loss in the sub-humid Ethiopian highlands. Ecohydrol. Hydrobiol. 2017. [Google Scholar] [CrossRef]
- Guzman, C.D.; Zimale, F.A.; Tebebu, T.Y.; Bayabil, H.K.; Tilahun, S.A.; Yitaferu, B.; Rientjes, T.H.M.; Steenhuis, T.S. Modeling discharge and sediment concentrations after landscape interventions in a humid monsoon climate: The Anjeni watershed in the highlands of Ethiopia. Hydrol. Process. 2017, 31, 1239–1257. [Google Scholar] [CrossRef]
- Amhara Design and Supervision Works Enterprise (ADSWE). Soil Map of Amhara Region, Land Use and Administration Work Process; Amhara Design and Supervision Works Enterprise (ADSWE): Bahir Dar, Ethiopia, 2012. [Google Scholar]
- Ayele, G.K.; Gessess, A.A.; Addisie, M.B.; Tilahun, S.A.; Tebebu, T.Y.; Tenessa, D.B.; Langendoen, E.J.; Nicholson, C.F.; Steenhuis, T.S. A biophysical and economic assessment of a community-based rehabilitated gully in the Ethiopian Highlands. Land Degrad. Dev. 2016, 270–280. [Google Scholar] [CrossRef]
- Addisie, M.B.; Ayele, G.K.; Gessess, A.A.; Tilahun, S.A.; Zegeye, A.D.; Moges, M.M.; Schmitter, P.; Langendoen, E.J.; Steenhuis, T.S. Gully head retreat in the sub-humid Ethiopian Highlands: The Ene-Chilala catchment. Land Degrad. Dev. 2017, 1579–1588. [Google Scholar] [CrossRef]
- Chanson, H. Hydraulics of Open Channel Flow; Butterworth-Heinemann: Oxford, UK, 2004. [Google Scholar]
- Tilahun, S.A. Observations and Modeling of Erosion from Spatially and Temporally Distributed Sources in the (Semi) Humid Ethiopian Highlands. Ph.D. Dissertation, Cornell University, Ithaca, NY, USA, 2012. [Google Scholar]
- Sugiyama, H.; Vudhivanich, V.; Whitaker, A.C.; Lorsirirat, K. stochastic flow duration curves for evaluation of flow regimes in rivers. J. Am. Water Resour. Assoc. 2003, 39, 47–58. [Google Scholar] [CrossRef]
- Bewket, W.; Sterk, G. Dynamics in land cover and its effect on stream flow in the Chemoga watershed, Blue Nile basin, Ethiopia. Hydrol. Process. 2005, 19, 445–458. [Google Scholar] [CrossRef]
- Steenhuis, T.S.; Hrncir, M.; Poteau, D.A.; Luna, E.J.R.; Tilahun, S.A.; Caballero, L.A.; Guzman, C.D.; Stoof, C.R.; Sanda, M.; Yitaferu, B.; et al. Saturated excess runoff pedo transfer function for vegetated watersheds. Vadose Zone J. 2013, 4. [Google Scholar] [CrossRef]
- Ferreira, C.S.S.; Walsh, R.P.D.; Steenhuis, T.S.; Ferreira, A.J.D. Effect of peri-urban development and lithology on streamflow in a Mediterranean catchment. Land Degrad. Dev. 2017, in press. [Google Scholar] [CrossRef]
- Searcy, J.K. Flow-Duration Curves; US Government Printing Office: Washington, DC, USA, 1959.
- Nyssen, J.; Clymans, W.; Poesen, J.; Vandecasteele, I.; De Baets, S.; Haregeweyn, N.; Naudts, J.; Hadera, A.; Moeyersons, J.; Haile, M.; et al. How soil conservation affects the catchment sediment budget–a comprehensive study in the north Ethiopian highlands. Earth Surf. Process. Landf. 2009, 34, 1216–1233. [Google Scholar] [CrossRef]
- Valentin, C.; Agus, F.; Alamban, R.; Boosaner, A.; Bricquet, J.P.; Chaplot, V.; De Guzman, T.; De Rouw, A.; Janeau, J.L.; Orange, D.; et al. Runoff and sediment losses from 27 upland catchments in Southeast Asia: Impact of rapid land use changes and conservation practices. Agric. Ecosyst. Environ. 2008, 128, 225–238. [Google Scholar] [CrossRef]
- Valentin, C.; Boonsaner, A.; Janeau, J.L.; Jouquet, P.; Henry Des Tureaux, T.; Huon, S.; Latsachack, K.; Le Troquer, Y.; Maeght, J.L.; Orange, D.; et al. Lessons from long-term monitoring of soil erosion in three Southeast Asian agricultural catchments undergoing rapid land-use changes. In Hydrology in A Changing World: Environmental and Human Dimensions; Daniell, T.M., Van Lanen, H.A.J., Demuth, S., Laaha, G., Servat, E., Mahé, G., Boyer, J.-F., Paturel, J.-E., Dezetter, A., Ruelland, D., Eds.; IAHS Publication: Wallingford, UK, 2014; pp. 303–308. [Google Scholar]
- Guzman, C.D.; Tilahun, S.A.; Zegeye, A.D.; Steenhuis, T.S. Suspended sediment concentration-discharge relationships in the sub-humid Ethiopian highlands. Hydrol. Earth Syst. Sci. 2013, 17, 1067–1077. [Google Scholar] [CrossRef]
- Vanmaercke, M.; Zenebe, A.; Poesen, J.; Nyssen, J.; Vertstraeten, G.; Deckers, J. Sediment dynamics and the role of flash floods in sediment export from medium-sized catchments: A case study from the semi-arid tropical highlands in Northern Ethiopia. J. Soil Sediment 2010, 10, 611–627. [Google Scholar] [CrossRef] [Green Version]
- Awulachew, S.B.; McCartney, M.; Steenhuis, T.S.; Ahmed, A.A. A Review of Hydrology, Sediment and Water Resource Use in the Blue Nile Basin; IWMI Working Paper; International Water Management Institute: Colombo, Sri Lanka, 2008; Volume 131, p. 87. [Google Scholar]
- Bayabil, H.K.; Yitaferu, B.; Steenhuis, T.S. Shift from transport limited to supply limited sediment concentrations with the progression of monsoon rains in the Upper Blue Nile Basin. Earth Surf. Process. Landf. 2017. [Google Scholar] [CrossRef]
- Zegeye, A.D.; Langendoen, E.J.; Stoof, C.R.; Tilahun, S.A.; Dagnew, D.C.; Zimale, F.A.; Guzman, C.D.; Yitaferu, B.; Steenhuis, T.S. Morphological dynamics of gully systems in the sub-humid Ethiopian Highlands: The Debre Mawi watershed. Soil 2016, 2, 443–458. [Google Scholar] [CrossRef]
- Zegeye, A.D.; Steenhuis, T.S.; Mekuria, W.; Dagnew, D.C.; Addisse, M.B.; Tilahun, S.A.; Kasse, T.A. Effect of gully head cut treatment on sediment load and gully expansion in the sub humid Ethiopian Highlands. Environ. Ecol. Res. 2017, 5, 138–144. [Google Scholar] [CrossRef]
- Tebebu, T.Y.; Abiy, A.Z.; Zegeye, A.D.; Dahlke, H.E.; Easton, Z.M.; Tilahun, S.A.; Collick, A.S.; Kidnau, S.; Moges, S.; Dadgar, F.; et al. Surface and subsurface flow effects on permanent gully formation and upland erosion near Lake Tana in the northern highlands of Ethiopia. Hydrol. Earth Syst. Sci. 2010, 14, 2207–2217. [Google Scholar] [CrossRef]
- Tamene, L.; Vlek, P.L.G. Assessing the potential of changing land use for reducing soil erosion and sediment yield of catchments: A case study in the highlands of northern Ethiopia. Soil Use Manag. 2007, 23, 82–91. [Google Scholar] [CrossRef]
- Nyssen, J.; Poesen, J.; Gebremichael, D.; Vancampenhout, K.; D’aes, M.; Yihdego, G.; Govers, G.; Leirs, H.; Moeyersons, J.; Naudts, J.; et al. Interdisciplinary on-site evaluation of stone bunds to control soil erosion on cropland in Northern Ethiopia. Soil Tillage Res. 2007, 94, 151–163. [Google Scholar] [CrossRef]
- Yadav, M.; Wagener, T.; Gupta, H. Regionalization of constraints on expected watershed response behavior for improved predictions in ungauged basins. Adv. Water Resour. 2007, 30, 1756–1774. [Google Scholar] [CrossRef]
- Montanari, L.; Sivapalan, M.; Montanari, A. Investigation of dominant hydrological processes in a tropical catchment in a monsoonal climate via the downward approach. Hydrol. Earth Syst. Sci. 2006, 10, 769–782. [Google Scholar] [CrossRef]


| Watershed Characteristics | Watersheds | |
|---|---|---|
| Tikur-Wuha | Guale | |
| Stream slope (%) | 5 | 11 |
| Soil type | Chromic Luvisols | Chromic Luvisols |
| Land use/cover (%) | ||
| Crop land (%) | 53 | 60 |
| Forest, shrub & bush (%) | 25 | 21 |
| Bare land (%) | 13 | 7 |
| Grazing land (%) | 8 | 12 |
| Settlement area (%) | 0.2 | 0.4 |
| Elevation range (m) | 2868–3303 | 2677–2863 |
| Gully area (ha) | 4.2 | 2.4 |
| Major crops were grown | Wheat, barley, potato | Wheat, barley, potato |
| Soil and Water Conservation Type | Tikur-Wuha Watershed | Guale Watershed | ||
|---|---|---|---|---|
| 2011 | 2012 | 2011 | 2012 | |
| Fodder and woodlots (ha) | 0.3 | 8.5 | 2.4 | 0 |
| Gully rehabilitation (m2) | 2100 | 100 | 1100 | 0 |
| SWCPs on agricultural lands (ha) | 40 | 14.8 | 38.1 | 3.7 |
| Degraded land treatment (ha) | 29 | |||
| Treated area (ha, (% of total area)) | 40 (8%) | 52.3 (10%) | 40.6 (21.4%) | 3.7 (2%) |
| Tikur-Wuha Watershed | |||||||||
|---|---|---|---|---|---|---|---|---|---|
| 2010 | 2011 | 2012 | |||||||
| Runoff | Rainfall | RC | Runoff | Rainfall | RC | Runoff | Rainfall | RC | |
| May | 41 | 115 | 0.36 | 25 | 127 | 0.20 | 13 | 77 | 0.17 |
| June | 33 | 151 | 0.22 | 22 | 193 | 0.11 | 46 | 280 | 0.16 |
| July | 79 | 461 | 0.17 | 110 | 500 | 0.22 | 73 | 487 | 0.15 |
| August | 81 | 435 | 0.19 | 125 | 458 | 0.27 | 64 | 330 | 0.19 |
| September | 39 | 168 | 0.23 | 51 | 165 | 0.31 | 34 | 132 | 0.26 |
| Total | 273 | 1330 | 0.21 | 333 | 1443 | 0.23 | 230 | 1306 | 0.18 |
| Guale Watershed | |||||||||
| May | 20 | 83 | 0.24 | 33.3 | 145 | 0.23 | 0 | 39 | 0.00 |
| June | 75 | 232 | 0.32 | 40.2 | 152 | 0.26 | 85 | 270 | 0.31 |
| July | 135 | 426 | 0.32 | 153.4 | 445 | 0.34 | 142 | 484 | 0.29 |
| August | 126 | 409 | 0.31 | 146 | 449 | 0.33 | 137 | 446 | 0.31 |
| September | 67 | 194 | 0.35 | 106.9 | 285 | 0.38 | 66 | 186 | 0.35 |
| Total | 423 | 1344 | 0.31 | 479.8 | 1476 | 0.33 | 430 | 1425 | 0.30 |
| Month | Tikur-Wuha Watershed | Guale Watershed | ||||
|---|---|---|---|---|---|---|
| 2010 | 2011 | 2012 | 2010 | 2011 | 2012 | |
| January | 1.0 | 0.0 | 0.0 | 0.9 | 0.0 | 0.0 |
| Febuary | 1.3 | 0.0 | 0.0 | 0.3 | 0.0 | 0.0 |
| March | 1.4 | 0.1 | 0.1 | 0.3 | 0.0 | 0.0 |
| April | 4.6 | 0.1 | 0.0 | 0.3 | 0.0 | 0.0 |
| May | 7.1 | 8.4 | 0.1 | 0.7 | 0.6 | 0.0 |
| June | 12.2 | 4.5 | 5.0 | 17.5 | 0.6 | 1.3 |
| July | 12.1 | 6.5 | 1.4 | 13.0 | 23.5 | 17.6 |
| August | 9.9 | 1.1 | 1.4 | 10.1 | 18.5 | 6.7 |
| September | 1.3 | 0.4 | 0.1 | 6.2 | 2.6 | 1.2 |
| October | 0.2 | 0.1 | 0.2 | 0.1 | 0.2 | 0.4 |
| November | 0.1 | 0.1 | 0.0 | 0.1 | 0.2 | 0.0 |
| December | 0.0 | 0.1 | 0.0 | 0.0 | 0.2 | 0.0 |
| Total | 51.1 | 21.5 | 8.3 | 49.4 | 46.4 | 27.2 |
| Difference | −58% | −84% | −6% | −45% | ||
© 2017 by the authors. Licensee MDPI, Basel, Switzerland. This article is an open access article distributed under the terms and conditions of the Creative Commons Attribution (CC BY) license (http://creativecommons.org/licenses/by/4.0/).
Share and Cite
Akale, A.T.; Dagnew, D.C.; Belete, M.A.; Tilahun, S.A.; Mekuria, W.; Steenhuis, T.S. Impact of Soil Depth and Topography on the Effectiveness of Conservation Practices on Discharge and Soil Loss in the Ethiopian Highlands. Land 2017, 6, 78. https://0-doi-org.brum.beds.ac.uk/10.3390/land6040078
Akale AT, Dagnew DC, Belete MA, Tilahun SA, Mekuria W, Steenhuis TS. Impact of Soil Depth and Topography on the Effectiveness of Conservation Practices on Discharge and Soil Loss in the Ethiopian Highlands. Land. 2017; 6(4):78. https://0-doi-org.brum.beds.ac.uk/10.3390/land6040078
Chicago/Turabian StyleAkale, Adugnaw T., Dessalegn C. Dagnew, Mulugeta A. Belete, Seifu A. Tilahun, Wolde Mekuria, and Tammo S. Steenhuis. 2017. "Impact of Soil Depth and Topography on the Effectiveness of Conservation Practices on Discharge and Soil Loss in the Ethiopian Highlands" Land 6, no. 4: 78. https://0-doi-org.brum.beds.ac.uk/10.3390/land6040078