The Role of Remote Sensing for Understanding Large-Scale Rubber Concession Expansion in Southern Laos


1
Nelson Institute for Environmental Studies & Department of Forest and Wildlife Ecology, University of Wisconsin-Madison, Madison, WI 53706, USA
2
Department of Geography, University of Wisconsin-Madison, Madison, WI 53706, USA
3
Centre for Development and Environment, University of Bern, 3012 Bern, Switzerland
*
Author to whom correspondence should be addressed.
Land 2018, 7(2), 55; https://0-doi-org.brum.beds.ac.uk/10.3390/land7020055
Submission received: 4 April 2018
/
Revised: 18 April 2018
/
Accepted: 18 April 2018
/
Published: 20 April 2018
Abstract
:Increasing global demand for natural rubber began in the mid-2000s and led to large-scale expansion of plantations in Laos until rubber latex prices declined greatly beginning in 2011. The expansion of rubber did not, however, occur uniformly across the country. While the north and central Laos experienced mostly local and smallholder plantations, rubber expansion in the south was dominated by transnational companies from Vietnam, China and Thailand through large-scale land concessions, often causing conflicts with local communities. In this study we use satellite remote sensing to identify and map the expansion of large-scale rubber plantations in Champasak Province—the first area in southern Laos to host large-scale rubber development—and document the biophysical impacts on the local landscape, which of course is linked to social impacts on local people. Our study demonstrates that the expansion of rubber in the province was rapid and did not always conform to approved concession area locations. The mono-culture nature of rubber plantations also had the effect of homogenizing the landscape, eclipsing the changes caused by local populations. We argue that by providing a relatively inexpensive way to track the expansion of rubber plantations over space and time, remote sensing has the potential to provide advocates and other civil society groups with data that might otherwise remain limited to the restricted domains of state regulation and private sector reporting. However, we also caution that while remote sensing has the potential to provide strong public evidence about plantation expansion, access to and control of this information ultimately determines its value.
1. Introduction
During the mid-2000s, the world began experiencing dramatic increases in demand and prices for raw rubber (Hevea brasiliensis), leading to the rapid expansion of plantation rubber in mainland Southeast Asia [1], especially in Cambodia, Vietnam, Thailand, Myanmar, southern China and Laos. Hundreds of thousands of hectares of rubber were planted in the Lao People’s Democratic Republic (Lao PDR or Laos) [2,3,4] up until rubber prices began to dramatically decline in 2011 [5]. While northern and central Laos have experienced a mixture of different types of rubber development, ranging from small-scale private development to contract farming and larger land concessions [6,7,8,9,10,11,12,13], the geography of rubber planting in southern Laos has been far more uniform [14]. Indeed, rubber in the south has, at least until recently, almost exclusively taken the form of large-scale concessions of putatively state land, granted to Vietnamese companies by central government-level long-term agreements, and characterized by high degrees of enclosure, serious environmental impacts, substantial negative impact on local communities, and correspondingly high local resentment [15,16,17,18,19,20,21,22,23]. Even before rubber prices began to fall in 2011, little interest was seen amongst farmers in southern Laos for developing small-scale rubber plantations like in the north [15].
Large-scale land concessions for rubber in southern Laos have been highly controversial, and in recent years researchers have described serious problems associated with dramatic landscape and livelihood transformations [16,17,20,21,22]. In fact, large-scale Vietnamese rubber development in Bachiengchaleunsouk (Bachieng) District, Champasak Province helped trigger Laos’s first moratorium on new economic land concessions in 2007 [15]. Unfortunately, rather than learning from early mistakes, problems have generally expanded to other parts of southern Laos. The May 2013 report Rubber Barons by the UK-based organization Global Witness—perhaps the most visible investigation to date—showed large-scale Vietnamese rubber investments in every province in southern Laos, as well as across large areas of northeastern Cambodia [24]. Other studies [17,19,25,26] in the region have also noted the persistence of land conflict with local communities.
Despite this attention, key aspects of the expansion of rubber in southern Laos have remained opaque. Contracts, plans, maps and monitoring reports (to the extent that the latter exist) are largely concealed from public view [21,22], and while local residents generally know the names of the companies operating in their vicinities, project boundaries have been both unclear and a topic of substantial concern and apprehension amongst small-scale farmers. Unclear relationships between differently named companies and projects, moreover, make it even more difficult for locals to pursue accountability [24]. Even as Laos’s investment landscape has somewhat come into focus at the national scale [2], spatial resolution at the local scale of projects, in villages and on company plots remains extremely low. In the absence of more detailed information from government, companies or civil society, key questions about the extent, timing and impacts of project operations remain unanswered [27].
This paper aims to fill some of these gaps, focusing on the rapid expansion of rubber plantations in southern Laos’s Champasak Province, the first area in the region to host large-scale rubber development. Using a combination of remote sensing, and advocacy-oriented fieldwork, which involved collecting field data about the problems local people were facing as a result of the rubber concessions, and engaging with discussions with villagers and government officials about their impacts [15], one purpose of this paper is to document the changes in the landscape associated with the development of three large Vietnamese rubber land concessions. In particular, we aim to describe the impacts of these rubber concessions, both biophysical and social, on the local landscape and population. This includes examining landscape pattern metrics such as patch size and considering the relationship between official concession area plans and actual implementation. Another goal is to examine ways in which remote sensing data related to land concessions might be useful for a range of actors—including civil society advocates, concerned government regulators, and due diligence researchers in the private sector—who are in need of local-level data about the alienation or “grabbing” of smallholder and common lands [28].
Satellite-based remote sensing offers tremendous potential for monitoring land-cover and land-use change caused by large-scale land concessions. Its principle advantage is that it provides synoptic coverage of many land surface types in several spectral regions and with temporal frequencies sufficient to assess vegetation growth, maturity, and harvest. Since land-use change is one of the most desired forms of information for studying land concessions, archived image data that span many years allow comparison of images. The digital nature of satellite data makes it relatively easy to integrate into a Geographic Information System (GIS) for synthesis or comparison with other (e.g., field-derived) data sources.
In the context of the Lao concession boom, between the mid-2000s and approximately 2012, the approach documented here addresses a number of important gaps. First, concession area locations approved by government agencies, to the extent these are well-defined, are often altered significantly during the course of implementation. Whether this is a good or a bad thing depends on circumstance; accommodation to local conditions that were not evident when plans were made can reflect implementation that is reflexive rather than simply by-the-book; but it can also be an indication of poor planning, if plans were un-matched to conditions on the ground. Research capable of differentiating between these two scenarios has located actual concession implementation at the intersection of differential local resistance and competition over land-based rents among different state actors [13,29,30]. But as Hett and colleagues show, tracking the relationship between planned concession areas and areas actually developed is a tall undertaking, and requires an additional level of investigation in order to explain why mismatches between planned and actual concession areas take the forms they do [31]. By pairing grounded and collaborative fieldwork with remote-sensing-based analysis of land use change, this study seeks to bridge pattern and process and, in doing so, understand when conformance with “the plan” is important to pursue from a good governance perspective, versus when it might be a red herring that detracts from legitimate accommodation to local circumstances.
Second, by providing a relatively inexpensive way to track the expansion of rubber plantations over space and time, remote sensing has the potential to provide advocates and other civil society groups with data that might otherwise remain limited to the restricted domains of state regulation and private sector reporting [32]. Efforts to disseminate information to local people about the potential impacts of large-scale land concessions, and to advocate efforts for local land rights in contested landscapes could be significantly strengthened if the extent and the actual spatial distribution of rubber plantations were known by local communities. At present, project-area residents—despite being essential (and among the most vulnerable) actors on land slated for conversion—frequently have inadequate information, and suffer as a result. Many village leaders have, for example, signed away their land for concessions due to the erroneous belief that they had no option but to agree to the proposal to take their land for purposes of development [15,22]. Providing a stronger, public evidence base about plantation expansion and development throughout the wider region can be a powerful tool in the complex and often opaque process of concession planning, regulation, negotiation and remedy.
This paper thus seeks to help rebalance the power asymmetry that often exists for detailed spatial information about concessions. It also serves to establish a framework for integrating remote sensing and advocacy-oriented fieldwork. A cautionary note is needed, however, so as to avoid a naïve equation of more information with better governance. Remote-sensing-generated maps have the potential to benefit local people trying to protect their rights, but the same technology can also be used by those looking for areas to develop rubber plantations. As many other authors have pointed out, much depends on who has access to and control of the maps [33,34,35,36]. This essential point highlights the issue of information control as much as information content in shaping the likely outcomes of the sorts of collaborative efforts discussed below. We return to this in the conclusion.
2. Approach and Methods
Understanding the social, economic, and ecological landscape that underpins large-scale rubber concessions in southern Laos requires an interdisciplinary approach capable of linking the political economy of development, collaborative research with civil society groups, the ecology of rubber, and remote sensing methodology and data. The research presented here is inherently interdisciplinary and seeks to establish a framework for integrating remotely sensed observations of rubber plantations with advocacy-oriented fieldwork. Part of southern Laos is the case study chosen here, but we hope this framework might be used to support struggles directed against what has become widely known as “land grabbing” in other places as well. Combining views from below and above, as elaborated next, provides the basis for the results and discussion presented in Section 3.
2.1. Research Site and Field Methods
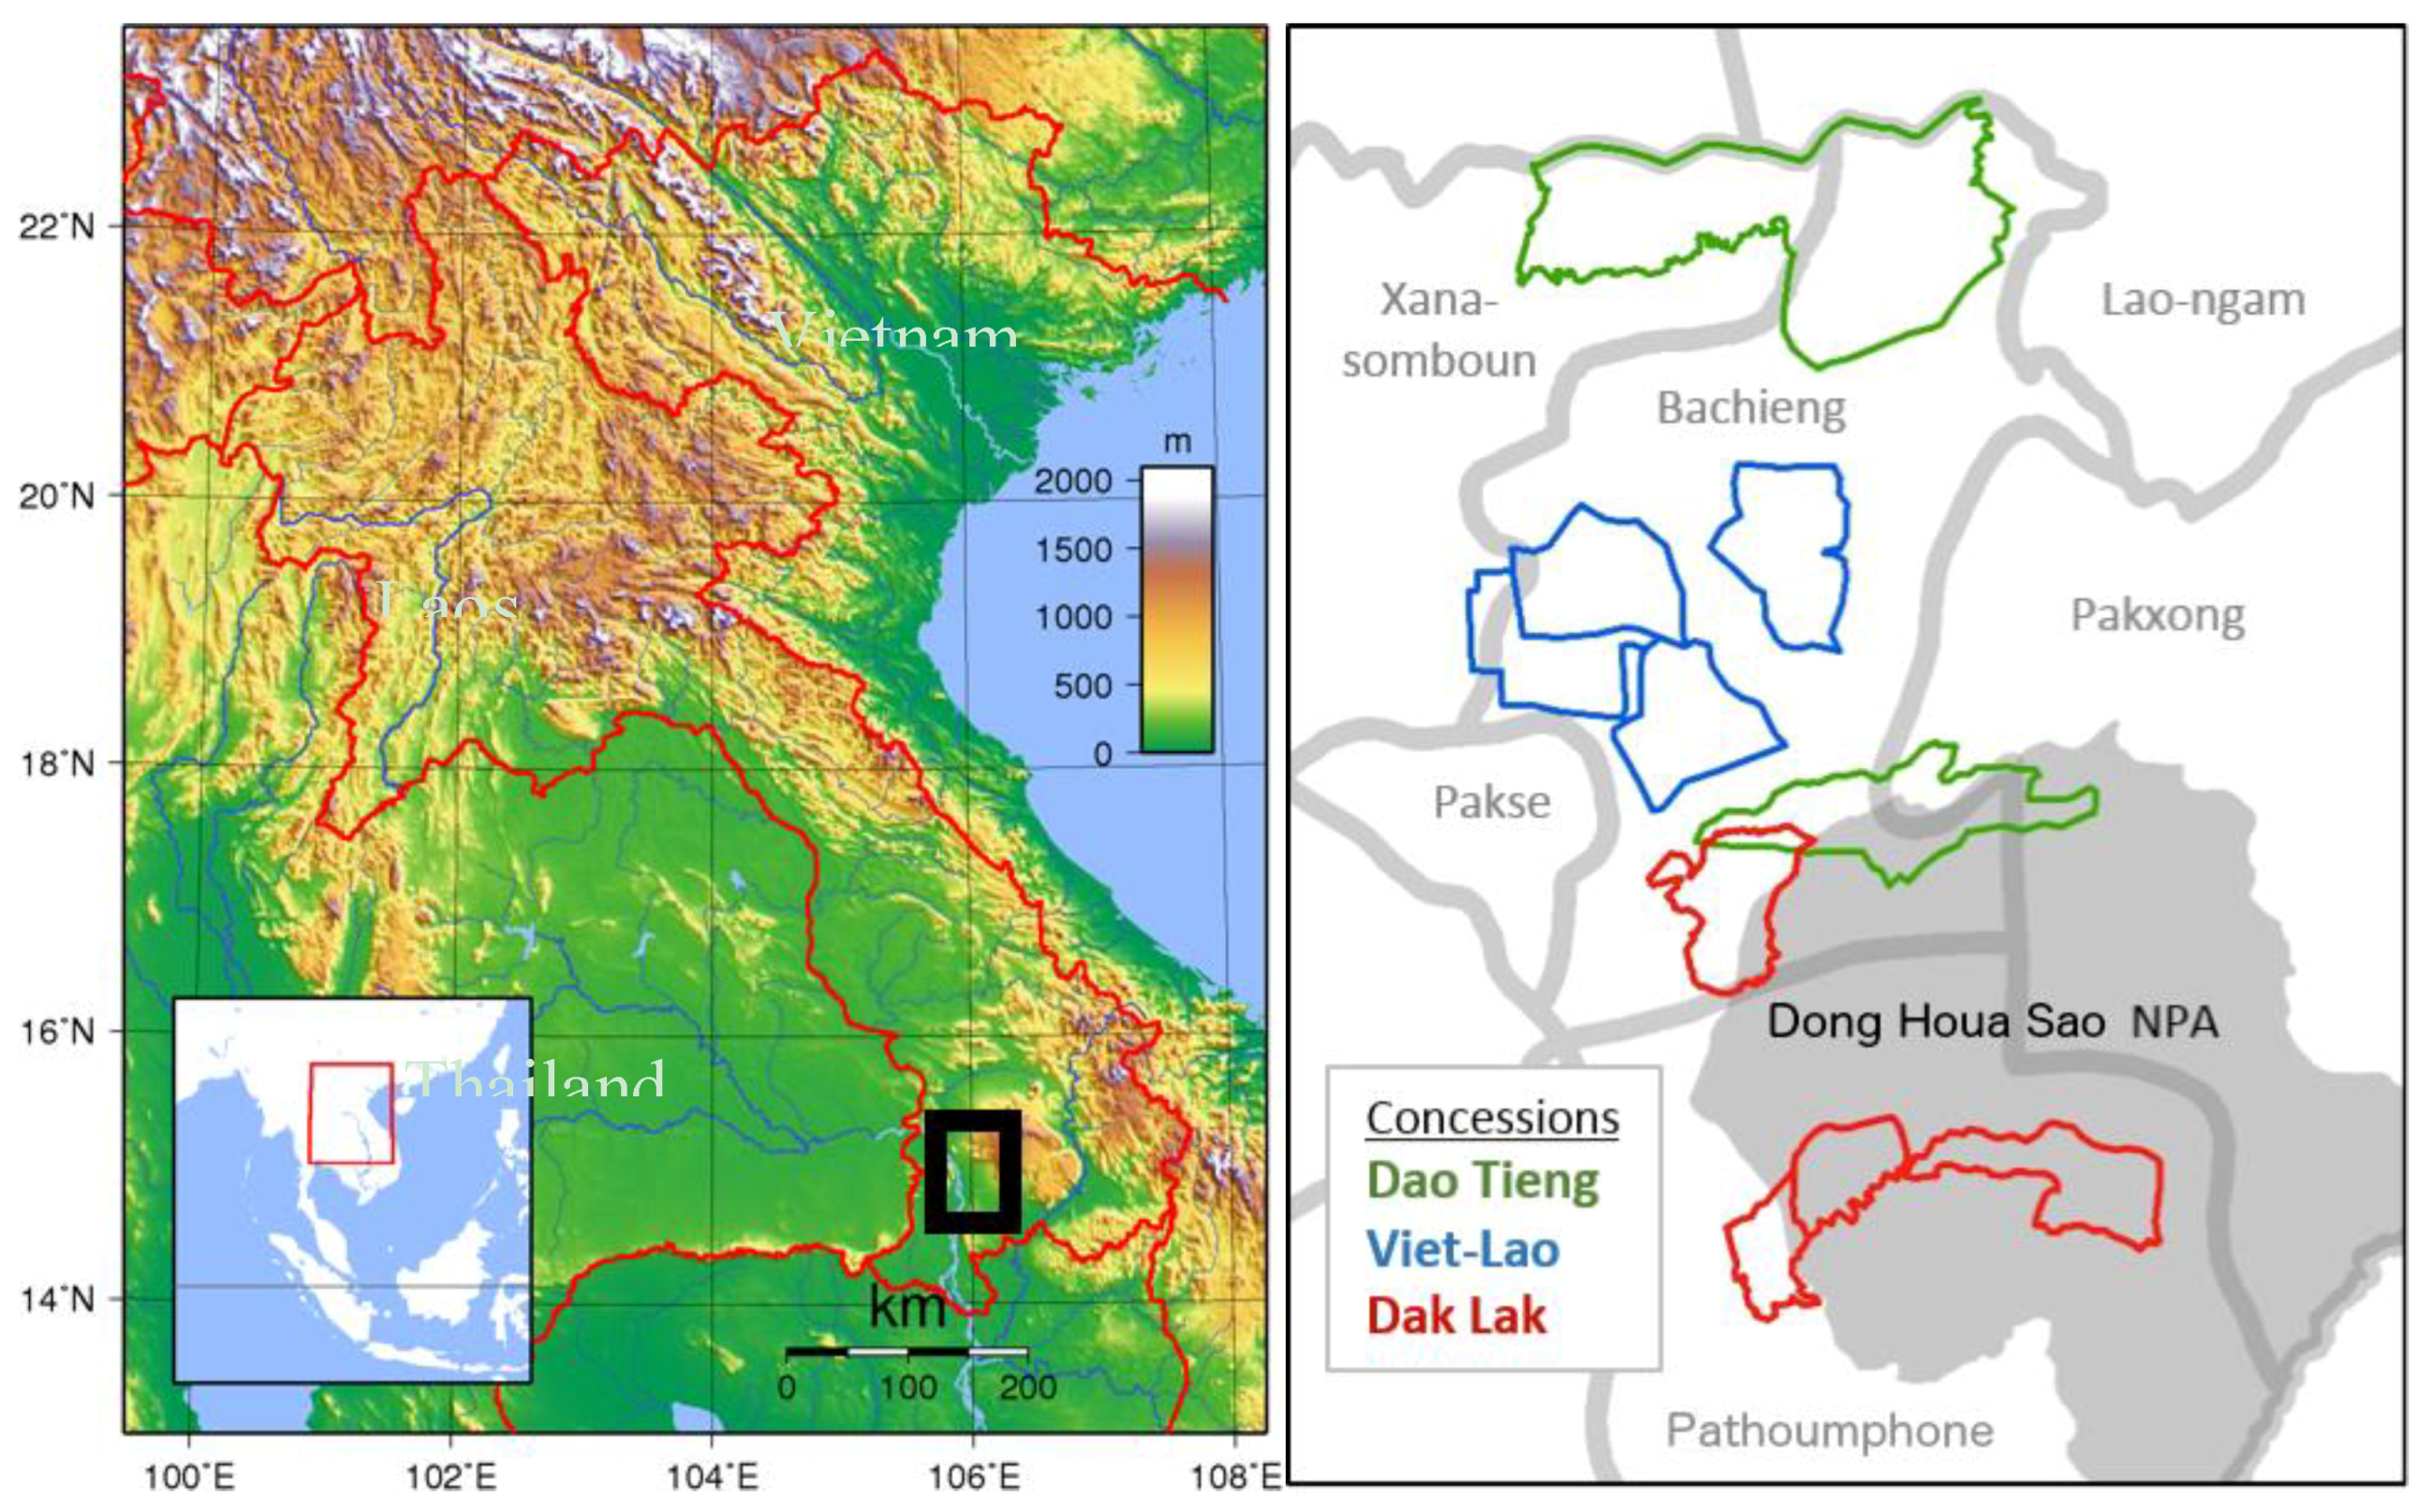
Prior to conducting the remote sensing work described in Section 2.2, we were already aware from our partnership with an international non-government organization (NGO) in southern Laos, which we do not name due to fears of potential repercussions, that three large Vietnamese-owned rubber concessions were being implemented on the slopes of the Bolaven Plateau (Figure 1). The first, owned by the Vietnam-Laos Rubber Joint Stock Company (commonly referred to as the Viet-Lao Rubber Company, VLRC, Hochiminh City, Vietnam), was granted in June 2004, and provided the company with access to 10,000 hectares (ha) in Bachieng District over a period of 50 years. Shortly thereafter (the following month actually), the Dak Lak Rubber Company, Buon Ma Thuot, Vietnam received a second 10,000 ha, 50-year concession for rubber, also in Bachieng District, but also including parts of two neighboring districts (Pakxong in Champasak Province and Lao-ngam in Salavan Province). In 2006, a third company, the Dao Tieng (also known as Yao Tieng) Viet-Lao Rubber Company (Vietnam), was given a 40-year agreement to develop a third 10,000 ha rubber concession, this time in Champasak Province’s Bachieng and Pathoumphone districts [14,15,23]. The 30,000 ha allocated to these three companies are the focus of this study.
Although the NGO we partnered with was also aware of the widespread land alienation problems that communities in the area were facing due to concessions [15,16], the full spatial extent of these plantations was unknown. Concession surveying in Laos tends to be a relatively opaque process [30]. Local communities may know that particular companies are looking for land, but they are rarely presented with maps showing where surveying is taking place, or other areas that have been already allocated. Moreover, contracts for plantation development generally do not include maps; projects are allocated land—for example 10,000 ha in Bachieng District—in the abstract, with the identification of which 10,000 ha put off until later. The identification of the precise parcels of land to be included in the concession is thus left to a survey process, conducted after the signing of the contract and often involving significant coercion in order to fill the quota of land that has been (allegedly) promised to the company [20,22,26,37].1 This process of finding and asserting control over state land after-the-fact—rather than allocating pre-identified (and obviously state-owned) land—makes the geography of land concessions difficult to follow, highly controversial, and anxiety-producing for local populations [15,16,21,30,38,39].
Our project thus presented an opportunity to use remote sensing data, and the power of maps more generally, to help understanding the land-use changes associated with concession-making. Initially, our NGO partners assisted by collecting GPS points from the land concession area as they experienced it locally (i.e., without the assistance of maps). The condition of the land associated with each GPS point was recorded; this helped with initial remote sensing analysis, assisting with calibrating what could be seen through remote sensing with actual conditions on the ground.
In addition, we were able to obtain documents showing a mix of survey and plantation areas for the three concessions of interest.2 While not pre-approved boundaries in the sense that one might hope for from pre-identified state land, these maps provided indicators of where the concessions were expected to and supposed to be developed circa 2007. We noticed that there was some overlap between two concession areas and one of Laos’ National Protected Areas (NPAs), Dong Houa Sao, so we added the boundaries of this protected area to our map showing local administrative units and planned project areas (Figure 1). Through this process, we were able to take the first step toward comparing actual land-use change to planned allocations for plantations and protected areas.
2.2. Remote Sensing of Rubber Plantations
For our remote sensing component, we made use of image data acquired by Landsat satellites. Landsat data are distributed as individual footprints conforming to the World Reference System-2 (WRS-2). Our study area is located between two footprints (path 126 and rows 49 and 50). We acquired a total of 20 images (10 for each footprint) between 2004 and 2012 (Table 1) over the broad area where the concessions of interest are located. Landsat data have six spectral bands ranging from visible blue to shortwave infrared (SWIR), and a revisit capability of 16 days. Due to frequent cloud coverage in the rainy season, we combined data acquired with Landsat 5 (Thematic Mapper or TM) and 7 (Enhanced Thematic Mapper Plus or ETM+), which increased the repeat frequency to eight days and improved the probability of cloud-free observations. Landsat data have 30-m spatial resolution. Our data would thus be classified as having medium spatial resolution and medium temporal frequency (a few images throughout the year). Finally, we used surface reflectance images that have been corrected for the influence of the atmosphere using the LEDAPS algorithm [40].
The principal method of information extraction from remotely sensed data included both visual and digital techniques. In the former, we visually traced the boundaries of existing rubber plantation areas across a series of Landsat images between 2004 and 2012, using the GPS-based observations described above to ground-truth and calibrate our inferences. More specifically, we first located the GPS points that show the locations of rubber planted areas on the Landsat data and traced the boundaries of changed (i.e., rubber planted) areas in a multi-temporal framework. For example, a parcel of land that was a natural forest in 2004 and cleared and converted to rubber plantation in 2005 was analyzed in a paired SWIR imagery in which the SWIR band in 2004, SWIR band in 2005 and SWIR band in 2005 again were combined into a Red-Green-Blue (RGB) composite. For each plantation, we examined a temporal image pair starting with 2011–2012 and working back to 2004–2005. The same analysis was also repeated with vegetation index inputs such as the Normalized Difference Vegetation Index (NDVI) [41], in which the original spectral bands are algebraically combined to amplify the contrast between vegetated and non-vegetated areas. During the digitization process we paid particular attention to the changes in color, tone, texture, and shape between the two images that form the pair. This form of detection, while time intensive, was not particularly complicated, and provided an excellent example of the practical utility of remote sensing for detecting rubber plantations. Moreover, through the use of Landsat data, this approach proved cost-effective for obtaining multiple images during a single year (e.g., one in rainy and one in dry season), which became an important consideration for separating rubber from other plantations.
Note that due to the hand digitized nature of this analysis, the resulting maps were considered to be 100% accurate. To this end, no formal accuracy was conducted for these maps. In our view, this form of digitization of rubber plantation boundaries is akin to drawing reference samples on a map or satellite data used in supervised classification. Instead of drawing small polygon samples that would be used in digital classification, we simply carefully digitized the boundaries of all rubber plantations through time. While such analysis may be cumbersome in other contexts, the very nature of rubber plantations as well as their considerably smaller number made this form of visual analysis possible. In the end these hand-digitized maps were used for two purposes: (a) to develop the reference database to be used in supervised image classification (see below) and (b) to accurately enumerate the changes in rubber plantation areas through time.
During the hand digitization phase we also noticed that rubber planted areas were unusually homogenous in terms of landscape texture when compared to lands they replace. To quantify this homogenization, we performed texture analysis on satellite data [42]. The goal of texture analysis is to capture the variability of image gray level values in the spatial domain [43]. While a number of texture measures exist, they all focus on quantifying heterogeneity in image gray level values within a local neighborhood, either based on the first-order (occurrence) or second- order (co-occurrence) grey level histogram [44]. Also to consider is the size of the moving window used to calculate them [45]. For the analysis here, we chose a co-occurrence measure (contrast) because of the obvious nature of the task at hand, using only the near-infrared band (NIR) and a window size of 7 pixels. The band choice was determined by trial and error to produce the highest contrast between rubber planted areas and other locations while the window size was equivalent to the smallest homogenous patch in the landscape that was visually determined. The contrast feature measures the local variations in the gray-level co-occurrence matrix and determines the intensity contrast between a pixel and its neighbor over the whole image.
The second form of image analysis involved digital image classification to test the efficacy of automated methods for identifying and mapping plantation locations. We used a supervised image classification algorithm involving Decision Trees (DT) [46] and in particular the C4.5 algorithm [47]. In general, the DT algorithms work by recursively splitting the input reference data into smaller and more homogeneous clusters that refer to individual land-use categories. The C4.5 algorithm used here has been modified to include Boosting, an ensemble meta-algorithm known to reducing bias and variance [48]. The C4.5 DT algorithm is fast but is completely dependent on the quality and representativeness of learning (training) examples. For training data, we used the rubber plantation map created by visual image interpretation described above and focused on only two categories: “rubber plantations” and “other” for each year between 2004 and 2012. More specifically, using the hand-digitized map we generated a total of 2000 randomly located samples using a proportional allocation approach, in which the areal proportions of each category (rubber plantations and others) determined the number of samples allocated. Each sample started out as a single 30-m by 30-m pixel but was buffered by one pixel in all directions to allow for geolocation errors. While the hand-digitized map and hence the samples from it were considered to be 100% accurate in their class labels, each sample was further evaluated for thematic accuracy by overlaying it on a temporal Landsat image stack. This process did not lead to removal of any samples.
In the next step, we divided these 2000 samples into training (75%) and testing (25%) sets used for training the C4.5 algorithm and for final map accuracy assessment respectively. Using the training set, we developed and applied classification rules with the help of the C4.5 algorithm and produced a rubber plantation map spanning all study years (2004–2012). As in our visual interpretation, digital image classification benefited from spectral transformations. The NDVI inputs in particular were indispensable for distinguishing planted areas from continuous forest or agricultural areas. In cases of confusion between mature rubber plantations and natural forested areas, multi-temporal NDVI features such as the range and maximum values helped improve the separation. Also helpful was the use of two or more images per year, based on the premise that the discrimination procedure relies on differential spectral responses of different land cover categories according to their phenological change [32]. The improvements from multi-temporal image data were conditional upon the temporal and spatial variability of the spectral signature of the land cover types in question, however, so the availability of images taken at critical phenological transition times was an important requirement for the temporal approach to work effectively. Tests with sample data suggested that in general, inputs involving one or more derived vegetation indices in addition to the raw input data consistently produced higher classification accuracies.
For accuracy assessment, the test samples were used to generate a confusion matrix, a standard tool for quantifying map accuracy derived from remotely sensed data [49,50], while keeping samples from the same polygon together to prevent artificial inflation of accuracy [51]. This resulted in a total of 575 samples being available for accuracy assessment. Note that while it would have been desirable to use a ground-validated dataset to assess the accuracy of the land cover maps resulting from supervised classification, neither the data nor the resources needed to evaluate the entire area of the study were available.
3. Results and Discussion
3.1. Rubber Planted Areas
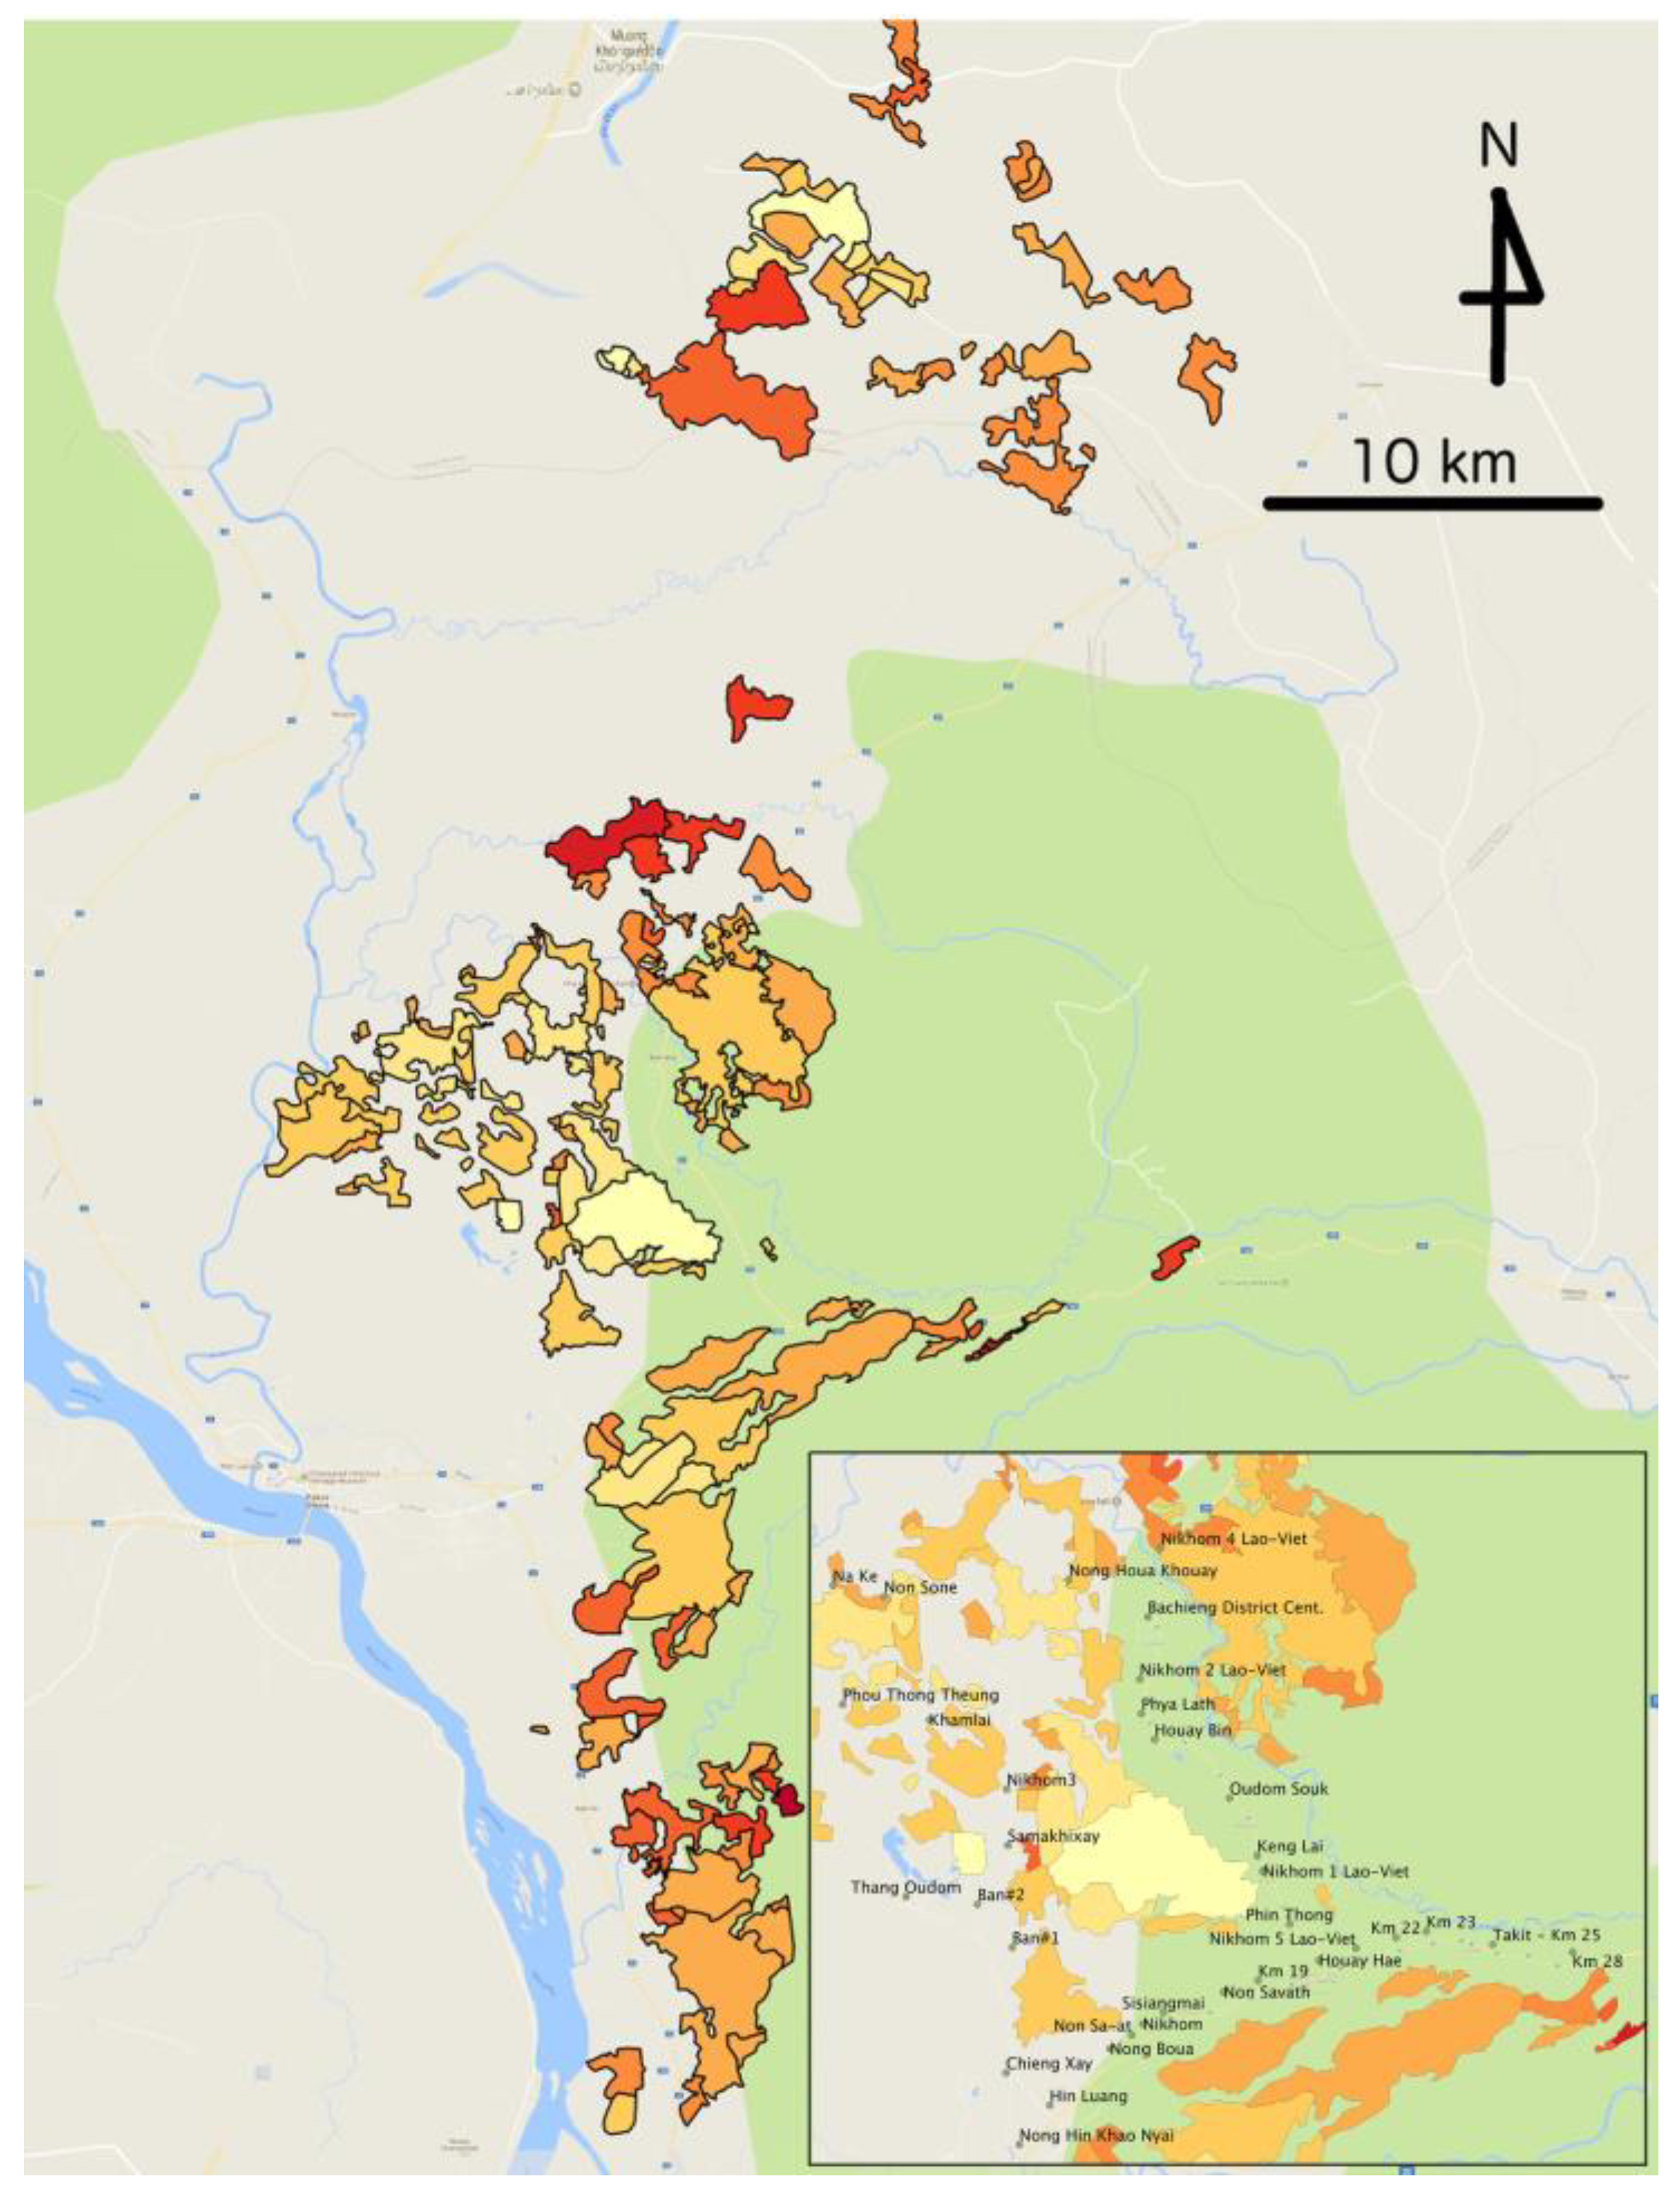
Our remote sensing analysis identified over 30,000 ha of rubber planted between 2004 and 2012 in the mixed foothills to the east of the Mekong River and north, west and south of the Bolaven Plateau (Figure 2a). These new rubber areas comprise over 70 annually distinct patches, which make up more than 25 distinct plantations when combined into multi-aged stands. These plantations have a partial, although highly uneven, correspondence to the concession areas pictured in Figure 1; we discuss this further below.
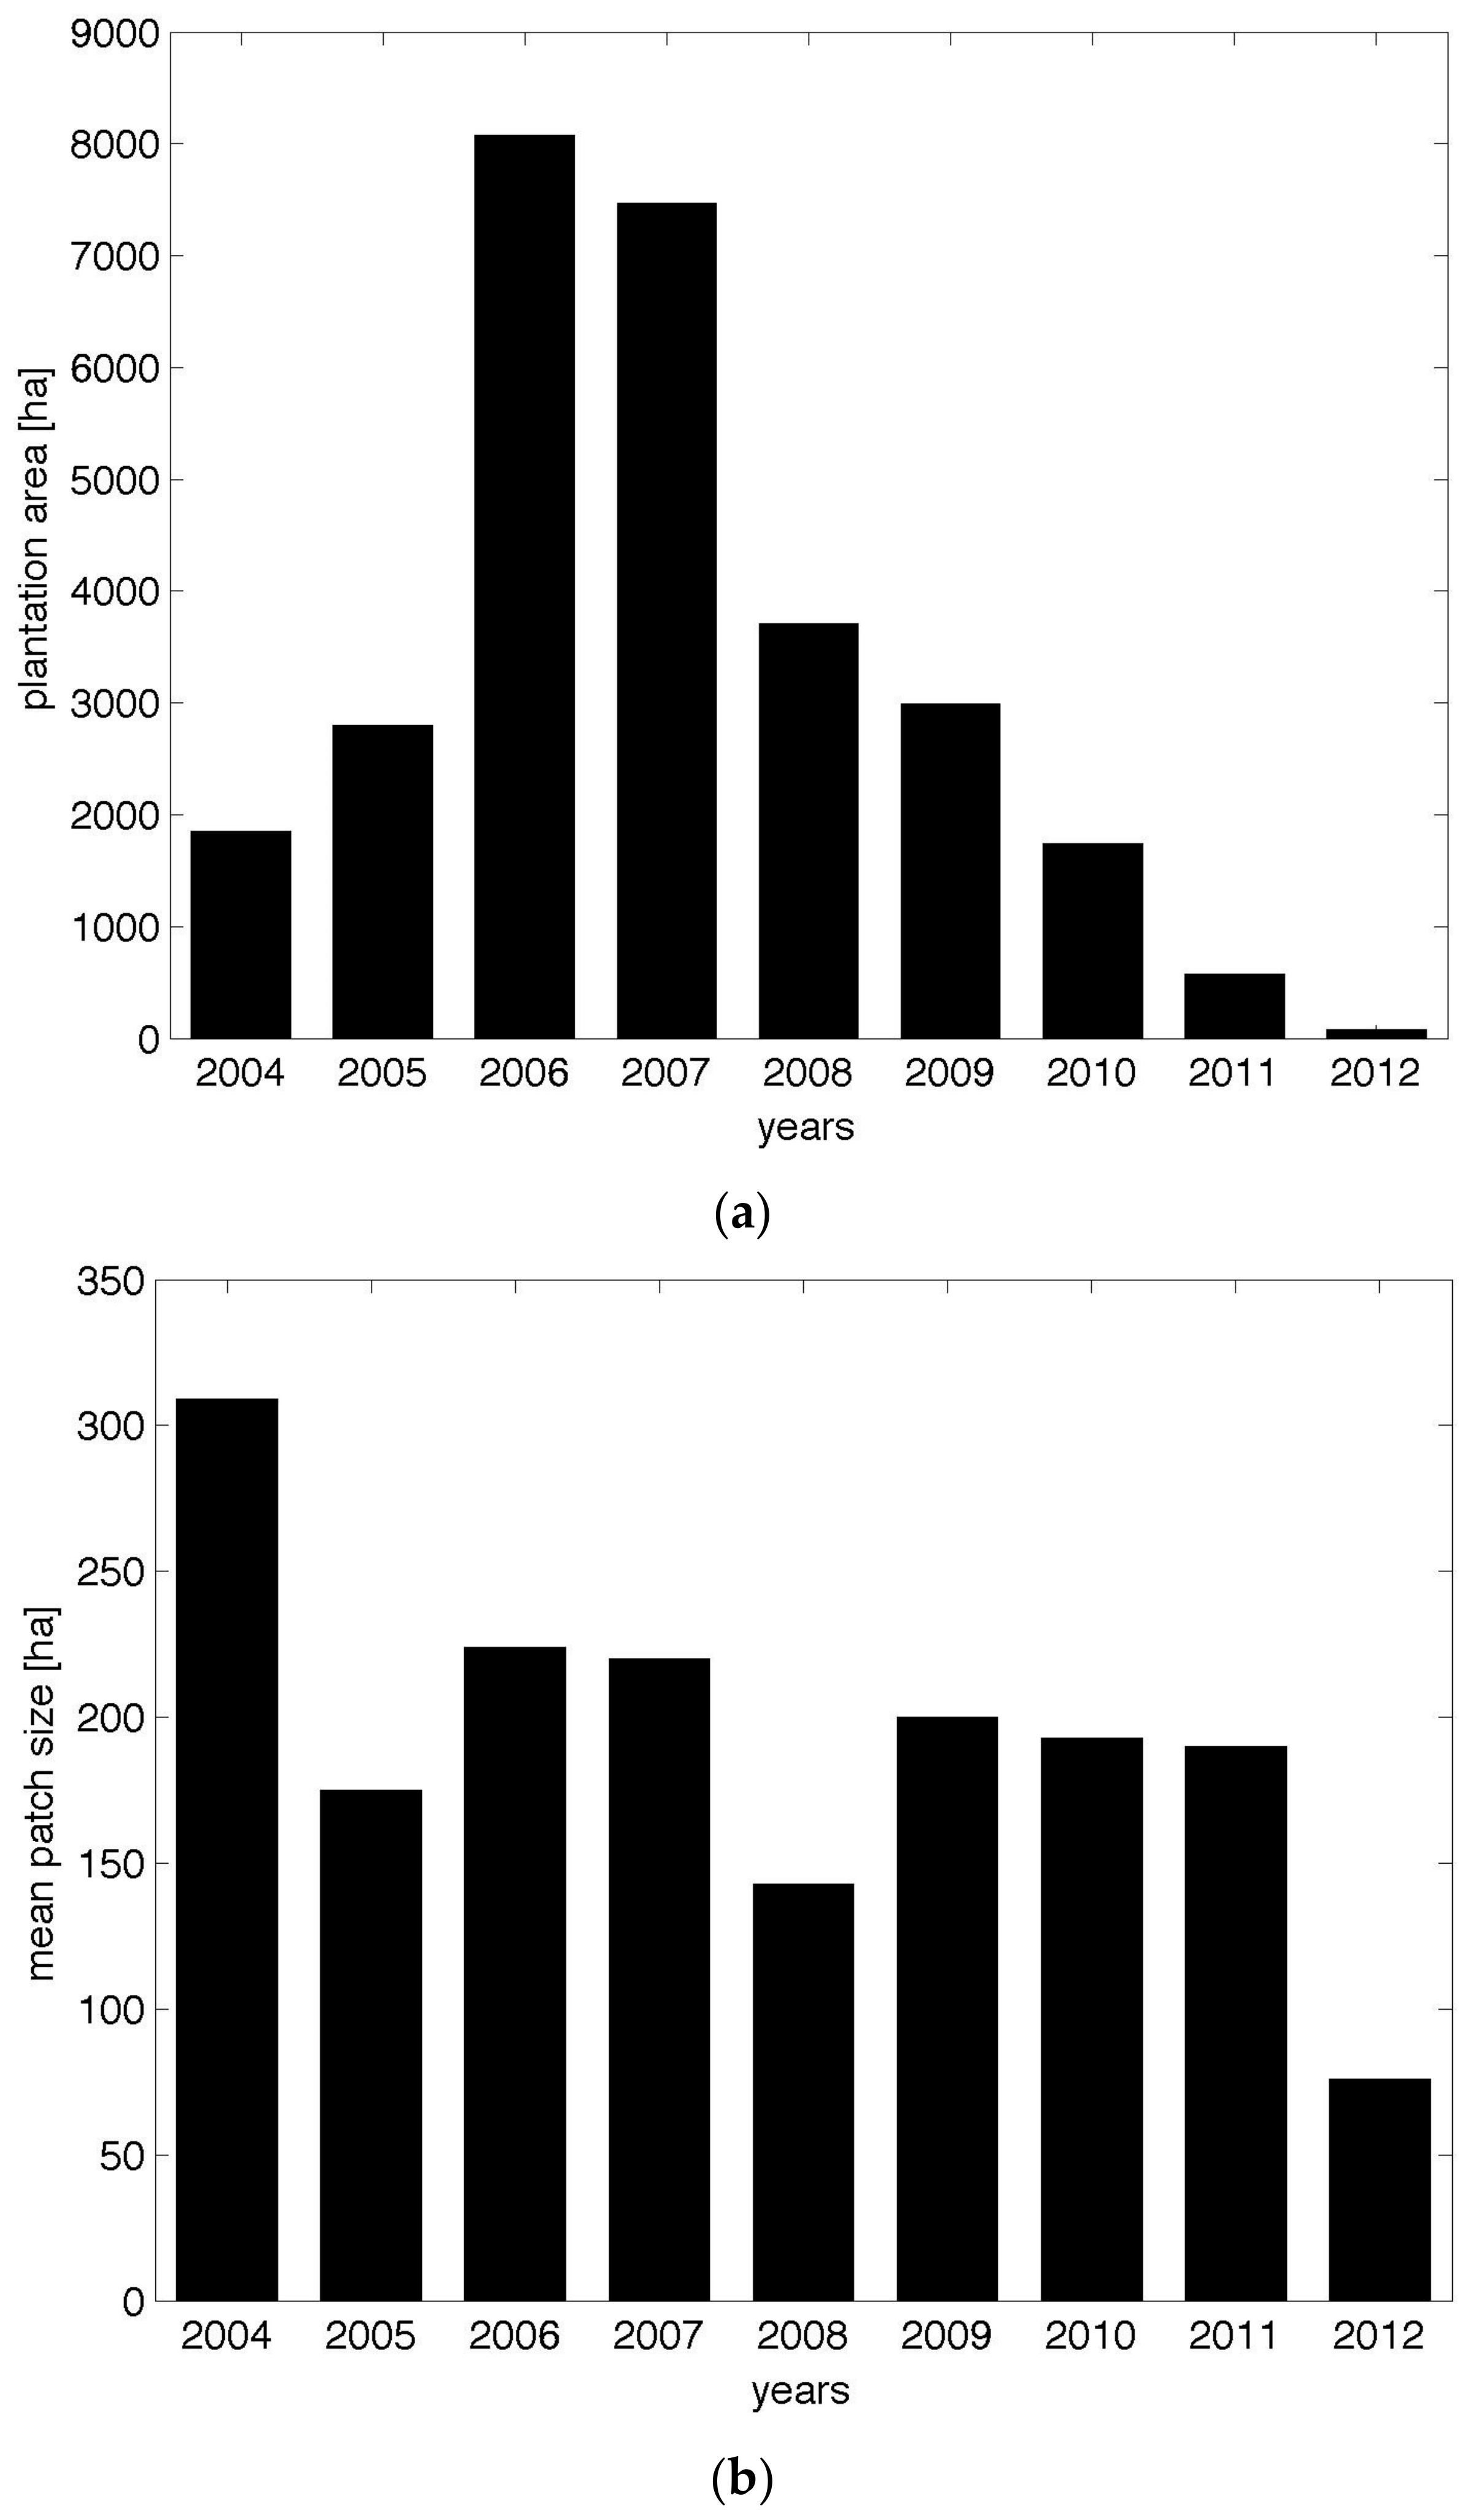
The sizes of the observed rubber patches ranged from less than 10 ha to more than 800 ha. Tracking the establishment and expansion of plantations over time with Landsat data reveals a relationship between timing and patch size: early clearings tended to be large—while later clearings were, as a rule, smaller. Based on our and others’ qualitative research in the area, this is likely to be more a function of social resistance and state regulation than the “filling up” of actually empty land; as noted in the literature on this area [15,16,21,23] and elaborated below, the areas targeted for conversion to rubber in the Bolaven foothills tended to be patchworks of extensive smallholder production which, when targeted by plantation developers, created substantial land conflicts and, eventually, state regulation. The large patch sizes observed early in this trajectory of conversions is consistent with our and others’ observations of local villagers’ transition from initial inexperience with the livelihood problems associated with the expansion of rubber plantations, to more vocal resistance, negotiations and complaints to the state. As those pressured or forced to give up their land to plantation companies began to object more, the size of new plantations decreased as a result. Moreover, district governments started to recognize the severe difficulties associated with taking almost all of the agricultural land of villages [23] and began to insist that villagers be left with larger pieces of land [15].
This trend is visible in Figure 2, and is quantified further in Figure 3. Measuring the distribution of individual plantation areas by year, we observe that the total clearing for rubber peaked in 2006 and 2007, with over 8000 and 7000 ha (respectively) converted in those two years alone (Figure 2a and Figure 3a). As Figure 2 and Figure 3b show (the first visually, the second through the measurement of mean patch size), new rubber areas tended to be especially large in these early years of 2004–2007. By 2009, as local resistance and government concern increased, and in the wake of a 2007 nationwide moratorium on rubber triggered by the VLRG project in particular [15], the rate of new conversions to rubber in the area began to slow. An NGO was also working in Bachieng District to provide legal training related to land issues, and had also supported other awareness raising activities about rubber expansion, the environment, livelihoods and land. This had some impact on the situation, and made it more difficult for the concessioners to gain large pieces of land. Even as the average patch size remained relatively large (only in 2008 did sizes drop below 150 ha, and then not again until 2012), total new clearances dropped significantly: to 3000 ha in 2009, and then by roughly half each year subsequently (Figure 3a). In 2012, the final year of our analysis, we identified only a single new plantation, and this was less than 80 ha in size.
The boom in rubber conversion observed between 2004 and 2012 is significant in a number of ways. Below we discuss two that pertain especially to the spatial dynamics discussed above, and that thus highlight the potential for collaborative research involving remotely sensed data.
3.2. Image Classification
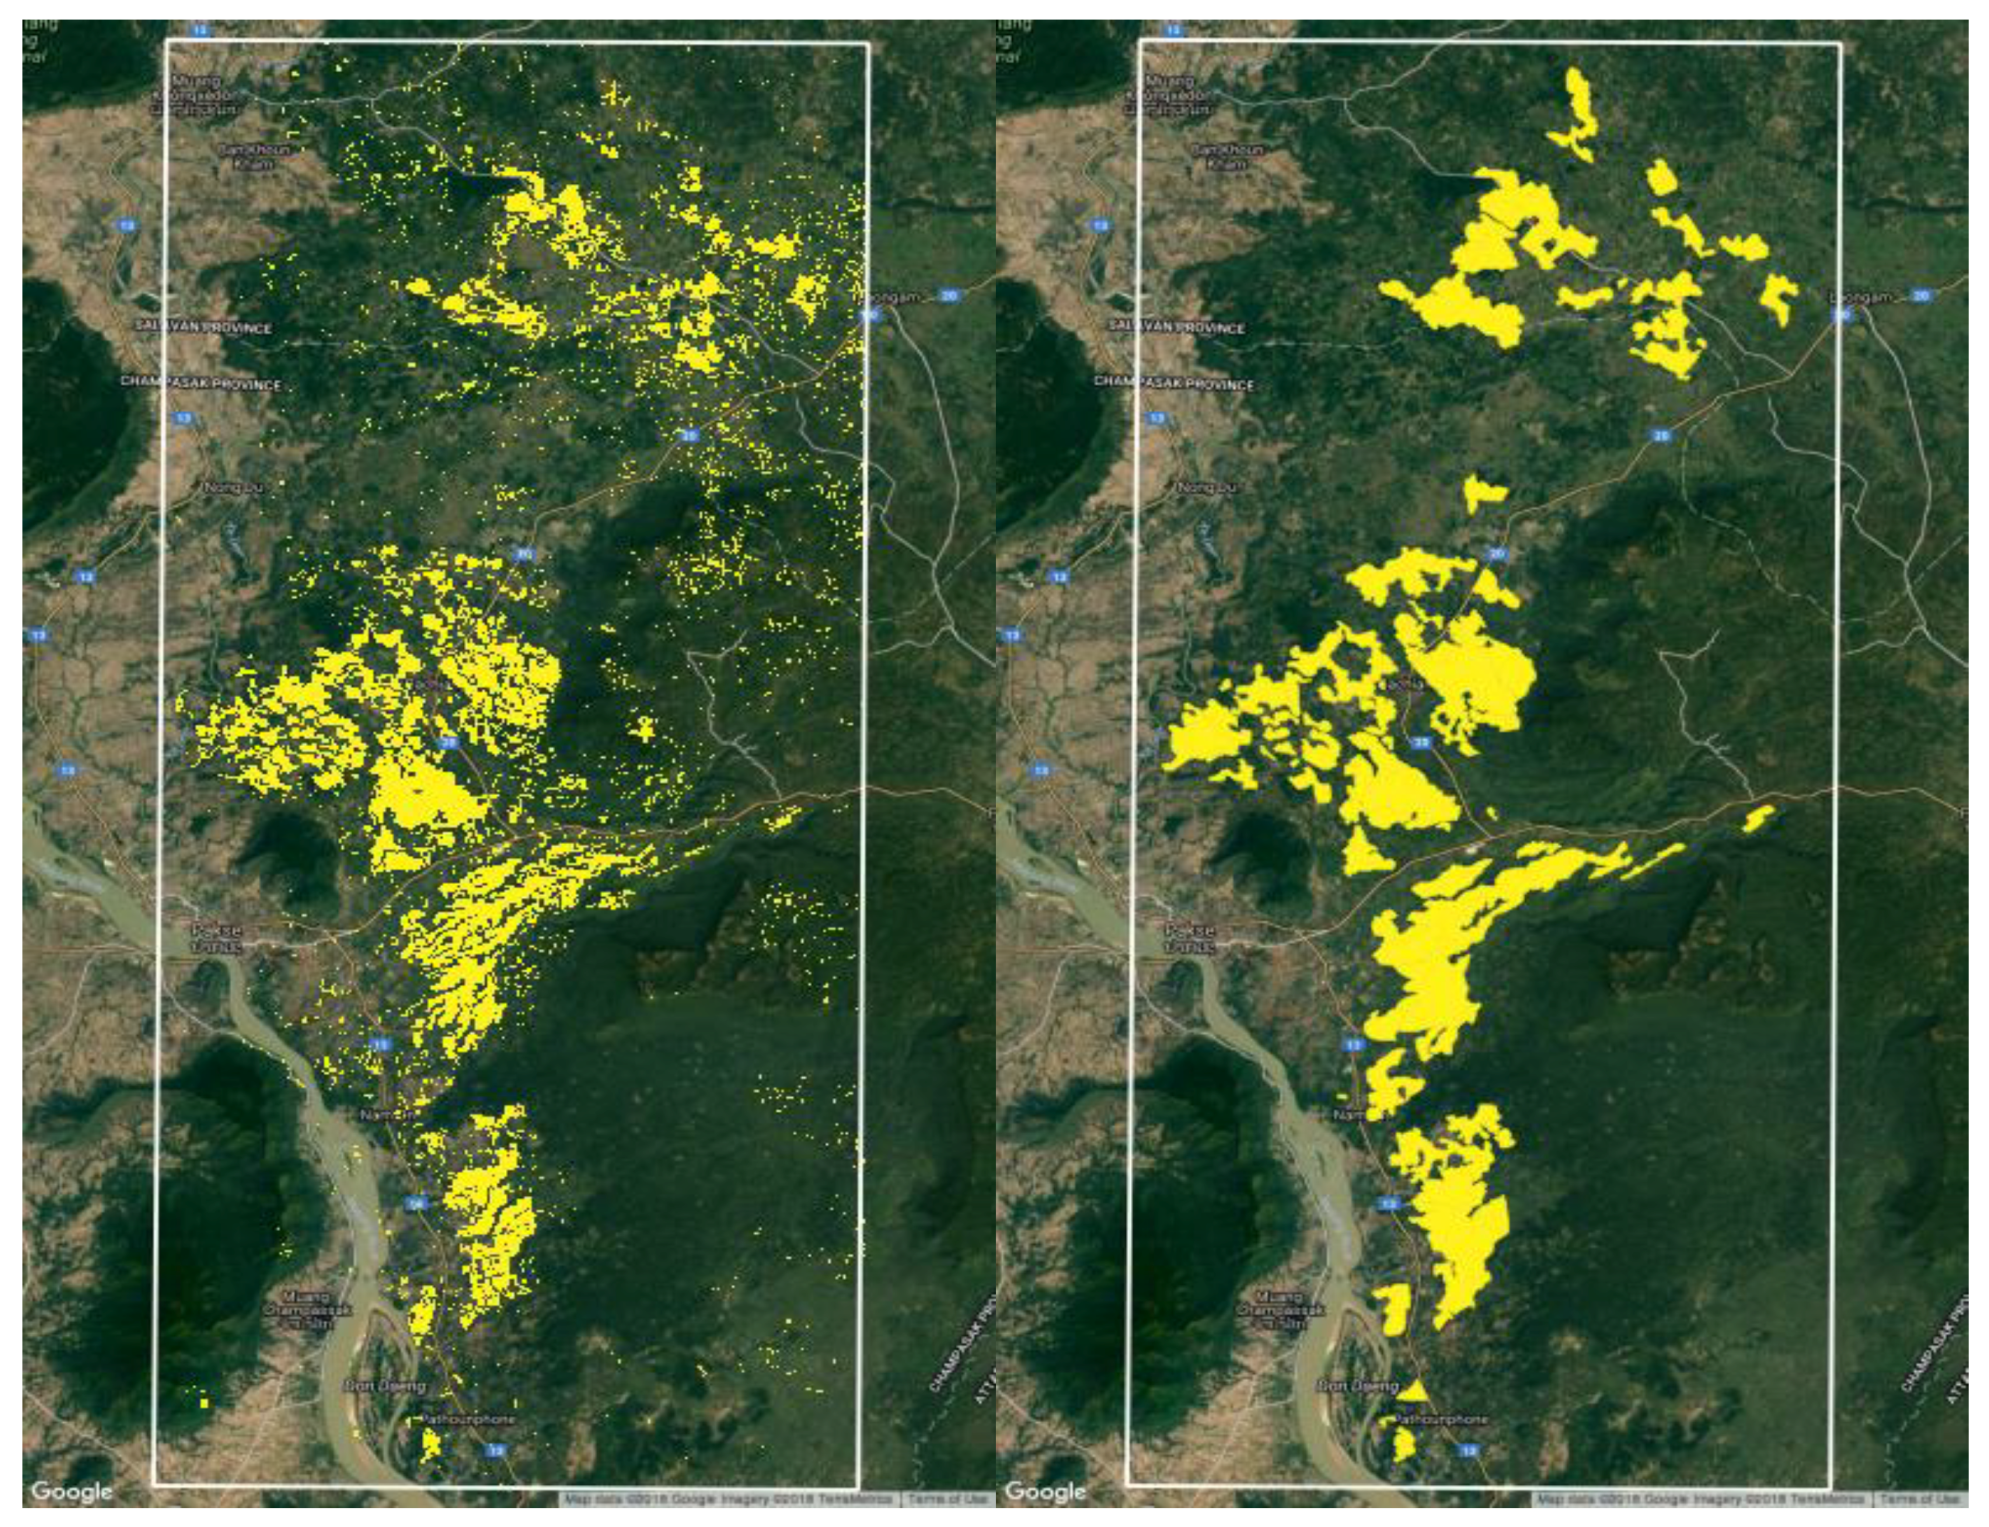
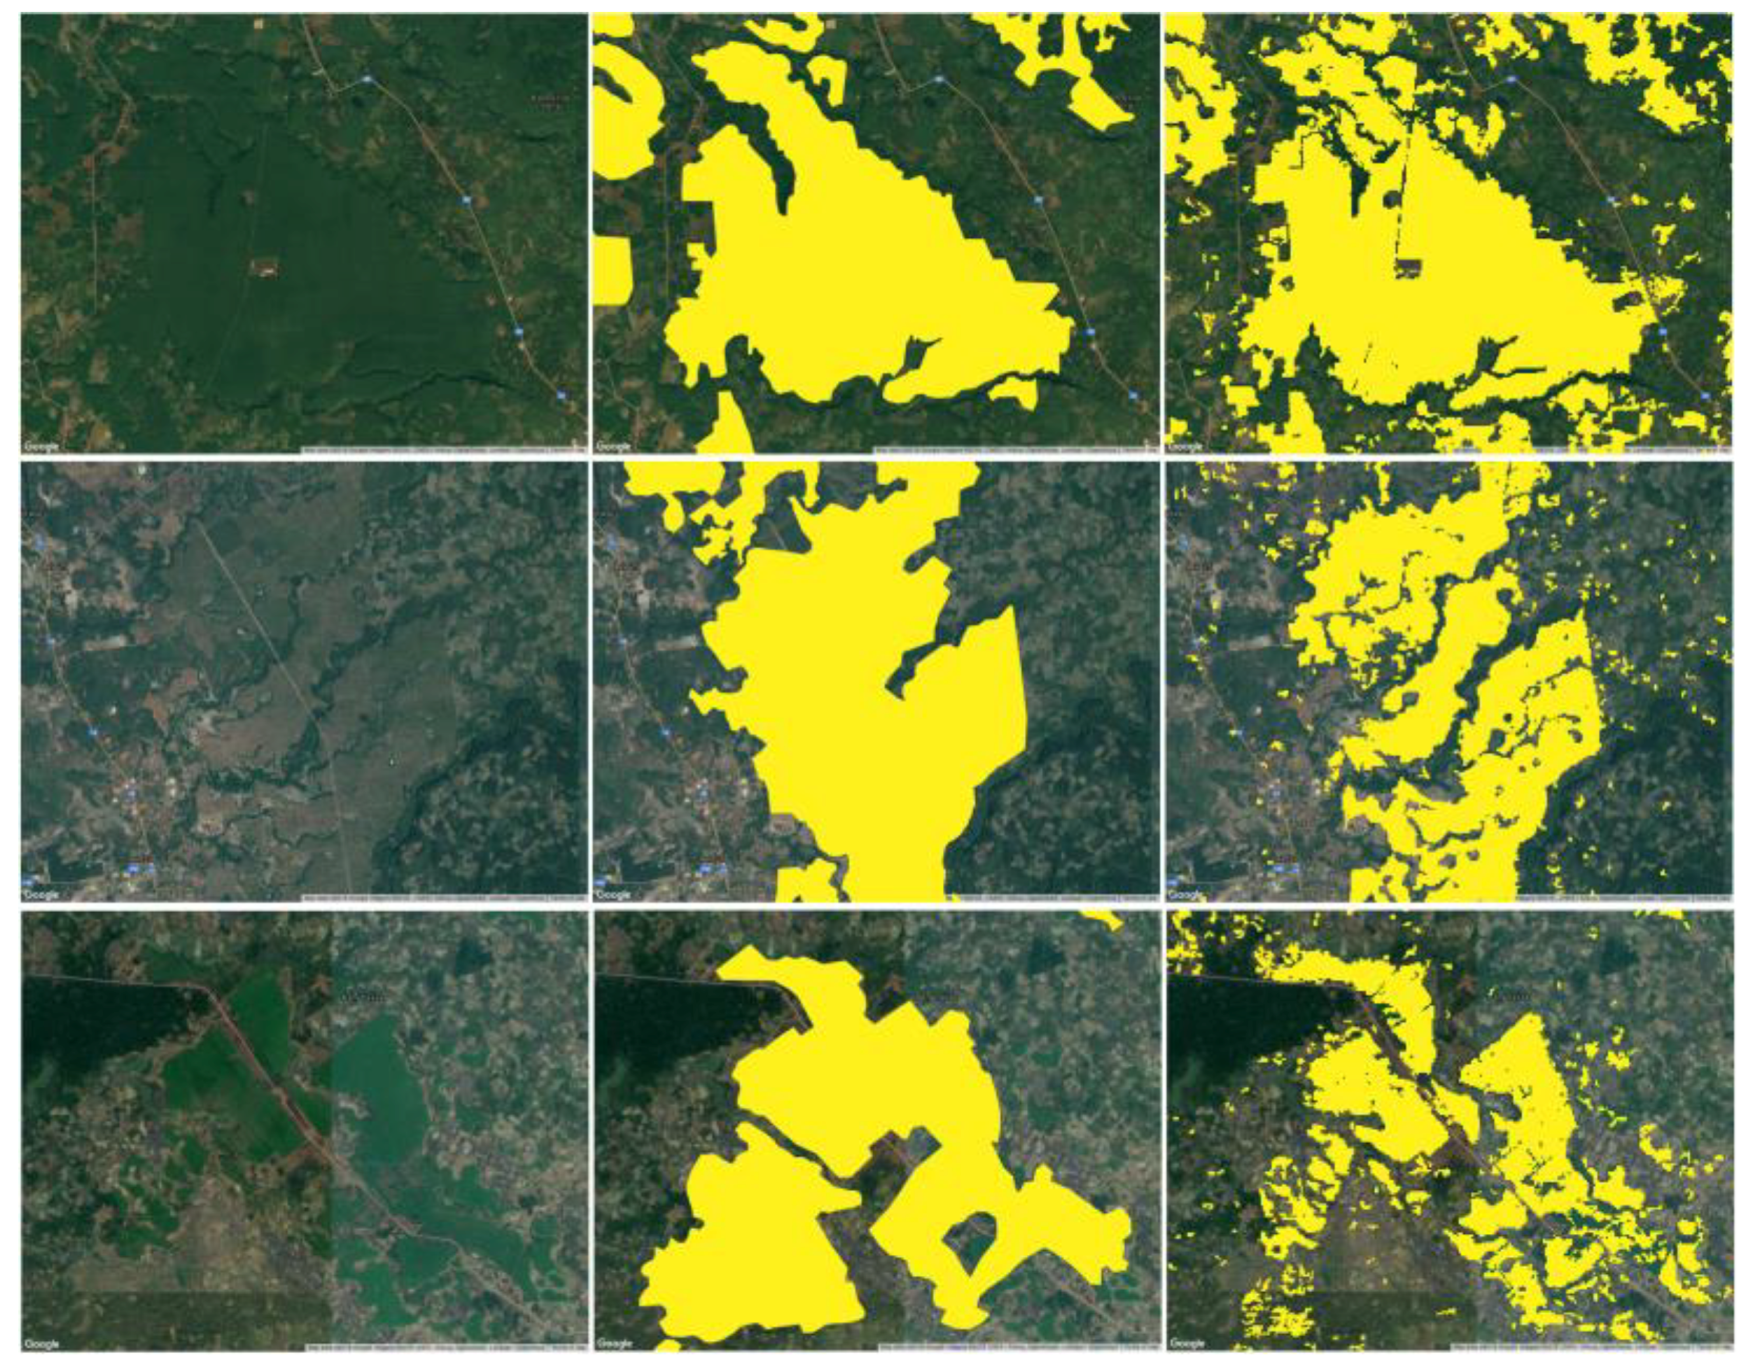
Digital image classification involving decision trees resulted in pixel level classification of rubber planted areas with patterns very similar to the hand digitized plantation boundaries (Figure 4). However, several important differences also exist. First, results of supervised image classification appear noisier, capturing slightly more than actual plantations—an error of commission. Second, while the hand-digitized plantation patches produce more homogenous patches, they also often capture areas that are not actually planted with rubber but are associated with it including plantation roads, houses, and breaks (Figure 5).
Evaluation of supervised image classification involving rubber plantation reveals a map with over 92% overall accuracy (Table 2). The confusion matrix also reveals that the rubber plantation category has higher commission (User’s accuracy of 88%) and omission errors (Producer’s accuracy of 73%) when compared to the other (non-plantation) category (both User’s and Producer’s above 92%). Nevertheless, the map is considered highly accurate and captures the major plantation boundaries quite well while having distinct few differences with the hand digitalized plantation boundaries as described earlier.
3.3. Landscape Simplification
Qualitative research on the livelihood changes that have accompanied the boom in rubber development in southern Laos has emphasized the close relationship between exclusion, as local people’s access to productive land has been lost to plantation concessions, and simplification of both the vegetative landscape and the property systems that govern it, as monocultures have replaced more complex patchworks of extensive smallholder production and use [15,16,20,21,22,23,26]. Remotely sensed data provide information on the extent of this phenomenon, showing its ubiquity throughout the area and, in doing so, challenging the temptation to see qualitative studies as one-off exceptions.
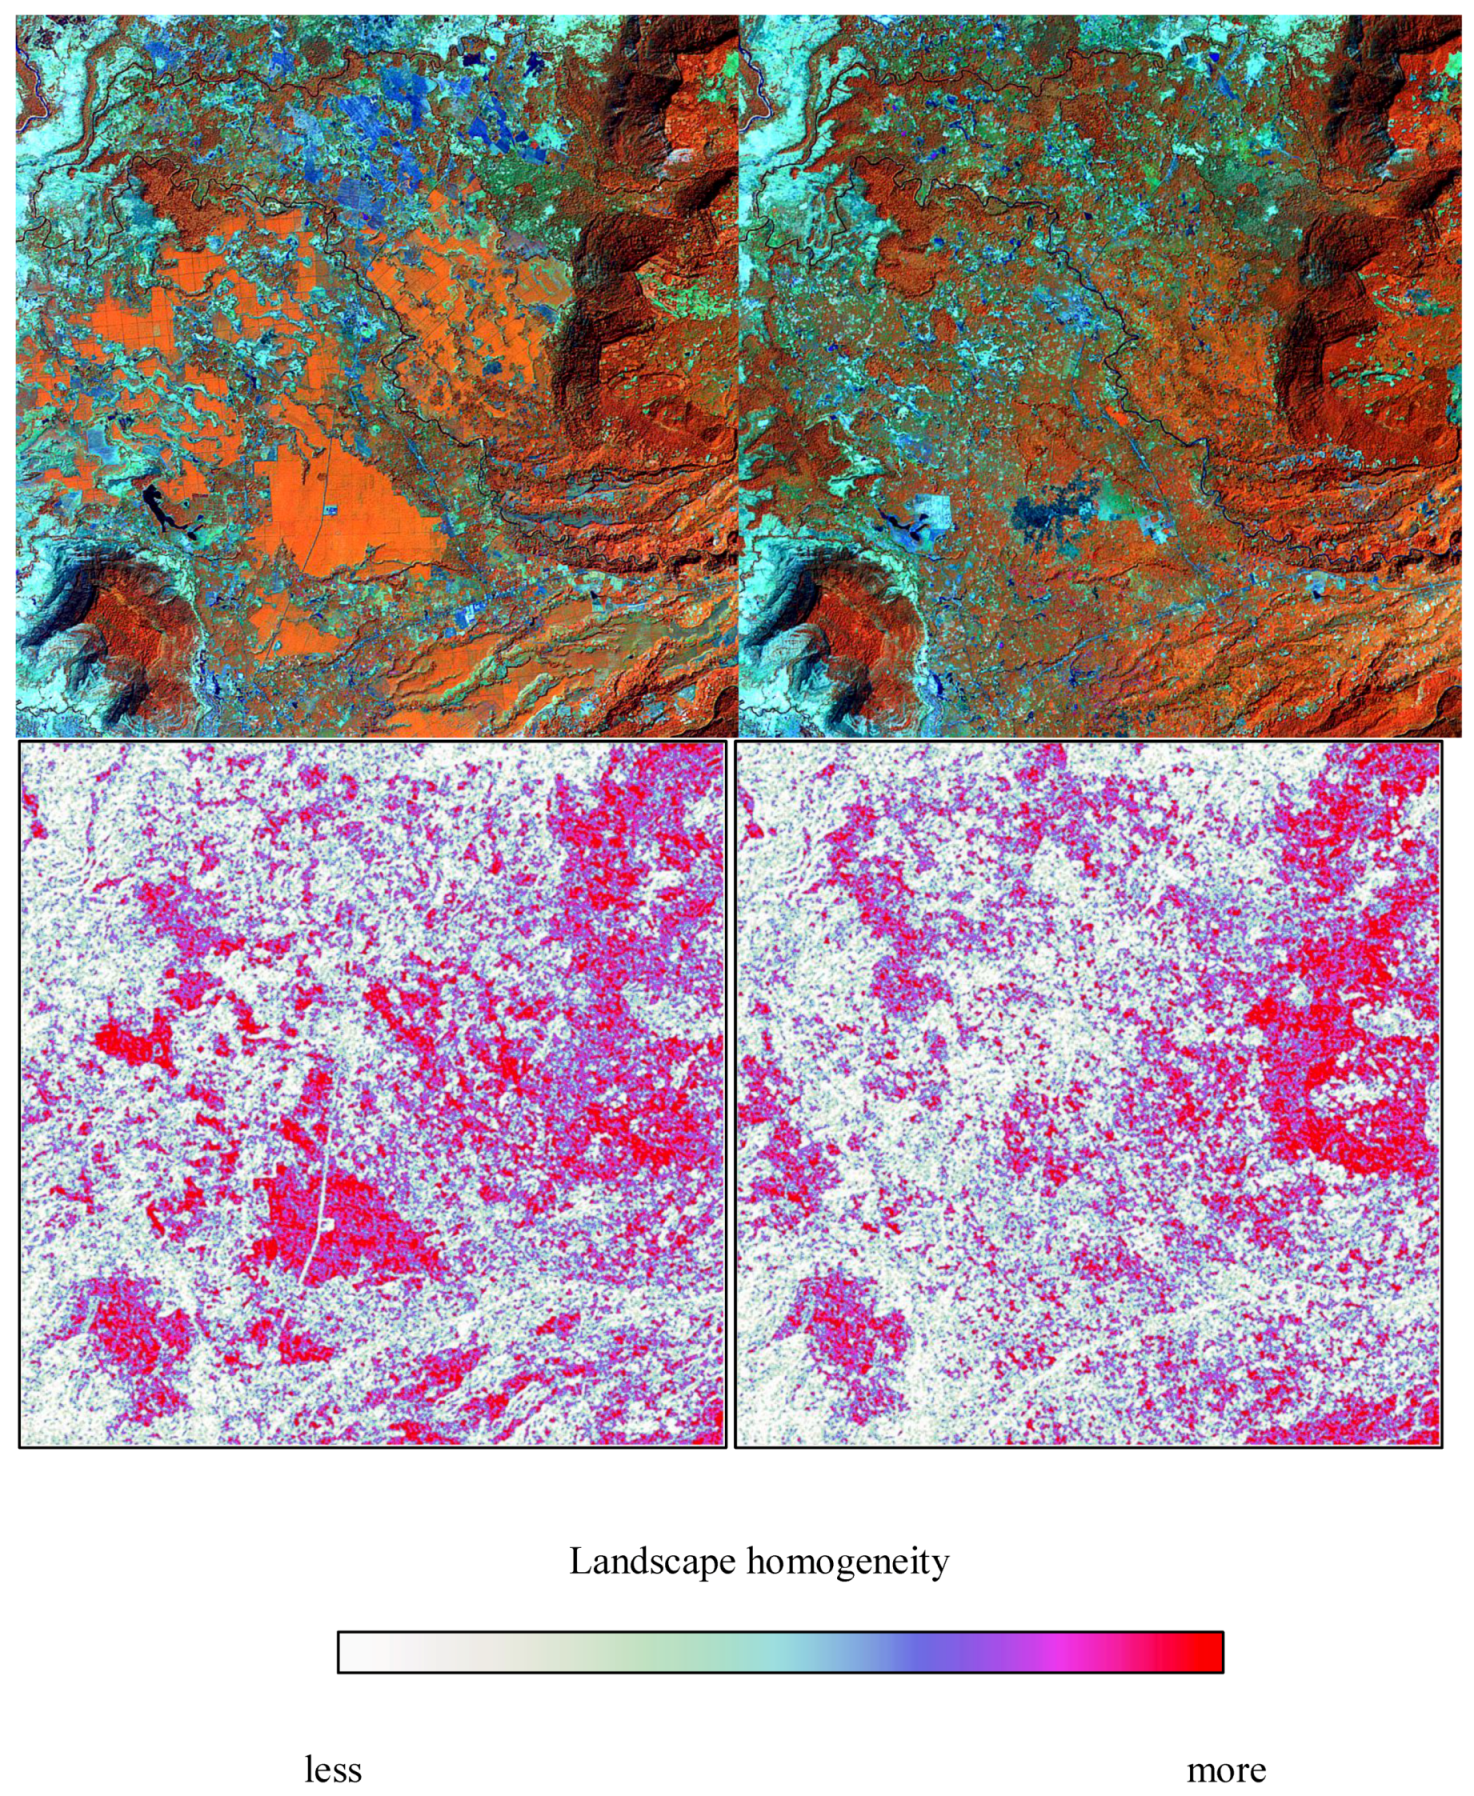
Figure 6 provides a detailed illustration of how land clearing for rubber has changed the texture, and with it the vegetative character, of the landscape. The image shows an area located in roughly the middle portion of Figure 2a, where large amounts of land conversion to rubber took place during the mid-to-late 2000s, mostly in connection with the VLRG project. The top two images in Figure 6 are rendered in false-color composites in order to emphasize vegetation quality, and show the area as it appeared in 2002 (top left) and 2011 (top right). The 2002 image shows that before the arrival of rubber, the landscape was dominated by small-scale forest clearings for agriculture, frequently for swidden cultivation but also small fruit tree plantations); these were generally less than 1 ha in size, and were relatively evenly distributed across the landscape, as is commonly the case for Mon-Khmer-speaking upland indigenous people in this part of the world [32,52,53,54,55]. During this pre-rubber period, there were also forested areas in various stages of succession, as is typical in areas with an active swidden cultivation system. The arrival of large-scale rubber plantations made this landscape far more homogenous, however, as is plainly visible in the image from 2011 (Figure 6, top right). The large patches in the center of the image correspond to the large patches shown in the middle portions of Figure 2a, and thus appear to be associated with the VLRG concession.
In the last few years, other research on rubber conversion in mainland Southeast Asia has zoomed out far more than this paper, looking at the Mekong region as a whole e.g., [32] and focusing on problems of ecological suitability, forest conversion, and the negative economic prospects of developing rubber on land to which it is poorly suited [56]. In focusing on the simplification of the landscape more locally, our research focuses more on thinking about land access for peasant farmers, which is an issue everywhere but is especially significant in areas (like those shown in Figure 2a and Figure 6) where ecological suitability for rubber is fairly good because these areas are located between 300–700 m above sea level, the optimal elevation for rubber. The problem, as noted above, is that the high quality soil areas desirable for rubber cultivation are also prime areas for growing various small-holder crops.
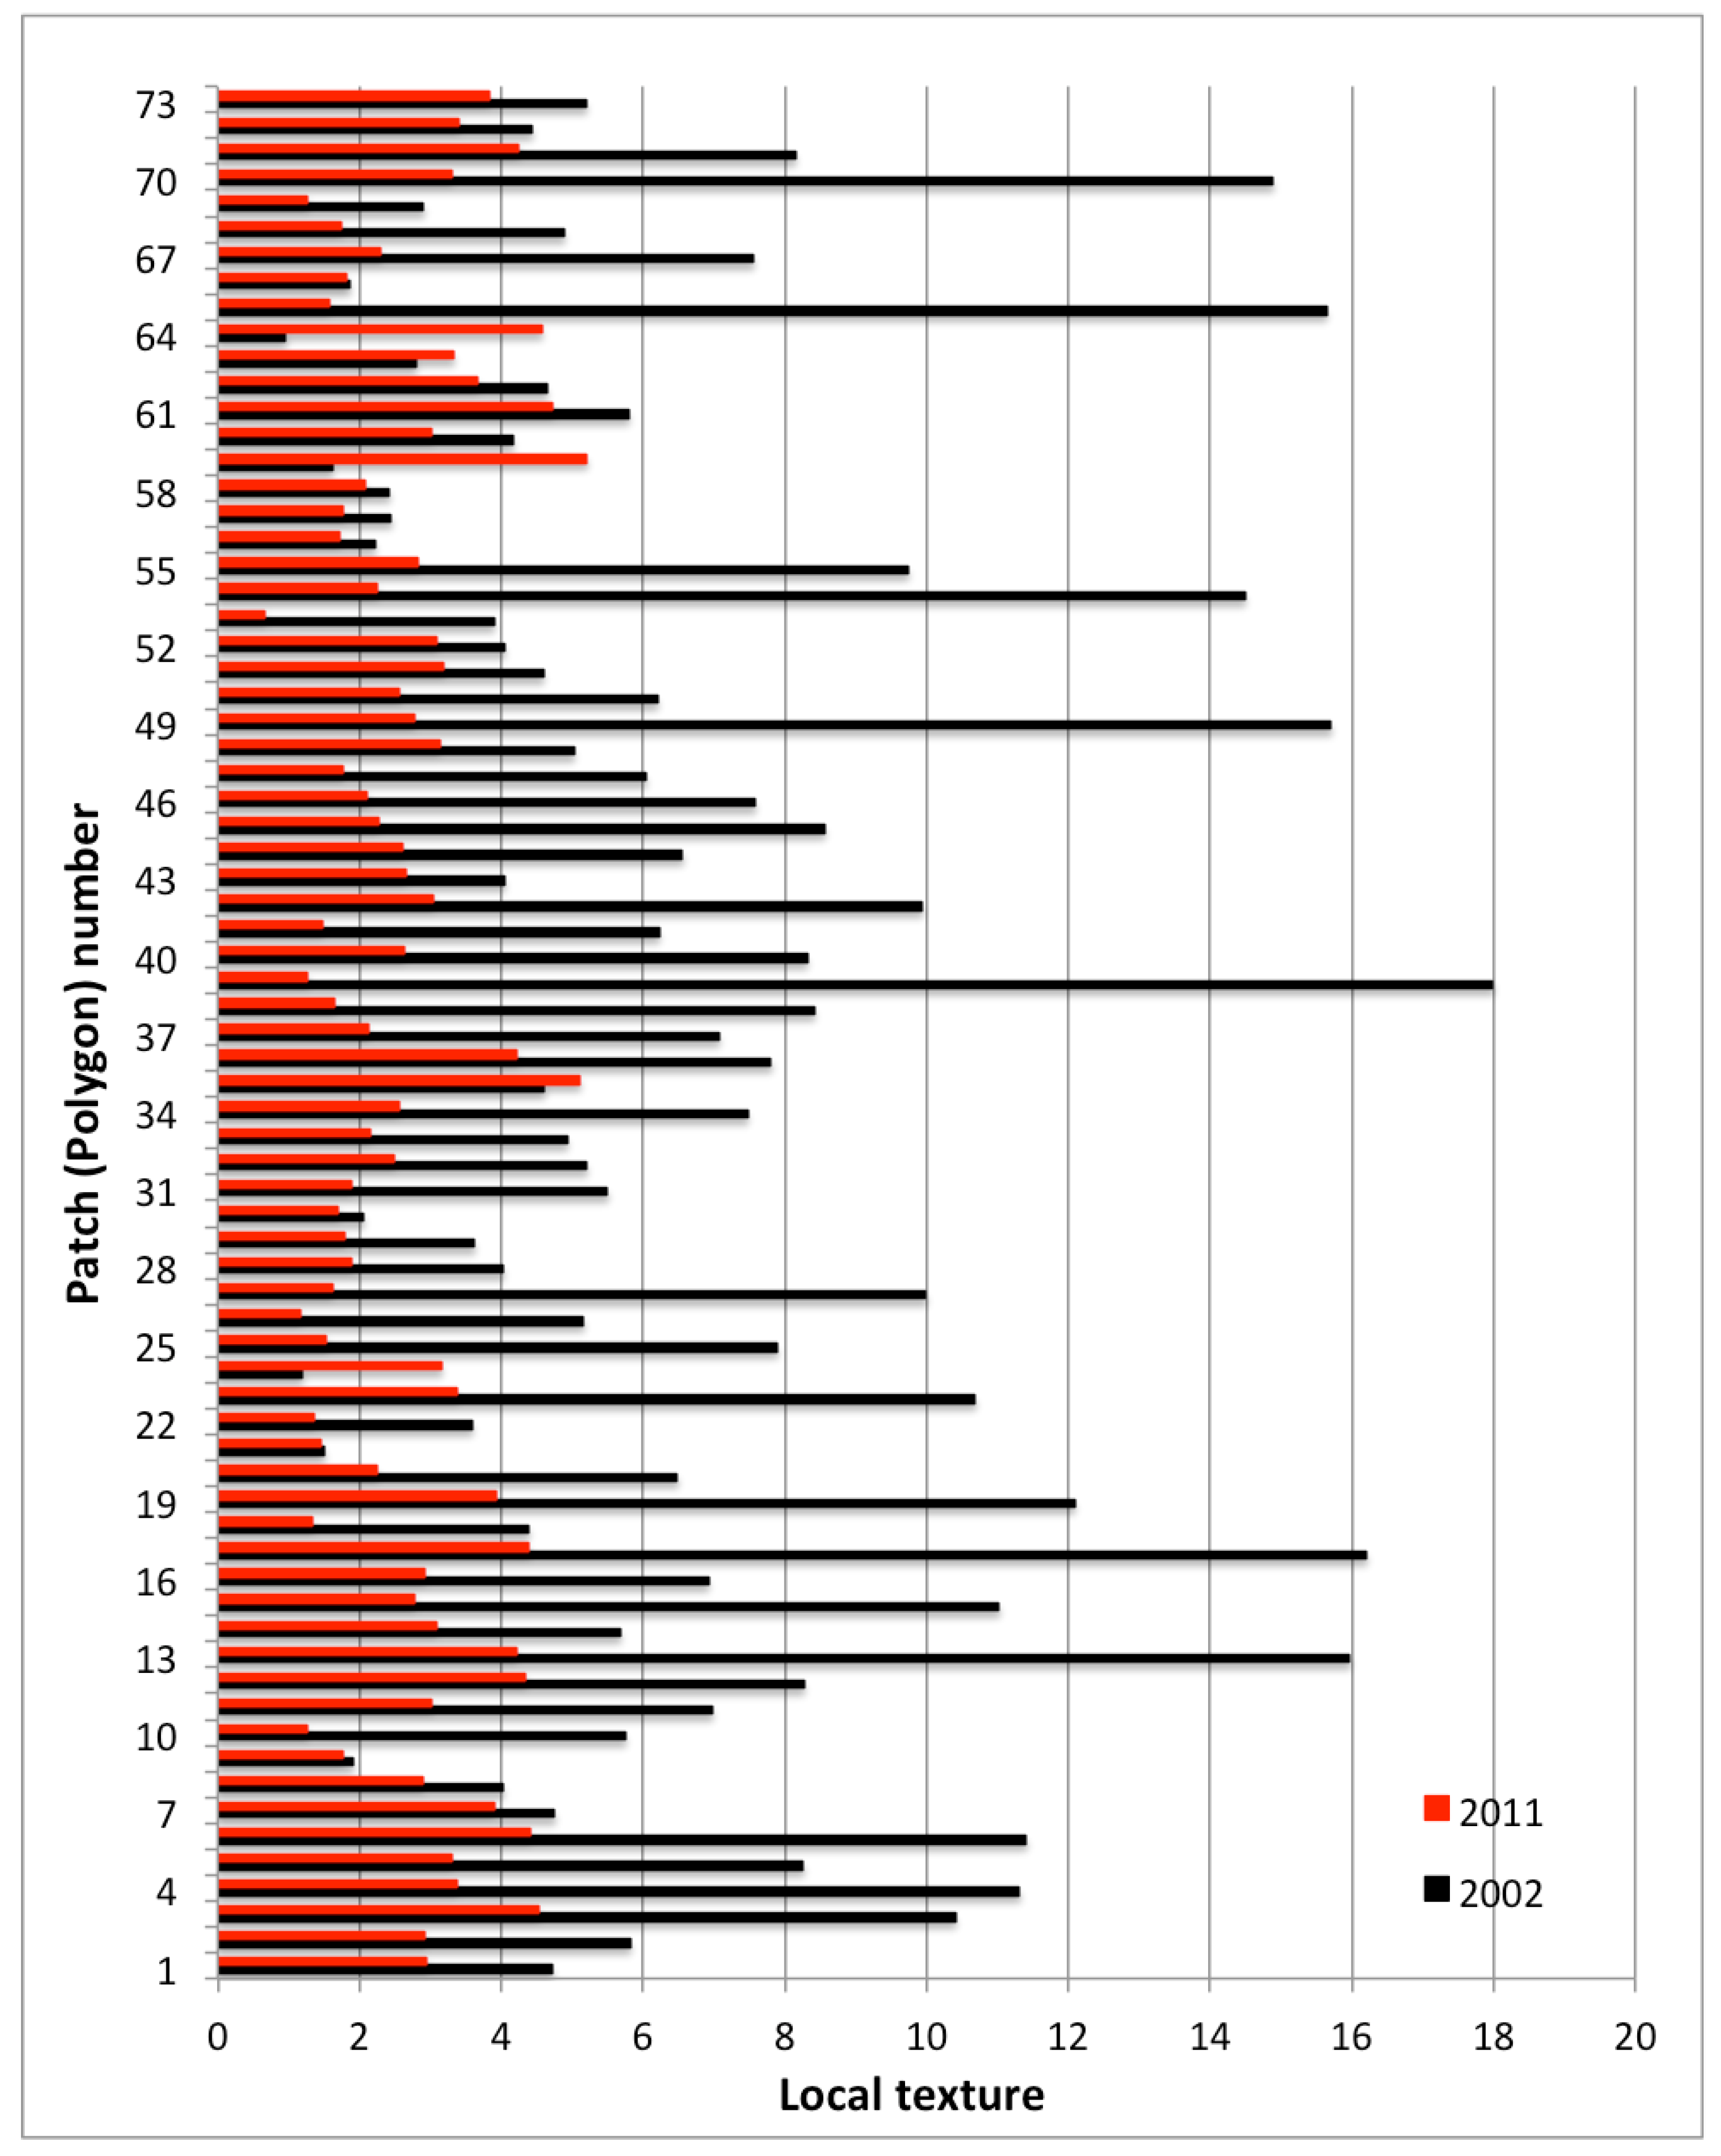
The bottom two images in Figure 6 help show the fundamental nature of the landscape simplification that large-scale rubber development has brought to southern Laos. They do this by quantifying landscape “texture” using a moving-window analysis. The results show the landscape measured on a spectrum from less homogenous to more homogenous, and allow the simplification shown in the top-row images to be measured (Figure 6, bottom row) and compared (Figure 7). The black and red bars in Figure 7 show the difference in landscape texture only in the areas of Figure 6 where rubber was developed. By focusing only on these areas (presented in Figure 7 using a patch-by-patch pairwise comparison), our analysis shows just how radical a simplification has occurred as mixed agricultural areas have been converted into large-scale rubber plantations. In doing so, our work not only helps to verify reports from local people and other observers about significant losses of common forest, pasture areas, and small-scale agricultural land; it also gives an indication of just how widely these reports apply, highlighting the need to take them seriously not just as anecdotal reports, but as policy-relevant research.
3.4. Concession Boundaries: Adaptation Versus Other Explanations
The spatial nature of remote sensing data also offers the potential to examine the relationship between official concession area plans and actual implementation. As shown in Figure 2, some of the plantations we observed lie within the boundaries sketched out early in the concession process, while others are either partially or completely outside of these boundaries. For example, of the 144 plantations we mapped from remote sensing, as of 2012, 98 of them were fully or partially located within the original concession boundaries. However, in terms of area, these plantations made up only about half (15,626 ha) of all plantations (30,000 ha), suggesting that a significant portion of development took place outside of the planned concession boundaries. Our analysis also showed that the fraction of originally planned concessions that were planted by 2012 varied widely by location and by company. For example, while less than 3% of the northernmost area developed by Dao Tieng Company was planted by 2012, the same company planted over 25% of another part located further south. Similarly, of the three areas leased to Dak Lak Company, two were almost completely planted by 2012 while the third was only partially (less than 10%) developed. A third firm active in the area, the VLRG, had a more even distribution of plantations across the four concessions it was allowed to develop—roughly 40–60% of its concessions were planted by 2012. Satellite data further revealed that those areas inside the originally planned concessions that were not planted by 2012 had land cover types similar to the surrounding areas outside of the boundaries. This “background” land cover over which rubber plantations have been developed includes natural vegetation, such as forests and forest-like vegetation, punctuated by intensive cultivation.
In this regard, two portions of our study area are striking when it comes to the non-development of initially planned concession areas: the northern (and larger) portion of the Dao Tieng concession; and the pieces of the VLRC and Dao Tieng concessions that overlap with the Dong Houa Sao National Protected Area (NPA). We discuss these in turn.
The northern portion of the Dao Tieng concession is situated in the northern part of our study area, and is pictured in the northern third of Figure 2 (also see Figure 1, right). According to our analysis, this area was left almost entirely unaffected by the area’s rubber boom; while Dao Tieng succeeded in developing portions of its southern concession, its inability to develop this northern part must have affected the company significantly. While a number of factors could help explain this, one important reason is likely to be timing. As discussed above, the most and largest conversions for rubber took place in 2004–2006, as companies pressed forward with land acquisition prior to the oppositional and regulatory responses that began to occur around 2007; these early conversions took place almost exclusively in and around the VLRC and Dak Lak concessions, and left Dao Tieng out of the land acquisition process in these key early years. Other factors could have been involved as well. For example, Baird and Le Billon [26] have demonstrated in these same plantation areas that the capacities of the leadership of some communities, and political capital based on past conflicts, play a significant role in determining how land concessions are being implemented in Laos. Recent research in southern Laos also indicates that concession boundaries are being violated in other Vietnamese rubber concession areas in Attapeu Province [19,24]. Still, some communities have been able to resist, negotiate, or otherwise influence how much land investing companies have been able to gain control of for rubber development. Corruption and patronage relations at the local level are, however, also heavily influencing the ways boundaries are being negotiated and altered [15,24].
As suggested by Figure 1 (right), the non-development of the three concession areas in the southern part of Figure 2 may all be related. Figure 1 shows the position of the Dong Houa Sao NPA relative to the initially planned concession regions, and highlights in particular that portions of the Dao Tieng and Dak Lak concessions were initially planned for areas inside the NPA. Despite the presence of logging in some protected areas in southern Laos [24,57,58], in this case it appears that the expansion of rubber into the protected area was not allowed. The expansion of rubber in areas to the west of the NPA, in the corridor between northern and southern portions of the Dak Lak concession, suggests that this company in particular was allowed to develop other areas as compensation. That some rubber plantations ended up in the NPA nonetheless highlights the usefulness of remote sensing in monitoring the actual implementation of rubber plantations, whether by state authorities, civil society or both.
3.5. Complementarities and Barriers to Collaborative Advocacy-Based Research’
In recent years, advocacy-oriented partnerships between academics and local civil society groups have become increasingly common. These span the spectrum from oppositional counter-mapping [36,59] to other forms of (“neo”) geographic collaboration that, as Elwood and Mitchell [60] put it, “contribute to the formation of political subjects, mobilized social groups, and shared knowledge”. Our work falls somewhere toward the latter end of the spectrum, bringing new information (in the form of landscape-wide vegetation change data and concession boundaries) that were previously unavailable to local civil society actors. As explained in Section 2, after initial remote sensing work associated with this project was done in the United States in order to assess how rubber is being developed in the part of southern Laos of interest to the NGO in Laos, maps were printed and taken to Laos by the second author, who had a close relationship with the NGO, in order to show the ethnic Lao and ethnic minority NGO workers actively engaged with problems associated with rubber concessions impacting local people.
As mentioned in Section 2, workers from the partner NGO in Laos conducted the ground-truthing that helped improve the accuracy of the remote sensing work. It was not easy for those working with the NGO to conceptualize how ground-truthing works, and that a Global Positioning System (GPS) unit would help address the land problems they are facing, but it was undoubtedly valuable to have these data for analyzing the remote sensing data and for putting together the maps that would be useful for the NGO workers and the villagers they cooperate with. Therefore, specific GPS data points were collected by NGO staff in the concession areas. The remote sensors and NGO workers needed to be able to accept the particular requirements and concerns of the other, something that we believe is crucially important for successful collaborations to occur, as the concerns and ways of working of both parties can be quite different and thus requires considerable compromising and understanding between both parties.3
One of the cooperation issues that we became aware of during the partnership related to the speed of the research. Academics like us tend to have busy schedules and multiple projects on the go. This can lead to some projects, such as this one, being set-aside for a period of time due other demands. While this is normal practice for academics, NGOs working in the field generally desire that research be conducted in a timelier manner, so as to meet the demands of communities. The second author also found this to be the case when he worked for an NGO in Laos in the 1990s and partnered with academics, as the academics were generally more accustomed to longer turn-around times than the NGO, which created some tensions and misunderstandings. We were not able to resolve this differences during this project, but we do think that it is important to point them out, as such differences should be considered carefully by both academics and NGOs when entering into partnerships like the one that was the basis for this research.
Although the issue of speed of work could not be resolved, this sort of work has the potential to help NGOs or other civil society groupings better visualize the ways that plantations are developing, both spatially and temporally. From the multi-year maps produced, for example, it might become evident that the concession holder is expanding in a particular direction. This could be important for planning, helping focus limited resources on working with communities that are most likely to be impacted by large-scale land concessions in the near future. In this particular case, the NGO we were working with had been working with the Department of Justice in Champasak Province to provide legal information to local people in order to make them less vulnerable to being cheated out of their private or common lands due to a lack of legal understanding related to land issues, and knowledge of rubber expansion trends could have been utilized to help improve planning capacity, provided that it be provided in a timely manner.
In the end, despite the barriers presented by the partnership, both sides were still able to provide important but different contributions to the project. On the one hand, the remote sensing work contributed important new insights into the way particular rubber plantations have been developed and spatially and temporally organized in a particular area in recent years, and the remote sensing work quantifiably demonstrated how developments have changed the landscape in different ways, making it more homogenously dominated by plantations containing a single species of rubber. The NGO in Laos, on the other hand, identified the initial problem of rubber concessions coming into conflict with the livelihoods of local communities [15,16,26,37], and thus was able to provide necessary qualitative data about landscape and environmental changes occurring in the area, which was necessary for directing the design of the remote sensing part of the project. Without certain understandings coming from activities on the ground, the remote sensing work would have had much less direction, or had been oriented to addressing particular community concerns in Laos.
Finally, in contrast to the high uncertainty of official information about the geography of planted rubber, the accuracy of our map—developed with the two methods described above for charting plantations’ emergence over time points to usefulness of remotely sensed observations in identifying, locating, and mapping major land transformations involving rubber. The high categorical accuracy of both maps is not surprising, as it is well known that visual interpretation by an analyst is by far the most accurate method of mapping broad land-use change. However, visual interpretation (although cheaper than traditional air photo interpretations of large areas) can be expensive, and making use of automated methods—as utilized here—is an attractive choice. An additional benefit of supervised image classification is the ability to scale over large areas—for example the entire country of Laos—while only using samples from a small example, such as certain locations from part of the country. Moreover, availability of spectral information such as NIR provides additional benefits for recognizing changes in vegetation patterns, thereby combining high rates of accuracy with a degree of efficiency that could make this approach more widely usable by civil society actors.
4. Conclusions
Improving spatial and temporal information about large-scale investments and associated land transformations can be quite useful for advancing the interests of local people, provided that they or their allies have control of this information. For policy development work, the location, size, time of establishment, and the fate of plantations can usefully be mapped at different scales, but too often the technology and know-how to do this is limited to the state and rich and powerful investors. This project indicates that it is also possible to do this sort of work in ways that benefit less powerful groups being supported by NGOs working in rural areas, or other civil society organizations, although certain issues need to be addressed to make collaboration between remote sensors and NGOs working in villages mutually successful. Indeed, the process outlined in this paper has the potential to act as a model for investigating industrial-scale land-use/land-cover change cases in other parts of the world, provided that work can be conducted in a timely manner. While it is possible to collect some important information using government records, company information, and surveys, these data tend to be of uneven quality, hard to acquire, and unevenly available even under the best of circumstances, inconsistent across years, lacking in spatial information on the location and extent of the fields, and often contain inadequate number of samples to represent whole region or country. Satellite remote sensing can be utilized to extract information on large-scale plantations in ways that can help address some of the above constraints. It offers synoptic, repetitive, and spatially explicit data in several spectral regions and with temporal frequencies sufficient to assess vegetation growth, maturity, and harvest. The work presented here follows established image processing methods to extract spatially explicit, up-to-date information on rubber plantations in southern Laos.
Still, as with the data available from the government, remote sensing data also have their limits. Remote sensing data cannot easily reveal the nuanced types of livelihood challenges that local people are facing due to large-scale rubber plantation development. Nor can they indicate how research design might be best done to ensure that remote sensing work deals with important problems on the ground. For understanding the crucial qualitative nature of land-use change, there remains no substitute for spending time talking with people in the field. Neither government concession data nor remote sensing data is sufficient to understand how long people see rubber concession development. Connections with local people are important, for prioritizing research, developing research questions, and for finally distributing remote sensing data prepared far away.
This project has shown how it is possible to combine remote sensing with limited central government sourced data about particular land concessions, and information coming from villagers via NGO workers. Working across scales and with very different practices and concerns, it is not always easy for diverse groups to cooperate, but with adequate consideration of the concerns of each other, this sort of collaborative research certainly has considerable potential.
Acknowledgments
Thanks to Gerry Duckitt and various Lao nationals in Pakse, Champasak, Laos for assisting with this project. The authors also thank Sarah Graves for the meticulous GIS work.
Author Contributions
All three authors conceived and designed this research; Özdoğan did the remote sensing work; Mike Dwyer obtained some important data, and Ian Baird did the fieldwork. All three authors jointly analyzed the data.
Conflicts of Interest
The authors declare no conflict of interest. The authors received no funding from any agency or company to conduct this research.
References
- Ziegler, A.D.; Fox, J.M.; Xu, J. The rubber juggernaut. Science 2009, 324, 1024–1025. [Google Scholar] [CrossRef] [PubMed]
- Schönweger, O.; Heinimann, A.; Epprecht, M.; Lu, J.; Thalongsengchanh, P. Concessions and Leases in the Lao PDR: Taking Stock of Land Investments. Geographica Bernensia, Bern and Vientiane; Centre for Development and Environment (CDE): Bern, Switzerland, 2012. [Google Scholar]
- Fox, J.; Castella, J.C. Expansion of rubber (Hevea brasiliensis) in mainland Southeast Asia: What are the prospects for small holders? J. Peasant Stud. 2013, 40, 155–170. [Google Scholar] [CrossRef]
- Vientiane Times. Govt Pledges Investigation for Fair Rubber Price; Vientiane Times: Vientiane, Laos, 2014. [Google Scholar]
- Vongvisouk, T.; Dwyer, M. Falling Rubber Prices in Northern Laos: Local Responses and Policy Options; LURAS Project, Vientiane; Helvetas: Zürich, Switzerland, 2016. [Google Scholar]
- Alton, C.; Bluhm, D.; Sannikone, S. Para Rubber Study: Hevea brasiliensis; Vientiane, Lao-German Program Rural Development in Mountainous Areas of Northern Lao PDR: Vientiane, Laos, 2005; 72p. [Google Scholar]
- Baird, I.G.; Vue, P. The ties that bind: The role of Hmong social networks in developing small-scale rubber cultivation in Laos. Mobilities 2017, 12, 136–154. [Google Scholar] [CrossRef]
- Dwyer, M.B. Territorial Affairs: Turning Battlefields into Marketplaces in Postwar Laos. Ph.D. Thesis, University of California, Berkeley, CA, USA, 2011. [Google Scholar]
- Manivong, V.; Cramb, R.A. Economics of smallholder rubber production in northern Laos. Agrofor. Syst. 2008, 74, 113–125. [Google Scholar] [CrossRef]
- Sturgeon, J.C.; Menzies, N.K.; Fujita-Lagerqvist, Y.; Thomas, D.; Ekasingh, B.; Lebel, L.; Phanvila, K.; Thongmanivong, S. Enclosing ethnic minorities and forests in the Golden Economic Quadrangle. Dev. Chang. 2013, 44, 53–79. [Google Scholar] [CrossRef]
- National Agriculture and Forestry Research Institute (NAFRI). Key Issues in Smallholder Rubber Planting in Oudomxai and Luang Prabang Provinces; Upland Research and Capacity Development Program; NAFRI: Vientiane, Laos, 2007. [Google Scholar]
- Shi, W. Rubber Boom in Luang Namtha; A Transnational Perspective; GTZ: Vientiane, Laos, 2008. [Google Scholar]
- Tongmanivong, S.; Phengsopha, K.; Chanthavong, H.; Dwyer, M.; Oberndorf, R. Concession or Cooperation? Impacts of Recent Rubber Investment on Land Tenure and Livelihoods: A Case Study from Oudomxai Province, Lao PDR; National University of Laos: Vientiane, Lao, 2009. [Google Scholar]
- Hicks, C.; Voladet, S.; Shi, W.; Guifeng, Z.; Lei, S.; Tu, P.Q.; Kalina, M. Rubber Investments and Market Linkages in Lao PDR: Approaches for Sustainability; Sustainable Mekong Research Network: Bangkok, Thailand, 2009. [Google Scholar]
- Baird, I.G. Land, rubber and people: Rapid agrarian change and responses in southern Laos. J. Lao Stud. 2010, 1, 1–47. [Google Scholar]
- Baird, I.G. Turning land into capital, turning people into labour: Primitive accumulation and the arrival of large-scale economic land concessions in Laos. New Propos. J. Marxism Interdiscip. Inq. 2011, 5, 10–26. [Google Scholar]
- Baird, I.G. Resistance and contingent contestations to large-scale land concessions in southern Laos and northeastern Cambodia. Land 2017, 6, 16. [Google Scholar] [CrossRef]
- Somphonphacdy, D.; Yabe, M.; Sato, G. Impact of rubber concession on rural livelihood in Champasack Province, Lao PDR. J. Fac. Agric. Kyushu Univ. 2012, 57, 339–344. [Google Scholar]
- Baird, I.G.; Fox, J. How land concessions affect places elsewhere: Telecoupling, political ecology, and large-scale plantations in southern Laos and northeastern Cambodia. Land 2015, 4, 436–453. [Google Scholar] [CrossRef]
- Kenney-Lazar, M. Plantation rubber, Land grabbing and social-property transformation in southern Laos. J. Peasant Stud. 2012, 39, 1017–1037. [Google Scholar] [CrossRef]
- Lao Biodiversity Association (LBA). Koke Deu le Yang Tang Tieu; LBA: Vientiane, Laos, 2008. (In Lao) [Google Scholar]
- Laungaramsri, P. Frontier capitalism and the expansion of rubber plantations in southern Laos. J. Southeast Asian Stud. 2012, 43, 463–477. [Google Scholar] [CrossRef]
- Obein, F. Assessment of the Environmental and Social Impacts Created by the VLRC Industrial Rubber Plantation and Proposed Environmental and Social Plans; Earth Systems Lao: Vientiane, Laos, 2007; p. 93. [Google Scholar]
- Global Witness. Rubber Barons: How Vietnamese Companies and International Financiers Are Driving a Land Grabbing Crisis in Cambodia and Laos; Global Witness: London, UK, 2013. [Google Scholar]
- Zurflueh, J. Vietnamese Rubber Investments in the South of the Lao PDR: Key Factors Influencing Decision Making in Large-Scale Land Acquisitions by Vietnamese Investors in the Agro-Forestry Sector of the Lao PDR. Master’s Thesis, Centre for Development and Environment (CDE), University of Bern, Bern, Switzerland, 2013. [Google Scholar]
- Baird, I.G.; Le Billon, P. Landscapes of political memories: War legacies and land negotiations in Laos. Political Geogr. 2012, 31, 290–300. [Google Scholar] [CrossRef]
- Dwyer, M.B. Trying to Follow the Money: Possibilities and Limits of Investor Transparency in Southeast Asia’s Rush for “Available” Land; CIFOR Working Paper 177; Center for International Forestry Research: Bogor, Indonesia, 2015. [Google Scholar]
- Munden Project. The Financial Risks of Insecure Land Tenure: An Investment View; Prepared for the Rights and Resources Initiative; Munden Project: Washington, DC, USA, 2012. [Google Scholar]
- Barney, K. Local vulnerability, project risk, and intractable debt: The politics of smallholder eucalyptus promotion in Salavane Province, Southern Laos. In Smallholder Tree Growing for Rural Development and Environmental Services: Lessons from South and Southeast Asia; Snelder, D., Lasco, R., Eds.; Springer: Berlin, Germany, 2008; pp. 263–286. [Google Scholar]
- Dwyer, M.B. Building the politics machine: Tools for “resolving” the global land grab. Dev. Chang. 2013, 44, 309–333. [Google Scholar] [CrossRef]
- Hett, C.; Nanhthavong, V.; Saphangthong, T.; Rodriguez Robles, G.; Phouangphet, K.; Speller, W.; Messerli, P.; Epprecht, M.; Heinimann, A. Land Deals in Laos: First Insights from a New Nationwide Initiative to Assess the Quality of Investments in Land. Conference Paper 18. In Proceedings of the Land Grabbing, Conflict and Agrarian-Environmental Transformations: Perspectives from East and Southeast Asia, Chiang Mai, Thailand, 5–6 June 2015. [Google Scholar]
- Li, Z.; Fox, J.M. Mapping rubber tree growth in mainland Southeast Asia using time-series MODIS 250 m NDVI and statistical data. Appl. Geogr. 2012, 32, 420–432. [Google Scholar] [CrossRef]
- Crampton, J. Mapping: A Critical Introduction to Cartography and GIS; John Wiley and Sons: London, UK, 2011. [Google Scholar]
- Bryan, J. Walking the line: Participatory mapping, Indigenous rights, and neoliberalism. Geoforum 2011, 42, 40–50. [Google Scholar] [CrossRef]
- Wainwright, J.; Bryan, J. Cartography, territory, property: Postcolonial reflections on Indigenous counter-mapping in Nicaragua and Belize. Cult. Geogr. 2009, 16, 153–187. [Google Scholar] [CrossRef]
- Peluso, N.L. Whose woods are these? Counter-mapping forest territories in Kalimantan, Indonesia. Antipode 1995, 27, 383–406. [Google Scholar] [CrossRef]
- Baird, I.G. Political memories of conflict, economic land concessions, and political landscapes in the Lao People’s Democratic Republic. Geoforum 2014, 52, 61–69. [Google Scholar] [CrossRef]
- Barney, K. Laos and the making of a ‘relational’ resource frontier. Geogr. J. 2009, 175, 146–159. [Google Scholar] [CrossRef]
- Dwyer, M. Turning Land into Capital. A Review of Recent Research on Land Concessions for Investment in the Lao PDR, Parts 1 and 2; Land Issues Working Group: Vientiane, Laos, 2007. [Google Scholar]
- Masek, J.G.; Vermote, E.F.; Saleous, N.; Wolfe, R.; Hall, F.G.; Huemmrich, F.; Gao, F.; Kutler, J.; Lim, T.K. LEDAPS Calibration, Reflectance, Atmospheric Correction Preprocessing Code, Version 2; ORNL DAAC: Oak Ridge, TN, USA, 2011. [CrossRef]
- Tucker, C.J. Red and photographic infrared linear combinations for monitoring vegetation. Remote Sens. Environ. 1979, 8, 127–150. [Google Scholar] [CrossRef]
- Woodcock, C.E.; Ryherd, S.L. Generation of Texture Images Using Adaptive WINDOWS. Technical Papers. In Proceedings of the ASPRS/ACSM Annual Convention, Baltimore, MD, USA, 2–7 April 1989; pp. 211–222. [Google Scholar]
- Baraldi, A.; Parmiggiani, F. An investigation of the textural characteristics associated with gray-level cooccurrence matrix statistical parameters. IEEE Trans. Geosci. Remote Sens. 1995, 33, 293–304. [Google Scholar] [CrossRef]
- Haralick, R.M.; Shanmuga, K.; Dinstein, I. Textural features for image classification. IEEE Trans. Syst. Man Cybern. 1973, SMC3, 610–621. [Google Scholar] [CrossRef]
- Berberoglu, S.; Lloyd, C.D.; Atkinson, P.M.; Curran, P.J. The integration of spectral and textural information using neural networks for land cover mapping in the mediterranean. Comput. Geosci. 2000, 26, 385–396. [Google Scholar] [CrossRef]
- Friedl, M.A.; Brodley, C.E.; Strahler, A.H. Maximizing land cover classification accuracies produced by decision trees at continental to global scales. IEEE Trans. Geosci. Remote Sens. 1999, 37, 969–977. [Google Scholar] [CrossRef]
- Quinlan, J.R. C4.5: Programs for Machine Learning; Morgan Kaufmann: San Mateo, CA, USA, 1993. [Google Scholar]
- Breiman, L. Bias, Variance, and Arcing Classifiers, Technical Report. 1996. Available online: https://www.stat.berkeley.edu/users/breiman/arcall96.pdf (accessed on 18 April 2018).
- Congalton, R.G. Assessing the Accuracy of Remotely Sensed Data: Principles and Practices; Lewis Publications: Boca Raton, FL, USA, 1999. [Google Scholar]
- Olofsson, P.; Foody, G.M.; Stehman, S.V.; Woodcock, C.E. Making better use of accuracy data in land change studies: Estimating accuracy and area and quantifying uncertainty using stratified estimation. Remote Sens. Environ. 2013, 129, 122–131. [Google Scholar] [CrossRef]
- Friedl, M.A.; Woodcock, C.E.; Gopal, S.; Muchoney, D.; Strahler, A.H.; Barker-Schaaf, C. A note on procedures used for accuracy assessment in land cover maps derived from AVHRR data. Int. J. Remote Sens. 2000, 21, 1073–1077. [Google Scholar] [CrossRef]
- Fox, J. Understanding a dynamic landscape: Land use, land cover, and resource tenure in northeast Cambodia. In Linking People, Place and Policy: A GIScience Approach; Walsh, S.J., Crews-Meyer, K.A., Eds.; Kluwer Academic Publishers: Boston, MA, USA; Dordrecht, The Netherlands; London, UK, 2001; pp. 113–130. [Google Scholar]
- Fox, J. Siam Mapped and mapping in Cambodia: Boundaries, sovereignty, and indigenous conceptions of space. Soc. Nat. Resour. 2002, 15, 65–78. [Google Scholar] [CrossRef]
- Baird, I.G. Various Forms of Colonialism: The Social and Spatial Reorganisation of the Brao in Southern Laos and Northeastern Cambodia. Ph.D. Thesis, University of British Columbia, Vancouver, BC, Canada, 2008. [Google Scholar]
- Ironside, J.; Baird, I.G. Wilderness and Cultural Landscape: Settlement, Agriculture, and Land and Resource Tenure in and Adjacent to Virachey National Park, Northeast Cambodia; Biodiversity and Protection Area Management Project; Ministry of Environment: Ban Lung, Cambodia, 2003. [Google Scholar]
- Ahrends, A.; Hollingsworth, P.M.; Ziegler, A.D.; Fox, J.M.; Chen, H.; Su, Y.; Xu, J. Current trends of rubber plantation expansion may threaten biodiversity and livelihoods. Glob. Environ. Chang. 2015, 34, 48–58. [Google Scholar] [CrossRef]
- Environmental Investigation Agency (EIA). Checkpoints: How Powerful Interest Groups Continue to Undermine Forest Governance in Laos; EIA: London, UK, 2012.
- Forest Trends. Forest Conversion in Lao PDR: Implications and Impacts of Expanding Land Investments; Forest Trends Policy Briefs; Forest Trends: Washington, DC, USA, 2014. [Google Scholar]
- Wood, D. Rethinking the Power of Maps; The Guilford Press: New York, NY, USA, 2010. [Google Scholar]
- Elwood, S.; Mitchell, S. Another politics is possible: Neogeographies, visual spatial tactics, and political formation. Cartographica 2013, 48, 275–292. [Google Scholar] [CrossRef]
| 1 | We describe this promise as “alleged” because, since contracts are not widely available, it is not possible to verify if the numbers referred to represent maximum amounts that can be acquired subject to land availability or actual amounts of land promised. |
| 2 | Viet Nam-Lao Rubber Group (VLRG) boundaries were digitized from Obein [23], while other boundaries came from primary data shared with the third author by anonymous sources at the Lao National Management Authority (NLMA), a central government agency, in 2008. |
| 3 | One example of this concerned map readability. Our NGO partners were generally impressed with the quality of the maps, but their first comment was that they could not orient themselves because villages and roads were not included. This was not an issue that the remote sensors had initially expected, as they were focused on vegetation change, and thought that including village and road names would clutter the map. However, for those working in the villages, reference points to roads and villages were considered essential, since these are the geographical markers that they mainly encounter in their everyday work. Thus, a later version of the maps prepared included village names and roads (Figure 2b), in order to make the maps usable in the field. |
Figure 1.
Study area with the three planned concession locations. District boundaries and names are in light gray. See note for concession location sources.
Figure 1.
Study area with the three planned concession locations. District boundaries and names are in light gray. See note for concession location sources.

Figure 2.
Location and the extent of rubber plantations in southern Laos. Shades of red to yellow indicate the year different plantations were established as identified in remotely sensed images. Also shown are the concession polygons shown in Figure 1 (thick black line) as well as major roads.
Figure 2.
Location and the extent of rubber plantations in southern Laos. Shades of red to yellow indicate the year different plantations were established as identified in remotely sensed images. Also shown are the concession polygons shown in Figure 1 (thick black line) as well as major roads.

Figure 3.
(a) Changes in rubber planted area between 2004 and 2012 in hectares. The areas correspond to what has been cleared/planted in individual years. (b) Changes in mean patch size of rubber planted area between 2004 and 2012 in hectares. The areas correspond to what has been cleared/planted in individual years.

Figure 4.
Rubber planted areas in southern Laos mapped from satellite data. The map on the left was produced by hand digitizing the plantation boundaries using visual clues while the map on the right was produced by supervised image classification.
Figure 4.
Rubber planted areas in southern Laos mapped from satellite data. The map on the left was produced by hand digitizing the plantation boundaries using visual clues while the map on the right was produced by supervised image classification.

Figure 5.
Comparison of hand digitized (center) and classified (right) maps of rubber plantations in southern Laos. The true color background image in the left visually identifies the location of and the nature of plantations.
Figure 5.
Comparison of hand digitized (center) and classified (right) maps of rubber plantations in southern Laos. The true color background image in the left visually identifies the location of and the nature of plantations.

Figure 6.
Landsat satellite views of rubber plantations in one sample location (top) and corresponding changes in landscape homogeneity (defined as decreases in contrast) quantified by image texture (bottom) in southern Laos. The image in the top the left was acquired in 2002 before the major expansion in rubber plantations took place. The image on the top right was acquired in 2011 following the major expansion. Landscape homogeneity is defined as lack of contrast between pixel values in a local image window or neighborhood.

Figure 7.
Quantitative changes in image texture by patch between 2002 and 2011 associated with rubber expansion. Here we use image local contrast as a form of image texture defined as the difference between pixel values in a local image window. In this context, the values in the X-axis correspond the variability of pixel values in each rubber plantation patch. The values in the Y-axis correspond to unique patch ID associated with a rubber plantation.


Table 1.
Characteristics of the Landsat data used in the study. TM (Landsat 5 Thematic Mapper). ETM+ (Landsat 7 Enhanced Thematic Mapper plus). Path/row numbers define the location of the two Landsat footprints used.
Table 1.
Characteristics of the Landsat data used in the study. TM (Landsat 5 Thematic Mapper). ETM+ (Landsat 7 Enhanced Thematic Mapper plus). Path/row numbers define the location of the two Landsat footprints used.
| Date | Sensor | Path/Row | Cloud Cover (%) |
|---|---|---|---|
| 2004/2/18 | TM | 126/049 | 3 |
| 2005/3/8 | TM | 126/049 | 0 |
| 2006/1/14 | ETM+ | 126/049 | 0 |
| 2007/3/14 | TM | 126/049 | 6 |
| 2008/3/16 | TM | 126/049 | 0 |
| 2009/2/15 | TM | 126/049 | 12 |
| 2010/2/2 | TM | 126/049 | 0 |
| 2011/2/5 | TM | 126/049 | 0 |
| 2012/2/16 | ETM+ | 126/049 | 13 |
| 2004/2/18 | TM | 126/050 | 0 |
| 2005/1/19 | TM | 126/050 | 0 |
| 2006/2/7 | TM | 126/050 | 0 |
| 2007/1/25 | TM | 126/050 | 0 |
| 2008/3/16 | TM | 126/050 | 7 |
| 2009/1/14 | TM | 126/050 | 0 |
| 2010/2/18 | TM | 126/050 | 0 |
| 2011/3/9 | TM | 126/050 | 1 |
| 2012/1/31 | ETM+ | 126/050 | 13 |
Table 2.
Confusion matrix showing the number of samples along with specific accuracy measures calculated from an independent set of reference data.
Table 2.
Confusion matrix showing the number of samples along with specific accuracy measures calculated from an independent set of reference data.
| Class | Other | Plantation | Total | User’s | Producer’s | Overall |
|---|---|---|---|---|---|---|
| Other | 432 | 35 | 467 | 0.93 | 0.97 | 0.92 |
| Plantation | 13 | 95 | 108 | 0.88 | 0.73 | |
| Total | 445 | 130 | 575 |
© 2018 by the authors. Licensee MDPI, Basel, Switzerland. This article is an open access article distributed under the terms and conditions of the Creative Commons Attribution (CC BY) license (http://creativecommons.org/licenses/by/4.0/).
Share and Cite
MDPI and ACS Style
Özdoğan, M.; Baird, I.G.; Dwyer, M.B. The Role of Remote Sensing for Understanding Large-Scale Rubber Concession Expansion in Southern Laos. Land 2018, 7, 55. https://0-doi-org.brum.beds.ac.uk/10.3390/land7020055
AMA Style
Özdoğan M, Baird IG, Dwyer MB. The Role of Remote Sensing for Understanding Large-Scale Rubber Concession Expansion in Southern Laos. Land. 2018; 7(2):55. https://0-doi-org.brum.beds.ac.uk/10.3390/land7020055
Chicago/Turabian StyleÖzdoğan, Mutlu, Ian G. Baird, and Michael B. Dwyer. 2018. "The Role of Remote Sensing for Understanding Large-Scale Rubber Concession Expansion in Southern Laos" Land 7, no. 2: 55. https://0-doi-org.brum.beds.ac.uk/10.3390/land7020055
Note that from the first issue of 2016, this journal uses article numbers instead of page numbers. See further details here.