Contribution of Traditional Farming to Ecosystem Services Provision: Case Studies from Slovakia


1
Institute of Landscape Ecology of the Slovak Academy of Sciences, P.O. Box 254, Štefanikova 3, 814 99 Bratislava, Slovakia
2
Department of Ecology and Environmental Sciences, Faculty of Natural Sciences, Constantine the Philosopher University in Nitra, Tr. A. Hlinku 1, 949 01 Nitra, Slovakia
3
Institute of Landscape Ecology of the Slovak Academy of Sciences, branch Nitra, Akademická 2, 949 01 Nitra, Slovakia
*
Author to whom correspondence should be addressed.
Land 2018, 7(2), 74; https://0-doi-org.brum.beds.ac.uk/10.3390/land7020074
Submission received: 16 May 2018
/
Revised: 2 June 2018
/
Accepted: 7 June 2018
/
Published: 12 June 2018
(This article belongs to the Special Issue Towards the Sustainable Management of Ecosystem Services in Social-Ecological Systems)
Abstract
:The main aim of this study is to assess the benefits provided by the ecosystems of traditional agricultural landscapes (TAL) and compare them to the outputs of large-scale agriculture. Assessment of ecosystem services (ES) was performed in four case-study areas situated in Slovakia, representing different types of TAL: Viticultural landscape, meadow–pasture landscape, and agricultural landscape with dispersed settlements and mosaics of orchards. The methodological approach was focused on assessment of all the principal types of ES—regulation and maintenance, provisioning, and cultural. Differences in the provision of ES due to the impact of different practices and intensities of agricultural landscape management were subsequently assessed and compared. The results show that TAL are generally more diverse and balanced regarding ES provision, mainly because of their varied patterns and their related functions. In particular they play an important role in water retention and the prevention of soil erosion—both important with respect to changes in climate. Modern intensive agriculture is principally able to fulfil the production functions. Support for traditional farming, landscape diversification and small-scale agricultural management is vital for enhancing the values of rural regions. Such measures could become key drivers for sustainable agricultural management in Slovakia, and elsewhere.
1. Introduction
Agriculture is considered a very important activity worldwide, securing most of the food required by humanity, and also having a significant influence on the shape of the landscape and its ability to fulfil various environmental functions and ecosystem services (ES) of benefit to society. All of these aspects vary according to the agricultural practices and technologies used [1,2]. The most significant development in Central and Eastern European agriculture in the second half of the 20th century was the collectivization process carried out as a part of a broad change of the socio-political system. Collectivization in Slovakia aimed at large-scale production of crops and meat by merging not only individual plots but also whole agricultural farms, which were then managed by centralized planning [3,4]. This process has had consequences for the overall landscape structure and quality [5,6]. As a result, a homogeneous large-scale agricultural landscape emerged, at the expense of the loss of the mosaic structure of traditional agricultural landscapes (TAL), as well as significant loss of small-scale patterns of non-forest permanent landscape vegetation [7,8,9].
The remnants of TAL in the European countryside represent many ingenious agricultural systems that have been shaped by the dynamic interaction of people and nature for centuries and as a result have also sustained high levels of agro-biodiversity [10]. The traditional practices deployed also represent a wealth of unique cultural heritage [11]. TAL in Slovakia constitute extensively utilized agricultural plots or mosaics of cultivated fields, meadows, pastures, orchards and vineyards, or early abandoned plots with a low degree of succession. They are characterized by some of the following features: (1) Small-scale structure of plot division, and/or (2) primary land use unchanged by the collectivization of agriculture under socialism, and/or (3) the presence of typical agrarian landforms [12,13]. Generally, TAL tend to be more diverse, smaller in scale, and more clearly structured and ordered than other agricultural landscapes [14,15]. TAL often survive as small remnants as a consequence of land use changes and intensification of agriculture and could be considered as “islands of biodiversity” in the present landscape [16,17,18].
Many scientific studies at the European level have shown that habitats with favorable conservation status tend to be characterized by higher species richness and that they show greater ability to provide ES than habitats with unfavorable status [19]. A high level of landscape biodiversity is closely linked to traditional methods of agricultural practices, which are now gradually disappearing across Europe [20,21]. From this point of view, landscape features and visual forms could be a very important indicator [22]. Several studies have confirmed that maintaining the TAL (and also the landscape character, or genius loci) is important with respect not only to wilderness protection due to the presence of semi-natural habitats [23], but also to informed regional management [21,24,25]. Also, a variety of studies have pointed out the importance of assessing the impact of the landscape structure and its spatial patterns [26,27,28,29,30]. The spatial patterns of the agricultural landscape affects biodiversity, function, dynamics of landscapes, landscape-based values and other landscape features.
Nowadays, global socio-economic trends are reflected at the regional level, which is a serious threat in that it causes homogenization of the landscape [31,32,33,34]. For a better understanding of the drivers and subsequent impacts of agricultural intensification that have occurred as a result of land use changes, identification of archetypal patterns of landscape systems is needed [35,36]. Another possibility for assessing the importance of landscape structure and biodiversity for the quality of landscape is the use of evaluation methods based on the ES approach, which we have applied in this study. The term ES is simply defined as the benefits obtained by people from nature, its processes and its functions. The ES approach is becoming more widespread (see e.g., refs. [37,38,39,40]). There are various methods and many examples of ES assessment for a wide range of purposes and applications—current ES research includes (among others) such topics as the evaluation of the role of ES in different types landscape (agricultural, forest, urban or wetland landscape) on local and national level [41,42,43,44,45], the role of ES in agricultural landscape diversity and productivity [2,46,47,48,49,50], and the impact on ES delivery of different land use [51,52,53,54,55,56]. In ES assessment, the agricultural landscape belongs to the most studied types of ecosystems.
This study aims to evaluate the potential of different types of agricultural landscape for the provision of functions and services to society, with regards to landscape utilization and management practices (traditional small-scale agriculture vs. large-scale cultivation patterns). Attention is paid to extensively cultivated farmland and TAL that are characterized by a higher diversity of landscape pattern and by the presence of semi-natural habitats. The hypothesis is that the traditional agricultural practices which are typical for TAL or extensively utilized farmland significantly contribute to the provision of ecological functions in the landscape and provide multifunctional services and benefits for society. The study is oriented towards (1) assessing the functional diversity of representative types of agricultural landscape in relation to the landscape stability, biodiversity and presence of semi-natural habitats; and (2) evaluating the selected ES in the chosen case-study areas, which represent different types of agricultural landscapes varying in form of land use and intensity of management.
2. Case Study Areas
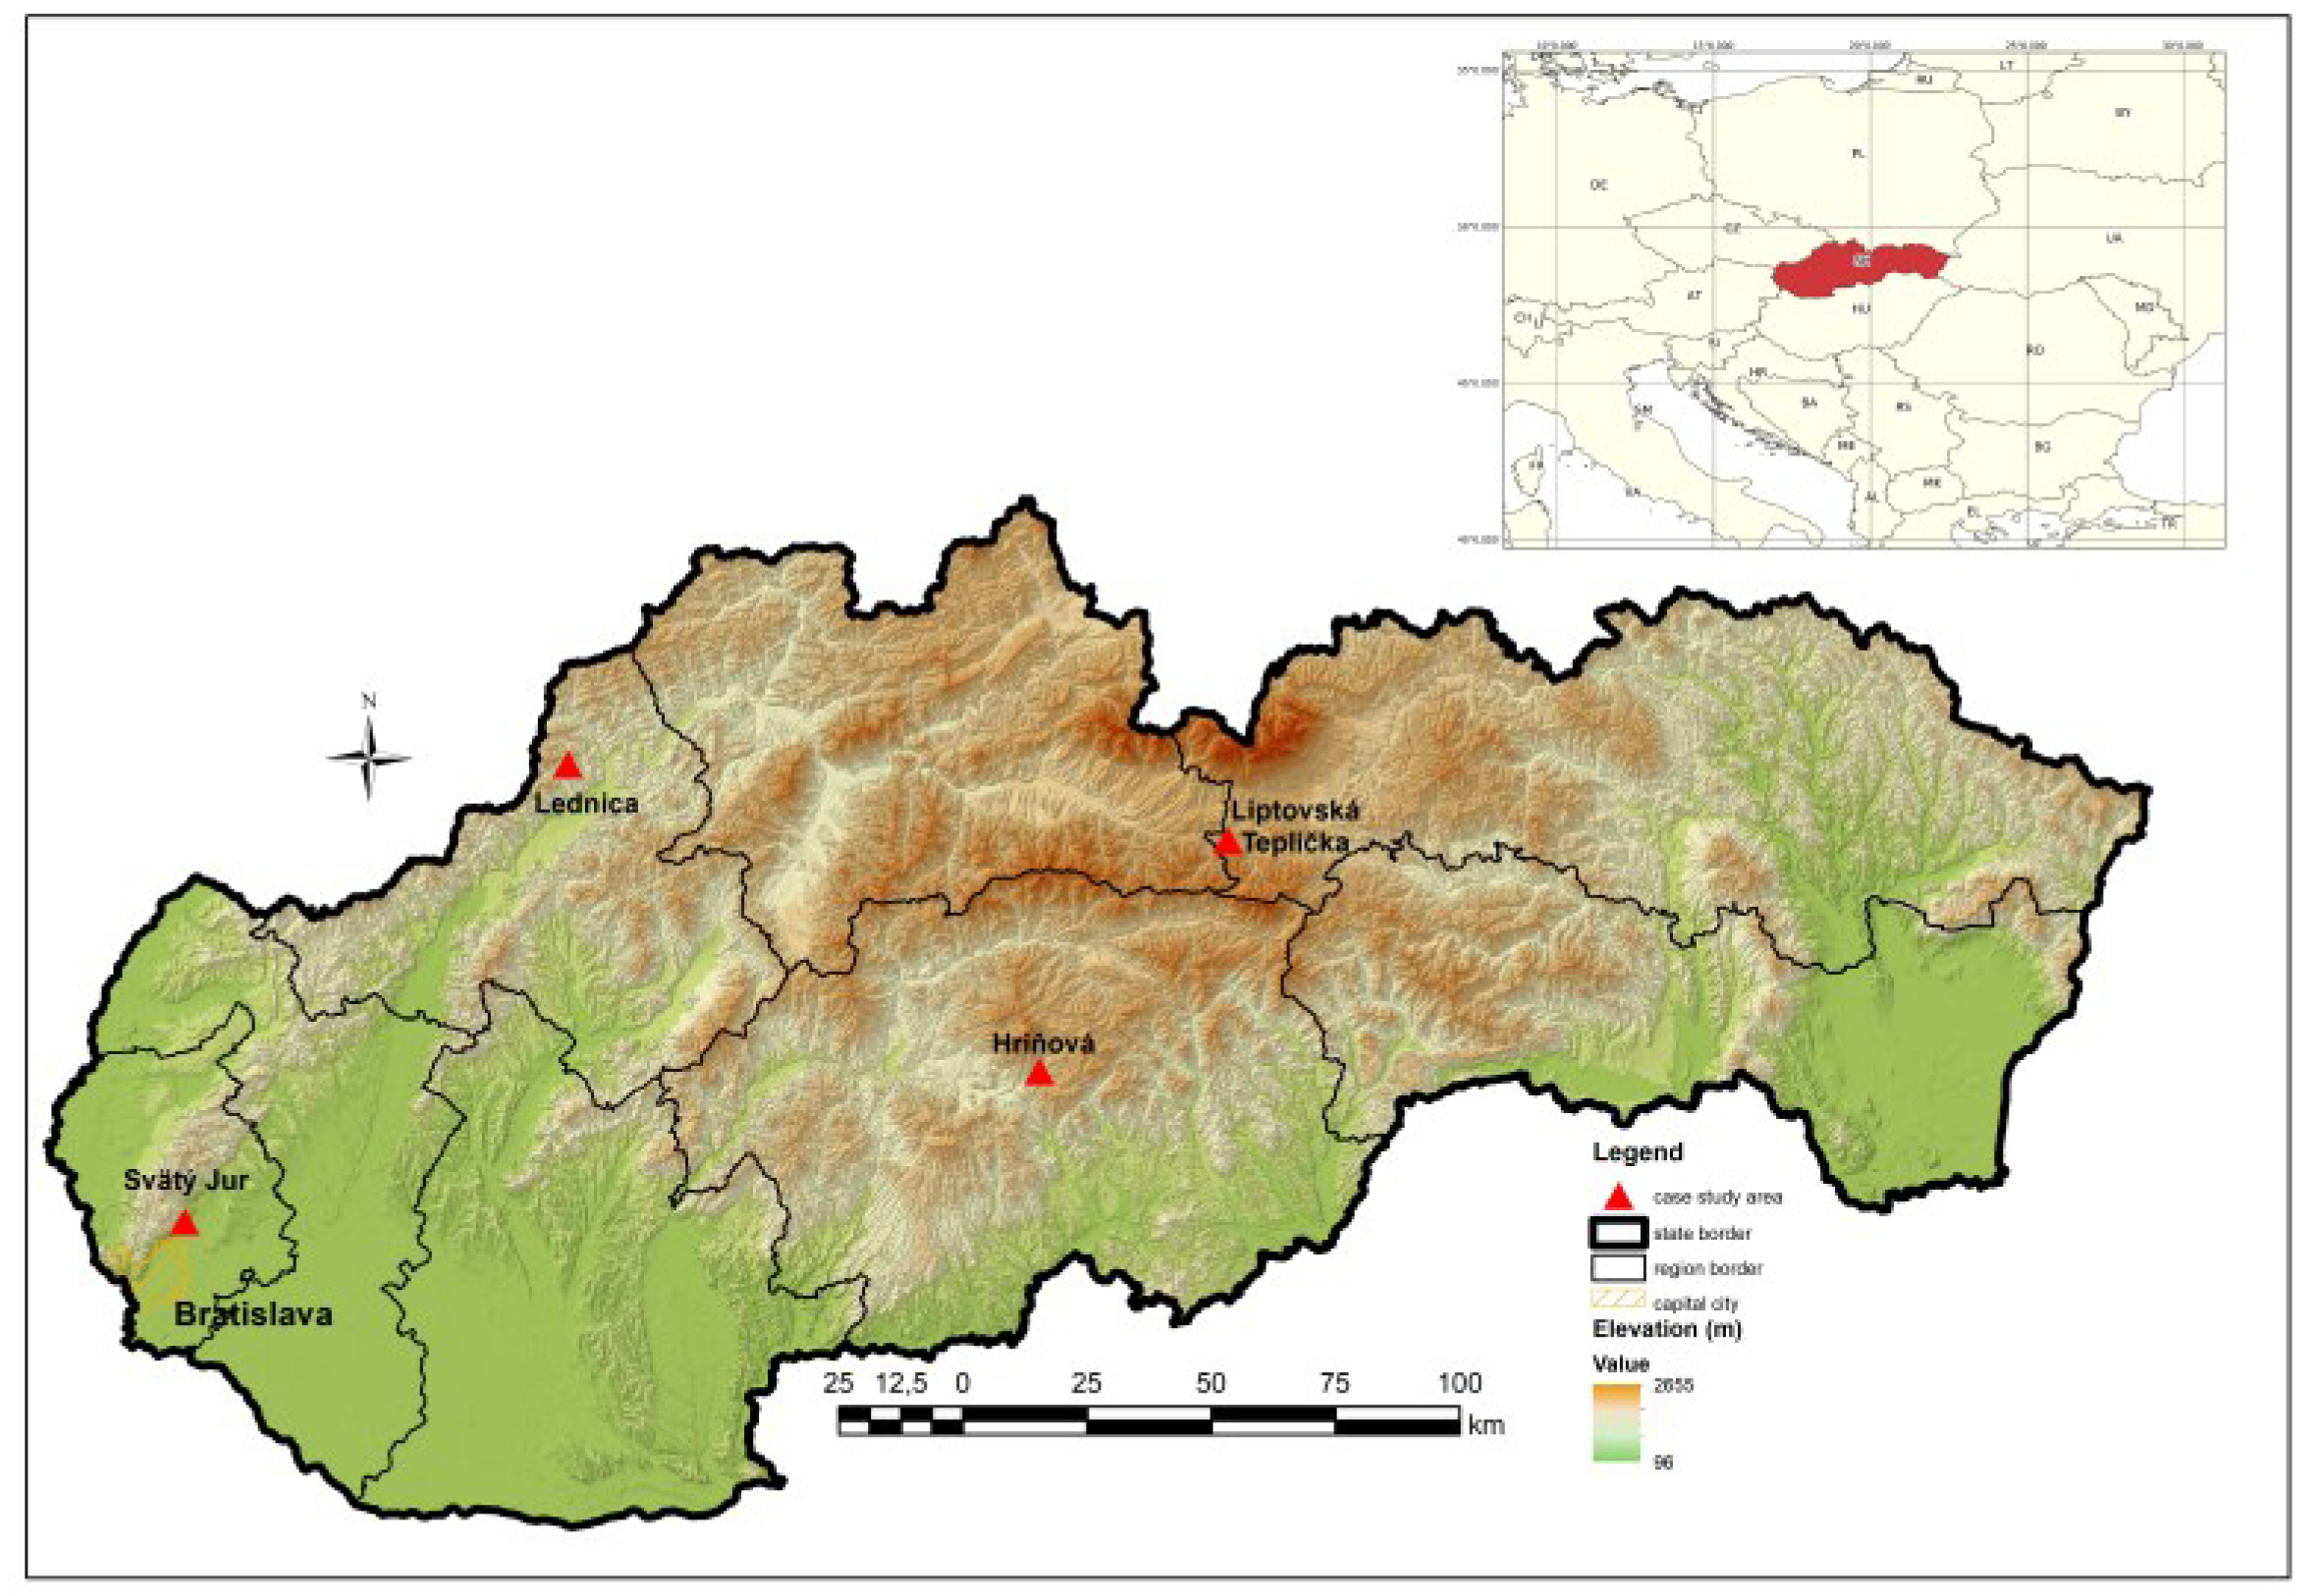
The research was conducted in Slovakia where some traditional farming has been preserved. Slovakia is mostly rural landscape, characterized by a diversified landscape structure. The total area is 49,034 km2, and the population is 5,435,343 inhabitants. The altitude varies from 95 m asl. (Streda nad Bodrogom) to 2655 m asl (Gerlachovsky peak). The dominant landscape structure is agricultural landscape, occupying 48.64% of the territory of Slovakia and consisting mostly of large-scale fields which originated during the collectivization of agriculture (1950s–1970s). The case-study areas (Figure 1, Table 1) are located in 3 of the main landscape types of Slovakia—lowland, foothill and mountain—and were selected as being representative in terms of TAL classification [57]:
- Svätý Jur—a typical rural vineyard area with preserved TAL of vineyards (part of the Small Carpathian wine region, the largest in Slovakia); altitude 126–514 m asl; 3987 ha; 4972 inhabitants. The landscape has been heavily affected by collectivisation, resulting in large-block partly-terraced vineyards (about 7% of the territory) and large blocks of fields (about 15.5%). The original mosaics of TAL are accompanied by “new” mosaics of small-plot vineyards, orchards and arable land created after 1990, which together cover 11.6% of the agricultural land [58].
- Lednica—TAL of arable-land, grasslands and orchards; altitude 398–565 m asl; 2265 ha; 2998 inhabitants. Currently, TAL areas constitute 18% of the agricultural landscape in Lednica cadaster, and they have been preserved close to the residential area. The study area is situated in the Považie region, which is one of the major well-known Slovak fruit areas [59].
- Hriňová—sub-mountainous landscape with dispersed settlements; altitude 490–1458 m asl; 12,649 ha; 7923 inhabitants. The agricultural landscape forms almost a quarter of the cadastral area (23.53%). Out of that, TAL constitutes 43.8% of the agricultural landscape, and mosaics of narrow fields on terraces occupy about 3.5% of the territory [60].
- Liptovská Teplička—TAL of Arable-Land and Grasslands; altitude 846–1429 m asl; 9868 ha; 2340 inhabitants. TAL constitutes only 13.4% of the cadastral area (forests cover 85%—the area is situated in the mountainous Low Tatra region). Only 17% of agricultural plots retain the traditional structure of narrow plots of grasslands (former small-plot fields and meadows) [61].
Detailed CLC statistics and land use maps of the case-study areas are supplied as supplementary materials (Supplement S1 and Supplement S2).
3. Materials and Methods
To attain the objective, the research was organized into two main steps—mapping and assessment of selected landscape features in the four case-study areas, followed by an assessment of the main ecosystem functions and services based on the expert assessment and GIS procedures by application of two different approaches.
3.1. Mapping and Assessment of Selected Landscape Features
Field mapping was performed, principally to assess the bio- and landscape diversity in four case-study areas. Landscape diversity was assessed based on the natural conditions and the land cover concerning the presence of semi-natural habitats and their biodiversity. During the field research, which was conducted in 2010–2015, special attention was paid to semi-natural habitats (grassland, shrubs and trees), and their species composition, spatial distribution and connectivity of landscape elements, and their ability to support ecosystem function and ES provision. The assessment of expected functions and services (e.g., provision of food, nesting sites, dispersal routes, regulation & maintenance) provided by the species or species group(s) of interest was based on the concept of functional landscape heterogeneity [62]. The following indicators representing the structural and functional features of ecosystems were mapped in detail in the field:
- Wild plants and their outputs: Wild plants species and their outputs, expressed by the amount of harvested fruits, herbs collected
- Fodder, fiber, timber, firewood: Material by amount, type, use
- Mediation of waste, toxins and other pollutants: Species composition of biota supporting biological filtration/sequestration/storage/accumulation of pollutants in land/soil, freshwater; visual screening of transport corridors e.g., by trees; green infrastructure to reduce noise and smells
- Mediation of flows: Flood or erosion protection by appropriate land coverage like grassland, small woodland, agrarian landforms; vegetation cover protecting/stabilizing terrestrial and riparian ecosystems
- Pollination and seed dispersal: Pollination by bees and other insects, number of hives; species’ relation to seed dispersal by insects, birds and other animals, or by wind, or to vegetative reproduction
- Pest and disease control: Naturalness of habitats that contribute to pest and disease control including resistance to invasion by alien species
- Recreational, physical and experiential interactions: By visits/use data, plants, animals, ecosystem type and preferred activities like walking, hiking, leisure fishing and leisure hunting
- Landscape aesthetics and inspiration: The subject matter of or inspiration for publications, artists, folklore.
The field survey was also focused on the intensity of land use (intensively utilized, extensively utilized, and abandoned) as the aim was to compare the traditional farming practices with modern intensive agriculture concerning their impact on the landscape and its provision of ES. Three different types of agricultural landscapes were taken into consideration, differing in landscape diversity, agricultural management and intensity of land use: small-scale agriculture linked to the TAL structures, intensively-utilized large-block agricultural plots, and new mosaics of small agricultural plots. The large-block agricultural landscape is a result of intensification and collectivization of agriculture; the new mosaics of small agricultural plots were created after 1989 by restoration of the land to the original owners.
For the ES division, we have used the Common International Classification of Ecosystem Services (CICES [63]), adapted for simple expert assessment of ES supply based on the field observation of indicators. In total 21 ES were considered, divided into 3 main sections: provisioning, regulation & maintenance, and cultural ES. The benefits of ES were assessed by 8 experts based on the fieldwork, using the observed indicators, and assigned a value from the following scale: 2—very positive effect, 1—positive, 0—neutral, −1—negative, −2—very negative effect or none at all. The final ES value was expressed as an average value of the individual experts´ assessments, given separately for each case-study area.
3.2. Assessment of Landscape Preconditions for ES Provision (Matrix-Based Approach)
The “matrix-based approach” has been used as a complementary method for ES assessment [64,65] in case-study areas. It is based on the combination of the spatial GIS analytical tools and expert evaluation. This method could be considered useful for “rapid assessment”—it is very flexible and can be applied at all spatial and temporal scales [65]. Matrix assessment is often based on the reclassification of land cover/land use data, but other data could also be involved. By using this method, the study aims to demonstrate the differences in the landscape’s preconditions for ES provision between the basic types of agricultural landscape management as found in the study areas—TAL, large-block intensively utilized landscape, and extensively utilized agricultural areas.
As a basis for comparison, land cover maps of the case-study area cadasters were prepared by the digitization and interpretation of aerial photographs (orthophotomaps) taken in the year 2012 [66,67], using the ArcGIS software tools. Identification of the individual land cover elements was performed by “on screen digitalization” method the scale of 1:5000. Land cover classes were then assigned by visual interpretation of used aerial orthophotomaps, using a unified legend based on the CORINE land cover classes (CLC) [68]. All 5 of the main Level 1 classes in the CLC nomenclature are represented in the study areas (artificial surfaces, agricultural areas, forests and semi-natural areas, wetlands and water bodies); in level 2 there are 13 from 15 groups represented. In level 3, of the 30 classes documented in the study areas, 23 are identical with the basic CLC legend, and 7 were modified. Finally, the level 4 classes were adapted for better determination of the TAL structures—in total, 68 classes were determined, of which 27 belong to the agricultural areas and 18 to the TAL structures (which are classified mainly as class 24, heterogeneous agricultural areas). The total size of the case study areas is 287.40 km2, of which 21.4% (61.52 km2) is agricultural land, and 29.3% (18.00 km2) of that we have classified as TAL. The list of documented CLC classes found in the 4 case-study areas, and their spatial extents, is presented as Supplementary S1.
For further assessment, relevant ES were selected based on a deliberative and expert-based approach (discussion at a scientific meeting, followed by a questionnaire aimed at selection of ES and their importance in the context of a Slovak countryside). This process was developed in the framework of the OpenNESS case study in Slovakia [69], but is also suitable for the purpose of this research. The final list of evaluated ES was extended compared to the ES assessment approach based on selected landscape features. In total, 26 individual ES were chosen (Table 2), grouped into 7 subsections and 3 main sections according to CICES classification [63]. Based on some studies [69,70], the most important ES of the Slovakian countryside could be considered to be: 3 provisioning services (P1, P7, P9 from Table 2), 6 regulation and maintenance ES (R1, R2, R4, R5, R7, R9) and 3 cultural ES (C1, C5, C6).
The next assessment step was the reclassification of CLC classes according to their preconditions for ES delivery; this was performed for all 26 relevant ES. The suitability value was expressed in a 6-degree scale (0–5), [64] where 0 means no relevant preconditions and 5 means a very high relevant preconditions for ES delivery—this could be understood as an ES supply approach according to Burkhard et al. [64]. These values were assigned by the team of experts involved in this study, and based not only on theoretical knowledge but also on the opinions of local stakeholders. Spreadsheet reclassification tables for the 3 main sections of ES are presented as supplementary data in S3.
The final step of the assessment was the calculation of the CLC classes’ preconditions for ES provision—firstly for the 7 ES sub-sections and then for the 3 main ES sections. For this process, the relative importance (weight) values from Table 1 were used, assigned by the same expert procedure as in the former assessment stage. Although the matrix-based analyses were conducted for whole cadastral areas of case-study areas, the focus was on the comparison of the TAL structures with other agricultural landscapes when evaluating the results. The interpretation of the results was therefore aimed at assessing the importance of ES provision of different agricultural landscape management approaches. Indices of landscape preconditions for ES provision were calculated for the 3 main ES sections—firstly for all agricultural landscape and then also for TAL alone and for the non-TAL agricultural area. These values were calculated as area-weighted averages in all case-study areas.
The matrix-based approach gives results and comparisons in terms of the overall importance of different landscape features for ES provision; but it cannot explain the issues of relative significance and functional variability of landscape elements for different ES. For such purposes, the complementary comparison of significance (ES_C) and the functional variability (volatility of the functions expressed as a standard deviation of obtained values, ST_DEV) of all agricultural land use classes occurring within the case-study areas were calculated. The main assumption in such an assessment is that a higher significance and higher functional variability (lower value of standard deviation) means a higher precondition of a given land use class towards the provision of a certain ES. By considering these two indicators together, the differences between the main types of agricultural landscape—large-block intensively utilized agricultural landscape, large-block extensively utilized agricultural areas, and TAL—should be clarified.
4. Results
4.1. Assessment of Ecosystem Services and Related Functions Based on Field Research and Evaluation by Experts
In this section, a basic assessment of ES provision and a comparison of all four case-study areas is provided, discussing the results of the in-field expert evaluation. The focus was mainly on ES related to semi-natural habitats. The distribution and proportion of these ES were much higher in all TAL mosaics than in intensively utilized landscapes. These habitats are almost absent in new mosaics and intensively utilized large-block agricultural landscape, or they occurred only as field margins, roadside vegetation, or adjacent riparian vegetation.
4.1.1. Assessment of Provisioning Ecosystem Services
The case-study areas differ in the amount of biomass provided for nutrition and in the principal cultivated crop which the agricultural landscape provides: grapes, fruit, cereals and potatoes (Table 3). The best environmental conditions for crops production are in Svätý Jur and Lednica. The high proportion of grassland in Liptovská Teplička, Lednica and Hriňová provides the conditions for biomass production, especially grass and other plants for fodder and fertilization. The largest proportion of intensively utilized grasslands for biomass production is in Lednica, as part of the agricultural land was reclaimed during the collectivization period and, being unsuitable for arable land, turned to grassland after 1989. These intensively utilized grasslands serve mainly to support livestock production by grazing and provision of hay. The lowest presence of intensively utilized meadows is in Hriňová, only 2% of the study area, as no collectivization took place there. There are also grasslands as a part of the mosaic of plots; these are also used for biomass production.
The most important provisioning ES provided by semi-natural habitats are food, material, and other wild plant products harvested for domestic or commercial use (mushrooms, berries, honey, flowers, and other chemical compounds derived from plants or herbs). The open agricultural landscape areas of Svätý Jur are notable for chestnut production and wild berries like raspberries, blackberries, and rosehips growing freely on the typical agrarian landforms and along the field roads. Wild plants and their berries, especially raspberries, darts, and hazelnuts growing on the agrarian landforms, or in small woodlands, are used by the locals of Hriňová, albeit to a lesser extent. The extensively utilized meadows, orchards, and vegetation of agrarian landforms are, in all case-study areas, characterized by high species richness and thus provide a large number of medicinal herbs and wild plant species as a resource for the bees that produce honey and pollen. The highest honey production was recorded in Lednica.
The experts’ assessment of provisioning ecosystem services (Table 4) indicated the importance of intensively utilized agricultural land for crop production, while TAL are more important for wild plants and their fruits. The small differences in the expert assessment for each case study area arose as experts took into account the real production potential as influenced by natural conditions (e.g., less fertile soils in Liptovská Teplička or Hriňová).
4.1.2. Assessment of Regulation and Maintenance Ecosystem Services
Semi-natural habitats of grassland and small patches of woodland form TAL mosaics and, together with the surrounding riparian vegetation, are connected to a range of ecological processes in the landscape—most notably soil protection, water retention and climate regulation. Their varied species composition significantly contributes to the regulation of waste, toxins, and other pollutants, by the attenuation of various organic compounds, fertilizers, nitrates and pesticides used in agriculture. The most active plants in phytodegradation or phytostabilization are willows (Salix sp.), poplars (Populus sp.), and grasses and herbs like Arrhenatherum elatius, Festuca sp., Sorghum sp., Panicum sp., Trifolium sp. and other legumes [73]. These species are naturally present in the TAL mosaics of the case-study areas.
Lines of trees and small woodlands create a green infrastructure of TAL and increase the mediation of waste by these ecosystems. They contribute to the reduction of noise and smells and improved visual effect. Some wild tree species like Pinus sp., Betula sp., Tilia sp., Ulmus sp. secrete phytoncides that have an antibacterial effect. These plants have been planted intentionally in some cases, but in others grew spontaneously on abandoned lands. The high proportion of woods and small woodlands in TAL of Svätý Jur and Hriňová, and of orchards in Lednica, promotes micro- and regional climate regulation by improvement of microclimate parameters.
The regulation that is provided by TAL ecosystems is likely to be of particular importance in extreme natural conditions, such as steep terrain or where there is a risk of natural hazards. Vegetation cover is the key factor preventing soil erosion, and the role played by species diversity is in increasing the stability and resilience of the system. In all study areas, a rich soil flora, including many different plant species, keeps the soil rich in nutrients and thus promotes maintenance of the bio-geochemical condition of the soil, including fertility, nutrient storage, and soil structure [74].
Maintenance of optimal surface and groundwater balance and regime requires the capture and transformation of precipitation by various landscape features. Elements such as the agrarian landforms, grasslands, and small woods in case-study areas contribute to this. Water flow maintenance can also be supported by special forms of intensively utilized agricultural landscapes, e.g., the terraced vineyards in Svätý Jur, or by the changing of large-block agricultural fields on steep slopes into grassland in the Liptovská Teplička and Lednica study areas.
Natural and semi-natural habitats provide nesting and floral resources for pollinator species and insects, birds, and other animals important for seed dispersal. Notably high pollination and seed dispersal were identified in TAL in Liptovská Teplička and other study areas due to high species richness. In some agricultural systems, especially in TAL with orchards in Lednica, pollination is actively managed through the establishment of a population of domesticated honey bees (Apis mellifera). The species-rich habitats of TAL provide favorable conditions for lifecycle maintenance, habitat and gene pool protection, and pest control. The traditional varieties of fruit trees found in Lednica have above-average resistance to pests.
Different indicators representing the structural and functional features of ecosystems have been taken into account in the expert assessment of regulation ES and depending of environmental conditions; the ES effectiveness values can be slightly different among each case study areas (Table 5).
4.1.3. Assessment of Cultural Ecosystem Services
Many cultural services are associated with TAL, and there is strong evidence that biodiversity of TAL plays a positive role in enhancing human well-being [75,76], especially in the case of agro-tourism, eco-tourism and educational activities taking place in the landscapes and inspired by the local ecosystems.
Extensive agricultural systems and attractive traditional landscape management provide the proper conditions for development of recreational services related to the promotion of the traditional farmer´s lifestyle and recognition and tasting of the traditional products. Such experiences are on offer in a variety of celebrations and festivals that take place regularly in case- study areas.
Bicycle, hiking and educational paths through the study areas offer pleasant views of the TAL that increase the attractiveness and aesthetic value of such region. Enjoyment of scenery, along with other landscape interactions, creates an opportunity to develop a sense of place (natural and cultural heritage), and local people have expressed their willingness to preserve the ecosystems and landscapes for the experience and use of future generations [75]. The traditions and practices help to maintain different folk groups and local civic associations in all study areas.
Spiritual and symbolic interaction with nature and the agricultural landscapes is manifested by chapels and crosses alongside the roads, for example, the typical “Detva cross” in Hriňová, which are abundantly decorated with traditional carved symbols such as grapes, images of the Eucharist (chalice with host), flowers, etc. Many local names in the vicinity of Lednica, mentioning vineyards and gardens, reflect the long history of agriculture and human interaction with the landscapes (Table 6).
4.2. Assessment of Agricultural Landscape Preconditions for ES Provision (Matrix Approach)
A complementary method for ES assessment was based on the reclassification of land use maps according to the preconditions for ES provision. Separate evaluation for the three main sections of ES is given in Section 4.2.1, Section 4.2.2 and Section 4.2.3. With this approach, the importance of the agricultural landscape types will be emphasized with respect to these ES (by comparison of both TAL and intensively utilized agricultural landscape), and also include the overall ES supply for the entire cadastral areas as a broader context.
4.2.1. Comparison of Study Areas’ Provisioning Ecosystem Services Using the Matrix Approach
The results confirm the relatively low preconditions of the agricultural landscape of the study areas for provisioning services—the overall potential was less than average (1.53–1.93) in all areas, with the nutrition supply (2.05–2.47) significantly higher than materials provision (0.70–1.13) (Table 7, Figure 2). The highest provision of nutrition, and also material, services are in Svätý Jur, while the lowest nutrition supply is in Lednica and lowest material services are in Hriňová. The dominant provisioning ES are in all areas Fodder (P2) and Domestic animals (P3); in Svätý Jur, Food production (P1) and Biomass for energy (P7) as well.
Regarding the importance of TAL for provisioning services, we have documented how in Svätý Jur the traditional vineyards and orchards make only a very small contribution to the preconditions of the agricultural landscape for provisioning services. In the other three case-study areas, TAL has either about the same (Liptovská Teplička) or a slightly higher (Lednica, Hriňová) provisioning potential compared to intensified large-block agriculture. The most important provisioning ES provided by TAL structures are mostly Biomass for food (P1) and Fodder (P2), plus Biomass for energy (P7) and Fiber (P8) in some areas.
4.2.2. Comparison of Study Areas’ Provision of Regulating Ecosystem Services Using the Matrix Approach
The results of the matrix-based approach (Table 8 and Figure 3) show the low importance of the agricultural landscape in case-study areas for mediations of toxins (0.96–1.47) and flows (0.82–1.31) and relatively low importance for regulation and maintenance (1.48–1.71). Thus, the overall preconditions of agricultural landscape for this whole ES group are low (1.13–1.53), and at their lowest in the Svätý Jur and their highest in the Lednica. On the other hand, the overall preconditions of the entire cadastral area for regulating ES range from 3.36 (Lednica) to 3.88 (Liptovská Teplička); this reflects the high proportion of forests and woodlands found in all cadastral areas, which land use types are important for the ecological state of the landscape. The dominant regulating ES of the agricultural landscape are R3 (Waste regulation), R9 (Pest and disease control), and R10 (Pollination, lifecycle maintenance).
The importance of TAL relative to other agricultural areas is most visible in the lowland and sub-mountainous areas (Svätý Jur, Lednica), where the contribution of TAL to the regulating ES is very high. In mountain areas like Liptovská Teplička and Hriňová, there is no significant difference between TAL and other types of agricultural use in the preconditions for regulating ES. The most important regulation and maintenance ES provided by TAL structures are Pollination and lifecycle maintenance (R10), Waste regulation (R3), Erosion control (R5), and to a lesser degree Local climate regulation (R7) and Pest and disease control (R9).
4.2.3. Comparison of Study Areas’ Provision of Cultural Ecosystem Services Using the Matrix Approach
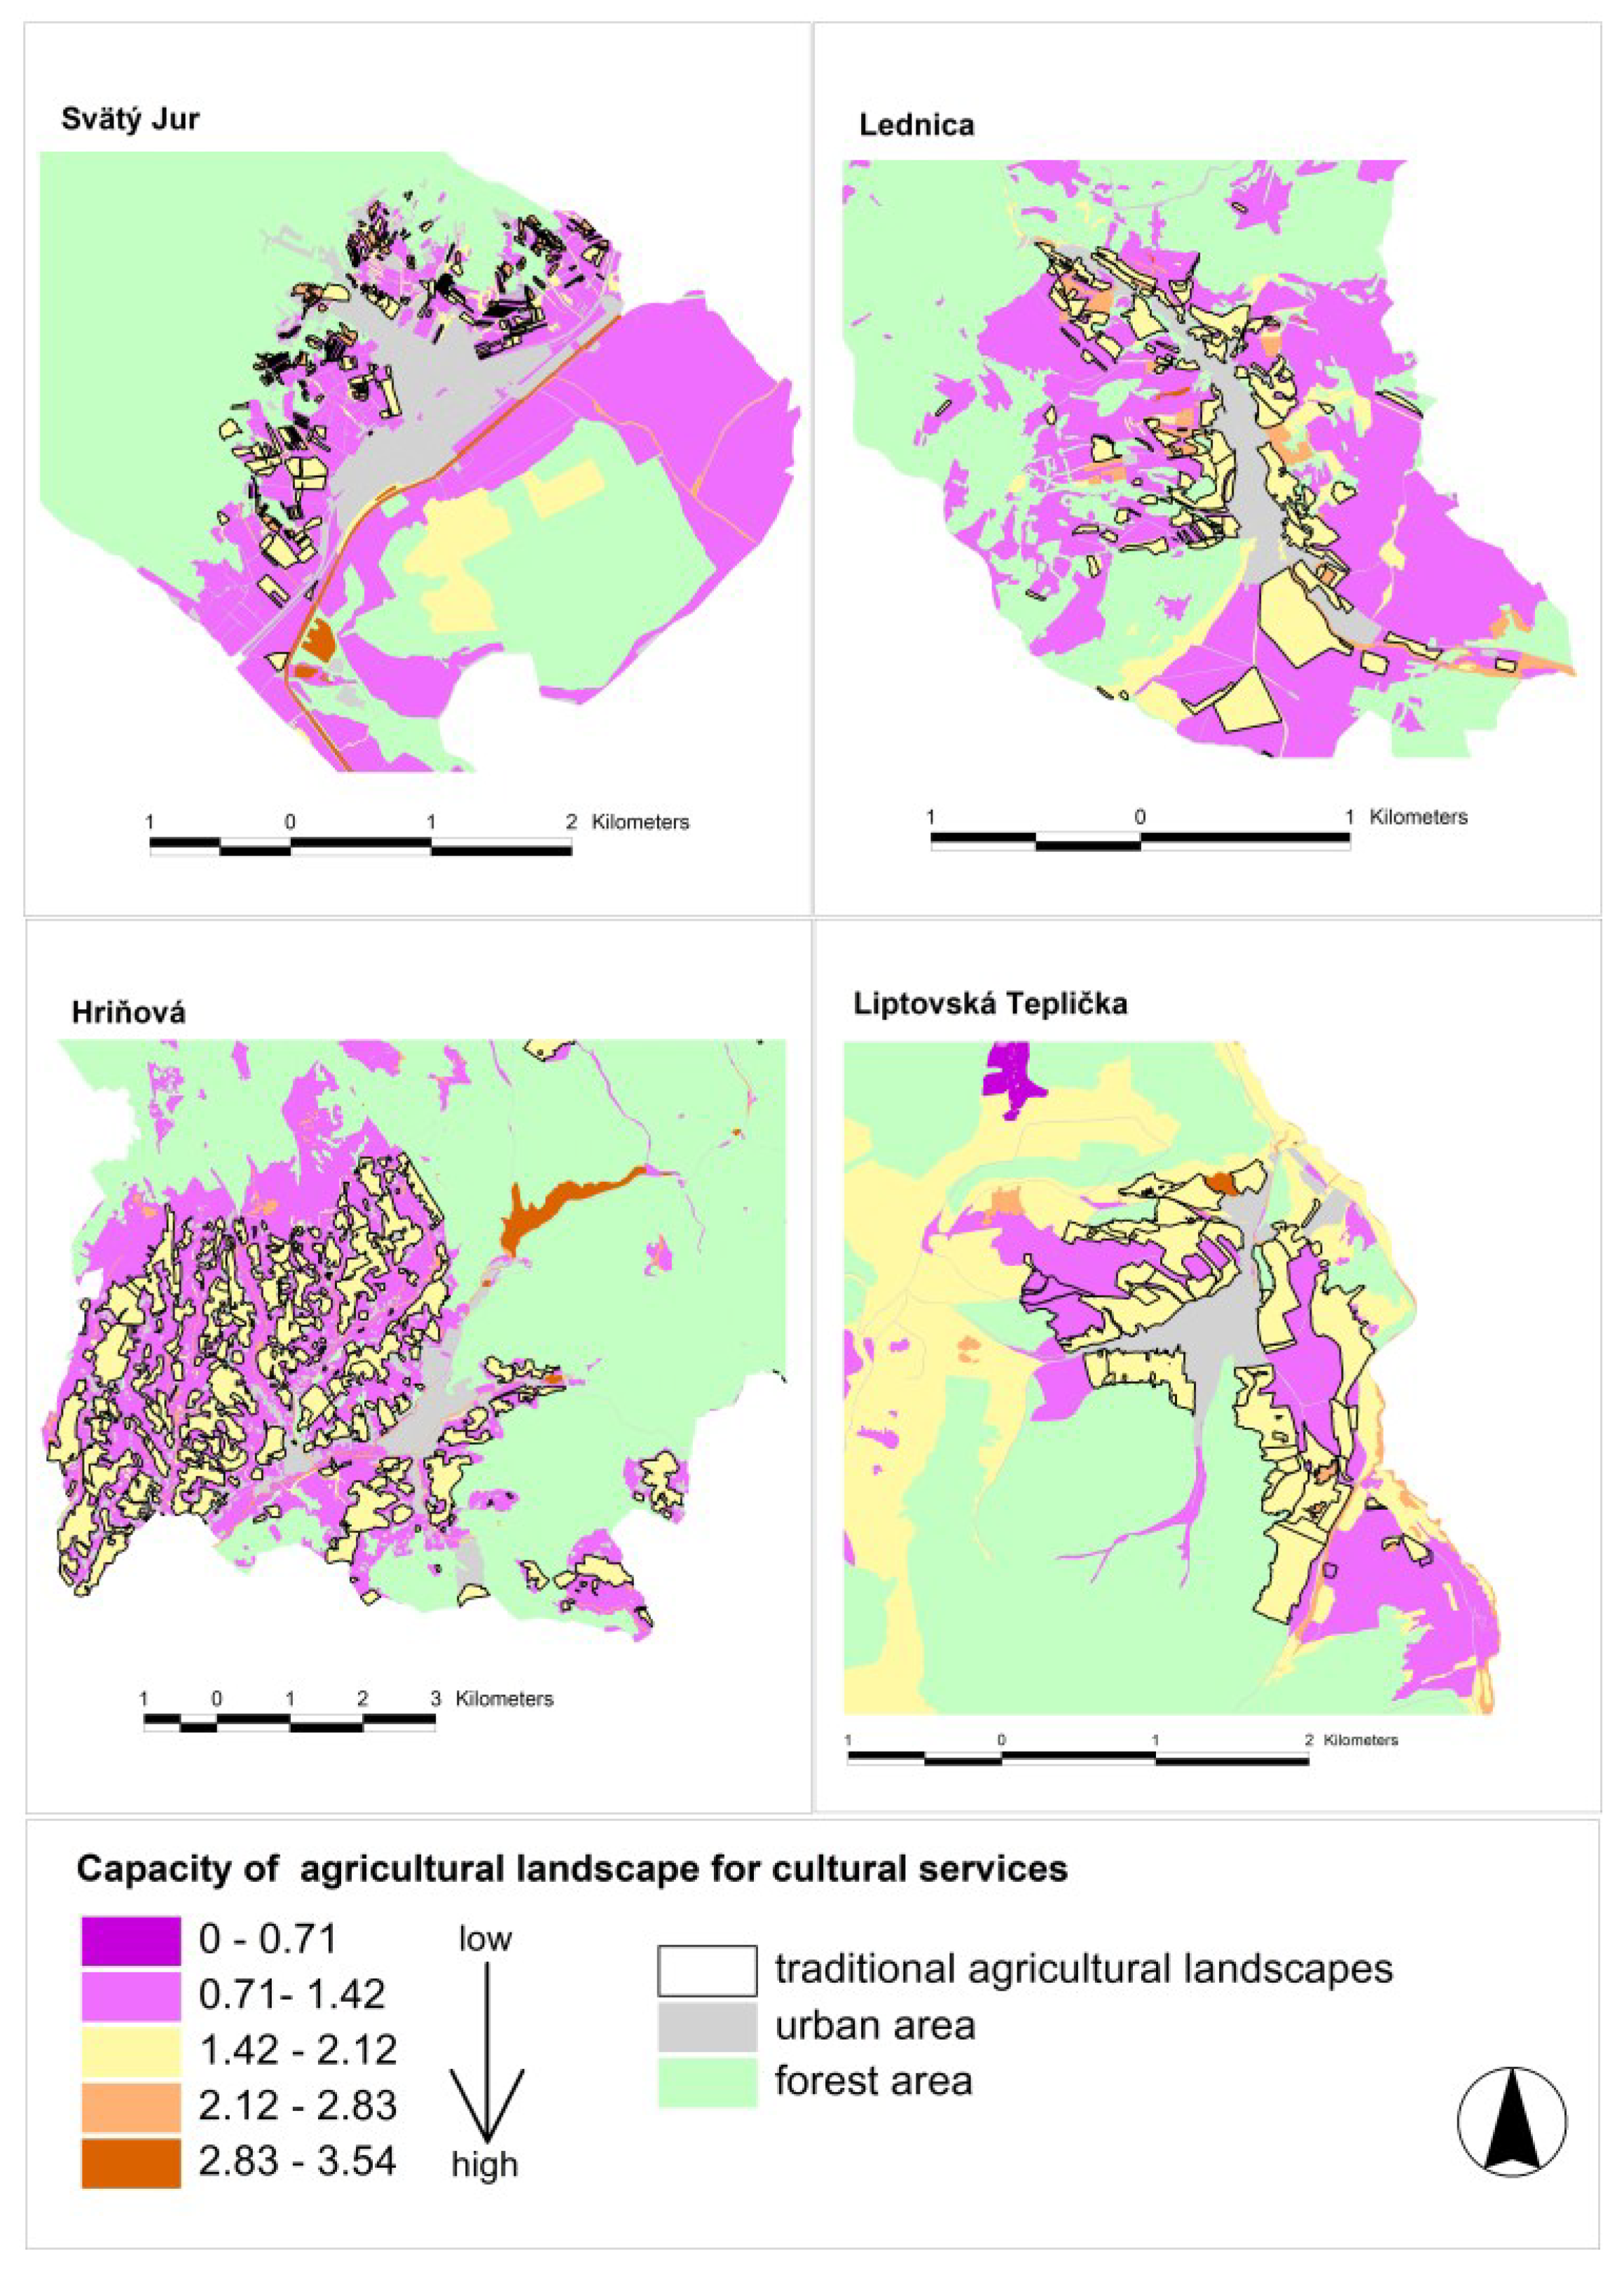
The overall preconditions of the study cadastral areas for cultural ES is high and ranges from 3.23 (Lednica, Svätý Jur, Hriňová) to 3.86 (Liptovská Teplička). The higher level of the latter area is caused mainly by its high share of forests, which are important for physical interactions (recreation), landscape aesthetics and as a place for people to encounter and learn about nature and the area. However, the importance of the agricultural landscape is much lower (from 1.31 in Svätý Jur to 1.69 in Lednica), at least in terms of spiritual & knowledge ES, although its provision of physical and intellectual ES is slightly higher (Table 9, Figure 4).
There are no dominant cultural ES for the agricultural landscape as a whole; the highest overall potential was documented for C6 (Knowledge), the lowest for C5 (religious and spiritual interactions). It is obvious that the TAL structures are more valuable for cultural ES than other types of agricultural landscape, particularly in case of the Svätý Jur and Lednica with their relatively high share of non-forested areas. In mountain areas, the difference between TAL and other agricultural land in relation to cultural ES is not so significant. Generally, the TAL in all case-study areas are characterized by a relatively high preconditions for cultural ES (except Religious and spiritual interactions, C5). The most importance was for the Recreation (C1) and Cultural heritage and diversity (C3) services.
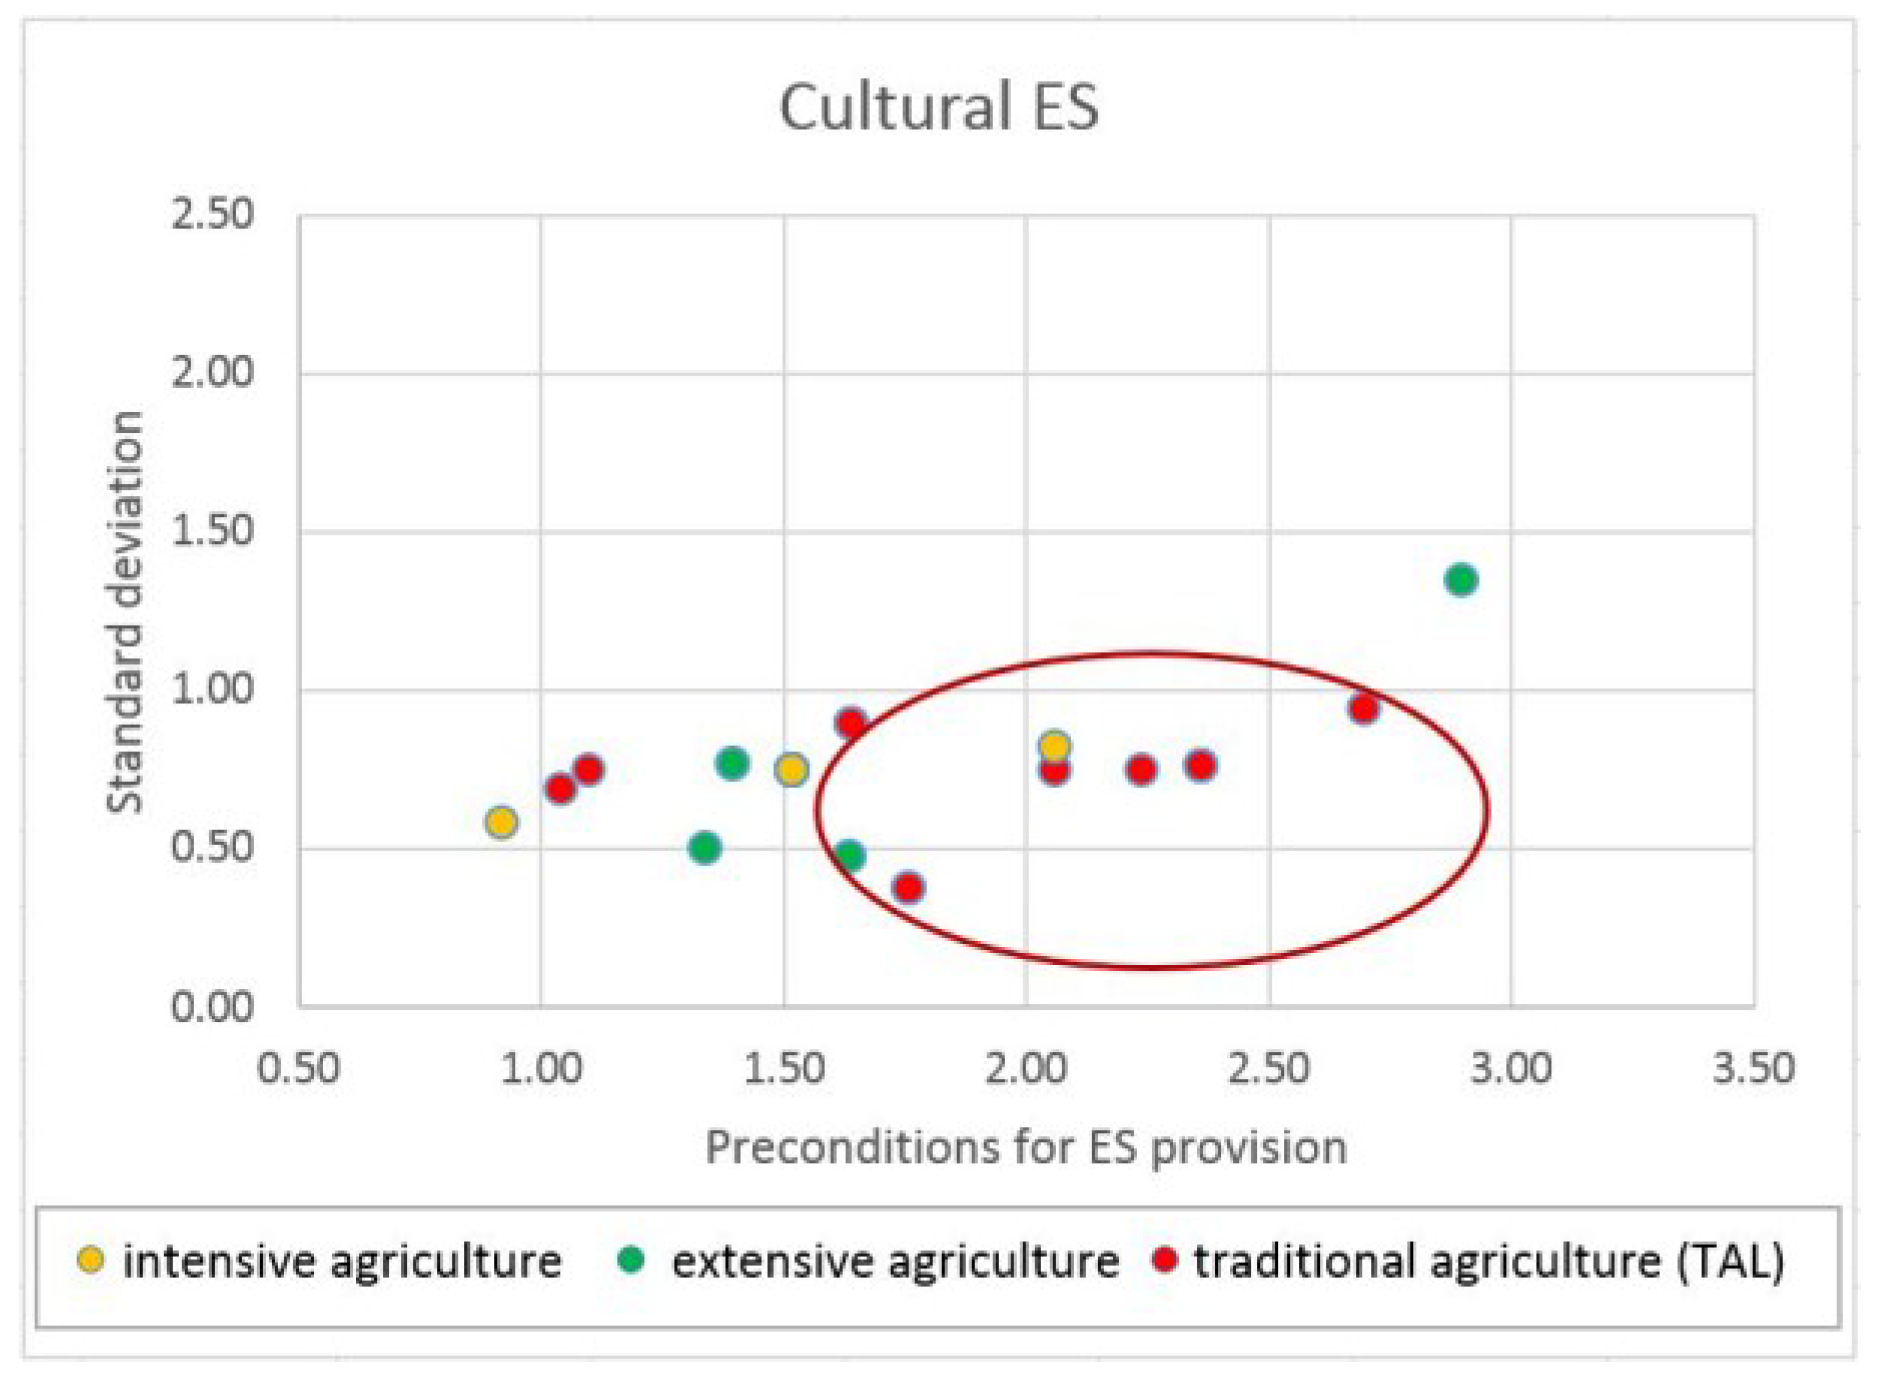
4.2.4. Overall Significance and Functional Variability of Land Use Classes according to ES Provision
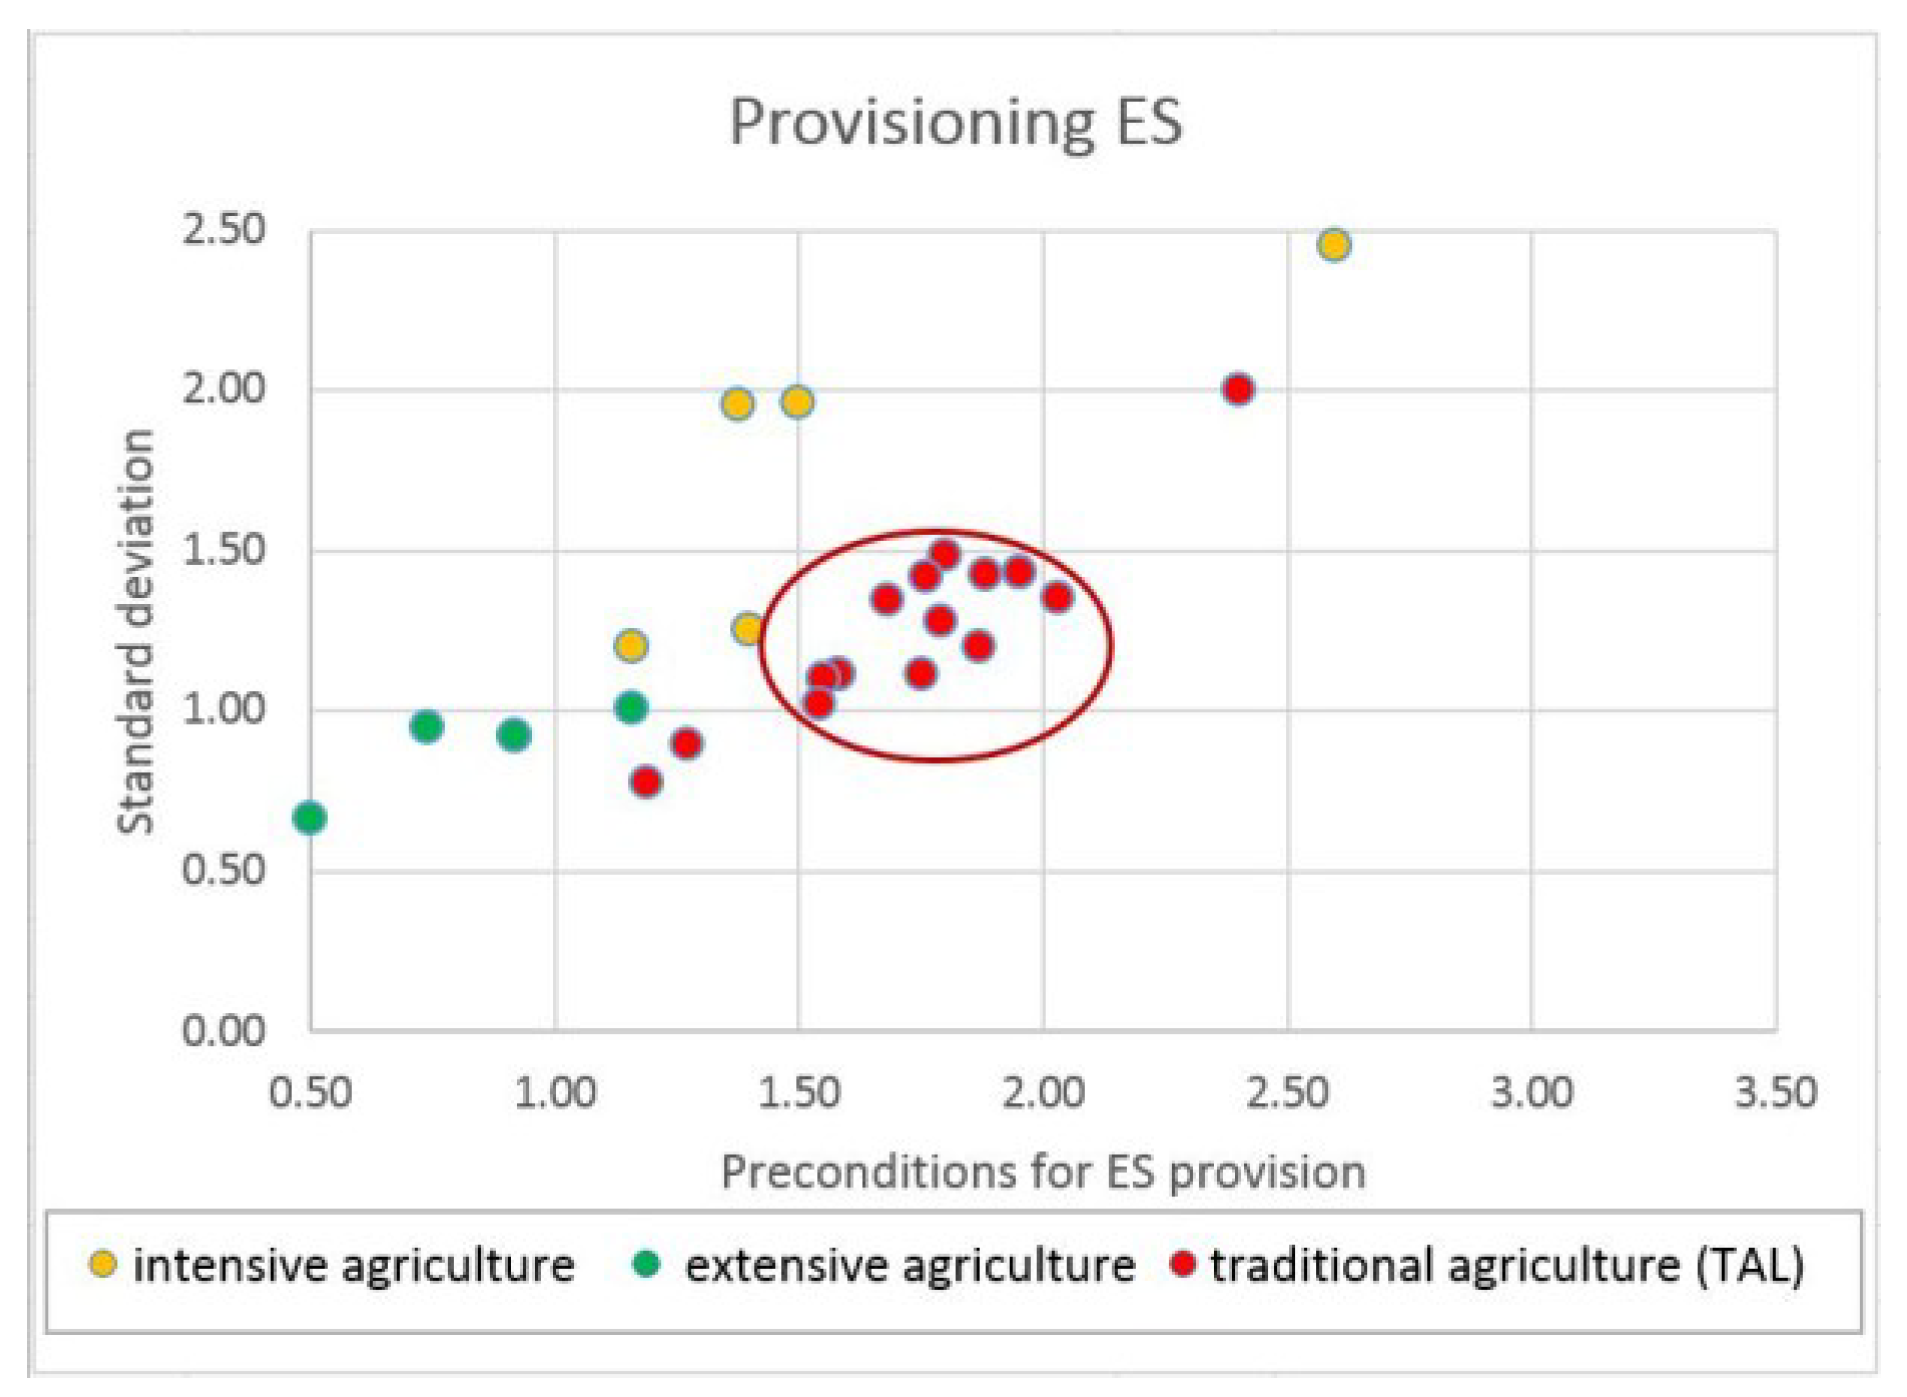
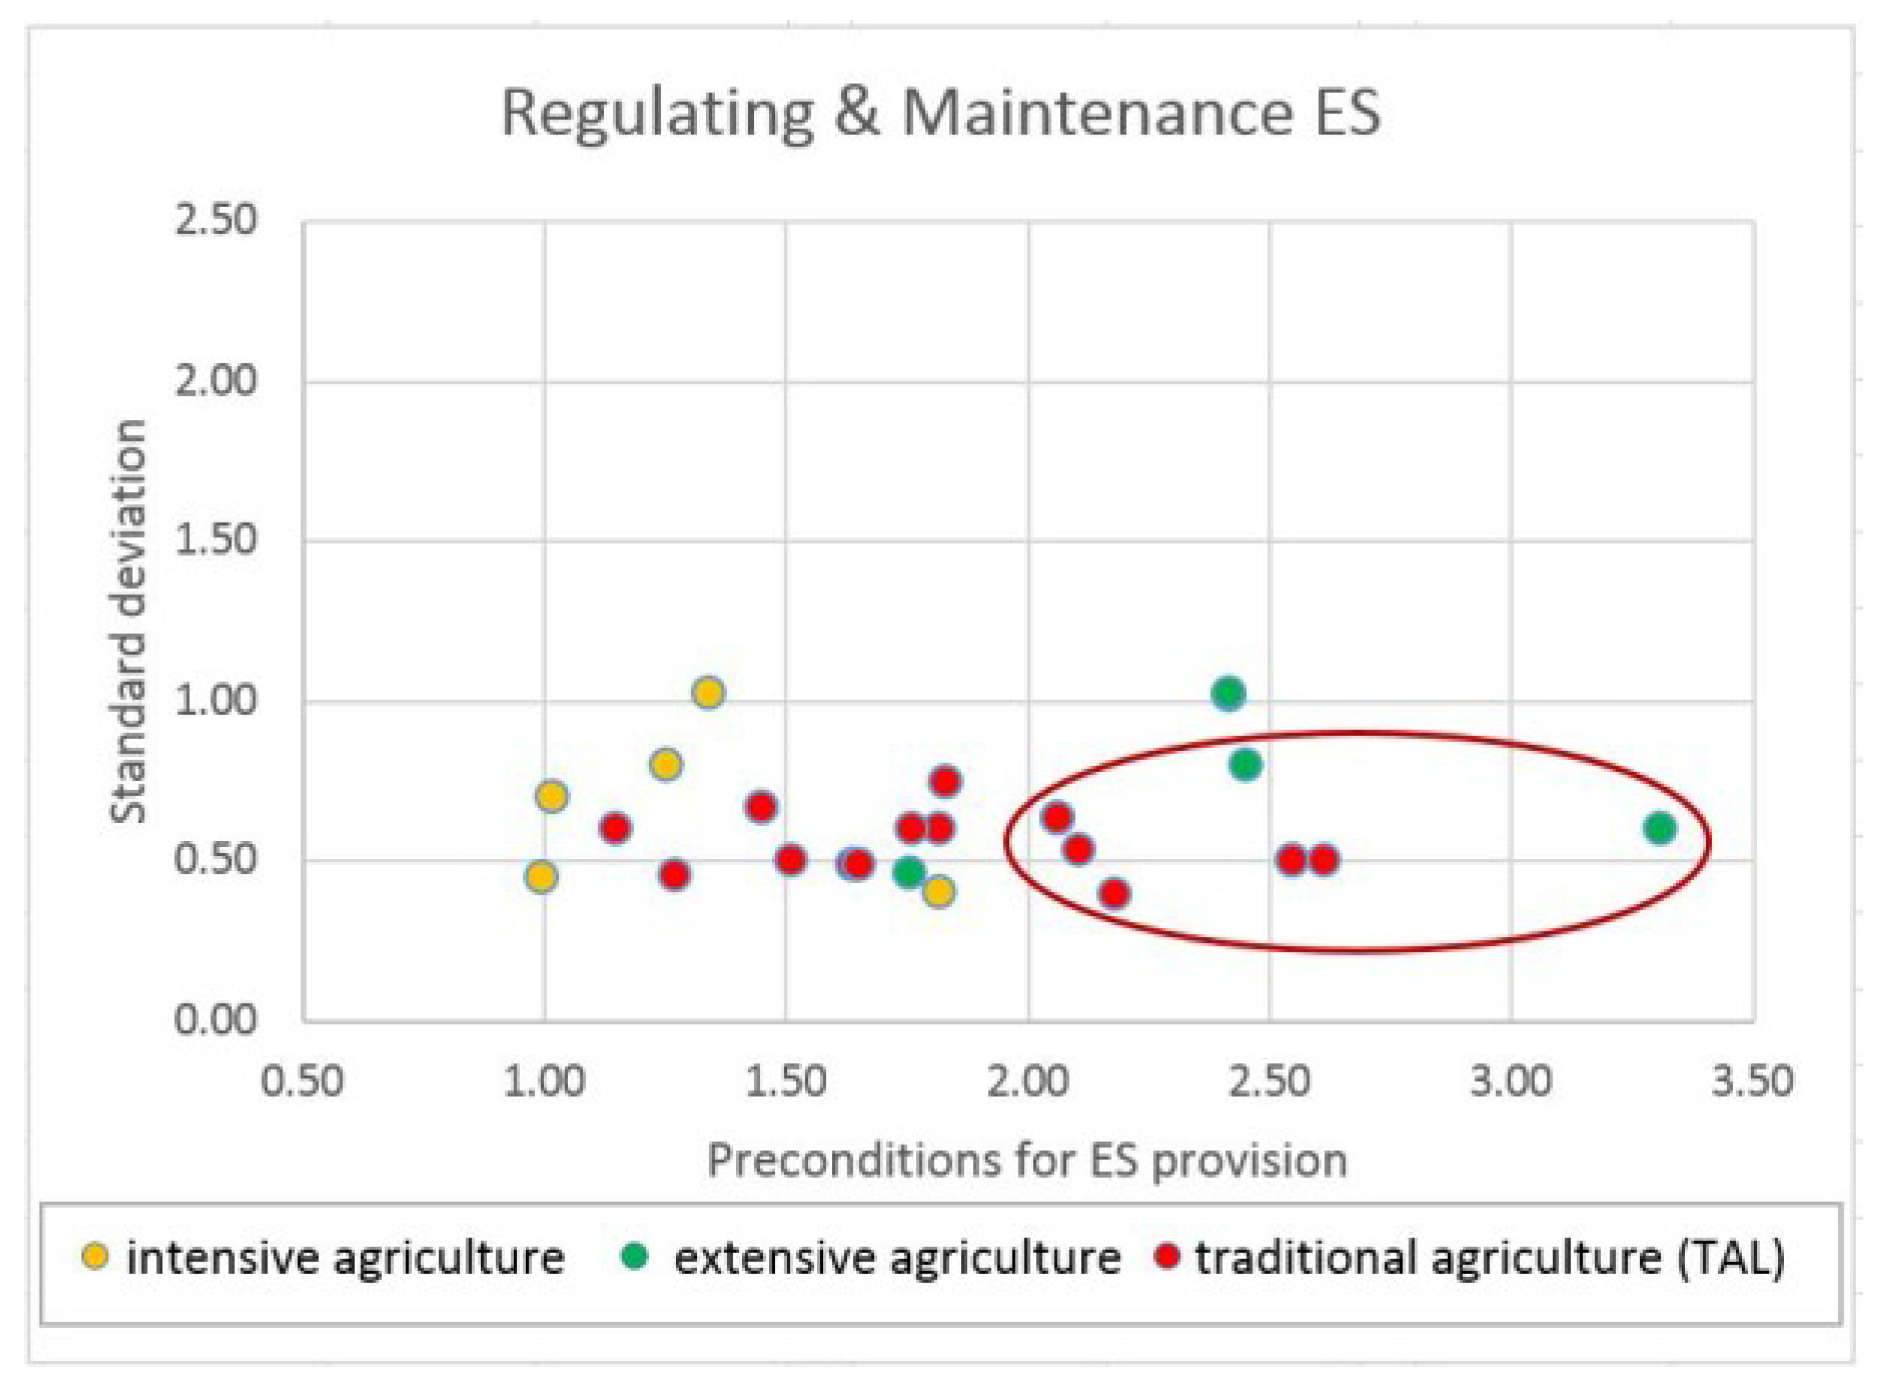
The overall significance and functional variability of individual land use classes according to their potential for ES provision were examined by considering the preconditions for ES provision in conjunction with the variability/volatility of land use classes, expressed as standard deviation of the obtained values. Table 10 shows the numerical results of the two main variables taken into consideration, for all agricultural land use classes occurring in the case-study areas. The agricultural land cover classes (28 classes) have been divided into 3 main groups—large-block intensively utilized agricultural areas (5), large-block extensively utilized agricultural areas (4), and TAL (19 classes). Figure 5, Figure 6 and Figure 7 show the comparison of these variables for the 3 main ES sections. The “significance” variable, ES_C, receives a value based on the expert assessment of the ES supply; this quantity ranges from 0.50 to 3.31. “Variability/volatility” is represented by the standard deviation, ST_DEV, and indicates the functional variability of the obtained values for individual ES capacities in a given group of ES—this ranges from 0.37 to 2.45.
For the provisioning ES, the supply and variability/volatility of land use classes varies significantly. The highest value and the highest dispersion of the values (standard deviation) of this parameter are shown by one group of intensively utilized agricultural CLC classes, while on the opposite end, one of the extensively utilized classes has the lowest value of both. Neither combination is favorable with respect to obtaining a decent spectrum of provisioning services at a given place. Thus, we would consider the most favorable CLC classes to be the “bunch” of TAL classes, which have average values of both significance and variability/volatility (marked with a red ellipse in Figure 5).
Regarding regulation & maintenance ES, the situation is not so obvious. Generally, there is a much higher variance in the preconditions of land use classes for ES provision, but a significantly lower spread in the variability values (standard deviation). Comparing groups of CLC classes, the overall highest preconditions with an appropriate variability/volatility is shown by the extensively utilized agricultural classes and, contrarily, the lowest values are shown by the intensively utilized classes. TAL structures do not form a compact group; however, a subset of them can be denoted as favorable, with a relatively high level of significance and low value of variability/volatility.
For the cultural ES section, the overall picture is similar to that of regulating ES—most of the CLC classes fit into a narrow range of variability/volatility, but the values of the ES supply vary massively and are scattered along most of the extent of the x-axis (Figure 7). Overall the suitability for cultural ES provision is lowest for the intensively utilized agricultural CLC classes and relatively similar for the two other classes, extensively utilized structures and TAL. Thus, favorable CLC classes with a relatively high level of significance and low value of variability/volatility could be found mainly within TAL.
By comparing the overall significance of the three basic agricultural land use types for the provision of the main ES sections, it is obvious that TAL show the most favorable combination of supply and dispersion of the values, not just overall but for all ES groups. This finding, therefore, supports our initial assumption, namely that TAL plays a vital role in the agricultural landscape in terms of providing ES in sufficient quantity and quality.
5. Discussion
The increasing interest in agro-environmental management requires the provision of tools to assess, monitor and map agro-environmental functions and ES in different regional contexts [76]. The study aims at assessing the importance of landscape diversity for maintaining human well-being, with emphasis on the role of traditional small-scale agricultural patterns (TAL). When analyzing the benefits for humans, an “ES approach” can be very effective [37,38,40]. In our research, we have tried to demonstrate the principal relationships between land use patterns, management intensity, and ecosystem functions and related services obtained from the agricultural landscape.
In the context of land use, several authors have underlined the importance of ecological quality and stability measures in the process of landscape planning, and their relationship with the provision of ES [77,78]. The role of landscape elements with high biodiversity and ecological stability in the preconditions of the landscape for ES provision has been confirmed by this study—despite the particular importance of forests and woodlands, the agricultural landscape also plays a vital role in ES provision. In this context, traditional farming is especially important for regulation, maintenance and cultural services [46,48,79]. TAL typically consists of mosaics of small plots of different types of agricultural landscape, supplemented by a range of vegetation elements, and these landscape features are the most important for ES provision, as demonstrated in presented research.
On the other hand, the intensification of agriculture has led to increasing agricultural production, but this poses serious threats to biodiversity and other ecosystem functions and services [52,79]. For example, the loss of biodiversity in agro-ecosystems through agricultural intensification and habitat loss negatively affects the maintenance of pollination systems, which is currently causing a loss of pollinators worldwide [80]. This research has also demonstrated the lower preconditions of intensively utilized agricultural landscape for ES provision other than provisioning services, which is in accordance with findings of other researchers [51,76]. Intensification of the agricultural landscape, and the associated decrease in TAL structures, is also reflected by the occurrence of ecological disturbances, increased water erosion, and air and water pollution.
The loss of traditional farming and its consequences for biodiversity and ES is generating concerns among both the scientific community and the public [81], so it is very important to look for solutions. In Slovakia after 1990, the landscape structure was partially diversified due to the return of land to the original owners. Such newly emerging agricultural mosaics generally consist of small parcels with a diverse representation of annual crops, permanent crops, and grasslands; but, compared to TAL, it has a lower share of semi-natural and natural vegetation. On the other hand, compared to large-scale arable land, it has a hydrologically more effective spatial structure, and its positive effect on water retention in the landscape has been documented [82,83].
The restoration of TAL is also beneficial for the promotion of the original, “closed” cycles of production and consumption, leading to almost waste-free management. Traditional management practices are generally friendlier to the soil and water resources. In the current context of global climate change and its consequences, TAL with typical agrarian landforms contributes to water retention in the landscape, which is important for the mitigation of desertification, and for protection against floods and soil erosion [46,84].
The two presented approaches to ES assessment highlight the benefits of TAL for society. Both methods required expert knowledge for ES valuation, but the first approach required more time and data, since it was based on field research and subsequent data processing. However, it has provided more specific data to understand the relationships between ecosystems, their spatial distribution and related functions. The matrix approach is well-documented and flexible and has a wide community of users around the world. In addition, the land cover data using adapted version of the 4th classification level has helped to determine the impact of management intensity on ES provision.
These results can contribute to highlighting the importance of the preservation and revitalization of ecosystems and their services at the local and national levels [2,49]. Such or similar approaches could be used for decision-making and implementation of policies in many areas relating to ecosystem management and decision making, such as nature and biodiversity protection, spatial planning, agriculture, forestry, water management, and development of rural tourism [14,33]. The spatial dimension of sustainability involves processes and relationships between different land uses, ecosystems and biotopes at different scales, and over time [85].
Additionally, the ES approach can potentially provide new arguments for green economy enhancement, rural development, and optimal agro-environmental policy promotion, and thus contribute to noticeable improvements to the protection of agro-biodiversity and the living conditions for the species and habitats in agricultural landscapes [46,50]. Finally, by highlighting the significance of TAL and their services to the stakeholder community (mainly by promotion of their cultural and historical values), it could also contribute to the multi-functionality of the landscape and development of tourism in these regions [1,48], which are often economically underdeveloped marginal areas.
6. Conclusions
The results of this study confirm that TAL provide a wide range of ES due to their diversified spatial and functional patterns, thus benefiting society and having irreplaceable provisional, ecological, cultural and historical value.
Regarding provisioning services, natural conditions predetermine the possibilities for agricultural production, which is reflected in the different types of TAL structures. Products from TAL regions are marketed with a quality label, e.g., wine from Svätý Jur, fruit brandies from Lednica, and dairy products from Liptovská Teplička. Although the production function is lower than in the case of intensified large fields, traditional farming produces healthy food and is generally friendlier to the soil, water and biodiversity.
The small-scale structure of TAL and its higher proportion of semi-natural habitats (grassland, orchards, small woodlands) usually provides more regulation and maintenance ES than intensified large-block fields or new mosaics of small agricultural plots. TAL play an important role in local climate regulation, water retention, and soil erosion prevention, which are very relevant to climate change. TAL structures also promote maintenance of the physical, chemical, and biological conditions. Some regulating ES (erosion control, water flow maintenance) could also be promoted by appropriate management practices in large-block agricultural landscape—e.g., application of ecological farming in Liptovská Teplička, changing large-block fields to grassland on the steep slopes in Lednica or Liptovská Teplička, and management of vineyards by terracing in Svätý Jur; but these are usually dependent on additional funding and technical measures.
A diversified and well-balanced structure of the landscape, managed in a traditional way, is also attractive from an aesthetic point of view and supports spiritual, symbolic and other interactions with the landscape as a “live museum”. The highest proportion of TAL and related cultural value was recorded in Hriňová village, but the historical and cultural heritage is the most visible in Liptovská Teplička. However, the TAL structures in Lednica and Svätý Jur also clearly contribute to the villages´ cultural-historical value.
The results of this study could contribute to a better understanding of the value of the natural and semi-natural TAL ecosystems in the landscape and their benefits to the quality of the environment and well-being of society. Appreciating such values should ultimately lead to improved biodiversity conservation of these important landscape structures. Dissemination of research results and further promotion of traditional farming and its benefits may contribute to the development of agro-tourism in less favored areas, as has happened in Liptovská Teplička and Hriňová. Environmentally friendly practices should also be applied to intensely utilized agricultural landscape in order to increase its potential to provide particular regulation ES.
Supplementary Materials
The following are available online at https://0-www-mdpi-com.brum.beds.ac.uk/2073-445X/7/2/74/s1, Supplement S1: Table of documented CLC classes within case study areas, Supplement S2: Land cover maps of case study areas, Supplement S3: Spreadsheet reclassification tables for 3 main sections of ES (S3a—Provisioning ES, S3b—Regulation & Maintenance ES, S3c—Cultural ES).
Author Contributions
The research was conceived, designed and implemented as a collaborative project between ILE SAS and CPU Nitra. All co-authors prepared and analyzed the data; J.Š., P.M. and F.P. wrote the paper.
Funding
This work was supported by the Scientific Grant Agency of Ministry of Education of the Slovak Republic [No. 2/0078/18 “Research of biocultural values of landscape”] and Cultural and Educational Grant Agency of the Ministry of Education, Science, Research and Sport of the Slovak Republic [KEGA No. 032UKF-4/2018 “Overview of Methods and Proposal for the Application of the Ecosystem Services Concept in the Environmental Studies Study Program”].
Acknowledgments
We would like to thank our colleagues Dagmar Štefunková, Veronika Piscová and Katarína Gerhátová who participated in land use mapping, and James Asher for English proof-reading.
Conflicts of Interest
The authors declare no conflict of interest.
References
- Peterson, J.M.; Boisvert, R.N.; de Gorter, H. Environmental policies for a multifunctional agricultural sector in open economies. Eur. Rev. Agric. Econ. 2002, 29, 423–443. [Google Scholar] [CrossRef] [Green Version]
- Van Zanten, B.T.; Verburg, P.H.; Espinosa, M.; Gomez-y-Paloma, S.; Galimberti, G.; Kantelhardt, J.; Kapfer, M.; Lefebvre, M.; Manrique, R.; Piorr, A.; et al. European agricultural landscapes, common agricultural policy and ecosystem services: A review. Agron. Sustain. Dev. 2014, 34, 309–325. [Google Scholar] [CrossRef]
- Demo, M.; Bielek, P.; Čanigová, M.; Ďuďák, J.; Fehér, A.; Hraška, Š.; Hričovský, I.; Hubinský, J.; Ižáková, V.; Látečka, M.; et al. The History of Agriculture in Slovakia (In Slovak); Vydavateľstvo SPU: Nitra, Slovakia, 2001; ISBN 80-7137-894-1. [Google Scholar]
- Kanianska, R.; Kizeková, M.; Nováček, J.; Zeman, M. Land-use and land-cover changes in rural areas during different political systems: A case study of Slovakia from 1782 to 2006. Land Use Policy 2014, 36, 554–566. [Google Scholar] [CrossRef]
- Bezák, P.; Mitchley, J. Drivers of change in mountain farming in Slovakia: From socialist collectivisation to the common agricultural policy. Reg. Environ. Chang. 2014, 14, 1343–1356. [Google Scholar] [CrossRef]
- Lieskovský, J.; Lieskovský, T.; Piscová, V. Physical accessibility and its role in landscape development three historical analyses from South Slovakia. Landsc. Res. 2017, 42, 498–507. [Google Scholar] [CrossRef]
- Baessler, C.; Klotz, S. Effects of changes in agricultural land-use on landscape structure and arable weed vegetation over the last 50 years. Agric. Ecosyst. Environ. 2006, 115, 43–50. [Google Scholar] [CrossRef]
- Blacksell, M. Agriculture and landscape in the 21st century Europe: The post-communist transition. Eur. Countrys. 2010, 2, 13–24. [Google Scholar] [CrossRef]
- Jepsen, M.R.; Kuemmerle, T.; Müller, D.; Erb, K.; Verburg, P.H.; Haberl, H.; Vesterager, J.P.; Andrič, M.; Antrop, M.; Austrheim, G.; et al. Transitions in European land-management regimes between 1800 and 2010. Land Use Policy 2015, 49, 53–64. [Google Scholar] [CrossRef] [Green Version]
- Harrop, S.R. Traditional agricultural landscapes as protected areas in international law and policy. Agric. Ecosyst. Environ. 2007, 121, 296–307. [Google Scholar] [CrossRef]
- Brown, J.; Kothari, A. Traditional agricultural landscapes and community conserved areas: An overview. Manag. Environ. Qual. 2011, 22, 139–153. [Google Scholar] [CrossRef]
- Dobrovodská, M. The development of relations between man and landscape in a historical mountain agricultural landscape of Slovakia. Ekologia 2006, 25, 38–48. [Google Scholar]
- Štefunková, D.; Dobrovodská, M. Preserved European cultural heritage in agrarian landscape of Slovakia. Tájökol. Lapok 2009, 7, 283–290. [Google Scholar]
- Antrop, M. The concept of traditional landscapes as a base for landscape evaluation and planning. The example of Flanders Region. Landsc. Urban Plan. 1997, 38, 105–117. [Google Scholar] [CrossRef]
- Vos, W.; Meekes, H. Trends in European cultural landscape development: Perspectives for a sustainable future. Landsc. Urban Plan. 1999, 46, 3–14. [Google Scholar] [CrossRef]
- Barančok, P.; Barančoková, M. Historical changes in dispersed kopanitse land type and changes in use of agricultural land on Kysuce region example. Ekológia 2016, 35, 371–391. [Google Scholar] [CrossRef]
- Donald, P.F.; Green, R.E.; Heath, M.F. Agricultural intensification and the collapse of Europe’s farmland bird populations. Proc. R. Soc. Lond. B 2001, 268, 25–29. [Google Scholar] [CrossRef] [PubMed]
- Lieskovský, J.; Kanka, R.; Bezák, P.; Štefunková, D.; Petrovič, F.; Dobrovodská, M. Driving forces behind vineyard abandonment in Slovakia following the move to a market-oriented economy. Land Use Policy 2013, 32, 356–365. [Google Scholar] [CrossRef]
- Maes, J.; Paracchini, M.L.; Zulian, G. A European Assessment of the Provision of Ecosystem Services: Towards an Atlas of Ecosystem Services; Publications Office of the European Union: Luxembourg, 2011; ISBN 978-92-79-19663-8. [Google Scholar]
- Agnoletti, M. Rural landscape, nature conservation and culture: Some notes on research trends and management approaches from a (southern) European perspective. Landsc. Urban Plan. 2014, 126, 66–73. [Google Scholar] [CrossRef]
- Opršal, Z.; Kladivo, P.; Machar, I. The role of selected biophysical factors in long-term land-use change of cultural landscape. Appl. Ecol. Environ. Res. 2016, 14, 23–40. [Google Scholar] [CrossRef]
- Agnoletti, M.; Tredici, M.; Santoro, A. Biocultural diversity and landscape patterns in three historical rural areas of Morocco, Cuba and Italy. Biodivers. Conserv. 2015, 24, 3387–3404. [Google Scholar] [CrossRef] [Green Version]
- Baiamonte, G.; Domina, G.; Raimondo, F.M.; Bazan, G. Agricultural landscapes and biodiversity conservation: A case study in Sicily (Italy). Biodivers. Conserv. 2015, 24, 3201–3216. [Google Scholar] [CrossRef]
- Havlíček, M.; Krejčiková, B.; Chrudina, Z.; Svoboda, J. Long-Term Land Use Development and Changes in Streams of the Kyjovka, Svratka and Velicka River Basins (Czech Republic). Morav. Geogr. Rep. 2012, 20, 28–42. [Google Scholar]
- Kuemmerle, T.; Müller, D.; Griffiths, P.; Rusu, M. Land use change in Southern Romania after the collapse of socialism. Reg. Environ. Chang. 2009, 9, 1–12. [Google Scholar] [CrossRef]
- Cushman, S.A.; McGarigal, K. Landscape-Level Patterns of Avian Diversity in the Oregon Coast Range. Ecol. Monogr. 2003, 73, 259–281. [Google Scholar] [CrossRef]
- DiBari, J.N. Evaluation of five landscape-level metrics for measuring the effects of urbanization on landscape structure: The case of Tucson, Arizona, USA. Landsc. Urban Plan. 2007, 79, 308–313. [Google Scholar] [CrossRef]
- Dramstad, W.E.; Fry, G.; Fjellstad, W.J.; Skar, B.; Helliksen, W.; Sollund, M.L.; Tveit, M.S.; Geelmuyden, A.K.; Framstad, E. Integrating landscape-based values—Norwegian monitoring of agricultural landscapes. Landsc. Urban Plan. 2001, 57, 257–268. [Google Scholar] [CrossRef]
- Landis, D.A. Designing agricultural landscapes for biodiversity-based ecosystem services. Basic Appl. Ecol. 2017, 18, 1–12. [Google Scholar] [CrossRef]
- Wu, J.; Jelinski, D.E.; Luck, M.; Tueller, P.T. Multiscale Analysis of Landscape Heterogeneity: Scale Variance and Pattern Metrics. Geogr. Inf. Sci. 2000, 6, 6–19. [Google Scholar] [CrossRef] [PubMed] [Green Version]
- Munteanu, C.; Kuemmerle, T.; Boltižiar, M.; Butsic, V.; Gimmi, U.; Halada, L.; Kaim, D.; Király, G.; Konkoly-Gyuró, É.; Kozak, J.; et al. Forest and agricultural land change in the Carpathian region—A meta-analysis of long-term patterns and drivers of change. Land Use Policy 2014, 38, 685–697. [Google Scholar] [CrossRef]
- Skokanová, H.; Havlíček, M.; Borovec, R.; Demek, J.; Eremiášová, R.; Chrudina, Z.; Mackovčin, P.; Rysková, R.; Slavík, P.; Stránská, T.; et al. Development of land use and main land use change processes in the period 1836–2006: Case study in the Czech Republic. J. Maps 2012, 8, 88–96. [Google Scholar] [CrossRef]
- Solár, J.; Janiga, M.; Markuljaková, K. The Socioeconomic and Environmental Effects of Sustainable Development in the Eastern Carpathians, and Protecting its Environment. Pol. J. Environ. Stud. 2016, 25, 291–300. [Google Scholar] [CrossRef] [Green Version]
- Tarasovičová, Z.; Saksa, M.; Blažík, T.; Falťan, V. Changes in Agricultural Land Use in the Context of Ongoing Transformational Processes in Slovakia. Agriculture 2013, 59, 49–64. [Google Scholar] [CrossRef]
- Hreško, J.; Petrovič, F.; Mišovičová, R. Mountain landscape archetypes of the Western Carpathians (Slovakia). Biodivers. Conserv. 2015, 24, 3269–3283. [Google Scholar] [CrossRef]
- Václavík, T.; Lautenbach, S.; Kuemmerle, T.; Seppelt, R. Mapping global land system archetypes. Glob. Environ. Chang. 2013, 23, 1637–1647. [Google Scholar] [CrossRef]
- De Groot, R.S.; Alkemade, R.; Braat, L.; Hein, L.; Willemen, L. Challenges in integrating the concept of ecosystem services and values in landscape planning, management and decision making. Ecol. Complex. 2010, 7, 260–272. [Google Scholar] [CrossRef]
- Maes, J.; Hauck, J.; Paracchini, M.L.; Ratamäki, O.; Hutchins, M.; Termansen, M.; Furman, E.; Pérez-Soba, M.; Braat, L.; Bidoglio, G. Mainstreaming ecosystem services into EU policy. Curr. Opin. Environ. Sustain. 2013, 5, 128–134. [Google Scholar] [CrossRef]
- MEA. Millenium Ecosystem Assessment. Ecosystems and Human Well-Being: Synthesis; Island Press: Washington, DC, USA, 2005; ISBN 1-59726-040-1. [Google Scholar]
- Schröter, M.; Barton, D.N.; Remme, R.P.; Hein, L. Accounting for capacity and flow of ecosystem services: A conceptual model and a case study for Telemark, Norway. Ecol. Indic. 2014, 36, 539–551. [Google Scholar] [CrossRef]
- Tscharntke, T.; Klein, A.M.; Kruess, A.; Steffan-Dewenter, I.; Thies, C. Landscape perspectives on agricultural intensification and biodiversity-ecosystem service management. Ecol. Lett. 2005, 8, 857–874. [Google Scholar] [CrossRef]
- Estoque, R.C.; Murayama, Y. Examining the potential impact of land use/cover changes on the ecosystem services of Baguio city, the Philippines: A scenario-based analysis. Appl. Geogr. 2012, 35, 316–326. [Google Scholar] [CrossRef]
- Turner, M.G.; Donato, D.C.; Romme, W.H. Consequences of spatial heterogeneity for ecosystem services in changing forest landscapes: Priorities for future research. Landsc. Ecol. 2013, 28, 1081–1097. [Google Scholar] [CrossRef]
- Stratford, C.J.; Acreman, M.C.; Rees, H.G. A simple method for assessing the vulnerability of wetland ecosystem services. Hydrol. Sci. J. 2011, 56, 1485–1500. [Google Scholar] [CrossRef] [Green Version]
- Frelichova, J.; Vackar, D.; Partl, A.; Louckova, B.; Harmackova, Z.V.; Lorencova, E. Integrated assessment of ecosystem services in the Czech Republic. Ecosyst. Serv. 2014, 8, 110–117. [Google Scholar] [CrossRef]
- Barral, M.P.; Rey Benayas, J.M.; Meli, P.; Maceira, N.O. Quantifying the impacts of ecological restoration on biodiversity and ecosystem services in agroecosystems: A global meta-analysis. Agric. Ecosyst. Environ. 2015, 202, 223–231. [Google Scholar] [CrossRef] [Green Version]
- Fagerholm, N.; Käyhkö, N.; Ndumbaro, F.; Khamis, M. Community stakeholders’ knowledge in landscape assessments—Mapping indicators for landscape services. Ecol. Indic. 2012, 18, 421–433. [Google Scholar] [CrossRef]
- Huang, J.; Tichit, M.; Poulot, M.; Darly, S.; Li, S.; Petit, C.; Aubry, C. Comparative review of multifunctionality and ecosystem services in sustainable agriculture. J. Environ. Manag. 2015, 149, 138–147. [Google Scholar] [CrossRef] [PubMed]
- Lerouge, F.; Sannen, K.; Gulinck, H.; Vranken, L. Revisiting production and ecosystem services on the farm scale for evaluating land use alternatives. Environ. Sci. Policy 2016, 57, 50–59. [Google Scholar] [CrossRef] [Green Version]
- Wood, S.A.; Karp, D.S.; DeClerck, F.; Kremen, C.; Naeem, S.; Palm, C.A. Functional traits in agriculture: Agrobiodiversity and ecosystem services. Trends Ecol. Evol. 2015, 30, 531–539. [Google Scholar] [CrossRef] [PubMed]
- Blumstein, M.; Thompson, J.R. Land-use impacts on the quantity and configuration of ecosystem service provisioning in Massachusetts, USA. J. Appl. Ecol. 2015, 52, 1009–1019. [Google Scholar] [CrossRef] [Green Version]
- Dupras, J.; Parcerisas, L.; Brenner, J. Using ecosystem services valuation to measure the economic impacts of land-use changes on the Spanish Mediterranean coast (El Maresme, 1850–2010). Reg. Environ. Chang. 2016, 16, 1075–1088. [Google Scholar] [CrossRef]
- Kandziora, M.; Dörnhöfer, K.; Oppelt, N.; Müller, F. Detecting Land Use And Land Cover Changes In Northern German Agricultural Landscapes To Assess Ecosystem Service Dynamics. Landsc. Online 2014, 35, 1–24. [Google Scholar] [CrossRef]
- Lausch, A.; Blaschke, T.; Haase, D.; Herzog, F.; Syrbe, R.U.; Tischendorf, L.; Walz, U. Understanding and quantifying landscape structure—A review on relevant process characteristics, data models and landscape metrics. Ecol. Model. 2015, 295, 31–41. [Google Scholar] [CrossRef]
- Van der Biest, K.; Vrebos, D.; Staes, J.; Boerema, A.; Bodí, M.B.; Fransen, E.; Meire, P. Evaluation of the accuracy of land-use based ecosystem service assessments for different thematic resolutions. J. Environ. Manag. 2015, 156, 41–51. [Google Scholar] [CrossRef] [PubMed]
- Vigl, L.E.; Schirpke, U.; Tasser, E.; Tappeiner, U. Linking long-term landscape dynamics to the multiple interactions among ecosystem services in the European Alps. Landsc. Ecol. 2016, 31, 1903–1918. [Google Scholar] [CrossRef] [Green Version]
- Špulerová, J.; Dobrovodska, M.; Lieskovský, J.; Bača, A.; Halabuk, A.; Kohút, F.; Mojses, M.; Kenderessy, P.; Piscová, V.; Barančok, P. Inventory and classification of historical structures of the agricultural landscape in Slovakia. Ekológia 2011, 30, 157–170. [Google Scholar] [CrossRef]
- Štefunková, D.; Hanušin, J. Analysis of the Spatial and Temporal Distribution of Selected Landscape Diversity Indexes in Detailed Scale (example of Viticultural Landscape Svaty Jur). In Proceedings of the 17th International Symposium on Landscape Ecology—Landscape and Landscape Ecology, Nitra, Slovakia, 27–29 May 2015; pp. 185–191. [Google Scholar]
- Špulerová, J.; Piscová, V.; Gerhátová, K.; Bača, A.; Kalivoda, H.; Kanka, R. Orchards as traces of traditional agricultural landscape in Slovakia. Agric. Ecosyst. Environ. 2015, 199, 67–76. [Google Scholar] [CrossRef]
- Mojses, M.; Petrovič, F. Land use changes of historical structures in the agricultural landscape at the local level—Hriňová case study. Ekologia 2013, 32, 1–12. [Google Scholar] [CrossRef]
- Dobrovodská, M. Landscape Ecological Research of Traditional Agricultural Landscape of Liptovská Teplička, Osturňa and Malá Franková; Veda, Publishing House SAV: Bratislava, Slovakia, 2014; p. 149. ISBN 978-80-224-1339-8. [Google Scholar]
- Fahrig, L.; Baudry, J.; Brotons, L.; Burel, F.G.; Crist, T.O.; Fuller, R.J.; Sirami, C.; Siriwardena, G.M.; Martin, J.L. Functional landscape heterogeneity and animal biodiversity in agricultural landscapes. Ecol. Lett. 2011, 14, 101–112. [Google Scholar] [CrossRef] [PubMed]
- Potschin, M.; Haines-Young, R. Landscapes, sustainability and the place-based analysis of ecosystem services. Landsc. Ecol. 2013, 28, 1053–1065. [Google Scholar] [CrossRef]
- Burkhard, B.; Kandziora, M.; Hou, Y.; Müller, F. Ecosystem Service Potentials, Flows and Demands—Concepts for Spatial Localisation, Indication and Quantification. Landsc. Online 2014, 1–32. [Google Scholar] [CrossRef]
- Burkhard, B.; Maes, J. Mapping Ecosystem Services. Adv. Books 2017, 1, e12837. [Google Scholar] [CrossRef]
- Orthophotomaps © Geodis Slovakia, s.r.o; Geodis Slovakia Ltd.: Banská Bystrica, Slovakia, 2014.
- Aerial Photograph and Digital Orthophotomaps © Eurosense s.r.o; Eurosense: Bratislava, Slovakia, 2014.
- Feranec, J.; Soukup, T.; Hazeu, G.; Jaffrain, G. European Landscape Dynamics: CORINE Land Cover Data; CRC Press, Taylor & Francis Group: Boca Raton, FL, USA, 2016; ISBN 978-148-224-663. [Google Scholar]
- Izakovičová, Z.; Špulerová, J.; Bezák, P.; Mederly, P. Implementation of the Ecosystem Services Concept in Planning and Management Practice in the Slovak Republic—Results of the Open-NESS Project in Trnava Case Study (In Slovak). Životné Prostredie 2017, 51, 198–204. [Google Scholar]
- Bezák, P.; Bezáková, M. Landscape Capacity for Ecosystem Services Provision Based on Expert Knowledge and Public Perception (case Study from the North West Slovakia). Ekologia 2014, 33, 344–353. [Google Scholar] [CrossRef]
- ÚKSUP. Register of Orchards. Available online: http://www.uksup.sk/ooip-datasety/ (accessed on 27 March 2018).
- STATdat. Available online: http://statdat.statistics.sk/ (accessed on 27 March 2018).
- Lee, J.H. An overview of phytoremediation as a potentially promising technology for environmental pollution control. Biotechnol. Bioprocess Eng. 2013, 18, 431–439. [Google Scholar] [CrossRef]
- Ďugová, O.; Šimonovičová, A.; Jandák, J. Soil microbiocoenosis of blown sand of the Borska nizina lowland. Ekologia 2007, 26, 143–150. [Google Scholar]
- Raatikainen, K.J.; Barron, E.S. Current agri-environmental policies dismiss varied perceptions and discourses on management of traditional rural biotopes. Land Use Policy 2017, 69, 564–576. [Google Scholar] [CrossRef]
- Marraccini, E.; Lardon, S.; Loudiyi, S.; Giacche, G.; Bonari, E. Sustainability of agriculture in Mediterranean periurban areas: Issues and agriurban projects in the Pisan region (Tuscany, Italy). Cah. Agric. 2013, 22, 517–525. [Google Scholar] [CrossRef]
- Sarvašová, Z.; Kovalčík, M.; Dobšinská, Z.; Šálka, J.; Jarský, V. Ecosystem Services—Examples of Their Valuation Methods in Czech Republic and Slovakia. Chang. Adapt. Socio-Ecol. Syst. 2014, 1, 74–83. [Google Scholar] [CrossRef]
- Brown, M.J.F.; Dicks, L.V.; Paxton, R.J.; Baldock, K.C.R.; Barron, A.B.; Chauzat, M.P.; Freitas, B.M.; Goulson, D.; Jepsen, S.; Kremen, C.; et al. A horizon scan of future threats and opportunities for pollinators and pollination. PeerJ 2016, 4, e2249. [Google Scholar] [CrossRef] [PubMed]
- Ružičková, H.; Halada, Ľ.; David, S.; Gerhátová, K. Management of meadows in the biosphere reserve east carpathians. I. Methodology and first results. Ekologia 1998, 17, 255–264. [Google Scholar]
- Ricketts, T.H.; Regetz, J.; Steffan-Dewenter, I.; Cunningham, S.A.; Kremen, C.; Bogdanski, A.; Gemmill-Herren, B.; Greenleaf, S.S.; Klein, A.M.; Mayfield, M.M.; et al. Landscape effects on crop pollination services: Are there general patterns? Ecol. Lett. 2008, 11, 499–515. [Google Scholar] [CrossRef] [PubMed]
- Navarro, L.M.; Pereira, H.M. Rewilding Abandoned Landscapes in Europe. Ecosystems 2012, 15, 900–912. [Google Scholar] [CrossRef] [Green Version]
- Lepeška, T. Hydric potential of selected river basins in Slovakia. Ecohydrol. Hydrobiol. 2013, 13, 201–209. [Google Scholar] [CrossRef]
- Šebo, D.; Huba, M. Three aspects of rural landscape quality to be achieved: The analysis and proposal of changes in the Stredné Považie region (In Slovak). Geografický Časopis 2015, 67, 199–218. [Google Scholar]
- Duru, M.; Therond, O. Livestock system sustainability and resilience in intensive production zones: Which form of ecological modernization? Reg. Environ. Chang. 2015, 15, 1651–1665. [Google Scholar] [CrossRef]
- Botequilha Leitão, A.; Ahern, J. Applying landscape ecological concepts and metrics in sustainable landscape planning. Landsc. Urban Plan. 2002, 59, 65–93. [Google Scholar] [CrossRef]
Figure 1.
The location of the case study areas in Slovakia.

Figure 2.
Preconditions of the case-study areas for provisioning ecosystem services.

Figure 3.
Preconditions of the case-study areas for regulation & maintenance services.

Figure 4.
Preconditions of the case-study areas for cultural ecosystem services.

Figure 5.
Assessment of significance and functional variability of land use classes for provisioning ecosystem services.
Figure 5.
Assessment of significance and functional variability of land use classes for provisioning ecosystem services.

Figure 6.
Assessment of significance and functional variability of land use classes for regulation and maintenance ecosystem services.
Figure 6.
Assessment of significance and functional variability of land use classes for regulation and maintenance ecosystem services.

Figure 7.
Assessment of significance and functional variability of land use classes for provisioning ecosystem services.
Figure 7.
Assessment of significance and functional variability of land use classes for provisioning ecosystem services.


Table 1.
The share of land use classes in the case-study areas.
| Land Use Basic Classes | Svätý Jur | Lednica | Hriňová | Liptovská Teplička |
|---|---|---|---|---|
| Agricultural landscape—ha (%) | 1008.5 (25.3%) | 851.3 (37.6%) | 2975.5 (23.5%) | 1327.5 (13.5%) |
| Traditional agricultural landscape—ha (% of agriculture land) | 117.3 (11.6%) | 152.5 (17.9%) | 1302.3 (43.8%) | 259.5 (19.5%) |
| Forests, woods—ha (%) | 2527.0 (63.4%) | 1334.2 (58.9%) | 9141.9 (72.3%) | 8408.2 (85.4%) |
| Build-up area—ha (%) | 299.1 (7.5%) | 79.8 (3.5%) | 467.4 (3.7%) | 110.2 (1.1%) |
| Other (water & wetlands)—ha (%) | 150.6 (3.8%) | 0 (0.0%) | 59.1 (0.5%) | 0.1 (0.0%) |
| Cadastre area—total ha | 3985.2 | 2265.3 | 12,643.9 | 9846.0 |
Table 2.
Selected ecosystem services for matrix-based approach.
| ES Section | ES Division (Sub-Section) | Ecosystem Service |
|---|---|---|
| Provisioning ES | Nutrition—biomass 60% 1 | P1—Cultivated crops and products (40%) |
| P2—Fodder (20%) | ||
| P3—Reared animals and products (20%) | ||
| P4—Fishes (5%) | ||
| P5—Wild plants (5%) | ||
| P6—Water for drinking (10%) | ||
| Material—biomass 40% | P7—Biomass for energy—agriculture (30%) | |
| P8—Fiber (10%) | ||
| P9—Timber (40%) | ||
| P10—Firewood—forestry (20%) | ||
| Regulation & Maintenance ES | Mediation of waste, toxins and other nuisances 35% | R1—Air quality regulation (40%) |
| R2—Water purification (35%) | ||
| R3—Bio-remediation and filtration (25%) | ||
| Mediation of flows 25% | R4—Water flow regulation (50%) | |
| R5—Erosion control (50%) | ||
| Maintenance of physical, chemical, biological conditions 40% | R6—Global climate regulation (10%) | |
| R7—Local climate regulation (30%) | ||
| R8—Decomposition, nutrients cycle regulation (15%) | ||
| R9—Pollination (30%) | ||
| R10—Pest control (15%) | ||
| Cultural ES | Physical and intellectual interactions with biota, ecosystems, and landscapes 60% | C1—Recreation and leisure (50%) |
| C2—Landscape aesthetics, inspiration (10%) | ||
| C3—Cultural heritage and diversity (20%) | ||
| C4—Natural heritage and diversity (20%) | ||
| Spiritual, symbolic and other interactions with biota, ecosystems, and landscapes 40% | C5—Knowledge and educational values (40%) | |
| C6—Religious and spiritual values (60%) |
1 % values represent a relative importance (weights) of ES within respective group (sub-section or section).
| Main Cultivated Crops | Svätý Jur | Lednica | Hriňová | Liptovská Teplička |
|---|---|---|---|---|
| Cereals | 6.42 | 5.55 | 3.07 | 4.08 |
| Oil crops | 3.3 | 3.14 | 3.32 | 2.53 |
| Potatoes | 21 | 8.72 | 7.22 | 21.7 |
| Forage | 6.99 | 4.87 | 6.06 | 5.52 |
| Density of fruit trees per hectare | 610 | 636 | 33 | 42 |
| Reared animals (per 100 ha of agricultural landscape) | ||||
| Cattle | 13.9 | 25.4 | 27.8 | 37.8 |
| Cow | 7 | 12.5 | 13.9 | 16.4 |
| Sheep | 1.3 | 78.1 | 68.8 | 8.7 |
| Pigs | 217.1 | 18.5 | 39.5 | 10.2 |
| Poultry | 5397.5 | 19188.2 | 329 | 302.1 |
| Hen | 4898.3 | 5132.4 | 283.5 | 215 |
Table 4.
Expert assessment of provisioning ecosystem services for different types of agricultural landscapes (TAL—traditional agricultural landscapes, NM—new mosaic, IP—intensively utilized large-block agricultural landscape, EP—extensively utilized large-block agricultural landscape).
Table 4.
Expert assessment of provisioning ecosystem services for different types of agricultural landscapes (TAL—traditional agricultural landscapes, NM—new mosaic, IP—intensively utilized large-block agricultural landscape, EP—extensively utilized large-block agricultural landscape).
| Section | Ecosystem Service | Svätý Jur | Lednica | Hriňová | Liptovská Teplička | |||||
|---|---|---|---|---|---|---|---|---|---|---|
| TAL | NM | IP | TAL | IP | TAL | IP | TAL | EP | ||
| Provisioning ES | Cultivated crops and products | 1 1 | 2 | 2 | 1 | 2 | 1 | 1.5 | 1 | 1.75 |
| Reared animals and their products | −0.5 | 0 | 0.25 | 1 | 2 | 1.75 | 2 | 1 | 2 | |
| Wild plants and their fruits | 1.5 | 1 | −1.25 | 2 | −1 | 2 | −1.25 | 2 | −0.5 | |
| Fodder | 0.5 | 0.5 | 1.5 | 0.75 | 1.5 | 1.25 | 1.75 | 1.25 | 1 | |
| Genetic materials from all biota | 1 | 0 | −0.25 | 2 | −0.25 | 1 | −0.25 | 1 | 0 | |
| Wild plants for pharmaceutical processes (herbs) | 1 | 0.5 | 0 | 2 | 0 | 2 | 0 | 2 | 0.5 | |
1 ES effectiveness value: 2—very positive effect, 1—positive, 0—neutral, −1—negative, −2—very negative effect or none.
Table 5.
Expert assessment of regulation & maintenance ecosystem services for different types of agricultural landscapes (TAL—traditional agricultural landscapes, NM—new mosaic, IP—intensively utilized large-block agricultural landscape, EP—extensively utilized large-block agricultural landscape).
Table 5.
Expert assessment of regulation & maintenance ecosystem services for different types of agricultural landscapes (TAL—traditional agricultural landscapes, NM—new mosaic, IP—intensively utilized large-block agricultural landscape, EP—extensively utilized large-block agricultural landscape).
| Section | Ecosystem service | Svätý Jur | Lednica | Hriňová | Liptovská Teplička | |||||
|---|---|---|---|---|---|---|---|---|---|---|
| TAL | NM | IP | TAL | IP | TAL | IP | TAL | EP | ||
| Regulation & Maintenance ES | Bio-remediation by micro-organisms, algae, plants, and animals | 2 1 | 1 | −1 | 2 | −1 | 2 | 0.5 | 2 | 1 |
| Air quality regulation | 1 | 0.5 | −1 | 2 | −0.75 | 1 | −1 | 1 | 0 | |
| Mediation of smell/noise/visual impacts | 1 | 0.5 | −0.25 | 1.75 | −0.75 | 1 | −0.25 | 0 | −0.25 | |
| Erosion control | 2 | 0.75 | 0.25 | 2 | −0.75 | 2 | 0 | 2 | 1 | |
| Water and mass flow regulation | 1.5 | 1 | −1 | 2 | −1 | 1 | −1 | 2 | −0.25 | |
| Pollination and seed dispersal | 1.5 | 0.5 | −1 | 2 | 1 | 1 | 0 | 2 | 1 | |
| Maintaining nursery populations and habitats | 2 | 0 | −1.5 | 2 | −1 | 2 | −1 | 2 | 1 | |
| Pest and disease control | 1.25 | 1 | −1 | 1.25 | −0.5 | 1.25 | −0.5 | 1.25 | 0 | |
| Decomposition, nutrient cycle regulation | 1 | 0 | −1 | 1 | −1 | 1 | 0.5 | 1.5 | 0.5 | |
| Micro- and regional climate regulation | 2 | 1 | −0.5 | 2 | 0 | 2 | −1 | 1.5 | 0 | |
1 ES effectiveness value: 2—very positive effect, 1—positive, 0—neutral, −1—negative, −2—very negative effect or none.
Table 6.
Expert assessment of cultural ecosystem services for different types of agricultural landscapes (TAL—traditional agricultural landscapes, NM—new mosaic, IP—intensively utilized large-block agricultural landscape, EP—extensively utilized large-block agricultural landscape).
Table 6.
Expert assessment of cultural ecosystem services for different types of agricultural landscapes (TAL—traditional agricultural landscapes, NM—new mosaic, IP—intensively utilized large-block agricultural landscape, EP—extensively utilized large-block agricultural landscape).
| Section | Ecosystem Service | Svätý Jur | Lednica | Hriňová | Liptovská Teplička | |||||
|---|---|---|---|---|---|---|---|---|---|---|
| TAL | NM | IP | TAL | IP | TAL | IP | TAL | EP | ||
| Cultural ES | Recreation—physical and experiential interactions of nature | 1 1 | 1 | −0.75 | 1.25 | −0.5 | 1 | −0.75 | 2 | 0.5 |
| Recreation—agro tourism | 0.5 | 0 | 0 | 1.00 | 0 | 2 | 0 | 2 | 1.75 | |
| Cultural heritage and diversity | 2 | 1 | −0.25 | 2 | −0.25 | 2 | −0.25 | 2 | 0.25 | |
| Landscape aesthetics and inspiration | 2 | 1 | 0 | 2 | −0.75 | 2 | −0.75 | 2 | −0.25 | |
| Religious and spiritual values | 2 | 1 | −0.75 | 2 | −0.5 | 2 | −0.75 | 2 | 0 | |
1 ES effectiveness value: 2—very positive effect, 1—positive, 0—neutral, −1—negative, −2—very negative effect or none.
Table 7.
Agricultural landscape preconditions for provisioning ecosystem services in the case-study areas.
Table 7.
Agricultural landscape preconditions for provisioning ecosystem services in the case-study areas.
| Groups of Services | Ecosystem Services | Svätý Jur | Lednica | Hriňová | Liptovská Teplička |
|---|---|---|---|---|---|
| Nutrition | Biomass for food production | 4.20 1 | 0.73 | 1.53 | 1.59 |
| Fodder | 3.51 | 4.34 | 4.48 | 4.56 | |
| Domestic animals | 0.42 | 4.04 | 3.62 | 3.36 | |
| Fish | 0.00 | 0.00 | 0.00 | 0.00 | |
| Forest and wild fruits | 0.17 | 1.71 | 1.18 | 1.23 | |
| Water for drinking purposes | 0.00 | 0.00 | 0.00 | 0.00 | |
| Potential for nutrition provision—overall, weighted average | 2.47 | 2.05 | 2.29 | 2.28 | |
| Materials | Biomass for energy | 3.55 | 2.02 | 1.97 | 1.99 |
| Fiber | 0.03 | 0.60 | 1.13 | 1.79 | |
| Wood | 0.01 | 0.12 | 0.00 | 0.02 | |
| Firewood | 0.31 | 0.22 | 0.00 | 0.03 | |
| Potential for material provision—overall, weighted average | 1.13 | 0.76 | 0.70 | 0.79 | |
| Overall potential for provisioning ES | Cadastral area | 1.49 | 1.52 | 1.50 | 1.61 |
| Agricultural landscape (in total) | 1.93 | 1.53 | 1.66 | 1.68 | |
| Large-block agricultural landscape | 2.05 | 1.48 | 1.56 | 1.67 | |
| TAL (traditional agricultural landscape) | 1.07 | 1.79 | 1.81 | 1.71 |
1 Potential was expressed in scale of 0 to 5, where 0 means no relevant potential and 5 means a very high relevant potential for ES delivery (as per to Burkhard et al. 2014).
Table 8.
Agricultural landscape preconditions for regulation and maintenance ecosystem services in study areas.
Table 8.
Agricultural landscape preconditions for regulation and maintenance ecosystem services in study areas.
| Groups of Services | Ecosystem Services | Svätý Jur | Lednica | Hriňová | Liptovská Teplička |
|---|---|---|---|---|---|
| Mediation of waste, toxins and other pollutants | Air quality regulation | 0.94 1 | 0.47 | 0.41 | 0.43 |
| Water quality regulation | 0.28 | 1.14 | 1.00 | 0.83 | |
| Waste regulation | 1.96 | 3.53 | 3.00 | 2.61 | |
| Potential for mediation of toxins—overall, weighted average | 0.96 | 1.47 | 1.27 | 1.12 | |
| Mediation of flows | Water and mass flows regulation | 1.12 | 1.27 | 1.26 | 1.04 |
| Erosion control | 0.51 | 1.36 | 1.15 | 1.03 | |
| Potential for mediation of flows—overall, weighted average | 0.82 | 1.31 | 1.21 | 1.04 | |
| Regulation and maintenance of physical, chemical, biological conditions | Atmospheric composition and global climate regulation | 1.09 | 1.89 | 1.59 | 1.62 |
| Local climate regulation | 1.93 | 1.29 | 1.15 | 1.24 | |
| Soil formation and nutrient regulation | 1.02 | 1.17 | 1.00 | 1.03 | |
| Pollination, lifecycle maintenance and protection | 1.83 | 2.14 | 2.00 | 2.01 | |
| Pest and disease control | 1.22 | 2.09 | 1.74 | 1.66 | |
| Potential for regulation & maintenance—overall, weighted average | 1.48 | 1.71 | 1.52 | 1.48 | |
| Overall potential for regulating ES | Cadaster area | 3.50 | 3.36 | 3.59 | 3.88 |
| Agricultural landscape (in total) | 1.13 | 1.53 | 1.36 | 1.24 | |
| Large-block agricultural landscape | 1.04 | 1.47 | 1.38 | 1.23 | |
| TAL (traditional agricultural landscape) | 1.83 | 1.77 | 1.32 | 1.31 |
1 Potential was expressed using a scale of 0–5, where 0 means no relevant potential and 5 means a very high potential for delivery of the relevant ES (as per Burkhard et al. 2014).
Table 9.
Agricultural landscape preconditions for cultural ecosystem services in the case-study areas.
Table 9.
Agricultural landscape preconditions for cultural ecosystem services in the case-study areas.
| Groups of Services | Ecosystem Services | Svätý Jur | Lednica | Hriňová | Liptovská Teplička |
|---|---|---|---|---|---|
| Physical and intellectual interactions with ecosystems and landscapes | Recreation—physical and experiential interactions | 1.44 1 | 1.96 | 2.00 | 1.79 |
| Landscape aesthetics and inspiration | 1.42 | 2.01 | 2.00 | 1.80 | |
| Cultural heritage and diversity | 1.43 | 2.00 | 2.00 | 1.80 | |
| Natural heritage and diversity | 1.12 | 2.01 | 2.00 | 1.80 | |
| Potential for physical & intellectual services—overall weighted average | 1.37 | 1.98 | 2.00 | 1.80 | |
| Spiritual, symbolic and other interactions with ecosystems and landscapes | Religious and spiritual interactions | 0.04 | 0.10 | 0.00 | 0.02 |
| Knowledge and other interactions | 2.02 | 2.00 | 2.00 | 2.00 | |
| Potential for spiritual & knowledge services—overall weighted average | 1.23 | 1.24 | 1.20 | 1.21 | |
| Overall potential for cultural ES | Cadastral area | 3.23 | 3.23 | 3.31 | 3.86 |
| Agricultural landscape (in total) | 1.31 | 1.69 | 1.68 | 1.56 | |
| Large-block agricultural landscape | 1.24 | 1.23 | 1.76 | 1.53 | |
| TAL (traditional agricultural landscape) | 1.92 | 1.88 | 1.73 | 1.69 |
1 The potential was expressed using a scale of 0–5, where 0 means no relevant potential and 5 means a very high potential for delivery of the relevant ES (as per Burkhard et al. 2014).
Table 10.
Significance (ES_C) and variability/volatility of the functions (STDEV) of agricultural land cover classes occurring for all case study areas.
Table 10.
Significance (ES_C) and variability/volatility of the functions (STDEV) of agricultural land cover classes occurring for all case study areas.
| Land Cover Class (CLC) | ES_C/PROV 1 | STDEV/PROV 2 | ES_C/REG 3 | STDEV/REG 4 | ES_C/CULT 5 | STDEV/CULT 6 | |
|---|---|---|---|---|---|---|---|
| Large-block intensively-utilized agricultural areas | |||||||
| 2111 | Large-block arable land | 2.60 | 2.45 | 1.02 | 0.70 | 0.92 | 0.58 |
| 2211 | Cultivated large-block vineyards | 1.16 | 1.20 | 1.00 | 0.45 | 1.40 | 0.76 |
| 2221 | Cultivated orchards | 1.40 | 1.25 | 2.42 | 1.02 | 2.06 | 0.82 |
| 2311 | Meadows | 1.50 | 1.96 | 1.34 | 1.02 | 1.52 | 0.75 |
| 2312 | Pastures | 1.38 | 1.95 | 1.26 | 0.80 | 1.52 | 0.75 |
| Large-block extensively-utilized agricultural areas | |||||||
| 2213 | Overgrown vineyards | 0.92 | 0.92 | 1.76 | 0.46 | 1.40 | 0.76 |
| 2224 | Overgrown orchards | 1.16 | 1.00 | 2.42 | 1.02 | 1.64 | 0.47 |
| 2313 | Grass wetlands | 0.50 | 0.66 | 2.46 | 0.80 | 2.90 | 1.34 |
| 2314 | Grass stands with dispersed trees and shrubs | 0.74 | 0.94 | 3.31 | 0.60 | 1.34 | 0.50 |
| Traditional agricultural structures—TAL | |||||||
| 2112 | Small-block arable land | 2.40 | 2.00 | 1.51 | 0.50 | 1.52 | 0.75 |
| 2212 | Small-block vineyards | 0.92 | 0.92 | 1.64 | 0.49 | 2.70 | 0.94 |
| 2411 | Arable land/vineyards | 1.80 | 1.49 | 1.15 | 0.60 | 1.04 | 0.69 |
| 2412 | Arable land/orchards | 1.88 | 1.43 | 1.65 | 0.49 | 1.10 | 0.75 |
| 2415 | Arable land/grasslands | 1.68 | 1.35 | 1.27 | 0.46 | 1.52 | 0.75 |
| 2421 | Arable land/ grasslands/vineyards | 1.95 | 1.43 | 1.45 | 0.67 | 1.64 | 0.90 |
| 2422 | Arable land/grasslands/orchards | 2.03 | 1.36 | 1.83 | 0.75 | 1.64 | 0.90 |
| 2423 | Arable land/vineyards/orchards | 1.76 | 1.42 | 1.83 | 0.75 | 1.64 | 0.90 |
| 2425 | Arable land/grasslands/berries | 1.95 | 1.43 | 1.45 | 0.67 | 1.52 | 0.75 |
| 2432 | Arable land/orchards/ semi-natural vegetation | 1.55 | 1.10 | 1.82 | 0.60 | 1.52 | 0.75 |
| 2436 | Arable land/grasslands/orchards/semi-natural vegetation | 1.58 | 1.12 | 2.07 | 0.63 | 1.52 | 0.75 |
| 2437 | Arable land/vineyards/orchards/semi-natural vegetation | 1.58 | 1.11 | 2.07 | 0.63 | 1.76 | 0.37 |
| 2439 | Arable land/grasslands/semi-natural vegetation | 1.55 | 1.10 | 1.82 | 0.40 | 1.76 | 0.37 |
| 2440 | Grassland/vineyard/semi-natural vegetation | 1.54 | 1.02 | 2.11 | 0.54 | 1.52 | 0.75 |
| 2441 | Orchard/vineyard | 1.27 | 0.89 | 2.18 | 0.40 | 2.36 | 0.76 |
| 2445 | Vineyard/orchard | 1.19 | 0.77 | 2.61 | 0.50 | 2.06 | 0.75 |
| 2451 | Grassland/vineyard | 1.79 | 1.28 | 1.76 | 0.60 | 2.24 | 0.75 |
| 2452 | Grassland/orchard | 1.87 | 1.20 | 2.55 | 0.50 | 2.36 | 0.76 |
| 2455 | Grassland/vineyard/orchard | 1.75 | 1.11 | 2.55 | 0.50 | 2.36 | 0.76 |
1 ES_C/PROV—Significance of given CLC class for provisioning ES, 2 STDEV_PROV—Functional variability of given CLC class with respect to provisioning ES, 3 ES_C/REG—Significance of given CLC class for regulation & maintenance ES, 4 STDEV_REG—Functional variability of given CLC class with respect to regulation & maintenance ES, 5 ES_C/CULT—Significance of given CLC class for cultural ES, 6 STDEV_CULT—Functional variability of given CLC class with respect to cultural ES. The cell colors represent the suitability of the given value in the context of overall significance and functional variability: Very favorable (green)—favorable (light green)—neutral (light yellow)—unfavorable (light grey)—very unfavorable (grey).
© 2018 by the authors. Licensee MDPI, Basel, Switzerland. This article is an open access article distributed under the terms and conditions of the Creative Commons Attribution (CC BY) license (http://creativecommons.org/licenses/by/4.0/).
Share and Cite
MDPI and ACS Style
Špulerová, J.; Petrovič, F.; Mederly, P.; Mojses, M.; Izakovičová, Z. Contribution of Traditional Farming to Ecosystem Services Provision: Case Studies from Slovakia. Land 2018, 7, 74. https://0-doi-org.brum.beds.ac.uk/10.3390/land7020074
AMA Style
Špulerová J, Petrovič F, Mederly P, Mojses M, Izakovičová Z. Contribution of Traditional Farming to Ecosystem Services Provision: Case Studies from Slovakia. Land. 2018; 7(2):74. https://0-doi-org.brum.beds.ac.uk/10.3390/land7020074
Chicago/Turabian StyleŠpulerová, Jana, František Petrovič, Peter Mederly, Matej Mojses, and Zita Izakovičová. 2018. "Contribution of Traditional Farming to Ecosystem Services Provision: Case Studies from Slovakia" Land 7, no. 2: 74. https://0-doi-org.brum.beds.ac.uk/10.3390/land7020074
Note that from the first issue of 2016, this journal uses article numbers instead of page numbers. See further details here.