Temporal and Spatial Analysis of Flood Occurrences in the Drainage Basin of Pinios River (Thessaly, Central Greece)

 ,
, 
 and
and
Abstract
:
1. Introduction
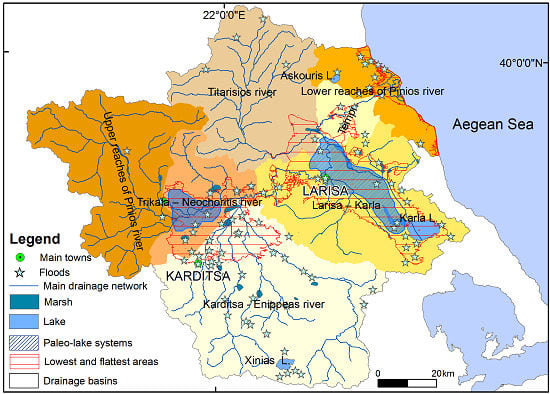
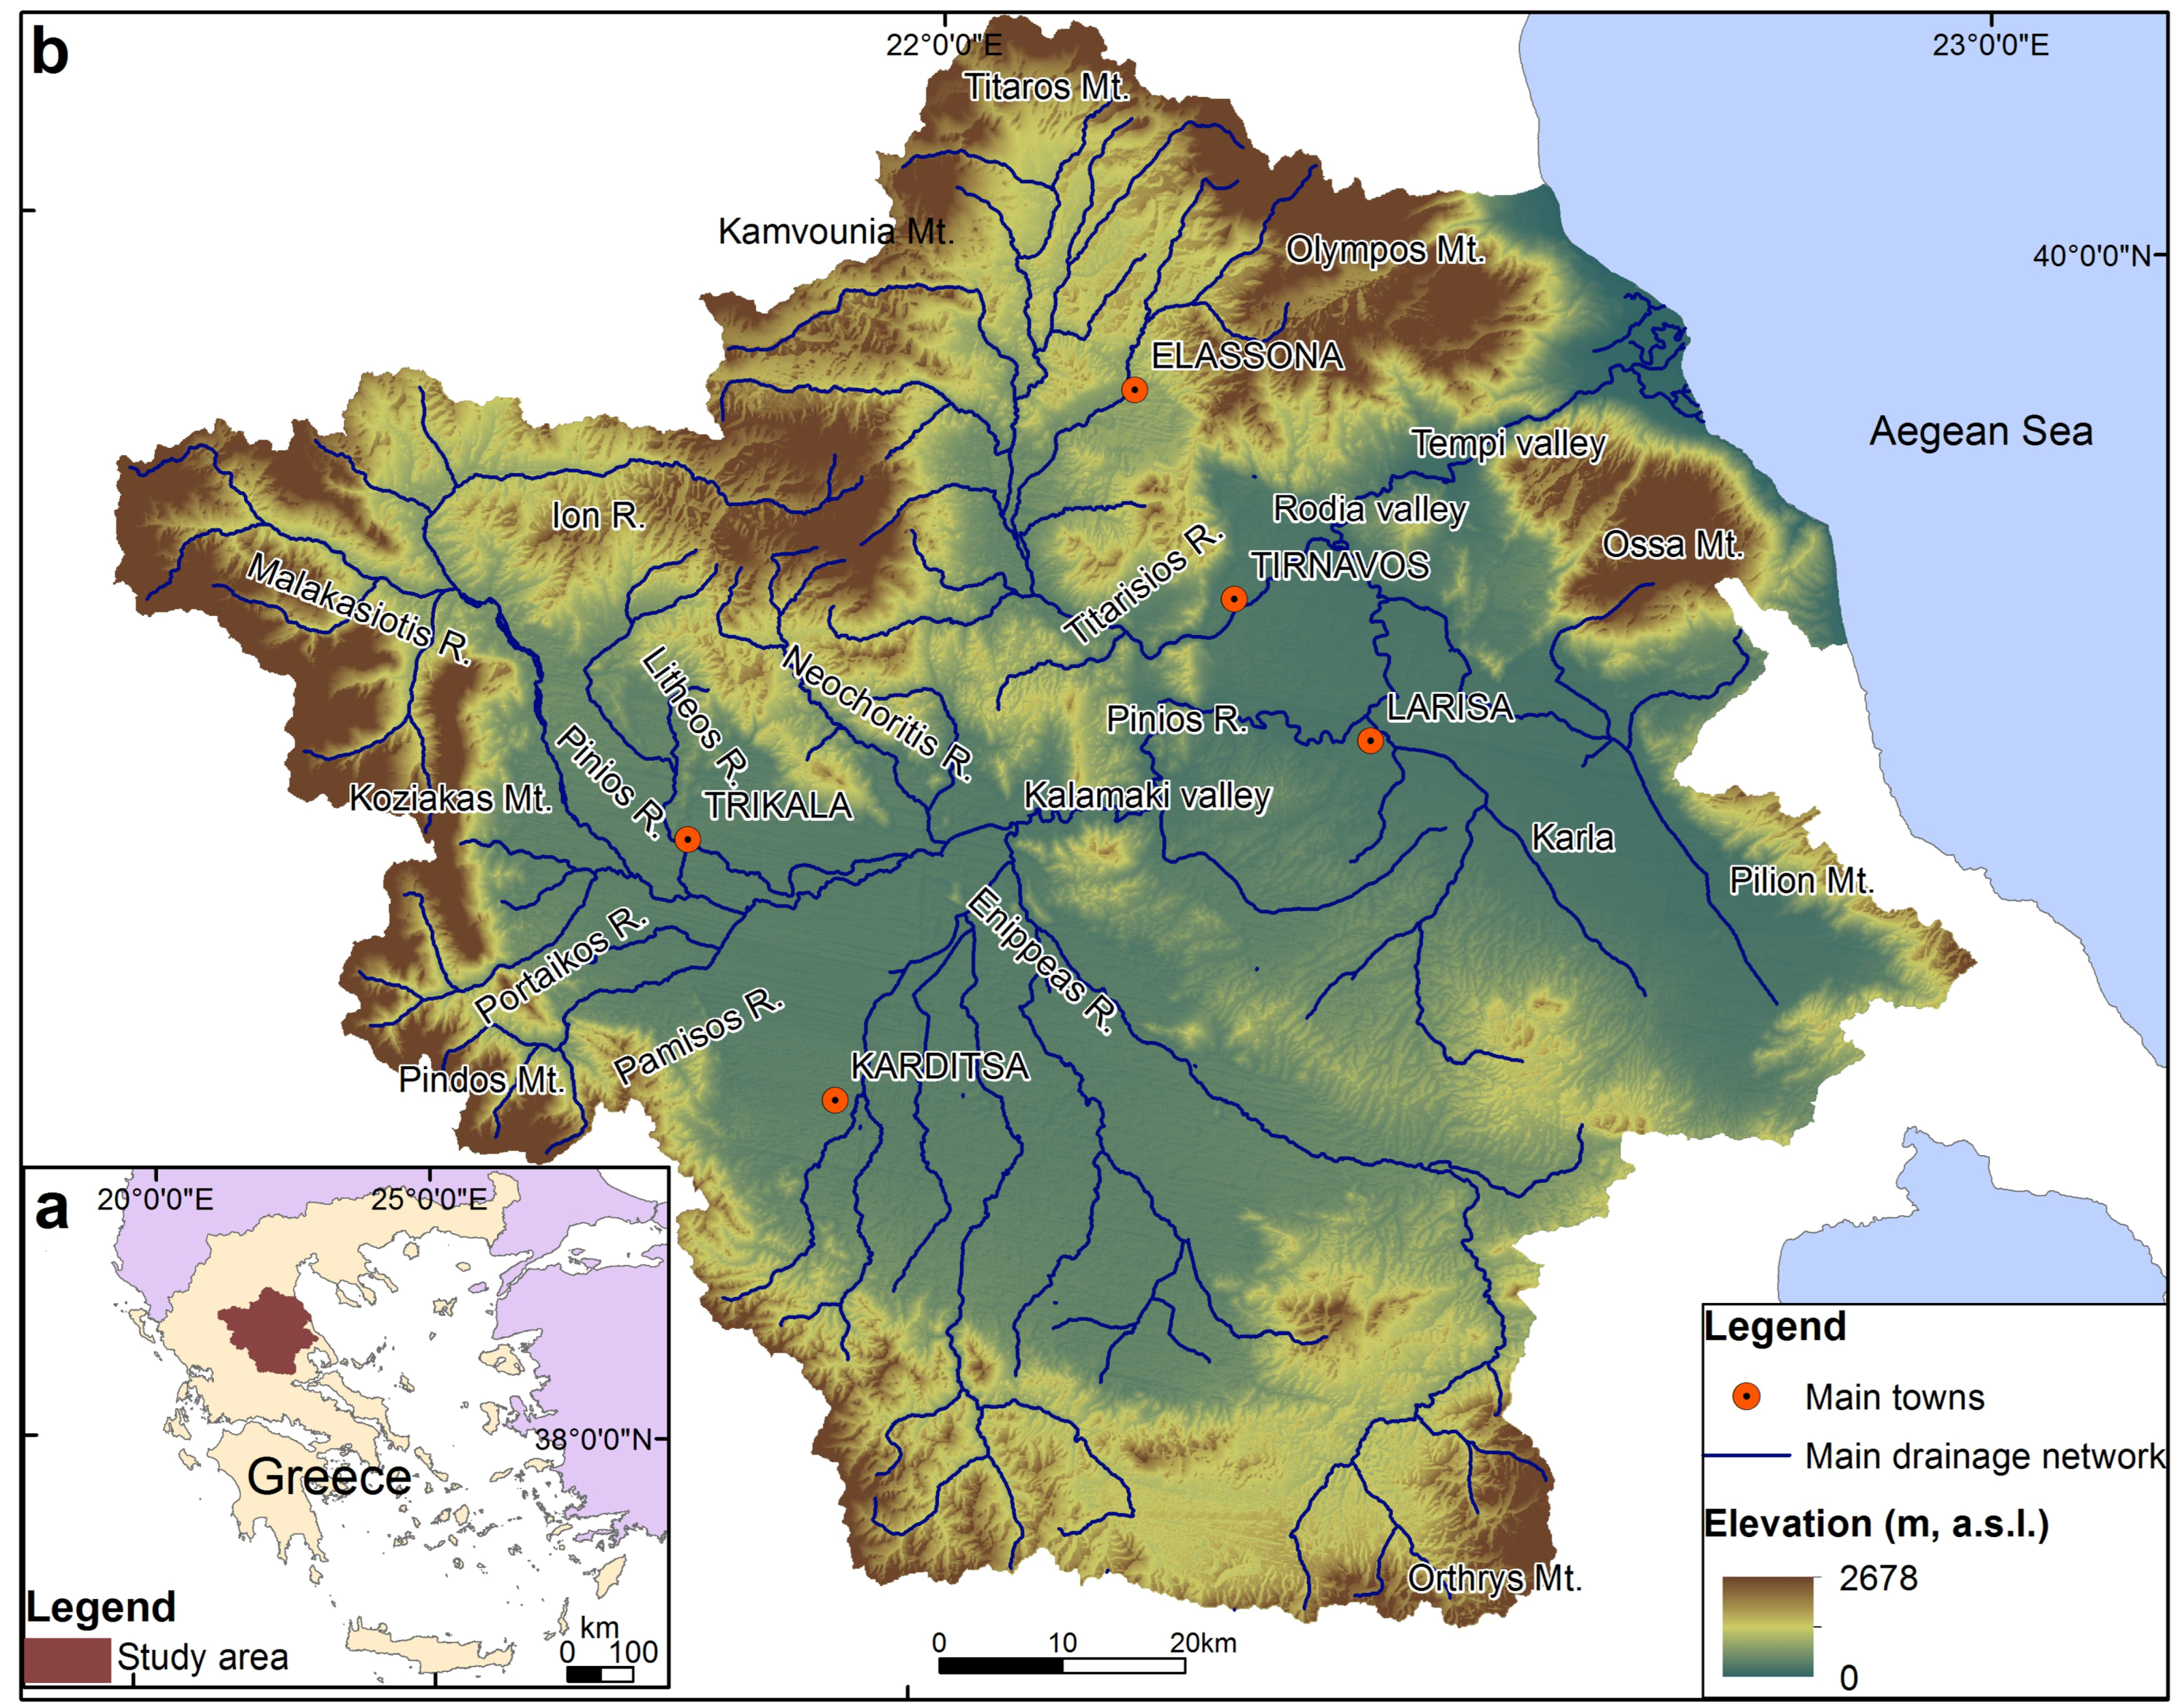
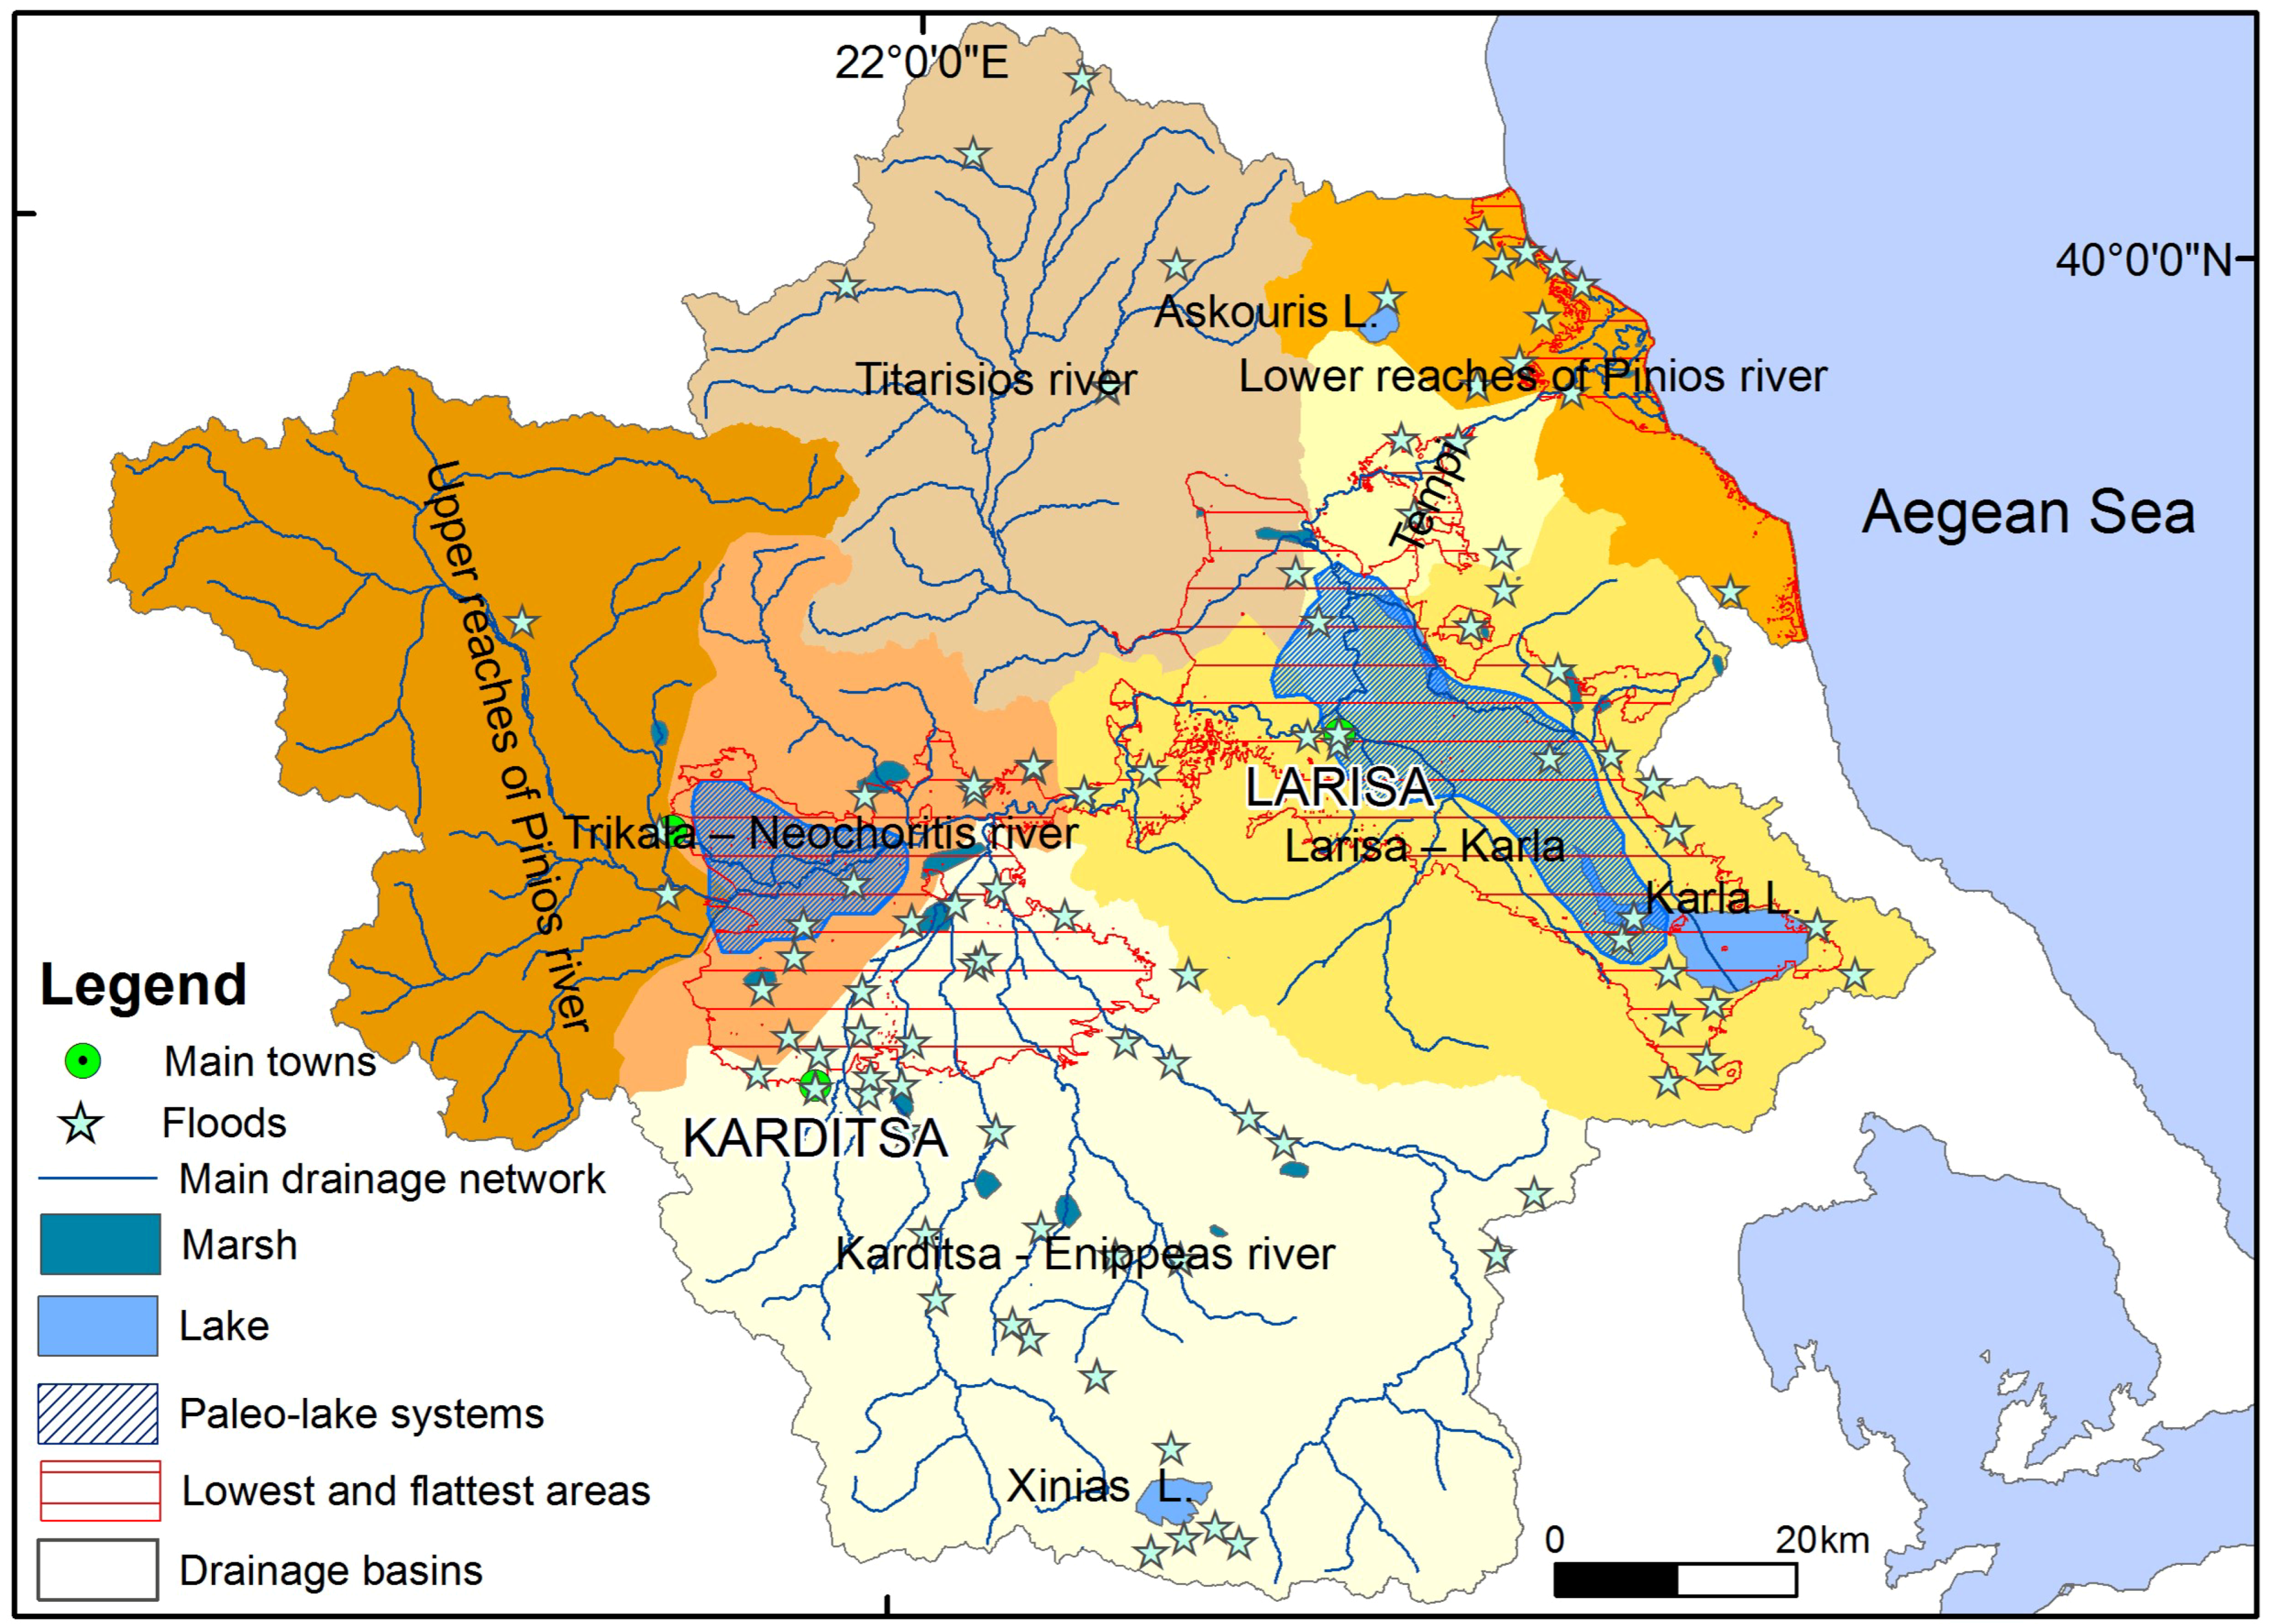
2. Study Area
3. Materials and Methods
3.1. Data
3.2. Statistical Analyses
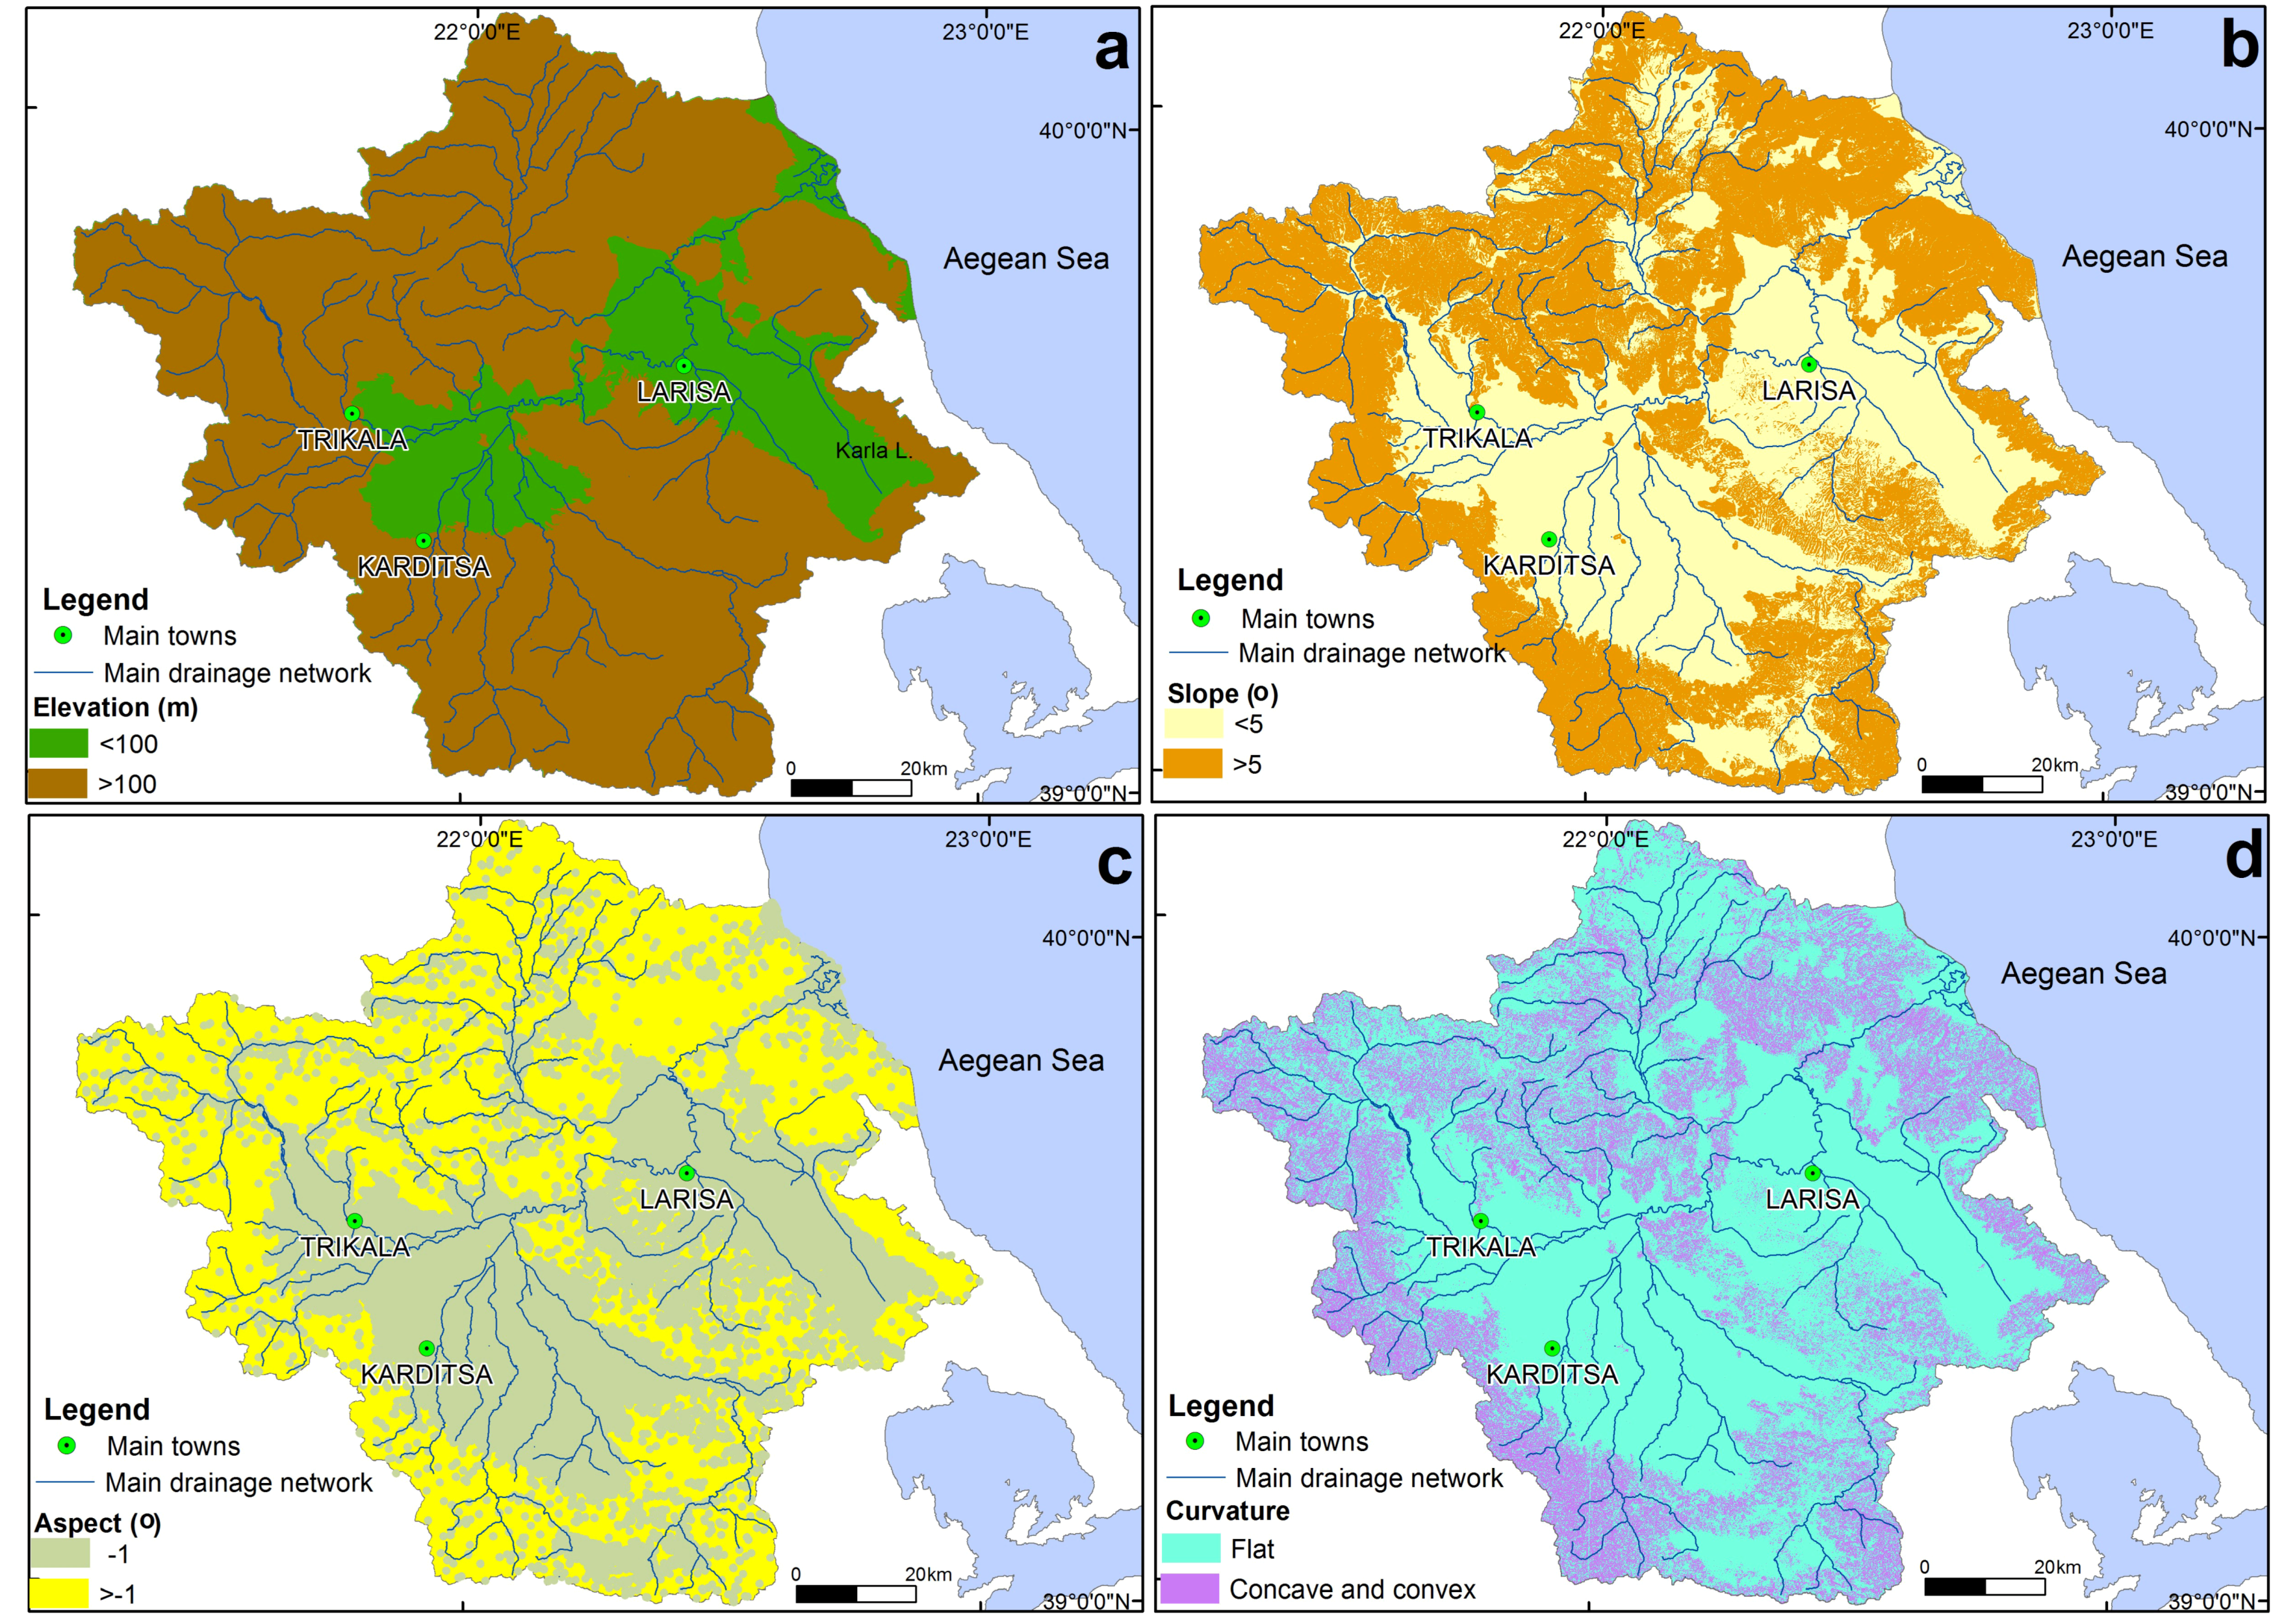
3.3. Spatial Analyses
4. Results
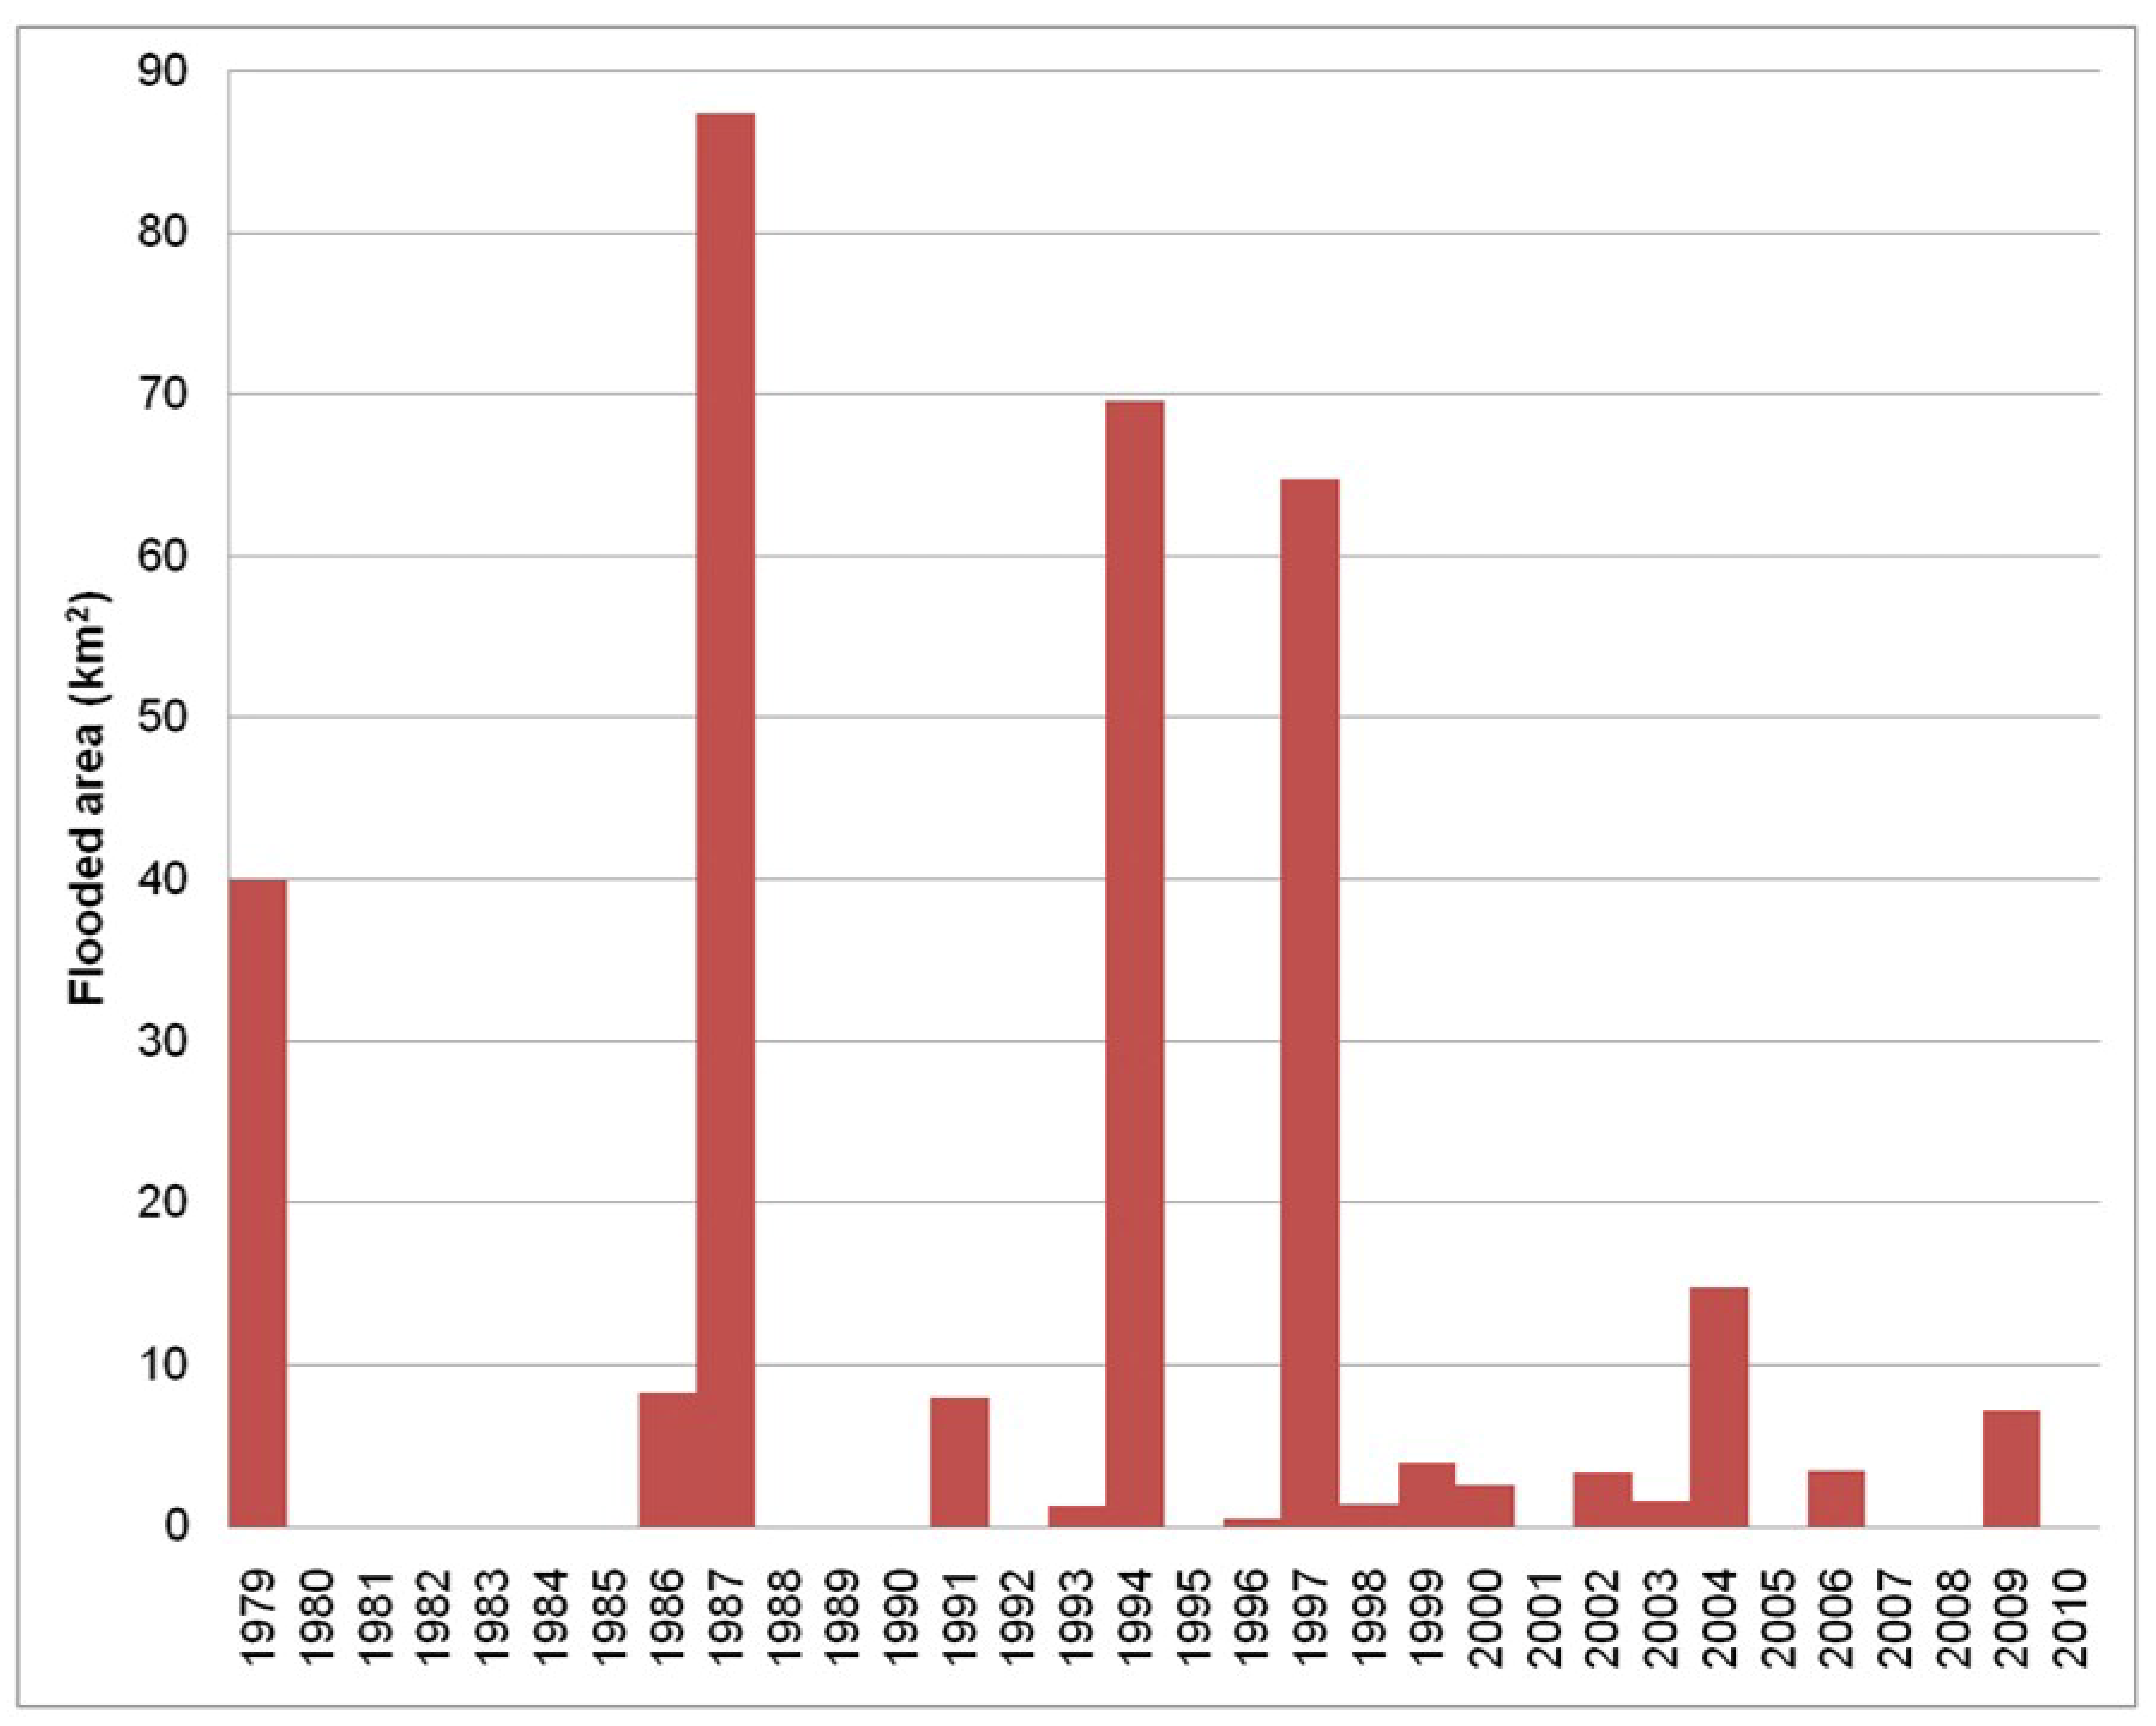
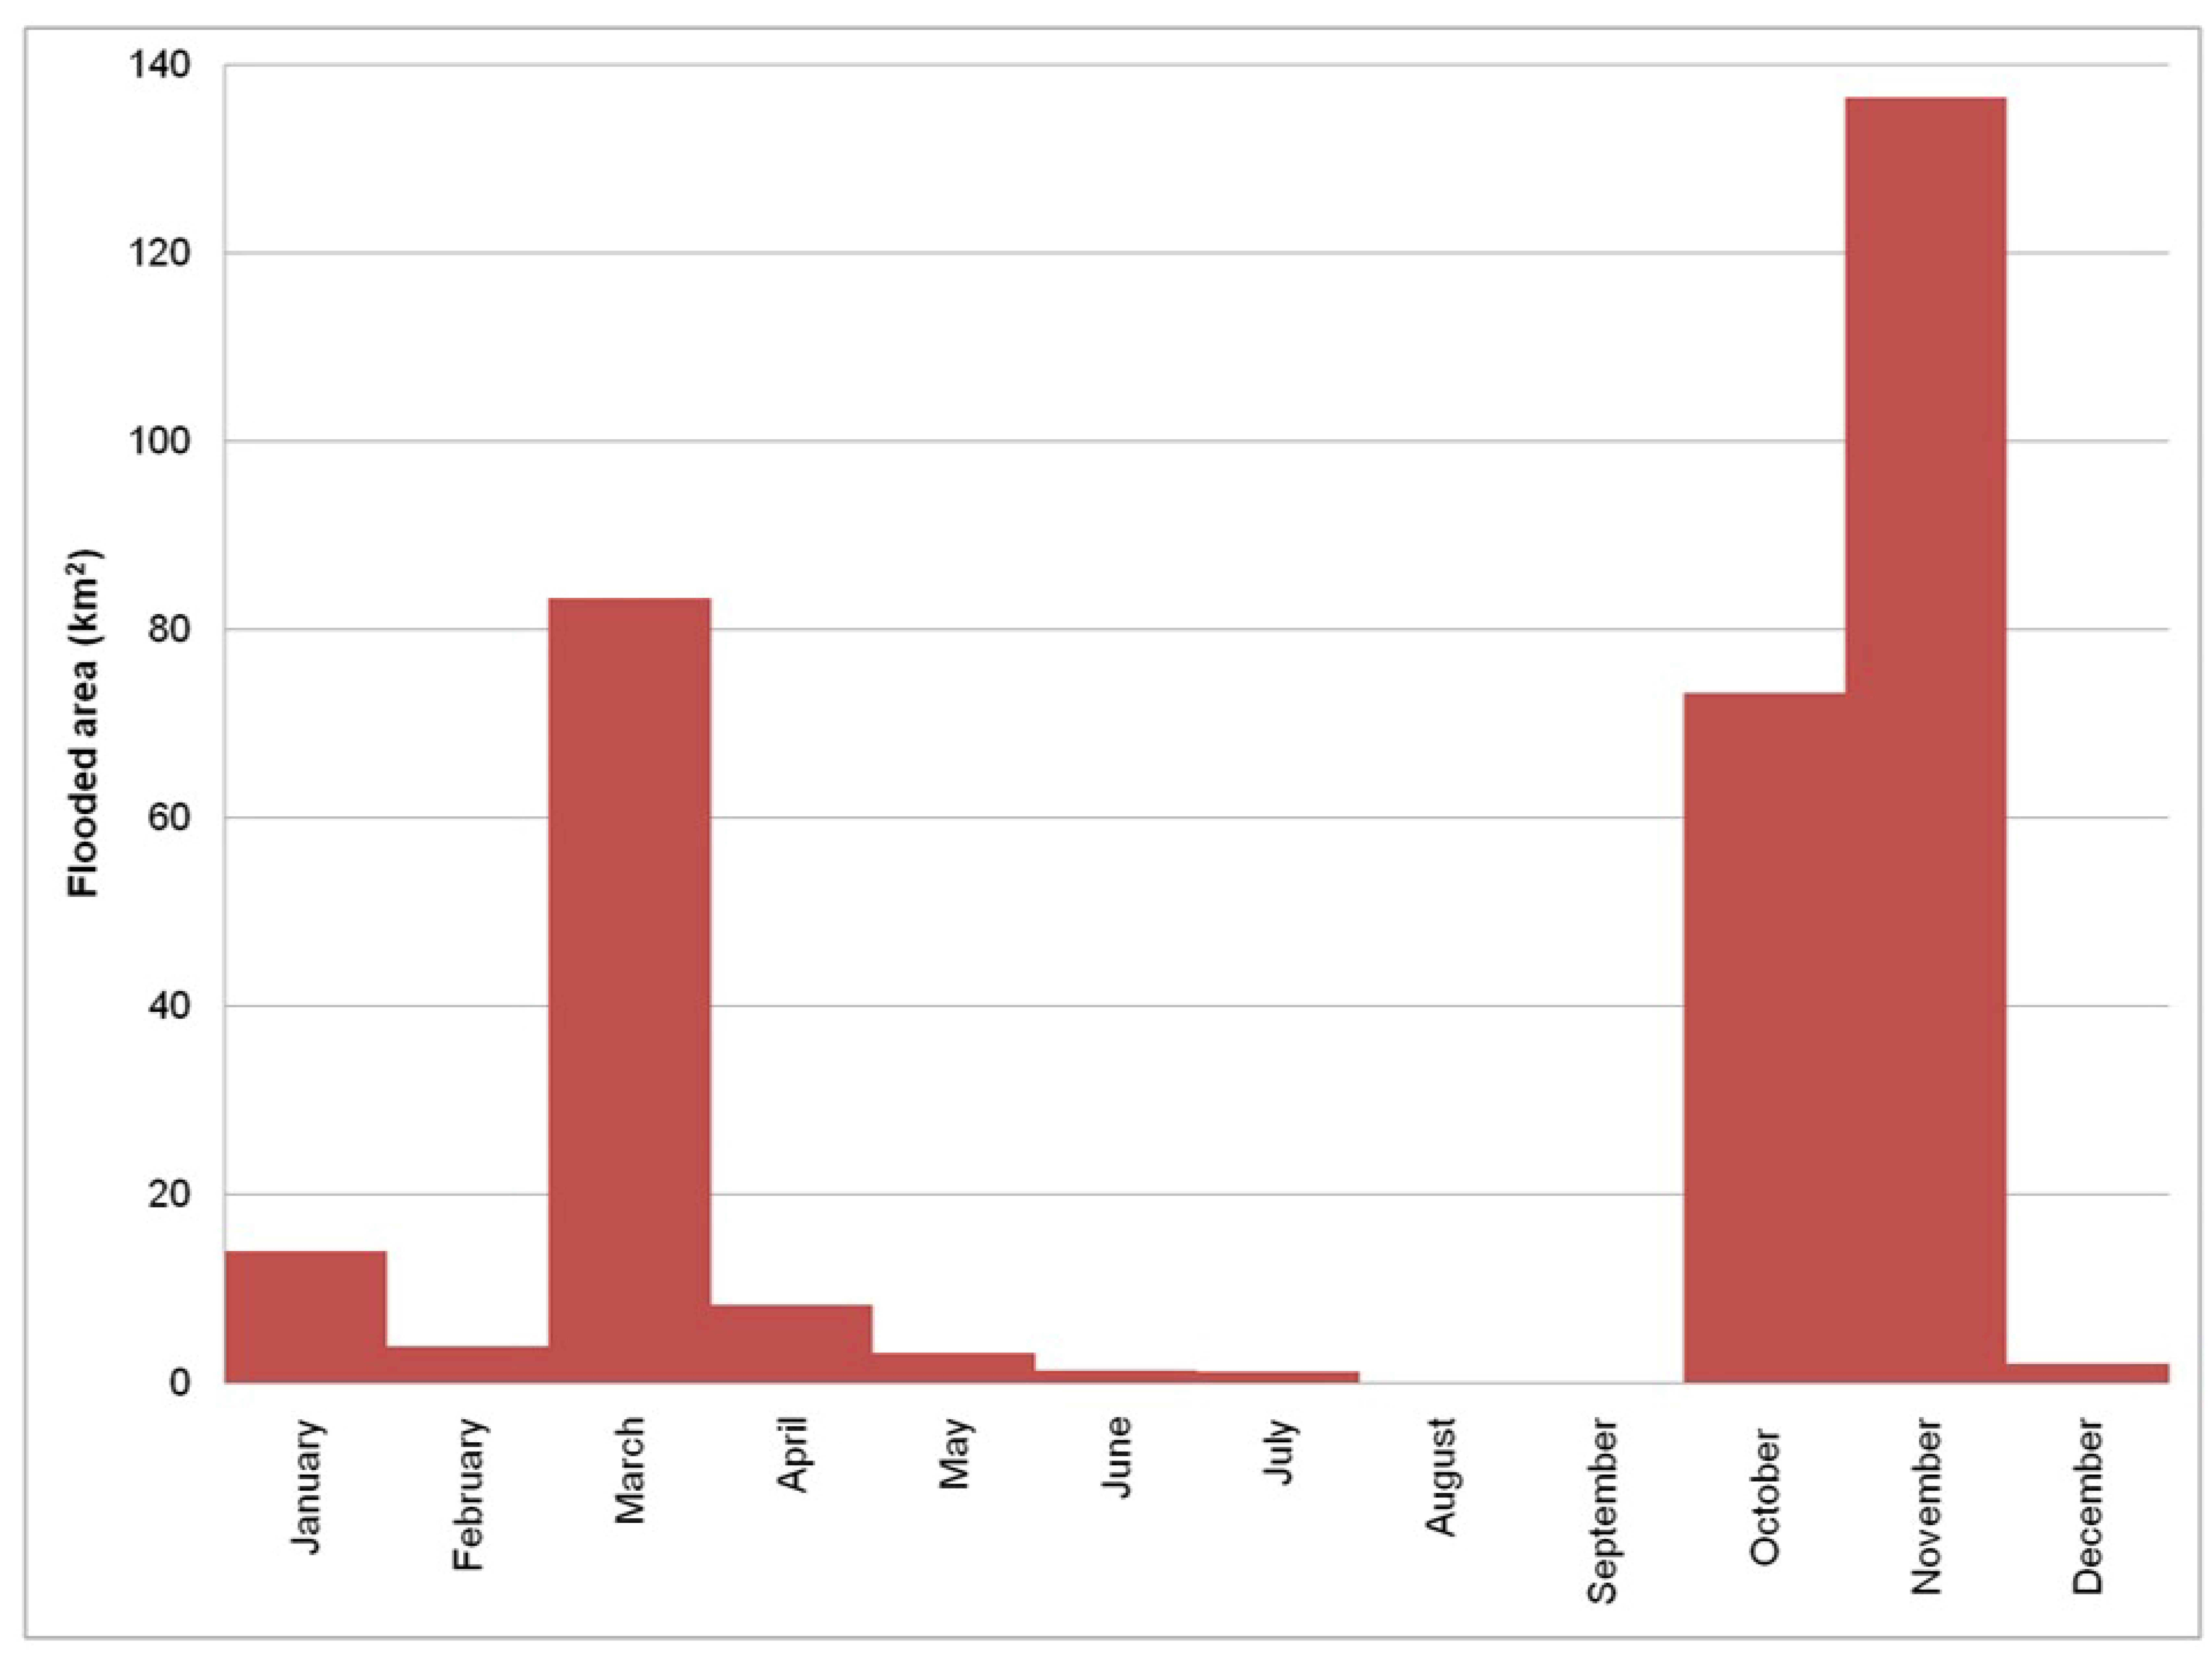
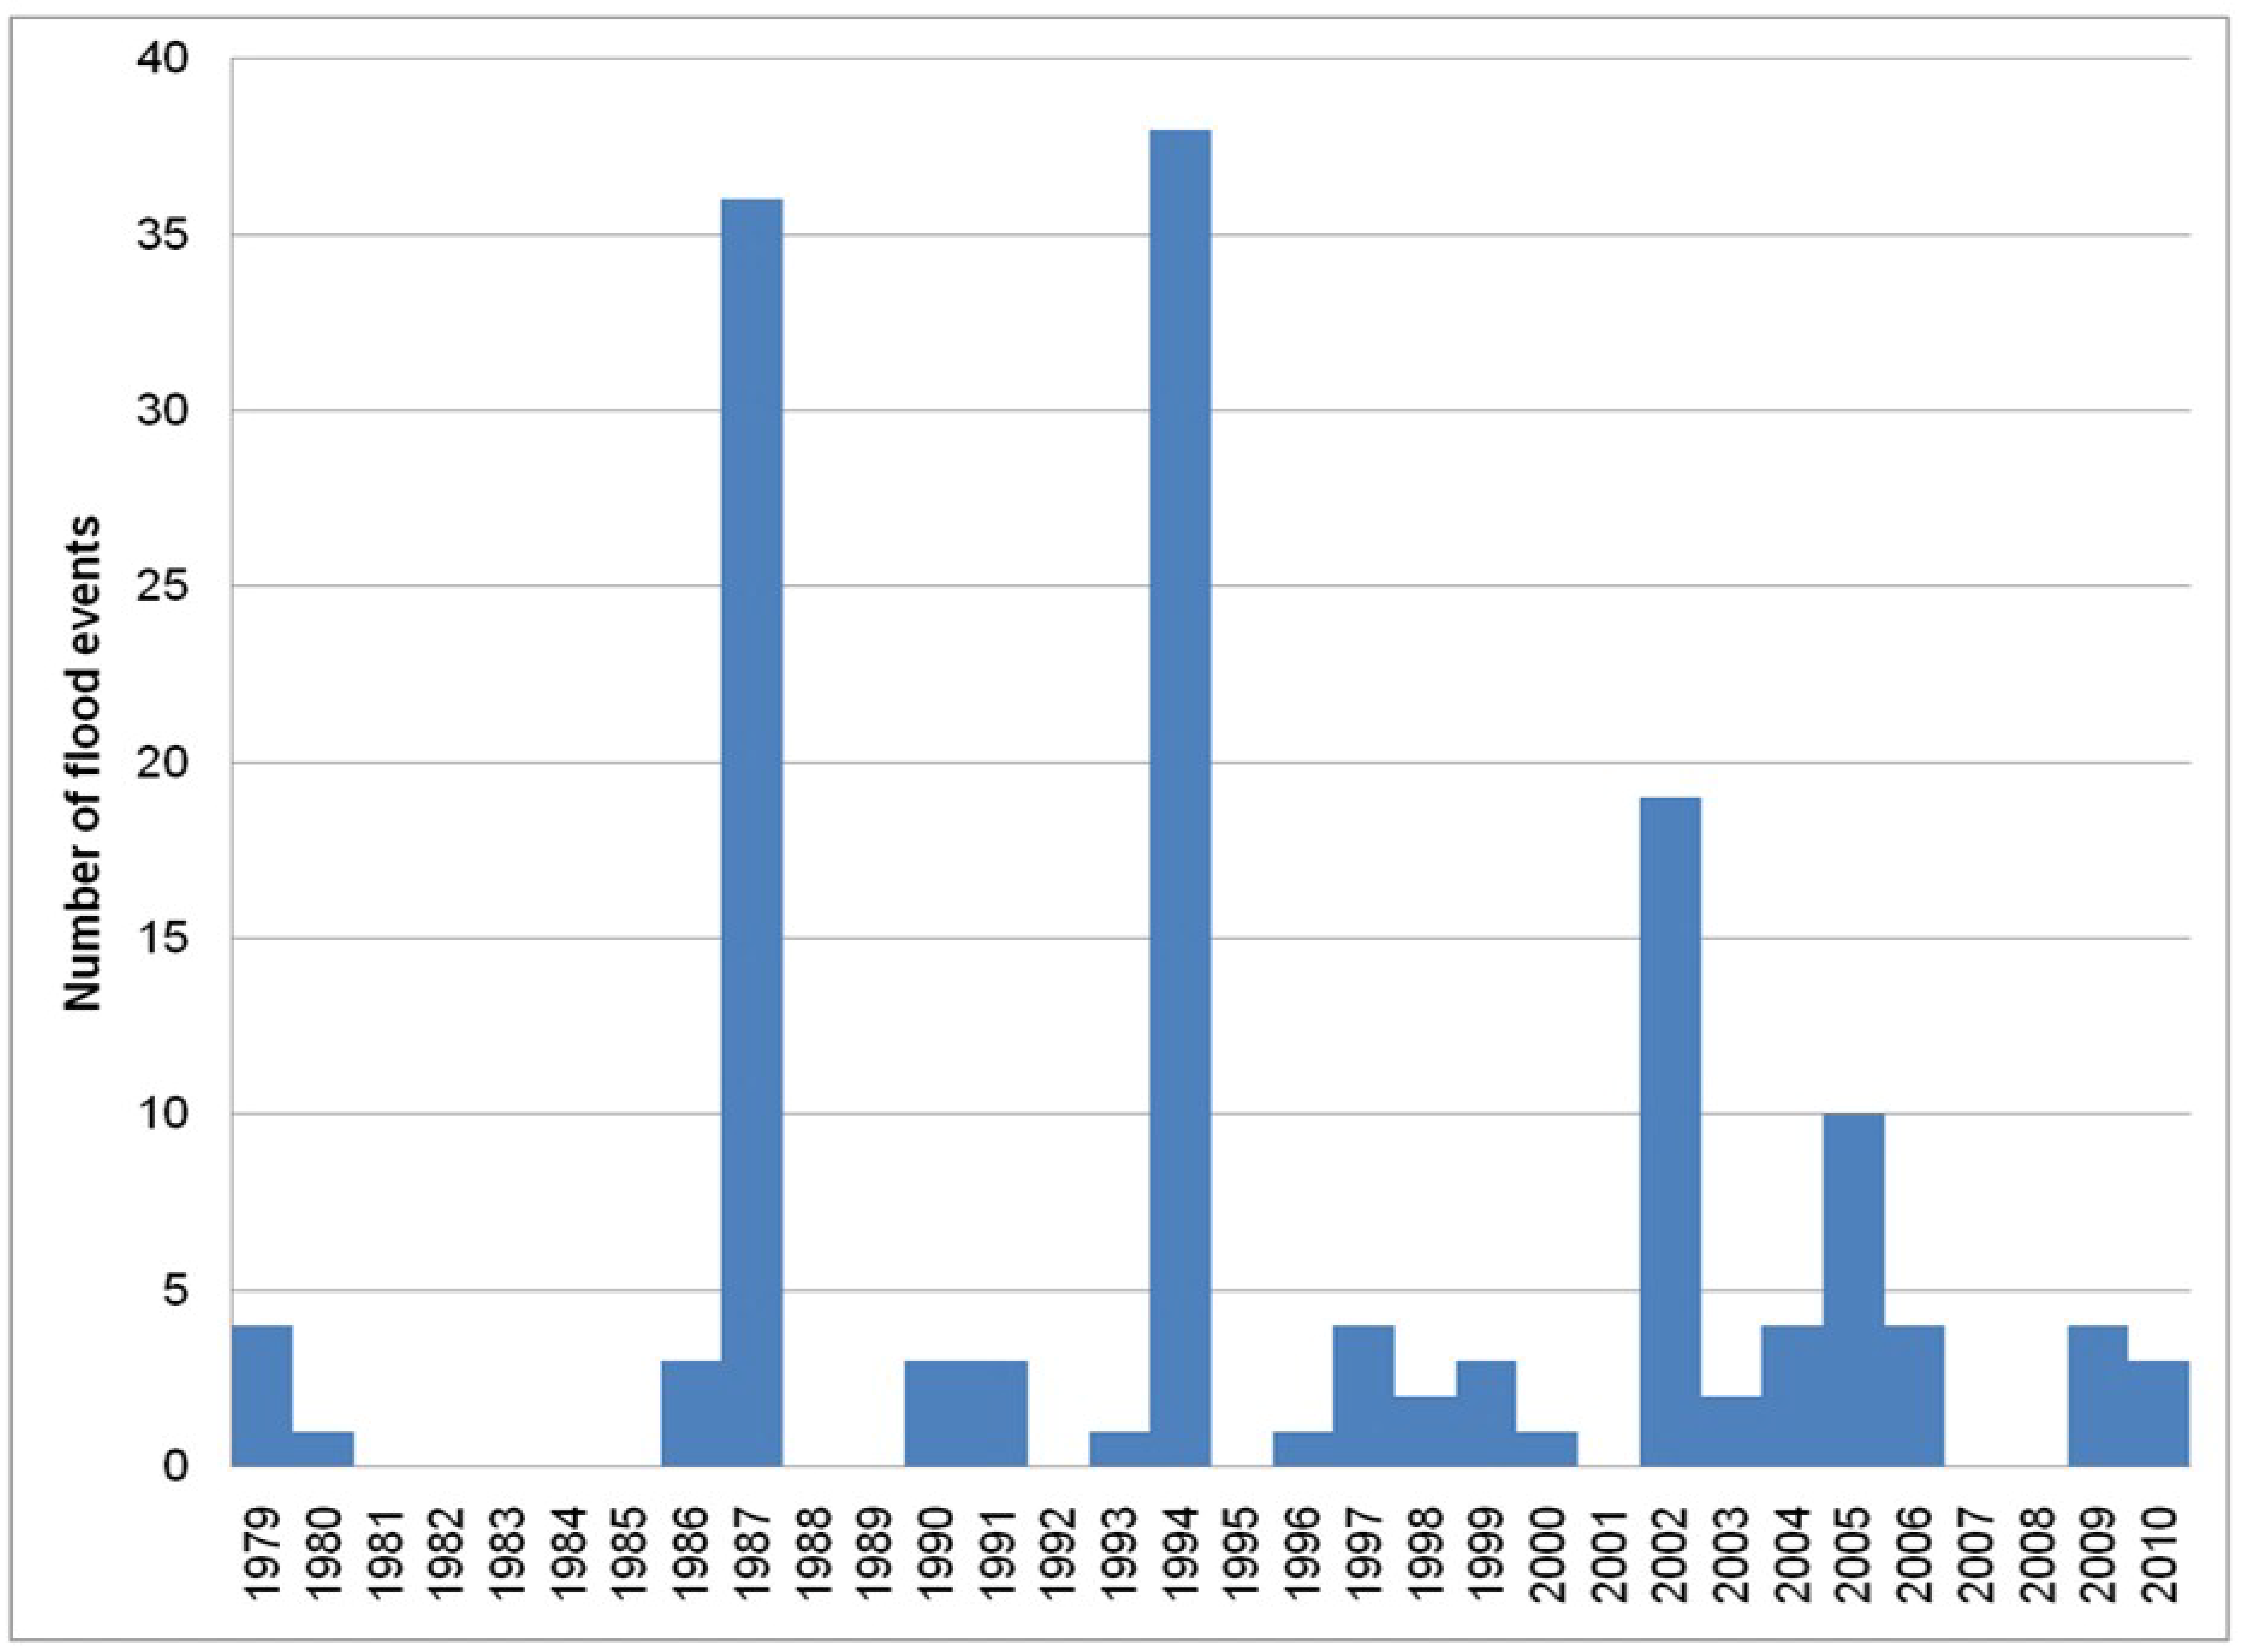
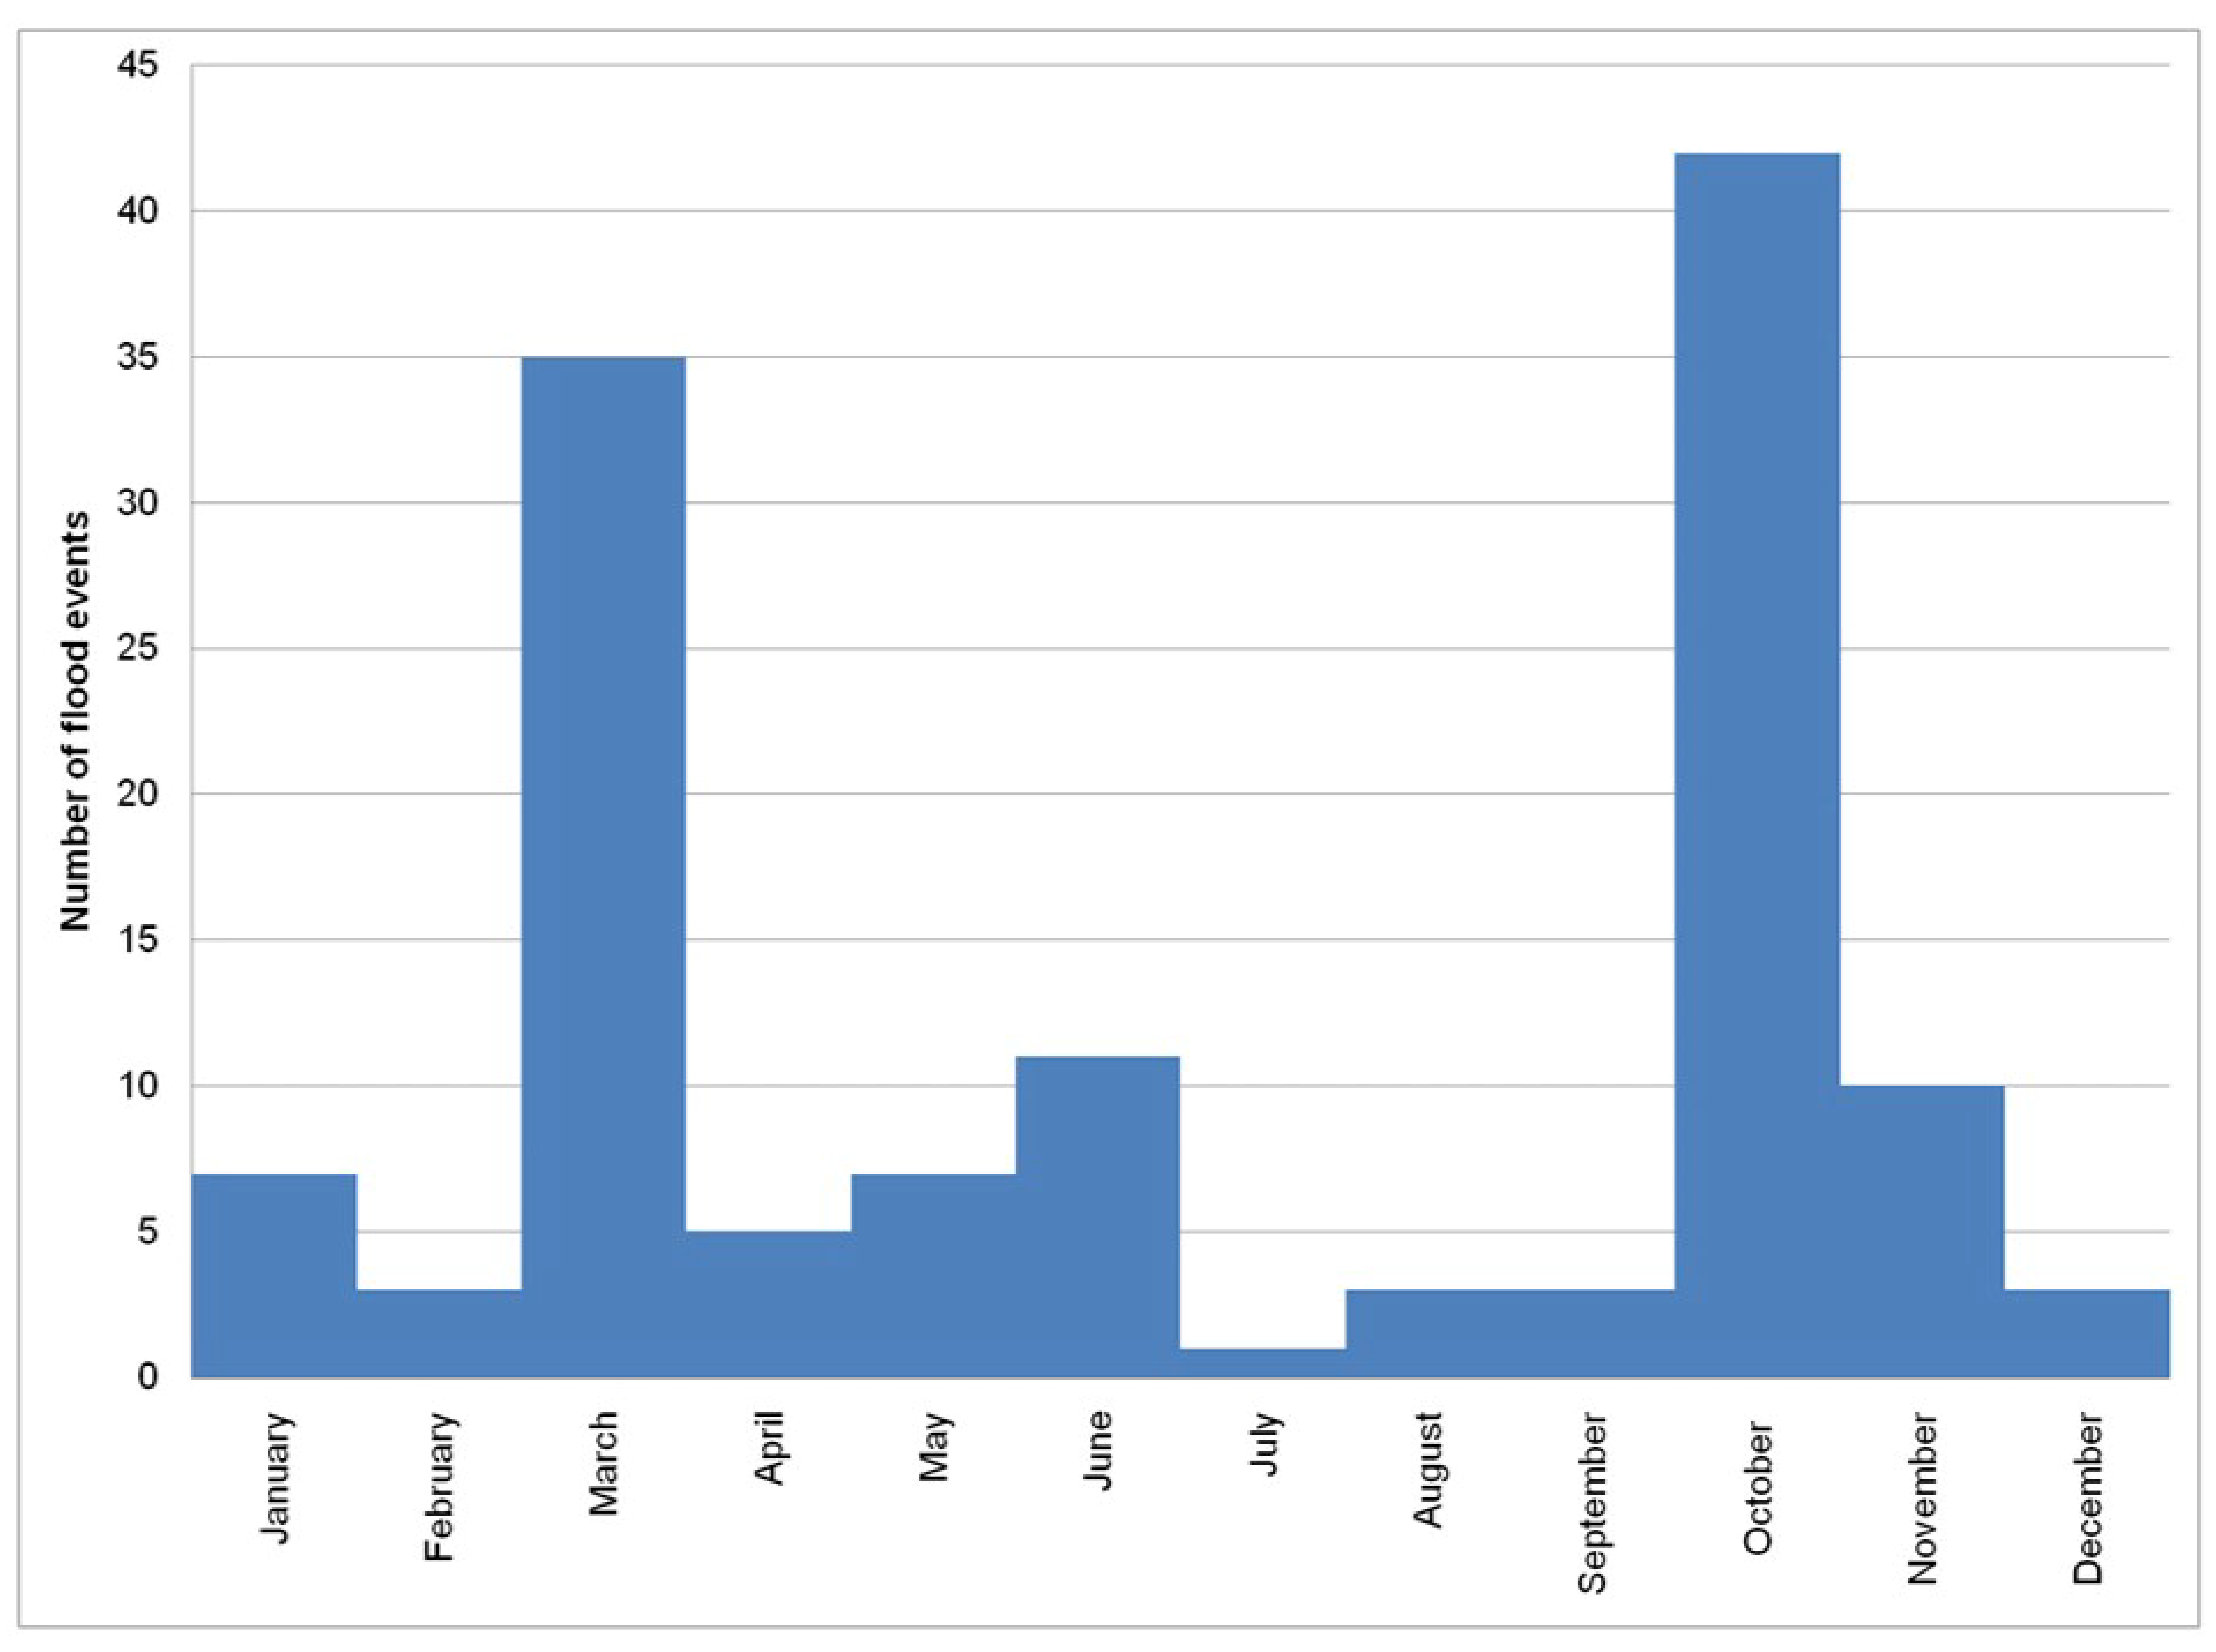
4.1. Temporal Distribution of Flood Events
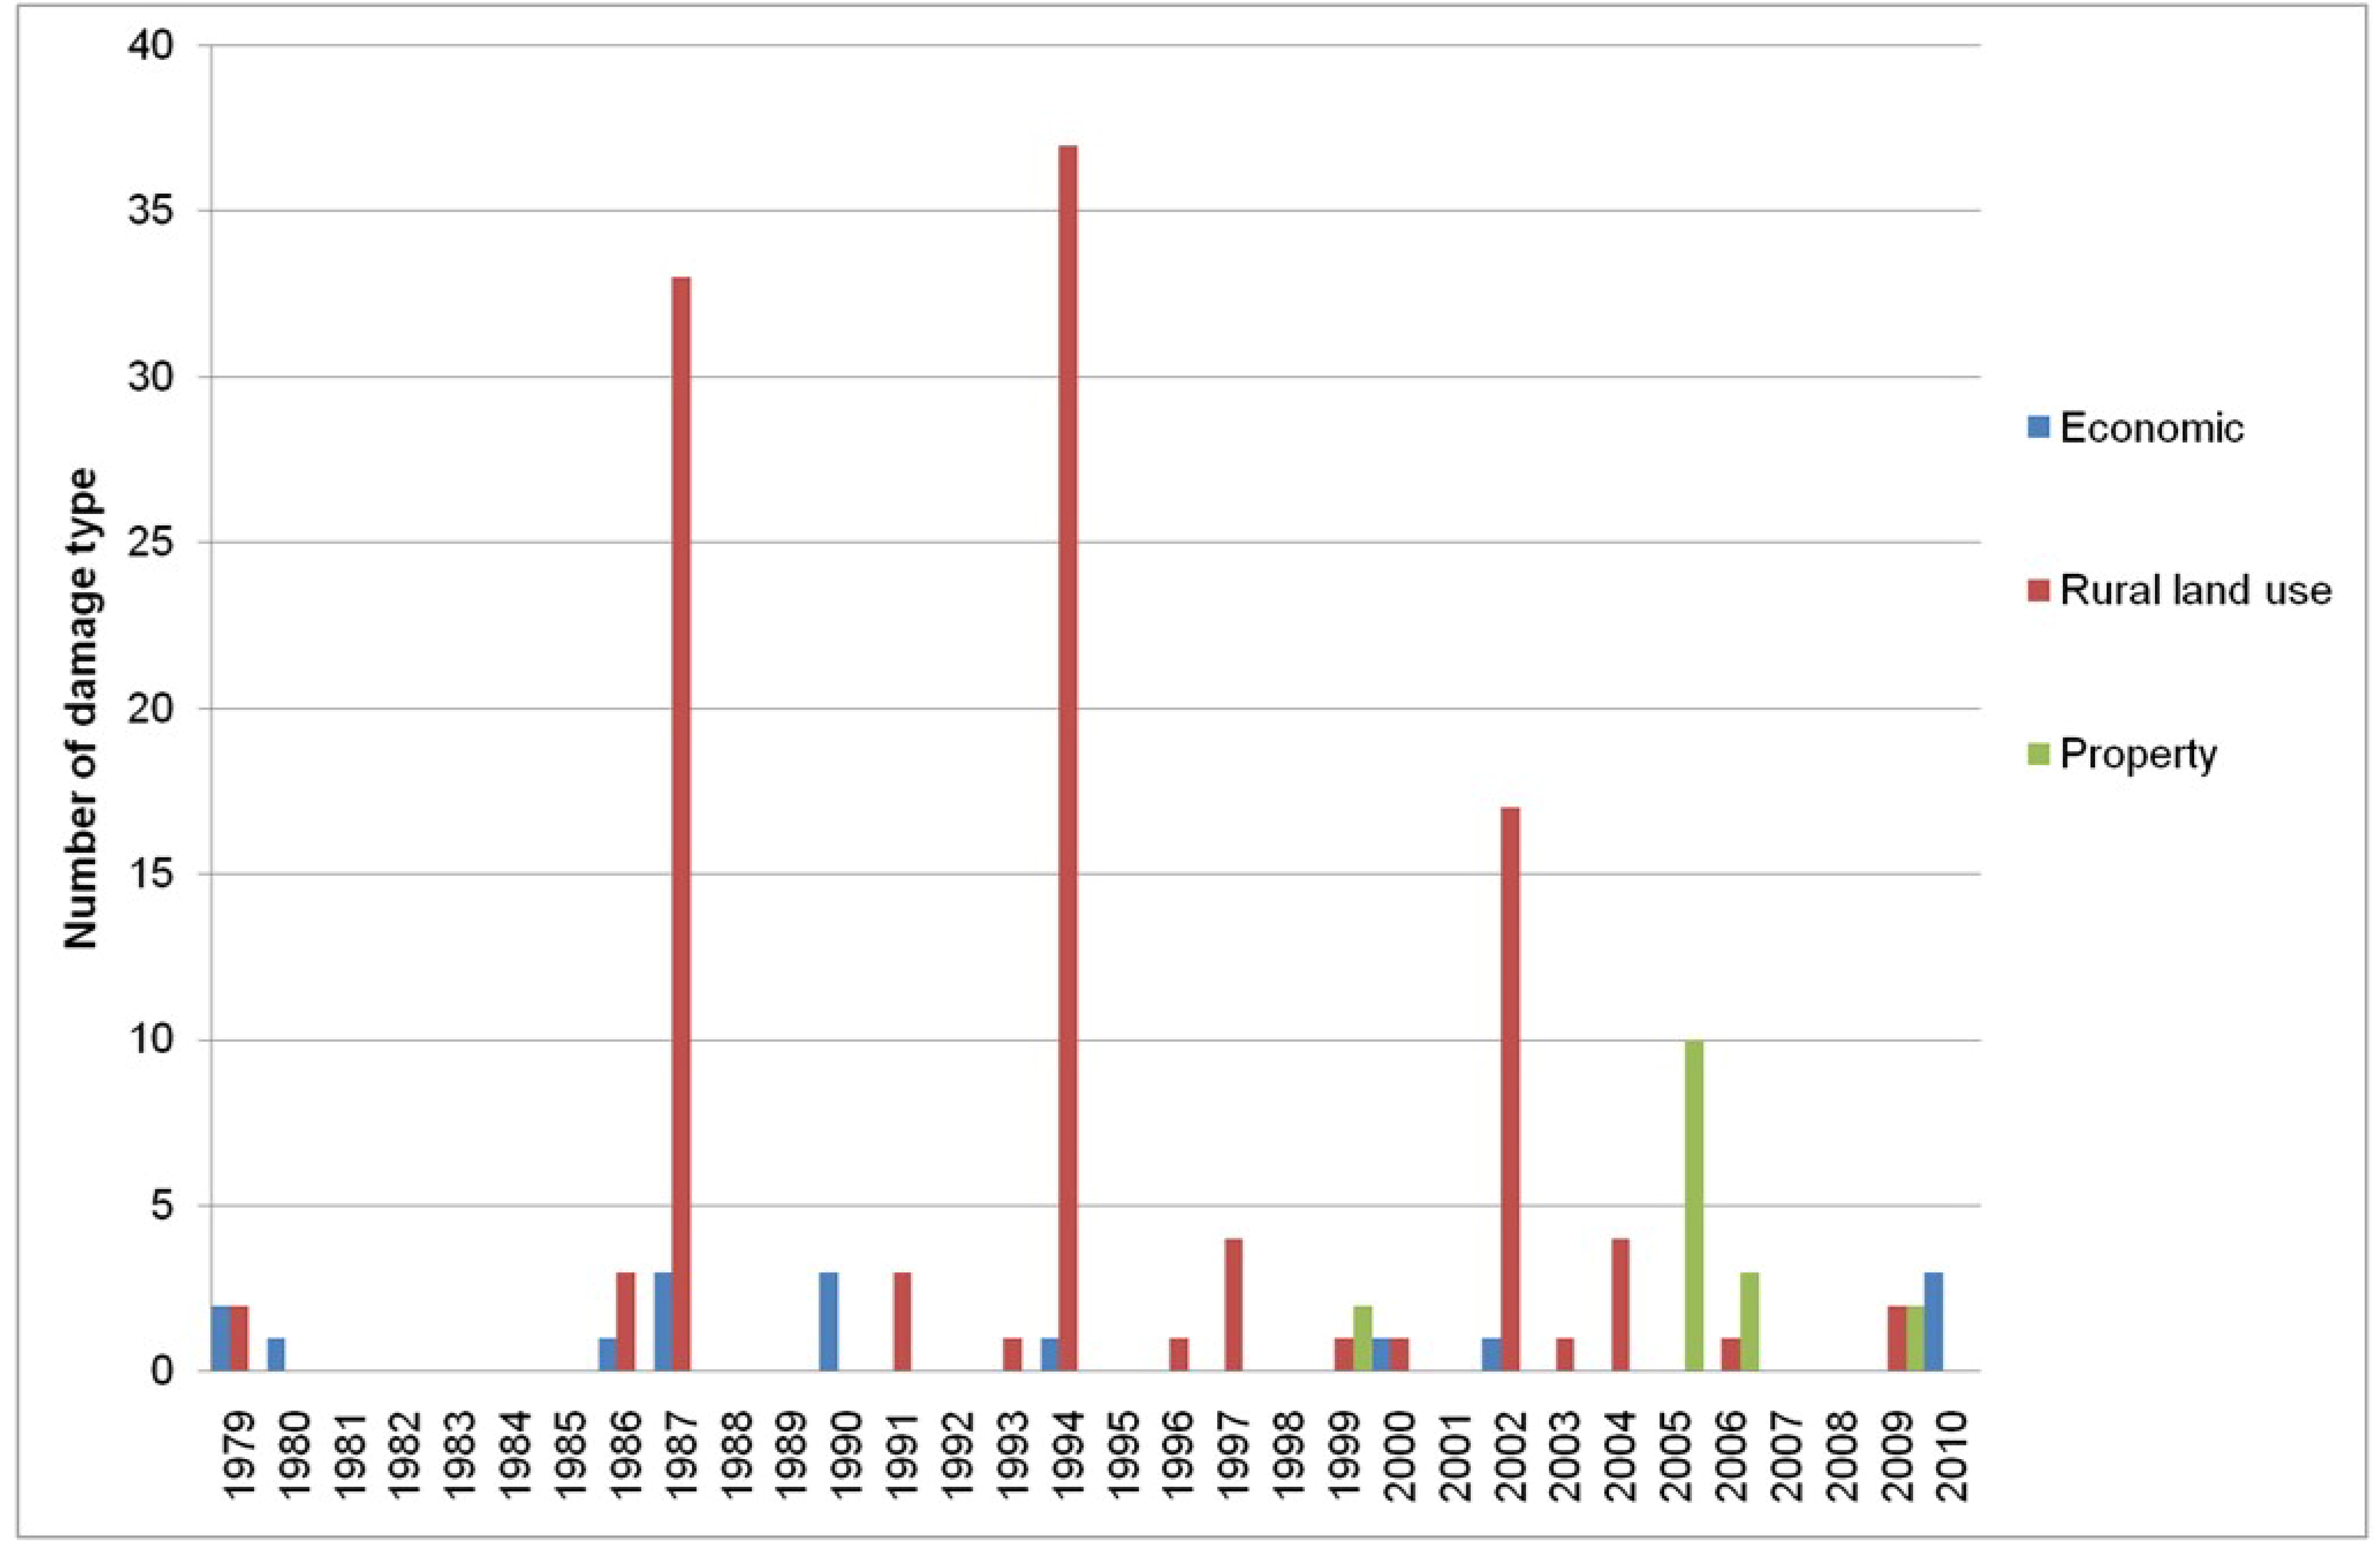
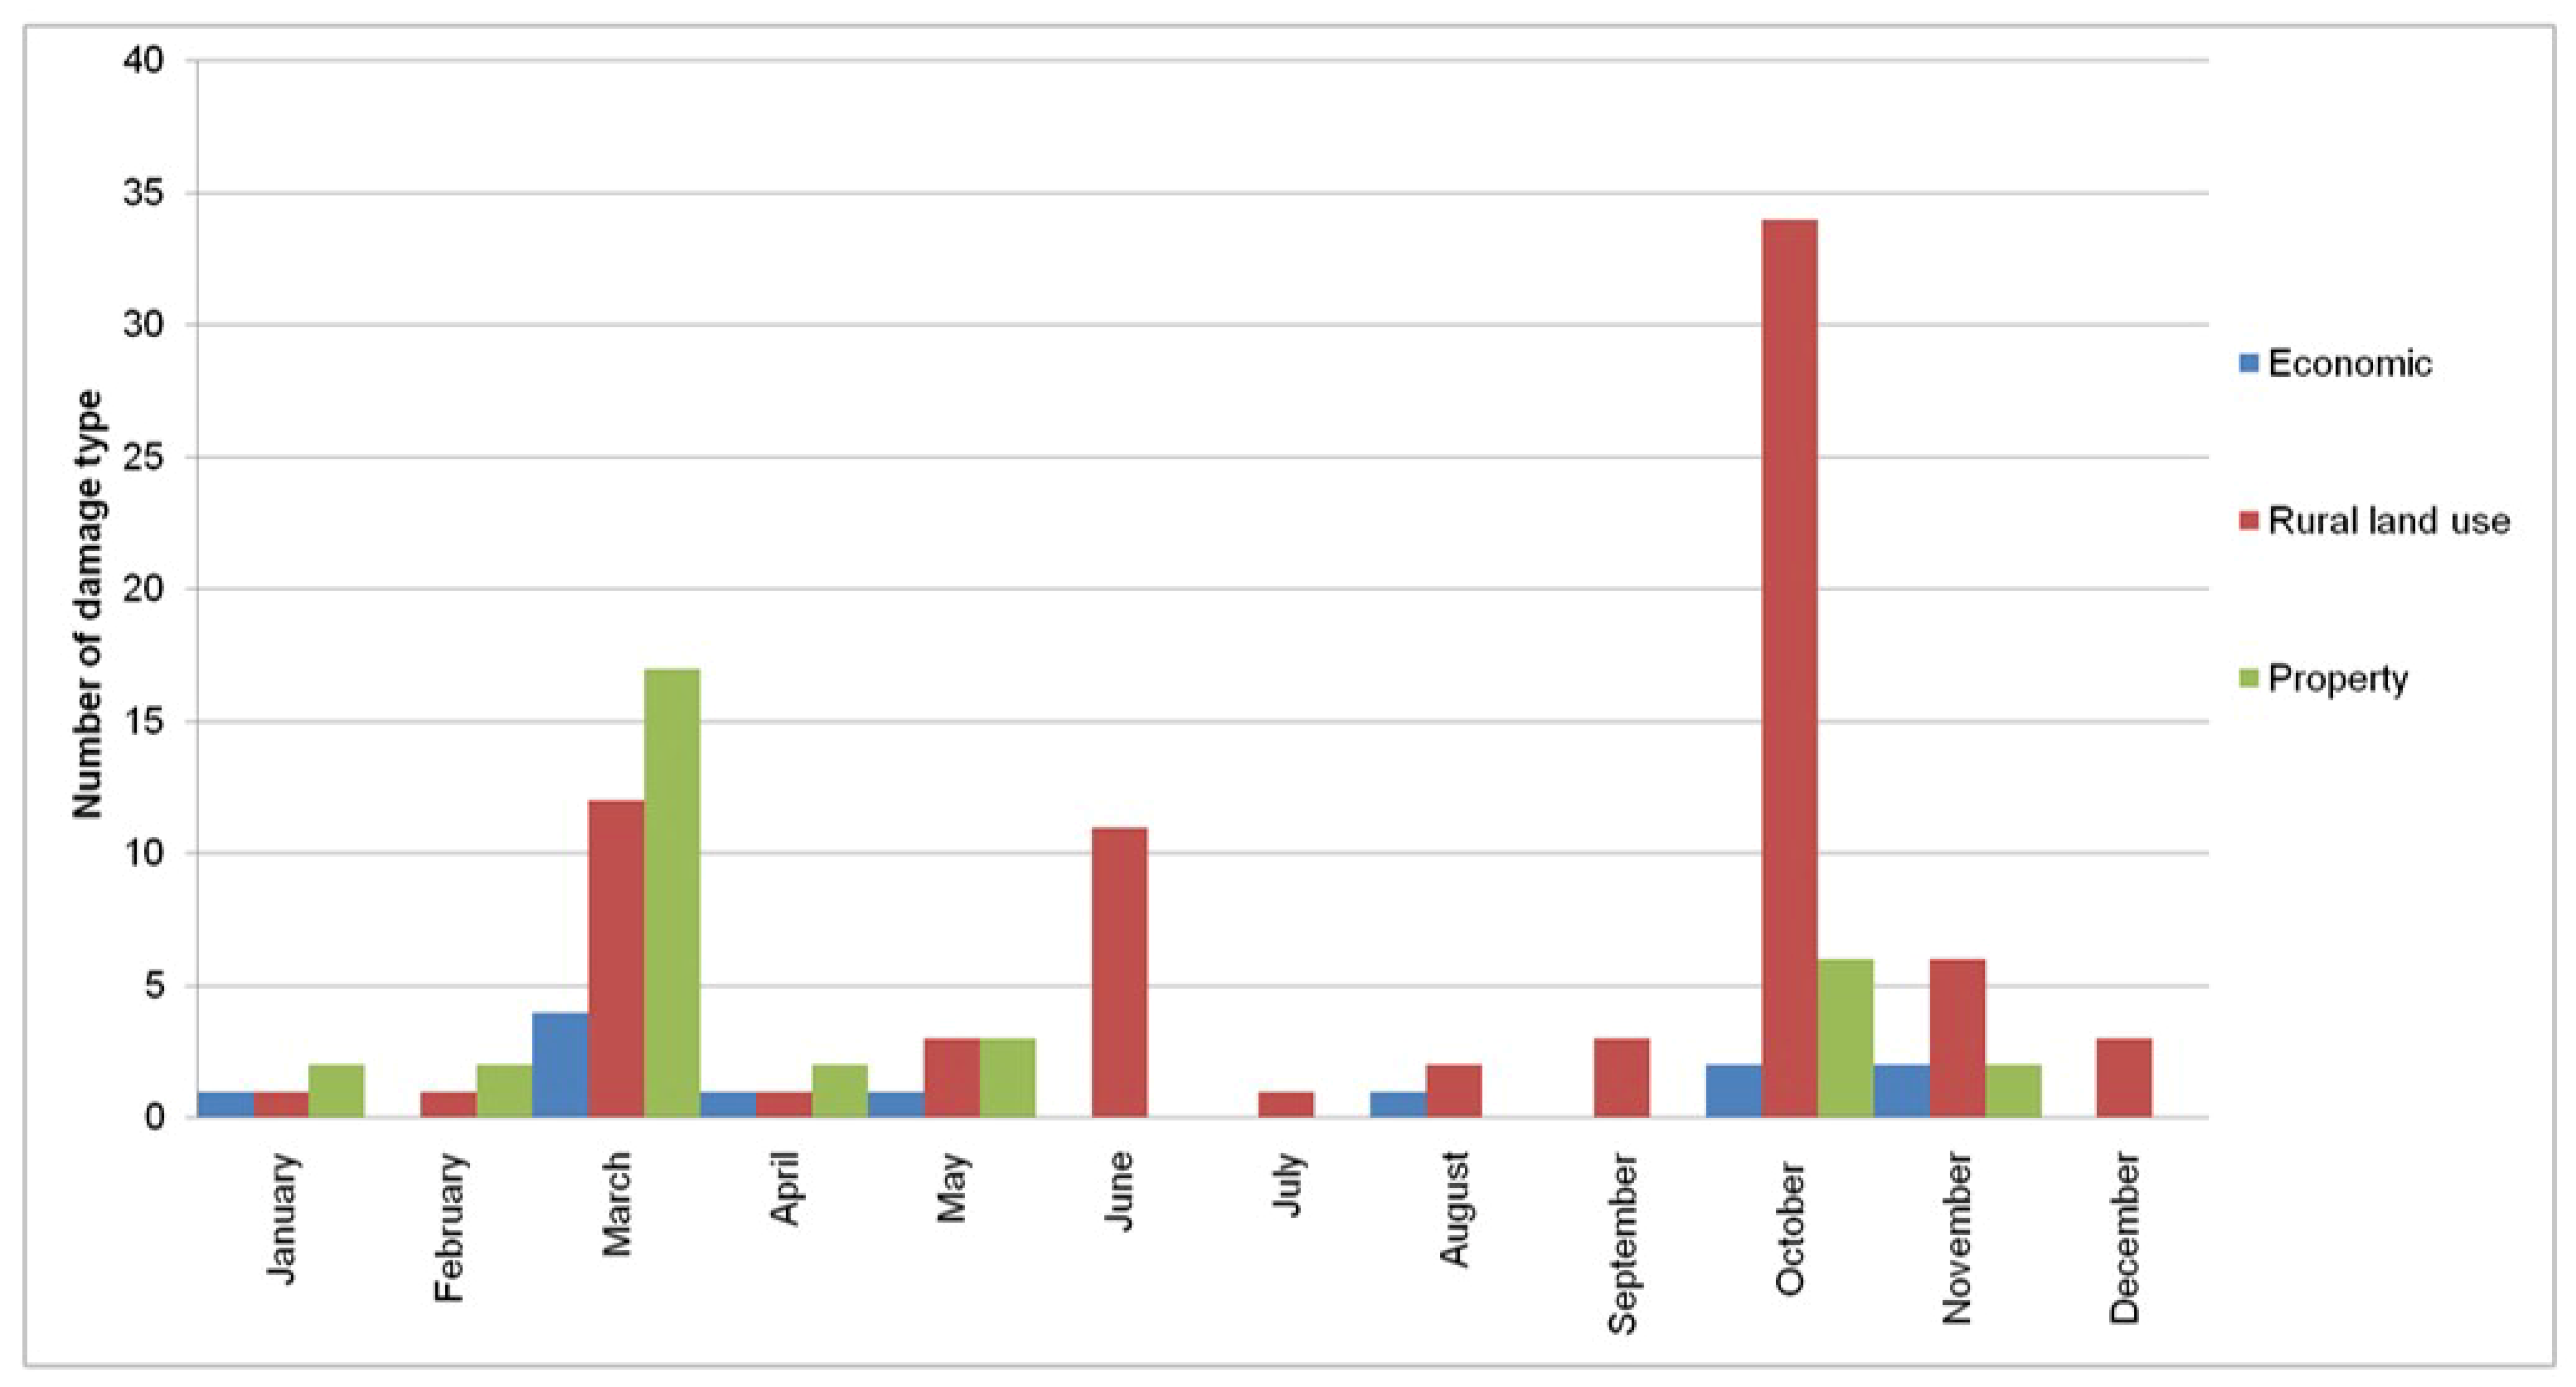
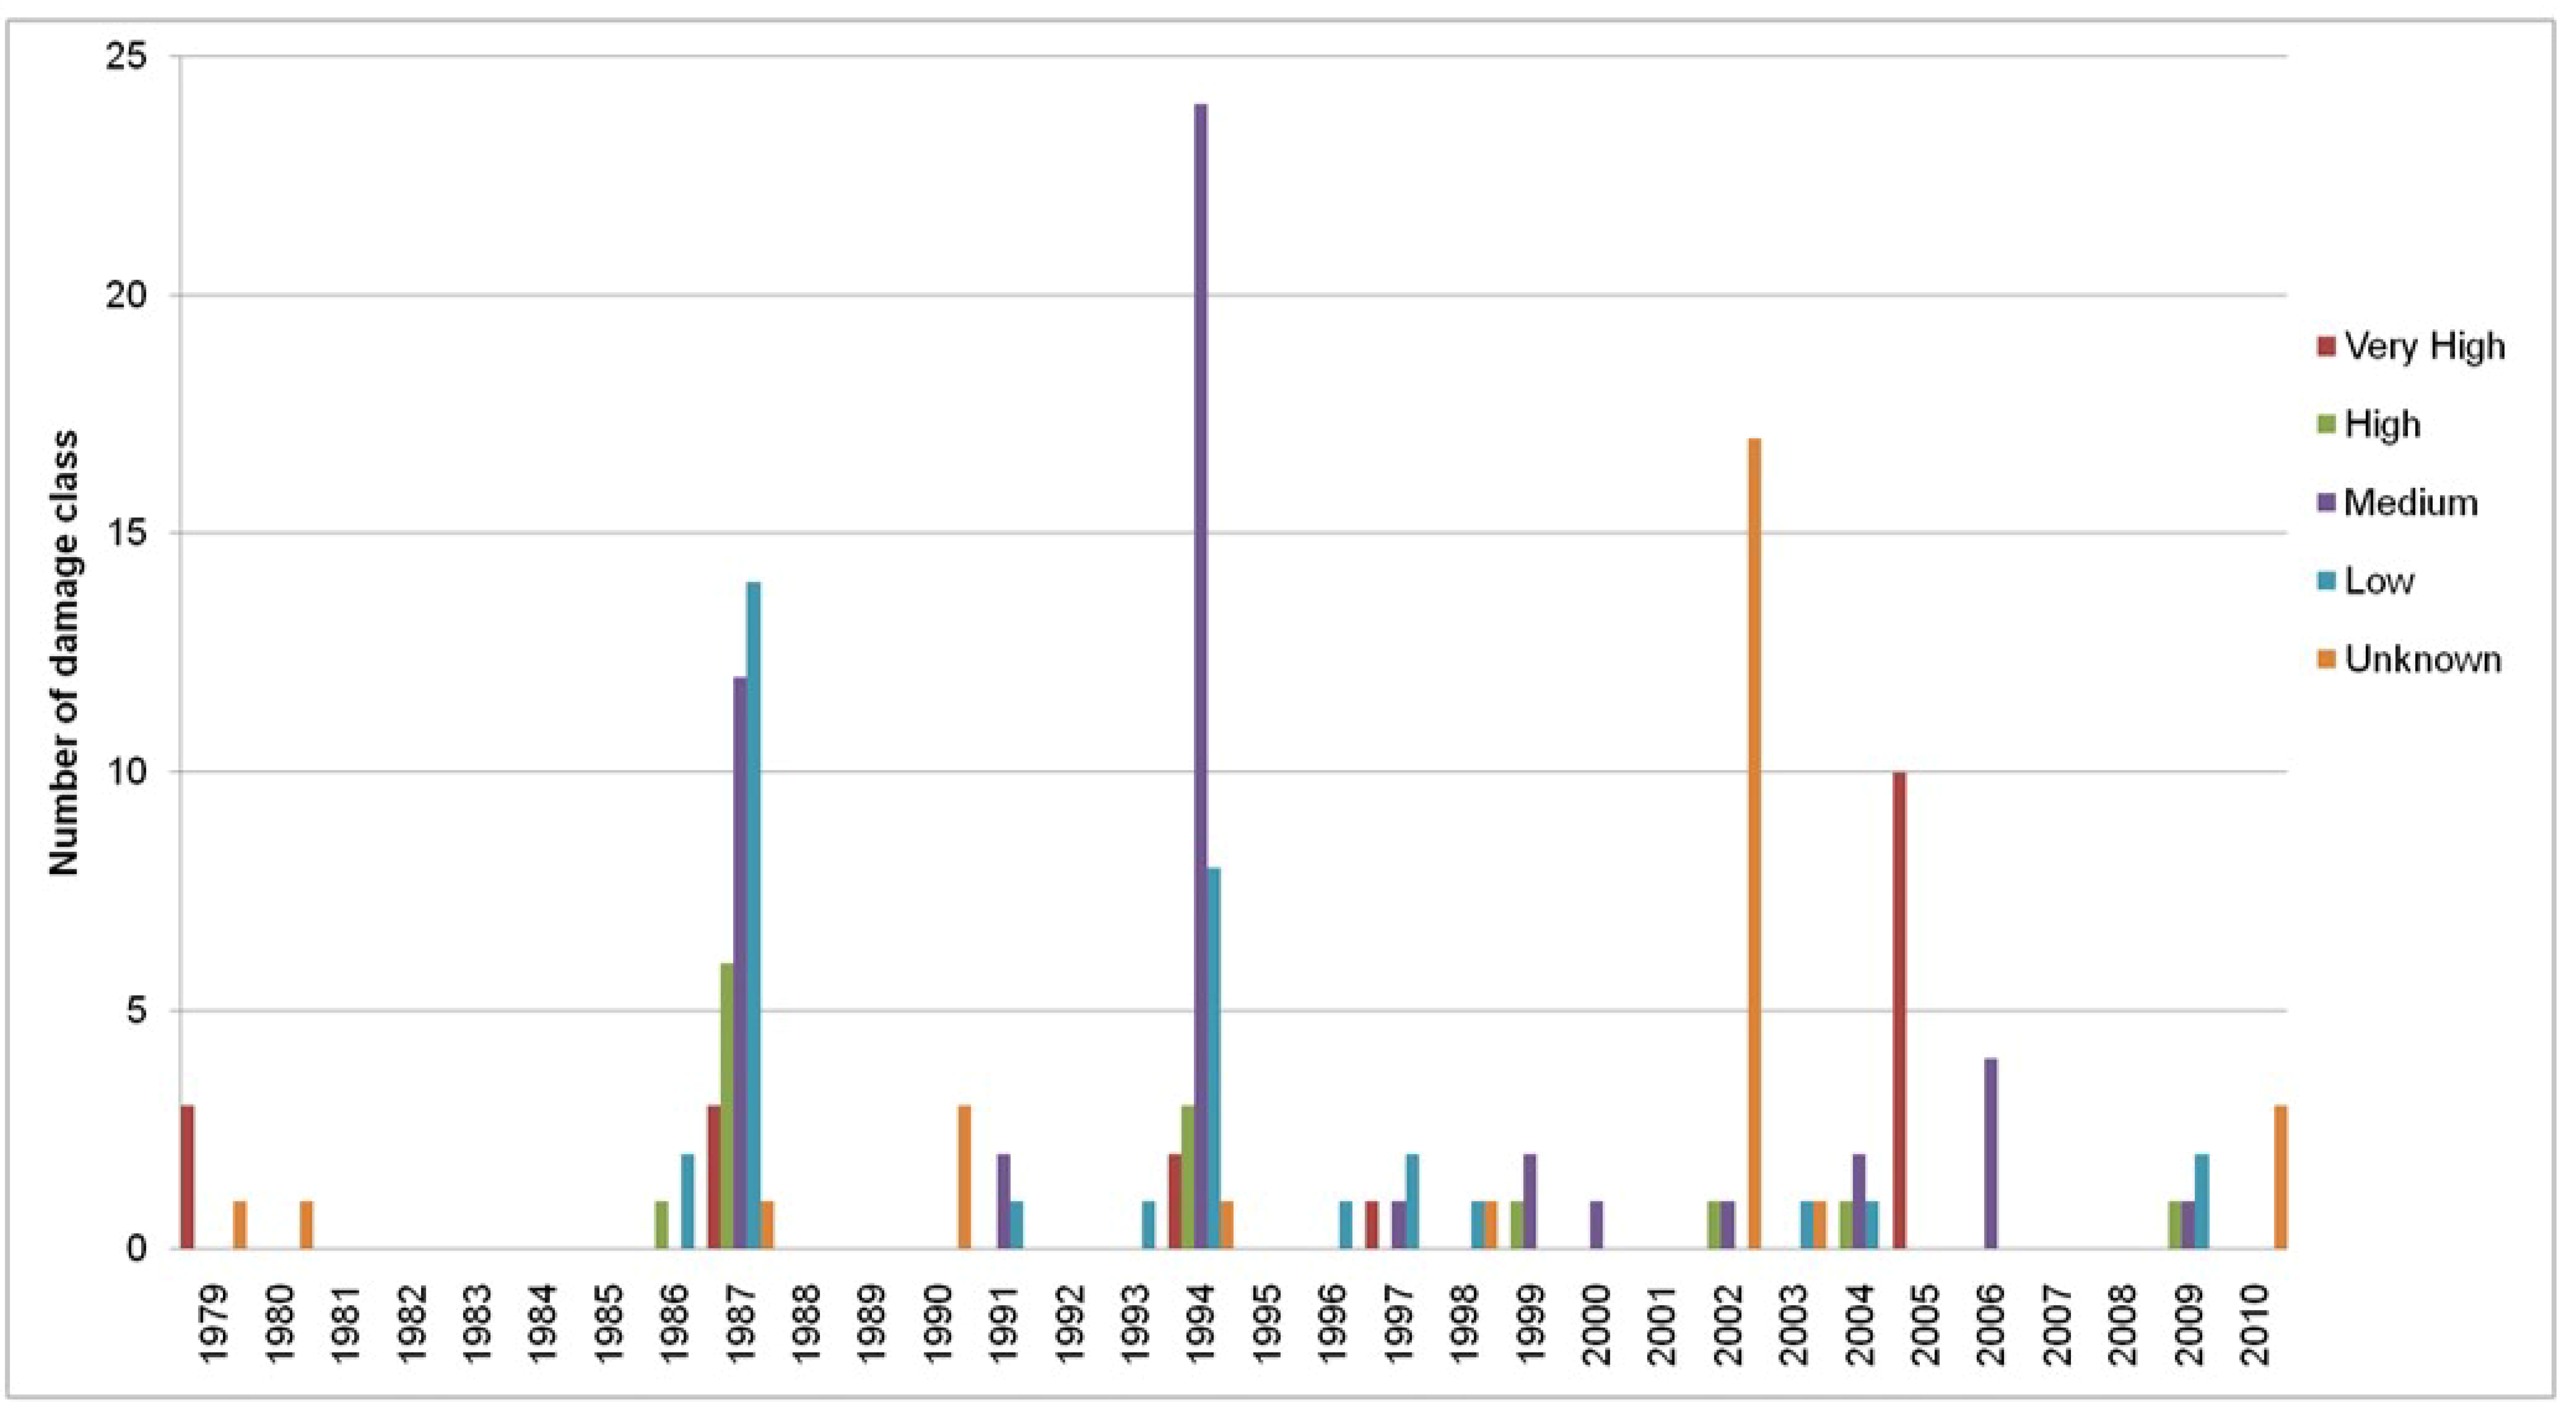
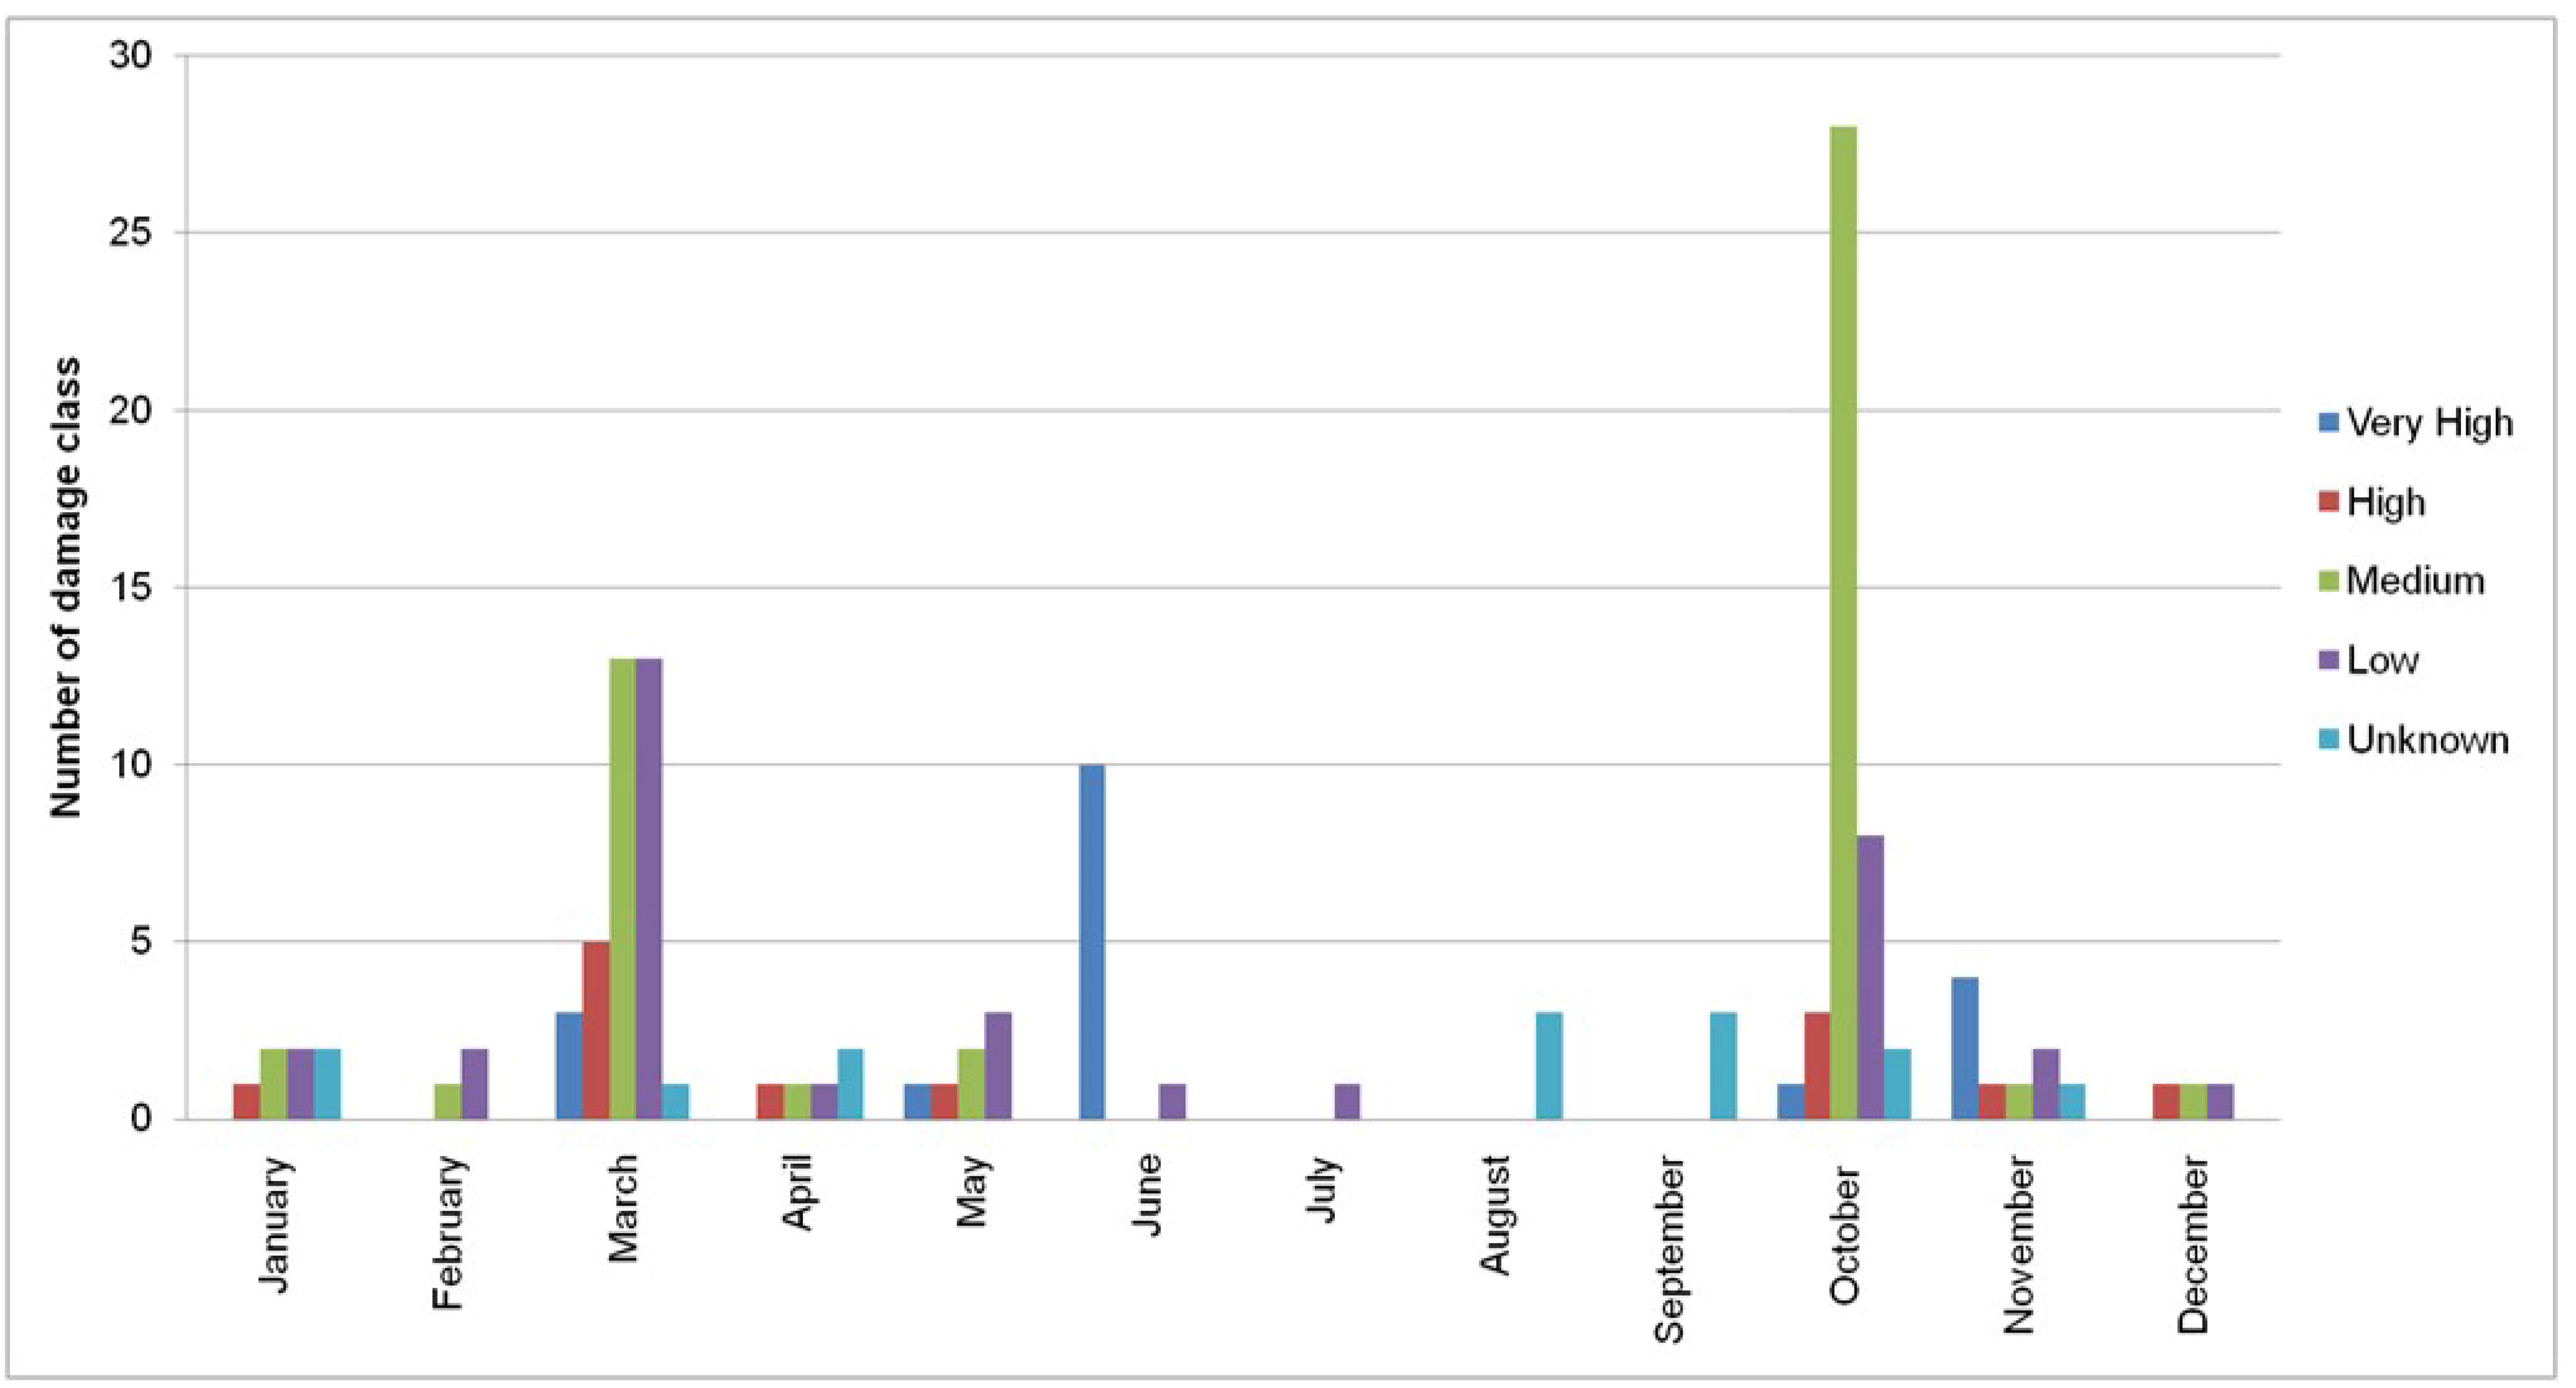
4.2. Temporal Distribution of Damages
4.3. Spatial Distribution of Flood Events
5. Discussion and Conclusions
Author Contributions
Funding
Conflicts of Interest
References
- Cerdà, A. Effect of Climate on Surface Flow along a Climatological Gradient in Israel: A Field Rainfall Simulation Approach. J. Arid Environ. 1998, 38, 145–159. [Google Scholar] [CrossRef]
- Bathrellos, G.D.; Skilodimou, H.D.; Maroukian, H. The spatial distribution of Middle and Late Pleistocene cirques in Greece. Geogr. Ann. A 2014, 96, 323–338. [Google Scholar] [CrossRef]
- Skilodimou, H.D.; Bathrellos, G.D.; Maroukian, H.; Gaki-Papanastassiou, K. Late Quaternary evolution of the lower reaches of Ziliana stream in south Mt. Olympus (Greece). Geogr. Fis. Din. Quat. 2014, 37, 43–50. [Google Scholar] [CrossRef]
- Bathrellos, G.D.; Skilodimou, H.D.; Maroukian, H.; Gaki-Papanastassiou, K.; Kouli, K.; Tsourou, T.; Tsaparas, N. Pleistocene glacial and lacustrine activity in the southern part of Mount Olympus (central Greece). Area 2017, 49, 137–147. [Google Scholar] [CrossRef]
- Kamberis, E.; Bathrellos, G.; Kokinou, E.; Skilodimou, H. Correlation between the structural pattern and the development of the hydrographic network in a portion of the Western Thessaly basin (Greece). Cent. Eur. J. Geosci. 2012, 4, 416–424. [Google Scholar] [CrossRef]
- Kokinou, E.; Skilodimou, H.D.; Bathrellos, G.D.; Antonarakou, A.; Kamberis, E. Morphotectonic analysis, structural evolution/pattern of a contractional ridge: Giouchtas Mt., Central Crete, Greece. J. Earth Syst. Sci. 2015, 124, 587–602. [Google Scholar] [CrossRef]
- Chousianitis, K.; Del Gaudio, V.; Sabatakakis, N.; Kavoura, K.; Drakatos, G.; Bathrellos, G.D.; Skilodimou, H.D. Assessment of Earthquake-Induced Landslide Hazard in Greece: From Arias Intensity to Spatial Distribution of Slope Resistance Demand. Bull. Seismol. Soc. Am. 2016, 106, 174–188. [Google Scholar] [CrossRef]
- Bathrellos, G.D.; Skilodimou, H.D.; Maroukian, H. The significance of tectonism in the glaciations of Greece. Geol. Soc. Spé;c. Publ. 2017, 433, 237–250. [Google Scholar] [CrossRef]
- Papadopoulou-Vrynioti, K.; Bathrellos, G.D.; Skilodimou, H.D.; Kaviris, G.; Makropoulos, K. Karst collapse susceptibility mapping considering peak ground acceleration in a rapidly growing urban area. Eng. Geol. 2013, 158, 77–88. [Google Scholar] [CrossRef]
- Τsolaki-Fiaka, S.; Bathrellos, G.D.; Skilodimou, H.D. Multi-criteria decision analysis for abandoned quarry restoration in Evros Region (NE Greece). Land 2018, 7, 43. [Google Scholar] [CrossRef]
- Skilodimou, H.D.; Bathrellos, G.D.; Koskeridou, E.; Soukis, K.; Rozos, D. Physical and anthropogenic factors related to landslide activity in the Northern Peloponnese, Greece. Land 2018, 7, 85. [Google Scholar] [CrossRef]
- Morisawa, M. Geomorphology Laboratory Manual; Willey & Sons: Hoboken, NJ, USA, 1976; 253p. [Google Scholar]
- Slaymaker, O. Geomorphic Hazards; John Wiley & Sons: Hoboken, NJ, USA, 1997; 204p. [Google Scholar]
- Bathrellos, G.D. An overview in Urban Geology and Urban Geomorphology. Bull. Geol. Soc. Greece 2007, 40, 1354–1364. [Google Scholar] [CrossRef]
- Bathrellos, G.; Skilodimou, H. Geomorphic Hazards and Disasters. Bull. Geol. Soc. Greece 2006, 39, 96–103. (In Greek) [Google Scholar]
- Goudie, S.A. Encyclopedia of Geomorphology; Goudie, S.A., Ed.; Taylor & Francis Group: New York, NY, USA, 2006; pp. 378–379. [Google Scholar]
- Merz, B.; Kreibich, H.; Schwarze, R.; Thieken, A. Assessment of economic flood damage. Nat. Hazards Earth Syst. Sci. 2010, 10, 1679–1724. [Google Scholar] [CrossRef]
- CEOS. The Use of Earth Observing Satellites for Hazard Support: Assessments and Scenarios; Final Report of the CEOS Disaster Management Support Group (DMSG); CEOS: Rome, Italy, 2003. [Google Scholar]
- European Environment Agency (EEA). Mapping the Impacts of Natural Hazards and Technological Accidents in Europe: An Overview of the Last Decade; Office for Official Publications of the European Communities: Luxembourg; European Environment Agency (EEA): Copenhagen, Denmark, 2010. [Google Scholar]
- Gaume, E.; Bain, V.; Bernardara, P.; Newinger, O.; Barbuc, M. A compilation of data on European flash floods. J. Hydrol. 2009, 367, 70–78. [Google Scholar] [CrossRef] [Green Version]
- Payrastre, O.; Gaume, E.; Andrieu, H. Use of historical data to assess the occurrence of floods in small watersheds in the French Mediterranean area. In Advances in Geosciences; European Geosciences Union: Munich, Germany, 2005; Volume 2, pp. 313–320. [Google Scholar]
- Tropeano, D.; Turconi, L. Using historical documents for landslide, debris flow and stream flood prevention. Applications in Northern Italy. Nat. Hazards 2004, 31, 663–679. [Google Scholar] [CrossRef]
- Van Alphen, J.; Martini, F.; Loat, R.; Slomp, R.; Passchier, R. Flood risk mapping in Europe, experiences and best practices. J. Flood Risk Manag. 2009, 2, 285–292. [Google Scholar] [CrossRef]
- Rijal, S.; Rimal, B.; Sloan, S. Flood Hazard Mapping of a Rapidly Urbanizing City in the Foothills (Birendranagar, Surkhet) of Nepal. Land 2018, 7, 60. [Google Scholar] [CrossRef]
- Samanta, S.; Koloa, C.; Kumar Pal, D.; Palsamanta, B. Flood Risk Analysis in Lower Part of Markham River Based on Multi-Criteria Decision Approach (MCDA). Hydrology 2016, 3, 29. [Google Scholar] [CrossRef]
- Jakob, Μ. Debris flow hazard analysis. In Debris-Flow Hazards and Related Phenomena; Jakob, M., Hungr, O., Eds.; Springer: Berlin, Germany, 2005; p. 794. [Google Scholar]
- Langbein, W.B. Annual floods and the partial-duration flood series. Trans. Am. Geophys. Union 1949, 30, 879–881. [Google Scholar] [CrossRef]
- Onyutha, C. On rigorous drought assessment using daily time scale: Non-stationary frequency analyses, revisited concepts, and a new method to yield non-parametric indices. Hydrology 2017, 4, 48. [Google Scholar] [CrossRef]
- Lang, M.; Ouarda, T.B.M.J.; Bobée, B. Towards operational guidelines for over-threshold modeling. J. Hydrol. 1999, 225, 103–117. [Google Scholar] [CrossRef]
- Willems, P. A time series tool to support the multi-criteria performance evaluation of rainfall-runoff models. Environ. Model. Softw. 2009, 24, 311–321. [Google Scholar] [CrossRef]
- Smith, R.L. Threshold Methods for Sample Extremes. In Statistical Extremes and Applications; de Oliveira, J.T., Ed.; NATO ASI Series; Springer: Dordrecht, The Netherlands, 1985; Volume 131, pp. 623–638. [Google Scholar]
- De Moel, H.; van Alphen, J.; Aerts, J.C.J.H. Flood maps in Europe—Methods, availability and use. Nat. Hazards Earth Syst. Sci. 2009, 9, 289–301. [Google Scholar] [CrossRef] [Green Version]
- Diakakis, M.; Mavroulis, S.; Deligiannakis, G. Floods in Greece, a statistical and spatial approach. Nat. Hazards 2012, 62, 485–500. [Google Scholar] [CrossRef]
- Skilodimou, H.; Stefouli, M.; Bathrellos, G. Spatio-temporal analysis of the coastline of Faliro Bay, Attica, Greece. Estud. Geol.-Madrid. 2002, 58, 87–93. [Google Scholar] [CrossRef]
- Skilodimou, H.; Livaditis, G.; Bathrellos, G.; Verikiou-Papaspiridakou, E. Investigating the flooding events of the urban regions of Glyfada and Voula, Attica, Greece: A contribution to Urban Geomorphology. Geogr. Ann. A 2003, 85, 197–204. [Google Scholar] [CrossRef]
- Migiros, G.; Bathrellos, G.; Skilodimou, H.; Karamousalis, T. Pinios (Peneus) River (Central Greece): Hydrological-geomorphological elements and changes during the quaternary. Cent. Eur. J. Geosci. 2011, 3, 215–228. [Google Scholar] [CrossRef]
- Mylopoulos, N.; Kolokytha, E.; Loukas, A.; Mylopoulos, Y. Agricultural and water resources development in Thessaly, Greece in the framework of new European Union policies. Int. J. River Basin Manag. 2009, 7, 73–89. [Google Scholar] [CrossRef]
- Goumas, K. The irrigation in Thessaly plain: Effects to underground and surface waters. In Proceedings of the Greek Hydrotechnical Association Conference, Larissa, Greece, 2 February 2006; pp. 39–53. (In Greek). [Google Scholar]
- Katsikatsos, G.; Migiros, G.; Vidakis, M. La structure géologique de la région de la Théssalie orientale (Grèce). Ann. Soc. Géol. Nord 1982, CI, 177–188. [Google Scholar]
- Migiros, G. The lithostratigraphic-tectonic structure of Orthris (Central Greece). Bull. Geol. Soc. Greece 1990, 26, 107–120. (In Greek) [Google Scholar]
- Ferriere, J.; Reynaud, J.; Pavlopoulos, A.; Bonneau, M.; Migiros, G.; Proust, J.N.; Gardin, S. Geological evolution and geodynamic controls of Tertiary intramontane piggyback Meso-Hellenic Basin, Greece. Bull. Soc. Geol. Fr. 2004, 175, 361–381. [Google Scholar] [CrossRef]
- Mimikou, M.; Koutsoyiannis, D. Extreme Floods in Greece: The Case of 1994. In Proceedings of the U.S.-Italy Research Workshop on the Hydrometeorology, Impacts and Management of Extreme Floods, Perugia, Italy, 13–17 November 1995. [Google Scholar]
- Ministry of Environment and Energy. Special Secretariat for Water. Floods, Historic Floods. 2017. Available online: http://www.ypeka.gr/Default.aspx?tabid=252&locale=el-GR&language=en-US (accessed on 17 June 2018).
- European Commission. Directive 2007/60/EC of the European Parliament and of the Council on the Assessment and Management of Flood Risks; European Environment Agency: Copenhagen, Denmark, 2007. [Google Scholar]
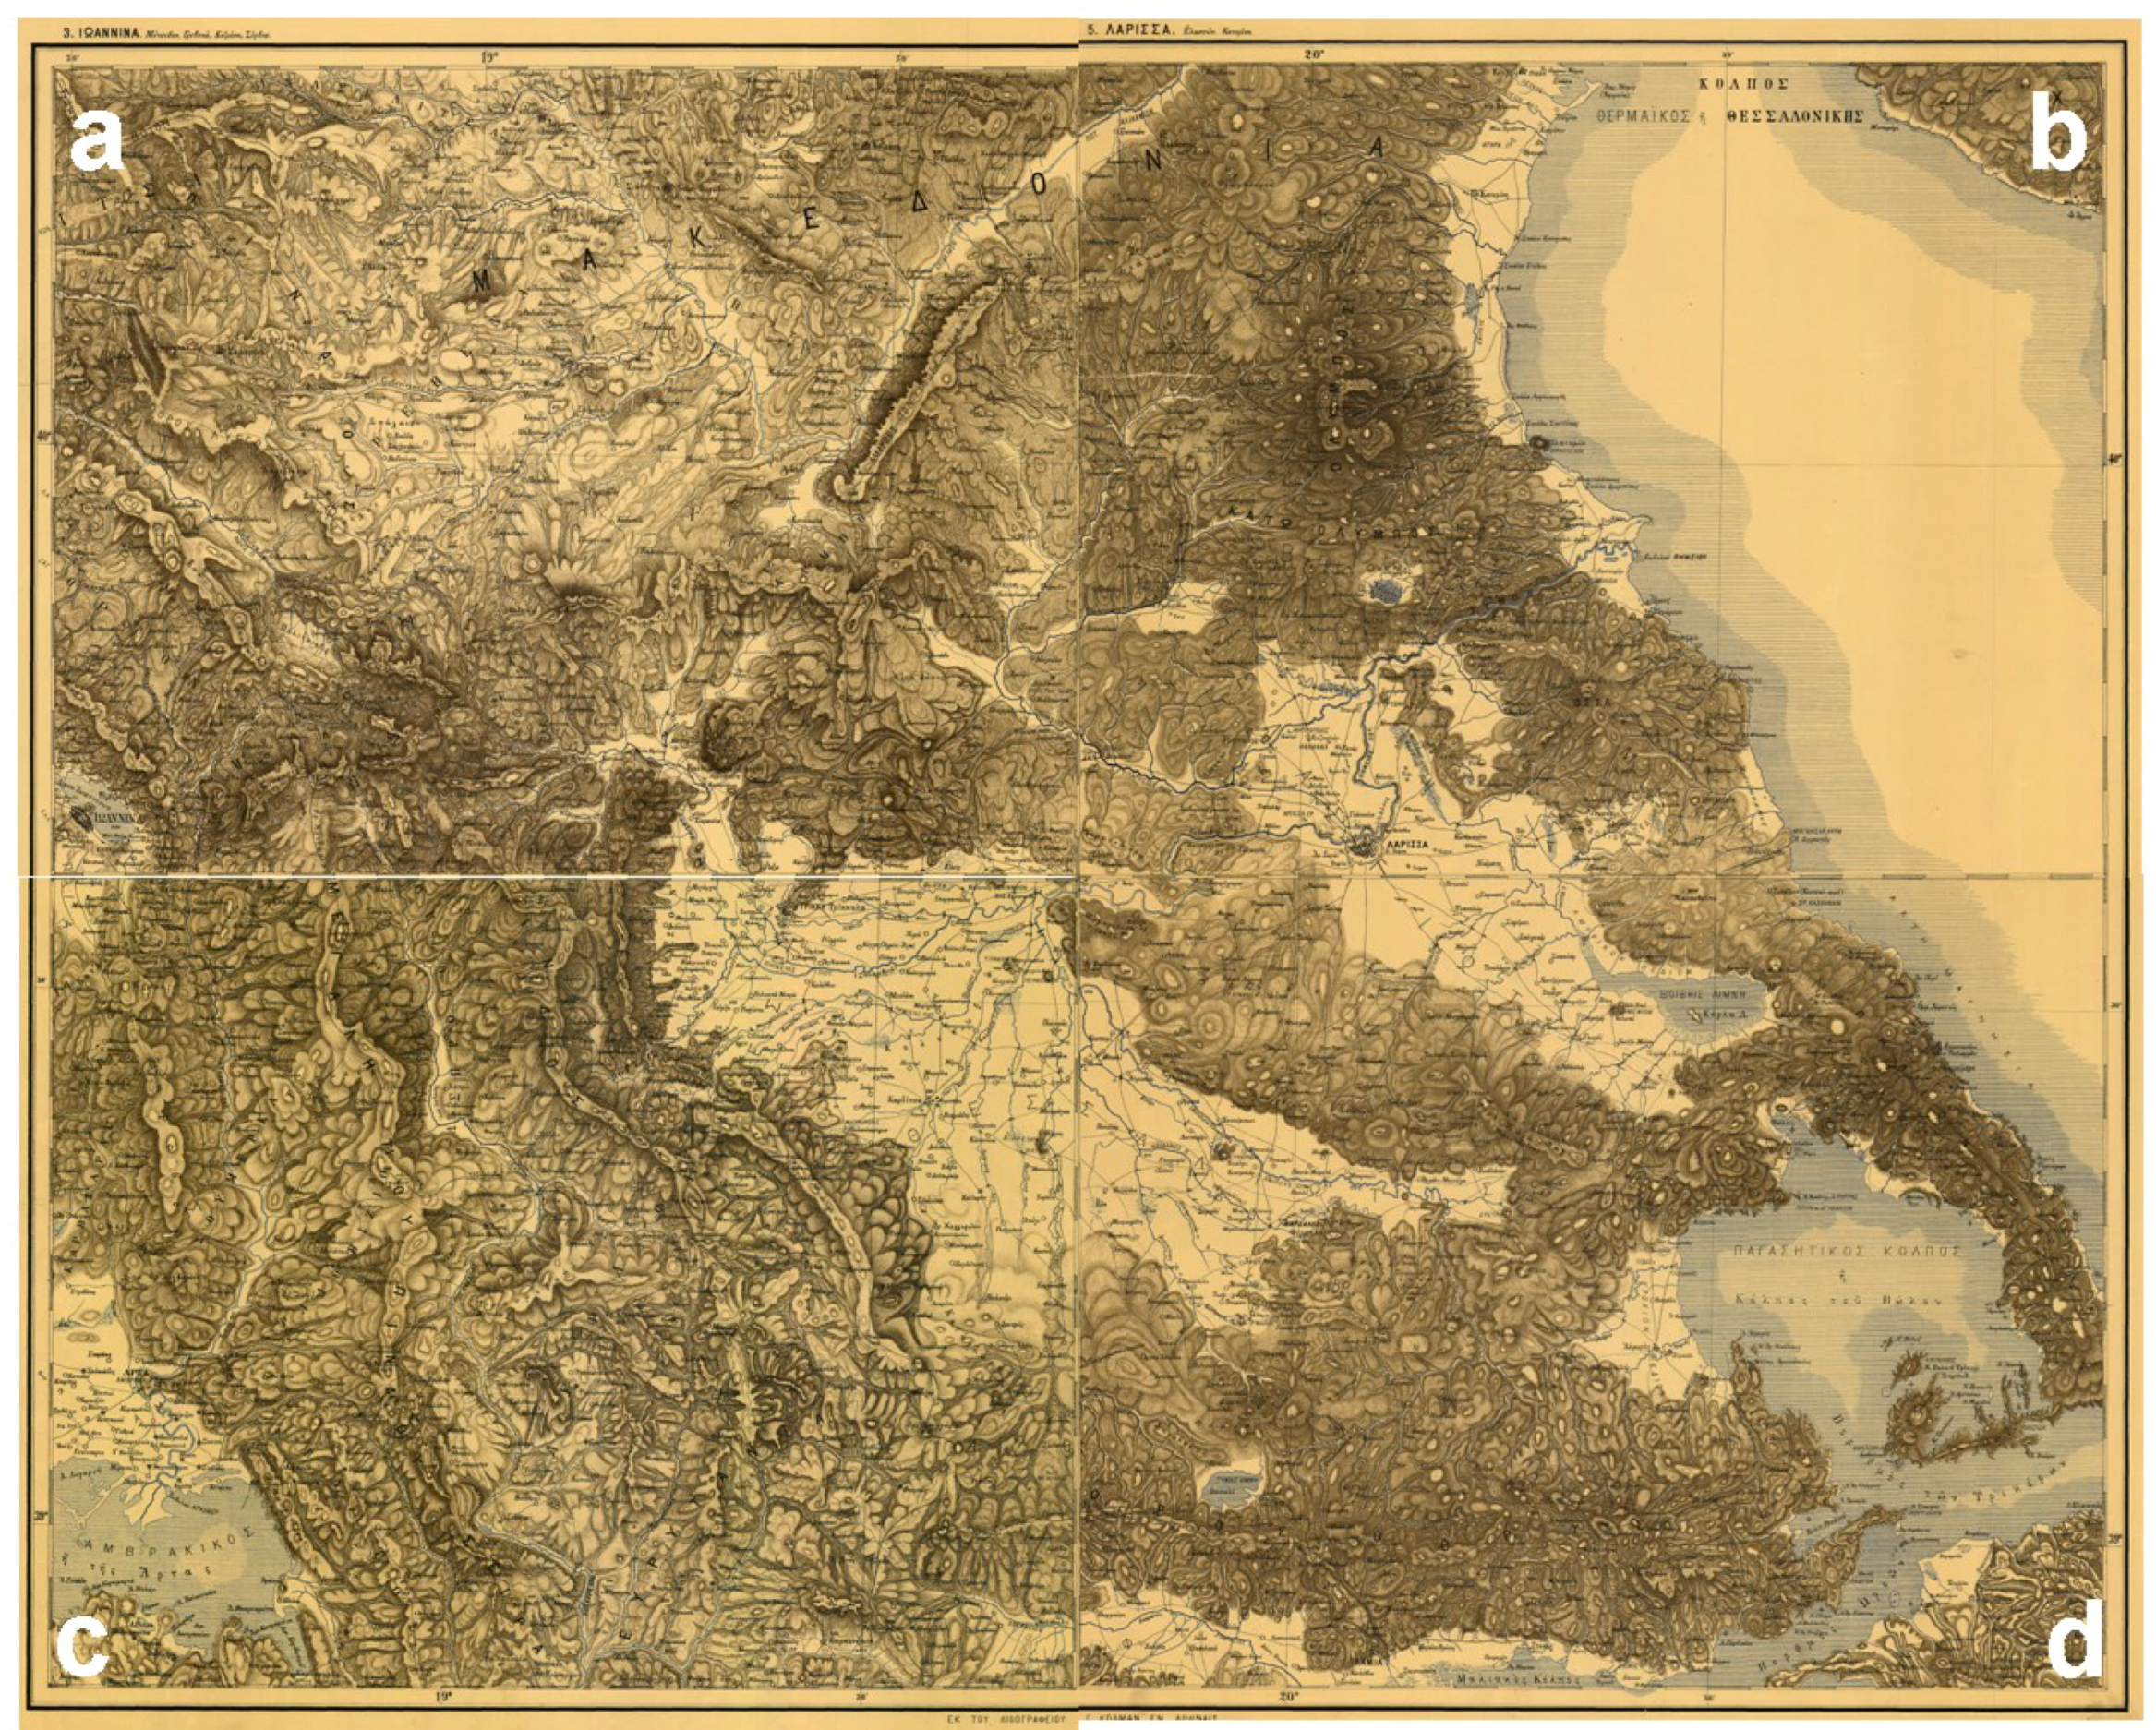
- Hrisohoou, M. Sheet “Ioannina-Metsovon-Grevena-Kozani-Servia”; Topographic Map, Scale 1:200,000; Colman George: Athens, Greece, 1881. [Google Scholar]
- Hrisohoou, M. Sheet “Larissa-Elasson-Katerini”; Topographic Map, Scale 1:200,000; Colman George: Athens, Greece, 1881. [Google Scholar]
- Hrisohoou, M. Sheet “Arta-Trikala-Karditsa”; Topographic Map, Scale 1:200,000; Colman George: Athens, Greece, 1881. [Google Scholar]
- Hrisohoou, M. Sheet “Volos-Farsalos-Lamia”; Topographic Map, Scale 1:200,000; Colman George: Athens, Greece, 1881. [Google Scholar]
- Ministry of Environment, Energy and Climate Change. Preliminary Flood Risk Assessment in Greece; Ministry of Environment and Energy: Athens, Greece, 2012. (In Greek)
- Ministry of Environment and Energy. Special Secretariat for Water, Management Plan for the Drainage Basins of Eastern Peloponnese; Ministry of Environment and Energy: Athens, Greece, 2017. (In Greek)
- Bathrellos, G.D.; Skilodimou, H.D.; Chousianitis, K.; Youssef, A.M.; Pradhan, B. Suitability estimation for urban development using multi-hazard assessment map. Sci. Total Environ. 2017, 575, 119–134. [Google Scholar] [CrossRef] [PubMed]
- Bathrellos, G.D.; Karymbalis, E.; Skilodimou, H.D.; Gaki-Papanastassiou, K.; Baltas, E.A. Urban flood hazard assessment in the basin of Athens Metropolitan city, Greece. Environ. Earth Sci. 2016, 75, 319. [Google Scholar] [CrossRef]
- Rozos, D.; Bathrellos, G.D.; Skilodimou, H.D. Comparison of the implementation of Rock Engineering System (RES) and Analytic Hierarchy Process (AHP) methods, based on landslide susceptibility maps, compiled in GIS environment. A case study from the Eastern Achaia County of Peloponnesus, Greece. Environ. Earth Sci. 2011, 63, 49–63. [Google Scholar] [CrossRef]
- Pradhan, B. Flood susceptible mapping and risk area delineation using logistic regression, GIS and remote sensing. J Spat. Hydrol. 2010, 9, 1–18. [Google Scholar]
- Koutsoyiannis, D.; Mimikou, M. Management and Prevention of Crisis Situations: Floods, Droughts and Institutional Aspects; 3rd EURAQUA Technical Review; Country Paper for Greece: Rome, Italy, 1996; pp. 63–77. [Google Scholar]
- Koukis, G.; Koutsoyiannis, D.; Embleton, C.; Embleton-Hamann, C. (Eds.) Geomorphological Hazards of Europe; Elsevier: New York, NY, USA, 1997; Volume 5, pp. 215–242. [Google Scholar]
- Bathrellos, G. Geological, Geomorphological and Geographic Study of Urban Areas in Trikala Prefecture—Western Thessaly. Ph.D. Thesis, National & Kapodistrian University of Athens, Athens, Greece, 2005; p. 561, (In Greek with Extended English Abstract). [Google Scholar]
- Bathrellos, G.D.; Gaki-Papanastassiou, K.; Skilodimou, H.D.; Papanastassiou, D.; Chousianitis, K.G. Potential suitability for urban planning and industry development by using natural hazard maps and geological—Geomorphological parameters. Environ. Earth Sci. 2012, 66, 537–548. [Google Scholar] [CrossRef]
- Intergovernmental Panel on Climate Change (IPCC). Climate Change 2014 Synthesis Report Summary for Policymakers, August 2018. Available online: https://www.ipcc.ch/pdf/assessment-report/ar5/syr/AR5_SYR_FINAL_SPM.pdf (accessed on 17 June 2018).
- Bathrellos, G.D.; Gaki-Papanastassiou, K.; Skilodimou, H.D.; Skianis, G.A.; Chousianitis, K.G. Assessment of rural community and agricultural development using geomorphological-geological factors and GIS in the Trikala prefecture (Central Greece). Stoch. Environ. Res. Risk Assess. 2013, 27, 573–588. [Google Scholar] [CrossRef]


| Classes of Total Damages | Human Casualties | Compensation (Euro) | Flooded Area (Hectares) |
|---|---|---|---|
| Low | <50,000 | <200 | |
| Medium | 50,000–200,000 | 200–500 | |
| High | 200,000–500,000 | 500–1000 | |
| Very High | ≥1 | >500,000 | >1000 |
| Sub-Basin | Number of Floods |
|---|---|
| Upper reaches of Pinios River | 4 |
| Trikala-Neochoritis River | 21 |
| Karditsa-Enippeas River | 63 |
| Larisa-Karla | 33 |
| Tempi Valley | 6 |
| Titarisios River | 7 |
| Lower reaches of Pinios River | 12 |
© 2018 by the authors. Licensee MDPI, Basel, Switzerland. This article is an open access article distributed under the terms and conditions of the Creative Commons Attribution (CC BY) license (http://creativecommons.org/licenses/by/4.0/).
Share and Cite
Bathrellos, G.D.; Skilodimou, H.D.; Soukis, K.; Koskeridou, E. Temporal and Spatial Analysis of Flood Occurrences in the Drainage Basin of Pinios River (Thessaly, Central Greece). Land 2018, 7, 106. https://0-doi-org.brum.beds.ac.uk/10.3390/land7030106
Bathrellos GD, Skilodimou HD, Soukis K, Koskeridou E. Temporal and Spatial Analysis of Flood Occurrences in the Drainage Basin of Pinios River (Thessaly, Central Greece). Land. 2018; 7(3):106. https://0-doi-org.brum.beds.ac.uk/10.3390/land7030106
Chicago/Turabian StyleBathrellos, George D., Hariklia D. Skilodimou, Konstantinos Soukis, and Efterpi Koskeridou. 2018. "Temporal and Spatial Analysis of Flood Occurrences in the Drainage Basin of Pinios River (Thessaly, Central Greece)" Land 7, no. 3: 106. https://0-doi-org.brum.beds.ac.uk/10.3390/land7030106