Predicting Intensification on the Brazilian Agricultural Frontier: Combining Evidence from Lab-In-The-Field Experiments and Household Surveys


1
Núcleo de Avaliação de Políticas Climáticas, Pontifícia Universidade Católica do Rio de Janeiro (PUC-Rio), R. Marquês de São Vicente, 225-Gávea, Rio de Janeiro, RJ 22451-900, Brazil
2
Climate Policy Initiative, Estrada da Gávea, 50, Gávea, Rio de Janeiro, RJ 22451-263, Brazil
3
Friedman School of Nutrition Science and Policy, Fletcher School of Law and Diplomacy, Tufts University, 150 Harrison Ave, Boston, MA 02111, USA
*
Authors to whom correspondence should be addressed.
†
These authors contributed equally to this work.
Land 2019, 8(1), 21; https://0-doi-org.brum.beds.ac.uk/10.3390/land8010021
Submission received: 4 December 2018
/
Revised: 24 December 2018
/
Accepted: 15 January 2019
/
Published: 16 January 2019
Abstract
:The expansion of crop agriculture onto low productivity cattle pastures in the agricultural frontier of Brazil is a form of agricultural intensification that can help to contribute to global food and climate goals. However, the amount of pasture to crop conversion in the region lags both agronomic and economic potential. We administered a survey in combination with a lab-in-the-field experiment to 559 farmers in Mato Grosso, Brazil. We used the results to explore behavioral determinants of pasture to crop conversion. We compared subjects’ choices across two rounds of a risk game meant to mimic the economic risk of decisions to convert pasture to crops. We found framing the risk game to concern agriculture profoundly altered subjects’ experimental choices. These discrepancies involved the majority of experimental subjects, and were highly heterogenous in nature. They were also somewhat predictive of subjects’ behavior converting pasture to cropland. Our findings indicate that farmers may make economic decisions involving agriculture and/or agricultural land differently from other economic decisions. Our finding are of relevance for research into the propensity of farmers to intensify and for policies seeking to influence rates of agricultural intensification.
1. Introduction
In Brazil, as in many emerging economies and less developed countries, agricultural systems are critical for economic growth and development, major drivers of greenhouse gas (GHG) emissions, and a major focus for GHG emissions abatement [1]. Simultaneously achieving agricultural growth and climate change mitigation is therefore critical. Of many mechanisms to abate emissions from land use, land use change, and forestry, agricultural intensification is notable in its potential to combine growth and emissions abatement, primarily when productivity gains can “spare” land for conservation [2,3,4,5,6,7,8,9].
Under Brazil’s climate commitments and policies, land sparing via intensification of agricultural systems and protection of the Amazon forest loom large [10,11]. Of this land sparing, the intensification of pasturelands, including the conversion of pasture to cropland, is a critical part of the pledge [12]. This process is not strictly an end of its own but often an intermediate step to the adoption of other Nationally Determined Contribution (NDC) components such as the various variants of integrated crop-livestock and forestry systems. Conversely, the restoration of degraded pastures, another specific component of Brazil’s NDC pledge, is often closely associated with either permanent or temporary conversion of pastures to crops [12]. Restoration of pastures requires skills and equipment that crop farmers often have but ranchers often do not [12]. Subsequently, crop farmers frequently farm the pasture they have recuperated even if it is eventually to be returned to ranching.
The conversion of Brazil’s pasture to crops may not maximize greenhouse gas abatement potential per unit pastureland [13]. The restoration of many pastures to forests or to some highly intensive cattle systems may bring greater emissions reductions [13]. However, pasture to crop conversion is highly feasible for several reasons. First, the technology is proven. It was adopted on tens of millions of hectares of agricultural land in Brazil over the period 2000–2014 [14]. Second, millions of additional hectares of pastureland are suitable for cropping and/or other forms of intensification [15]. Third, an extensive methodologically varied modeling literature suggests that modest incentives (disincentives) to intensify (extensify) agricultural land use could considerably increase the intensity of agricultural land use in Brazil including via conversion to crops [4,12,16,17].
However, this last point is the shakiest of the three because pasture to crop conversion modeling exhibits high within and across model uncertainty in predicting the propensity of ranching systems to intensify. For example, the greenhouse gas footprint of biofuels has been shown to critically depend on within-model parameter uncertainty governing the rate of pasture to cropland conversion [18]. Similarly, across pairs of models performing identical scenario experiments, rates of pasture vs. cropland classification disagreement exceed 50 percent in Brazil and many of the world’s major agricultural frontiers [19].
Such uncertainty stems from a variety of sources that can be classified as uncertainty and/or bias with respect to: the quality and distribution of natural resource endowments, political economy, the heterogenous economic and behavioral characteristics of households, and the representation of these heterogeneous agents in aggregate [20,21,22,23,24].
Our focus is to extend understanding of household level heterogeneity shaping rates of pasture to crop conversion. We do this via a household survey combined with a lab in the field experiment. We collect these data with a sample of large rural producers in Mato Grosso State, Brazil. The population and the geography were selected for their importance in determining Brazil’s ability to balance its agricultural development and GHG mitigation goals.
Pasture to crop conversion is a type of agricultural technology adoption that brings about agricultural intensification and we therefore seek to build on research exploring patterns and processes of the adoption of intensive agricultural technologies. As with other forms of agricultural intensification, we can understand spatial heterogeneity in rates of pasture to cropland conversion in Brazil at least in part geographically. Sources of geographic heterogeneity include: market access, cost of transporting goods to market, costs of inputs, profitability relative to other land use, cost competitiveness relative to other agricultural products, non-production utility of holding land, laws and policies, institutions and the rule of law, land degradation, land suitability, climate, locally suited agricultural inputs, and agglomeration economies [12,25,26,27]. Many of these geographies are dynamic. For example, cyclical and other tendencies in the enforcement of conservation policies can be expected to affect rates of intensification [28]. Some regions undergoing high rates of pasture to cropland conversion have seen fairly recent and sizable declines in costs of transporting goods to market as infrastructure expands and improves [29].
However, the aforementioned factors tend to explain a small share of household level heterogeneity in the take-up of intensive agricultural technologies. From its inception to present, the study of household level drivers of agricultural technology adoption has richly highlighted the role of peer effects and social learning [30,31,32,33]. Other factors include individual learning and capacity to learn, heterogeneous information access and exposure [34], rural population density [35], age and household age structure [36], and credit [37]. All the aforementioned factors can fit neatly into a profit maximizing framework. Particularly where the relative merits of the adoptable technology vs. the status quo are well known, we might expect such a framework to allow us to explain patterns of technology adoption [38].
Along Brazil’s pasture-crop frontier, many factors contribute to considerable uncertainty about the returns to ranching vs. cropping. These include dynamics of input and output markets, evolving technologies and infrastructure, and heterogeneous and dynamical nature of institutions. Under such uncertainty we therefore might expect behavioral factors to explain adoption heterogeneity [39,40]. We can define the relative risk of adoption of a technology by properties of the distribution of profitability of the adopted vs. status quo technology [41]. For example, row cropping often exhibits a greater variance of profitability than ranching systems. Under such circumstances, we could explain heterogeneous behavior by heterogeneity of risk preferences. Meanwhile, some technologies have profit distributions skewed towards high gains and high losses. Incumbent technologies also entail sunk costs for producers. One or both of these can lead loss aversion to predict technology take up [40,42]. Finally, incumbent technologies are familiar technologies. All else equal, we might expect ambiguity averse producers to exhibit an incumbent advantage. Given these rationales, our research gathers data on risk preference, loss aversion, and ambiguity aversion using well developed methods. We then use these to predict producers’ past pasture to crop conversion behavior.
Another crucial factor for modeling pasture to cropland conversion is that it occurs not only via technology adoption by a single producer, but also through land sales or land rentals. In the recent past in Mato Grosso State, Brazil, a critical region for pasture to crop conversion, self-conversion, leasing, and land sales each contributed evenly to conversion [12]. The leasing and sales mechanisms for pasture to crop conversion introduce two notable complicating factors. First, they may involve more than one agent. Second, by leasing or selling, a cattle rancher must decide to temporarily or permanently cease working their land. For the purposes of this study, we ignore the first point as we theorize essentially limitless demand for prime Brazilian farmland and therefore presume sufficient potential lessors or buyers. The participation of major domestic and foreign investors in the lease and purchase of land in region is the basis for this assumption. The latter point inspires another major focus of our study. Holding and/or working the land can be the source of considerable utility for rural producers [43]. This utility, which we will refer to as “non-production utility”, can be expected to stem from factors such as culture prestige of owning land, satisfaction of working the land, government subsidies, and the ability to hedge against inflation by holding land [43]. If a producer decides to sell they would be foregoing all of these factors. Leasing would involve foregoing a subset. We hypothesize that this foregone non-production utility of land could help to explain heterogeneity in pasture to crop conversion rates.
It is exceedingly challenging in our setting to estimate non-production utility of land with accuracy and precision. Indeed, a number of determinants of the profitability and risk of pasture systems vs. cropland systems are also often effectively unobservable [39]. Our experimental design addresses both of these problems, albeit with a single approach that does not allow us to neatly distinguish between the two factors. We develop and apply two experimental games meant to mimic the decision a rancher faces to convert pasture to cropland. One game, the “unframed game” allows participants to select among a number of lotteries. Each lottery mimics the opinions of a set experts on the profit and risk associated with pasture to crop conversion choices. The second game, the “framed game” is identical to the first except that we explicitly frame the game as concerning pasture to crop conversion choices. We expect the first game to reveal information about the risk preferences of the producers. We expect the second game and the contrast between the first and second game to reveal information about how past and future pasture to crop conversion patterns depend on the heterogeneous characteristics of producers, their risk preferences, and the non-production utility of land. Our work follows a growing literature using behavioral traits, elicited in experiments, to predict economic outcomes (e.g., [42,44,45,46,47]).
We aim for our work to contribute to the literature on agricultural intensification in Brazil (e.g., [12,17,25,26]). It can be used to generate alternative representative households in economic modeling of future land use. Such household scenarios might update assumptions about cost-effective channels for reducing GHGs from Land Use, Land Use Change, and Forestry (LULUCF). Finally, our work can provide insights into how to target future interventions to control the rate of pasture to crop conversion.
2. Materials and Methods
2.1. Setting
The economy of the state of Mato Grosso (7.23°–17.87° S and 50.57°–61.52° W) is dominated by agriculture. In 2016, the state was Brazil’s largest producer of crop agriculture by value [48], producing 8% percent of global soybeans, and had the country’s largest cattle herd [49]. Growth has been swift. In 2016, the value of agriculture production in Mato Grosso reached 36 billion 2015BRL, compared to just 3 billion 2015BRL in 1995. Agricultural growth in Mato Grosso had until recently stemmed primarily from the expansion of crop agriculture and beef cattle operations, often at the expense of natural ecosystems. However, in recent years, stricter conservation laws and dwindling reserves of land highly suited to cropping has shifted growth from the extensive to the intensive margin [12,25]. Pasture to cropland conversion has constituted an important share of these productivity gains in Mato Grosso. Pasture to cropland conversion often entails further leveling of land and the amendment of lime to reduce soil acidity [12]. The replacement of pasture with crops can result in substantially higher agricultural revenues per hectare (e.g., [50,51]) and is also associated with urban growth and development (e.g., [52,53]).
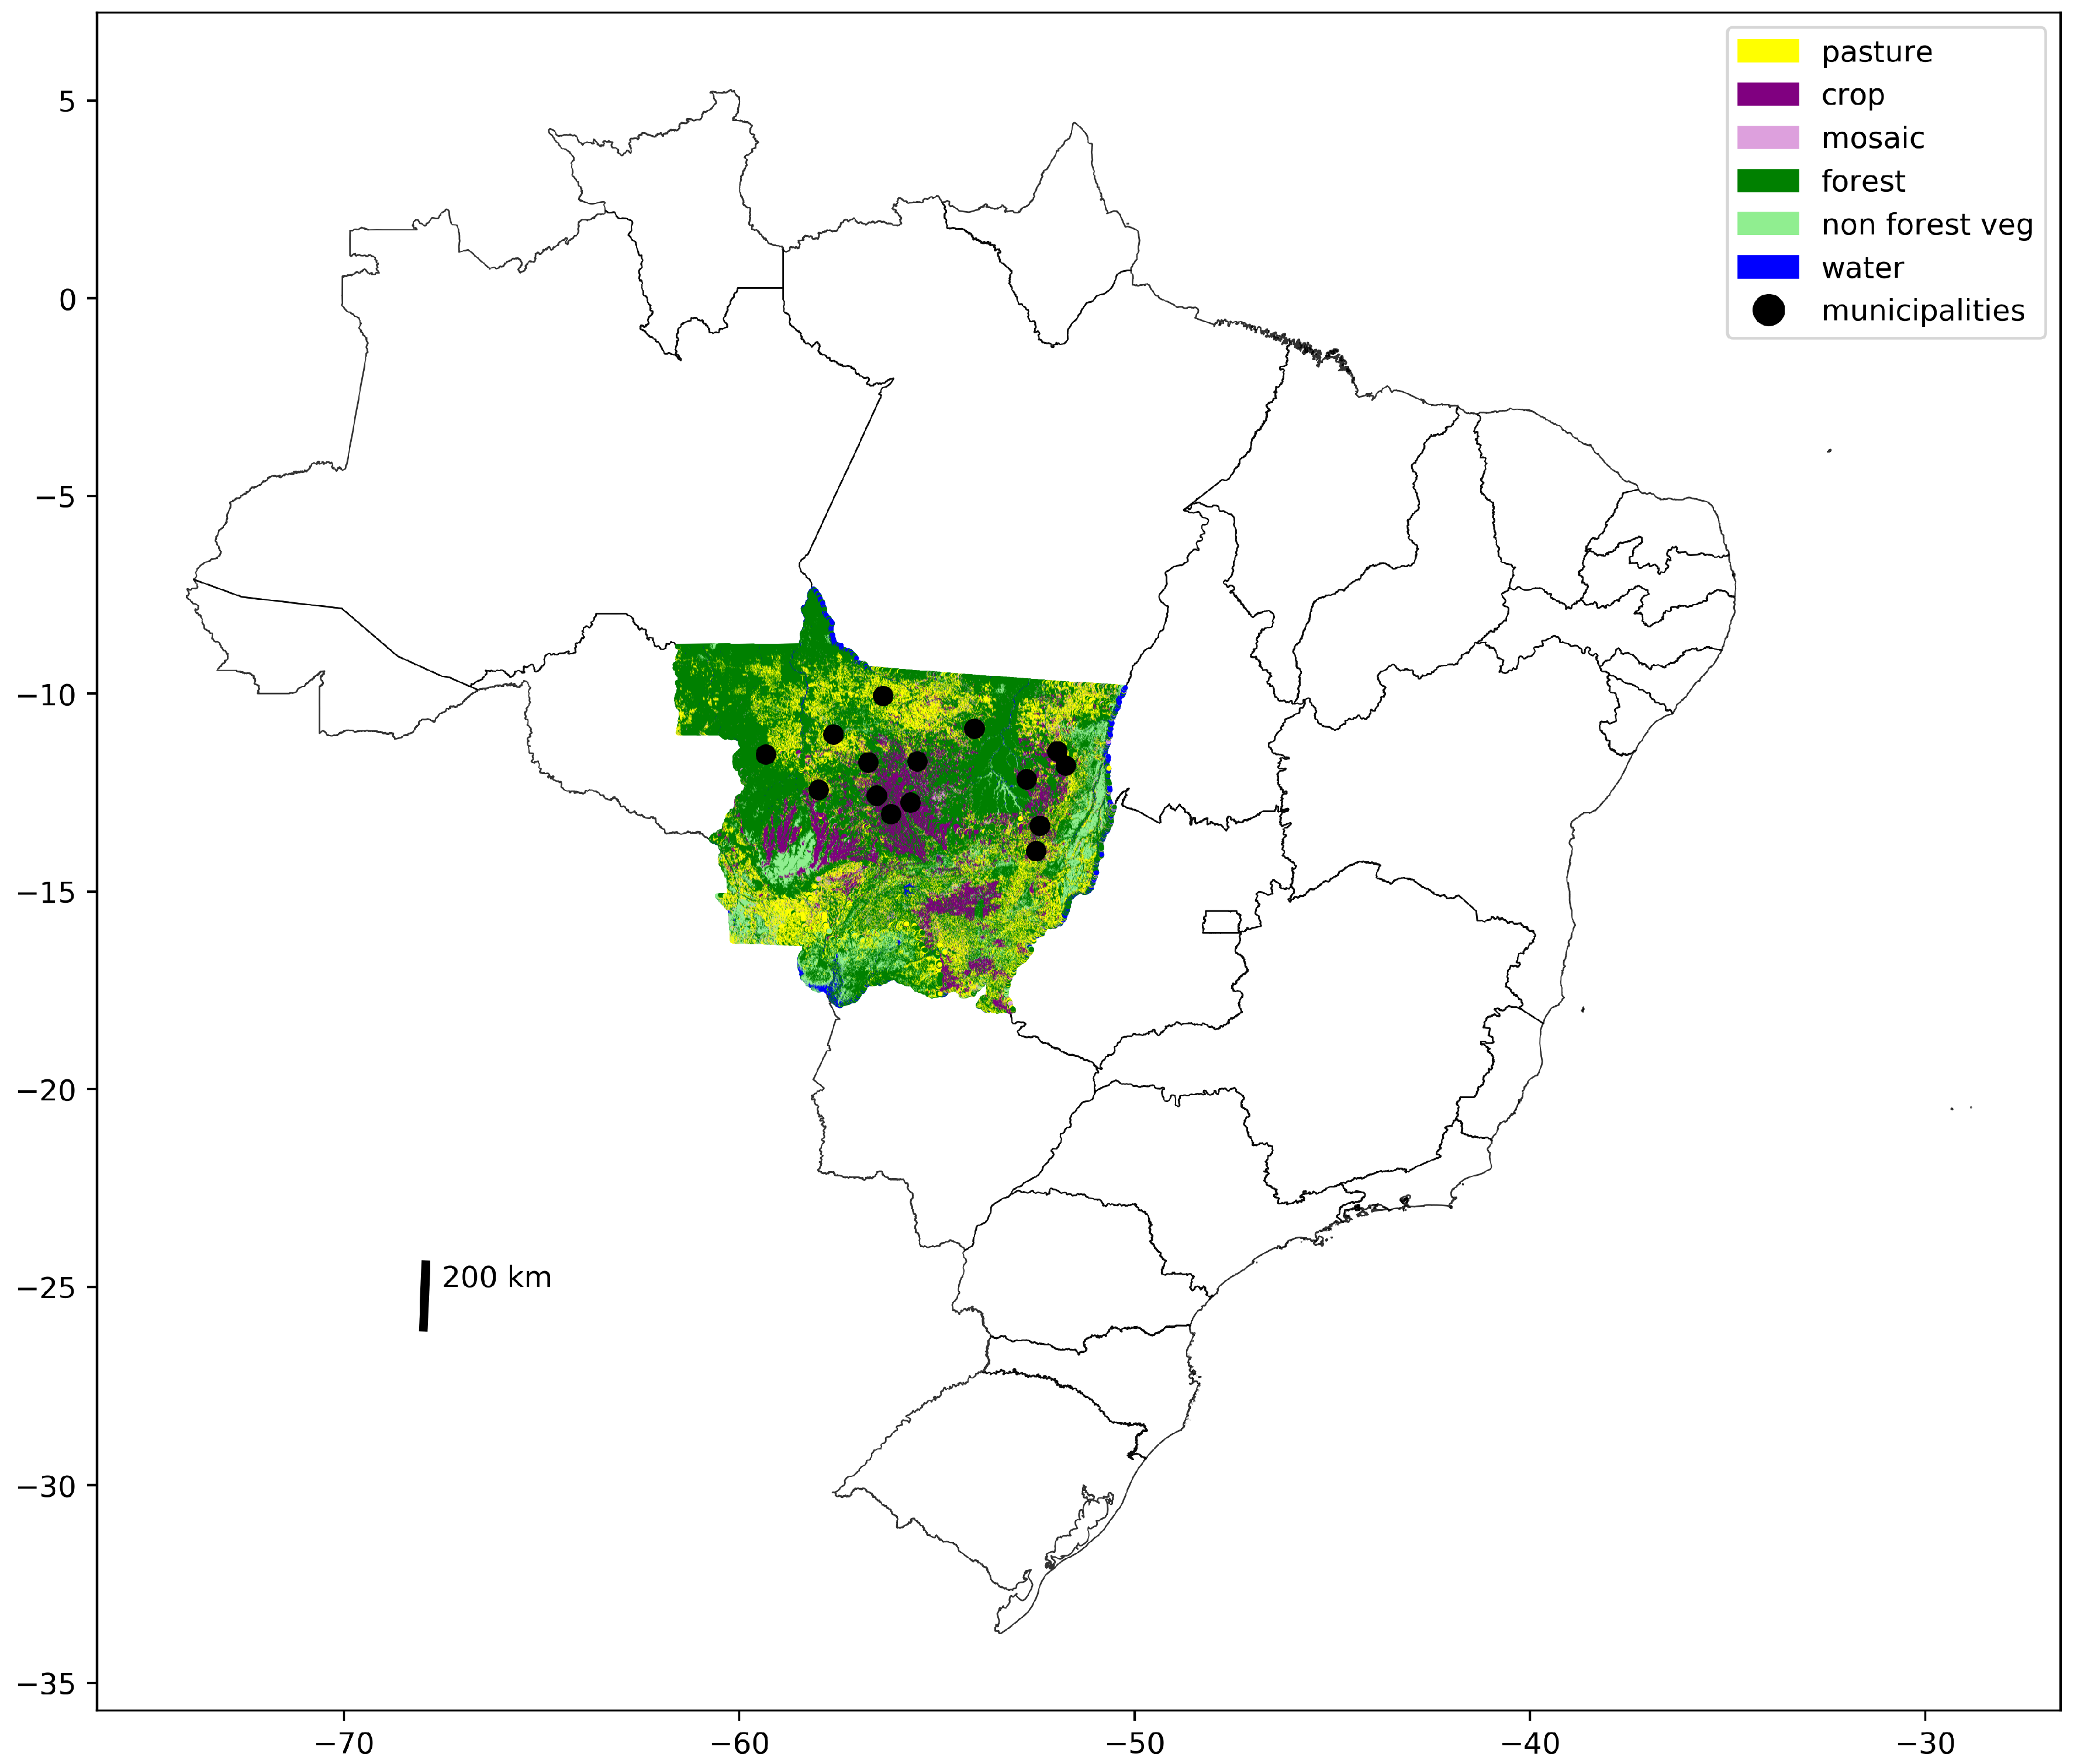
Over the period 2000 to 2014, Mato Grosso (see Figure 1) saw approximately 5 million hectares of cropland expansion of which approximately half was conversion from pasture to cropland [14]. However pasture to crop conversion to date constitutes a small share of total potential for cropland expansion. As much as 30–50% of the approximately 25 million hectares of remaining pasture in the state may be agronomically suitable for pasture to cropland conversion [12].
Across Mato Grosso, pasture to cropland conversion stems from a fairly even mixture of self conversion, leasing, and land sales [12]. Leasing often takes the following form. An agent, usually a rancher, leases their degraded land to another agent, usually a farmer. The farmer will then use a tractor and lime to farm the land for several years, and over time, restore the fertility of the land. In exchange, the farmer pays a rent (in the form of soybeans or cash) to the rancher. The rental price can vary with the location and quality of the land. After some years, the farmer returns the land to the rancher. The rancher can then permanently convert to farming or return to ranching [12].
We used experimental methods to determine farm and farmer-level predictors of variation in the take up of pasture to cropland conversion in Mato Grosso, Brazil. Our experiments were designed based on the results of focus groups conducted with farmers and ranchers in expert-identified hotspots in the state during the period February and March 2014. Using these findings, we identified two key factors that affect pasture to crop conversion that we chose to explicitly test: land sales prices and risk. Land sales prices tend to have more variation than land rental prices and may directly affect the options to lease, sell or self-convert land. Risk has the potential to affect all conversion options and could appear in all stages of the transactions.
We performed experiments with 559 producers during the months of October 2014 to December 2014. These producers were recruited by three different research teams in 20 different municipalities of the state of Mato Grosso. They were recruited using local contacts from cooperatives, unions, extension services, research institutions, and universities. The recruitment efforts focused on producers and farm managers operating at least 500 hectares of land. These producers comprise a small subset of all producers operating in the region. However, because of their large holdings, they are responsible for most of the pasture to crop conversion observed in the state of Mato Grosso.
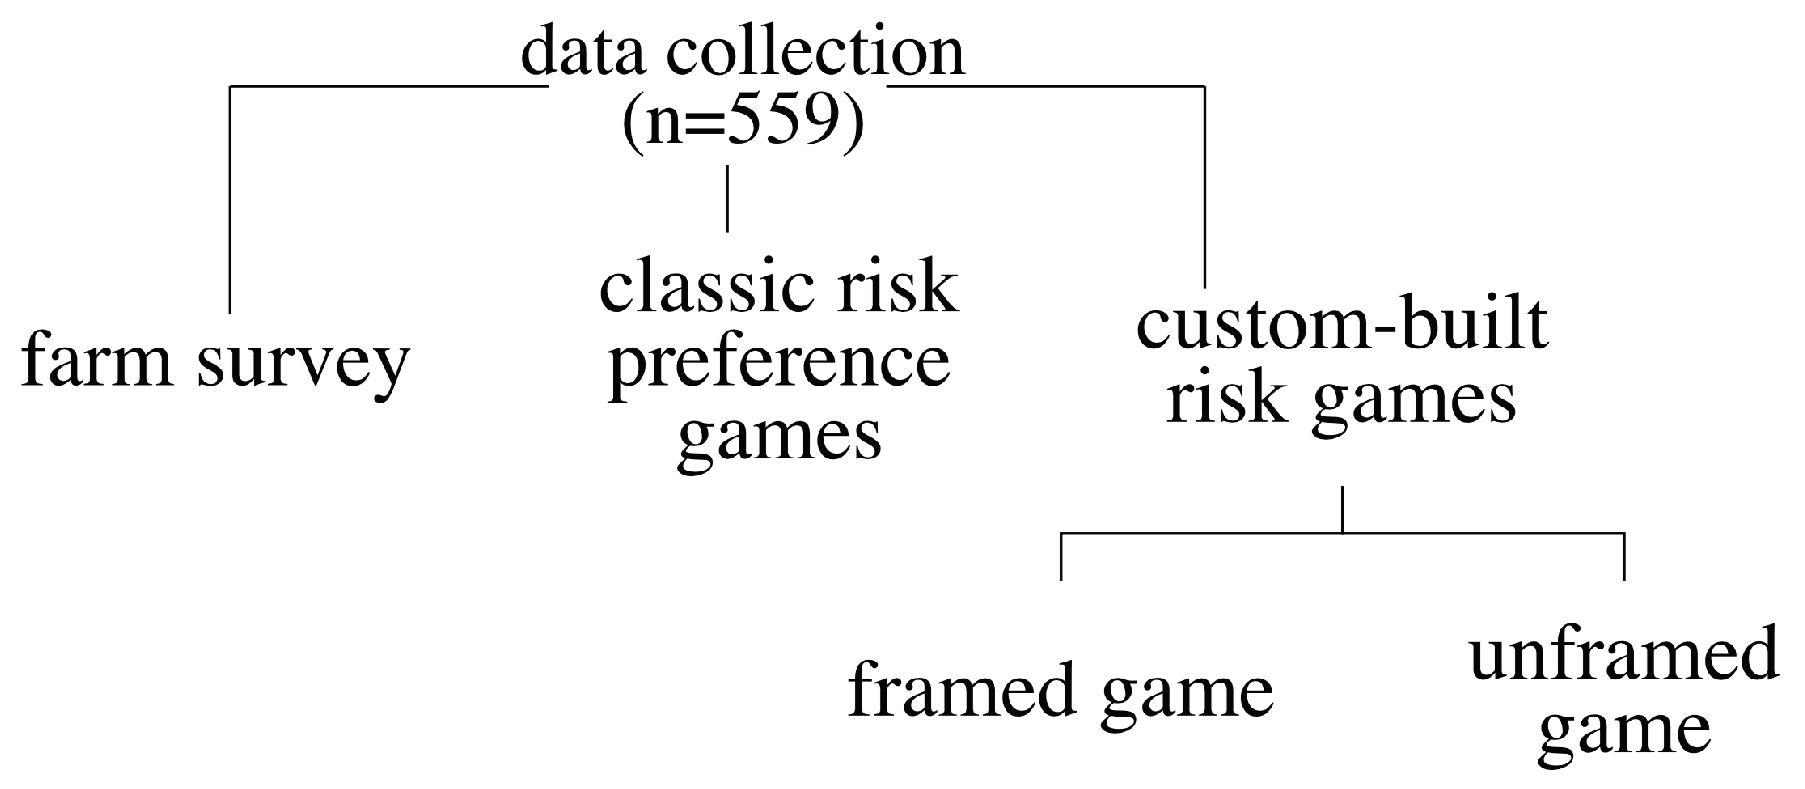
The experimental subjects participated in a series of experiments and completed a socioeconomic survey (see Figure 2). The research design targeted recruitment of a sample of 600 producers. In total of 598 subjects participated in the experiments. Of this 598, just 559 were included in the dataset due to incomplete responses and coding errors (for more please refer Appendix A, Appendix B and Appendix C which detail the experimental design and data collection procedures.).
2.2. Custom-Built Risk Games
We custom-built risk games that emulate pasture to crop conversion choices ranchers face (see Figure 2). The experimental subjects received a text passage describing the experimental setting. The passage describes a rancher deciding the fate of pasture that he owns. The rancher can choose four options: “do nothing”, “lease to a crop farmer”, “sell to a crop farmer”, and “convert to crop farming”.
We told players that each conversion choice had a worst-case scenario outcome and a best case scenario outcome each with a 50% likelihood of occurrence. The conversion choices were constructed such that those with lower risk had lower return. We used interviews with experts to determine the payoffs and the risk-return ordering of the choices. “Do nothing” offered the lowest risk and return followed by “lease”, then “sell”, and then “convert”. This order was constant across all subjects. The degree of difference in risk (variance) and return (mean) across choices varied across four experimental groups (Further details of the the design of the custom-built games can be found in Appendix A.
Individuals’ experiences and perceptions might influence their behavior during experiments [54,55]. For this reason, individuals might choose differently when the context of the experiment is comparable to the context of their choices in real life [56,57,58]. To understand the importance of context in our setting, we implemented an identical experiment to the one described above omitting the information about the setting (i.e., decisions about pasture to crop conversion). Conversion choices were transformed into investment options and payoffs were presented as potential investment returns.
Throughout the paper, we refer to our two custom-built risk games respectively as, “game with framing” and “game without framing”. On its own, each game identifies the preferred investment option of the subjects in that setting. The comparison between the games hints at individual-level understanding of the cultural, economic, and institutional factors affecting investment choices involving land and/or agriculture. All subjects completed all classic and custom-built games, enabling within subject comparison.
Experience with agriculture might help farmers to better calculate the risk-return trade-off of the different choices. Expectations and perceptions about non-agricultural costs and benefits from landholding might induce farmers to behave differently when land is at stake. Tenure insecurity might induce farmers who would otherwise prefer to sell or lease their land to either “do nothing” or “convert”. Irrespective of the mechanism generating differences in behavior between the games, these differences can be informative about how putting land or agricultural livelihoods at stake can change the behavior of farmers compared to how they would behave when faced with non-agricultural investment options.
2.3. Other Variables
Information regarding real-life conversion behavior came from a socioeconomic survey administered with the sample farmers. We asked respondents to recall whether and when they leased, sold or converted pastures. We constructed variables indicating whether and when the participant had leased pasture resulting in cropland conversion, sold pasture resulting in cropland conversion, or converted pasture to cropland. When the farmer had engaged in more than one type of conversion, we classified the farmer as participating in the most recent conversion activity. These four conversion variables are the main outcomes on which we focus the portion of the paper focused on predicting field behavior.
The survey also included questions on individual characteristics such as municipality of residence, age, schooling, farm size and input use. It also included information on the number of years that neighboring farmers have been converting pastures to cropland.
We collected information on risk preferences using a set of classic risk preference games (see Figure 2) on risk, ambiguity and loss constructed using the methodology developed by [46]. In these games, participants are asked to choose between six different lotteries ordered by risk levels. In the risk game, the players know the probabilities of the different lottery outcomes and cannot lose money. The ambiguity game is a variation of the risk game in which the players do not known the exact probabilities of the lottery, whereas the loss game is a variation of the risk game in which the players can lose money. The risk game demonstrates participants’ risk aversion, while the differences between choices in the risk game and the ambiguity and loss games demonstrate participants’ ambiguity and loss aversion (See Appendix B for details of the risk games).
Table 1 reports descriptive statistics of the sample across categories of pasture to crop conversion behavior. About 40% of the farmers had converted pastures into cropland while 10% have sold or leased pastures for conversion. Our sample was supposed to have been drawn from pasture to crop conversion hotspots at the time of survey administration. The intuition of the experts appears broadly correct; pasture to cropland conversion (in table as “First conv.”) commenced on average in 2010 in the properties of the research subjects and use of genetically modified organisms (GMOs) and no-till agricultural practices were widespread. Roughly two thirds of the sample farmers used these technologies. The average farm size was approximately 1800 hectares, indicating that the successful targeting of large farmers. The average farmer in our sample was 48 years old, had completed high school, was born outside the state of Mato Grosso, and migrated to the state around 1990. Relative to other groups in Latin America, the farmers were typically risk averse, extremely loss averse, but not very ambiguity averse. As is typical of survey research, many respondents did not report their wealth (198/559). Of those who did, 1/3 reported total wealth greater than R$10,000,000 (USD 4,000,000 at the time of the survey) while about 25% had a total wealth smaller than R$1,000,000 (USD 400,000).
2.4. Hypotheses
Our empirical investigation was designed to explore the extent to which the custom-built risk games are predictive of field pasture to crop conversion behavior. The analysis consists of four steps. In the first step, we compared the behavior in the games with and without framing to determine the importance of context for the experimental choices. We call this the framing effect and we expect that it could be positive or negative depending on the net effect of unobservable cost and benefits each producer faces. Were context irrelevant, we would expect the correlation between choices in these games to be close to one and the framing effect to be close to zero. The weaker this correlation the greater the importance of the context signaled by framing. First, we use simple cross-tabulations to inspect this correlation. Additionally, we use multiple regression to explore if the framing effect is predictive of each of the four experimental outcomes, conditional on subject fixed effects.
In the second step, we compare (a) choices in the custom-built unframed game with field behavior and (b) choices in the custom-built framed game with field behavior. Here we expect a higher correlation between the choices in the framed game and field behavior than the correlation between choices in the unframed game and field behavior. This hypothesis stems from the existence of heterogenous circumstances and tendencies linking participants to framed choices.
In the third step, we explore the extent to which we can explain variation in framing effect with observables. We perform multiple linear regression using a set of covariates known to drive agricultural management and intensification decisions. We also fit a model with controls for geographic variation to investigate the role of individual vs. geographic drivers of variation. Ultimately, we are interested in not only this partitioning, but also the share of the framing effect that we cannot explain with observables.
Finally in a fourth step, we explore our ability in predicting individual participants’ propensity to convert pasture to cropland. Our dependent variables are (1) pasture to crop conversion of any type, (2) self conversion, (3) conversion via lease, and (4) conversion via land sales. Our right hand side draws on four sources of evidence from the data collection activities. These include the farm survey, the classical risk games, the custom-built unframed risk games, the custom-built framed risk games, and framing effect.
In constructing our framing effect variables, we create three groups, each designed to explore an element of the theoretical behavioral foundations of rates of agricultural intensification. The first group is called "Change in Risk Behavior" and indicates subjects who switched from more (less) to less (more) risky choices under framing. We picked this variable given the considerable literature arguing that risk aversion of cattle ranchers constrains intensification of cattle systems. We class no conversion as “1”, lease as “2”, sale as “3”, and self conversion as “4”. This order follows the order elicited from our expert survey. This variable is constructed from subtracting the unframed choice from the framed choice. The second framing effect variable is called “Land Preferences”. This variable is meant to capture the affinity that some farmers have for working the land. This variable can take on the values of “1”, “0”, and “” as it is produced by subtracting the unframed binary choice of value “0” or “1” from the framed binary choice. We classify “no conversion” and “self conversion” as land preference = 1 and “lease” and “sell” as land preference = 0. To calculate the variable we subtract the unframed value from the framed value. The third and final framing effect variable is called “Non-production benefits of landholding”. This variable is meant to capture ways in which holding land can confer benefits (and dis-benefits) to land owners. These can stem from myriad sources including cultural prestige, land speculation, hedging against inflation, and atypical tenure security both favoring and disfavoring the participant.
In this fourth step, the regressions implemented include participant-level controls and municipality fixed effects. The participant-level characteristics control for alternative determinants of conversion choices. The municipality fixed effects control for unobserved sources of heterogeneity that are varying at the municipality-level. While we do not interpret our results as causal, we find the coefficients to change little with the inclusion of controls, indicating that endogeneity and omitted variables are unlikely to drive the results [59].
3. Results
Experimental Results
Table 2 contrasts the choices from the custom-built risk games with and without framing as pasture to crop conversion. There are striking differences in the behavior of the subjects in the unframed and the framed games. In the unframed game, 20% of the participants chose “nothing”, 24% chose to “lease”, and 25% chose to sell, and 31% chose to convert the land. In contrast in the framed game, 3.2% of the participants chose “nothing”, 37.7% chose “lease”, 2.5% chose “sell”, and 56.5% chose to convert. We consider the framing effect to be large as only 38.6% () of the individuals chose identically in the two experiments. Nearly one quarter of participants who would have sold from a risk standpoint alone chose to keep land. These results confirm others’ findings that context influences behavior in experiments [56,60].
Table 3 explores how framing affects experimental choices. Column 1 shows that subjects were 16.8 percentage points more likely to convert (or less likely to do nothing) in the games with framing than in the games without framing. This result is the net effect of a 14.1 percentage point increase in leases (column 2), a 22.9 percentage point decline in sales (column 3), and a 25.6 percentage point increase in self-conversion (column 4).
Table 4 explores how the price and risk treatments influence subjects’ experimental choices in the framed vs. unframed games. Experimental subjects assigned to a higher land sales price were less likely to lease and more likely to sell in the unframed game. In contrast to the effects of prices, varying risk did not influence choices in the unframed games. The implication is ambiguous, it might mean that our treatment explored too little variance, or imply a lack of understanding of the importance of variance, or limited influence of relative risk on pasture to crop conversion.
In the framed game, neither price nor risk was significantly predictive of any conversion choice. For the price effect, this result statistically significantly differed (at p < 0.1, at p < 0.05, at p < 0.05 ) from the unframed game for the respective options “Nothing”, “Lease”, and “Sell”. No statistically significant difference was observed for “Convert”. In the cases where framing caused the price effect to be statistically significantly different, it implies that framing significantly changed the subjects’ evaluation of the different experimental choices. In fact, the framing effect appears to be so large that it overshadowed the price treatments. Although none of the price effect coefficients in the framed game are statistically significant, their significant difference with coefficients in the unframed game suggests that we cannot rule out that the price treatment had some effect on the framed outcome. The framed game captures both the contextual references and the effect of the experimental treatment. It is unclear whether the experimental treatment has done much to alter the outcome of the framed game.
Table 5 and Table 6 contrast the choices from respectively the framed and unframed custom-built risk games with field behavior collected in the farm survey. Here we see the possible existence of conversion constraints in practice as many who chose conversion in games had yet to convert on their own farms, despite being located in conversion hotspots. We also see that participants are more likely to lease in theory than in practice. This finding concords with research arguing that sclerotic land rental markets in Brazil are constraining agricultural intensification [61]. In the unframed vs. field matrix the most notable contrast is the fairly balanced nature of choices in the unframed risk game (this was by design) vs. the highly imbalance nature of how producers have acted even on purportedly similar conditions. This is further suggestive evidence that the true conditions producers face differ from those of expert views.
Table 7 show results of regressions exploring correlates of several specific instances of the framing effect that we hypothesize will be predictive of field behavior variation. Columns 1 and 2 investigate predictors of “Change in risk behavior” from framing. Columns 3 and 4 examine predictors of “Non-production utility of land”, and columns 5 and 6 examine predictors of “propensity to wish to work the land”. Odd columns do not include municipality fixed effects while even columns include municipality fixed effects.
Columns 1 and 2 show that risk choice is negatively associated with “Change in risk behavior” (Risk choices are ordinal metrics but our specification treats them as continuous. However, the results are unchanged if we use a functional form featuring a dummy for each different risk choice.). The table also shows that loss aversion (represented by a higher difference between loss and risk choices) is associated with a decline in the “Work the land” framing effect. The results also indicate that older and less educated farmers are more likely to choose more risky options. The results from the specifications with and without municipality fixed effects are quite similar.
Table 8, Table 9, Table 10 and Table 11 all show results from regressions of pasture to crop conversion on choices from the framed and unframed risk games, the framing effects, individual controls, and municipality level controls. Each of these tables follows the same stepwise approach. Column (1) regresses the outcome of interest on unframed choices, participant controls, and municipality controls, Column (2) regresses the outcome of interest on framed choices, participant controls, and municipality controls, Column (3) regresses the outcome of interest on both framed and unframed choices, participant controls, and municipality controls, Column (4) regresses the outcome of interest on the “Change in Risk behavior” framing effect, participant controls, and municipality controls, Column (5) regresses the outcome of interest on the “Land preferences” framing effect, participant controls, and municipality controls, Column (6) regresses the outcome of interest on the “Non-production benefits of landholding” framing effect, participant controls, and municipality controls, and Column (7) regresses the outcome of interest on all three previously mentioned framing effects, participant controls, and municipality controls.
We first modeled a response variable indicating participants who undertook any type of pasture to crop conversion. These results can be found in Table 8. Here we find only “Non-production benefits of landholding” to be a significant predictor of pasture to crop conversion (Columns 6 & 7). The relationship is robust to a specification including two additional framing effects (Column 7).
Next we explored a response variable indicating participants who undertook self conversion of pasture to cropland. These results can be found in Table 9. Here we find “Non-production benefits of landholding” to be a significant predictor of pasture to crop conversion (Columns 6 and 7) and also Land Preferences (Column 5). The Land Preferences relationship may be weak as it is not robust to the specification including two additional framing effects (Column 7).
Next we explored a response variable indicating participants who undertook conversion of pasture to cropland via land sale. These results can be found in Table 10. Here we find a significant relationship with those who opted for “Lease” and “Convert” in the framed custom-built game (Column 2). These results were robust to the specifications including choices in the unframed game (Column 3).
Finally, we explored a response variable indicating participants who undertook conversion of pasture to cropland via land lease. These results can be found in Table 11. Here we again find a significant relationship with those who opted for “Lease” and “Convert” in the framed custom-built game (Column 2). These results were again robust to the specifications including choices in the unframed game (Column 3). We also find a negative relationship with “Change in Risk Behavior” and “Land Preferences” (Couumns 4 & 5). However these findings are not robust to the specification simultaneously including all three framing effects (Column 7).
Taken together our results show no predictive power for the unframed results, weak predictive power for results from the framed games, and slightly better predictive power from indicators of the framing effect. These findings are consistent with the hypothesis that behavior in the field is more related to behavior in experiments with context mirroring the context in which the experimental subjects make their decisions in real life.
4. Discussion
Our findings are similar to some previous comparisons of experimental and field behavior. For example, ref [62] found that behavior in context-free experiments is not predictive of field behavior. This is consistent with our findings of no relationship between behavior in experiment without framing and field behavior. Our findings on the existence of a relationship between the behavior in the experiment with framing and field behavior are also consistent with [56,58]. However, we should note that we do not find this correlation for all outcomes.
Perhaps the sharpest departure from the previous literature is the importance of framing to our findings. Previous studies such as [56,60] show that changes in framing mildly affected behavior in lab experiments. By contrast, we found a striking framing effect i.e., large differences in unframed vs. framed behavior. We think the discrepancy may stem in part from the highly economically heterogeneous nature of farming in the Brazilian agricultural frontier. A great deal of this heterogeneity stems from non-agricultural costs and benefits of owning or using land. These are quite producer and/or producer-location specific. Thus, these costs and benefits are notoriously poorly quantified and often hidden from expert assessments or top-down modeling exercises. They certainly did not inform the expert-sanctioned technology adoption cost-benefit estimates described in our experimental scenario treatments. Yet these costs and benefits likely shaped game performance just as they shape rates of agricultural intensification in practice. By introducing agricultural context, we believe that we prompted subjects to consider in the games these costs and benefits they face in the field when practicing agriculture. Or put another way, context may have changed how subjects perceived the experimental treatments themselves. To best compare experiments, it is ideal to modify just the subjects, the context, or treatments [63]. It seems likely that our approach modified both context and treatment. While this may be suboptimal for experimental comparison, we believe that the approach was worthwhile because it provided additional insight into field behavioral variation.
Previous studies have focused on how behavioral traits elicited in lab experiments like trustworthiness (e.g., [44]), time preferences (e.g., [42]) and risk preferences (e.g., [46]) influence economic outcomes. However, we are unaware of studies that provide evidence that the framing effect is informative about economic outcomes. While we are unable to distinguish the mechanism causing changes in risk behavior, our results provide evidence it is possible to learn about the subjective information that individuals bring to lab experiments by comparing how they modify their choices in experiments with different informational content.
5. Conclusions
This paper uses lab in the field experiments to examine whether the behavior of large farmers from the state of Mato Grosso can be predicted using the results of framed and/or unframed choice experiments. Farmers were asked to participate in experimental games identical but for framing that the decision concerns agriculture. We find that this framing caused farmers to indicate remarkably different preferences across the two games. In fact, the framing effect was so large that we observed no correlation at all in choice selection in the framed vs. unframed game. One implication is that farmer can be expected to behave very differently when it comes to economic decisions involving agriculture than in all other economic decisions.
We then turned to the relationship between behavior in the laboratory and the field. Our findings indicate that choices in the experiment without framing were not at all associated with pasture to crop conversion in the field. However, the framed experiment choices and certain framing effects themselves were predictive of field behavior. We found some evidence that risk aversion, non-production utility of farming, and an affinity for working the land each may play a role in driving conversion decisions.
Our findings show it is possible to learn about the personal priors that of experimental subjects by comparing how they modify their choices in experiments with differences in framing. While we are unable to determine the mechanism driving the changes in risk behavior across experiments, our findings indicate that heterogeneity in behavior risk behavior involving agricultural decisions explains pasture to crop conversion behavior in the Brazilian agricultural frontier. This is an important result for understanding heterogeneity in land use in this region and for designing interventions to pursue sustainability and agricultural goals in parallel.
Identifying the mechanisms leading to this result is an important avenue for future research. Understanding the sources of the farmers’ preferences for land and agriculture could help to build theory and design land use policies. For instance, the land use effects of policies aimed at reducing tenure insecurity will be larger in a scenario in which tenure insecurity induces cautious behavior than in a scenario in which it induces bold behavior. Likewise, the land use effects of training and technical assistance will be different in scenarios in which lack of knowledge induces farmers to seek vs. retreat from risk.
Supplementary Materials
The Field Manual is available online at https://0-www-mdpi-com.brum.beds.ac.uk/2073-445X/8/1/21/s1.
Author Contributions
The authors contributed equally to this work.
Funding
This research was funded by the Energy Biosciences Institute and the Dutch Ministry of Economic Affairs (Grant DGAN/16099163).
Acknowledgments
The authors thank Chantal Toledo for helping to design and pilot the research and the team from Plan Consultoria for assistance in data collection.
Conflicts of Interest
The authors declare no conflict of interest.
Appendix A. Custom-Built Risk Games
The custom-built risk games emulated pasture to crop conversion choices in a controlled setting. The experimental subjects received a text passage describing the experimental setting. The passage describes a rancher deciding the fate of pasture they own. The rancher can choose four options: “do nothing”, “lease to a crop farmer”, “sell to a crop farmer”, or “convert to crop farming”.
Each conversion choice had a worst-case scenario outcome and a best case scenario outcome each with a 50% likelihood of occurrence. The conversion choices were constructed such that those with lower risk had lower return. “Do nothing” offered the lowest risk and return followed by “lease”, then “sell”, and then “convert”. This order was constant across all subjects. An identical experiment was performed omitting information about pasture to crop conversion. The degree of difference in risk (variance) and return (mean) across choices varied across subjects. The subjects were randomly assigned to four experimental groups. Each experimental group had a distinct combination of risk and return (high-high, high-low, low-high and low-low). The experimental subjects in each group were told that the annual returns to each lottery/“conversion choice” were the following:
- Experimental Group 1 (Low-Low):
- -
- Do Nothing (+/− 10%): R$12,150 or R$14,850 (mean = R$13,500)
- -
- Lease (+/− 20%): R$11,840 or R$17,760 (mean = R$14,800)
- -
- Sell (+/− 30%): R$10,500 or R$19,500 (mean = R$15,000)
- -
- Self-Convert (+/− 40%): R$10,200 or R$23,800 (mean = R$17,000)
- Experimental Group 2 (High-Low):
- -
- Do Nothing (+/− 10%): R$12,150 (R$13.5) or R$14,850 (R$16.5) (mean = R$13,500)
- -
- Lease (+/− 20%): R$11,840 (R$13) or R$17,760 (R$19.5) (mean = R$14,800)
- -
- Sell (+/− 30%): R$11,550 (R$12.5) or R$21,450 (R$23.5) (mean = R$16,500)
- -
- Self-Convert (+/− 40%): R$10,200 (R$11) or R$23,800 (R$26) (mean = R$17,000)
- Experimental Group 3 (High-Low):
- -
- Do Nothing (+/− 30%): R$9450 (R$10.5) or R$17,550 (R$19) (mean = R$13,500)
- -
- Lease (+/− 40%): R$8880 (R$10) or R$20,720 (R$23) (mean = R$14,800)
- -
- Sell (+/− 50%): R$7500 (R$8.5) or R$22,500 (R$25) (mean = R$15,000)
- -
- Self-Convert (+/− 60%): R$6800 (R$7.5) or R$27,200 (R$30) (mean = R$17,000)
- Experimental Group 4 (High-High):
- -
- Do Nothing (+/− 30%): R$9450 (R$10.5) or R$17,550 (R$19) (mean = R$13,500)
- -
- Lease (+/− 40%): R$8880 (R$10) or R$20,720 (R$23) (mean = R$14,800)
- -
- Sell (+/− 50%): R$8250 (R$9) or R$24,750 (R$27.5) (mean = R$16,500)
- -
- Self-Convert (+/− 60%): R$6800 (R$7.5) or R$27,200 (R$30) (mean = R$17,000)
To ensure the choices across experiments were comparable, the subjects were kept in the same experimental group across experiments.
Appendix B. Assessment of Risk Attitudes
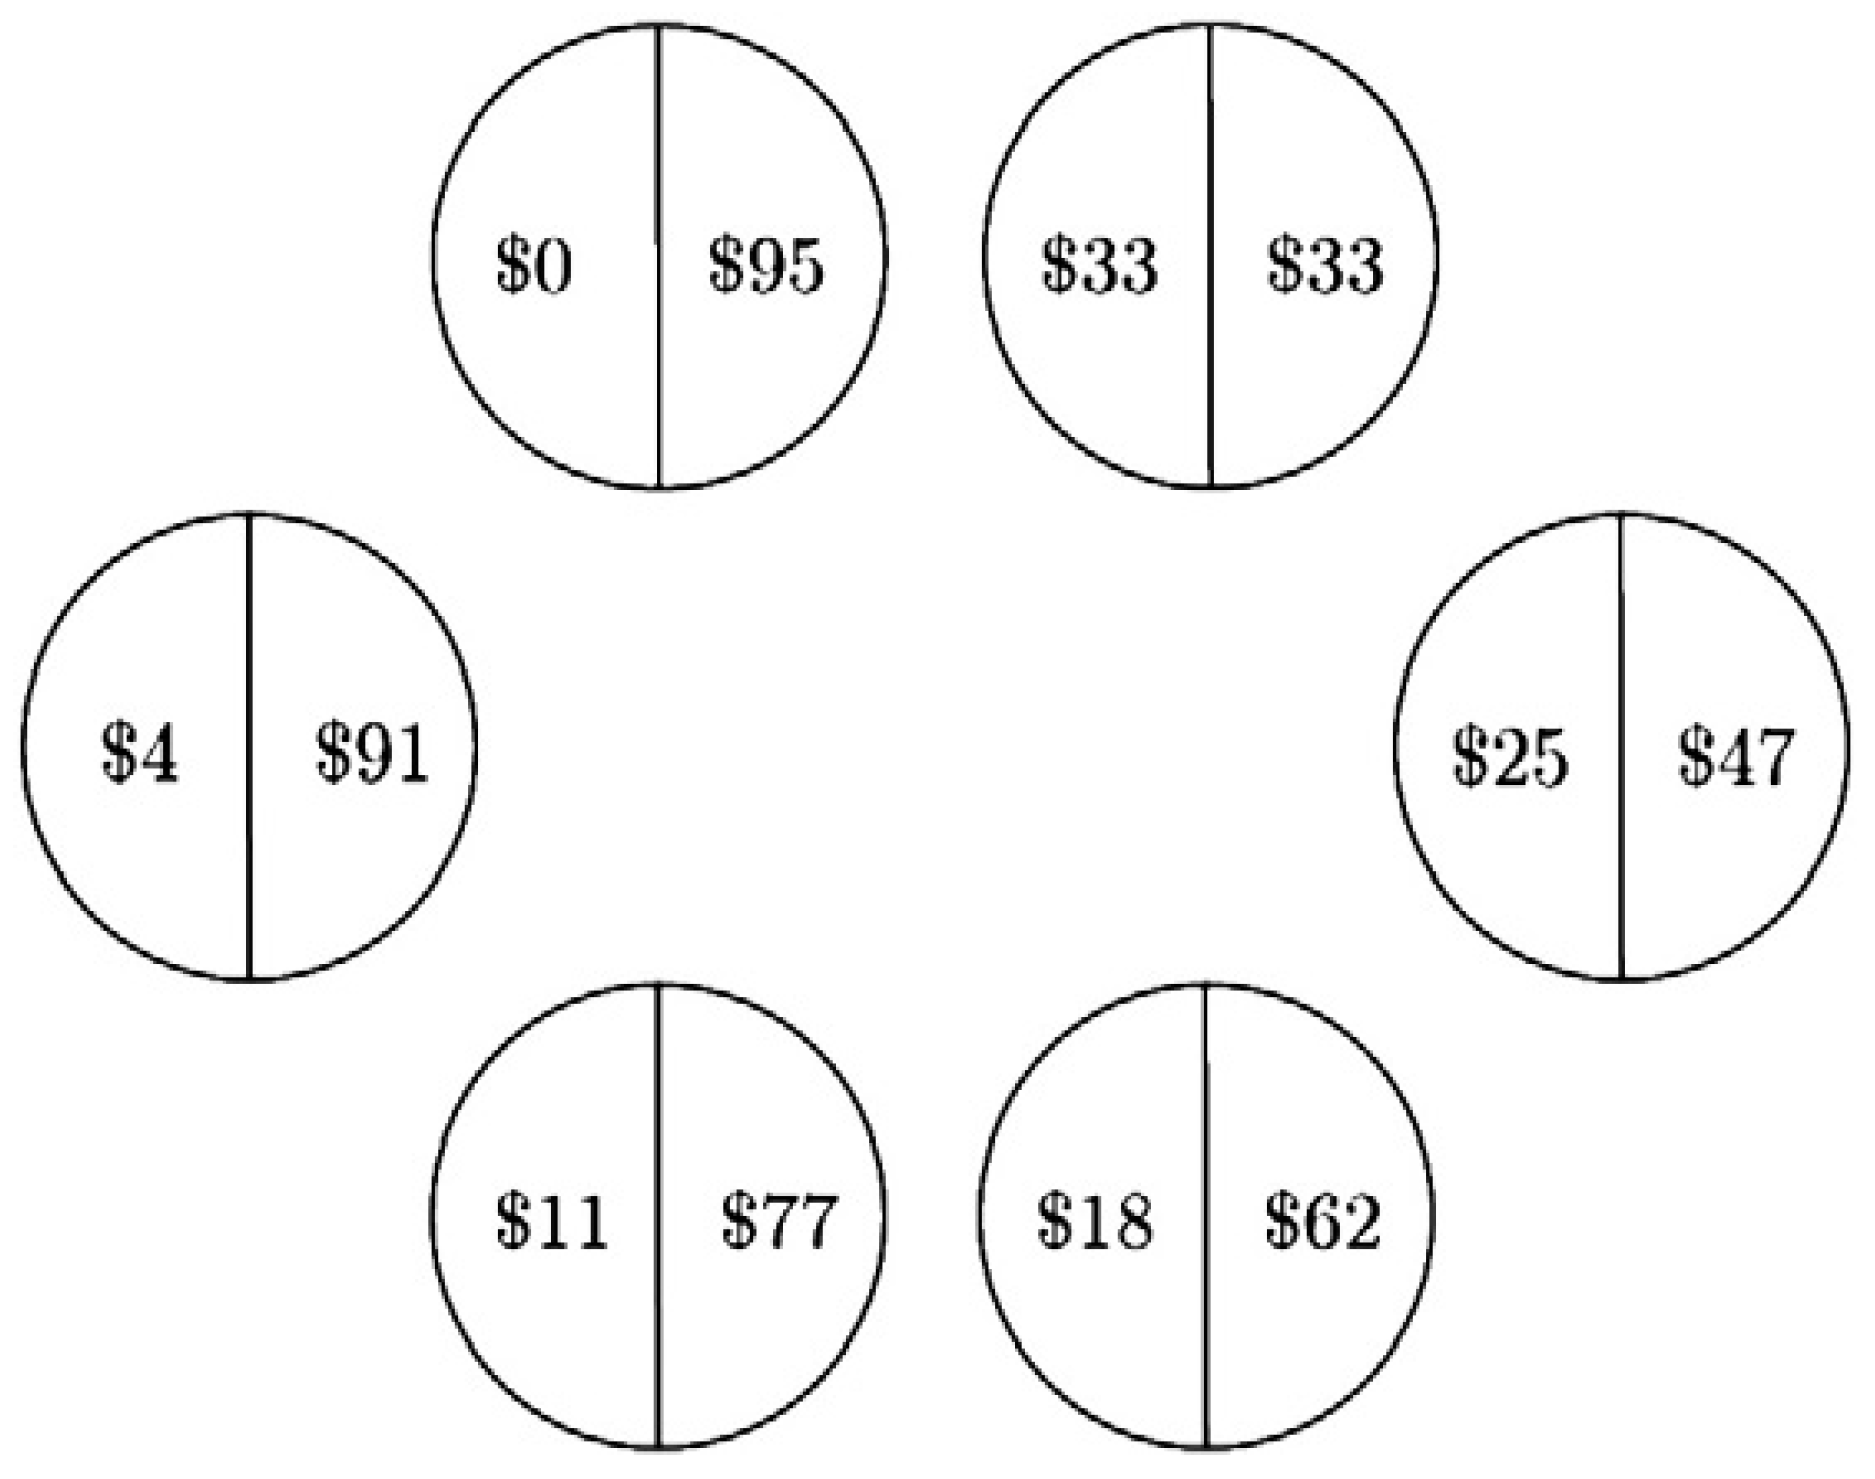
We gather data on risk attitudes by applying several experimental games developed by Cardenas and Carpenter [46]. In the games, participants face real monetary incentives (i.e., they earn money for participating, but they can win more depending on chance and their choices). Together, the results of these games reveal participants’ attitudes to risk and also how these attitudes differ in the presence of ambiguity or the potential for loss. In each game, participants are asked to select from six binary lotteries. Each lottery has an equal probability of the good outcome and the bad outcome. The lotteries range from extreme aversion to risk (Figure A1), ambiguity (Figure A2), or loss (Figure A3) option (low score) to possible tolerance for risk, loss, or ambiguity option (high score). In each of the three games the first five of six options increase in riskiness, but also increase in variance of payoff. The sixth option increases from the fifth only in variance. Payoffs were the same in the risk and ambiguity games. In the loss game, some rounds can result in losses, but because participants are given an initial endowment, no participant loses money playing the games. The difference in the performance of individuals in the risk vs. ambiguity game reveals the participants’ reaction to ambiguity. A negative number denotes ambiguity aversion and a positive number denotes ambiguity seeking behavior. The difference between the risk and the loss aversion game reveals the participants’ reaction to potential losses with a negative number denoting loss aversion and a positive number denoting loss seeking.
Figure A1.
Lottery choices in the risk game. The game is based on [46]. Values are in 2014 BRL. This game intends to capture baseline attitudes towards risk. Subjects choose one of six lotteries. As one moves clock-wise around the ring, the lotteries increase in risk and expected payoff except for the last lottery, which has the same expected payoff as the fifth but has higher variance. Within each lottery, the odds of a high payment are the same as the odds of a low payment (50% probability). To determine payouts for the task, participants choose one lottery to play. A computer then randomly draws an outcome.

Figure A2.
Lottery choices in the ambiguity game. The game is based on [46]. Values are in 2014 BRL. This game intends to capture baseline attitudes towards risk. Subjects choose one of six lotteries. As one moves clock-wise around the ring, the lotteries increase in risk and expected payoff except for the last lottery, which has the same expected payoff as the fifth but is riskier. The participant knows that there are at least three low value balls and three high value balls in each circle but does not know the distribution of the remaining four balls which could be either low or high value. Thus, the odds of a high or low payment are bounded between 30% and 70% but are unknown. To determine payouts for the task, participants first choose one lottery to play. A computer then draws the outcome.

Figure A3.
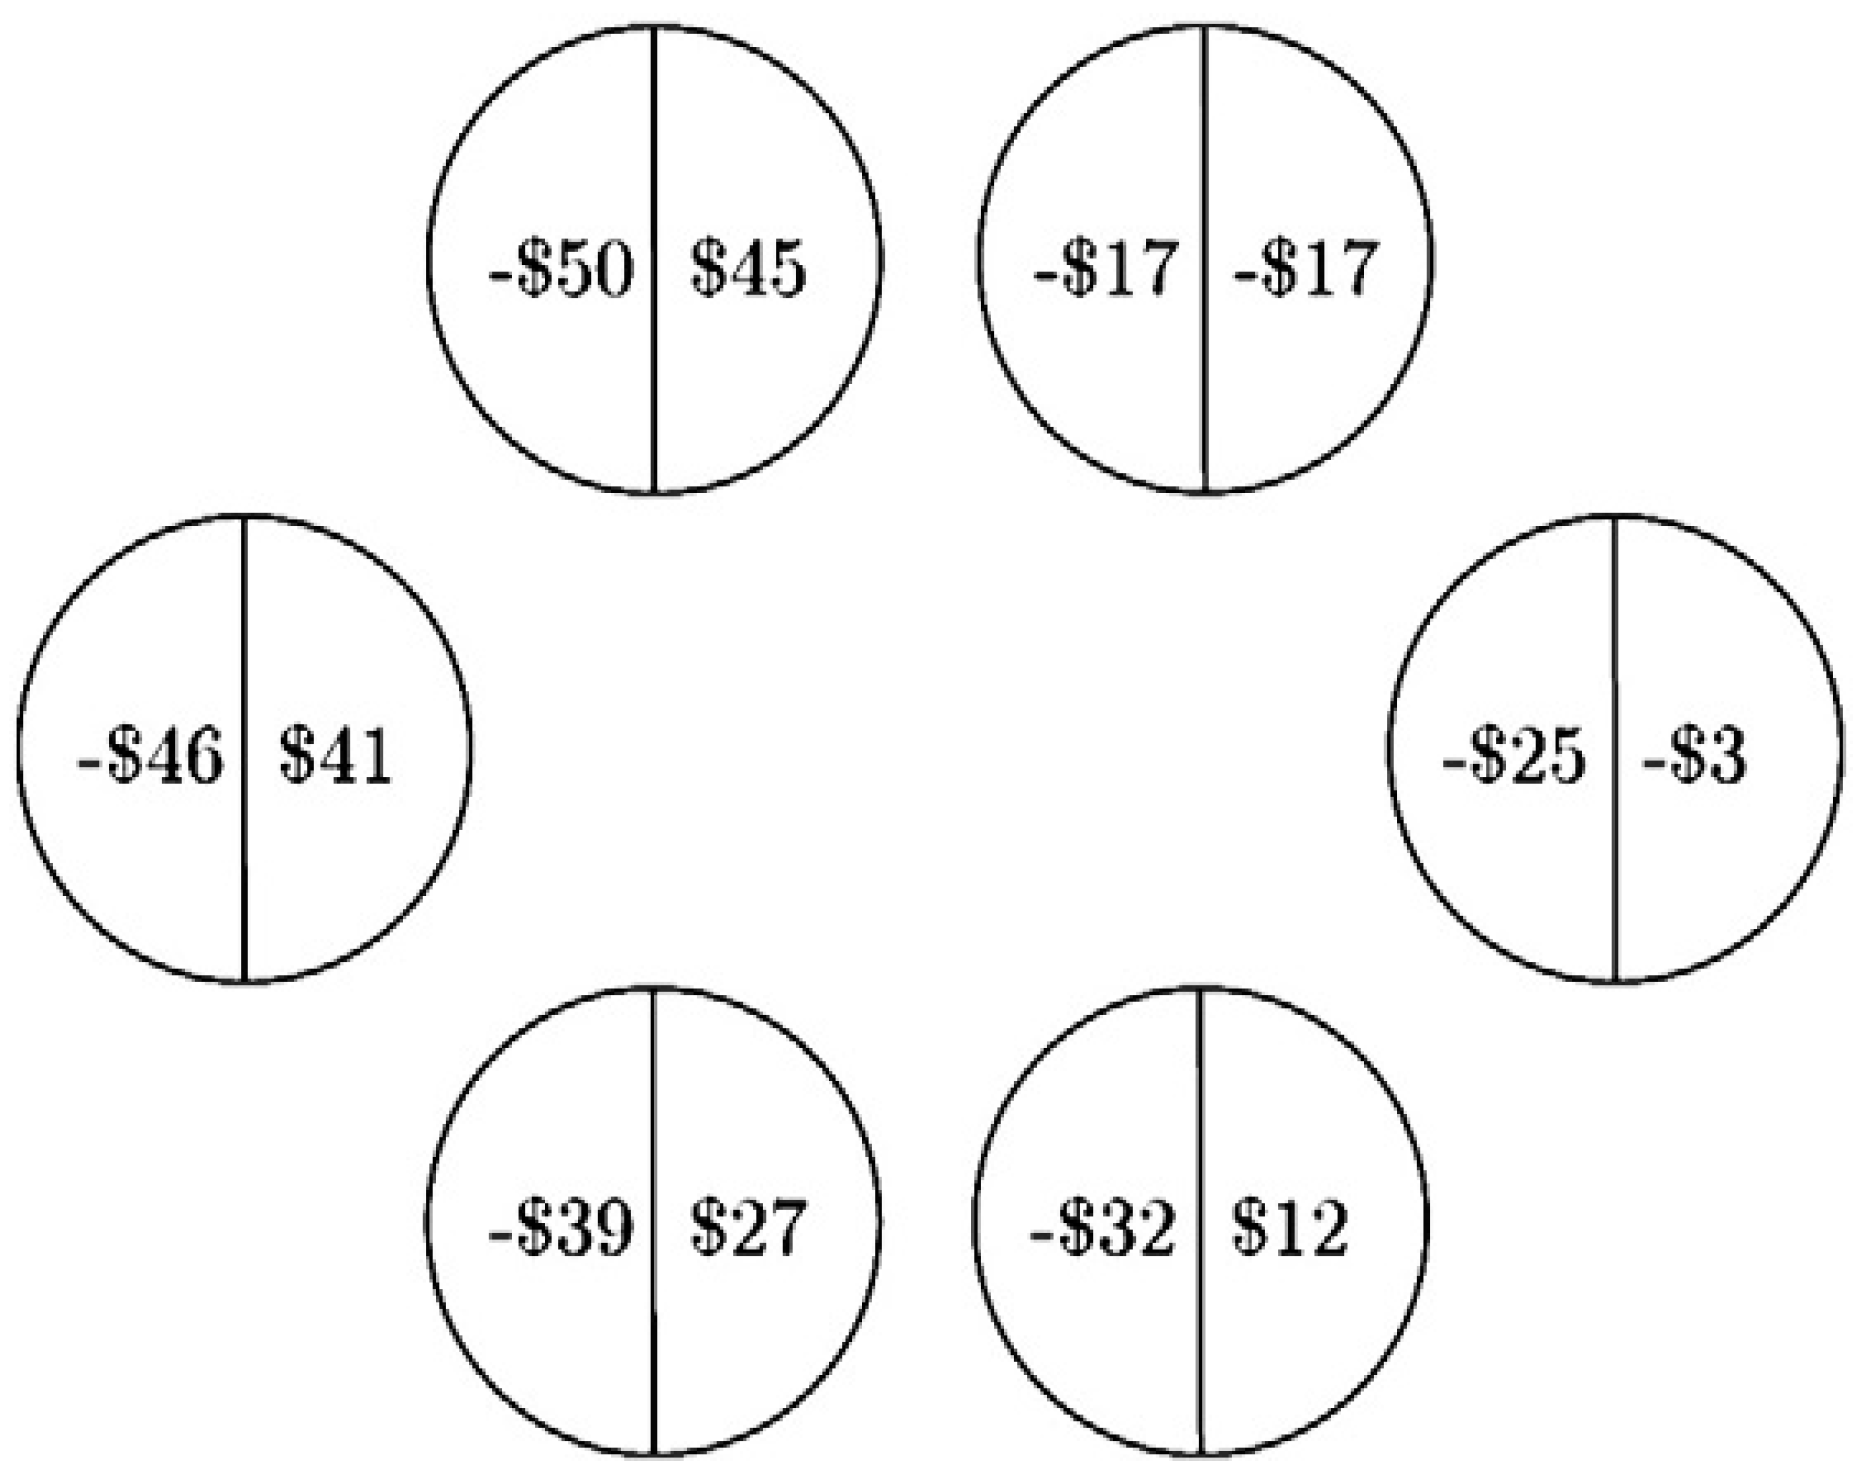
Lottery choices in the loss game. The game is based on [46]. Value are in 2014 BRL. This game intends to capture baseline attitudes towards risk. Subjects choose one of six lotteries. As one moves clock-wise around the ring, the lotteries increase in risk and expected payoff except for the last lottery, which has the same expected payoff as the fifth but is riskier. Within each lottery, the odds of a high payment are the same as the odds of a low payment (50% probability). To determine payouts for the task, participants choose one lottery to play. A computer then randomly draws an outcome. This game is essentially equal to the risk game with $50 being subtracted to the payoffs. Participants are given an endowment of $50 to ensure that no one will lose money by participating in this game.
Figure A3.
Lottery choices in the loss game. The game is based on [46]. Value are in 2014 BRL. This game intends to capture baseline attitudes towards risk. Subjects choose one of six lotteries. As one moves clock-wise around the ring, the lotteries increase in risk and expected payoff except for the last lottery, which has the same expected payoff as the fifth but is riskier. Within each lottery, the odds of a high payment are the same as the odds of a low payment (50% probability). To determine payouts for the task, participants choose one lottery to play. A computer then randomly draws an outcome. This game is essentially equal to the risk game with $50 being subtracted to the payoffs. Participants are given an endowment of $50 to ensure that no one will lose money by participating in this game.

Appendix C. Field Instructions
We designed and implemented the conversion games, the risk games, and the socioeconomic questionnaire used in this research. The three modules were administered to almost 600 farmers recruited by three different research teams in 20 municipalities of the state of Mato Grosso. These farmers were recruited using local contacts from cooperatives, unions, extension services, research institutions, and universities. The recruitment efforts focused on farmers or farm managers that operated at least 500 hectares of land.
The enumerators from the three teams conducting the field research were trained to ensure the conversion games and the risk games were administered correctly. The enumerators received a manual of field instructions providing guidelines in the organization of the groups of farmers and the conduction of the games. We have included the field manual the enumerators received as a supplement in Supplementary Materials file.
References
- Benveniste, H.; Boucher, O.; Guivarch, C.; Le Treut, H.; Criqui, P. Impacts of nationally determined contributions on 2030 global greenhouse gas emissions: Uncertainty analysis and distribution of emissions. Environ. Res. Lett. 2018, 13, 014022. [Google Scholar] [CrossRef]
- CPI. Production and Protection: A First Look at Key Challenges; Climate Policy Initiative: San Francisco, CA, USA, 2013. [Google Scholar]
- IPCC. Climate Change 2014: Mitigation of Climate Change; Intergovernmental Panel on Climate Change: Geneva, Switzerland, 2014. [Google Scholar]
- Cohn, A.S.; Mosnier, A.; Havlik, P.; Valin, H.; Herrero, M.; Schmid, E.; O’Hare, M.; Obersteiner, M. Cattle ranching intensification in Brazil can reduce global greenhouse gas emissions by sparing land from deforestation. Proc. Natl. Acad. Sci. USA 2014, 111, 7236–7241. [Google Scholar] [CrossRef] [Green Version]
- Soussana, J.F.; Lutfalla, S.; Ehrhardt, F.; Rosenstock, T.; Lamanna, C.; Havlík, P.; Richards, M.; Chotte, J.L.; Torquebiau, E.; Ciais, P.; et al. Matching policy and science: Rationale for the ‘4 per 1000-soils for food security and climate’ initiative. Soil Tillage Res. 2017. [Google Scholar] [CrossRef]
- Alexander, P.; Brown, C.; Arneth, A.; Finnigan, J.; Moran, D.; Rounsevell, M.D. Losses, inefficiencies and waste in the global food system. Agric. Syst. 2017, 153, 190–200. [Google Scholar] [CrossRef]
- Grassi, G.; House, J.; Dentener, F.; Federici, S.; den Elzen, M.; Penman, J. The key role of forests in meeting climate targets requires science for credible mitigation. Nat. Clim. Chang. 2017, 7, 220. [Google Scholar] [CrossRef]
- Springmann, M.; Mason-D’Croz, D.; Robinson, S.; Wiebe, K.; Godfray, H.C.J.; Rayner, M.; Scarborough, P. Mitigation potential and global health impacts from emissions pricing of food commodities. Nat. Clim. Chang. 2017, 7, 69–74. [Google Scholar] [CrossRef]
- Frank, S.; Havlík, P.; Stehfest, E.; van Meijl, H.; Witzke, P.; Pérez-Domínguez, I.; van Dijk, M.; Doelman, J.C.; Fellmann, T.; Koopman, J.F.; et al. Agricultural non-CO2 emission reduction potential in the context of the 1.5 °C target. Nat. Clim. Chang. 2018, 9, 66–72. [Google Scholar] [CrossRef]
- Gil, J.D.; Garrett, R.D.; Rotz, A.; Daioglou, V.; Valentim, J.; Pires, G.F.; Costa, M.H.; Lopes, L.; Reis, J.C. Tradeoffs in the quest for climate smart agricultural intensification in Mato Grosso, Brazil. Environ. Res. Lett. 2018, 13, 064025. [Google Scholar] [CrossRef] [Green Version]
- Silva, R.D.O.; Barioni, L.G.; Pellegrino, G.Q.; Moran, D. The role of agricultural intensification in Brazil’s Nationally Determined Contribution on emissions mitigation. Agric. Syst. 2018, 161, 102–112. [Google Scholar] [CrossRef]
- Cohn, A.S.; Gil, J.; Berger, T.; Pellegrina, H.; Toledo, C. Patterns and processes of pasture to crop conversion in Brazil: Evidence from Mato Grosso State. Land Use Policy 2016, 55, 108–120. [Google Scholar] [CrossRef]
- Searchinger, T.D.; Wirsenius, S.; Beringer, T.; Dumas, P. Assessing the efficiency of changes in land use for mitigating climate change. Nature 2018, 564, 249–253. [Google Scholar] [CrossRef]
- Zalles, V.; Hansen, M.C.; Potapov, P.V.; Stehman, S.V.; Tyukavina, A.; Pickens, A.; Song, X.P.; Adusei, B.; Okpa, C.; Aguilar, R.; et al. Near doubling of Brazil’s intensive row crop area since 2000. Proc. Natl. Acad. Sci. USA 2018. [Google Scholar] [CrossRef] [PubMed]
- Strassburg, B.B.; Latawiec, A.E.; Barioni, L.G.; Nobre, C.A.; da Silva, V.P.; Valentim, J.F.; Vianna, M.; Assad, E.D. When enough should be enough: Improving the use of current agricultural lands could meet production demands and spare natural habitats in Brazil. Glob. Environ. Chang. 2014, 28, 84–97. [Google Scholar] [CrossRef] [Green Version]
- Gouvello, C.D. Brazil Low-Carbon Country Case Study; Food and Agriculture Organization of the United Nations: Rome, Italy, 2010. [Google Scholar]
- Bento de Souza Ferreira Filho, J.; Ribera, L.; Horridge, M. Deforestation control and agricultural supply in Brazil. Am. J. Agric. Econ. 2015, 97, 589–601. [Google Scholar] [CrossRef]
- Plevin, R.J.; Beckman, J.; Golub, A.A.; Witcover, J.; O’Hare, M. Carbon accounting and economic model uncertainty of emissions from biofuels-induced land use change. Environ. Sci. Technol. 2015, 49, 2656–2664. [Google Scholar] [CrossRef] [PubMed]
- Prestele, R.; Alexander, P.; Rounsevell, M.D.; Arneth, A.; Calvin, K.; Doelman, J.; Eitelberg, D.A.; Engström, K.; Fujimori, S.; Hasegawa, T.; et al. Hotspots of uncertainty in land-use and land-cover change projections: A global-scale model comparison. Glob. Chang. Biol. 2016, 22, 3967–3983. [Google Scholar] [CrossRef]
- Jansen, H.G.; Stoorvogel, J.J. Quantification of aggregation bias in regional agricultural land use models: Application to Guácimo county, Costa Rica. Agric. Syst. 1998, 58, 417–439. [Google Scholar] [CrossRef]
- Parker, D.C.; Manson, S.M.; Janssen, M.A.; Hoffmann, M.J.; Deadman, P. Multi-agent systems for the simulation of land-use and land-cover change: a review. Ann. Assoc. Am. Geogr. 2003, 93, 314–337. [Google Scholar] [CrossRef]
- Verburg, P.H.; Schot, P.P.; Dijst, M.J.; Veldkamp, A. Land use change modelling: Current practice and research priorities. GeoJournal 2004, 61, 309–324. [Google Scholar] [CrossRef]
- Lambin, E.F.; Geist, H.J. Land-Use and Land-Cover Change: Local Processes and Global Impacts; Springer: Berlin/Heidelberg, Germany, 2008. [Google Scholar]
- Angelsen, A. Policies for reduced deforestation and their impact on agricultural production. Proc. Natl. Acad. Sci. USA 2010, 107, 19639–19644. [Google Scholar] [CrossRef] [PubMed] [Green Version]
- Spera, S.A.; Cohn, A.S.; VanWey, L.K.; Mustard, J.F.; Rudorff, B.F.; Risso, J.; Adami, M. Recent cropping frequency, expansion, and abandonment in Mato Grosso, Brazil had selective land characteristics. Environ. Res. Lett. 2014, 9, 064010. [Google Scholar] [CrossRef] [Green Version]
- Bragança, A. Prices, Land Use and Deforestation: Evidence from the Tapaj’os Basin; Climate Policy Initiative: Rio de Janeiro, Brazil, 2016. [Google Scholar]
- Fontes, F.; Palmer, C. “Land Sparing” in a von Thünen Framework: Theory and Evidence from Brazil. Land Econ. 2018, 94, 556–576. [Google Scholar] [CrossRef]
- Pailler, S. Re-election incentives and deforestation cycles in the Brazilian Amazon. J. Environ. Econ. Manag. 2018, 88, 345–365. [Google Scholar] [CrossRef]
- Walker, R.; Browder, J.; Arima, E.; Simmons, C.; Pereira, R.; Caldas, M.; Shirota, R.; de Zen, S. Ranching and the new global range: Amazônia in the 21st century. Geoforum 2009, 40, 732–745. [Google Scholar] [CrossRef]
- Griliches, Z. Research costs and social returns: Hybrid corn and related innovations. J. Polit. Econ. 1958, 66, 419–431. [Google Scholar] [CrossRef]
- Bandiera, O.; Rasul, I. Social networks and technology adoption in northern Mozambique. Econ. J. 2006, 116, 869–902. [Google Scholar] [CrossRef]
- Conley, T.; Udry, C. Learning About a New Technology: Pineapple in Ghana. Am. Econ. J. Appl. Econ. 2010, 100, 35–69. [Google Scholar] [CrossRef]
- Duflo, E.; Kremer, M.; Robinson, J. Nudging farmers to use fertilizer: Theory and experimental evidence from Kenya. Am. Econ. Rev. 2011, 101, 2350–2390. [Google Scholar] [CrossRef]
- Kabunga, N.S.; Dubois, T.; Qaim, M. Heterogeneous information exposure and technology adoption: The case of tissue culture bananas in Kenya. Agric. Econ. 2012, 43, 473–486. [Google Scholar] [CrossRef]
- Josephson, A.L.; Ricker-Gilbert, J.; Florax, R.J. How does population density influence agricultural intensification and productivity? Evidence from Ethiopia. Food Policy 2014, 48, 142–152. [Google Scholar] [CrossRef] [Green Version]
- Baerenklau, K.A.; Knapp, K.C. Dynamics of agricultural technology adoption: Age structure, reversibility, and uncertainty. Am. J. Agric. Econ. 2007, 89, 190–201. [Google Scholar] [CrossRef]
- Giné, X.; Yang, D. Insurance, credit, and technology adoption: Field experimental evidencefrom Malawi. J. Dev. Econ. 2009, 89, 1–11. [Google Scholar] [CrossRef]
- Suri, T. Selection and comparative advantage in technology adoption. Econometrica 2011, 79, 159–209. [Google Scholar]
- Foster, A.; Rosenzweig, M. Microeconomics of Technology Adoption. Ann. Rev. Econ. 2010, 2, 395–424. [Google Scholar] [CrossRef] [Green Version]
- Liu, E.M.; Huang, J. Risk preferences and pesticide use by cotton farmers in China. J. Dev. Econ. 2013, 103, 202–215. [Google Scholar] [CrossRef]
- Kim, K.; Chavas, J.P. Technological change and risk management: An application to the economics of corn production. Agric. Econ. 2003, 29, 125–142. [Google Scholar] [CrossRef]
- Ashraf, N.; Karlan, D.; Yin, W. Tying Odysseus to the Mast: Evidence From a Commitment Savings Product in the Philippines. Q. J. Econ. 2006, 121, 635–672. [Google Scholar] [CrossRef] [Green Version]
- Bowman, M.S.; Soares-Filho, B.S.; Merry, F.D.; Nepstad, D.C.; Rodrigues, H.; Almeida, O.T. Persistence of cattle ranching in the Brazilian Amazon: A spatial analysis of the rationale for beef production. Land Use Policy 2012, 29, 558–568. [Google Scholar] [CrossRef]
- Karlan, D.S. Using experimental economics to measure social capital and predict financial decisions. Am. Econ. Rev. 2005, 95, 1688–1699. [Google Scholar] [CrossRef]
- Cassar, A.; Crowley, L.; Wydick, B. The effect of social capital on group loan repayment: Evidence from field experiments. Econ. J. 2007, 117, 85–106. [Google Scholar] [CrossRef]
- Cardenas, J.C.; Carpenter, J. Risk attitudes and economic well-being in Latin America. J. Dev. Econ. 2013, 103, 52–61. [Google Scholar] [CrossRef]
- Carvalho, L.S.; Meier, S.; Wang, S.W. Poverty and economic decision-making: Evidence from changes in financial resources at payday. Am. Econ. Rev. 2016, 106, 260–284. [Google Scholar] [CrossRef] [PubMed]
- Brazilian Institute of Geography and Statistics. Municipal Agricultural Data Report (PAM). 2016. Available online: http://www.sidra.ibge.gov.br (accessed on 14 January 2019).
- De Geografia e Estatística, I.B. Pesquisa Pecuária Municipal. 2017. Available online: https://ww2.ibge.gov.br/ (accessed on 14 January 2019).
- Richards, P.D.; Walker, R.T.; Arima, E.Y. Spatially complex land change: The Indirect effect of Brazil’s agricultural sector on land use in Amazonia. Glob. Environ. Chang. 2014, 29, 1–9. [Google Scholar] [CrossRef] [PubMed]
- Assunção, J.; Bragança, A. Does Technical Change in Agriculture Increase Deforestation? Evidence from the Brazilian Soybean Revolution. INPUT Working Paper. 2015. Available online: https://www.inputbrasil.org/wp-content/uploads/2015/08/Technological_Change_and_Deforestation_Working_Paper_CPI.pdf (accessed on 14 January 2019).
- VanWey, L.K.; Spera, S.; de Sa, R.; Mahr, D.; Mustard, J.F. Socioeconomic Development and Agricultural Intensification in Mato Grosso. Phil. Trans. R. Soc. B Biol. Sci. 2013, 368, 1–7. [Google Scholar] [CrossRef] [PubMed]
- Richards, P.; Pellegrina, H.; VanWey, L.; Spera, S. Soybean development: The impact of a decade of agricultural change on urban and economic growth in Mato Grosso, Brazil. PLoS ONE 2015, 10, e0122510. [Google Scholar] [CrossRef]
- Cárdenas, J.C.; Ostrom, E. What do people bring into the game? Experiments in the field about cooperation in the commons. Agric. Syst. 2004, 82, 307–326. [Google Scholar] [CrossRef] [Green Version]
- Levitt, S.D.; List, J.A. What do Laboratory Experiments Measuring Social Preferences Reveal About the Real World? J. Econ. Perspect. 2007, 21, 153–174. [Google Scholar] [CrossRef]
- Benz, M.; Meier, S. Do People Behave in Experiments as in the Field?—Evidence from Donations. Exp. Econ. 2008, 11, 268–281. [Google Scholar] [CrossRef]
- Lusk, J.L.; Norwood, F.B. Bridging the gap between laboratory experiments and naturally occurring markets: An inferred valuation method. J. Environ. Econ. Manag. 2009, 58, 236–250. [Google Scholar] [CrossRef]
- Chang, J.B.; Lusk, J.L.; Norwood, F.B. How closely do hypothetical surveys and laboratory experiments predict field behavior? Am. J. Agric. Econ. 2009, 91, 518–534. [Google Scholar] [CrossRef]
- Altonji, J.G.; Elder, T.E.; Taber, C.R. Selection on observed and unobserved variables: Assessing the effectiveness of Catholic schools. J. Polit. Econ. 2005, 113, 151–184. [Google Scholar] [CrossRef]
- List, J.A. The behavioralist meets the market: Measuring social preferences and reputation effects in actual transactions. J. Polit. Econ. 2006, 114, 1–37. [Google Scholar] [CrossRef]
- Assunção, J.; Chiavari, J. Land Rental Markets in Brazil: A Missed Opportunity; Climate Policy Initiative: San Francisco, CA, USA, 2014. [Google Scholar]
- Voors, M.; Turley, T.; Kontoleon, A.; Bulte, E.; List, J.A. Exploring whether behavior in context-free experiments is predictive of behavior in the field: Evidence from lab and field experiments in rural Sierra Leone. Econ. Lett. 2012, 114, 308–311. [Google Scholar] [CrossRef]
- Coppock, A.; Green, D.P. Assessing the Correspondence between Experimental Results Obtained in the Lab and Field: A Review of Recent Social Science Research. Polit. Sci. Res. Methods 2015, 3, 113–131. [Google Scholar] [CrossRef]
Figure 1.
Study site. We conducted research across 20 municipalities of Mato Grosso, Brazil identified in preliminary interviews with experts to be of importance for pasture to crop conversion either because they were sites of recent pasture to crop conversion or were home to wealthy producers who engaged in pasture to crop conversion elsewhere. Most of the municipalities in our sample were in the former category. The municipalities were Agua Boa, Alta Floresta, Alto Boa Vista, Baianos, Brasnorte, Canarana, Claudia, Itanhanga, Juara, Juina, Lucas do Rio Verde, Marcelandia, Porto dos Gauchos, Querencia, Santa Carmem, Sao Felix do Araguaia, Sinop, Sorriso, Tapurah, and Vera).

Figure 2.
Survey Instrument. In 2014, we targeted recruitment of a sample of 600 producers farming properties of >500 hectares in Mato Grosso, Brazil. In total of 598 subjects participated in the experiments. Of this 598, just 559 were included in this analysis due to data collection errors. Data collection consisted of three components: a farm survey, a set of classic risk games, and custom-built risk games meant to emulate pasture to crop conversion choices).


Table 1.
Descriptive statistics by conversion choices.
| Do Nothing | Lease | Sell | Convert | Total | |
|---|---|---|---|---|---|
| Risk preference | 2.76 | 2.95 | 2.40 | 2.72 | 2.75 |
| (1.54) | (1.66) | (1.12) | (1.56) | (1.54) | |
| Loss aversion | 0.99 | 1.12 | 1.40 | 1.00 | 1.02 |
| (2.04) | (2.17) | (1.92) | (2.04) | (2.05) | |
| Ambiguity aversion | 0.10 | 0.02 | |||
| (1.54) | (1.51) | (1.16) | (1.48) | (1.50) | |
| First conv. (yrs) | 4.21 | 6.27 | 8.67 | 7.88 | 5.76 |
| (5.46) | (4.04) | (8.65) | (6.77) | (6.21) | |
| No-till (1 = yes 0 = no) | 0.52 | 0.73 | 0.60 | 0.92 | 0.68 |
| (0.50) | (0.45) | (0.51) | (0.28) | (0.47) | |
| Farm size (1000*ha) | 1.41 | 1.09 | 1.56 | 2.78 | 1.87 |
| (2.95) | (1.22) | (1.73) | (6.14) | (4.30) | |
| Age (yrs) | 46.00 | 49.61 | 49.80 | 45.07 | 46.04 |
| (13.07) | (11.66) | (9.48) | (12.25) | (12.64) | |
| School (yrs) | 11.74 | 11.29 | 13.27 | 12.10 | 11.87 |
| (4.61) | (4.40) | (3.41) | (4.04) | (4.38) | |
| Born in other state | 0.86 | 1.00 | 0.87 | 0.88 | 0.88 |
| (0.34) | (0.00) | (0.35) | (0.32) | (0.33) | |
| Slope (dec. degrees) | 1.45 | 1.14 | 0.87 | 0.85 | 1.20 |
| (0.65) | (0.49) | (0.31) | (0.29) | (0.60) | |
| Soy transp. cost (2014 USD/ton) | 84.99 | 89.56 | 85.06 | 79.35 | 83.36 |
| (19.61) | (15.84) | (16.64) | (14.92) | (18.00) | |
| Good soils | 0.91 | 0.90 | 0.80 | 0.86 | 0.89 |
| (0.11) | (0.14) | (0.21) | (0.17) | (0.14) | |
| Nearby crop (ha w/i 25 km) | 519.13 | 535.86 | 468.45 | 531.01 | 523.14 |
| (163.22) | (136.89) | (198.45) | (191.68) | (172.87) | |
| N | 308 | 41 | 15 | 195 | 559 |
This table reports differences in descriptive statistics across research subjects according to the most recent type of pasture to crop conversion that they performed. Group means are unbracketed and standard deviations are reported in brackets. “Risk preference", “Loss aversion", and “Ambiguity aversion" were estimating using experimental games described in Appendix A. Risk preference is an ordinal ranking from (1-6) of tendency to select risky choices in experimental games. Loss aversion is measure of the difference between a risk game with the potential for loss (also measured on a 1-6 scale) and the risk preference game. Ambiguity aversion is a measure of the difference between the risk preference game and a game equal but for ambiguity of risk (the ambiguity game is also measured on a 1-6 scale). The abbreviation “First conv." is a measure equal to the numbers of years that elapsed from the first time the subject converted pasture to cropland and 2014. The variables "No-till" and “Farm size" describe characteristics of the farm of the research subject. The variables “Age", “School", and “Born in other state” described characteristics of the subject. All remaining variables describe characteristics of the municipality of residence of the subject in the year 2013.
Table 2.
Sharply contrasting choices in unframed vs. framed risk games.
| Without Framing | With Framing | |||||||||
|---|---|---|---|---|---|---|---|---|---|---|
| Nothing | Lease | Sell | Convert | Total | ||||||
| N | % | N | % | N | % | N | % | N | % | |
| Nothing | 2 | 0.4% | 43 | 7.7% | 3 | 0.5% | 64 | 11.4% | 112 | 20.0% |
| Lease | 3 | 0.5% | 55 | 9.8% | 3 | 0.5% | 71 | 12.7% | 132 | 23.6% |
| Sell | 5 | 0.9% | 52 | 9.3% | 4 | 0.7% | 81 | 14.5% | 142 | 25.4% |
| Convert | 8 | 1.4% | 61 | 10.9% | 4 | 0.7% | 100 | 17.9% | 173 | 30.9% |
| Total | 18 | 3.2% | 211 | 37.7% | 14 | 2.5% | 316 | 56.5% | 559 | 100.0% |
Statistics are computed using data from all research subjects who completed the experimental games (n = 559).
Table 3.
Effects of framing on experimental choices.
| Nothing | Lease | Sell | Convert | |
|---|---|---|---|---|
| (1) | (2) | (3) | (4) | |
| Framing | *** | 0.141 ** | *** | 0.256 *** |
| (0.034) | (0.056) | (0.036) | (0.045) | |
| Individual FE | Yes | Yes | Yes | Yes |
| R2 | 0.040 | 0.066 | 0.115 | 0.082 |
| N | 1118 | 1118 | 1118 | 1118 |
The table reports the results from regressing experimental choices on an indicator of framing while controlling for individual fixed effects. Robust standard errors are reported in parentheses. *** p < 0.01; ** p < 0.05; * p < 0.10.
Table 4.
The response of experimental choices to price and risk treatments.
| Nothing | Lease | Sell | Convert | |||||
|---|---|---|---|---|---|---|---|---|
| Framed | Unframed | Framed | Unframed | Framed | Unframed | Framed | Unframed | |
| (1) | (2) | (3) | (4) | (5) | (6) | (7) | (8) | |
| High price | 0.05 | 0.03 | *** | 0.00 | 0.10 *** | |||
| (0.01) | (0.03) | (0.04) | (0.04) | (0.01) | (0.04) | (0.04) | (0.04) | |
| High risk | 0.00 | 0.03 | 0.04 | 0.02 | ||||
| (0.01) | (0.03) | (0.04) | (0.04) | (0.01) | (0.04) | (0.04) | (0.04) | |
| Diff. of price coef. (p value) | 0.05 | 0.02 | 0.02 | 0.92 | ||||
| Diff. of risk coef. (p value) | 0.10 | 0.46 | 0.58 | 0.67 | ||||
| Controls | Yes | Yes | Yes | Yes | Yes | Yes | Yes | Yes |
| R2 | 0.02 | 0.00 | 0.04 | 0.02 | 0.07 | 0.04 | 0.01 | 0.03 |
| N | 559 | 559 | 559 | 559 | 559 | 559 | 559 | 559 |
The table reports the results from regressing experimental choices on indicators of price and risk treatments and a set of individual characteristics. Odd columns use the results from the framed experiment and even columns from the unframed experiment. Robust standard errors are reported in parentheses. *** p < 0.01; ** p < 0.05; * p < 0.10.
Table 5.
Choices in framed risk game contrast with field behavior.
| Conversion Choices | With Framing | |||||||||||||
|---|---|---|---|---|---|---|---|---|---|---|---|---|---|---|
| Nothing | Lease | Sell | Convert | Total | ||||||||||
| N | % | N | % | N | % | N | % | N | % | |||||
| Nothing | 13 | 2.3% | 103 | 18.4% | 12 | 2.1% | 180 | 32.2% | 308 | 55.1% | ||||
| Lease | 0 | 0.0% | 27 | 4.8% | 0 | 0.0% | 14 | 2.5% | 41 | 7.3% | ||||
| Sell | 0 | 0.0% | 4 | 0.7% | 0 | 0.0% | 11 | 2.0% | 15 | 2.7% | ||||
| Convert | 5 | 0.9% | 77 | 13.8% | 2 | 0.4% | 111 | 19.9% | 195 | 34.9% | ||||
| Total | 18 | 3.2% | 211 | 37.7% | 14 | 2.5% | 316 | 56.5% | 559 | 100.0% | ||||
Statistics are computed using data from all subjects who completed the experimental games (n = 559).
Table 6.
Field behavior contrasts with choices in unframed risk game.
| Conversion Choices | With Framing | |||||||||||||
|---|---|---|---|---|---|---|---|---|---|---|---|---|---|---|
| Nothing | Lease | Sell | Convert | Total | ||||||||||
| N | % | N | % | N | % | N | % | N | % | |||||
| Nothing | 64 | 11.4% | 69 | 12.3% | 68 | 12.2% | 107 | 19.1% | 308 | 55.1% | ||||
| Lease | 8 | 1.4% | 12 | 2.1% | 10 | 1.8% | 11 | 2.0% | 41 | 7.3% | ||||
| Sell | 4 | 0.7% | 3 | 0.5% | 4 | 0.7% | 4 | 0.7% | 15 | 2.7% | ||||
| Convert | 36 | 6.4% | 48 | 8.6% | 60 | 10.7% | 51 | 9.1% | 195 | 34.9% | ||||
| Total | 112 | 20.0% | 132 | 23.6% | 142 | 25.4% | 173 | 30.9% | 559 | 100.0% | ||||
Statistics are computed using data from all subjects who completed the experimental games (n = 559).
Table 7.
Associations between switching behavior and subject characteristics.
| Change in Risk Behavior | Non Production Utility of Land | Work the Land | ||||
|---|---|---|---|---|---|---|
| (1) | (2) | (3) | (4) | (5) | (6) | |
| Risk preference | ** | *** | ||||
| (0.028) | (0.029) | (0.015) | (0.015) | (0.015) | (0.015) | |
| Loss aversion | * | *** | *** | |||
| (0.020) | (0.021) | (0.011) | (0.011) | (0.011) | (0.011) | |
| Ambiguity aversion | 0.004 | 0.006 | ||||
| (0.026) | (0.026) | (0.015) | (0.015) | (0.014) | (0.014) | |
| First conv. | 0.002 | 0.000 | 0.001 | 0.000 | ||
| (0.006) | (0.006) | (0.003) | (0.003) | (0.003) | (0.003) | |
| No-till | 0.004 | 0.024 | 0.067 | 0.103 ** | 0.031 | 0.083 * |
| (0.076) | (0.092) | (0.042) | (0.046) | (0.040) | (0.048) | |
| Area | * | |||||
| (0.007) | (0.007) | (0.003) | (0.004) | (0.004) | (0.005) | |
| Age | 0.006 * | 0.006 | 0.003 | 0.002 | 0.003 | 0.003 * |
| (0.003) | (0.003) | (0.002) | (0.002) | (0.002) | (0.002) | |
| Schooling | ** | *** | ||||
| (0.009) | (0.009) | (0.005) | (0.005) | (0.005) | (0.005) | |
| Born in other state | 0.037 | 0.047 | 0.016 | 0.016 | 0.015 | |
| (0.119) | (0.118) | (0.062) | (0.064) | (0.059) | (0.061) | |
| Municipality FE | No | Yes | No | Yes | No | Yes |
| R2 | 0.035 | 0.046 | 0.012 | 0.059 | 0.015 | 0.030 |
| N | 559 | 559 | 559 | 559 | 559 | 559 |
The table reports the results from regressing the changes in risk behavior across the framed vs. unframed experiments on a set of individual characteristics (for further discussion of these individual level variables please refer to Table 1). Columns 1 and 2 use a variable that is 1 when the subject chose more aggressively in the experiment with framing, when the subject chose more conservatively in the experiment with framing and 0 otherwise as the dependent variable. Columns 3 and 4 use a indicator denoting whether the subject chose more aggressively in the experiment with framing as the dependent variable. Columns 5 and 6 use a indicator denoting whether the subject chose more conservatively in the experiment with framing as the dependent variable. Robust standard errors are reported in parentheses. *** p < 0.01; ** p < 0.05; * p < 0.10.
Table 8.
Predictors of pasture to crop conversion.
| Convert (0/1) | |||||||
|---|---|---|---|---|---|---|---|
| (1) | (2) | (3) | (4) | (5) | (6) | (7) | |
| Lease-no framing | 0.013 | 0.013 | |||||
| (0.059) | (0.059) | ||||||
| Sell-no framing | 0.064 | 0.065 | |||||
| (0.057) | (0.058) | ||||||
| Convert-no framing | |||||||
| (0.057) | (0.057) | ||||||
| Lease-framing | 0.088 | 0.084 | |||||
| (0.110) | (0.112) | ||||||
| Sell-framing | |||||||
| (0.145) | (0.147) | ||||||
| Convert-framing | 0.037 | 0.036 | |||||
| (0.109) | (0.111) | ||||||
| Change in risk behavior | 0.021 | 0.020 | |||||
| (0.022) | (0.027) | ||||||
| Land preferences | 0.075 * | 0.018 | |||||
| (0.039) | (0.052) | ||||||
| Non-prod. benefits of landholding | 0.106 *** | 0.101 ** | |||||
| (0.040) | (0.046) | ||||||
| Ind. Control | Yes | Yes | Yes | Yes | Yes | Yes | Yes |
| Muni. Controls | Yes | Yes | Yes | Yes | Yes | Yes | Yes |
| Observations | 559 | 559 | 559 | 559 | 559 | 559 | 559 |
| R-squared | 0.30 | 0.29 | 0.30 | 0.31 | 0.31 | 0.32 | 0.32 |
This table reports the results from regressing an indicator denoting any type of pasture to cropland conversion (sell, lease, self-convert) on choices in the custom-built risk games. Columns 1–3 show regressions of this indicator on the choices in the custom-built games with and without framing. Columns 4–7 show regressions of this indicator on three measures of framed vs. unframed choices detailed in the main text. All regressions control for individual-level characteristics (for further discussion of these variables please refer to Table 1). Robust standard errors are reported in parentheses. *** p < 0.01; ** p < 0.05; * p < 0.10.
Table 9.
Predictors of self-conversion of pasture to cropland.
| Self-Convert (0/1) | |||||||
|---|---|---|---|---|---|---|---|
| (1) | (2) | (3) | (4) | (5) | (6) | (7) | |
| Lease-no framing | 0.022 | 0.022 | |||||
| (0.058) | (0.058) | ||||||
| Sell-no framing | 0.077 | 0.077 | |||||
| (0.057) | (0.057) | ||||||
| Convert-no framing | |||||||
| (0.055) | (0.056) | ||||||
| Lease-framing | 0.015 | 0.011 | |||||
| (0.109) | (0.111) | ||||||
| Sell-framing | |||||||
| (0.145) | (0.148) | ||||||
| Convert-framing | |||||||
| (0.107) | (0.109) | ||||||
| Change in risk behavior | 0.032 | 0.021 | |||||
| (0.021) | (0.026) | ||||||
| Land preferences | 0.106 *** | 0.051 | |||||
| (0.038) | (0.050) | ||||||
| Non-production benefits of landholding | 0.110 *** | 0.091 ** | |||||
| (0.038) | (0.044) | ||||||
| Ind. Control | Yes | Yes | Yes | Yes | Yes | Yes | Yes |
| Muni. Controls | Yes | Yes | Yes | Yes | Yes | Yes | Yes |
| Observations | 559 | 559 | 559 | 559 | 559 | 559 | 559 |
| R-squared | 0.32 | 0.31 | 0.32 | 0.33 | 0.33 | 0.33 | 0.34 |
This table reports the results from regressing an indicator denoting whether participant farmers converted pasture to cropland themselves. Columns 1–3 show regressions of this indicator on the choices in the custom-built games with and without framing. Columns 4–7 show regressions of this indicator on three measures of framed vs. unframed choices described in the main text. All regressions control for individual-level characteristics (for further discussion of these variables please refer to Table 1). Robust standard errors are reported in parentheses. *** p < 0.01; ** p < 0.05; * p < 0.10.
Table 10.
Predictors of pasture conversion by land sale.
| Sell (0/1) | |||||||
|---|---|---|---|---|---|---|---|
| (1) | (2) | (3) | (4) | (5) | (6) | (7) | |
| Lease-no framing | 0.006 | 0.006 | |||||
| (0.025) | (0.025) | ||||||
| Sell-no framing | 0.003 | 0.004 | |||||
| (0.024) | (0.024) | ||||||
| Convert-no framing | |||||||
| (0.024) | (0.024) | ||||||
| Lease-framing | 0.044 ** | 0.043 ** | |||||
| (0.017) | (0.018) | ||||||
| Sell-framing | 0.005 | 0.005 | |||||
| (0.018) | (0.017) | ||||||
| Convert-framing | 0.044 *** | 0.044 *** | |||||
| (0.014) | (0.014) | ||||||
| Change in risk behavior | |||||||
| (0.010) | (0.012) | ||||||
| Land preferences | |||||||
| (0.016) | (0.025) | ||||||
| Non-production benefits of landholding | 0.005 | 0.006 | |||||
| (0.018) | (0.023) | ||||||
| Ind. controls | Yes | Yes | Yes | Yes | Yes | Yes | Yes |
| Muni. controls | Yes | Yes | Yes | Yes | Yes | Yes | Yes |
| Observations | 559 | 559 | 559 | 559 | 559 | 559 | 559 |
| R-squared | 0.02 | 0.02 | 0.02 | 0.04 | 0.04 | 0.04 | 0.04 |
This table reports the results from regressing an indicator denoting whether participant farmers converted pastured to cropland via land sale on choices in the custom-built risk games. Columns 1–3 show regressions of this indicator on the choices in the custom-built games with and without framing. Columns 4–7 show regressions of this indicator on three measures of framed vs. unframed choices described in the main text. All regressions control for individual-level characteristics (for further discussion of these variables please refer to Table 1). Robust standard errors are reported in parentheses. *** p < 0.01; ** p < 0.05; * p < 0.10.
Table 11.
Predictors of pasture conversion by lease.
| Lease (0/1) | |||||||
|---|---|---|---|---|---|---|---|
| (1) | (2) | (3) | (4) | (5) | (6) | (7) | |
| Lease-no framing | 0.023 | 0.023 | |||||
| (0.035) | (0.035) | ||||||
| Sell-no framing | |||||||
| (0.032) | (0.032) | ||||||
| Convert-no framing | |||||||
| (0.031) | (0.031) | ||||||
| Lease-framing | 0.137 *** | 0.136 *** | |||||
| (0.027) | (0.027) | ||||||
| Sell-framing | |||||||
| (0.027) | (0.027) | ||||||
| Convert-framing | 0.043 ** | 0.042 ** | |||||
| (0.019) | (0.019) | ||||||
| Change in Risk Behavior | * | ||||||
| (0.014) | (0.016) | ||||||
| Land Preferences | *** | ||||||
| (0.022) | (0.030) | ||||||
| Non-Production benefits of Landholding | 0.009 | ||||||
| (0.025) | (0.030) | ||||||
| Ind. Control | Yes | Yes | Yes | Yes | Yes | Yes | Yes |
| Muni. Controls | Yes | Yes | Yes | Yes | Yes | Yes | Yes |
| Observations | 559 | 559 | 559 | 559 | 559 | 559 | 559 |
| R-squared | 0.02 | 0.05 | 0.06 | 0.04 | 0.04 | 0.03 | 0.04 |
This table reports the results from regressing an indicator denoting whether participant farmers converted pastured to cropland via lease on choices in the custom-built risk games. Columns 1–3 show regressions of this indicator on the choices in the custom-built games with and without framing. Columns 4–7 show regressions of this indicator on three measures of framed vs. unframed choices described in the main text. All regressions control for individual-level characteristics (for further discussion of these variables please refer to Table 1). Robust standard errors are reported in parentheses. *** p < 0.01; ** p < 0.05; * p < 0.10.
© 2019 by the authors. Licensee MDPI, Basel, Switzerland. This article is an open access article distributed under the terms and conditions of the Creative Commons Attribution (CC BY) license (http://creativecommons.org/licenses/by/4.0/).
Share and Cite
MDPI and ACS Style
Bragança, A.; Cohn, A.S. Predicting Intensification on the Brazilian Agricultural Frontier: Combining Evidence from Lab-In-The-Field Experiments and Household Surveys. Land 2019, 8, 21. https://0-doi-org.brum.beds.ac.uk/10.3390/land8010021
AMA Style
Bragança A, Cohn AS. Predicting Intensification on the Brazilian Agricultural Frontier: Combining Evidence from Lab-In-The-Field Experiments and Household Surveys. Land. 2019; 8(1):21. https://0-doi-org.brum.beds.ac.uk/10.3390/land8010021
Chicago/Turabian StyleBragança, Arthur, and Avery Simon Cohn. 2019. "Predicting Intensification on the Brazilian Agricultural Frontier: Combining Evidence from Lab-In-The-Field Experiments and Household Surveys" Land 8, no. 1: 21. https://0-doi-org.brum.beds.ac.uk/10.3390/land8010021
Note that from the first issue of 2016, this journal uses article numbers instead of page numbers. See further details here.