Article

Deep Tillage Improves Degraded Soils in the (Sub) Humid Ethiopian Highlands

1
Faculty of Civil and Water Resources Engineering, Bahir Dar Institute of Technology, Bahir Dar University, Bahir Dar 6000, Ethiopia
2
International Water Management Institute, HQ, P.O Box 2075, Colombo, Sri Lanka
3
Department of Agricultural and Biosystems Engineering, Makerere University, Kampala 00256, Uganda
4
Department of Soil and Environment, Swedish University of Agricultural Sciences, 75007 Uppsala, Sweden
5
Department of Biological and Environmental Engineering, Cornell University, Ithaca, NY 14853, USA
*
Author to whom correspondence should be addressed.
Submission received: 28 August 2019 / Revised: 17 October 2019 / Accepted: 18 October 2019 / Published: 24 October 2019
(This article belongs to the Special Issue Land Degradation Neutrality (LDN))

Abstract

:
Intensification of rainfed agriculture in the Ethiopian highlands has resulted in soil degradation and hardpan formation, which has reduced rooting depth, decreased deep percolation, and increased direct runoff and sediment transport. The main objective of this study was to assess the potential impact of subsoiling on surface runoff, sediment loss, soil water content, infiltration rate, and maize yield. Three tillage treatments were replicated at five locations: (i) no tillage (zero tillage), (ii) conventional tillage (ox-driven Maresha plow, up to a depth of 15 cm), and (iii) manual deep ripping of the soil’s restrictive layers down to a depth of 60 cm (deep till). Results show that the posttreatment bulk density and penetration resistance of deep tillage was significantly less than in the traditional tillage and zero-tillage systems. In addition, the posttreatment infiltration rate for deep tillage was significantly greater, which resulted in significantly smaller runoff and sedimentation rates compared to conventional tillage and zero tillage. Maize yields were improved by 6% under deep tillage compared to conventional tillage and by 29% compared to no tillage. Overall, our findings show that deep tillage can be effective in overcoming some of the detrimental effects of hardpans in degraded soils.

Graphical Abstract

1. Introduction

The Ethiopian highlands are suffering from extensive resource degradation [1,2]. Land degradation, hardpan formation, and declining soil quality act together to decrease agricultural productivity and economic growth in these landscapes [2,3]. According to the UN Sustainable Development Goal 15 (Life on Land) [4], further land degradation should be prevented. To do this information is needed on biophysical methods that will accomplish that.
Land degradation and hardpan formation in the Ethiopian highlands has been related to repeated cross-plowing of steep slopes [5], compaction by heavy agricultural implements [6], and cattle grazing [7]. In a recent study [8], soil degradation was strongly related to continuous tillage after deforestation. Tillage increases the rate of mineralization and the disintegration of aggregates, which subsequently results in finer soil particles that easily move down the soil profile during rainfall infiltration [8]. This movement accelerates hardpan formation in the upper 60 cm of the soil profile [8,9]. The hardpan restricts further infiltration and reduces hydraulic conductivity as large soil pores become filled with sediment-laden water [8,10].
Subsequently, perched water tables form when the hardpan limits deep percolation of rainfall, causing runoff and rill erosion as the soil becomes saturated. Hardpans also restrict root growth, reducing water and nutrient uptake by plants [11]. Most roots of agricultural crops will not grow in soils with a penetration resistance of greater than 2 MPa [12]. Bulk densities in untilled soils were significantly greater than for conventionally tilled soils [13]. Farmers are avoiding tillage on soils with severe erosion or suboptimal soil moisture contents, and when time and labor requirements for tillage are not available [14].
Solutions to soil compaction problems [15] to decrease the bulk density of the soil and increase the porosity include the following: adding manure or increasing the organic matter content of the soil; mechanical loosening, such as deep ripping or deep tillage; practicing crop rotation, especially with a deeply rooted crop; and controlled traffic and reduced livestock grazing.
Deep tillage is a practice that breaks up soil, usually at depths of 30–45 cm. This is undertaken in order to reduce soil compaction, rip the hardpan, reduce the soil bulk density and soil strength, thereby encouraging deeper rooting of plants, and improving soil infiltration rates and plants’ access to water and minerals [16]. Conventional tillage can break up the soil from 10 to 15 cm, but it may be inadequate where soil compaction is a problem [7]. Deep tillage reduces soil bulk density and decreases runoff and soil loss [17]. In Western Iran, plowing to a depth of 30 cm and turning under soil and crop residues resulted in longer roots and lower soil bulk density and cone index [11].
Low permeability soils are widespread in crop land areas globally, and deep plowing could greatly increase the vertical permeability in such areas [18]. Preventing hardpans from forming or ripping and loosening existing hardpans will allow more extensive root growth, increase water infiltration, and reduce runoff; it may also result in greater water availability for the crop. Little information is available in subhumid regions in Ethiopia on how hardpans influence hydrological processes and crop production. Hence, the main objective of this study was to assess the impact of deep tillage of degraded soils with a hardpan on surface runoff, shallow groundwater recharge, sediment loss, and crop yield.

2. Materials and Methods

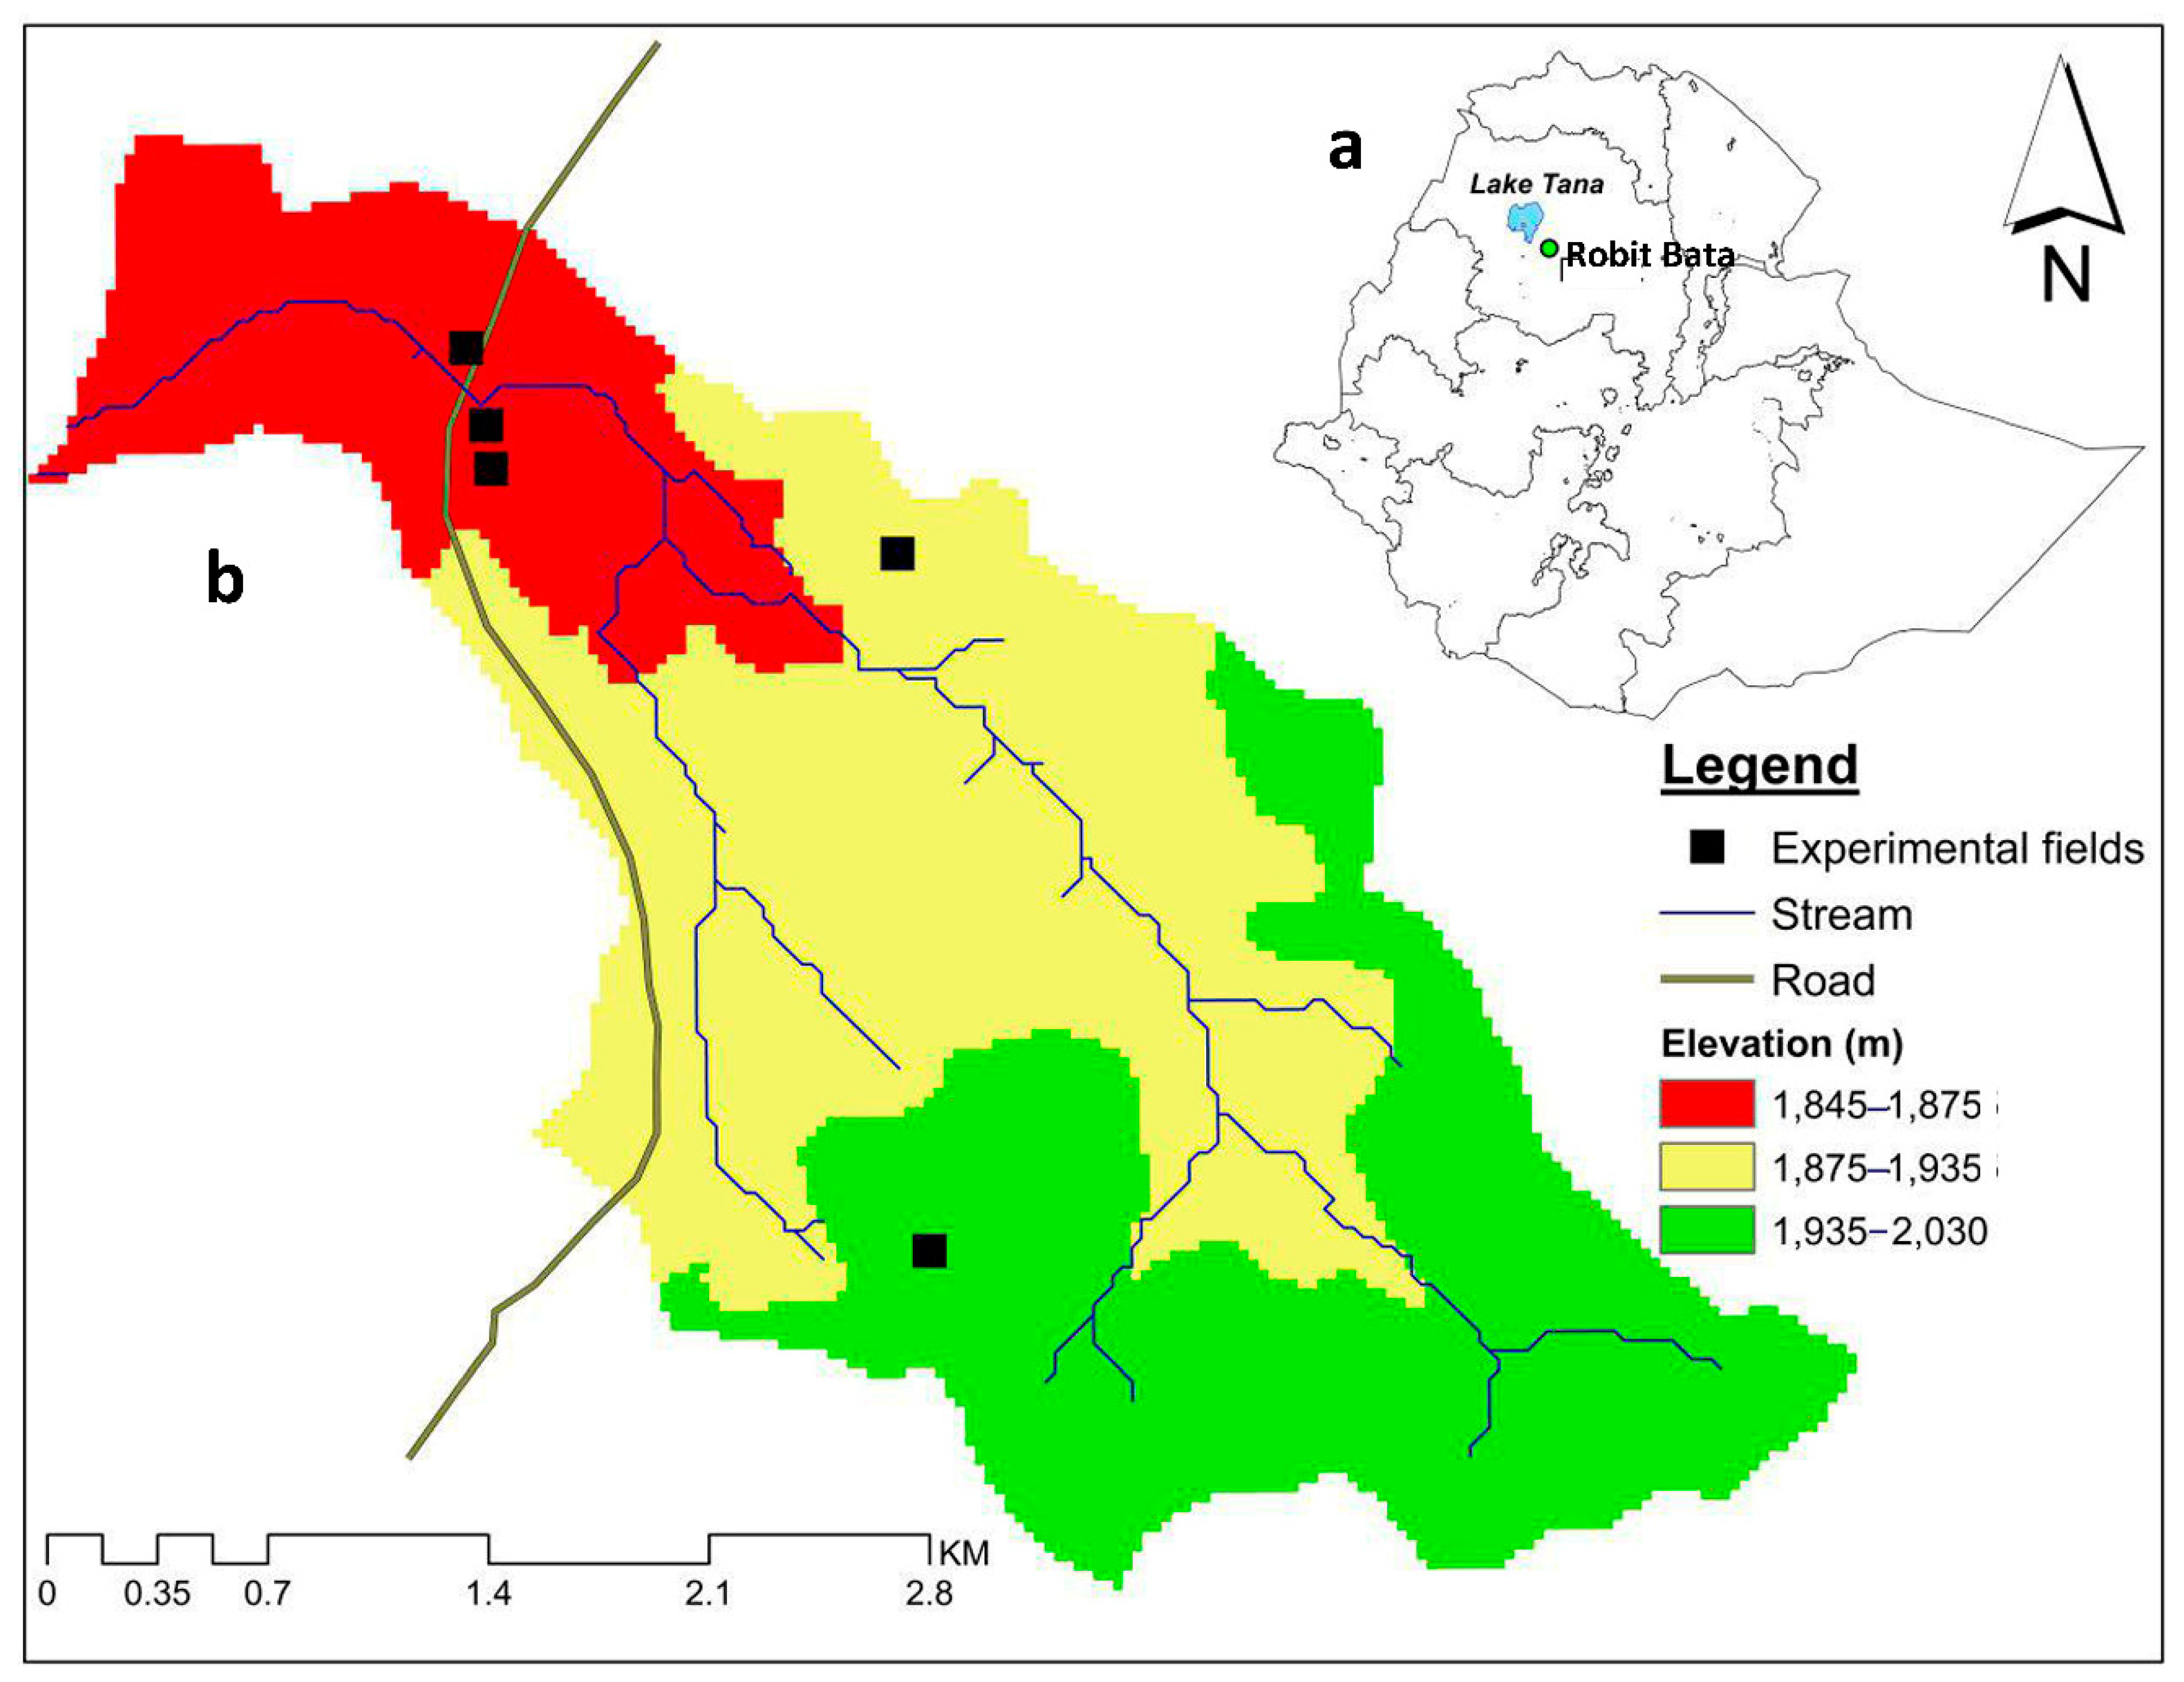
2.1. Description of the Study Area

This study was conducted in the 911-ha Robit-Bata watershed, located 10 km north of Bahir Dar, near Lake Tana (Figure 1). The climate is subtropical (Woina Dega), with a mean annual rainfall of 1500 mm. Rural livelihoods are primarily derived from farming and rainfed agriculture and livestock production. Rainfed crops include maize, teff, millet, and barley. Soils are volcanically derived and predominantly consist of chromic Vertisols in the lower watershed, with clay content ranging between 64% and 82% and organic matter ranging from 0.3% to 1.7%, and Eutric Nitosols in the upper watershed with clay content between 30% and 78% and organic matter from 0.6% to 2.2%.
Depending on the crop, land preparation generally begins in May, at the start of the rain phase, with sowing in June. Land preparation was undertaken by an oxen-driven Maresha plough to a depth of 10–15 cm. Plots were ploughed three to five times prior to planting, depending on crop and soil type. Weed management is primarily manual, although some herbicides may be used. Between cropping seasons, animals are allowed to graze, which may contribute to soil compaction.

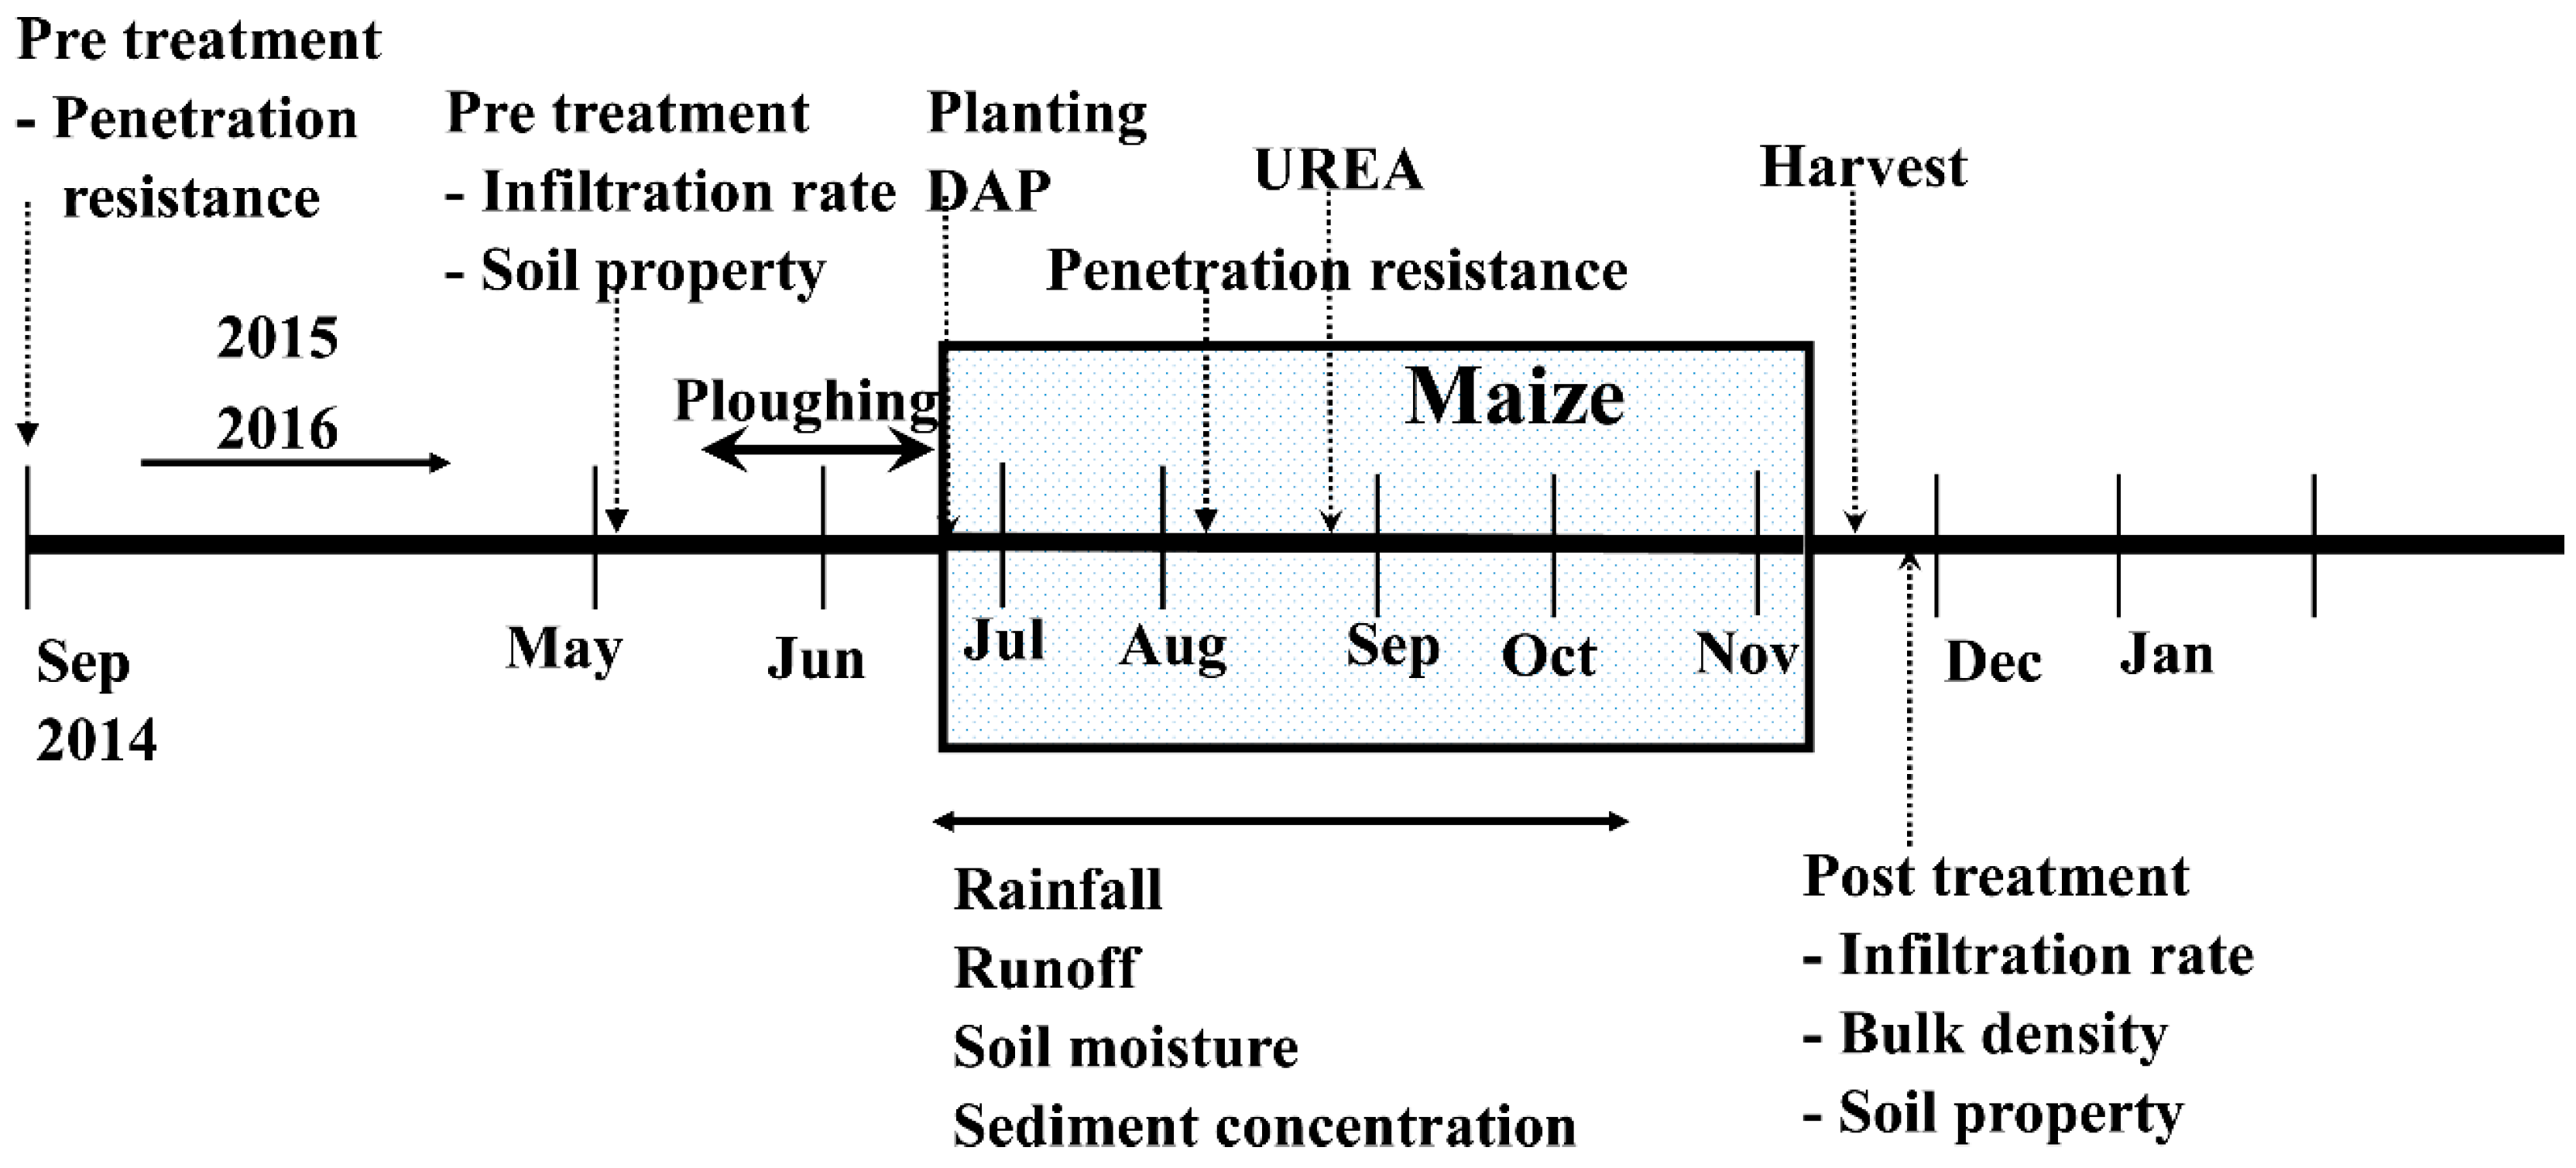
2.2. Tillage Treatments and Monitoring

Suitable fields for this study were selected in 2014, and treatments were established in May 2015. Data were collected during the rain phase from July to October 2015 and June to September 2016. An overview of agricultural practices and monitoring conducted throughout the study is shown in Figure 2.

2.2.1. Identification of the Restrictive Hardpan Layer

Prior to the field experiment, farmer fields were surveyed using a handheld cone penetrometer to assess the presence of a hardpan. Penetration resistance was measured 24 hours after a heavy rainfall, when the soil profile was at field capacity. The penetrometer rod was driven 60 cm into the soil at a rate of 2.5 cm s−1. Plots where penetration resistance exceeded 2 MPa [12,19], indicating the presence of a hardpan restricting root growth, were selected (Figure 1). In total, five farmer fields with hardpans, as well as similar slopes, topographic position along the slope, soil depth, and uniform presence of boulders and rocks, were selected (Table 1).

2.2.2. Experimental Setup

For each of the selected fields, three plots, each 4 m wide and 30 m long, were established in cropland in May 2015. Plots were separated using 50 cm tall 8 mm thick metal sheets. The sheets extended 35 cm depth into the soil profile. Downslope of each plot, a drainage pipe was installed to collect runoff and soil loss from each treatment, separately, after a rainfall event. Two barrels were installed at the outlet of each plot. Plot runoff was collected into Barrel I (capacity 127 L), and 10% of the overflow from Barrel I was directed to Barrel II (capacity 110 L). Ten 2.5 cm diameter holes 5 cm below the top of Barrel I facilitated runoff to Barrel II via a rubber hose. The tops of the barrels were covered with corrugated iron sheet roof to prevent rainfall from entering.
Three tillage treatments—no tillage (zero tillage, NT), conventional tillage (CT), and deep tillage (DT) deep ripping of the restrictive layer—were randomly assigned to the three plots (Figure 3). Plots with CT were conventionally ploughed three times to a 15 cm depth, with an oxen-driven Maresha plow, with a fifteen days’ interval during both the years 2015 and 2016. Deep tillage consisted of manually digging up the soil to a depth of 60 cm, using a mattock, in 2015 and 2016. The dug-up soil was not homogenized. For NT treatment, plots were not tilled, and the weeds were removed by hand during planting.
On 26 June 2015, hybrid maize variety Konor was sown in each plot, using a spacing of 20 cm by 50 cm, as recommended by the farmer (Figure 3). In June 20, 2016, the sowing rate was adjusted to 20 cm by 70 cm, as per the recommendation of the Office of Agricultural within the district. Fertilizers were broadcasted at a rate of 200 kg ha−1 diammonium phosphate (DAP consisting of 18% N-NH4+, 46% P-PO43−) during sowing and 200 kg ha−1 urea (46% N-NH4+) 60 days after planting. Weed management was done manually in all plots four times from planting to harvest.

2.2.3. Data Collected

The soil’s physical and chemical properties: Penetration resistance was measured prior to field experiments and in August, during the rain phases in 2015 and 2016 (Figure 2), using the same methodology each year. Bulk density was determined by taking undisturbed soil cores, using a core cutter of 5.1 cm diameter at 20 cm depth increments up to 60 cm after the rain phases in 2015 and 2016 (Figure 2). Soil samples were analyzed for cation exchange capacity (CEC), total nitrogen (N), plant available phosphorus (P), available organic matter (OM), and pH. A soil suspension with a soil–water ratio of 1 to 2.5, stirred for 30 minutes, was used to measure pH. Soil organic carbon was determined using titration with ammonium sulphate. The Kjeldahl method was used to determine total N. Plant-available phosphorus was obtained from the extraction of acid-soluble and adsorbed phosphorus with fluoride-containing solution, according to the Bray I test (acid soil). Cation exchange capacity was determined by the flame photometer method.
Infiltration rate: Steady state infiltration rates were conducted using a single-ring infiltrometer (30 cm height and 30 cm diameter). The infiltrometer was driven down 15 cm into the soil. The sides of the infiltrometer were kept vertical with a level. Little disturbance was made to the soil inside and outside of the ring. An initial amount of water was poured into the ring and allowed to drain out. The ring was then filled with water, and the depth was measured and recorded. The water depth was measured with a float and a ruler. Subsequent water depths inside the ring, with corresponding time lapses (falling head), were recorded. Pretreatment steady-state infiltration tests were conducted in the five fields. Posttreatment steady-state infiltration-rate measurements were conducted in each plot for all five fields after the rain phases in 2015 and 2016. In total, 35 infiltration-rate tests were conducted throughout the experiment.
Rainfall: Rainfall was measured manually each morning, at 8 o’clock, from rain gauges that were installed at each field during the 2015 and 2016 rain phases (Figure 2). The rain gauges were located 2 m away from the experimental plots.
Runoff and sediment yield: The runoff and sediment load generated from each plot was determined throughout the two rain phases. Surface runoff was measured using the installed collection barrels each day, at 08:00. The water depth in each barrel was measured using a steel ruler, and, after thoroughly mixing, a subsample of 150 mL was taken. Sediment concentration was determined in the lab after filtration and oven-drying at 105 °C. Details of the calculation are given in the supplementary material (Text S1)
Soil moisture: A soil-moisture profiler (Delta-T Devices Ltd, England) with an accuracy of 4% was used to determine volumetric soil moisture content by installing a moisture access tube in the lower third of each plot. Measurements were taken twice weekly from planting to harvest, at depths of 10, 20, 30, 40, 60, and 100 cm. The readings of the soil moisture profile were calibrated for each depth by taking 15 undisturbed soil samples, oven-drying them, and determining the volumetric soil moisture content.
Yield: Maize was harvested after the end of the rain phase from each plot, separately, in both years. Maize yield from each plot was collected and measured using a balance. The harvested maize was dried in the field prior to separating the stem, cob, and grains. Additionally, rooting depth was measured at the end of the rain phase in 2016 in each of the treatments for all fields. Plant roots were carefully removed from soil, and root length was determined using a ruler.

2.3. Data Analysis

The effect of tillage treatment on the soil’s physical and chemical properties was analyzed using the PROC MIXED procedure in SAS with year, treatment, and soil depth as fixed factors and plots as repeated measurements. Bulk density, available P, and texture data were log-normal transformed (i.e., log (x + 1)) to ensure homogeneity of variance and normal distribution of the residuals.
Nested design with dep (ANOVA) was conducted using SPPS version 16.0 at the 5% probability level (p < 0.05) for runoff, soil loss, crop yield, and root depth, with treatments and year as fixed factors. In case the normality criteria were not fulfilled, data were log-transformed (i.e., log (x + 1)). Differences in soil loss following the various tillage treatments were assessed using the non-parametric Kruskal–Wallis test.

3. Results

The soil’s physical and chemical properties after the tillage treatments are presented first, followed by the differences in runoff and soil loss for all tillage treatments. The results discussed are based on the data from the 2015 and 2016 rain phase.

3.1. Soil Penetration Resistance and Bulk Density

For all treatments, the lowest bulk densities were observed in the surface 0–20 cm soil depth, while the highest were observed from 40–60 cm depth. Bulk density for all treatments increased slightly with increasing soil depth (Table 2). Bulk density values for the DT treatment were significantly less than those measured in the CT and NT treatment for the three soil depths in both years (p < 0.01). Almost all deep tillage plots (at all depths) showed bulk densities that remained constant in 2015 and 2016. On the other hand, in the conventional and no-tillage plots, bulk density increased in 2016. The higher bulk density values of the no-tillage treatments, which can be assumed to represent the bulk densities of the plots before the application of the tillage treatments, are a good indication of the presence of hardpans in the experimental agricultural plots and in agricultural fields of the wider Robit-Bata watershed.
The penetration resistance at the onset of the experiment was on average 1.58 MPa (20 cm), 2.26 MPa (40 cm), and 2.48 MPa (60 cm) (Table 3). At the end of the rain phases in 2015 and 2016, the penetration resistance at the three different depths was lowest in the DT, followed by CT and NT (Table 3). As expected, soil penetration resistance was significantly (p < 0.05) less for deep tillage treatments than for the conventional and no-tillage treatments for the 0–20 and 20–40 cm soil profile in both years. Only in 2015 did deep tillage have a significant smaller penetration resistance than the other tillage treatments. For all treatments, the penetration resistance values increased with depth. The smallest average penetration resistance was recorded for the surface 20 cm, while the greatest average value was at a depth of 40–60 cm, which is consistent with the bulk density results (Table 2). The bulk density and soil penetration measurements show that the restrictive hardpan layer starts around the 40 cm depth. The lower penetration values obtained for the deep tillage treatments from 20 to 40 and 40 to 60 cm were related to the restrictive hardpan layers being broken during tillage, enabling crop root penetration. In 2015, the soil penetration resistance values in the deep tillage treatment were less than the critical threshold value of 2 MPa for all depths; with CT, most of the plots exceeded the critical threshold value of 2 MPa at depths greater than 20 cm, and for NT, the critical threshold value of 2 MPa was exceeded in the surface 20 cm in two of the fields.

3.2. Changes in Soil Chemical Properties

Medium-to-high variability in organic matter, sand content, total nitrogen, CEC, and available phosphorus was observed between the five fields at a specific soil depth (Table S1). Overall, differences in soil chemical properties within the soil profile were minimal. Aside from slight increases in pH in the surface 20 cm (p < 0.05), the treatments did not have an effect on the pH, CEC, P, clay, silt, or sand fraction over a two-year period (Table S1). There was a slight increase in organic matter compared to the pretreatment measurements over two years, with the maximum values reported in the CT treatment. Total nitrogen followed a similar trend for the first two soil layers but showed a slightly greater concentration in the DT treatment at the 60 cm depth compared to the other treatments at the same depth.

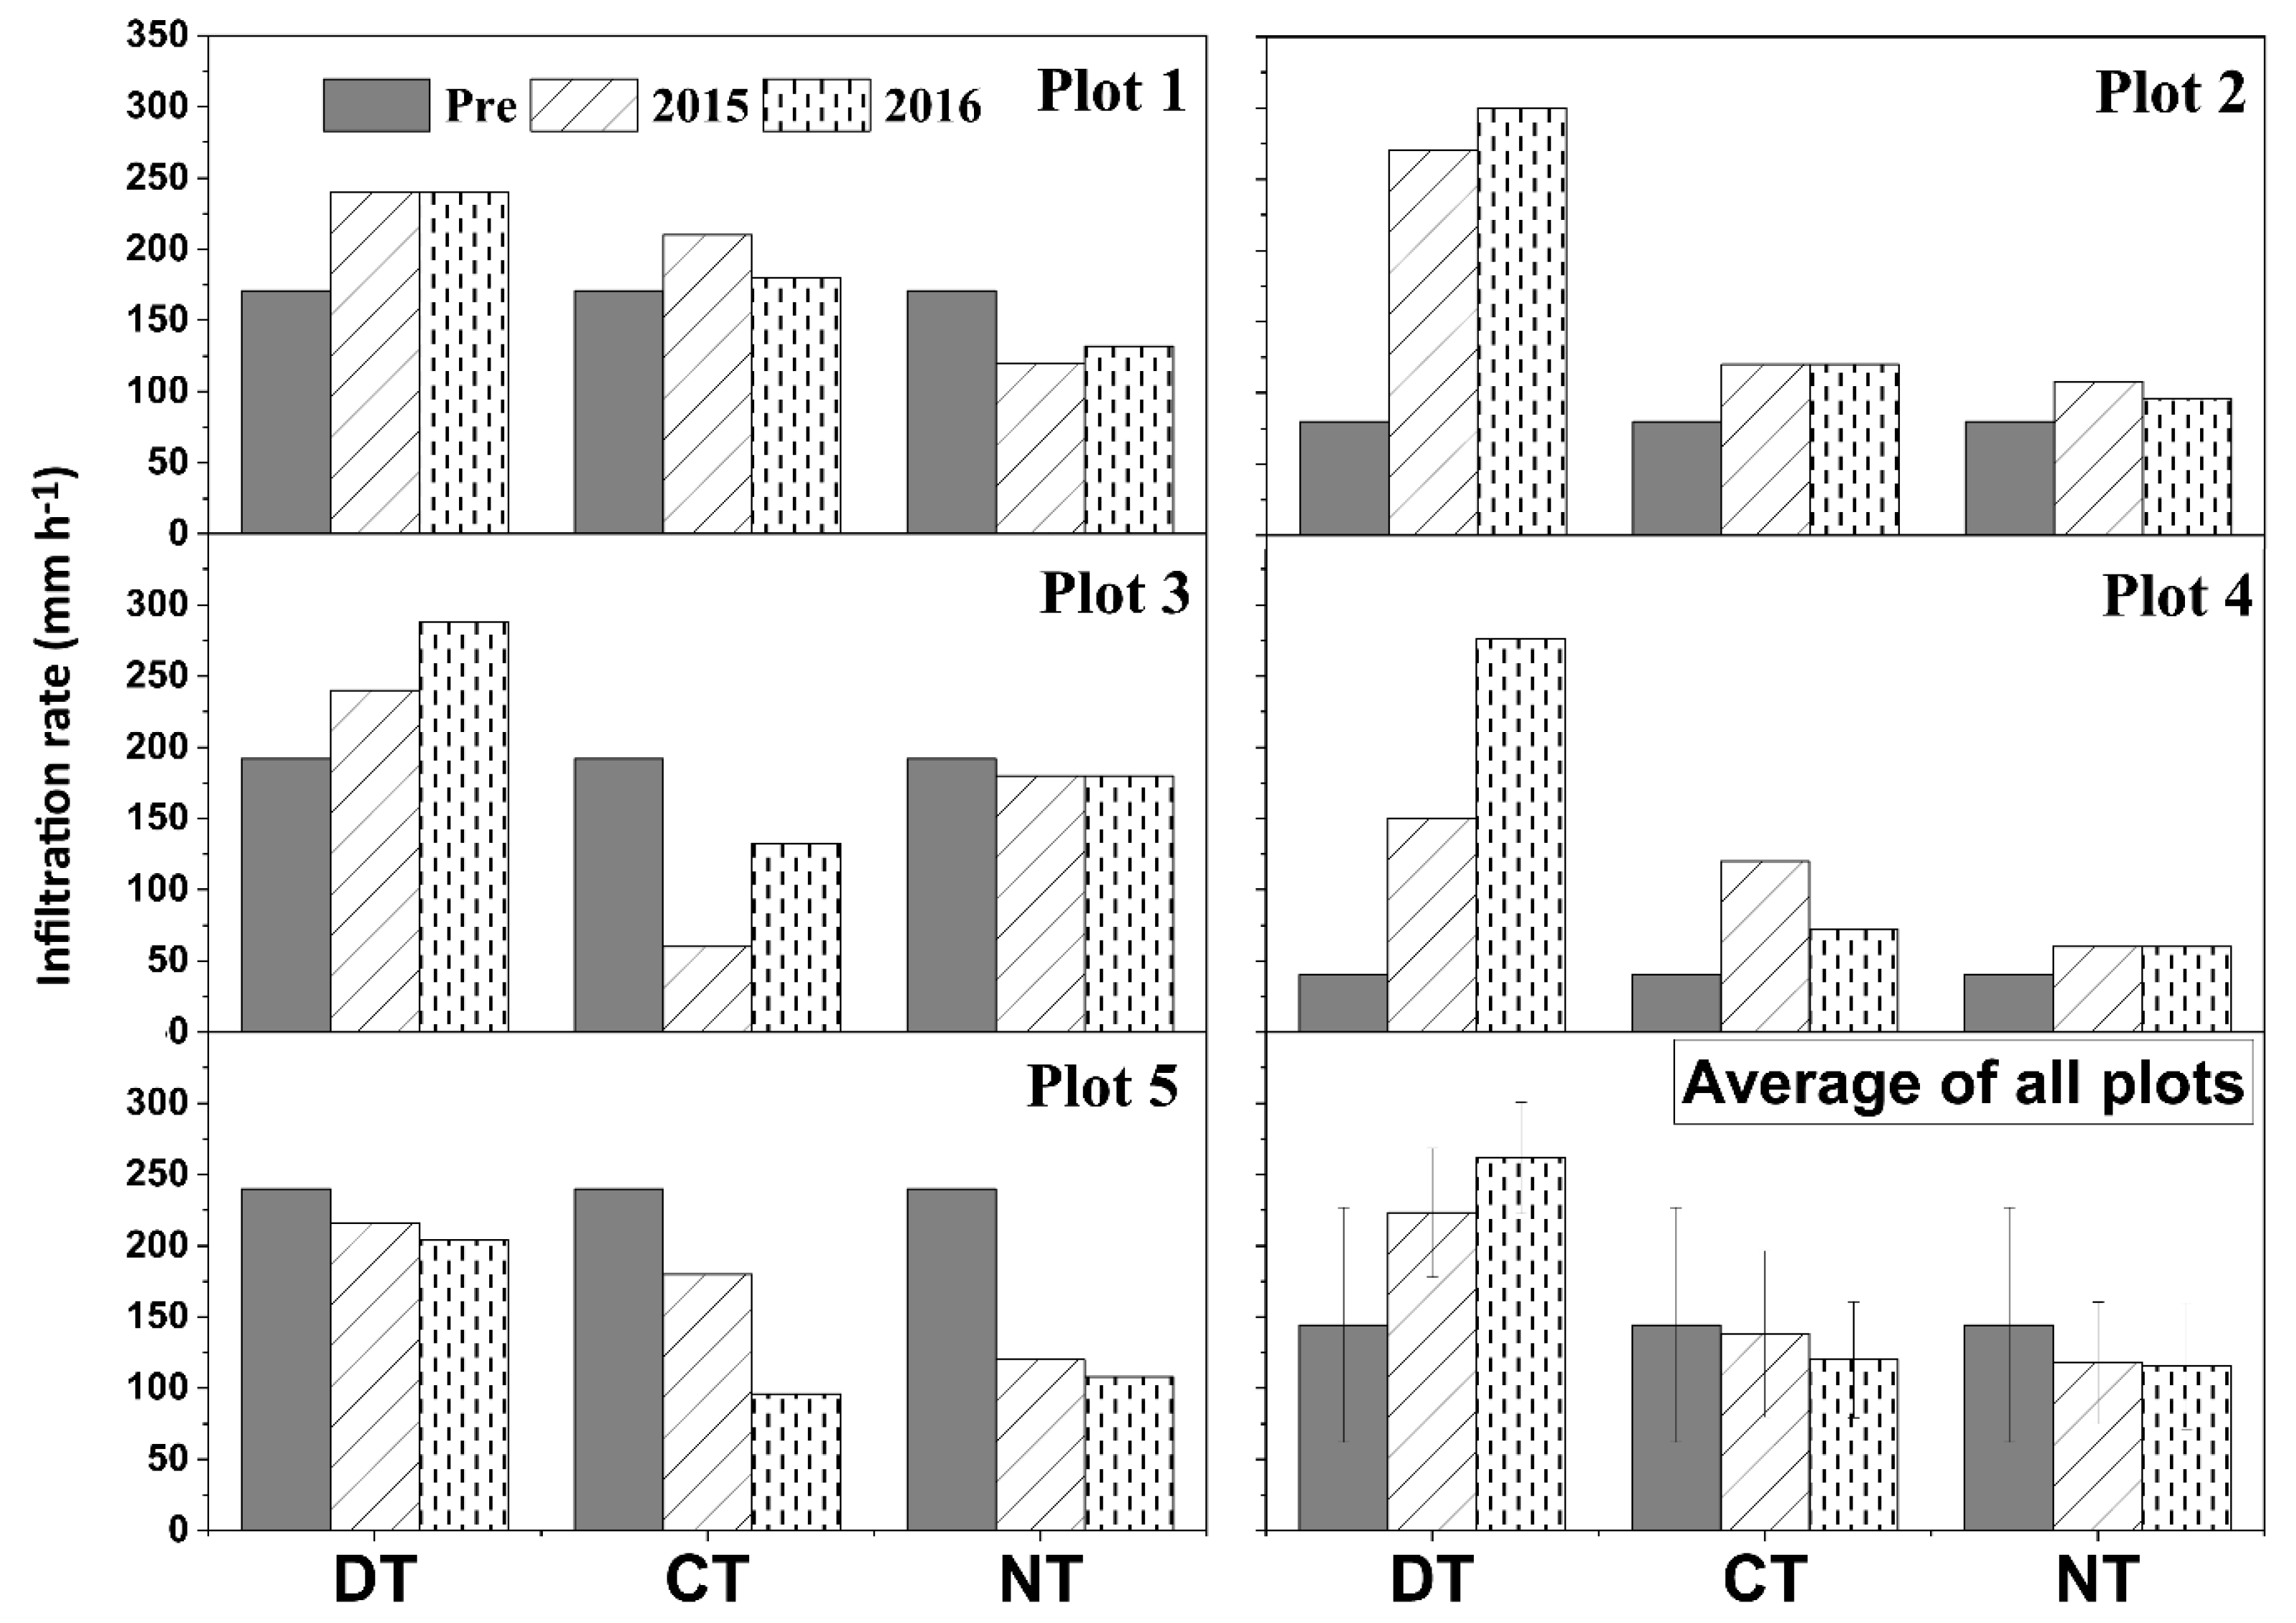
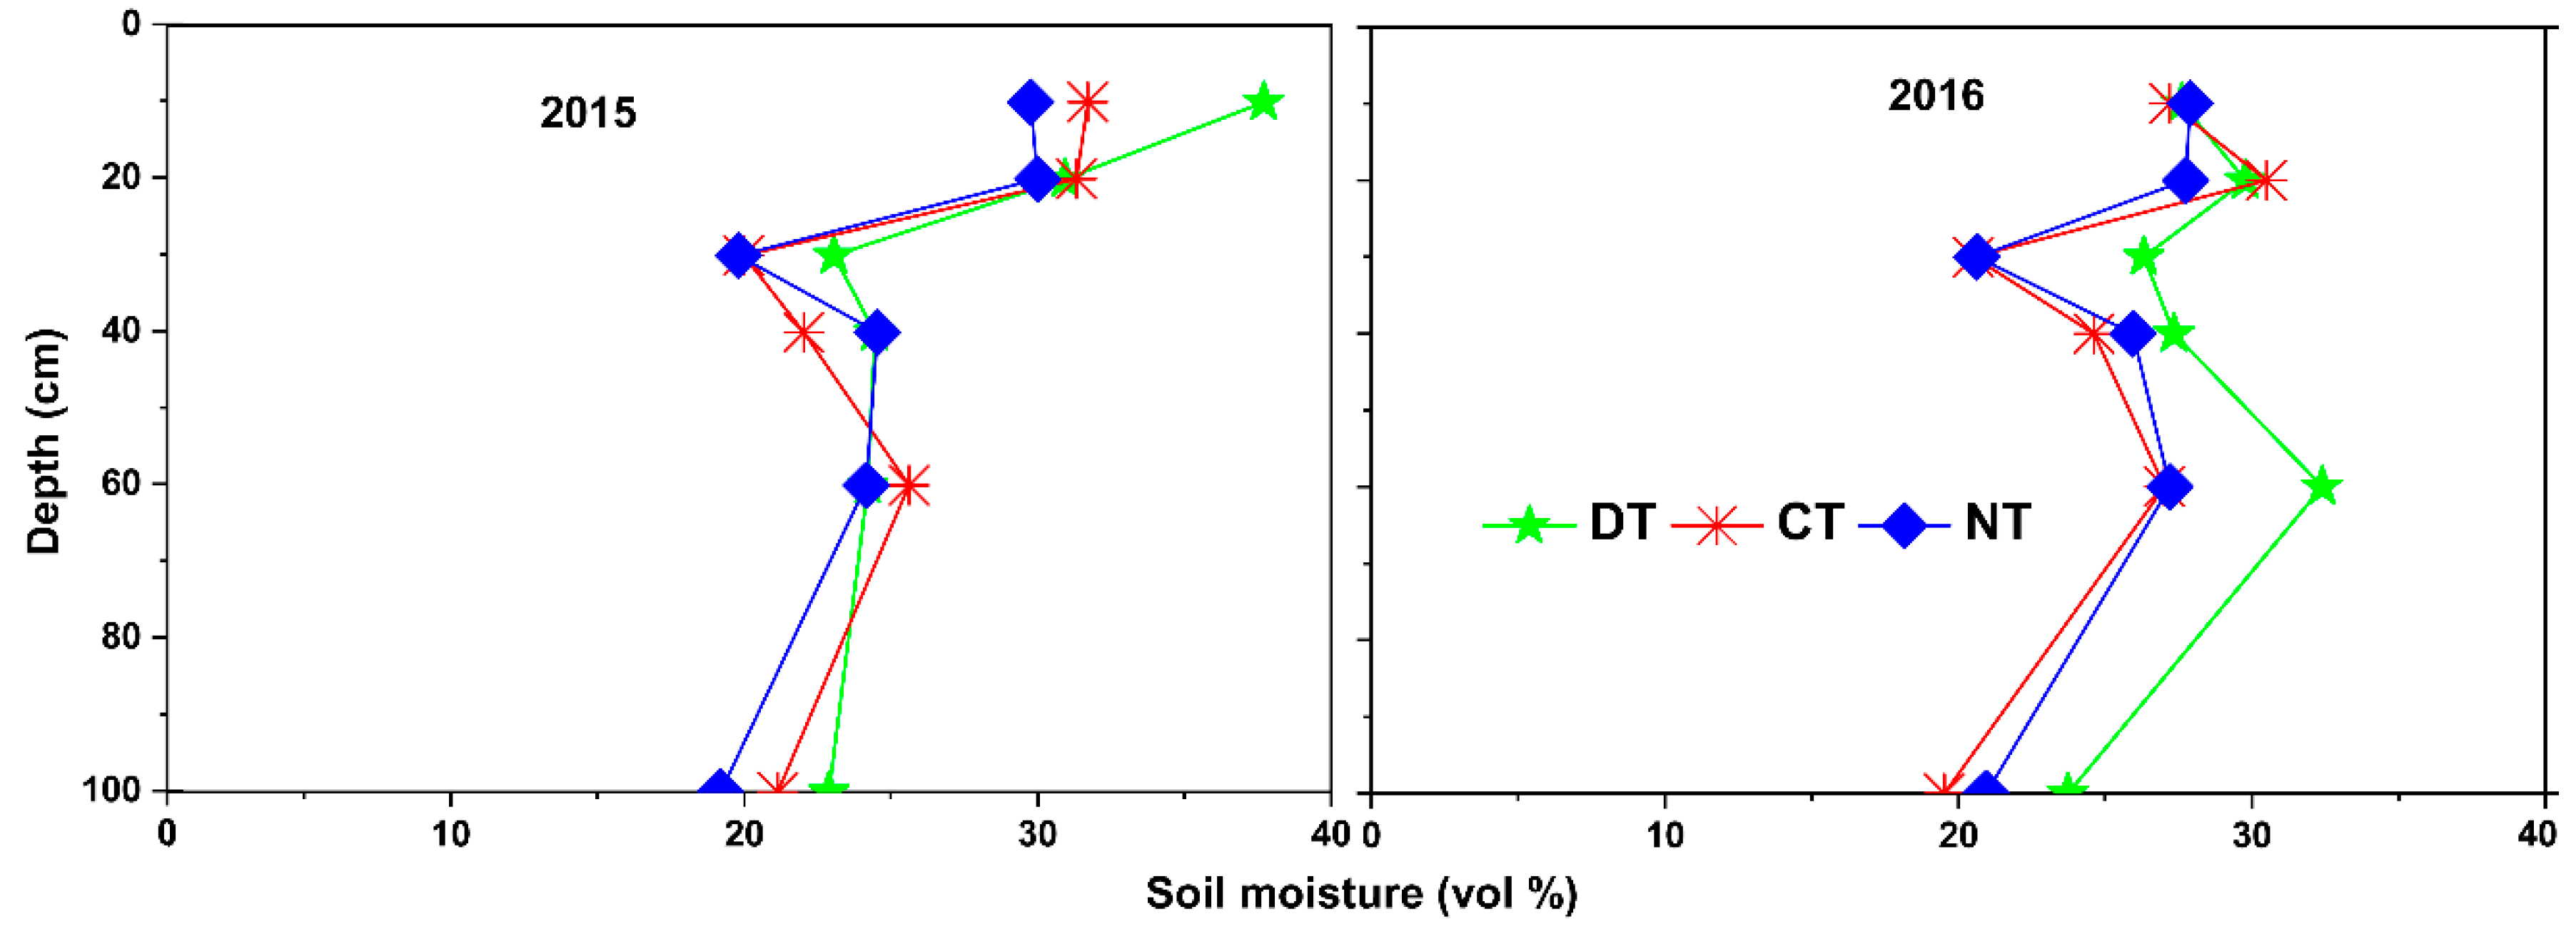
3.3. Infiltration Rate and Soil Moisture Content

The mean steady-state infiltration rates observed for the years 2015 and 2016 were as follows: 223 and 262 mm hr−1 (DT), 138 and 120 mm hr−1 (CT), and 118 and 115 mm hr−1 (NT), respectively. The infiltration rates in DT were significantly greater in 2015 and 2016 compared to CT and NT treatments (Figure 4).
Median soil moisture contents in 2015 and 2016 are given in Figure 5. Differences were minimal in 2015. In 2016, the soil moisture content increase of the entire soil profile was greater under DT compared to the NT and CT, likely in relation to the smaller bulk density and greater pore space (Table 2).

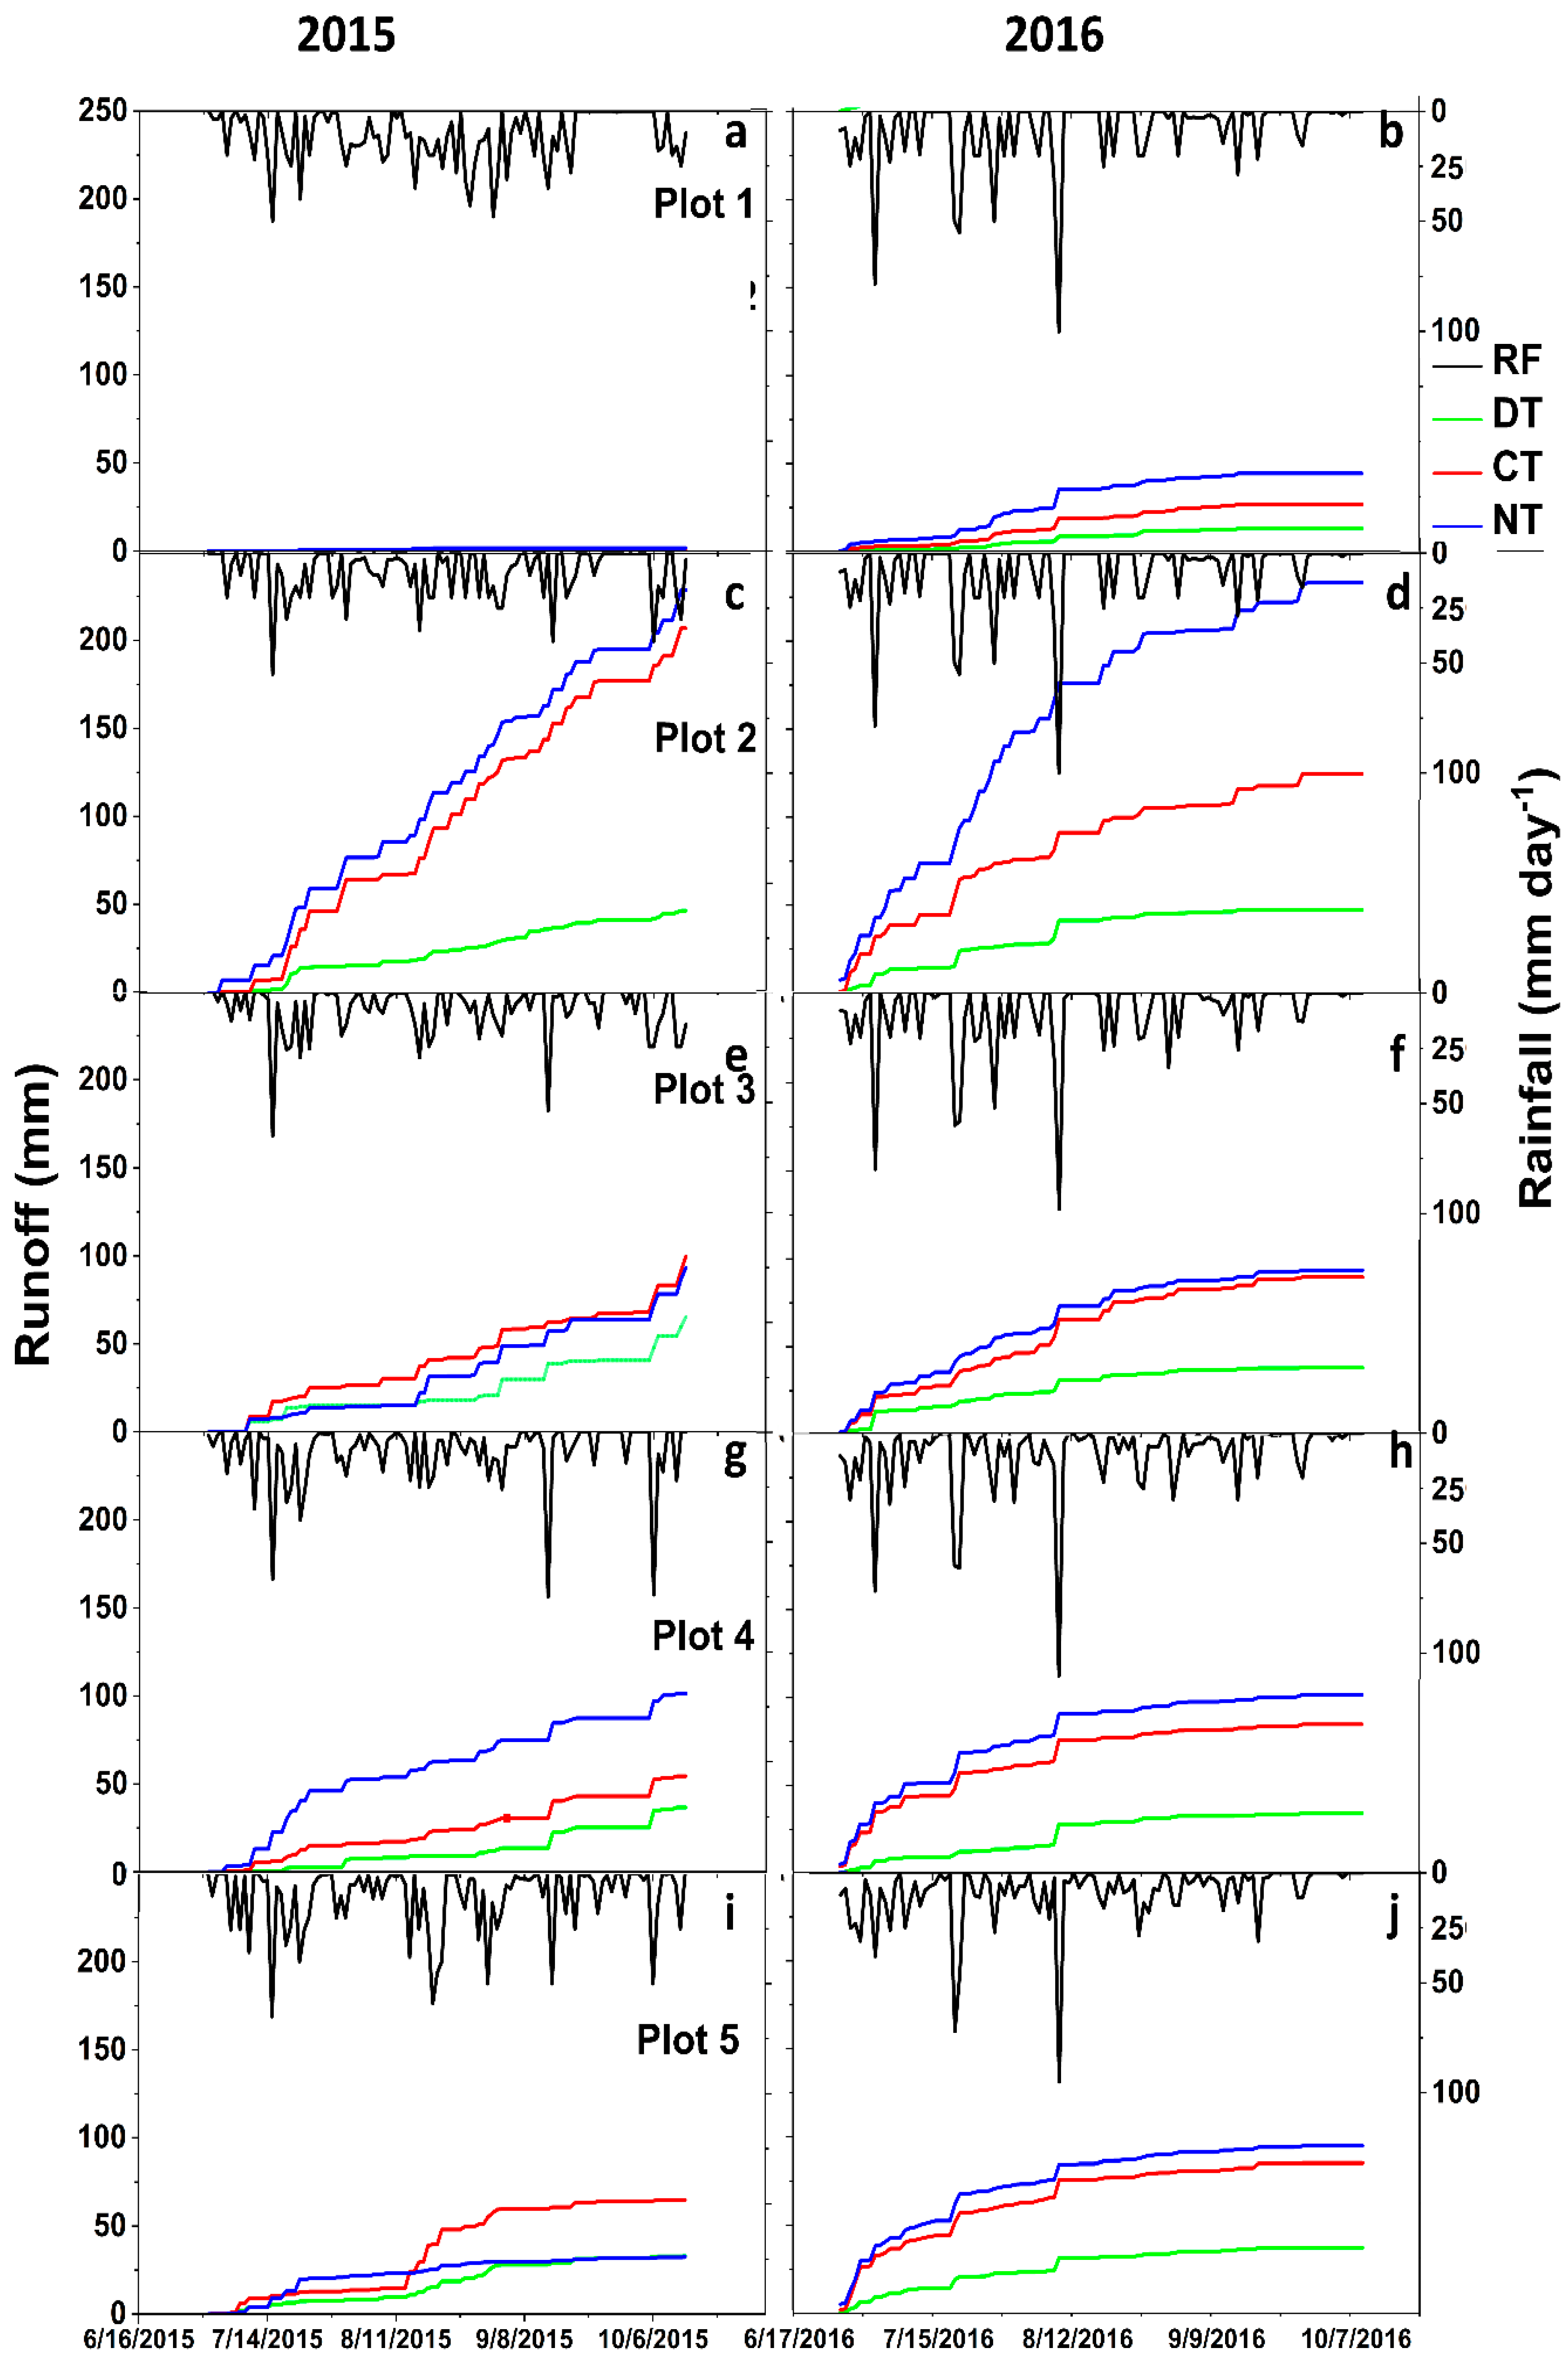
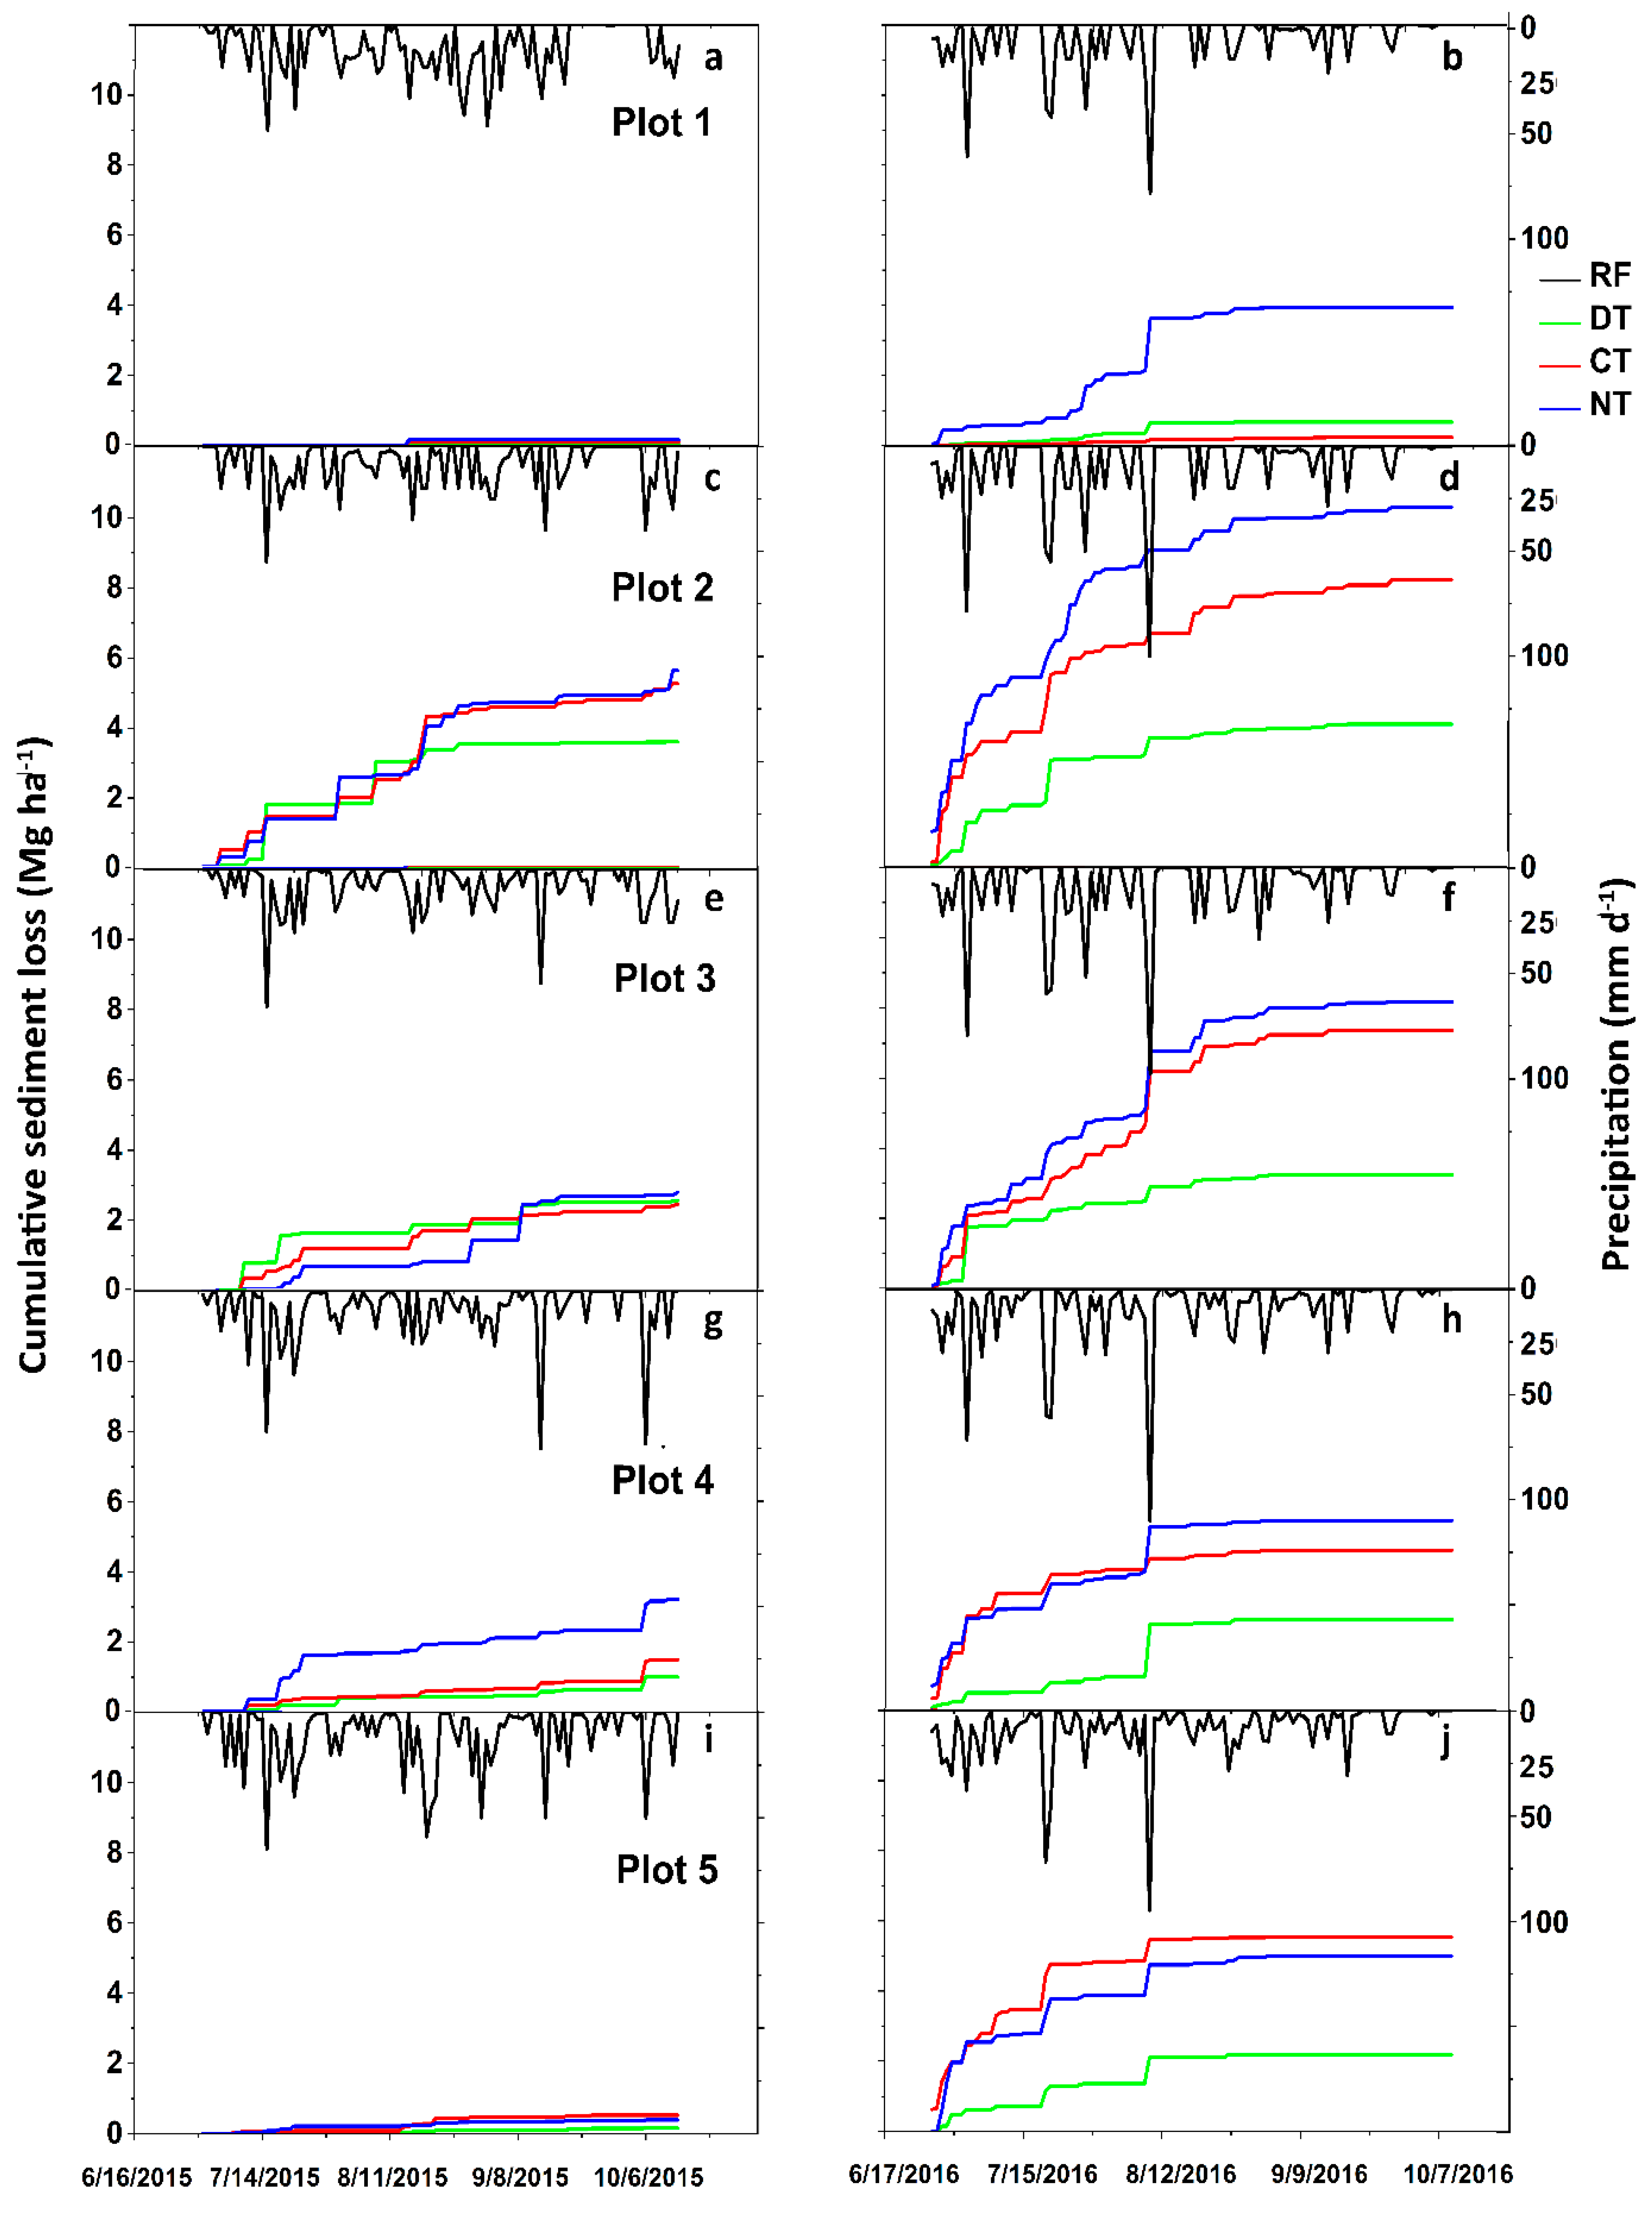
3.4. Runoff and Soil Loss

The cumulative surface runoff fluctuated significantly between the various treatments and replicates (Figure 6 and Table 4). Runoff was the least for the DT treatment (0–65 mm in 2015 and 0–47 mm in 2016) due to disruption of the hardpan. The surface runoff for the NT treatment (0–229 mm in 2015 and 0.5–233 mm in 2016) was significantly greater, with an average surface runoff during the growing season of 92 mm in 2015 and 113 mm in 2016 (Table 4, p < 0.05).
Measured soil loss followed a similar trend as the runoff. Soil loss observed between the fields varied strongly. Among the three tillage treatments, NT lost more soil and DT lost the least (Figure 7). Average soil loss over the two years was 48% greater for CT and 63% higher for NT compared to DT. The majority of the soil erosion from the plots occurred prior to August. Soil loss in 2015 and 2016, respectively, was 1.5 and 2.6 Mg ha−1 for DT, 2.0 and 5.1 Mg ha−1 for CT, and 2.4 and 6.7 Mg ha−1 in NT (Figure 7).

3.5. Agricultural Productivity of Maize as Function of Tillage Treatments

The average root depth in 2016 was significantly greater for the deep tillage treatment than both conventional tillage and no-till (Table 5). It was almost double that in NT and CT. Although maize yield did not vary statistically for the tillage treatments (Table 5), it was generally greater for plots that were deep-tilled than not-tilled. In 2015, the yield was slightly greater for the deep-tilled compared to the conservation tillage. In 2016, yields were the same (Table 5).

4. Discussion

4.1. Effect of Deep Tillage on Soil Erosion and Runoff

The lower soil bulk density and penetration resistance obtained with DT is due to deeper ripping of the soil profile’s disrupting the hardpan and creating more pore space. Since the machinery for deep tillage was not available, the ripping was achieved by digging the soil up to a depth of 60 cm. Both manual and machine deep tillage connect the surface soil with the existing macropores in the subsoil [8]. We expect, therefore, that our results are also valid for mechanical deep tillage, especially since our results are in agreement with [20], which reported lower bulk density with deep tillage treatments and higher bulk density with NT. Other studies [21] also reported that deep tillage resulted in lower bulk density and penetration resistance than conventional tillage. Similarly, [22] found that the application of deep tillage down to a 90 cm depth in soils with a fragipan resulted in a significant reduction in bulk density and penetration resistance.
The positive effects of deep tillage on penetration resistance and bulk density corresponded with the greater infiltration rates found with DT in both years. The infiltration rates in DT increased with time, but, in CT and NT, rates decreased. The increase in filtration rates can be attributed to the increase in total pore space. Njùs and Bùrresen (1988), cited by [23], showed that deep ploughing resulted in a higher number of macropores and increased the total number of pore spaces to a depth of 10 cm.
Because the restrictive soil layer was broken with deep tillage, more rainfall was able to infiltrate deeper into the soil profile and was not lost by interflow, resulting in a higher moisture content in the top 40 cm (Figure 5). Our findings are consistent with other studies [21] in which DT on a loam soil gave rise to a significantly higher water content at a depth of 20–30 cm than CT. Similarly, [24] reported that tilling soils resulted in improving water holding capacity and transmittivity ability of the soils, and this was attributed to high roughness and depression storage. The increase in pore space following the deep tillage treatment caused a reduction in surface runoff and soil loss in the DT treatment due to greater deep percolation. The reduction in soil loss for deep tillage treatment (Figure 7) was primarily due to the reduction in surface runoff because sediment concentrations in the runoff were greater in DT than for the other tillage treatments. Average sediment concentration for deep tillage in 2015 was 0.81 and 0.51 g L−1 for the other two tillage treatments. In 2016, sediment concentrations were 1.5 g L−1 for DT and around 1.2 g L−1 for CT and NT (not shown). These findings are in agreement with the findings of [17].
While the trend of the surface runoff followed the observed decrease in soil loss, the annual surface runoff averaged 4% of total rainfall for DT, 9.0% for CT, and 11.1% for NT. The runoff was less than other studies, such as [25], which reported, in Debre Mawi watershed, runoff of 32% of monsoon rainfall in 2010 and 20% in 2011, before implementation of soil water conservation practices. After the application of such practices, the reported runoff in Debre Mawi watershed averaged 11% of monsoon rainfall in 2012 and 2013. The smaller runoff in our study was primarily caused by the higher infiltration rates. The median pretreatment infiltration rate in this study was 171 mm hr−1, while [25] reported a median infiltration rate of 33 mm hr−1 y−1 for Debre Mawi watershed in 2010, 24 mm hr−1 in 2012, and 31 mm hr−1 in 2013. In some of our fields, infiltration rates increased to 242 mm hr−1 under deep tillage, further reducing the expected runoff and soil loss. As the subhumid mountainous region of Amhara is characterized by saturation excess flow [26,27], breaking the hardpan in the upland area leads to increase subsurface water availability and, therefore, shallow groundwater recharge by decreasing surface runoff.

4.2. Effect of Deep Tillage on Maize Production

The smaller grain yield in NT compared to the other tillage treatment was caused by unfavorable soil conditions for crop growth, including higher bulk density, higher penetration resistance, less soil moisture content, and less air diffusivity. The results are in agreement with [20,21] and [28], which all reported that subsoiling led to greater grain yields than NT and CT. A meta-analysis by [29] reported that deep tillage gave rise to a 6% increase in grain yield. Similarly, [30] reported that deep tillage resulted in improved seed emergence and grain yield than CT and NT, with the improvement attributed to better drainage during the rain monsoon phase.
The relatively greater soil moisture in the soil profile for deep tillage corresponded to the greater infiltration rates compared with the other tillage methods. As the rooting depth of maize was the deepest under DT, the crop was able to access the greatest quantity of water and nutrients from the soil profile [12]. Furthermore, the reduced runoff and soil loss observed in the deep tillage treatment may have reduced fertilizer runoff. The high variability in organic matter, sand, and available phosphorus between the fields may have masked the response of maize to increased soil moisture and available nutrients.
Although the changes in hydrological processes and maize yield showed similar trends among all the fields, results were variable. This variation was partially attributed to the location of the fields in the watershed. Daily runoff depths were greater in downslope plots compared to upslope because greater soil moisture contents downhill limited infiltration. Soil saturation downslope is more common than upslope because the contributing area is larger while the subsurface transport capacity is less due to a smaller slope [31].

5. Conclusions

Based on the two years of experimental data, we conclude that, in the sub-humid monsoon climate of Robit-Bata, breaking up a soil hardpan by using deep tillage (60 cm depth) increased infiltration rates and soil moisture throughout the profile, while it reduced runoff and soil loss. Deep tillage increased pore space and decreased both bulk density and penetration resistance, but soil chemical properties were not affected significantly. These improvements in the soil’s physical properties may have influenced the higher maize yields obtained under the deep tillage during the first year compared with the tillage with the traditional Maresha plow. Compared to conventional and deep tillage, no-till reduced crop yields and increased runoff. Significant dry spells did not occur in this study. Therefore, the increased soil moisture content with deep tillage most likely will have a greater effect on maize yields in semi-arid areas, where the interval between rain events is larger than in the humid areas and rainfed crops experience water stress.
Taking the results of this study, together with [25], reinforces the existing evidence that promoting interventions relating to tillage techniques improves livelihoods for farmers through greater productivity. At the same time, these interventions have the advantage that they contribute to sustainable intensification (more produce per unit of natural resource) and increase shallow groundwater, which helps extend the availability of water for use downstream, lowers negative off-site impacts through the reduction of soil loss and suspended solid loads in surface waters, and meets, thereby, the UN Sustainable Development Goals (SDG) 15, specifically SDG 15.3, which aims to achieve land-degradation neutrality.

Supplementary Materials

The following are available online at https://0-www-mdpi-com.brum.beds.ac.uk/2073-445X/8/11/159/s1. Text S1. Calculation of discharge and soil loss from the plots. Table S1. Soil chemical properties of the top 60 cm before and after the application of the tillage treatments.

Author Contributions

M.A.H., H.M., P.N., P.S., S.A.T., and T.S.S. designed the experiment, did data analysis and interpretation; M.A.H. and H.M. collected the data; M.A.H. wrote the manuscript with the aid of P.S., S.A.T. and T.S.S.; M.A.H., S.L. and J.B. collaborated with P.S. and S.A.T. in the project administration.

Funding

The research was implemented under a collaborative partnership between the International Water Management Institute (IWMI) and the Bahir Dar University (BDU). This research was supported by the Innovation Laboratory for Small Scale Irrigation (ILSSI) project (#AID-OAA-A-13-000SS) funded by Feed the Future through the US Agency for International Development, as well as the CGIAR Research Program on Water, Land, and Ecosystems (WLE).

Acknowledgments

We would like to thank the community and the farmers who let us carry out the experiments on their land. Without their help and wisdom, these experiments would not have been possible.

Conflicts of Interest

The authors declare no conflicts of interest. The contents of the paper are the responsibility of the authors and do not necessarily reflect the views of USAID or the United States government.

References

  1. Hurni, H. Degradation and conservation of the resources in the Ethiopian highlands. Mt. Res. Dev. 1988, 8, 123–130. [Google Scholar] [CrossRef]
  2. Hurni, H. Land degradation, famine, and land resource scenarios in Ethiopia. In World Soil Erosion and Conservation. Cambridge Studies in Applied Ecology and Resource Management; Cambridge University Press: Cambridge, UK, 1993; pp. 27–61. [Google Scholar]
  3. Mekuria, W.; Veldkamp, E.; Haile, M.; Nyssen, J.; Muys, B.; Gebrehiwot, K. Effectiveness of exclosures to restore degraded soils as a result of overgrazing in Tigray, Ethiopia. J. Arid Environ. 2007, 69, 270–284. [Google Scholar] [CrossRef]
  4. Keesstra, S.; Mol, G.; De Leeuw, J.; Okx, J.; Molenaar, C.; De Cleen, M.; Visser, S. Soil-related sustainable development goals: Four concepts to make land degradation neutrality and restoration work. Land 2018, 7, 133. [Google Scholar] [CrossRef]
  5. Tefera, B.; Ayele, G.; Atnafe, Y.; Jabbar, M.A.; Dubale, P. Nature and Causes of Land Degradation in Oromiya Region, Ethiopia—A Review; Socio-economics and Policy Research Working Paper 36; ILRI (International Livestock Research Institute): Nairobi, Kenya, 2002; Volume 82, p. 6. [Google Scholar]
  6. Raper, R.; Schwab, E.; Dabney, S. Measurement and variation of site-specific hardpans. In 2001 ASAE Annual Meeting; American Society of Agricultural and Biological Engineers: St. Joseph, MI, USA, 1998. [Google Scholar]
  7. Mwendera, E.; Saleem, M.M. Hydrologic response to cattle grazing in the Ethiopian highlands. Agric. Ecosyst. Environ. 1997, 64, 33–41. [Google Scholar] [CrossRef]
  8. Tebebu, T.Y.; Bayabil, H.K.; Stoof, C.R.; Giri, S.K.; Gessess, A.A.; Tilahun, S.A.; Steenhuis, T.S. Characterization of degraded soils in the humid Ethiopian highlands. Land Degrad. Dev. 2017, 28, 1891–1901. [Google Scholar] [CrossRef]
  9. Lal, R. Long-term tillage and maize monoculture effects on a tropical Alfisol in western Nigeria. I. Crop yield and soil physical properties. Soil Tillage Res. 1997, 42, 145–160. [Google Scholar] [CrossRef]
  10. Guzman, C.D.; Tilahun, S.A.; Dagnew, D.C.; Zegeye, A.D.; Yitaferu, B.; Kay, R.W.; Steenhuis, T.S. Developing soil conservation strategies with technical and community knowledge in a degrading sub-humid mountainous landscape. Land Degrad. Dev. 2017, 29, 749–764. [Google Scholar] [CrossRef]
  11. Mosaddeghi, M.; Mahboubi, A.; Safadoust, A. Short-term effects of tillage and manure on some soil physical properties and maize root growth in a sandy loam soil in western Iran. Soil Tillage Res. 2009, 104, 173–179. [Google Scholar] [CrossRef]
  12. Duiker, S. Diagnosing Soil Compaction Using a Penetrometer (Soil Compaction Tester). 2002. Available online: https://extension.psu.edu/diagnosing-soil-compaction-using-a-penetrometer-soil-compaction-tester (accessed on 23 October 2019).
  13. Burayu, W.; Chinawong, S.; Suwanketnikom, R.; Mala, T.; Juntakool, S. Conservation tillage and crop rotation: Win-win option for sustainable maize production in the dryland central Rift Valley of Ethiopia. Kamphaengsaen Acad. J. 2006, 4, 48–60. [Google Scholar]
  14. Sharma, A.; Behera, U. Modern Concepts of Agriculture; Conservation Tillage; Indian Agricultural Research Institute: New Delhi, India, 2008. [Google Scholar]
  15. Hamza, M.; Anderson, W. Soil compaction in cropping systems: A review of the nature, causes and possible solutions. Soil Tillage Res. 2005, 82, 121–145. [Google Scholar] [CrossRef]
  16. Busscher, W.; Bauer, P. Soil strength, cotton root growth and lint yield in a southeastern USA coastal loamy sand. Soil Tillage Res. 2003, 74, 151–159. [Google Scholar] [CrossRef]
  17. Sadegh-Zadeh, F.; Wahid, S.A.; Seh-Bardan, B.J.; Seh-Bardan, E.J.; Bah, A. Alternative management practices for water conservation in dryland farming: A case study in Bijar, Iran. Water Conserv. 2011, 47. [Google Scholar] [CrossRef]
  18. Scanlon, B.; Reedy, R.; Baumhardt, R.; Strassberg, G. Impact of deep plowing on groundwater recharge in a semiarid region: Case study, High Plains, Texas. Water Resour. Res. 2008, 44. [Google Scholar] [CrossRef] [Green Version]
  19. Atwell, B. Response of roots to mechanical impedance. Environ. Exp. Bot. 1993, 33, 27–40. [Google Scholar] [CrossRef]
  20. Javeed, H.; Zamir, M.; Tanveer, A.; Yaseen, M. Soil physical properties and grain yield of spring maize (Zea mays L.) as influence by tillage practices and mulch treatments. Cercet. Agron. Mold. 2013, 46, 69–75. [Google Scholar] [CrossRef]
  21. Ji, B.; Zhao, Y.; Mu, X.; Liu, K.; Li, C. Effects of tillage on soil physical properties and root growth of maize in loam and clay in central China. PlantSoil Environ. 2013, 59, 295–302. [Google Scholar] [CrossRef]
  22. Varsa, E.; Chong, S.; Abolaji, J.; Farquhar, D.; Olsen, F. Effect of deep tillage on soil physical characteristics and corn (Zea mays L.) root growth and production. Soil Tillage Res. 1997, 43, 219–228. [Google Scholar] [CrossRef]
  23. Rasmussen, K. Impact of ploughless soil tillage on yield and soil quality: A Scandinavian review. Soil Tillage Res. 1999, 53, 3–14. [Google Scholar] [CrossRef]
  24. Guzha, A. Effects of tillage on soil microrelief, surface depression storage and soil water storage. Soil Tillage Res. 2004, 76, 105–114. [Google Scholar] [CrossRef]
  25. Dagnew, D.C.; Guzman, C.D.; Zegeye, A.D.; Tebebu, T.Y.; Getaneh, M.; Abate, S.; Zimale, F.A.; Ayana, E.K.; Tilahun, S.A.; Steenhuis, T.S. Impact of conservation practices on runoff and soil loss in the sub-humid Ethiopian Highlands: The Debre Mawi watershed. J. Hydrol. Hydromech. 2015, 63, 210–219. [Google Scholar] [CrossRef] [Green Version]
  26. Tilahun, S.A.; Guzman, C.D.; Zegeye, A.D.; Ayana, E.K.; Collick, A.S.; Yitaferu, B.; Steenhuis, T.S. Patterns of Soil Erosion in the Semi-humid Ethiopian Highlands: A Case Study of Debre Mawi Watershed. In Nile River Basin: Ecohydrological Challenges, Climate Change and Hydropolitics; Assefa, M., Abtew, W., Setegn, S.G., Eds.; Springer: Cham, Switzerland, 2014; pp. 149–164. [Google Scholar]
  27. Moges, M.A.; Schmitter, P.; Tilahun, S.A.; Langan, S.; Dagnew, D.C.; Akale, A.T.; Steenhuis, T.S. Suitability of watershed models to predict distributed hydrologic response in the Awramba watershed in Lake Tana basin. Land Degrad. Dev. 2017, 28, 1386–1397. [Google Scholar] [CrossRef]
  28. Yao, Y.; Schiettecatte, W.; Lu, J.; Wang, Y.; Wu, H.; Jin, K.; Cai, D.; Gabriels, D.; Hartmann, R.; Cornelis, W. Influence of tillage practices on yield, water conservation and soil loss: Results of field experiments in the Eastern Loess Plateau (Henan Province, China). In Proceedings of the 13th International Soil Conservation Organisation Conference, Brisbane, Australia, 4–9 July 2004. [Google Scholar]
  29. Schneider, F.; Don, A.; Hennings, I.; Schmittmann, O.; Seidel, S.J. The effect of deep tillage on crop yield–What do we really know? Soil Tillage Res. 2017, 174, 193–204. [Google Scholar] [CrossRef]
  30. Chen, Y.; Cavers, C.; Tessier, S.; Monero, F.; Lobb, D. Short-term tillage effects on soil cone index and plant development in a poorly drained, heavy clay soil. Soil Tillage Res. 2005, 82, 161–171. [Google Scholar] [CrossRef]
  31. Steenhuis, T.S.; Collick, A.S.; Easton, Z.M.; Leggesse, E.S.; Bayabil, H.K.; White, E.D.; Awulachew, S.B.; Adgo, E.; Ahmed, A.A. Predicting discharge and sediment for the Abay (Blue Nile) with a simple model. Hydrol. Process. 2009, 23, 3728–3737. [Google Scholar] [CrossRef]
Figure 1. (a) Location of Robit-Bata Watershed within Ethiopia; (b) the Robit-Bata watershed and elevation map with the location of the five experimental fields.
Land 08 00159 g001
Figure 2. Schematic overview of the measurements conducted throughout the rain phases in 2015 and 2016.
Land 08 00159 g002
Figure 3. Setup of experimental plots. (a) Schematic diagram of the experimental runoff plots; (b) photo of deep tillage (DT) with hoe; (c) conventional till (CT) with traditional oxen-drawn plough; and (d) no-till (NT), in which seed and fertilizer are placed in locally loosened soil.
Land 08 00159 g003
Figure 4. Steady-state infiltration rates before tillage and after harvest for deep tillage (DT), conventional tillage (CT) and no-till (NT) in 2015 and 2016. The bars in the graphs indicate the standard deviation from the mean.
Land 08 00159 g004
Figure 5. Plot of the soil volumetric water content versus the soil depth for the three tillage treatments in 2015 and 2016.
Land 08 00159 g005
Figure 6. Rainfall (RF) and cumulative runoff for conventional tillage (CT), deep tillage (DT), and no-till (NT) in 2015 (left) and 2016 (right): (a) plot 1, 2015; (b) plot 1, 2016; (c) plot 2, 2015; (d) plot 2, 2016; (e) plot 3, 2015; (f) plot 4, 2016; (g) plot 4, 2015; (h) plot 4, 2016; (i) plot 5, 2015; and (j) plot 5, 2016. The locations are given in Figure 1.
Land 08 00159 g006
Figure 7. Rainfall (RF) and cumulative sediment loss for conventional tillage (CT), deep tillage (DT), and no-till (NT) in 2015 (left) and 2016 (right). (a) Plot 1, 2015; (b) plot 1, 2016; (c) plot 2, 2015; (d) plot 2, 2016; (e) plot 3, 2015; (f) plot 4, 2016; (g) plot 4, 2015; (h) plot 4, 2016; (i) plot 5, 2015; and (j) plot 5, 2016. The locations are given in Figure 1.
Land 08 00159 g007
Table 1. Soil depth and elevation of the experimental fields and the measured penetration resistance for the 0–20, 20–40, and 40–60 cm depths prior to implementation of the tillage treatments.
Field CodeSoil Profile Depth (m)Elevation (m a.s.l.)Soil Depth (cm)Pretreatment Resistance (MPa)
P10.618500–201.38
20–402.42
40–602.62
P2>3.518630–201.38
20–401.93
40–602.21
P3>3.518730–201.38
20–402.07
40–602.42
P4>3.519300–20NA
20–40NA
40–60NA
P50.819760–202.21
20–402.62
40–602.69
All plots 0–201.58
20–402.26
40–602.48
Table 2. Bulk density (g cm−3) from 0–20, 20–40, and 40–60 cm depth intervals at the end of the rain phases in 2015 and 2016 for deep tillage (DT), conventional tillage (CT), and no-till (NT). Average values with different letters at the same depth within the same year indicate a significant difference at p < 0.05 between the tillage treatments.
Soil Depth (cm)20152016
DTCTNTDTCTNT
0–201.20 a1.43 b1.47 bc1.20 a1.53 c1.55 c
20–401.20 a1.40 b1.51 c1.21 a1.57 cd1.62 d
40–601.22 a1.46 b1.52 b1.23 a1.61 c1.69 c
Table 3. Penetration resistance (MPa) from 0–20, 20–40, and 40–60 cm depths prior to and after treatment implementation (deep tillage: DT; conventional tillage: CT; and no tillage: NT) at the end of the rain phase in 2015 and 2016.
Soil Depth (cm)Pretreatment Resistance (MPa)20152016
DT (MPa)CT (MPa)NT (MPa)DT (MPa)CT (MPa)NT (MPa)
0–201.58 a0.26 b0.93 c1.60 a0.07 b0.22 bd0.41 d
20–402.26 a0.65 b1.67 c2.13 a1.13 d1.68 c1.75 c
40–602.48 a1.17 b2.24 a2.41 a2.13 a2.32 a2.22 a
a b c d Average values for all plots with different superscript letters at the same depth within the same year show a significant difference at p < 0.05 between the tillage treatments and the pretreatment value.
Table 4. Average and standard deviation of the surface runoff (mm) for the three tillage treatments (deep tillage (DT); conventional tillage (CT) and no tillage (NT)) for the 2015 and 2016 rain phases.
Tillage Treatment20152016
DT36 ± 24 a34 ± 13 a
CT85 ± 77 b82 ± 352 b
NT91 ± 87 b113 ± 71 b
a b Average values for all plots with different superscript letters within the same year show a significant difference at p < 0.05.
Table 5. Measured maize yield (Mg ha−1) and rooting depth observed under the various treatments: deep tillage (DT); conventional tillage (CT); and no tillage (NT).
Lead toYield (Mg ha−1)Root Depth (cm)
201520162016
DTCTNTDTCTNTDTCTNT
P14.23.63.23.72.22.2572521
P26.35.76.12.83.82.7522828
P37.86.04.95.36.23.2493417
P42.92.61.63.53.72.7562925
P53.12.81.33.53.33.1432723
Average4.9 ± 2.1 a4.1 ± 1.6 a3.4 ± 2.1 a3.8 ± 0.9 a3.8 ± 1.5 a2.8 ± 0.4 a51 ± 6 a29 ± 3 b23 ± 4 b
CV%44.138.860.624.738.014.5111218
a,b Average values with different superscripts within the same year show a significant difference at p < 0.05 between the tillage treatments.

