Article

The Spatial-Temporal Dynamics of Potato Agrobiodiversity in the Highlands of Central Peru: A Case Study of Smallholder Management across Farming Landscapes

1
Department of Agricultural Sciences, University of Antioquia, Medellín 1226, Colombia
2
International Potato Center (CIP), La Molina 1558, Lima 12, Peru
3
Agricultural Genetics Institute, International Center for Tropical Agriculture (CIAT), Bac Tu Liem District, Hanoi 100803, Vietnam
4
Grupo Yanapai, Concepción, Junín 12126, Peru
*
Author to whom correspondence should be addressed.
Land 2019, 8(11), 169; https://doi.org/10.3390/land8110169
Submission received: 28 September 2019 / Revised: 30 October 2019 / Accepted: 30 October 2019 / Published: 8 November 2019

Abstract

:
In the high Andes, environmental and socio-economic drivers are transforming agriculture and presumably affecting the in situ conservation of potato (Solanum spp.). To monitor the use and conservation of intraspecific diversity, systematic and comparative studies across agricultural land-use systems are needed. We investigated the spatial-temporal dynamics of potato in two landscapes of Peru’s central Andes: A highland plateau (Huancavelica) compared to an eastern slope (Pasco). We examined household-level areal allocations, altitudinal distribution, sectoral fallowing practices, and the conservation status for three main cultivar groups: (i) Bred varieties, (ii) floury landraces, and (iii) bitter landraces. Mixed methods were used to survey 323 households and the 1101 potato fields they managed in 2012–2013. We compared the contemporary altitudinal distribution of landraces with 1975–1985 altimeter data from the International Potato Center. Intensification is occurring in each landscape while maintaining high intraspecific diversity. Access to land and production for sale compared to consumption significantly affected smallholder management and differentiated landscapes. Most landraces were scarce across households: 45.4% in Huancavelica and 61.7% in Pasco. Potato cultivation has moved upward by an average of 306 m since 1975. Landrace diversity is versatile but unevenly distributed across landscapes. This requires adaptive ways to incentivize in situ conservation.

1. Introduction

In the Andes, demographic shifts, migration, part-time farming, market integration, urbanization, and climate change will increasingly affect the agricultural land-use systems that support farmers’ on-farm agrobiodiversity and in situ conservation of major food plants [1,2,3,4,5,6,7]. Agricultural land-use responses in the Andes to the above-mentioned drivers have been varied. In some farming environments, the intensity of land use has increased in terms of cropping frequencies and areal coverage of cash crops or bred varieties, fertilizers and pesticides driven by agricultural specialization [8,9,10,11]. Other areas have seen a mixed trend due to migration, off-farm work, land abandonment, and a livelihood shift away from subsistence agriculture [12,13,14,15]. At high altitude, the expansion of agriculture resulting from climate change and market incentives is seen to encroach upon natural habitats, disrupting ecosystem services such as the provision of soil organic carbon stocks and water, and competing with other smallholder livelihood activities [16,17,18]. The net outcome of these processes on farmers’ management practices involving agrobiodiversity—particularly crop landrace diversity—has not been necessarily negative, as smallholder farming systems have been shown to be highly adaptive and opportunistic [19,20,21]. Therefore, Andean smallholder farming systems are still recognized to harbor high levels of agrobiodiversity essential for adaptive agriculture and food security [22,23,24].
Modern-day environmental, demographic, and socio-economic changes are nonetheless demanding ever more complex land-use choices from smallholder farmers. Processes of intensification reflect hybrid systems where traditional management schemes coexist with management modifications [25,26,27,28]. Contemporary agricultural land-use change in the high Andes is often associated with an upward expansion of cropping, micro-fragmentation of household cropping areas, incremental occurrence of pests and disease at higher altitudes, and the gradual abandonment of communal land-use management such as sectoral fallowing systems [6,29,30,31]. Mixed livestock–crop systems, and competition between these two components, are particularly common at high altitudes [17,32]. Nonetheless, it is difficult to generalize many of these processes in the region due to its socioeconomic and agroecological diversity [33,34]. The co-existence of traditional and modern management practices is not uncommon as smallholders adjust their livelihoods by integrating into markets and adopting new technologies [10,19,35,36].
The persistence of high crop and landrace diversity in the portfolios of smallholder farmers has been considered a unique feature of Andean agriculture despite accelerated change, although in-depth inquiries into the relationship of agricultural land-use change and intraspecific diversity of crops are scant. In the central Peruvian highlands, potato agriculture has evolved in a harsh and risk-prone mountain environment. Its diverse microclimates, altitudinal gradients, and soil conditions have led to spatially heterogeneous farming landscapes and a suite of management adaptations involving different tillage systems and field scattering, among other practices [37,38,39]. Extreme and typically localized weather events like frost and hail regularly result in crop failure [40]. Pest and disease outbreaks are also known to occasionally affect these high-altitude farming environments [41,42]. To mitigate imminent risk and safeguard their food reserves and seed stocks, farmers have developed practices that juxtapose spatial and temporal features of land use at household and communal levels.
An example involves the sectoral fallowing system, or laymi in Quechua, as it aggregates households’ individually assigned fields into six to 10 sectors and is collectively cultivated following a crop–pasture rotation regimen [43,44,45]. Sectoral fallowing systems allow fragile high-altitude soils to partially recover their fertility while making pastureland available for grazing animals [46]. They also optimize labor through community-level coordination [47,48]. Yet another example involves distinct types of tillage systems for potato cultivation [38]. Chiwa is a low-labor-intensity minimal-tillage practice and is commonly applied in sloping environments reserved for landraces. Chacmeo is another minimum-tillage practice that is moderately labor-intensive and well adapted to slope planting of landraces. Barbecho is a full-tillage practice and labor-intensive. It is commonly used for market-oriented production of bred varieties and commercial landraces.
Adaptive agricultural land-use practices have thus enabled smallholder farmers in Peru’s central Andes to manage high intraspecific diversity of the potato. Four botanical species of cultivated potato are recognized following the latest taxonomic treatment: Solanum tuberosum, Solanum curtilobum, Solanum ajanhuiri, and Solanum juzepczukii [49,50]. At the intraspecific level farmers maintain an ample repertoire of genetically and morphologically distinct, farmer-recognized landraces. These landraces—each with a farmer-recognized vernacular name—are the basic unit of management and conservation on the farm [51,52]. At the national level this intraspecific diversity is high and consists of an estimated 2800 to 3300 potato landraces [53]. Even at the village and household levels, landrace diversity can be remarkable. For example, in one hotspot of potato diversity, up to 406 genetically distinct landraces have been identified in the landrace portfolios of just eight farmer households, and individual households are known to maintain as many as 160 unique landraces [54].
Farmers predominantly classify cultivar groups, varieties, or landraces according to visual phenotypic characters [55,56]. Three main cultivar groups are recognized by smallholder farmers in Peru’s central highlands. The floury landraces (S. tuberosum Andigenum Group), also known as “boiling potatoes”, are deemed of high culinary quality and make up the bulk of the potato landrace diversity managed by farmers. They are most often cultivated as mixed lots (chalo, chaqru, or waychuy in Quechua) containing between four and 80 floury landraces while a minority (i.e., eight landraces) are commercially produced in single-cultivar fields [57]. Bitter landraces (S. juzepczukii and S. curtilobum) are generally frost-resistant and only apt to be consumed as freeze-dried chuño due to their high glycoalkaloid content [40,58]. They are also less diverse in number compared to floury landraces. Bred varieties (S. tuberosum) are the result of formal breeding programs and have been amply disseminated for their high-yield and disease-resistance traits in Peru. Farmers have widely integrated these into their cropping portfolios. Bred varieties occupy a special window in terms of food supply as they produce earlier than the floury landraces. They serve a dual purpose: Consumption and the market.
Research concerning the contemporary management of Andean smallholders’ agrobiodiversity, and specifically the interaction between agricultural land use and intraspecific diversity, can help to gain insights into multilevel conservation within and among landscapes, households, and fields. In this in-depth case study, we scrutinize the spatial-temporal dynamics of the potato´s cultivation in two distinct diversity hotspots in Peru’s central Andes. This is done with four objectives in mind. First, to obtain a fine-grained understanding of agricultural land-use patterns in contrasting smallholder farming environments. Second, to systematically document the conservation status of the potato´s intraspecific diversity across the three distinct cultivar categories found in these two sites. Third, to discern the modern-day spatial distribution of this intraspecific diversity along an altitudinal gradient. Four, to inform future in situ monitoring and conservation approaches. Hence, we examine and compare areal allocations, altitudinal ranges, fallowing rates, the use of sectoral fallowing, and the conservation status of individual landraces. We detect possible temporal changes in the distribution of landraces by comparing their contemporary altitudinal range with 1975–1985 elevation records of accessions from the International Potato Center (CIP). We hypothesize that the spatial-temporal dynamics of each agricultural landscape in the central Peruvian highlands respond to distinct pressures driving smallholders’ management innovations while allowing the maintenance of high intraspecific diversity amid contemporary global change. Implications for the long-term in situ conservation tied to agricultural land use are reflected upon.

2. Materials and Methods

2.1. Study Area and Household Sample

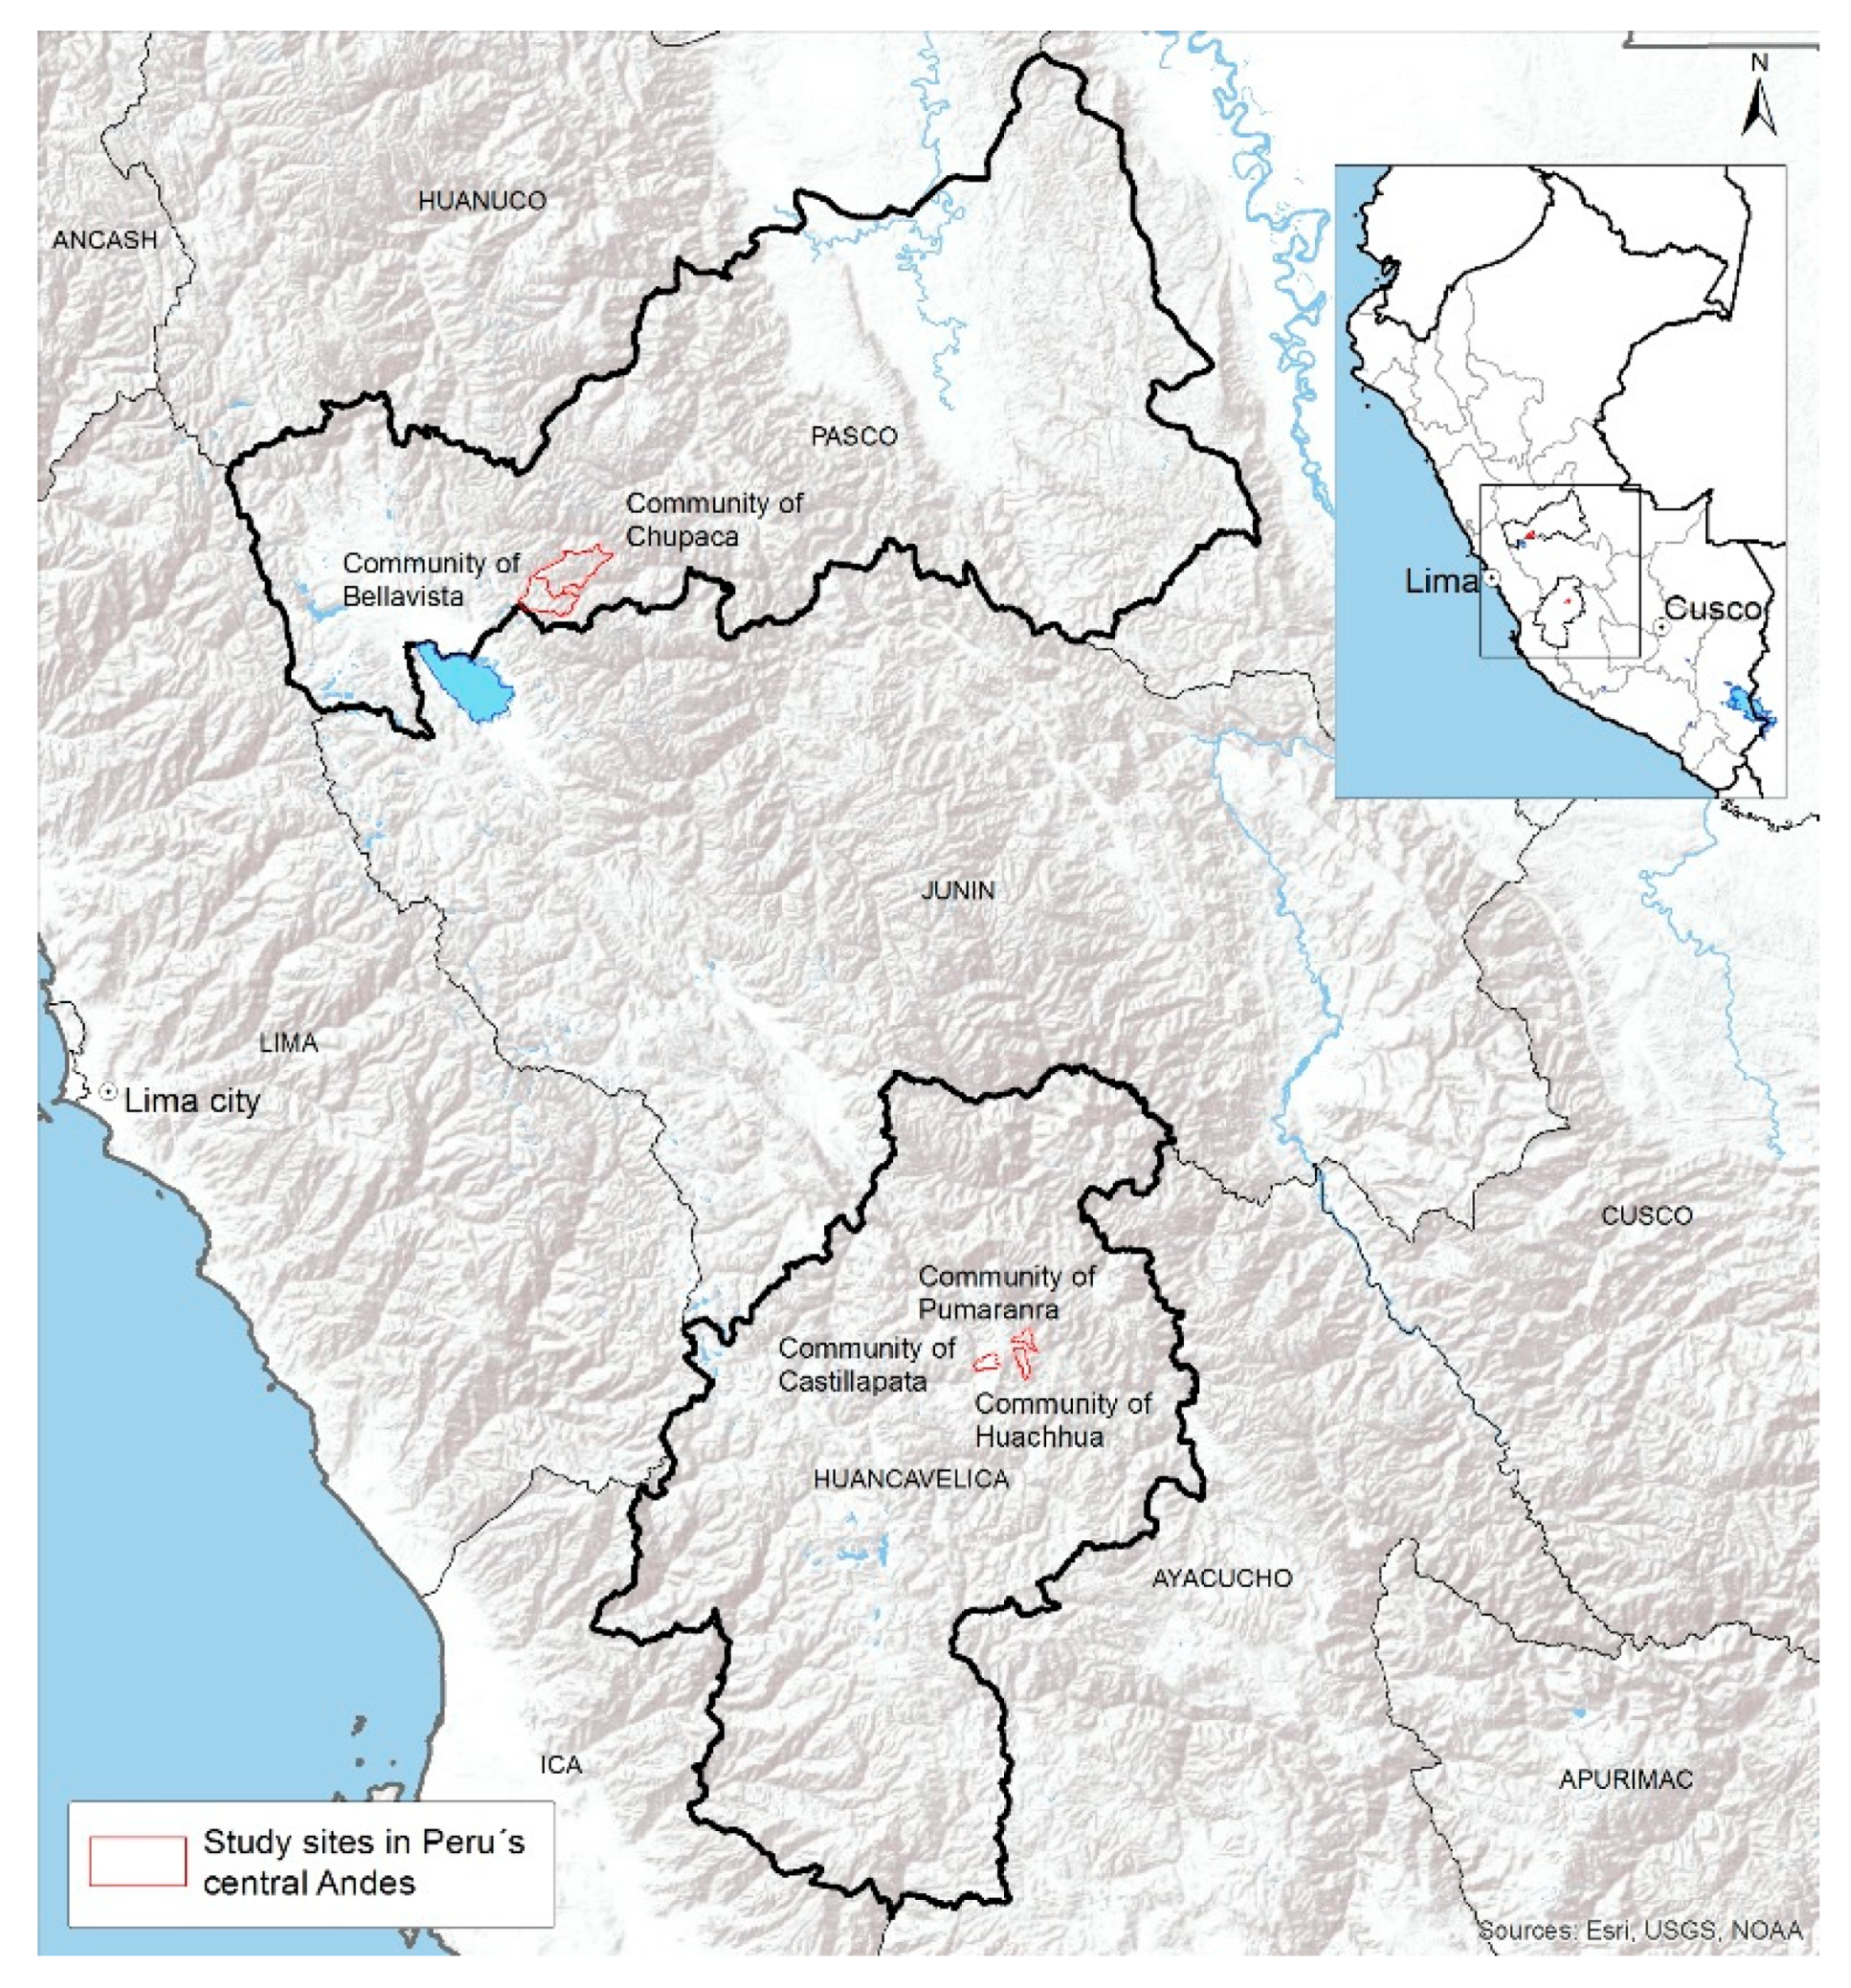
We conducted in-depth research in five communities pertaining to two contrasting highland landscapes of Peru’s central Andes (Figure 1, Table 1). The first cluster of three farmer communities lies in the central plateau or cordillera of the Huancavelica region where potato is grown at high altitude with frequent exposure to frost and hail. The second cluster of two communities is nestled in a valley along the eastern flanks of the Andes in the Pasco region, about 235 km from the Huancavelica region. Here, relatively humid conditions lead to high levels of pressure from late blight disease (Phytophthora infestans). Farmers in Huancavelica are indigenous Quechua speakers, while those in Pasco are mostly mestizo Spanish speakers. Both sites are recognized hotspots of potato intraspecific diversity [59,60]. A total of 176 and 147 households in the Huancavelica and Pasco landscapes, respectively, were randomly sampled and participated in the study.

2.2. Participatory Mapping and Field-Level Sampling

Drawing from cartography and participatory methods we conducted participatory mapping between February and June 2013 to document the agricultural land use of each potato field of participating households. The procedure consisted of two parts. First, we accompanied farmers on one or two visits to each of their potato fields for short surveys, georeferencing, and field sampling of cultivars planted. Second, we ran multiple focus-group meetings centered on drawing over printed high-resolution satellite images of each of the five communities. Participating households located and drew each of their potato fields on the base map. Local authorities delimited community boundaries and identified each of the sectors comprising fallowing systems.
Field-level surveys were conducted with each household (n = 323). Trained enumerators implemented the surveys in Quechua (Huancavelica) and Spanish (Pasco). Each survey had four components: (i) Basic household-level information, (ii) field-level characteristics of each potato field, (iii) georeferencing each potato field with Garmin Oregon 550t global positioning systems (GPS) devices, and (iv) cultivar diversity sampling at harvest. For each georeferenced field a range of variables was collected, including planting date, fallowing-sector association, tillage type, use of chemicals, slope, seed source, and product end use. Georeferencing resulted in the collection of waypoints for the corners and center of each field, as well as altitude. Farmers also recalled crop species content and fallows for each year from 2004 to 2013. A total of 1101 potato fields, 481 in Huancavelica, and 620 in Pasco, were visited, surveyed, and georeferenced.
During the potato harvest from April to June 2013, each potato field (n = 1101) was sampled for its cultivars. In each field, we randomly selected 25 potato plants that were distributed along eight equidistant rows and unearthed one tuber per plant until we arrived at a total count of 200 tubers. In cases where the household had already harvested, we randomly picked 200 tubers from the heap or bags. The sampled tubers served to identify and count each of the individual cultivars following the local nomenclature used by farmers. This exercise was carried out by local survey teams and the farmers to whom each field belonged. In each field, the occurrence of a potato cultivar was recorded as the total count of individual tubers out of 200 total tubers sampled.

2.3. Focus-Group Meetings to Refine Cultivar Classification

Individual cultivars are frequently recognized by more than one name (synonyms), and sometimes the same name is used for distinct cultivars (homonyms). This poses a challenge of over- or under-classification [51]. To overcome this issue, we carried out focus group meetings with farmers who were the most knowledgeable about varietal diversity. A representative collection of the distinct cultivar morphotypes that were identified during field surveys was created for each community by using real tuber samples and, in a few cases, photographs. Local experts, both men and women, indicated alternate names associated with each tuber sample. A list of unique cultivars and their synonyms was thus derived for each community. These, in turn, were compared and cross-checked for the same tuber samples for each landscape. A master list of unique cultivars was attained for each of the two landscapes.

2.4. Conservation Status of Cultivars

To determine the conservation status of cultivars for each landscape (Huancavelica, Pasco) we used two indices [59]: (i) Relative cultivar frequency (RCF), (ii) overall cultivar frequency (OCF). The RCF index is used to gauge the relative abundance or frequency (or rarity) of a unique cultivar in comparison to all other cultivars sampled in each landscape. It indicates the proportion of each distinct cultivar over the total cultivar population sampled in each landscape. For each cultivar occurrence per household, a household cultivar frequency (HCF) was first calculated. This involved summing the number of tubers sampled for a specific cultivar across a household’s total fields, dividing the result by the total number of samples of all cultivars for that household, and multiplying by 100%. The RCF for each cultivar was then derived by summing its corresponding HCFs and dividing the result by the total number of households sampled per landscape. Red listing was based on the threshold levels: RCF < 0.05 = very scarce, RCF < 0.10 = scarce, RCF < 0.25 = uncommon, RCF < 1.00 = common, RCF > 1.00 = abundant.
The OCF index is a measure of evenness. For each cultivar, its community cultivar frequency (CCF) was first calculated by dividing the number of households cultivating it by the total number of sampled households in each community comprising a landscape and multiplying by 100%. The OCF for each cultivar was obtained by summing its CCFs and dividing the result by the total number of communities sampled in the landscape. The evenness of individual cultivars was then classified as the proportion of households growing them: OCF < 1% = very few households, OCF < 5% = few households, OCF < 25% = many households, OCF > 25% = most households.

2.5. Timeline Series Analysis

Possible changes in the altitudinal distributions of floury and bitter landraces were examined. We compared the altitudes documented in this study with gene bank passport altimeter data from all collections made in 1975–1985 for the same two landscapes. The latter data were provided by the International Potato Center and totaled 63 georeferenced landrace accessions from 16 locations in Huancavelica and Pasco.

2.6. Statistical Analyses

Datasets [61,62] containing household and field-level information (Section 2.1, Section 2.2, Section 2.3 and Section 2.4) were analyzed using the statistical computing software R version 3.4.1 [63] as summarized below (Table 2).
Models using logistic regression, generalized linear models (using lasso, elastic, and ridge-based penalized maximum likelihood approaches), and random forest-based approaches were built using field-level management practices data (i.e., cultivar group content, number of cultivars, field area, days to harvest, planting season, sector association, seed source, product end use, tillage type, application (yes/no) of chemicals, and fallowing rate) collected for each field surveyed as explanatory variables, and landscapes as the outcome variable.
Receiver operating characteristic (ROC), sensitivity, and specificity metrics with ten-fold cross validation were used to assess model quality. The coefficient of variation metric was used to identify the lowest lambda value for lasso and ridge-based penalized general linear models. To account for imbalance in the number of intermediate-range fields (97 in Huancavelica and 379 in Pasco), up and down sampling approaches were employed to build the models. The generalized linear model with elastic-based penalization approach was found to perform best in classifying intermediate-range fields and the generalized linear model with ridge-based penalization approach performed best in classifying high-range fields across landscapes. The above analysis was performed in the R statistical computing environment using the packages glmnet caret and catools [65]. The outputs of the models were visualized through boxplots drawn with the ggplot2 package, and association plots (based on an independence model and Pearson test of the residuals) were drawn using the vcd package in the R statistical computing environment [63,66,67].

2.7. Research Ethics

The study was conducted under the Global Program on Genetic Resources at the International Potato Center (CIP) in Peru, following Peruvian laws and regulations for research undertaken in Peru. Therefore, the research proposal was reviewed under the supervision of the Office of the Deputy Director General for Research and Development and was allowed and conducted in accordance with CIP’s research guidelines, with particular adherence to prior informed consent, data anonymization, protection of personal data, and ethical research behavior. Ethics approval was not required for this research according to national regulations as it involved human subjects in non-invasive survey procedures. We sought and obtained the approval of community authorities prior to survey implementation. We described the objectives of the study, the methodology, the oral prior informed consent option, voluntary nature, and confidentiality of households participating during a community assembly. Community authorities from the five communities selected agreed to the study. Households were surveyed only after community-level approval.

3. Results

3.1. Household Characteristics

We calculated and compared main household features across landscapes (Table 3). These indicated demographic and socio-economic distinctions, such as in the average number of children per household, the proportion of heads of household without formal schooling, and family versus hired labor to sustain agricultural activities on the farm. Households in Huancavelica access and manage much smaller areas. The most significant differences between households in Huancavelica and Pasco as detected by logistic regression analyses (best model) were number of children, number of fields, off-farm income, number of floury landraces, and average area cultivated with bred varieties (Table 4).

3.2. Field-Management Characteristics

The number of potato fields cropped per household was 2.7 (±1.4) in Huancavelica and 4.3 (±2.1) in Pasco. Rented fields represented 11.9% of total fields only in Pasco. Potato production in Huancavelica was destined for household consumption for 78.0% and dual purpose (consumption and sale) for 22.0% of fields. In Pasco, production for sale represented 60.0%, dual purpose 23.5%, and solely consumption 16.5%. Most field production had a secondary end use. In Huancavelica, farmers saved medium-sized tubers for both seed and making freeze-dried chuño from 90.7% of fields. Seed and chuño production exclusively were secondary uses for 8.1% and 0.4% of fields, respectively. Only 0.8% of production from sampled fields had no secondary end use. In Pasco, secondary uses were seed and chuño production (20.0%), tuber seed exclusively (39.4%), chuño production exclusively (28.4%), seed and pig feed (4.8%), pig feed exclusively (1.1%), chuño and pig feed (0.8%). Only 5.5% of production from surveyed fields did not have any secondary end use.
In both landscapes, households followed two potato cropping calendars, the qatun tarpuy, literally ‘big planting’ (main season), and the michka, or small planting (off-season). The ‘big plantings’ coincide with the main rainy season and span from October–November (sowing period) to May–June (harvesting period). It is the most intensive season in terms of labor demands. The off-season plantings are short, involve small cropping areas, and generally demand access to irrigation with sowing taking place from June to July (dry season). Consequently, most potato fields mapped corresponded to the main season: 97.1% and 82.4% of fields in Huancavelica and Pasco, respectively. The number of main and off-season fields per household, respectively, was 2.7 (±1.3) versus 0.1 (±0.2) in Huancavelica, and 3.5 (±1.9) versus 0.8 (±0.9) in Pasco. Pasco had the longer potato-growing calendar. The number of days to harvest was 261.9 (±32.1) compared to 197.3 (±21.7) in Huancavelica. However, the minimum and maximum number of days to harvest recorded for each were similar: 121 and 304 in Huancavelica versus 120 and 309 in Pasco, depending on the cultivar group and specific cultivar involved.
All potato fields in Pasco and 44.7% of fields in Huancavelica received applications of chemicals (fungicides and fertilizers). Most potato fields, 71.9% in Huancavelica and 100% in Pasco, were managed with the chiwa tillage system, followed by barbecho (22.5%) and chacmeo (5.6%) in Huancavelica. In this central plateau, fields with floury landraces were tilled 73.1% chiwa, 23.2% barbecho, and 3.7% chacmeo; fields with bred varieties were tilled 68.8% chiwa, 22.4% barbecho, and 8.8% chacmeo; and fields with bitter landraces were tilled 95.2% chiwa, 1.9% barbecho, and 2.9% chacmeo.

3.3. Cultivar Diversity, Abundance, and Evenness

Field sampling and focus group meetings resulted in the identification of 130 and 191 unique cultivars for Huancavelica and Pasco, respectively. Floury landraces represented the bulk of diversity: 85.5% of cultivars in Huancavelica and 95.8% in Pasco. Bred varieties made up 9.2% and bitter landraces 5.3% of cultivars in Huancavelica. In Pasco, bred varieties were 3.7% and bitter landraces 0.5% of cultivar diversity. Floury landraces dominated households’ portfolios (Table 5). The maximum number of cultivars for any household (56) was recorded for this cultivar group in Pasco. Bred and bitter landraces registered a maximum household-level cultivar count of six and five cultivars, respectively in Huancavelica.
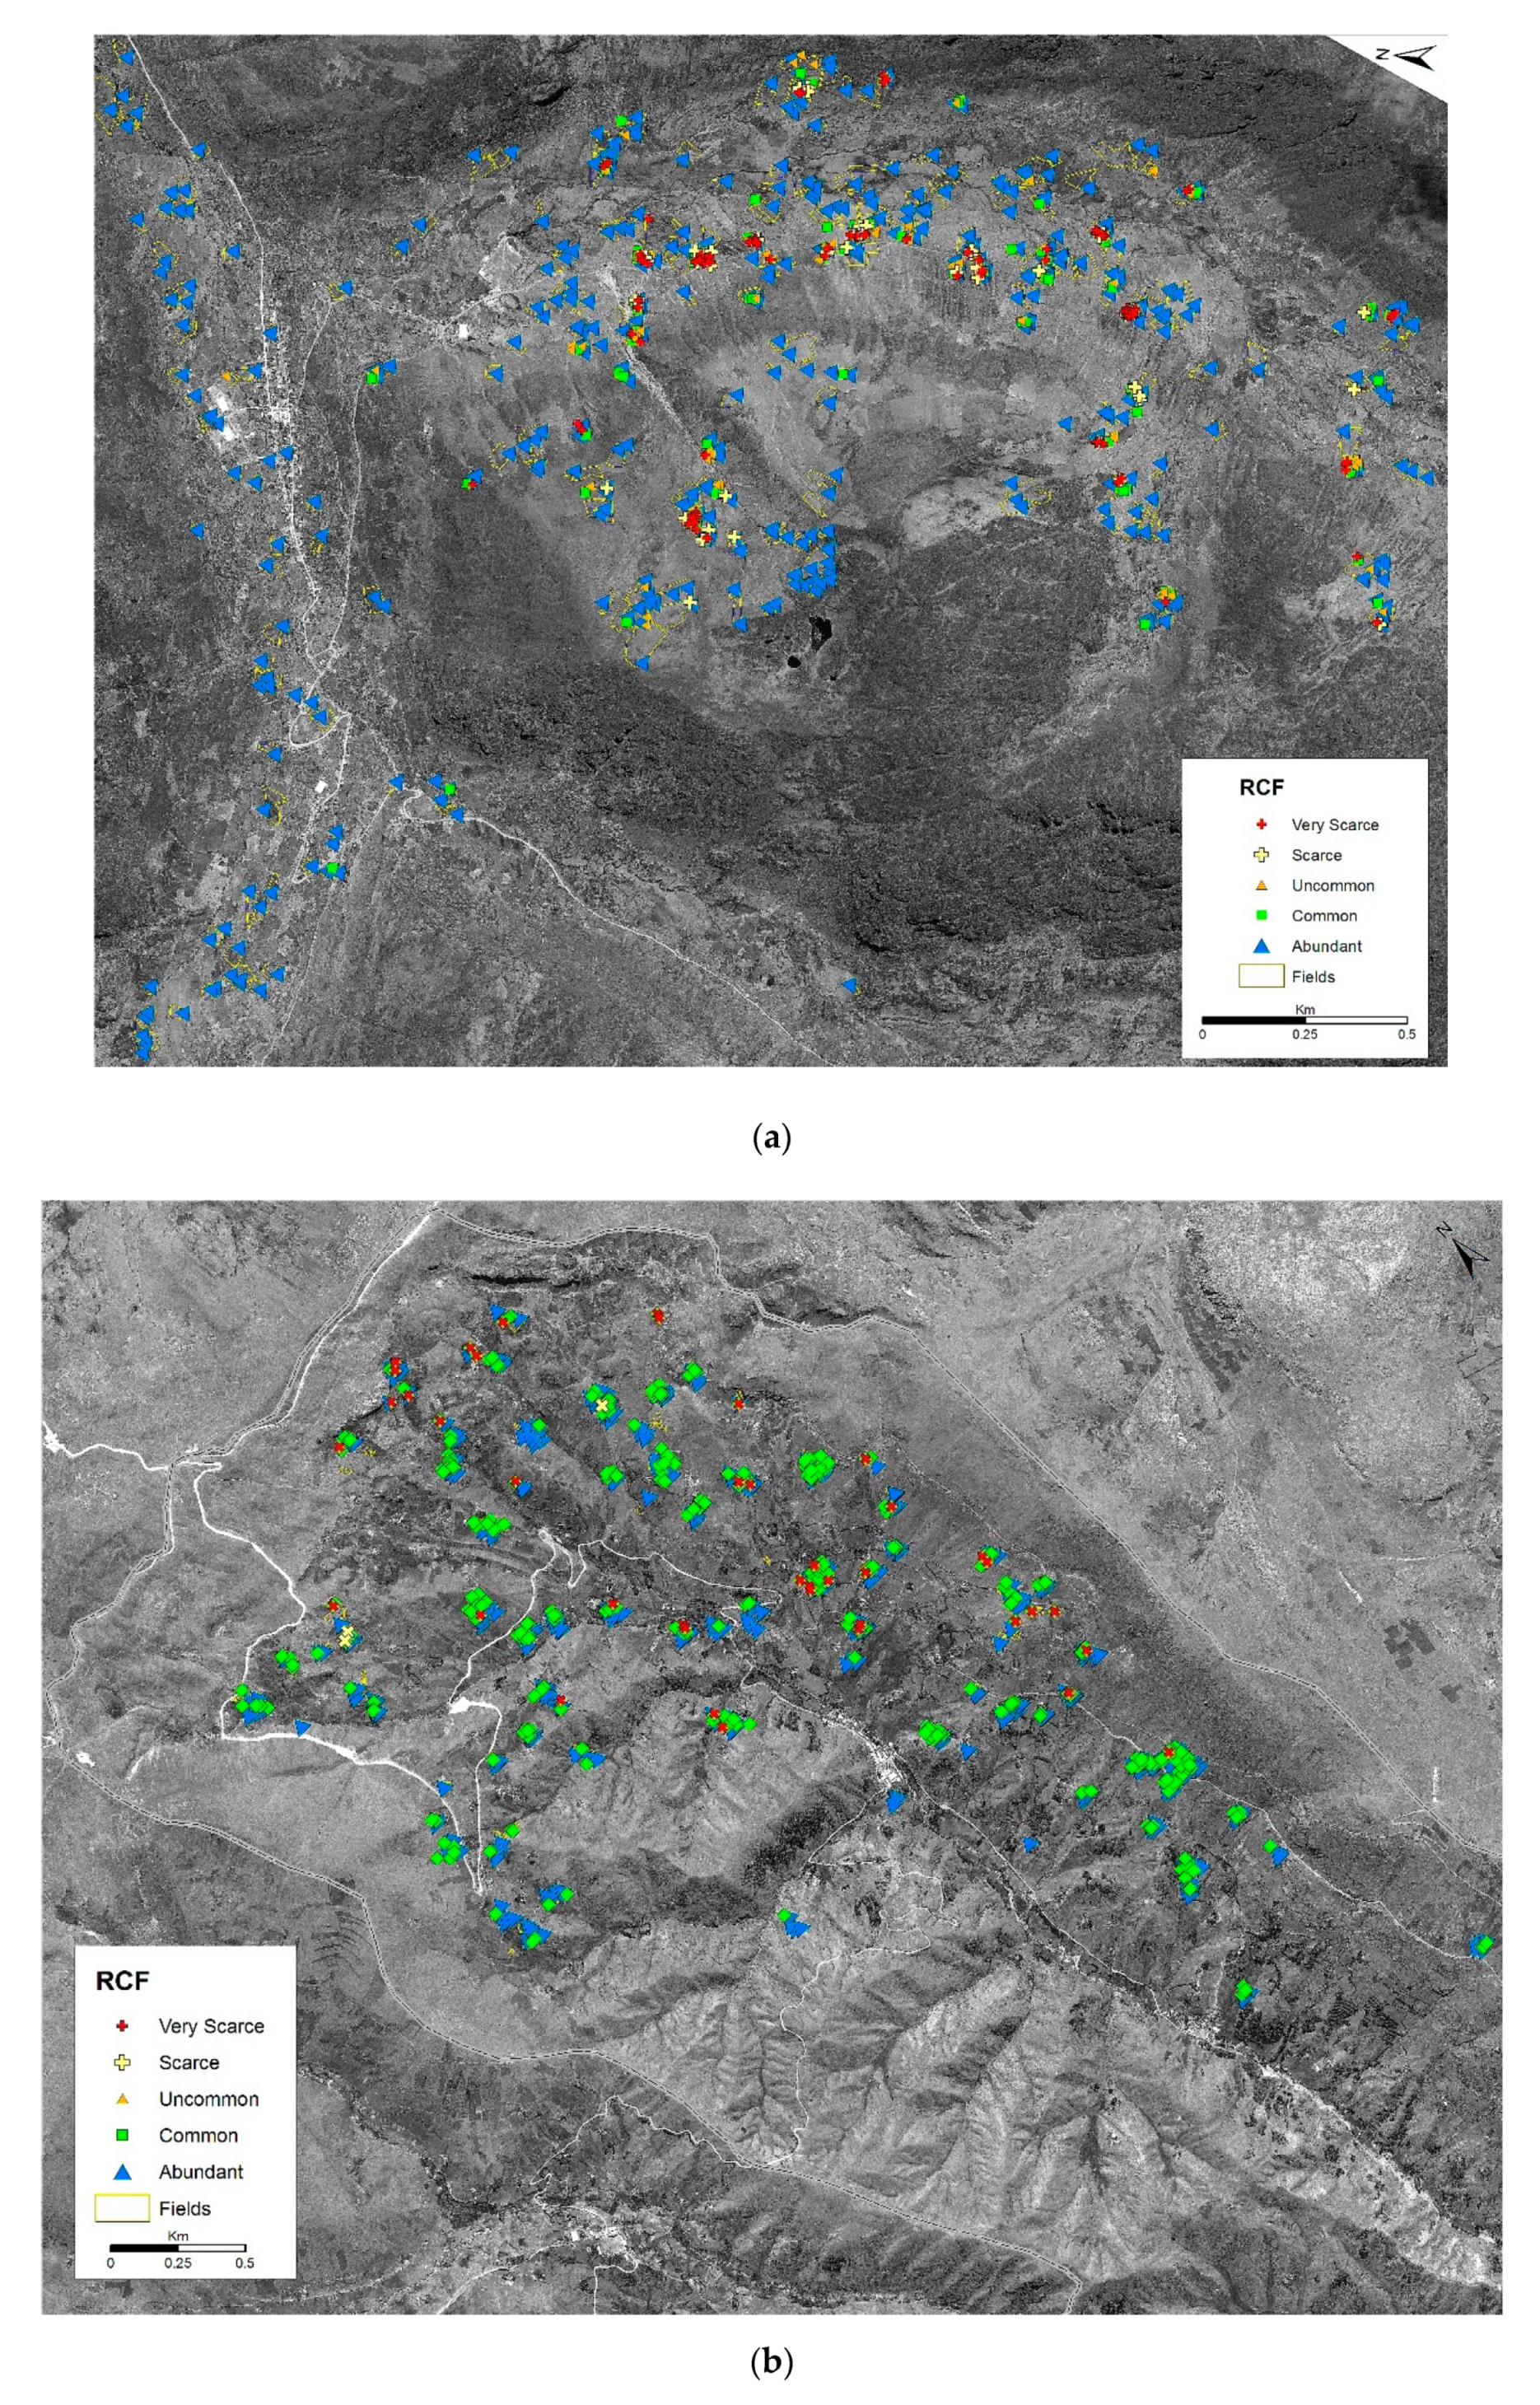
We contrasted the spatial distribution and relative abundance of cultivars by RCF index value (Figure 2a,b) for a representative community in each landscape. Red listing showed that most cultivars were very scarce (RCF < 0.05) across households: 45.4% of total cultivars in Huancavelica and 61.7% in Pasco (Table 6). These were predominantly floury landraces. Huancavelica showed comparatively more common and abundant cultivars than Pasco. In terms of evenness, approximately two thirds of cultivars in each landscape were grown by very few households (OCF < 1%) or few households (OCF < 5%) while less than 15% of cultivars were present in the cropping portfolios of most households (OCF > 25%, Table 7). Overall, for the landscapes combined, 12.5% of cultivars were in the cropping portfolios of most households while 29.6% were grown by less than 1% of households.

3.4. Spatial Management of Intraspecific Diversity

3.4.1. Fields with One Type of Cultivar Compared to Fields with Mixed Groups

Mixed fields with two to three cultivar groups contained the highest average number of distinct cultivars: 13 (±8.8) cultivars per field in Huancavelica and 14 (±6.4) in Pasco. The distribution of distinct cultivar groups within such mixed fields always involved separated sub-plots assigned to floury landraces, bitter landraces, or bred varieties. Fields containing all three cultivar groups only made up 5.4% of the fields sampled in Huancavelica. In Pasco, most mixed fields comprised combinations of floury and bred cultivars and represented 11.5% of all sampled fields. These contained an average of 11.8 (±11.6) cultivars per field. Bred varieties and floury landraces occurred together in 23.1% of fields in Huancavelica, with an average of 10.2 (±5.4) cultivars per field. Across landscapes, most fields were planted exclusively with floury landraces: 48.9% of fields in Huancavelica and 60.6% in Pasco with 57.9% and 49.5% of these, respectively, containing chaqru mixtures of at least four cultivars. On average, exclusively floury fields contained 6.0 (±5.5) cultivars per field in Huancavelica and 6.0 (±6.8) in Pasco. A much lower proportion of fields contained exclusively bred varieties: 6.9% in Huancavelica and 27.1% in Pasco, with an average of 1.1 (±0.3) varieties per field in each landscape. Floury and bitter landraces occurred together in 11.4% of fields in Huancavelica and 0.6% in Pasco. Only in Huancavelica were fields planted exclusively with bitter landraces (4.4%) at an average 1.3 (±0.7) cultivars per field. In Pasco bitter landraces were grown with bred varieties and floury landraces in 0.8% of fields. In these cases (n = 5) only one bitter landrace was cultivated out of an average of 15.8 total cultivars per field. Floury landraces were allocated the most fields per household in both landscapes (Table 8). In Pasco, the average number of fields per household with exclusively floury landraces and exclusively bred varieties surpassed that of Huancavelica by roughly one field.

3.4.2. Cropping Areas

The total potato cropping area differed considerably between landscapes: 35.0 ha for 176 households in Huancavelica and 81.0 ha for 147 households in Pasco. Total areal proportions by cultivar group were 82.9% versus 74.2% for floury landraces, 9.2% versus 25.7% for bred varieties and 7.9% versus 0.1%, for bitter landraces in Huancavelica and Pasco, respectively. Floury cultivars comparatively occupied the largest areas per household (Table 9). These were 5.9 and 2.3-fold the cropping areas of bred varieties and bitter landraces, respectively, in Huancavelica, and 4.2 and 70.2-fold the cropping areas of their counterparts in Pasco. Household field sizes were notably different between the two landscapes (Table 10). These always tended to be two to three times larger for households in Pasco for fields with bred varieties and floury landraces or a mix of these two cultivar groups.

3.4.3. Contemporary Range of Altitudes at Which Potatoes are Grown

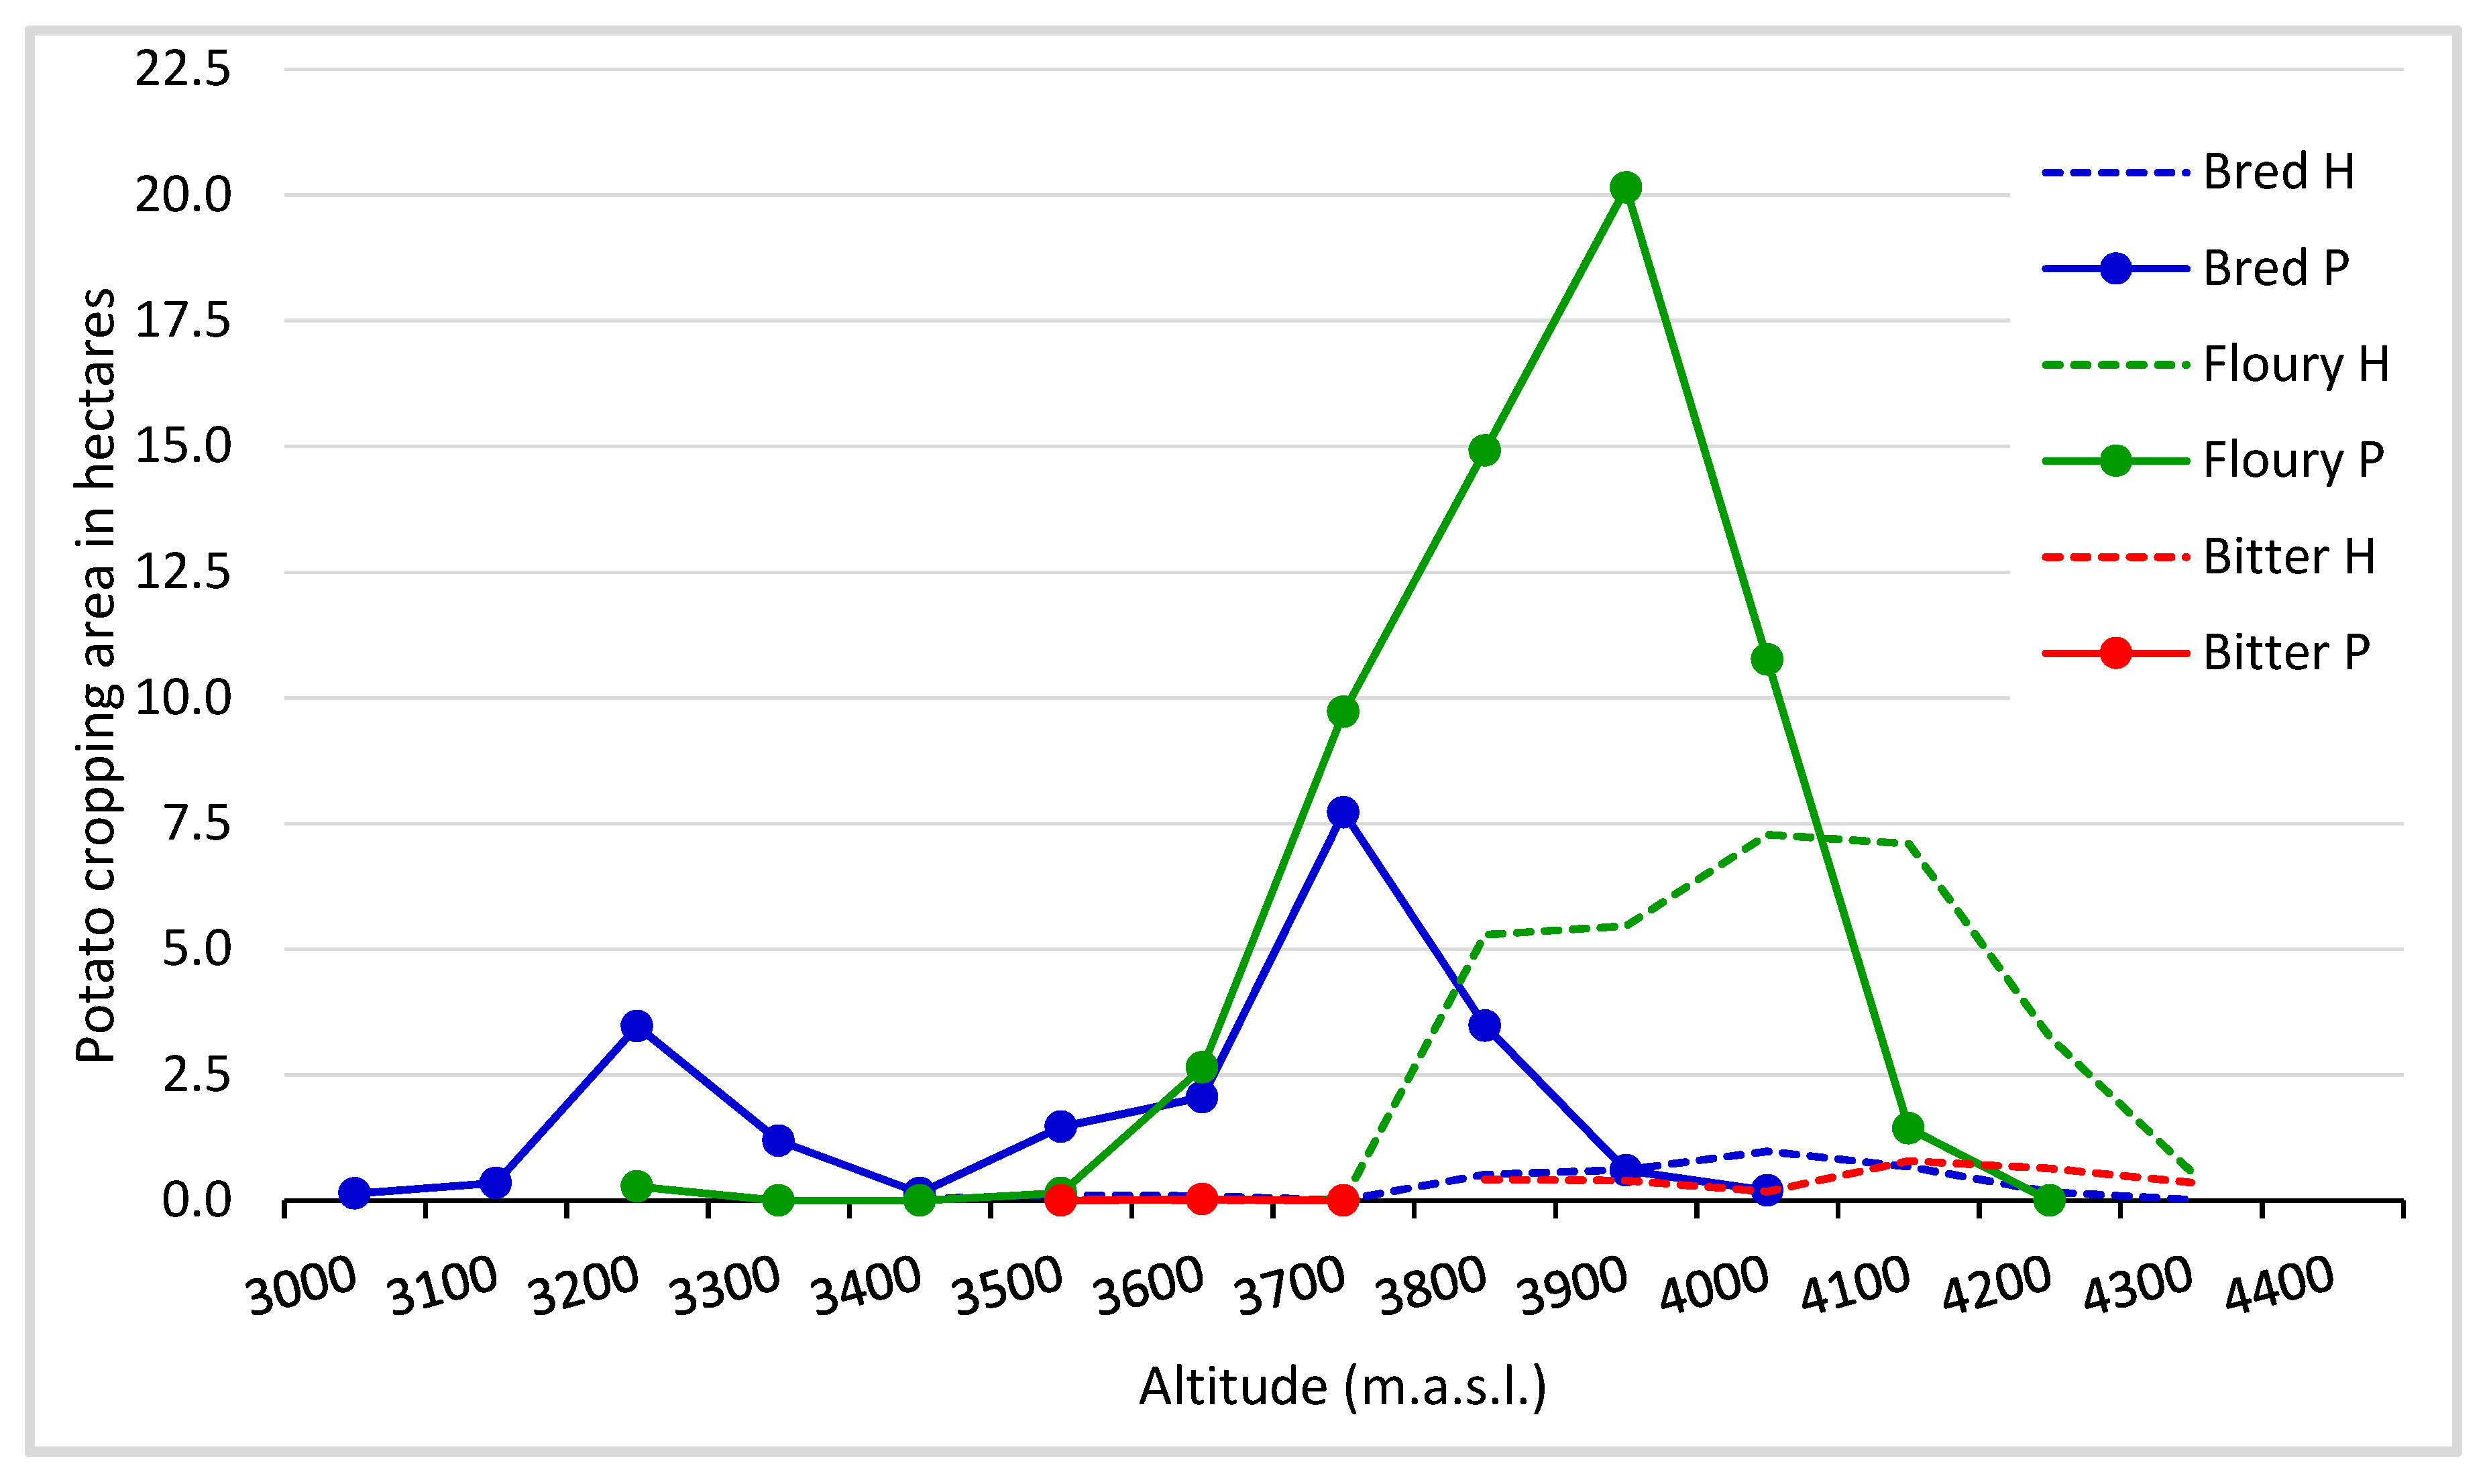
The altitudinal distribution of potato differed by 200 m between landscapes, with Pasco having a slightly wider range (3000–4200 m) and distribution in Huancavelica reaching higher altitudes (3400–4400 m) (Figure 3). In Huancavelica and Pasco, respectively, 84.9% and 83.5% of cultivation in terms of areal coverage occurred between 3800 and 4200 m, and 3700 and 4100 m. Cultivation of bred varieties and floury landraces began at 3097 and 3264 m in Pasco versus 3464 and 3521 m in Huancavelica. Bred varieties and floury landraces overlapped for a 900 m range in both landscapes: from 3500 to 4400 m in Huancavelica and 3200 to 4100 m in Pasco. Across cultivar groups and landscapes, bred varieties occupied the widest altitudinal distribution of 1100 m while bitter landraces had a narrow range of 400 m in Pasco. Bitter landraces began to occur at 3800 versus 3600 m of altitude in Huancavelica and Pasco, respectively. All three cultivar groups overlapped between 3800 and 4400 m in Huancavelica and 3600 and 4000 m in Pasco.
We also examined the number of cultivars per field for incremental 100-m altitudinal belts in each landscape. In Huancavelica, the highest concentration of cultivars occurred at the 4000–4100 m altitudinal belt with an average 37.0 (±12.7) and maximum 46 cultivars per field. These were floury, bitter, and bred cultivars. This was the case at 3900–4000 m with an average 22.3 (±11.6) and maximum 50 cultivars per field in Pasco, involving only floury landraces and bred varieties. The highest levels of within-field diversity are concentrated at the upper limits.

3.5. Temporal Characteristics of Intraspecific Diversity

3.5.1. Fallow in Rotations

Of 1101 surveyed fields, 92.4% had a fallow period in the rotation. Remaining fields were cultivated uninterruptedly. The average period was a total of 7.4 years for the ten-year cropping cycle recalled in the study. This consisted, in 47.6% of cases, of intermittent resting with at least one cropping interruption. Fields with a fallow in the rotation represented 96.3% of fields in Huancavelica and 89.4% in Pasco. Average field-level fallowing rates were calculated for exclusive and mixed fields by cultivar group (
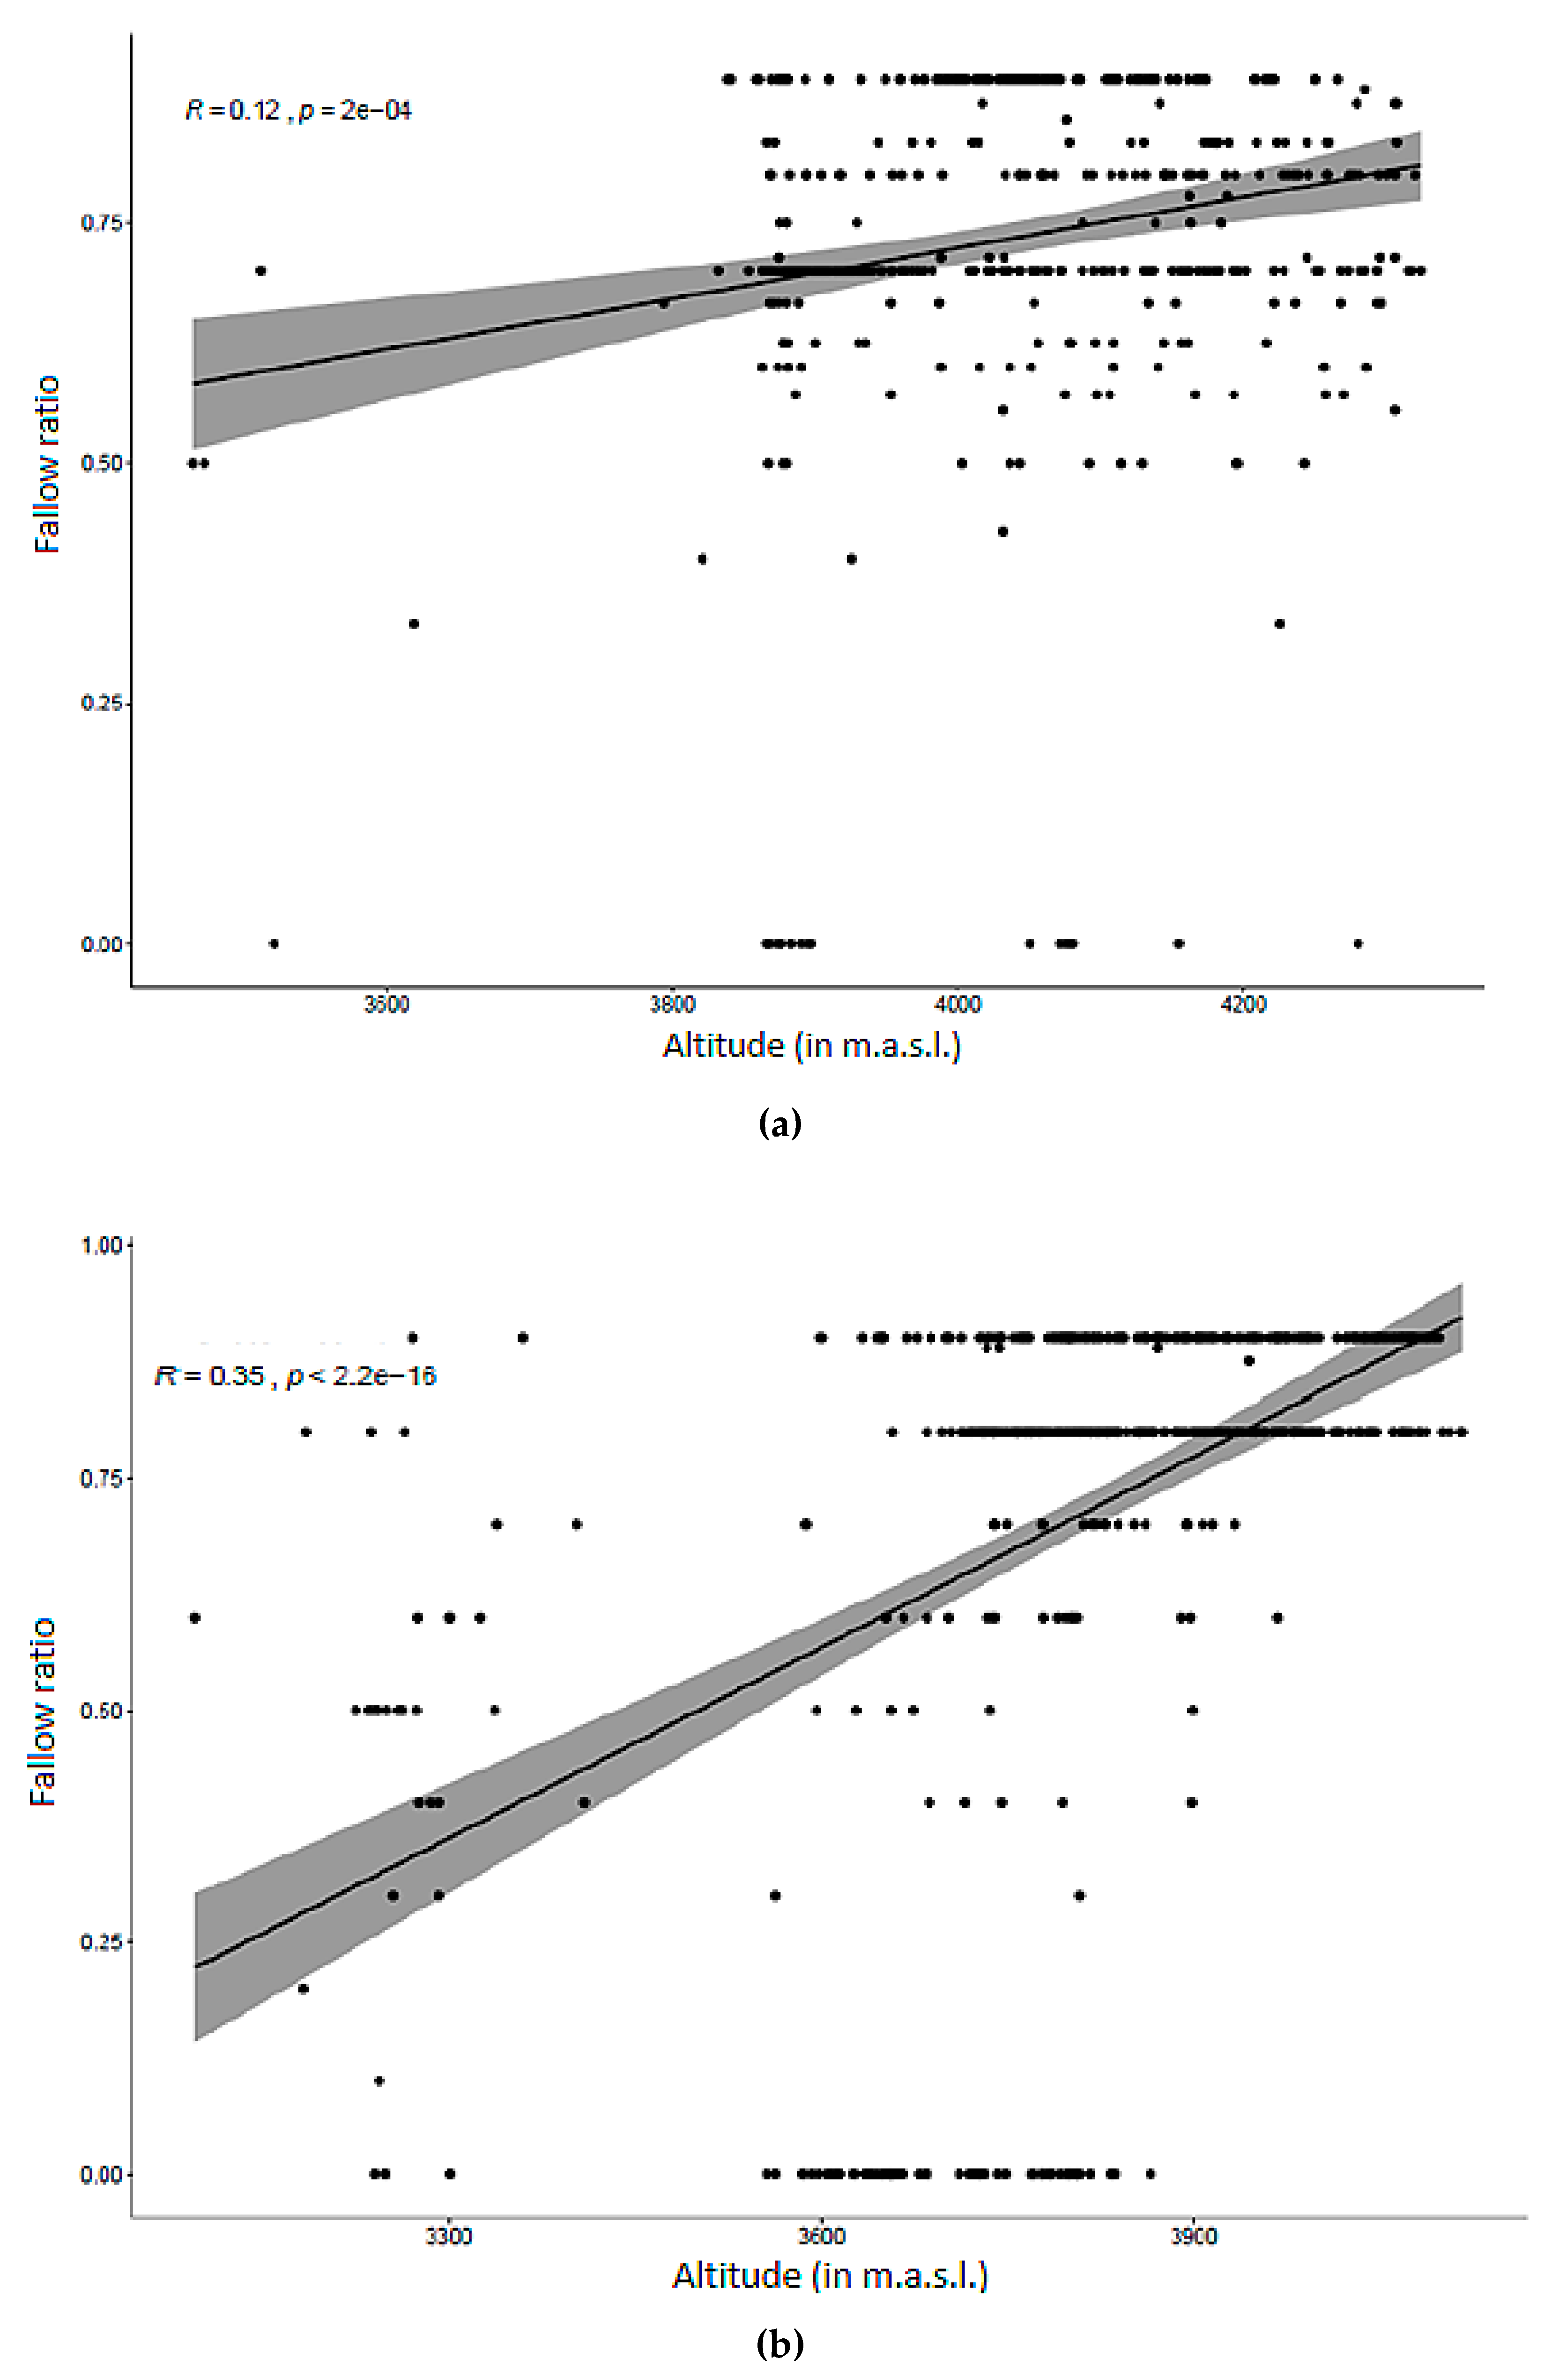
Table 11). Fields containing exclusively bred varieties in Pasco showed the lowest fallowing rates (4.4 out of 10 years) and most intensive management compared to fields exclusively containing floury landraces (8.3 out of 10 years). Therefore, discriminatory management for fields with exclusively bred varieties or landraces occurred in Pasco. This was not the case in Huancavelica, where differences in fallowing periods between cultivar groups were smaller: 7.5, 7.4, and 7.2 years for fields containing bred varieties, floury, and bitter landraces, respectively. In both landscapes, we found a significant positive relationship (p < 0.001) between the fallowing rate and altitude of fields (Figure 4a,b). The duration of fallowing periods tended to increase with altitude. However, in Pasco this relationship was stronger (R = 0.35) compared to Huancavelica (R = 0.12).

3.5.2. Rotation Sequences

Most fields involved only potato in their cropping sequences: 54.1% in Huancavelica and 98.9% in Pasco. In Huancavelica, 7.3% of these fields involved two cultivar groups into their rotations, i.e., a bred varieties-floury landraces or floury landraces-bitter landraces sequence, and subsequently a fallow period. Remaining fields exclusively involving potato in this landscape obeyed the sequence bred varieties-fallow (6.5%), floury landraces-fallow (51.2%), bitter landraces-fallow (2.3%), and 32.7% involved mixed cultivar groups followed by a fallowing period. In Pasco, 10.3% of fields exclusively involving potato did not include a fallowing period in the cropping rotation. These were either uninterrupted bred varieties-floury landraces sequences (8.5%) or entirely dominated by bred varieties (1.8%). In this landscape, 16.1% of fields exclusively involving potato included bred varieties and floury landraces as mixed plots in a cropping sequence with a fallow, while 13.1% and 60.5% had a bred varieties-fallow and floury landraces-fallow sequence, respectively.
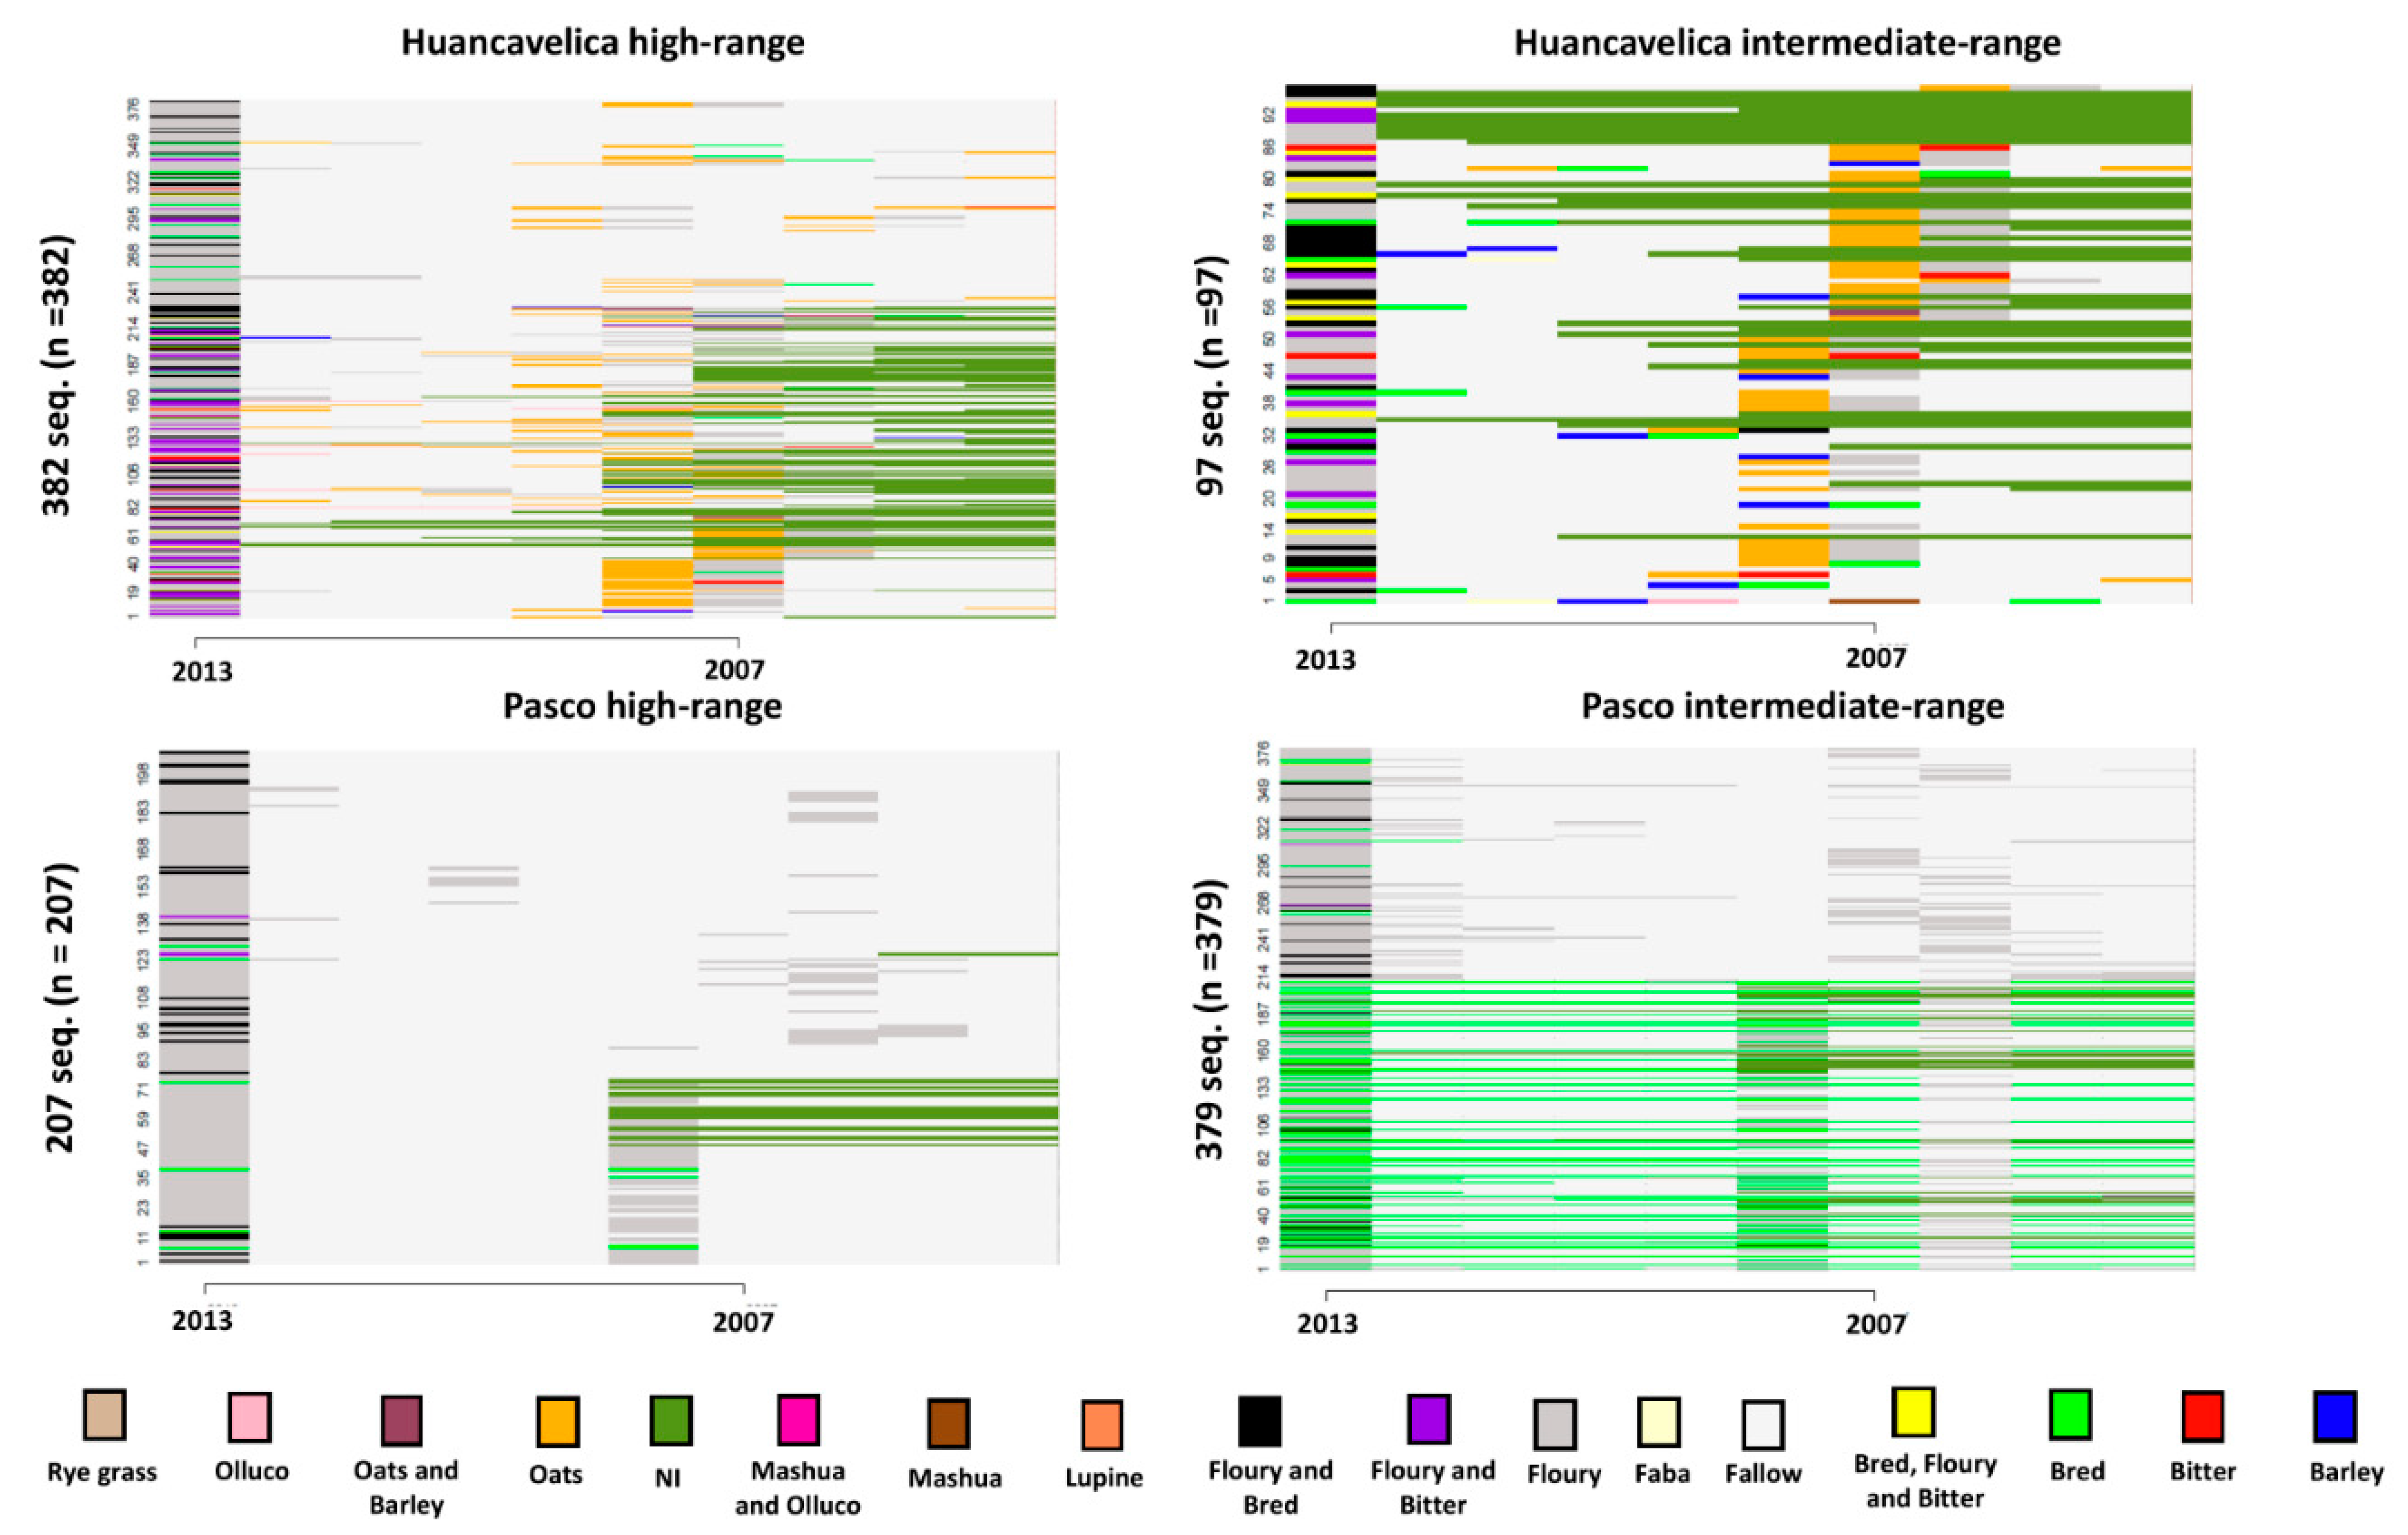
Rotation sequences with other crop species were more varied and frequent in Huancavelica than Pasco at both intermediate and high altitudinal ranges (Figure 5). In Huancavelica, 44.5% of potato fields integrated cereals (oats, barley), 1.2% legumes (faba, lupine), 1.2% grasses (Lolium multiflorum), and 0.6% minor Andean tubers (Ullucus tuberosus, Tropaeolum tuberosum) in the rotation. Cereals were not included at all in rotation sequences with the potato in Pasco, and only 1.0% of fields incorporated a legume (peas) and 0.2% an Andean tuber (Tropaeolum tuberosum). Cereals were planted after floury landraces (20.8%), bitter landraces (2.7%), bred varieties (2.5%), and fields containing mixed cultivar groups (18.3%) in Huancavelica. Legumes in this landscape were planted after floury landraces (0.2%), bred varieties (0.6%), and mixed bred and floury cultivars (0.4%). All cropping sequences containing legumes and Andean tubers in Pasco occurred after bred varieties.

3.5.3. Association of Fields with Sectoral Fallowing Systems

Fields associated with a communal sectoral fallowing system comprised 32.4% of all surveyed fields and 33.5% of the total potato cropping area in Huancavelica. In Pasco, they represented 89.2% of fields and 92.1% of its total potato cropping area. The total area with potato under sectoral fallowing was 11.7 ha in Huancavelica and 74.5 ha in Pasco. These were covered 84.7% with floury landraces, 7.1% with bred varieties, and 8.2% with bitter landraces in Huancavelica. The potato cropping area under sectoral fallowing in Pasco was 80.5% floury landraces, 19.5% bred varieties, and 0.04% bitter landraces. Areas that were not part of a sectoral fallowing regime comprised 23.3 ha in Huancavelica and 6.5 ha in Pasco. These were allocated 82.0% floury landraces, 10.2% bred varieties, and 7.8% bitter landraces in Huancavelica; and 1.6% floury landraces and 98.4% bred varieties in Pasco. One hundred (100) of 130 cultivars in Huancavelica and 189 of 191 cultivars in Pasco occurred in areas under sectoral fallowing. Areas that were not managed as part of a sectoral fallow contained 105 cultivars in Huancavelica and 25 in Pasco.
In each landscape, we compared fields associated and not associated with sectoral fallowing systems for cultivar diversity per field, field size, and altitude. We identified significant and opposing differences in the altitudinal distribution of fields associated and not associated with sectoral fallowing systems. While in Huancavelica fields in sectoral fallows had a significantly lower median value in altitude compared to those outside such sectors (3938 (±94) m versus 4090 (±134) m, W = 8823, p = 2.2e − 16), in Pasco, fields in sectoral fallows had a significantly higher median altitudinal value than fields dissociated from sectors (3836 (±175) m versus 3679 (±145) m, W = 30,302, p = 2.2e − 16). No significant differences (p > 0.05) were observed in cultivar diversity and field size between fields associated and not associated with sectoral fallows in Huancavelica. However, significant differences were observed for the same in Pasco. Sector fields had higher median values with respect to the total number of cultivars (5.9 (±7.6) versus 1.4 (±2.5) cultivars per field, W = 27,582, p = 4.481e − 12) and field size (1348 (±1555) m² versus 958 (±1235) m², W = 23,107, p = 0.0009386) in comparison to non-sector fields.
The fallowing sectors in Pasco were specifically targeted to landraces concentrating high levels of cultivar diversity while the non-sectoral fallowing land, subject to household-level decision-making, was predominantly destined to bred varieties and a limited number of commercial landraces in comparatively smaller field areas. Such a pattern does not show for Huancavelica where areal arrangements for cultivar group portfolios and cultivar diversity are evenly distributed across the two land-use systems.

3.6. Agricultural Landscape Differences by ‘Fixed’ Altitudinal Ranges

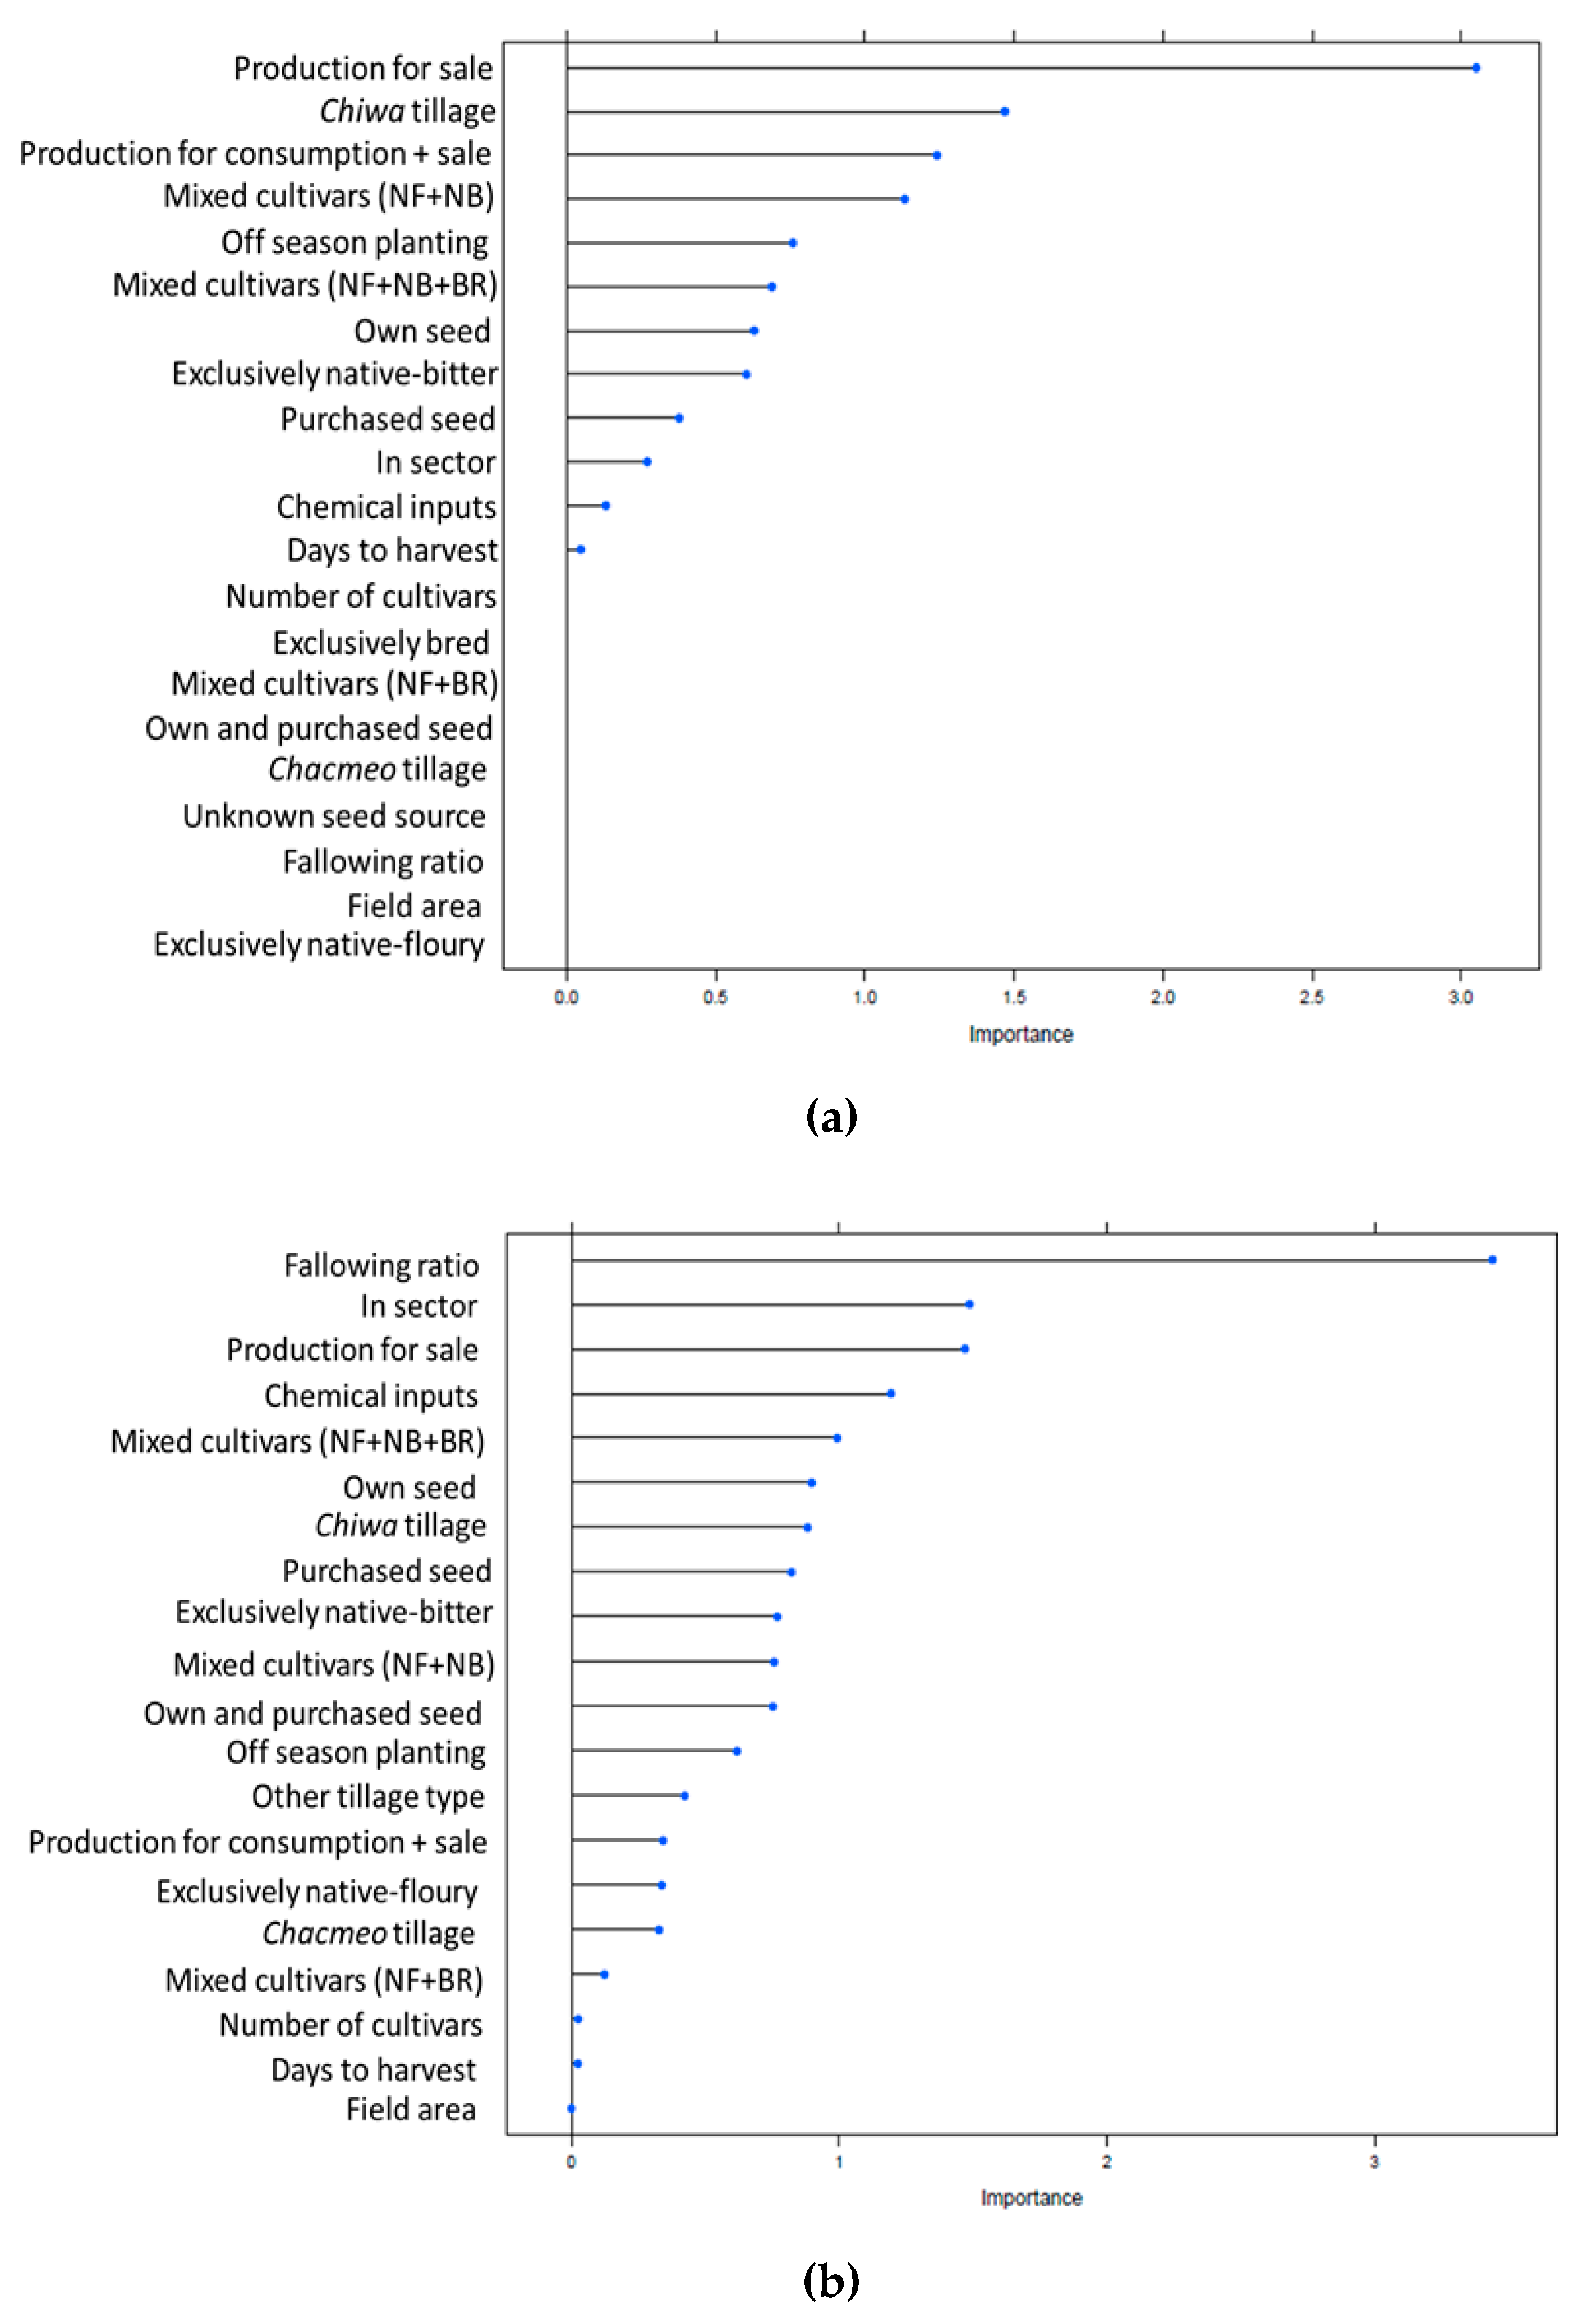
Based on the generalized linear model (with elastic-based penalization) (see Materials and methods, Section 2.6), we identified characteristics that significantly differentiated the management of intermediate-range fields (3500 to 3899 m) across Huancavelica and Pasco. Product end use, tillage type, and mixed-cultivar fields were the top differentiators for this altitudinal range (Figure 6a, Figure S1a–c). Intermediate-range fields in Pasco were significantly associated with production for sale (65% of fields), while in Huancavelica it was consumption as end use (95% of fields). Further, intermediate-range fields in Huancavelica were significantly associated with mixed-cultivar groupings containing floury and bitter landraces (12% of fields), in contrast to Pasco, where less than 0.1% of its fields at this range showed this cultivar combination. Tillage type also significantly differentiated smallholder management between landscapes, with all fields in Pasco being managed through chiwa tillage. In Huancavelica, 82.5%, 10.3%, and 7.2% of fields at this range were tilled using chiwa, chacmeo, and barbecho, respectively.
Analysis of upper-range fields (3900 to 4324 m) revealed that fallowing ratio, number of fields associated with sectors, product end use, and chemical inputs were the top differentiating features of potato production between landscapes (Figure 6b, Figure S1d–f). All fields in Pasco belonged to a fallowing sector. This applied to 23.3% of fields in Huancavelica. Field fallowing rates were also higher in Pasco at this range, 0.85 (±0.06) versus 0.76 (±0.15) in Huancavelica. A significantly higher proportion of high-range fields (50%) was associated with sale in Pasco, in contrast to Huancavelica where significantly more fields (73%) were destined to consumption. Chemical inputs characterized all high-range fields in Pasco but only 31.9% of fields in Huancavelica. Seed source further significantly differentiated upper-range fields between landscapes, with farmers’ own seed applying to 99.7% of high-range fields in Huancavelica and 49.3% of fields in Pasco. In addition, high-range fields containing all cultivar groups occurred only in Huancavelica.

3.7. A Timeline Comparison of Altitudinal Distribution

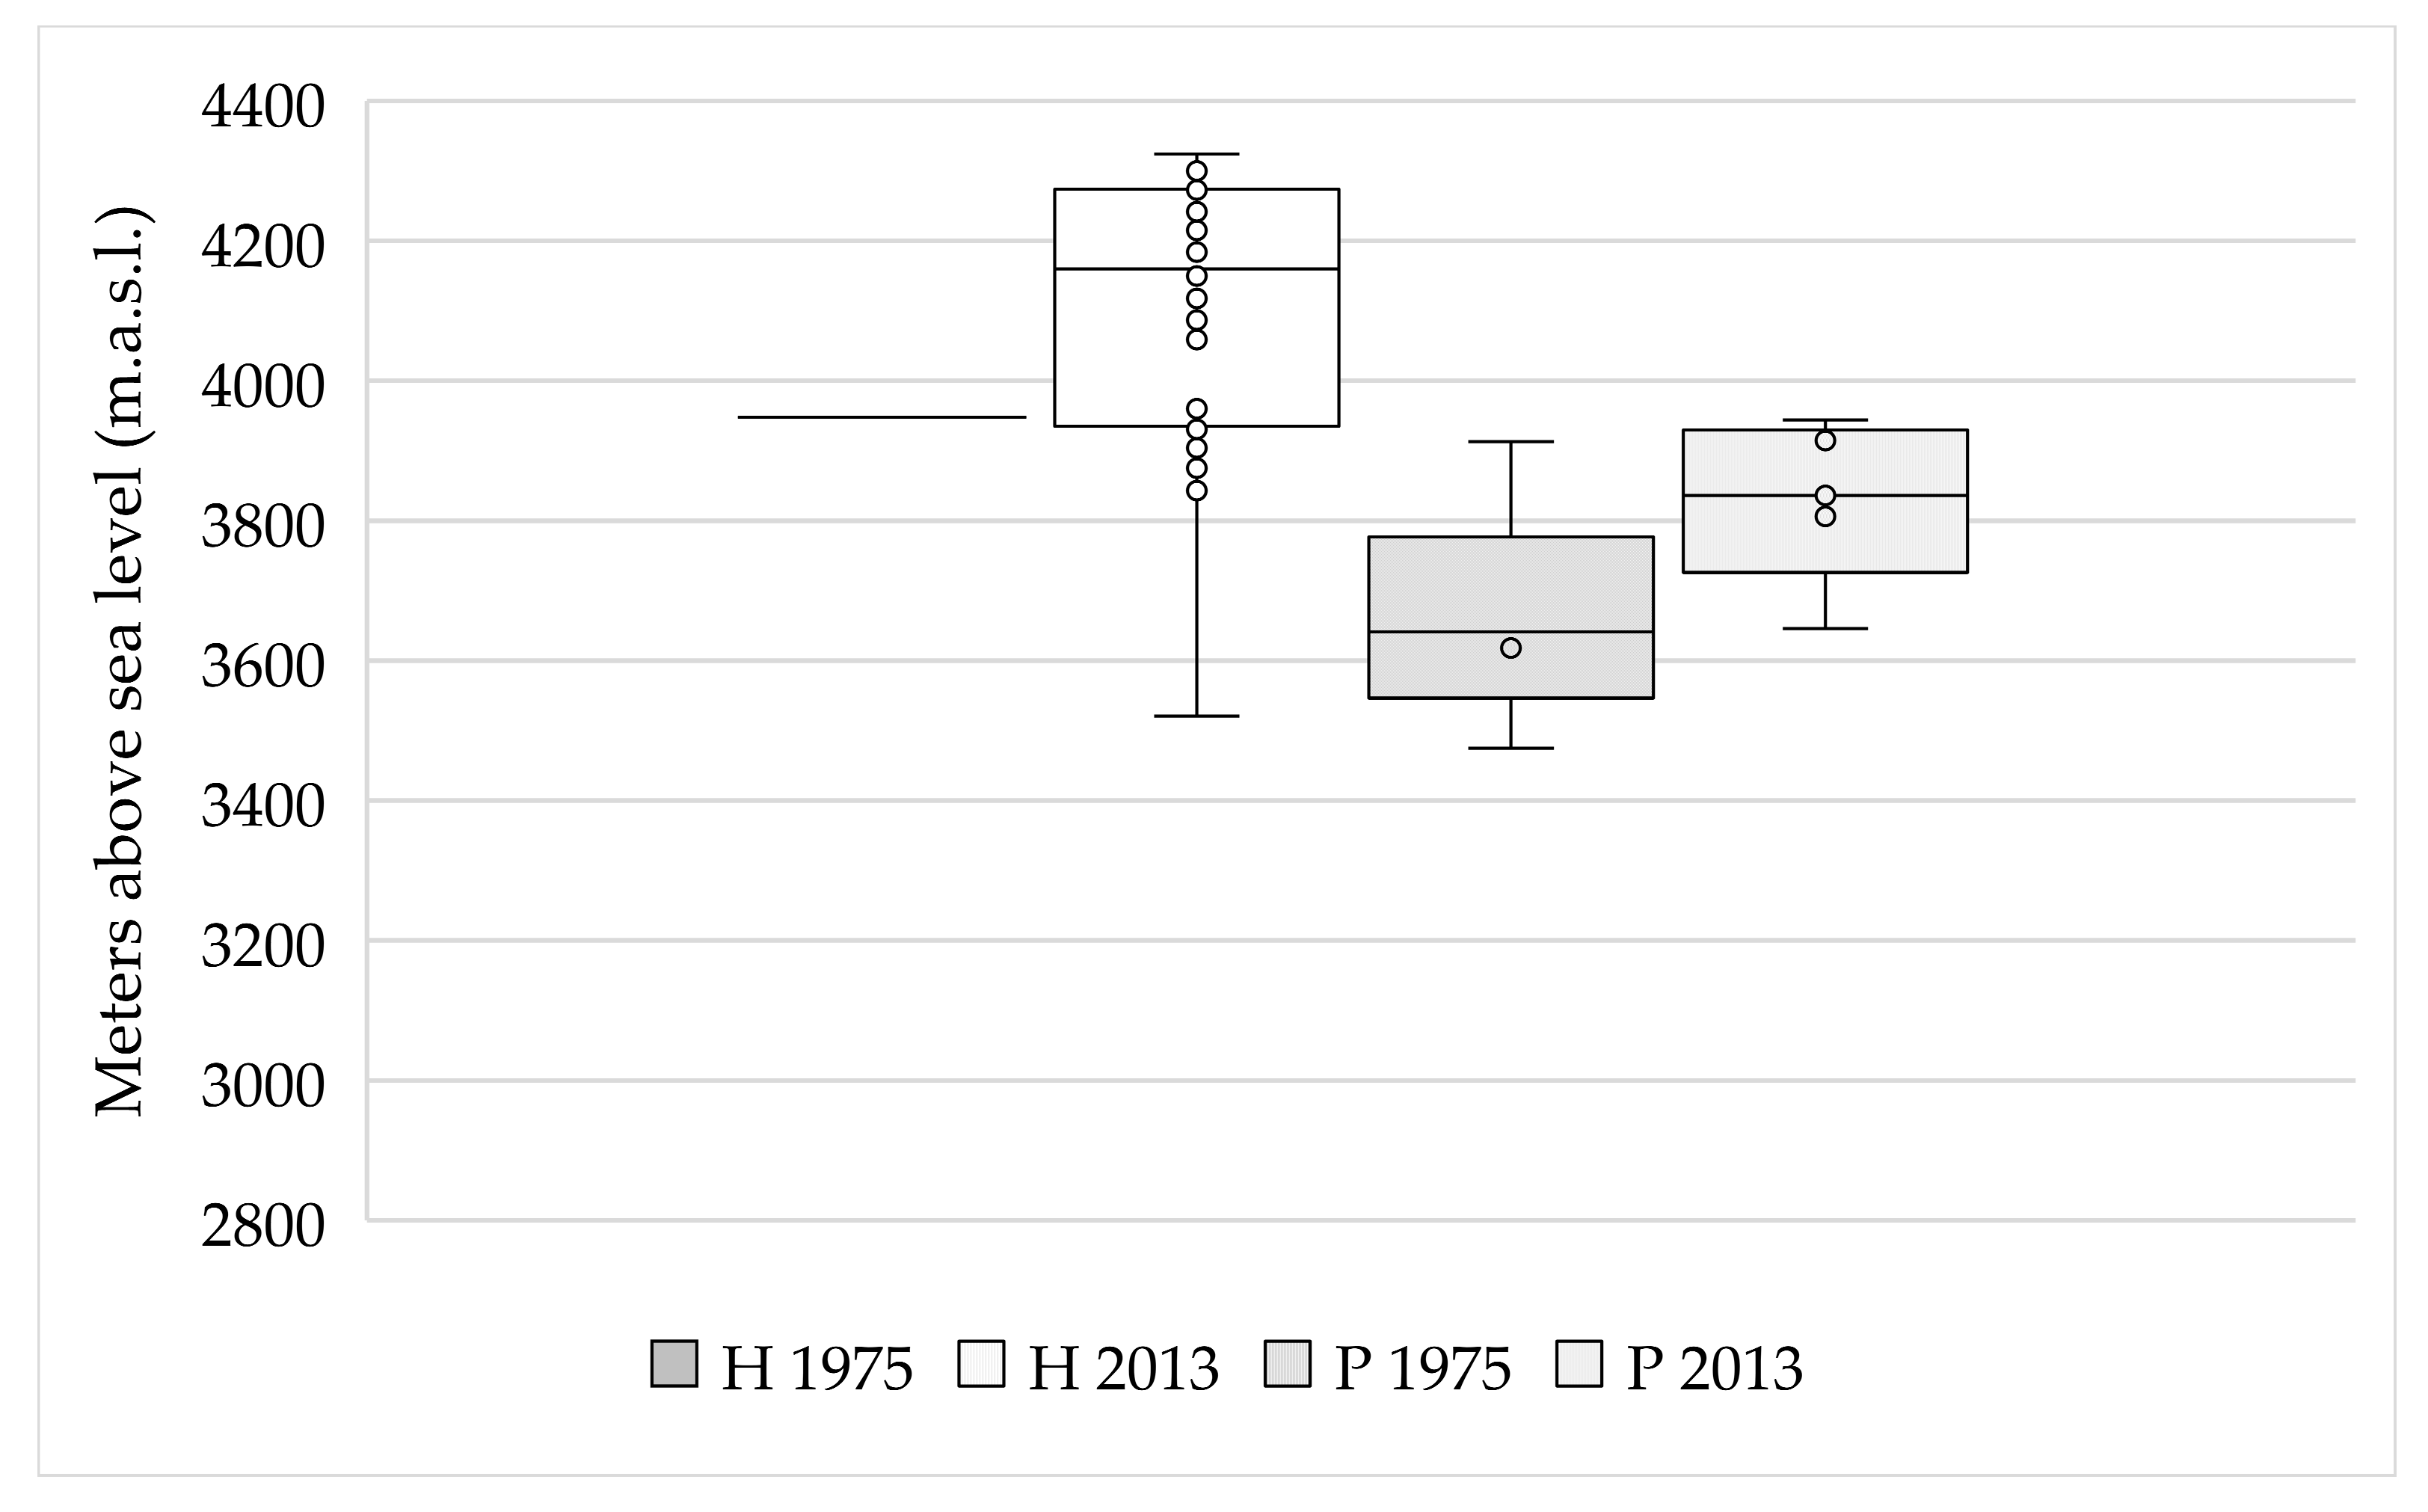
The average altitudinal distribution of potato landraces in the two landscapes examined in this study has shifted upward by 330 m for floury landraces and 102 m for bitter landraces when comparing current ranges with those of passport data from the 1975–1985 gene bank collection (Table 12, Figure 7 and Figure 8). Pasco showed the greatest upward shift of 404 m for floury landraces. For bitter landraces, the upward shift has been less pronounced overall. However, in Huancavelica bitter landraces still showed a shift of 174 m. This contrasts with Pasco, where this cultivar group has, on average, moved upward by 31 m, although these results were obtained from a small number of samples.
Maximum and minimum altitudinal distribution values also showed notable changes. The maximum reported altitude for floury landraces has increased by 475 m in Pasco and 351 m in Huancavelica. For bitter landraces in Huancavelica the shift in maximum altitude has been 376 m. As to minimum altitudes, floury landraces showed the highest increase by 496 m in Huancavelica. In Pasco the minimum altitude recorded for floury landraces has risen by 129 m. The minimum altitude recorded for bitter landraces was surprisingly 427 m lower in 2013 than in 1975–1985 in Huancavelica, but it has shown a 171 m increase in Pasco.

4. Discussion

4.1. Hybrid Agricultural Landscapes and Smallholder Intensification

Our results show that smallholder agricultural land-use systems are spatially and temporally versatile, incorporating adaptations of traditional management practices to facilitate intensification. Such modifications of Andean cropping system components, allowing for the need to accommodate environmental and socio-economic pressures, have also been described by others [2,21,30,31]. Intensification is occurring in its most basic form through shortening of fallow periods, but differently in each agricultural landscape. At a fine-grained level, agricultural land-use patterns reveal the specific dynamics enabling the ongoing cultivation of potato agrobiodiversity in these distinct farming environments. In Pasco, farmers ensure their ongoing production for both market and consumption by shortening the fallow period in their low-altitude fields while simultaneously maintaining long recovery periods in the upper-altitude range where most of the intraspecific diversity is also concentrated. The better household-level availability and access to land compared to Huancavelica enables farmers to manage their resources differentially and sustain commercial production of a few commercial cultivars while conserving diverse landrace portfolios at high altitude. In Huancavelica, on the other hand, the comparatively shorter fallow periods across all fields relate to diminishing land availability in a context of demographic pressure. With twice as many children and one third the total potato cropping area compared to Pasco, the only options that households have in this landscape involve shortened fallows and expanded cultivation at increasingly high altitudes [56,68]. Adaptations become a necessity in contexts where land scarcity, the need for cash income from agriculture, and increased market orientation drive smallholder land-use decisions [27,69].
Hybrid agricultural land-use systems that integrate traditional and modern practices are common as smallholders adjust to changing production conditions and livelihood prospects in different ways [28,70,71]. This is notable in Pasco where, despite market-oriented intensification, two traditional agricultural management components are more strongly maintained compared to the subsistence-oriented agricultural land-use systems of Huancavelica. Firstly, potato tillage in Pasco involved only the chiwa minimal-tillage system. This practice is common to sloping and high-altitude farming environments where the traditional foot plough or chakitaklla is typically used instead of animal or mechanical traction [56,72]. A plausible explanation is erosion prevention on steep slopes under high rainfall conditions. Secondly, 92.1% of Pasco’s potato cropping area belonged to communal sectoral fallowing systems compared to only 33.5% of Huancavelica’s area. Intensification clearly hasn’t led to the disintegration of communal fallows.
Farmers in Pasco resorted to renting fields. This is only possible if land becomes available from households that have either migrated or oriented labor toward off-farm employment. Income generation through non-agricultural activities characterizes rural livelihoods across the Andes [1,8,11,14]. Therefore, commercial agriculture partly drives intensification in Pasco. This is reflected not only in the low fallowing rates for fields where cultivation with bred varieties for sale is a priority but also by the consistent application of external inputs (fertilizers, fungicides) by all households. The use of chemicals can be partially attributed to high levels of late blight pressure. Except for a few bred varieties, most cultivars are highly susceptible to the disease [73,74]. In contrast, in Huancavelica’s subsistence-oriented production systems, fallowing rates were particularly influenced by altitude, and the use of chemicals was very modest.
Huancavelica displays its own form of smallholder intensification in response to change. The traditional management of fields through communally coordinated sectors has to a large extent disintegrated and been replaced by cropping rotations that are directly decided upon at the household level. The disintegration and adaptations of sectoral fallowing systems have been documented throughout the Andes [30,31,45,48,75]. They are often a result of population growth, land scarcity, and the micro-fragmentation of landholdings, but have also been observed where access to irrigation provides smallholders with other crop production options [12,68]. Soil degeneration and socio-cultural factors such as interrupted transmission of knowledge and discontinuity of communal decision-making institutions may also play a role [76,77].

4.2. Conservation of Landrace Diversity Amidst Market Specialization

A major driver of agricultural land-use change relates to economic integration and the consequent requirement for smallholders to specialize [78,79,80]. This tendency has previously been associated with diminished levels of crop varietal diversity [81,82,83]. In this study, we demonstrate that more subsistence-oriented agriculture does not necessarily encapsulate the highest landrace diversity. The commercial potato production in Pasco, which requires the adoption of intensive management practices, does not exclude parallel landrace conservation. These findings contrast with those reported in Ecuador by Skarbø (2014), who found a positive association between subsistence farming, Kichwa ethnicity and language, and the landrace richness of maize (Zea mays), common beans (Phaseolus vulgaris), and potatoes (Solanum spp.). Smallholders in Pasco, mostly mestizo Spanish speakers, are market-oriented producers of ware potato, particularly of bred varieties and commercial floury landraces. These smallholders intended the production of two-thirds of their total fields exclusively for sale, and consistently interacted with traders at the Carhuamayo market. In contrast, in Huancavelica only about one-fifth of fields were dual-purpose—destined to both consumption and sale—with the remainder being exclusively stored for home consumption. Yet, in Pasco, the total landrace diversity observed at the household and landscape levels was higher compared to Huancavelica. Market specialization and the allocation of significant areas to bred varieties does not displace landrace diversity, as Zimmerer (2013) also evidenced in Bolivia, where cash crop intensification and maize (Zea mays) agrobiodiversity were found to co-occur in smallholder farming landscapes.
Conversely, subsistence-oriented production accommodated more bred varieties in Huancavelica than in Pasco. Both as household-level average and as proportion of their collective cultivar diversity, more bred varieties were present in Huancavelica. Although not strictly market-oriented, smallholders in Huancavelica have integrated modern breeds into their portfolios due to their comparative advantage in terms of earlier maturation—which makes food available during the lean period—and ample accessibility in seed networks [57,84]. This occurs even as the average cropping area per household is nearly three times smaller in Huancavelica than in Pasco. Here, predominantly indigenous Quechua-speaking smallholders do not generate excess production for sale but maintain diversified cultivar portfolios with a higher representation of bred varieties and bitter landraces. In terms of areal coverage, there is more land available for diversity in Pasco. While proportionally Pasco’s diversity was grown on a smaller fraction of the household’s total potato area, in absolute terms the area occupied by landraces per household was nearly twice as large compared to Huancavelica. On the other hand, in Pasco more landraces were scarce or very scarce as they occupied a small proportion of the total cultivar portfolio. This can be partially explained by the way farmers allocate land and prioritize labor to generate an income. However, environmental factors likely also play a crucial role.
The source of seed tubers was almost entirely (99.6%) farm-saved in Huancavelica, but in Pasco this was only the case for 52.9% of fields. The extremely high altitudes at which potato cultivation occurs in Huancavelica are favorable for preventing virus infection and assuring seed health [85,86]. Pasco, in contrast, is a high-risk zone for late blight disease and farmers mentioned seed quality as a continual concern. Seed degeneration resulting from cumulative pathogen and pest infestation over successive cropping cycles detrimentally affects yield performance and easily spreads across smallholder Andean networks [87]. Farmers in Pasco partially renew their seed stocks frequently by sourcing from higher-altitude production zones that meet their perceptions of quality for floury landrace production [57,88]. With climate change, pest and disease pressure is likely to increase, warranting continuous monitoring of seed security and the conservation status of landrace diversity in both agricultural landscapes.

4.3. Uneven Contemporary Spatial Distribution of Landrace Diversity

Our findings show that high intraspecific diversity persists in each agricultural landscape and collectively in Peru’s central Andes, especially of floury landraces. Yet this diversity is unequally distributed across smallholder farming landscapes. It is mostly concentrated at extremely high altitudes between 3900 and 4200 m above sea level. The field scattering, overlap between cultivar groups, and use of mixed portfolios between and within fields show remarkable environmental plasticity and organizational ingenuity. It involves a continued use of diversity to adapt to an unpredictable environment and multiple production objectives [39,54,89]. Nonetheless, farmers commonly only prioritize five to seven landraces to meet mostly consumption or market needs. Bred varieties, which are a minor portion of the total varietal diversity (6.1%), cover the widest altitudinal distribution range while most landrace diversity is concentrated in a very narrow altitudinal range. This finding, confirming earlier reports of this kind of altitudinal concentration [30], suggests that diversity is potentially vulnerable with pests and diseases ‘pushing’ landraces upwards to limits where abiotic stress is highest (frost, hail) and land use for cropping competes with livestock. Sustained exposure to global presses (i.e., climate change) and local pulses (i.e., extreme weather events) has been shown to contribute to biodiversity loss and further drive land-use transformations across the world´s complex and bioculturally rich mountain environments [90].
Bitter landraces, which are characterized by relatively low diversity, were assigned only minimal area and were generally absent from farmers’ fields. Their apparent disappearance from the portfolios of most farmers may be the result of decreasing labor availability (needed to process them into chuño), changing consumer behavior, and less predictable frosts (in June) [91,92,93]. Clearly, bitter landraces are at risk of being lost. The conservation dynamics of this special cultivar group warrants closer attention as their genetic potential is key to future breeding strategies to cope with abiotic stressors [40]. Traditional fallowing systems or laymis have been reservoirs of high intraspecific diversity in the central Andes. Yet, landrace diversity is not restricted to fields in fallowing sectors. In Huancavelica, the landrace diversity is currently contained in a landscape matrix of fields under a non-traditional household-level rotation with low-input management. In Pasco, the bulk of farmers’ diversity continues to occur in communally coordinated sectoral fallowing system with discriminatory, intensive management driven by market integration and late blight disease pressure. The above shows that diversity is being maintained as part of dynamic and adaptive management strategies.
Across agricultural landscapes, cultivar groups were not spatially separated but rather overlapped and to a large extent shared the same space. This finding confirms that rationales other than niche adaptation drive farmers’ spatial management of intraspecific diversity [2,89,94]. Potato cultivation in the two landscapes studied has moved upward by an average of 306 m since 1975. The altitudinal shift is most dramatic for floury landraces. For this cultivar group, contemporary maximum and minimum altitudes are 475 and 500 m above that reported 38 years ago according to CIP passport data from collections. The incursion of the potato into higher altitudes has been previously documented and is explained by the compounding effect of environmental and social factors [22,29,56]. Changes in temperature and precipitation patterns, and lower number of and more erratic frosts are affecting agriculture in the central Andes [93,95,96]. Higher incidence of pests and disease is associated with climatic variability and further driving crop cultivation into higher altitudes [3,6,97]. Soil degradation also increasingly affects productivity in smallholder contexts, where population growth is pushing land-use systems beyond their capacity and into the upper limits of where agriculture is possible [20,76]. Potatoes and their upward movement represent the highest cropping globally. Their changing spatial-temporal dynamics requires closer attention to understand the trade-offs and limitations of further altitudinal range expansion.

4.4. Study Limitations

Assessments of agricultural land-use change and agrobiodiversity ideally require systematic comparisons over long periods. Data availability for timeline comparison is a constant limitation. In this study, we used a detailed inventory based on participatory mapping to examine the current situation. Yet, it represents only one season and does not account for inter-seasonal variation. We recorded the application of chemicals per field (yes/no) but did not measure the frequency or amounts of fertilizers and fungicides used. We therefore have no way of providing a fine-grained comparison of this type of intensification within and across agricultural landscapes. Further, we used folk taxonomy and focus group meetings to derive a master list of unique cultivars within and across landscapes. This is an adequate but imperfect way of classifying diversity, since it does not attain the precision provided by morphological and molecular characterization. Lastly, the gene bank passport data from 1975–1985 only allowed for comparisons of altitudinal ranges for a limited number of floury and bitter landraces, excluding bred varieties.

5. Conclusions

We have examined, for the first time and in detail, smallholders´ management of potato agrobiodiversity in two contrasting farming landscapes of Peru´s central Andes. To inform future in situ monitoring and conservation approaches in this center of crop origin, it is critical to access high-resolution agricultural land-use data and gain entrenched insights as to the contemporary spatial-temporal dynamics underpinning agrobiodiversity on farm. We thus pursued and attained three main research goals: (i) Obtaining a fine-grained understanding of agricultural land-use patterns in these recognized hotspots of potato intraspecific diversity; (ii) Systematically documenting the conservation status of the potato´s intraspecific diversity across three distinct cultivar categories in these two sites; (iii) Discerning the modern-day spatial distribution of this diversity along an altitudinal gradient and comparing it with CIP altimeter data from nearly four decades ago.
The spatial-temporal dynamics of potato agrobiodiversity in the highlands of central Peru demonstrates remarkable adaptability in response to modern-day pressures. This is based on smallholder modification of traditional practices. High intraspecific diversity is maintained in these mixed, hybrid agricultural land-use systems. In each of the smallholder farming landscapes, intensification is taking place in different and rather unexpected ways. Whether predominantly market or subsistence-oriented, smallholder households inform their land-use decisions by drawing from the changing dynamics of their agroecological and socioeconomic contexts, increasingly geared toward intensification, i.e., shorter fallowing periods and chemical applications. Importantly, land availability gives smallholder households a comparative advantage by simultaneously enabling potato landrace conservation and market production. When it comes to on-farm agrobiodiversity, attributing the onus of its persistence on smallholders’ fields to market specialization may obscure the role of the other demographic, social, and environmental factors inherent in global change. Driven by population growth and pest and disease pressure, potato cultivation has moved into the upper limits of where agriculture is possible as shown by the comparison of contemporary altitudinal distributions with those of CIP’s gene bank collections nearly four decades ago. Its landrace diversity is now concentrated in a narrow, upward moving altitudinal belt. The plasticity shown by the potato and the adaptability of smallholder cultivation systems do not necessarily confer them resilience into the future. To gauge the on-farm dynamics of the potato in its center of crop origin systematic and long-term monitoring will be crucial. Its in situ conservation warrants the exploration of other options, such as the creation of incentives for smallholders’ diversity to be valued and utilized by society at large. From this standpoint, the active involvement of urban consumers and new institutional stakeholders may be key to the ongoing use and conservation of the potato’s intraspecific diversity.

Supplementary Materials

The following are available online at https://0-www-mdpi-com.brum.beds.ac.uk/2073-445X/8/11/169/s1. Figure S1: Independence analysis (based on chi square statistical testing of Pearson residuals) of the topmost differentiating variables between intermediate and high-altitude fields in the Huancavelica and Pasco landscapes. (A) Production end use, (B) Tillage type, (C) Cultivar combination (NF = Native-floury; NB = Native-bitter; BR = Bred; Mixed = combinations of NF, NB, and BR) show that intermediate-range fields in Huancavelica were associated with production for consumption, chacmeo, and barbecho tillage, and mixed-cultivar groups of floury and bitter landraces compared to fields in Pasco, (D) Fallowing sector association, (E) Production end use, (F) and Fallowing rates show that high-range fields in Huancavelica were not associated with a fallowing sector, production end use was destined to consumption, and fallowing rates were significantly lower compared to their homologues in Pasco. The scale corresponds to Pearson residuals and the color on the scale corresponds to a significantly positive (blue) or significantly negative (red) relationship based on independence analysis at p-value < 0.05.

Author Contributions

Conceptualization, S.D.H., A.A., H.J., S.P., M.S., and R.C.; Methodology, S.D.H., A.A., H.J., S.P., M.S., and R.C.; Formal analysis, A.A., D.D.B., H.J., and F.P.; Investigation, A.A. and R.C.; Data curation, H.J. and F.P.; Writing—original draft preparation, A.A. and S.D.H.; Writing—review and editing, A.A., S.D.H., H.J., and D.D.B.; Supervision, S.D.H. and H.J.; Project administration, A.A., S.P., and R.C.; Funding acquisition, S.D.H.

Funding

This research was funded by the McKnight Foundation’s Collaborative Crop Research Program for the main author to conduct her research in Peru, grant number 09-033. This research was also financed and implemented as part of the CGIAR Research Program on Roots, Tubers, and Bananas (RTB) at the International Potato Center (CIP).

Acknowledgments

The authors thank the smallholder farmers and community authorities of Castillapata, Huachhua, Pumaranra, Bellavista, and Chupaca for collaborating with us and making this research possible. We are grateful to the local teams of field enumerators who supported us during the arduous data collection. We also thank the International Potato Center for facilitating the gene bank collection data that enabled our comparative timeline series analysis.

Conflicts of Interest

The authors declare no conflict of interest. The funders had no role in the design of the study; in the collection, analyses, or interpretation of data; in the writing of the manuscript, or in the decision to publish the results.

References

  1. Oyarzun, P.J.; Borja, R.M.; Sherwood, S.; Parra, V. Making Sense of Agrobiodiversity, Diet, and Intensification of Smallholder Family Farming in the Highland Andes of Ecuador. Ecol. Food Nutr. 2013, 52, 515–541. [Google Scholar] [CrossRef] [PubMed]
  2. Zimmerer, K.S.; Vaca, H.L.R. Fine-Grain Spatial Patterning and Dynamics of Land Use and Agrobiodiversity amid Global Changes in the Bolivian Andes. Reg. Environ. Chang. 2016, 16, 2199–2214. [Google Scholar] [CrossRef]
  3. Kroschel, J.; Sporleder, M.; Tonnang, H.E.Z.; Juarez, H.; Carhuapoma, P.; Gonzales, J.C.; Simon, R. Predicting Climate-Change-Caused Changes in Global Temperature on Potato Tuber Moth Phthorimaea Operculella (Zeller) Distribution and Abundance Using Phenology Modeling and GIS Mapping. Agric. For. Meteorol. 2013, 170, 228–241. [Google Scholar] [CrossRef]
  4. Skarbø, K. The Cooked Is the Kept: Factors Shaping the Maintenance of Agro-Biodiversity in the Andes. Hum. Ecol. 2014, 42, 711–726. [Google Scholar] [CrossRef]
  5. Haller, A. The “Sowing of Concrete”: Peri-Urban Smallholder Perceptions of Rural–Urban Land Change in the Central Peruvian Andes. Land Use Policy 2014, 38, 239–247. [Google Scholar] [CrossRef] [PubMed]
  6. Giraldo, D.; Juarez, H.; Perez, W.; Trebejo, I.; Yzarra, W.; Forbes, G. Severity of the Potato Late Blight (Phytophthora Infestans) in Agricultural Areas of Peru Associated with Climate Change. Rev. Peru. Geo Atmos. 2010, 2, 56–67. [Google Scholar]
  7. Quiroz, R.; Ramírez, D.A.; Kroschel, J.; Andrade-Piedra, J.; Barreda, C.; Condori, B.; Mares, V.; Monneveux, P.; Perez, W. Impact of Climate Change on the Potato Crop and Biodiversity in Its Center of Origin. Open Agric. 2018, 3, 273–283. [Google Scholar] [CrossRef]
  8. Hellin, J.; Higman, S. Crop Diversity and Livelihood Security in the Andes. Dev. Pract. 2005, 15, 165–174. [Google Scholar] [CrossRef]
  9. Aragona, F.B.; Orr, B. Agricultural Intensification, Monocultures, and Economic Failure: The Case of Onion Production in the Tipajara Watershed on the Eastern Slope of the Bolivian Andes. J. Sustain. Agric. 2011, 35, 467–492. [Google Scholar] [CrossRef]
  10. Rocha, J.M. Agricultural Intensification, Market Participation, and Household Demography in the Peruvian Andes. Hum. Ecol. 2011, 39, 555–568. [Google Scholar] [CrossRef]
  11. Caulfield, M.; Bouniol, J.; Fonte, S.J.; Kessler, A. How Rural Out-Migrations Drive Changes to Farm and Land Management: A Case Study from the Rural Andes. Land Use Policy 2019, 81, 594–603. [Google Scholar] [CrossRef]
  12. Wiegers, E.S.; Hijmans, R.J.; Herve, D.; Fresco, L.O. Land Use Intensification and Disintensification in the Upper Cañete Valley, Peru. Hum. Ecol. 1999, 27, 319–339. [Google Scholar] [CrossRef]
  13. Gray, C.L. Rural Out-Migration and Smallholder Agriculture in the Southern Ecuadorian Andes. Popul. Environ. 2009, 30, 193–217. [Google Scholar] [CrossRef]
  14. Gray, C.L.; Bilsborrow, R.E. Consequences of Out-Migration for Land Use in Rural Ecuador. Land Use Policy 2014, 36, 182–191. [Google Scholar] [CrossRef] [PubMed]
  15. Bussink, C.B.; Hijmans, R.J. Land-Use Change in the Cajamarca Catchment, Peru, 1975–1996. In Scientist and Farmer: Partners in Research for the 21st Century; Program Report, 1999–2000; International Potato Center: Lima, Peru, 2001; pp. 421–428. [Google Scholar]
  16. Rolando, J.L.; Dubeux, J.C.B.; Ramirez, D.A.; Ruiz-Moreno, M.; Victor Mares, C.T.; Sollenberger, L.E.; Quiroz, R. Land Use Effects on Soil Fertility and Nutrient Cycling in the Peruvian High-Andean Puna Grasslands. Soil Sci. Soc. Am. J. 2018, 82, 463–474. [Google Scholar] [CrossRef]
  17. Postigo, J.C.; Young, K.R.; Crews, K.A. Change and Continuity in a Pastoralist Community in the High Peruvian Andes. Hum. Ecol. 2008, 36, 535–551. [Google Scholar] [CrossRef]
  18. Tovar, C.; Seijmonsbergen, A.C.; Duivenvoorden, J.F. Monitoring Land Use and Land Cover Change in Mountain Regions: An Example in the Jalca Grasslands of the Peruvian Andes. Landsc. Urban Plan. 2013, 112, 40–49. [Google Scholar] [CrossRef]
  19. Zimmerer, K.S. The Compatibility of Agricultural Intensification in a Global Hotspot of Smallholder Agrobiodiversity (Bolivia). Proc. Natl. Acad. Sci. USA 2013, 110, 2769–2774. [Google Scholar] [CrossRef] [PubMed]
  20. Skarbø, K.; Vandermolen, K. Maize Migration: Key Crop Expands to Higher Altitudes Under Climate Change in the Andes. Clim. Dev. 2015, 8, 245–255. [Google Scholar] [CrossRef]
  21. Taboada, C.; Garcia, M.; Gilles, J.; Pozo, O.; Yucra, E.; Rojas, K. Can Warmer Be Better? Changing Production Systems in Three Andean Ecosystems in the Face of Environmental Change. J. Arid Environ. 2017, 147, 144–154. [Google Scholar] [CrossRef]
  22. Rolando, J.L.; Turin, C.; Ramírez, D.A.; Mares, V.; Monerris, J.; Quiroz, R. Key Ecosystem Services and Ecological Intensification of Agriculture in the Tropical High-Andean Puna as Affected by Land-Use and Climate Changes. Agric. Ecosyst. Environ. 2017, 236, 221–233. [Google Scholar] [CrossRef]
  23. Baldinelli, G.M. Agrobiodiversity Conservation as a Coping Strategy: Adapting to Climate Change in the Northern Highlands of Bolivia. Consilience 2014, 11, 153–166. [Google Scholar]
  24. Zimmerer, K.S.; De Haan, S. Agrobiodiversity and a Sustainable Food Future. Nat. Plants 2017, 3, 1–3. [Google Scholar] [CrossRef] [PubMed]
  25. Jakovac, C.C.; Dutrieux, L.P.; Siti, L.; Peña-Claros, M.; Bongers, F. Spatial and Temporal Dynamics of Shifting Cultivation in the Middle-Amazonas River: Expansion and Intensification. PLoS ONE 2017, 12, e0181092. [Google Scholar] [CrossRef] [PubMed]
  26. Mensah-Bonsu, A.; Sarpong, D.B.; Al-Hassan, R.; Egyir, I.S.; Asuming-Brempong, S.; Egyir, I.S.; Kuwornu, J.K.M.; Osei-Asare, Y.B. Intensity of and Factors Affecting Land and Water Management Practices among Smallholder Maize Farmers in Ghana. Afr. J. Agric. Resour. Econ. 2017, 12, 142–157. [Google Scholar]
  27. Junqueira, A.B.; Almekinders, C.J.M.; Stomph, T.J.; Clement, C.R.; Struik, P.C. The Role of Amazonian Anthropogenic Soils in Shifting Cultivation: Learning from Farmers’ Rationales. Ecol. Soc. 2016, 21, 12. [Google Scholar] [CrossRef]
  28. Roy Chowdhury, R. Differentiation and Concordance in Smallholder Land Use Strategies in Southern Mexico’s Conservation Frontier. Proc. Natl. Acad. Sci. USA 2010, 107, 5780–5785. [Google Scholar] [CrossRef] [PubMed]
  29. Perez, C.; Nicklin, C.; Dangles, O.; Vanek, S.; Sherwood, S.; Halloy, S.; Garrett, K.A.; Forbes, G. Climate Change in the High Andes: Implications and Adaptation Strategies for Small-Scale Farmers. Int. J. Environ. Cult. Econ. Soc. Sustain. 2010, 6, 1–21. [Google Scholar] [CrossRef]
  30. De Haan, S.; Juárez, H. Land Use and Potato Genetic Resources in Huancavelica, Central Peru. J. Land Use Sci. 2010, 5, 179–195. [Google Scholar] [CrossRef]
  31. Parsa, S. Native Herbivore Becomes Key Pest After Dismantlement of a Traditional Farming System. Am. Entomol. 2010, 56, 242–251. [Google Scholar] [CrossRef] [Green Version]
  32. Lozada, C. Overgrazing and Range Degradation in the Peruvian Andes. Rangelands 1991, 13, 64–67. [Google Scholar]
  33. Chiriboga Vega, M. Pequeñas Economías: Reflexiones Sobre La Agricultura Familiar Campesina; Food and Agriculture Organization (FAO): Quito, Ecuador, 2015. [Google Scholar]
  34. Maletta, H. La Pequeña Agricultura Familiar En El Perú. Una Tipología Microrregionalizada; Organización de las Naciones Unidas para la Alimentación y la Agricultura (FAO): Lima, Peru, 2017. [Google Scholar]
  35. Brush, S.B.; Taylor, J.E.; Bellon, M.R. Technology Adoption and Biological Diversity in Andean Potato Agriculture. J. Dev. Econ. 1992, 39, 365–387. [Google Scholar] [CrossRef]
  36. Mayer, E.; Glave, M. “Alguito Para Ganar” (A Little Something to Earn): Profits and Losses in Peasant Economies. Am. Ethnol. 1999, 26, 344–369. [Google Scholar] [CrossRef]
  37. Young, K.R. Andean Land Use and Biodiversity: Humanized Landscapes in a Time of Change. Ann. Missouri Bot. Gard. 2009, 96, 492–507. [Google Scholar] [CrossRef]
  38. Oswald, A.; De Haan, S.; Sanchez, J.; Ccanto, R. The Complexity of Simple Tillage Systems. J. Agric. Sci. 2009, 147, 399–410. [Google Scholar] [CrossRef]
  39. Goland, C. Field Scattering as Agricultural Risk Management: A Case Study from Cuyo Cuyo, Department of Puno, Peru. Mt. Res. Dev. 1993, 13, 317–338. [Google Scholar] [CrossRef]
  40. Condori, B.; Hijmans, R.J.; Ledent, J.F.; Quiroz, R.; Liu, J.H. Managing Potato Biodiversity to Cope with Frost Risk in the High Andes: A Modeling Perspective. PLoS ONE 2014, 9, e81510. [Google Scholar] [CrossRef] [PubMed]
  41. Coca-Morante, M.; Tolín-Tordoya, I. The Potato Late Blight Caused by Phytophthora Infestans Mont de Bary as Selection Factor of Phurejas Potatoes (Solanum Phureja Juz et Buk) in Endemic Areas of the Bolivian Andes. Am. J. Plant. Sci. 2013, 4, 53–58. [Google Scholar] [CrossRef]
  42. Poveda, K.; Martínez, E.; Kersch-Becker, M.F.; Bonilla, M.A.; Tscharntke, T. Landscape Simplification and Altitude Affect Biodiversity, Herbivory and Andean Potato Yield. J. Appl. Ecol. 2012, 49, 513–522. [Google Scholar] [CrossRef]
  43. Orlove, B.S.; Godoy, R. Sectoral Fallowing Systems in the Central Andes. J. Ethnobiol. 1986, 6, 169–204. [Google Scholar]
  44. Kraft, K.E. Community Land Management in the Andean Context: The Sectoral Fallowing System. Master’s Thesis, University of California Davis, Davis, CA, USA, 1988. [Google Scholar]
  45. Mayer, E. Land Use in the Andes: Ecology and Agriculture in the Mantaro Valley of Peru, with Special Reference to Potatoes; International Potato Center (CIP)/Social Science Unit: Lima, Perú, 1979. [Google Scholar]
  46. Pestalozzi, H. Sectoral Fallow Systems and the Management of Soil Fertility: The Rationality of Indigenous Knowledge in the High Andes of Bolivia. Mt. Res. Dev. 2000, 20, 64–71. [Google Scholar] [CrossRef] [Green Version]
  47. Godoy, R. The Evolution of Common-Field Agriculture in the Andes: A Hypothesis. Comp. Stud. Soc. Hist. 1991, 33, 395–414. [Google Scholar] [CrossRef]
  48. Zimmerer, K.S. Common Field Agriculture as a Cultural Landscape of Latin America: Development and History in the Geographical Customs of Resource Use. J. Cult. Geogr. 2002, 19, 37–63. [Google Scholar] [CrossRef]
  49. Ovchinnikova, A.; Krylova, E.; Gavrilenko, T.; Smekalova, T.; Zhuk, M.; Knapp, S.; Spooner, D.M. Taxonomy of Cultivated Potatoes (Solanum Section Petota: Solanaceae). Bot. J. Linn. Soc. 2011, 165, 107–155. [Google Scholar] [CrossRef]
  50. Spooner, D.M.; Nuñez, J.; Trujillo, G.; del Rosario Herrera, M.; Guzman, F.; Ghislain, M. Extensive Simple Sequence Repeat Genotyping of Potato Landraces Supports a Major Reevaluation of Their Gene Pool Structure and Classification. Proc. Natl. Acad. Sci. USA 2007, 104, 19398–19403. [Google Scholar] [CrossRef] [PubMed]
  51. Brush, S.B. Farmers’ Bounty: Locating Crop. Diversity in the Contemporary World; Yale University Press: New Haven, CT, USA; London, UK, 2004. [Google Scholar]
  52. Zimmerer, K.S.; Douches, D.S. Geographical Approaches to Crop Conservation: The Partitioning of Genetic Diversity in Andean Potatoes. Econ. Bot. 1991, 45, 176–189. [Google Scholar] [CrossRef]
  53. De Haan, S.; Rodriguez, F. Potato Origin and Production. In Advances in Potato Chemistry and Technology; Singh, J., Kaur, L., Eds.; Elsevier Inc.: London, UK, 2016; pp. 1–32. [Google Scholar] [CrossRef]
  54. De Haan, S.; Núñez, J.; Bonierbale, M.; Ghislain, M. Multilevel Agrobiodiversity and Conservation of Andean Potatoes in Central Peru: Species, Morphological, Genetic, and Spatial Diversity. Mt. Res. Dev. 2010, 30, 222–231. [Google Scholar] [CrossRef]
  55. Zimmerer, K.S. Changing Fortunes: Biodiversity and Peasant Livelihood in the Peruvian Andes; University of California Press: Berkeley, CA, USA; Los Angeles, CA, USA, 1996. [Google Scholar]
  56. De Haan, S. Potato Diversity at Height: Multiple Dimensions of Farmer-Driven in-Situ Conservation in the Andes. Ph.D. Thesis, Wageningen University, Wageningen, The Netherlands, 2009. [Google Scholar]
  57. Arce, A.; de Haan, S.; Burra, D.D.; Ccanto, R. Unearthing Unevenness of Potato Seed Networks in the High Andes: A Comparison of Distinct Cultivar Groups and Farmer Types Following Seasons with and Without Acute Stress. Front. Sustain. Food Syst. 2018, 2, 1–22. [Google Scholar] [CrossRef]
  58. De Haan, S.; Burgos, G.; Arcos, J.; Ccanto, R.; Scurrah, M.; Salas, E.; Bonierbale, M. Traditional Processing of Black and White Chuño in the Peruvian Andes: Regional Variants and Effect on the Mineral Content of Native Potato Cultivars. Econ. Bot. 2010, 64, 217–234. [Google Scholar] [CrossRef]
  59. De Haan, S.; Polreich, S.; Rodriguez, F.; Juarez, H.; Plasencia, F.; Ccanto, R.; Alvarez, C.; Otondo, A.; Sainz, H.; Venegas, C.; et al. A Long-Term Systematic Monitoring Framework for On-Farm Conserved Potato Landrace Diversity. In Enhancing Crop Genepool Use: Capturing Wild Relative and Landrace Diversity for Crop Improvement; Maxted, N., Dulloo, M.E., Ford-Lloyd, B.V., Eds.; CABI International: Boston, MA, USA, 2016; pp. 289–296. [Google Scholar] [CrossRef]
  60. Zevallos, E.L.; Villaorduña, L.F.; Castillo, H.J.; Cristóbal, M.A.; Álvarez, F.J.; Gonzales, R.A.; Rojas, A. Colección, Evaluación y Conservación de Papas Nativas de La Región Pasco. Rev. Praxis 2011, 10. [Google Scholar]
  61. Juarez, H.; Plasencia, F.; Polreich, S.; Scurrah, M.; Ccanto, R.; De Haan, S. Dataset for: Participatory Mapping for Long-Term Monitoring and Red Listing of Cultivated Potato Populations in Huancavelica, Peru. V1; International Potato Center: Lima, Peru, 2017. [Google Scholar] [CrossRef]
  62. Juarez, H.; Plasencia, F.; Polreich, S.; Arce, A.; De Haan, S. Dataset for: Participatory Mapping for Long-Term Monitoring and Red Listing of Cultivated Potato Populations in Pasco, Peru. V1; International Potato Center: Lima, Peru, 2017. [Google Scholar] [CrossRef]
  63. R Core Team. R: A Language and Environment for Statistical Computing; R Foundation for Statistical Computing: Vienna, Austria, 2017. [Google Scholar]
  64. Ritschard, G.; Bürgin, R.; Studer, M. Exploratory Mining of Life Event Histories. In Contemporary Issues in Exploratory Data Mining in the Behavioral Sciences; McArdle, J.J., Ritschard, G., Eds.; Routledge Taylor & Francis Group: New York, NY, USA, 2014; pp. 221–253. [Google Scholar]
  65. Kuhn, M. caret: Classification and Regression Training. Available online: https://cran.r-project.org/package=caret (accessed on 21 January 2018).
  66. Wickham, H. Ggplot2. Wiley Interdiscip. Rev. Comput. Stat. 2011, 3, 180–185. [Google Scholar] [CrossRef]
  67. Meyer, D.; Zeileis, A.; Hornik, K.; Gerber, F.; Friendly, M. vcd: Visualizing Categorical Data. Available online: https://cran.r-project.org/package=vcd (accessed on 21 January 2018).
  68. Scurrah, M.; de Haan, S.; Olivera, E.; Ccanto, R.; Creed, H.; Carrasco, M.; Veres, E.; Barahona, C. Ricos En Agrobiodiversidad Pero Pobres En Nutrición: Desafíos de La Mejora de La Seguridad Alimentaria En Comunidades de Chopcca, Huancavelica. In Perú: El Problema Agrario en Debate. SEPIA XIV; Asensio, R.H., Eguren, F., Ruiz, M., Eds.; Seminario Permanente de Investigación Agraria (SEPIA): Lima, Peru, 2012; pp. 362–407. [Google Scholar]
  69. Oduol, J.B.A.; Tsuji, M. The Effect of Farm Size on Agricultural Intensification and Resource Allocation Decisions: Evidence from Smallholder Farms in Embu District, Kenya. J. Fac. Agric. Kyushu Univ. 2005, 50, 727–742. [Google Scholar]
  70. Radel, C.; Schmook, B.; Chowdhury, R.R. Agricultural Livelihood Transition in the Southern Yucatán Region: Diverging Paths and Their Accompanying Land Changes. Reg. Environ. Chang. 2010, 10, 205–218. [Google Scholar] [CrossRef]
  71. Zimmerer, K.S.; Carney, J.A.; Vanek, S.J. Sustainable Smallholder Intensification in Global Change? Pivotal Spatial Interactions, Gendered Livelihoods, and Agrobiodiversity. Curr. Opin. Environ. Sustain. 2015, 14, 49–60. [Google Scholar] [CrossRef]
  72. Gade, D.W.; Rios, R. Chaquitaclla—The Native Footplough and Its Persistence in Central Andean Agriculture. Tools Tillage 1972, 3, 3–15. [Google Scholar]
  73. Pérez, W.; Ñahui, M.; Ellis, D.; Forbes, G.A. Wide Phenotypic Diversity for Resistance to Phytophthora Infestans Found in Potato Landraces from Peru. Plant Dis. 2014, 98, 1530–1533. [Google Scholar] [CrossRef] [PubMed]
  74. Garrett, K.A.; Nelson, R.J.; Mundt, C.C.; Chacón, G.; Jaramillo, R.E.; Forbes, G.A. The Effects of Host Diversity and Other Management Components on Epidemics of Potato Late Blight in the Humid Highland Tropics. Phytopathology 2001, 91, 993–1000. [Google Scholar] [CrossRef] [PubMed] [Green Version]
  75. Parsa, S.; Ccanto, R.; Rosenheim, J.A. Resource Concentration Dilutes a Key Pest in Indigenous Potato Agriculture. Ecol. Appl. 2011, 21, 539–546. [Google Scholar] [CrossRef] [PubMed]
  76. Fonte, S.J.; Vanek, S.J.; Oyarzun, P.; Parsa, S.; Quintero, D.C.; Rao, I.M.; Lavelle, P. Pathways to Agroecological Intensification of Soil Fertility Management by Smallholder Farmers in the Andean Highlands. In Advances in Agronomy; Sparks, D.L., Ed.; Elsevier Inc. Academic Press: Burlington, UK, 2012; Volume 116, pp. 125–184. [Google Scholar] [CrossRef]
  77. Gilles, J.L.; Thomas, J.L.; Valdivia, C.; Yucra, E.S. Laggards or Leaders: Conservers of Traditional Agricultural Knowledge in Bolivia. Rural Sociol. 2013, 78, 51–74. [Google Scholar] [CrossRef] [Green Version]
  78. Fu, Y.; Brookfield, H.; Guo, H.; Chen, J.; Chen, A.; Cui, J. Smallholder Rubber Plantation Expansion and Its Impact on Local Livelihoods, Land Use and Agrobiodiversity, a Case Study from Daka, Xishuangbanna, Southwestern China. Int. J. Sustain. Dev. World Ecol. 2009, 16, 22–29. [Google Scholar] [CrossRef]
  79. Hettig, E. Agricultural Transformation and Land-Use Change. Evidence on Causes and Impacts from Indonesia. Ph.D. Thesis, Georg-August Universitat Gottingen, Gottingen, Germany, 2017. [Google Scholar]
  80. Wickramasinghe, U. Production Specialization and Market Participation of Smallholder Agricultural Households in Developing Countries. In Sustainable Economic Development: Resources, Environment, and Institutions; Balisacan, A.M., Chakravorty, U., Ravago, M.-L.V., Eds.; Academic Press: Cambridge, MA, USA, 2015; pp. 349–367. [Google Scholar] [CrossRef]
  81. Brush, S.B. Ethnoecology, Biodiversity, and Modernization in Andean Potato Agriculture. J. Ethnobiol. 1992, 12, 161–185. [Google Scholar]
  82. Van Dusen, M.E.; Taylor, J.E. Missing Markets and Crop Diversity: Evidence from Mexico. Environ. Dev. Econ. 2005, 10, 513–531. [Google Scholar] [CrossRef]
  83. Rana, R.B.; Garforth, C.; Sthapit, B.; Jarvis, D. Influence of Socio-Economic and Cultural Factors in Rice Varietal Diversity Management on-Farm in Nepal. Agric. Human Values 2007, 24, 461–472. [Google Scholar] [CrossRef]
  84. De Haan, S.; Burgos, G.; Liria, R.; Rodriguez, F.; Creed-Kanashiro, H.M.; Bonierbale, M. The Nutritional Contribution of Potato Varietal Diversity in Andean Food Systems: A Case Study. Am. J. Potato Res. 2019, 96, 151–163. [Google Scholar] [CrossRef]
  85. Bertschinger, L. Modelling of Potato Virus Pathosystems by Means of Quantitative Epidemiology: An. Exemplary Case Based on Virus Degeneration Studies in Peru. Ph.D. Thesis, Swiss Federal Institute of Technology, Zurich, Switzerland, 1992. [Google Scholar] [CrossRef]
  86. Thomas-Sharma, S.; Abdurahman, A.; Ali, S.; Andrade-Piedra, J.L.; Bao, S.; Charkowski, A.O.; Crook, D.; Kadian, M.; Kromann, P.; Struik, P.C.; et al. Seed Degeneration in Potato: The Need for an Integrated Seed Health Strategy to Mitigate the Problem in Developing Countries. Plant Pathol. 2015, 65, 3–16. [Google Scholar] [CrossRef]
  87. Buddenhagen, C.E.; Hernandez Nopsa, J.F.; Andersen, K.F.; Andrade-Piedra, J.; Forbes, G.A.; Kromann, P.; Thomas-Sharma, S.; Useche, P.; Garrett, K.A. Epidemic Network Analysis for Mitigation of Invasive Pathogens in Seed Systems: Potato in Ecuador. Phytopathology 2017, 107, 1209–1218. [Google Scholar] [CrossRef] [PubMed] [Green Version]
  88. Urrea-Hernandez, C.; Almekinders, C.J.M.; van Dam, Y.K. Understanding Perceptions of Potato Seed Quality among Small-Scale Farmers in Peruvian Highlands. NJAS Wageningen J. Life Sci. 2016, 76, 21–28. [Google Scholar] [CrossRef]
  89. Zimmerer, K.S. Overlapping Patchworks of Mountain Agriculture in Peru and Bolivia: Toward a Regional-Global Landscape Model. Hum. Ecol. 1999, 27, 135–165. [Google Scholar] [CrossRef]
  90. Klein, J.A.; Tucker, C.M.; Nolin, A.W.; Hopping, K.A.; Reid, R.S.; Steger, C.; Grêt-Regamey, A.; Lavorel, S.; Müller, B.; Yeh, E.T.; et al. Catalyzing Transformations to Sustainability in the World’s Mountains. Earth’s Future 2019, 7, 547–557. [Google Scholar] [CrossRef]
  91. De Haan, S.; Burgos, G.; Liria, R.; Bonierbale, M.; Thiele, G. The Role of Biodiverse Potatoes in the Human Diet in Central Peru: Nutritional Composition, Dietary Intake and Cultural Connotations. In Potato Diversity at Height: Multiple Dimensions of Farmer-Driven In-Situ Conservation in the Andes; Wageningen University: Wageningen, The Netherlands, 2009; pp. 161–182. [Google Scholar]
  92. Burgos, G.; De Haan, S.; Salas, E.; Bonierbale, M. Protein, Iron, Zinc and Calcium Concentrations of Potatoes Following Traditional Processing as “chuño”. J. Food Compos. Anal. 2009, 22, 617–619. [Google Scholar] [CrossRef]
  93. Silva, Y.; Takahashi, K.; Cruz, N.; Trasmonte, G.; Mosquera, K.; Nickl, E.; Chavez, R.; Segura, B.; Lagos, P. Variability and Climate Change in the Mantaro River Basin, Central Peruvian Andes. In Proceedings of the 8th ICSHMO, Foz do Iguaçu, Brazil, 24–28 April 2006; pp. 407–419. [Google Scholar]
  94. Zimmerer, K.S. The Ecogeography of Andean Potatoes. Versatility in Farm Regions and Fields Can Aid Sustainable Development. Bioscience 1998, 48, 445–454. [Google Scholar] [CrossRef]
  95. Instituto Geofísico del Perú. Vulnerabilidad Actual y Futura Ante El Cambio Climático y Medidas de Adaptación En La Cuenca Del Río Mantaro; CONAM—Consejo Nacional del Ambiente, Ed.; Fondo Editorial del CONAM: Lima, Peru, 2005.
  96. Martínez, A.G.; Núñez, E.; Silva, Y.; Takahashi, K.; Trasmonte, G.; Mosquera, K.; Lagos, P. Vulnerability and Adaptation to Climate Change in the Peruvian Central Andes: Results of a Pilot Study. In Proceedings of the 8th ICSHMO, Foz do Iguaçu, Brazil, 24–28 April 2006; pp. 297–305. [Google Scholar]
  97. Dangles, O.; Carpio, C.; Barragan, A.R.; Zeddam, J.-L.; Silvain, J.-F. Temperature as a Key Driver of Ecological Sorting among Invasive Pest Species in the Tropical Andes. Ecol. Appl. 2008, 18, 1795–1809. [Google Scholar] [CrossRef] [PubMed]
Figure 1. Study sites in Peru’s central Andes.
Land 08 00169 g001
Figure 2. (a) Spatial distribution of total unique cultivars sampled based on their relative cultivar frequency (RCF) index values (RCF < 0.05 = very scarce, RCF < 0.10 = scarce, RCF < 0.25 = uncommon, RCF < 1.00 = common, 188 RCF > 1.00 = abundant) in the community of Bellavista, Pasco; (b) Spatial distribution of total unique cultivars sampled based on their relative cultivar frequency (RCF) index values (RCF < 0.05 = very scarce, RCF < 0.10 = scarce, RCF < 0.25 = uncommon, RCF < 1.00 = common, 188 RCF > 1.00 = abundant) in the community of Huachhua, Huancavelica.
Land 08 00169 g002
Figure 3. Total potato cropping area by cultivar group (bred, floury, bitter) and landscape (Huancavelica = H, Pasco = P) across the altitudinal range from 3000 to 4400 m.a.s.l.
Land 08 00169 g003
Figure 4. Significance of relationship between fallowing rate and altitude in the (a) Huancavelica and (b) Pasco landscapes.
Land 08 00169 g004
Figure 5. Pattern analysis of cropping sequences for intermediate and high-range altitude fields in each landscape, illustrating higher occurrence of potato rotations with other crop species (i.e., cereals) in Huancavelica. In the legend, NI refers to No Information.
Land 08 00169 g005
Figure 6. Farmer management associated variables listed in order of significance in differentiating (a), intermediate, and (b) high-altitude fields between landscapes.
Land 08 00169 g006
Figure 7. Altitudinal distribution of floury landraces (1975–2013) in m.a.s.l. (H = Huancavelica, P = Pasco).
Land 08 00169 g007
Figure 8. Altitudinal distribution of bitter landraces (1975–2013) in m.a.s.l. (H = Huancavelica, P = Pasco).
Land 08 00169 g008
Table 1. Study sites in Peru’s central Andes.
SiteSite LocationDistrictsCommunitiesNumber of Total Households Number of Sampled Households
1Huancavelica region, central AndesYauli, PaucaráCastillapata, Huachhua, Pumaranra750–800176
2Pasco region, central AndesPaucartamboBellavista, Chupaca550–600147
Estimates derived in consultation with community authorities.
Table 2. Parameters examined and statistical procedures sustaining analyses.
Feature ExaminedVariables and Levels of AnalysisStatistical Procedure(s)
Number of potato cultivarsCultivar group , field, household, landscapeDescriptive (Average, Maximum, Minimum, Standard Deviation)
Number of fieldsCultivar group , household, landscapeDescriptive (Average, Maximum, Minimum, Standard Deviation)
Potato cropping areasCultivar group , altitudinal distribution range , landscapeDescriptive (Average, Maximum, Minimum, Standard Deviation)
Field fallowing ratesCultivar group , landscapeNumber of unplowed (fallow) years divided by total number of years included in the cropping cycle
Altitudinal distribution change 1975–2013Floury and bitter landracesDescriptive (Average, Maximum, Minimum, Standard Deviation)
Sectoral and non-sectoral fallowing fieldsNumber of cultivars, field size, altitude, landscapeMedian values. Two-sample unpaired Wilcoxon tests. Significance determined at p < 0.001 level
Field management practices‘Fixed’ altitudinal range ᵃ, landscapeRegression and statistical learning approaches compared, and best-performing model was used to identify management characteristics that significantly differentiated fields across landscapes *
Household-level characteristicsAge and sex of household head, number of children and adults in household, total number of potato fields for household, off-farm income (yes/no), total number of bred varieties, floury landraces and bitter landraces across all fields belonging to the household, household area under bred, floury, and bitter cultivationDescriptive (Average, Maximum, Minimum, Standard Deviation).
Logistic regression with landscapes serving as the outcome variable. Stepwise regression (forward and backward) was employed, and the resulting model was selected based on Akaike information criterion (AIC) and likelihood ratio test (LRT) criteria
Field-level cropping history and land-use patterns (2004–2013)Landscape, ‘fixed’ altitudinal range ᵃ (intermediate and high)R package TraMineR to elucidate differences between landscapes [64].
Bred varieties, floury landraces, bitter landraces. In 100-m intervals. ᵃ Classified as low (3097–3499 m), intermediate (3500–3899 m), or high-range (3900–4324 m); resulting in 97 intermediate-range and 382 high-range fields in Huancavelica, and 379 intermediate-range and 207 high-range fields in Pasco. * Analysis was not performed for low-range fields as they were too few (two in Huancavelica and 34 in Pasco) to compare between landscapes.
Table 3. Main household-level characteristics by landscape.
DemographyHuancavelica (n = 176)Pasco (n = 147)
Average age of head of household (years)47.7 (±15.0)44.3 (±14.3)
Female heads of household (%)10.08.0
Average number of children (<18 years) per household2.4 (±2.0)1.4 (±1.2)
Average number of total household members per household4.7 (±2.3)3.8 (±1.5)
Education
Heads of household who completed primary education (%)8.023.1
Heads of household who did not complete primary education (%)31.231.9
Heads of household who completed secondary education (%)19.913.6
Heads of household who did not complete secondary education12.525.2
Heads of household who attended technical school or college (%)4.01.4
Heads of household who did not have any formal schooling (%)24.44.8
Sources of farm labor
Family only (%)46.623.1
Family and reciprocity (%)35.823.8
Family and hired labor (%)3.435.4
Reciprocity and communal work (%)6.39.5
Family, hired, and reciprocity (%)3.42.7
Hired labor (%)2.84.1
Hired and reciprocity or communal work (%)1.71.4
Potato cropping
Households planting bred varieties (%)64.878.9
Households planting floury landraces (%)99.4100.0
Households planting bitter landraces (%)39.83.8
Total household potato cropping area (m²)1989 (±1588)5509 (±3994)
Off-farm income
Households with off-farm sources of income (%)60.868.7
Total number of households per landscape.
Table 4. Logistic regression output (best model) of most significant differentiating household characteristics between the Huancavelica and Pasco landscapes.
Significant Explanatory Variables Odds Ratio2.50%97.50%
(Intercept)0.24010.08950.6169
Number of children per household0.64900.52500.7883
Number of fields per household1.97751.62702.4605
Off-farm income3.40881.78226.7795
Number of floury landraces0.92720.90010.9519
Average area cultivated with bred varieties1.00121.00031.0023
Significant explanatory variables correspond to variables used in the logistic regression model that were identified to significantly differentiate households in Pasco from those in Huancavelica. The odds ratio was calculated by exponentiating the coefficients (of significant variables) obtained from the logistic regression model, while the columns 2.5% and 97.5% correspond to the exponentiated confidence interval levels.
Table 5. Number of distinct cultivars managed per household by cultivar group and landscape.
Huancavelica Pasco
Cultivar GroupN AverageMaximumMinimumStandard DeviationCultivar GroupN AverageMaximumMinimumStandard Deviation
Bred varieties1141.86.01.01.1Bred varieties1161.44.01.00.7
Floury landraces17512.542.01.07.1Floury landraces14716.556.01.011.0
Bitter landraces701.75.01.01.1Bitter landraces51.01.01.00.0
Total17614.3 49 1 8.0 Total14717.7 58 2 11.1
Number of households planting each cultivar group. Calculated from sum of distinct cultivars across the three cultivar groups.
Table 6. Relative cultivar frequencies (RCF) or measure of relative abundance of cultivars by cultivar group and landscape.
Huancavelica
Very scarce (<0.05)Scarce (<0.10)Uncommon (<0.25)Common (<1.00)Abundant (>1.00)
Cultivar groupNo. of cultivars% *No. of cultivars%No. of cultivars%No. of cultivars%No. of cultivars%
Bred varieties32.300.010.853.832.3
Floury landraces5542.386.2118.52216.91511.5
Bitter landraces10.800.010.821.532.3
Total 5945.486.21310.12922.22116.1
Pasco
Very scarce (<0.05)Scarce (<0.10)Uncommon (<0.25)Common (<1.00)Abundant (>1.00)
Cultivar groupNo. of cultivars%No. of cultivars%No. of cultivars%No. of cultivars%No. of cultivars%
Bred varieties21.000.021.100.031.6
Floury landraces11660.72010.52211.5157.9105.2
Bitter landraces00.000.010.500.000.0
Total 11861.72010.52513.1157.9136.8
* Percent of total number of cultivars registered within each landscape: 130 in Huancavelica and 191 in Pasco. Total number of cultivars under each RCF category.
Table 7. Overall cultivar frequencies (OCF) or measure of evenness of unique cultivars by cultivar group and landscape.
Huancavelica
Very few households (<1%)Few households (<5%)Many households (<25%)Most households (>25%)
Cultivar groupNo. of
cultivars
% *No. of cultivars%No. of
cultivars
%No. of
cultivars
%
Bred varieties10.843.153.821.5
Floury landraces3426.23526.92620.01612.3
Bitter landraces00.021.543.110.8
Total 3527.04131.53526.91914.6
Pasco
Very few households (<1%)Few households (<5%)Many households (<25%)Most households (>25%)
Cultivar groupNo. of cultivars% *No. of cultivars%No. of cultivars%No. of cultivars%
Bred varieties21.021.010.521.0
Floury landraces5830.45528.85126.71910.0
Bitter landraces00.010.500.000.0
Total 6031.45830.35227.22111.0
* Percent of total number of cultivars registered within each landscape: 130 in Huancavelica and 191 in Pasco. Total number of cultivars under each OCF category.
Table 8. Average number of fields per household for exclusive and mixed fields by cultivar group and landscape.
HuancavelicaPasco
Cultivar GroupN AverageMaximumMinimumStandard DeviationN AverageMaximumMinimumStandard Deviation
Bred varieties321.02.01.00.2901.95.01.01.0
Floury landraces1261.95.01.00.91382.78.01.01.7
Bitter landraces181.23.01.00.5-----
Mixed (BR + FL) 811.44.01.00.7521.43.01.00.6
Mixed (FL + BL) 471.22.01.00.441.01.01.00.0
Mixed (BR + FL + BL) 261.01.01.00.011.01.01.0-
Number of households managing each field type. BR = bred varieties, FL = floury landraces, BL = bitter landraces.
Table 9. Average total cropping area (m²) per household by cultivar group and landscape.
Huancavelica
Cultivar groupN AverageMaximumMininmumStandard Deviation
Bred varieties11428215696284
Floury landraces17516557323431401
Bitter landraces7040416892363
Pasco
Cultivar groupN AverageMaximumMinimumStandard Deviation
Bred varieties1161797821911774
Floury landraces147408621,6872223832
Bitter landraces5582711119
Number of households planting each cultivar group.
Table 10. Average area (m²) per field for exclusive and mixed fields by cultivar group and landscape.
HuancavelicaPasco
Cultivar GroupN AverageMaximumMinimumStandard DeviationN AverageMaximumMinimumStandard Deviation
Bred varieties333401465233331681069681896984
Floury landraces23562739229608376132013,28391562
Bitter landraces2128588340220-----
Mixed (BR + FL) 11182659045590271184612,917442181
Mixed (FL + BL) 559193219997684520137517613
Mixed (BR + FL + BL) 261660589819316021821821821-
Number of fields for each exclusive and mixed cultivar group type. BR = bred varieties, FL = floury landraces, BL = bitter landraces.
Table 11. Average fallowing rates for exclusive and mixed fields by cultivar group and landscape.
HuancavelicaPasco
Cultivar GroupN AverageMaximumMinimumStandard DeviationN AverageMaximumMinimumStandard Deviation
Bred varieties330.750.900.330.171680.440.900.000.37
Floury landraces2350.740.900.000.193760.830.900.500.07
Bitter landraces210.720.900.500.10-----
Mixed (BR + FL) 1110.760.900.000.13710.780.900.000.19
Mixed (FL + BL) 550.690.900.000.2340.890.900.880.01
Mixed (BR + FL + BL) 260.670.900.000.2610.800.800.80-
Number of fields for each exclusive and mixed cultivar group type. BR = bred varieties, FL = floury landraces, BL = bitter landraces.
Table 12. Altitude of landraces from 1975 to 2013 in the Huancavelica and Pasco landscapes.
1975–1985N AverageMaximumMinimumStandard Deviation
Huancavelica31381139733025174
Floury landraces29380139733025176
Bitter landraces23948394839480
Pasco32351939133135165
Floury landraces27349436413135156
Bitter landraces5365839133475159
2012–2013NAverageMaximumMinimumStandard Deviation
Huancavelica3323405643243464133
Floury landraces2929405743243521128
Bitter landraces153412243243521164
Pasco3387388341163097125
Floury landraces3132389741163264104
Bitter landraces5382939443646117
Number of reference cultivar samples.

