The Land Transfer from the State Treasury to Local Government Units as a Factor of Social Development of Rural Areas in Poland


The Faculty of Geodesy, Geospatial and Civil Engineering, Institute of Geography and Land Management, University of Warmia and Mazury in Olsztyn, Oczapowskiego 2, 10-719 Olsztyn, Poland
*
Author to whom correspondence should be addressed.
Land 2019, 8(11), 170; https://0-doi-org.brum.beds.ac.uk/10.3390/land8110170
Submission received: 15 October 2019
/
Revised: 27 October 2019
/
Accepted: 6 November 2019
/
Published: 8 November 2019
Abstract
:Sustainable rural development (with the development of social functions) is currently one of the basic objectives of the rural areas policy in Poland. The main purpose of this article is to determine the level of social development of rural areas and to examine whether the National Support Center for Agriculture (NSCA) activities (in the form of transferring land to communes for the implementation of social goals) have an impact on that development, and to what extent. In this article, an assessment of the social development level of rural areas using the Hellwig method was carried out. The research covered the years 2005 and 2018, on the districts of the Warmian-Masurian voivodship located in the northeastern part of Poland. The detailed analysis also covered the rural and rural-urban communes of Lidzbark, Kętrzyn, and Bartoszyce districts. The obtained results were compared with the area of land transferred by the NSCA Regional Office Olsztyn to local government units in 2004–2017, for the implementation of social goals. Pearson’s correlation coefficient was used for a comparison. The results are presented in tabular form and visualized using GIS software in the form of carto-diagrams (diagram maps). Results show a positive influence of NSCA on social development of rural areas.
1. Introduction
Rural areas cover more than 93% of Poland and are inhabited by nearly 40% of the country’s population [1]. Compared to 2006, around 547,000 inhabitants arrived to these areas (with a decrease in the number of inhabitants in cities by almost 239,000 people). This growth was influenced by two factors, i.e., a positive rate of a natural increase and a positive net migration rate [2]. Rural areas in Poland represent 8.3% of rural areas in the European Union (EU) [3,4]. The share of rural areas in the surface of individual voivodships is diversified, which is largely due to historical conditions. The highest value of this indicator was recorded in the Warmian-Masurian (97.5%) and Lubelskie (96.1%) voivodships and the lowest in Silesian (69.3%). The decrease in the share of rural areas occurred in 11 voivodships. Four areas remained at the same level, and the minimal increase was recorded in the Lesser Poland voivodship [5].
According to the methodology introduced by The Organization for Economic Cooperation and Development (OECD), rural areas are defined as areas with population density below 150 per km2 [2]. The OECD has developed a regional typology, which recognizes the diversity of rural regions. In general terms, the OECD identifies three ways to define rural regions, with different characteristics, challenges, and policy needs. Rural areas within functional urban areas (FUAs) are an integral part of the commuting zone of the urban center and their development is fully integrated within an FUA. Rural regions close to an FUA have strong linkages to a nearby FUA, but are not part of its labor market. Remote rural regions are at a distance from an FUA [6]. Rural areas in EU statistics are defined using the “population grid.” The new degree of urbanization creates a three-way classification of local administrative units level 2 (LAU2) as follows. Densely populated area (alternative name: cities) is defined as an area where at least 50% of the population lives in high-density clusters (alternative name: urban center). Intermediate density area (alternative name: towns and suburbs) is defined as an area where less than 50% of the population lives in rural grid cells and less than 50% of people live in a high-density cluster. Thinly populated area (alternative name: rural area) is known as an area where more than 50% of the population lives in rural grid cells [7]. In addition, at the regional level, rural areas are defined on the basis of the city population size criteria, where: a region classified as “thinly populated area” becomes an “intermediate density area” if a city with a population of over 200,000 people is located within it, which represents at least 25% of the population of that region. A region classified as the “intermediate density area” becomes a “densely populated area” if a city with a population of over 500,000 is located in it, which represents at least 25% of the population of that region [2]. The typology of regions, according to Eurostat, was developed based on the OECD typology. Its purpose is to improve the comparability of individual categories of units within the European Union by eliminating the weaknesses of the OECD typology. The methodology for identifying and dividing subregions, according to Eurostat typology, distinguishes the following delimitation criteria: determining two categories of grids (1 × 1 km squares drawn by geographical grid lines): urban and rural, based on data from the CORINE land cover system and on population data for LAU2. “Urban areas” are those grids, which meet two conditions in total: the population density is over 300/km2, and the minimum population of the area created by the grouping of a given grid together with eight neighboring grids is more than 5,000 people. “Rural areas” are those grids that do not meet the above criteria [2,8]. OECD, in the case of European Union countries, assigns subregions to one of three types (“densely populated area,” “intermediate density area,” and “thinly populated area”), according to the typology of regions based on Eurostat [2]. Rural areas, described by the Statistics Poland (pol. Główny Urząd Statystyczny, GUS), are based on OECD and Eurostat classifications, and refer to territorial division, according to the National Official Register of the Territorial Division of the Country (pol. Krajowy Rejestr Urzędowy Podziału Terytorialnego Kraju, TERYT), in which rural communes and the rural part of urban-rural communes are recognized as rural areas. The use of TERYT register identifiers enables the development and presentation of socio-economic phenomena in cross-sections with various degrees of detail [2].
In rural areas in Poland, an increase in the role of non-agricultural production and consumption functions can be seen, at the expense of a decreasing share of agricultural production [9]. Rural development is becoming more sustainable. Due to this, other functions with non-agricultural character are incorporated into rural areas [10]. The multi-functional agricultural model of rural areas is currently one of the basic categories of policy toward agriculture and rural areas in Poland [11]. The concept of rural development in the aspect of sustainability is one of the fundamental types of strategies in the sphere of agriculture and villages in Poland. The development, which takes place in rural areas, has contributed to a visible improvement in the material situation of the population, but also to the deterioration of the situation in the environmental sphere and to social degradation. For this reason, one should also refer to the issue of striving for development in harmony with the surrounding environment [12]. This approach perfectly fits multi-functional agriculture into the ideas of sustainable development. In turn, the idea of sustainable development is currently one of the main elements considered in land development, including in rural areas [13,14,15]. In Polish legislation, sustainable development is defined in the Environmental Protection Law [16] as the socio-economic development integrating political, economic, and social actions, which is balanced with environmental protection and a permanence of basic natural processes in order to satisfy the basic needs of individual communities or citizens in both present and future generations. Therefore, the problem of developing non-agricultural functions of the rural economy and the need to preserve a wide range of its social functions is a key issue for ensuring the improvement of living standards for the rural population [11]. The research presented in this article concerns precisely the social aspects of rural development as a component of their multi-functional development in the context of the transfer of land from the Agricultural Property Stock (APS) of the State Treasury to local government units. Agricultural Property Stock (APS) of the State Treasury was composed, among others, of [17]:
- agricultural property, as defined by the civil code, in areas zoned for agricultural production, excluding land managed by the State Forests and national parks,
- other types of property and assets of the former state-owned agricultural enterprises, their associations, and unions,
- forests that were not subdivided into land plots with a separate legal title (Article 1 of the Act on the management of the agricultural property of the State Treasury).
The National Support Center for Agriculture (NSCA) manages the APS under the law regulations [17]. NSCA was created on 01/09/2017, as the successor of the Agricultural Property Agency (pol. Agencja Nieruchomości Rolnych) and the Agricultural Market Agency (pol. Agencja Rynku Rolnego). Among many tasks related to the management of APS, NSCA was authorized to transfer part of the APS land free of charge to local government units (in Poland these are communes, districts, and voivodships) [18]. Land and objects transferred to communes are often used to carry out social tasks [19,20,21]. The impact of land transferred on the social aspects of rural development in Poland was analyzed in this study.
The main purpose of this paper is to determine the level of social development of rural areas and to examine whether NSCA activities (in the form of transferring land to communes for the implementation of social goals) have an impact on it, and to what extent.
2. Materials and Methods
Research carried out in this study can be divided into three stages.
- Stage I: determining the level of social development of rural areas,
- Stage II: analysis of data on land transferred by NSCA to local government units,
- Stage III: analysis of whether transferring land affected the social development of rural areas, and to what extent.
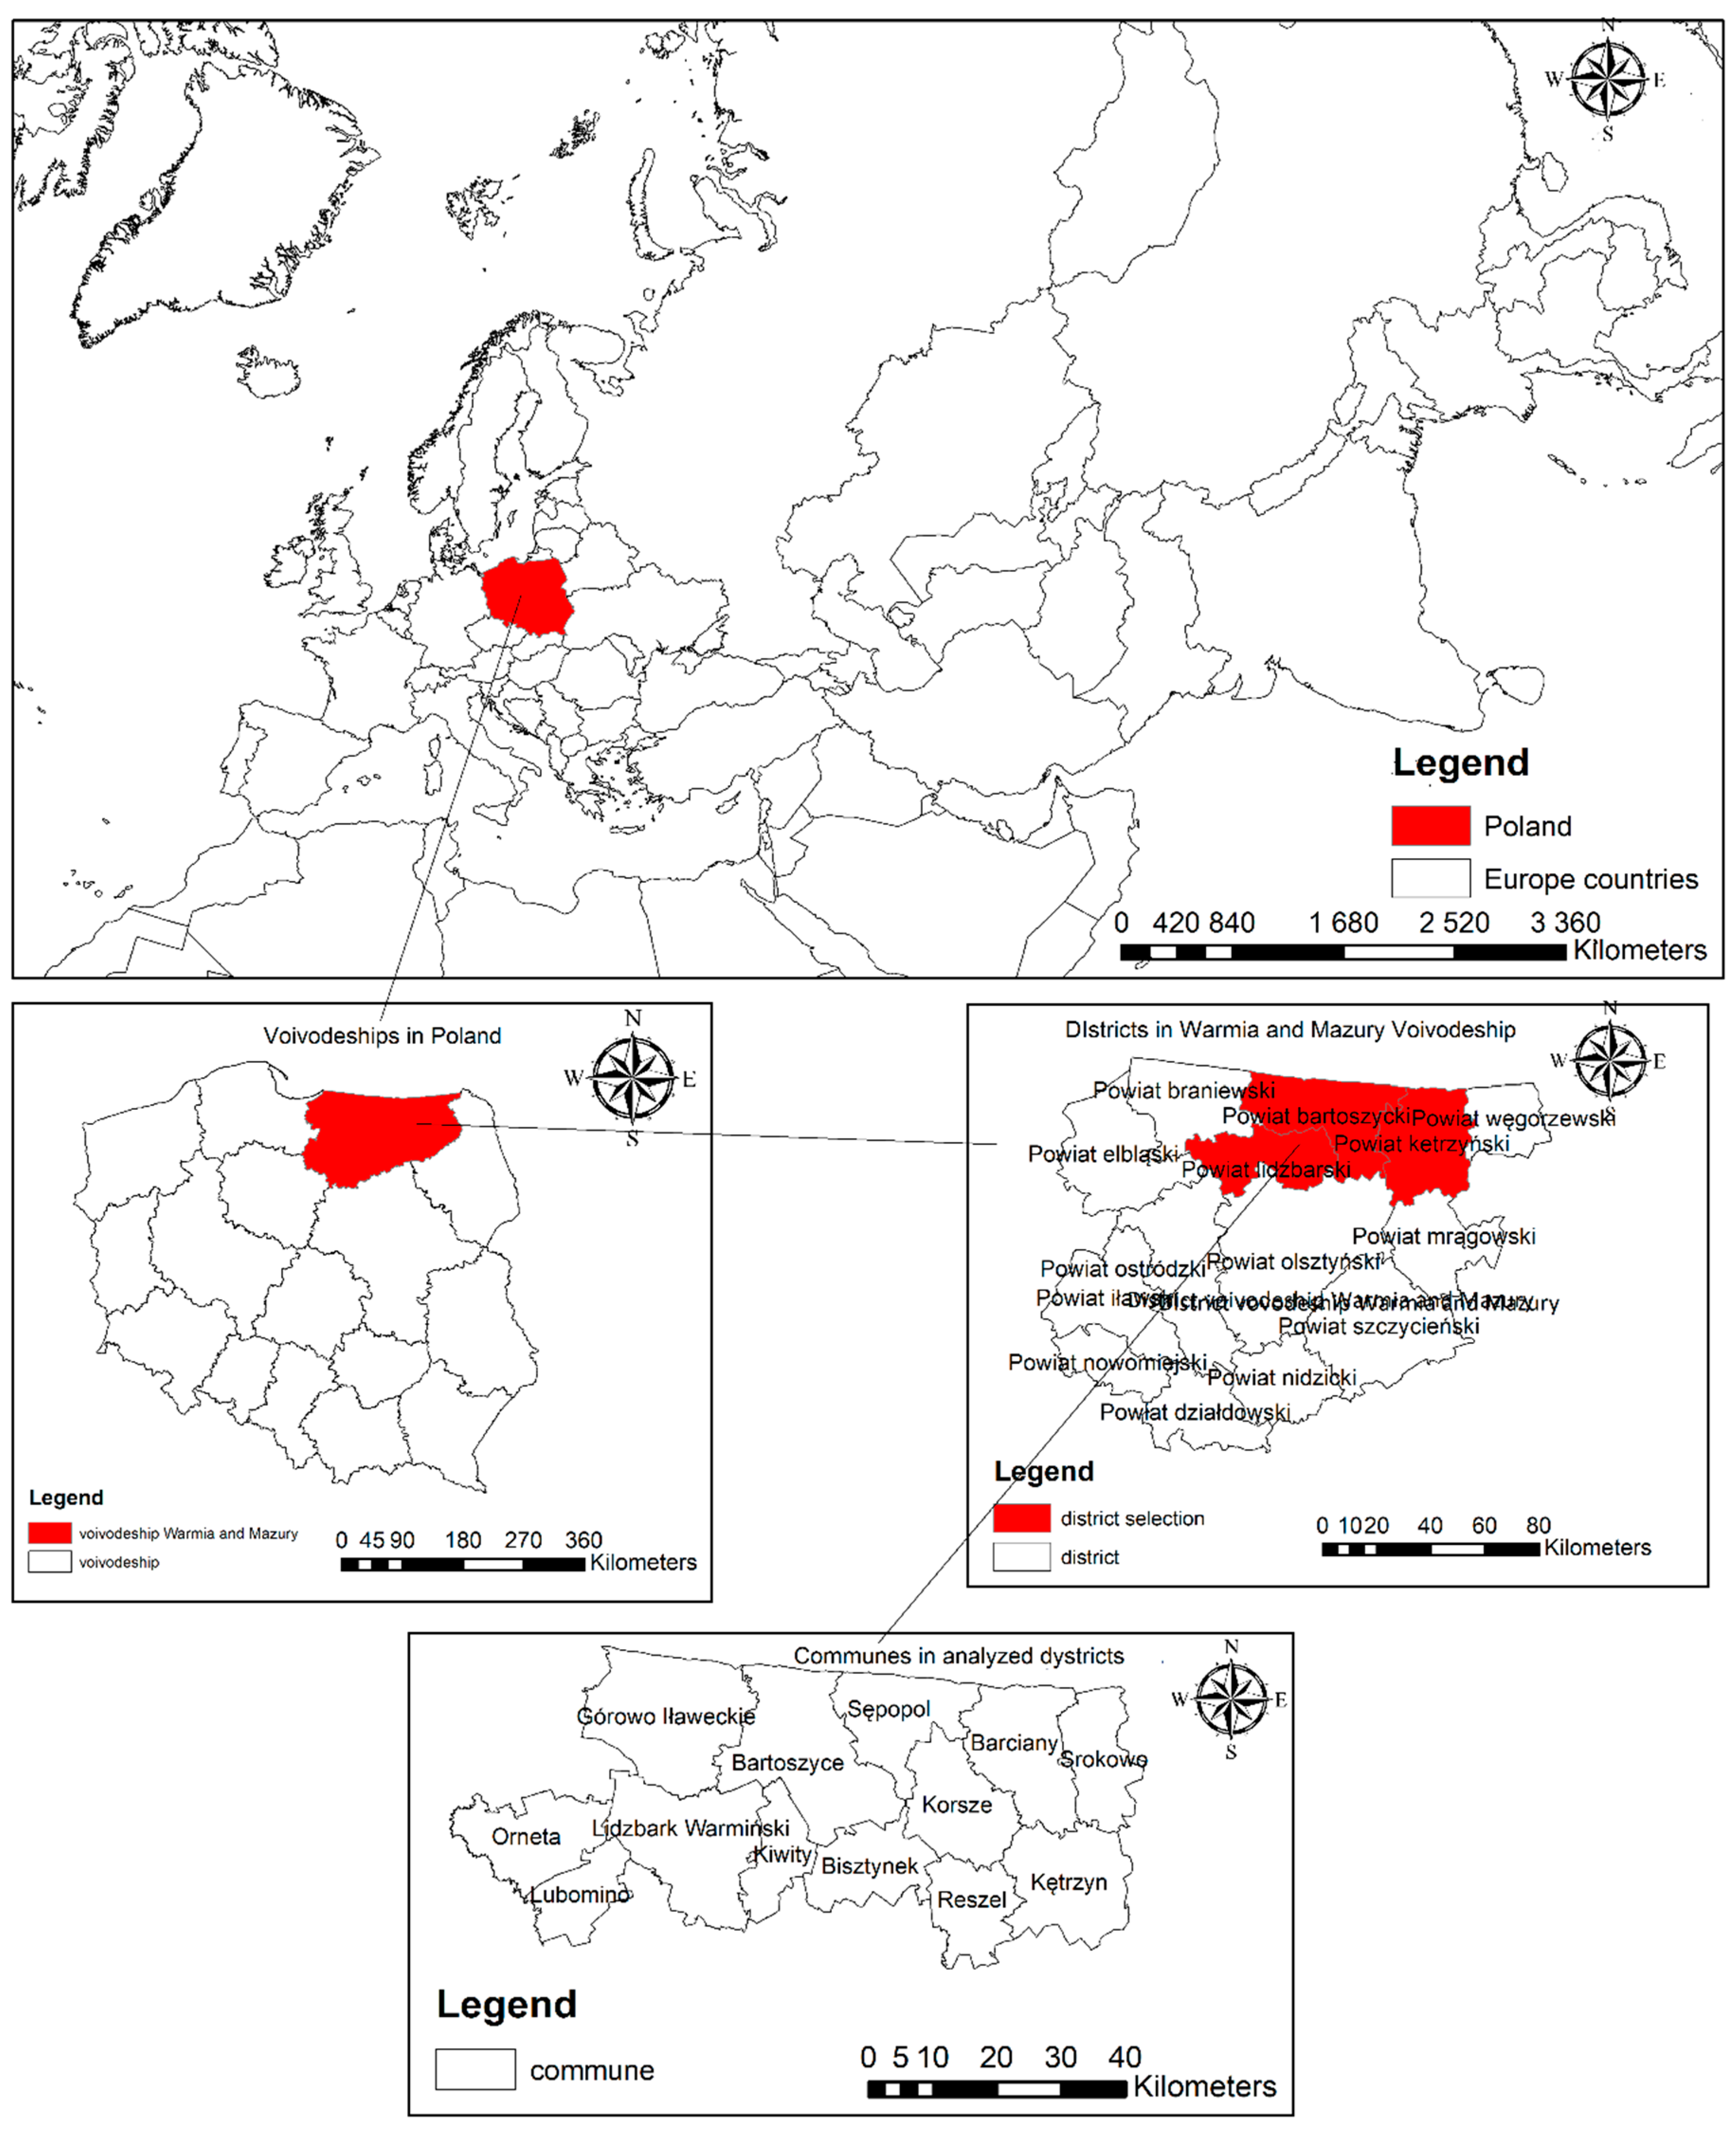
As part of the first stage, the research area and analysis period was chosen. Data from 2005–2018 were analyzed. The year 2005 was chosen to refer to the period after Poland’s acceptance to the European Union (01/05/2004). After this date, rural development has accelerated significantly. New, different developmental conditions have emerged. There was a possibility for communes to receive financial support from EU funds as well as the state budget. Many communes began implementing projects aimed at improving living conditions in rural areas [22,23,24]. The Warmian-Masurian Voivodship, located in North-eastern Poland, was selected as the research area. The research covered 19 rural districts of the voivodship. Detailed analyses were carried out for 14 rural and rural-urban communes, which are part of three districts: Lidzbark, Kętrzyn, and Bartoszyce. The research area is shown in Figure 1.
In the next step, a literature analysis was carried out to select the best method to determine the level of social development in rural areas. Taxonomic methods are most often used to determine the level of development of a given area. These are statistical methods used to classify objects described by many of its properties. Analysis of the literature indicated that, in the case of research similar to the research carried out in this article, linear ordering methods are most often used. As a result, it was decided to choose the “Hellwig method.” It is a method commonly used in this type of research [10,25,26,27,28,29,30]. Based on analysis of the literature [25,26,28,30,31,32,33], a set of diagnostic variables was prepared for the implementation. The variables are of a statistical nature and allow for prioritizing territorial division units, according to established criteria. In this case, one criterion is the social development of rural areas. A set of 21 specific diagnostic variables (expressed as indicators) is included in Table 1.
For the used set of diagnostic variables, its values for 2005 and 2018 were obtained, by using the Local Data Bank [34]. The obtained variables enable the division of the analyzed objects into classes that differ in terms of the level of social development using the taxonomic measure of Hellwig development [35,36]. This approach is one of the commonly used taxonomic methods in which the aggregate measure is calculated as a synthetic indicator of the taxonomic distance of a given object from the theoretical development pattern. The Hellwig development pattern method organizes a Pi (where: i = 1, 2,…, n) set of objects (in this case, districts and communes), where each is described by a set of m diagnostic variables with the character of a stimulant or destimulant. Stimulants are variables whose high values are desirable, and low values are undesirable. Destimulants, on the other hand, are variables whose low values are desirable and high values are undesirable. Diagnostic variables X3, X5, X7, and X15 are destimulants in this study, while the other variables are stimulants.
The numerical description of the set of objects can be presented in the form of an observation matrix X, taking the form of Equation (1) below.
where xij means the value of the j-th variable for the i-th object (i = 1, 2,…, n; j = 1, 2,…,m).
In the case of this research, n = 19 (for districts) and n = 14 (for communes) and m = 21 in both cases.
For the collected 21 diagnostic variables, it was examined whether these variables are characterized by sufficiently high variability by eliminating quasi-constant variables. For this purpose, the coefficient of variation V was calculated for each j-th variable. Its value is a relative measure of dispersion, and it is calculated by using the equation below.
where: –arithmetic mean of j-th variable (3), Sj–standard deviation for the j-th variable (3)
From the set of variables, unequal variables have been eliminated.
where V * is the critical value of the variation coefficient. The value of V* was arbitrarily set at 0.10. Due to low variability, variables X5 and X17 have been eliminated from the analysis.
Afterward, the strength of the relationship between the other variables was tested. For this purpose, the correlation between variables was determined with the value of the Pearson coefficient.
Due to the high value of correlation with other variables, variable X9 was eliminated from the analysis.
Further calculations were made for the remaining eighteen variables (m = 18).
The Hellwig method requires linearity of diagnostic variables. Therefore, covariance was calculated, which is a measure of the joint variability of two random variables. Covariance of variables shows how variables are linearly related to each other. Positive covariance indicates a positive linear relationship between variables, while negative covariance indicates the opposite. If the variables are not linearly related, the covariance value is close to zero. The covariances were calculated for the analyzed variables. The results show that the variables are connected linearly, which confirms the validity of the chosen method. In the next step, the variables were unified.
To unify variables, the characteristics should be normalized by standardizing it, according to Equation (2).
where: is the arithmetic mean of j-th variable (3) and Sj is the standard deviation for the j-th variable (3). This way, a matrix of standard values of the Z characteristics is obtained in Equation (6) below.
where zij is a standardized value of xij.
The matrix (6) formed is the basis for determining the reference object P0. It is an abstract object (district, commune) with standardized values z01, z02,…,z0j, where:
The P0 object obtained in this way is treated as a development pattern.
In the next step, the Euclidean distances of the tested objects from the determined pattern should be calculated. This can be completed based on Equation (8).
For the D10, D20,…,Dn0 distance values obtained in this way, the average value should be calculated (9).
As well as standard deviation (10):
The level of social development is obtained from Equation (11) below.
where:
A string of d1, d2,…, dn values is obtained in this way, using the range [0.1].
The higher the measure of the di value of the tested object (i.e., its values are close to the pattern), the higher its level of development is. The lower the di value is (i.e., the values of the tested object are further away from the pattern), the lower its level of development is.
Two parameters of the taxonomic measure were used to classify the examined objects, according to the level of social development: geometric mean ( and standard deviation (Sdi). Six social development classes of rural areas were distinguished in this way, depending on the value of di:
- Sixth class (the lowest level of development):
- Fifth class (low level of development):
- Fourth class (medium level of development):
- Third class (medium-high level of development):
- Second class (high level of development):
- First class (the highest level of development):
Using the methodology described above, rural development classes were determined for 19 rural districts of the Warmian-Masurian Voivodship, according to the values for 2005 and 2018. Then, similar calculations were carried out for 14 rural and urban-rural communes, which are part of three districts: Lidzbark, Kętrzyn, and Bartoszyce, according to the values for 2005 and 2018. Afterward, the change of classes for both examined cases between 2005 and 2018 was determined. We assessed the changes that occurred in the studied areas between the years 2005 and 2018. The results obtained are presented in tabular form (Microsoft Office Excel was used for calculations), and in the form of cartodiagrams (Esri ArcMap version 10.2 was used to visualize the results).
As part of the second stage of research, the authors obtained primary data from NSCA, Regional Office (RO) Olsztyn. The data concerned land transferred to local government units for the implementation of social goals. Collected data were aggregated according to its location, by assigning the number of hectares to the smallest local government unit in Poland, i.e., the commune. The division by specific purpose of land transfer was introduced. Four categories of transferred land were identified in this way: land for sport and recreation, land for the construction of infrastructure such as pumping stations, wells, bus stops, drainage tanks, and sewage networks, as well as land for construction of cultural objects and land for the construction of new roads or its modernization (widening the road lane). Next, the obtained data was verified by conducting field visits. This way, the reliability of the data obtained was checked and it was verified whether the transferred land was used as intended. Lastly, data on communes were collected and compiled in tabular form, assigning communes to individual districts. The results were also visualized using Esri ArcMap version 10.2.
To implement the third stage of the research, the authors decided to determine the correlation between the classes of social development obtained in the first stage and the area of land transferred by NSCA to local government units for implementing social goals. Pearson’s linear correlation coefficient was used. This is the coefficient that determines the level of the linear relationship between random variables. It was developed by Karl Pearson. Correlation can be interpreted as e.g., strong and weak or negative and positive [37,38]. However, this interpretation is arbitrary and cannot be treated too strictly. For example, a coefficient of 0.9 for sociologists and economists means a strong correlation, and for physicists using high-class measurements when studying the laws of nature means a weak correlation [37]. On the other hand, the level of correlation affects the lifetime of correlation [38]. In this study, to verify the correctness of the model, determining the classes of social development of rural areas by the Hellwig method for 2005 and 2018, changes in the level of social development between the years 2005 and 2018 and, comparing it with the land transferred by NSCA, the RO Olsztyn–J. Guilford correlation level classification was used (r or ρ), where:
- |r| = 0–no correlation
- Level I—0.0 < |r| ≤ 0.1—very weak correlation
- Level II—0.1 < |r| ≤ 0.3—weak correlation
- Level III—0.3 < |r| ≤ 0.5—average (moderate) correlation
- Level IV—0.5 < |r| ≤ 0.7—strong correlation
- Level V—0.9 < |r| < 1.0—very strong (almost full) correlation
where r is the correlation coefficient.
To better visualize the collected data, the article also uses the cartographic methods used to visualize spatial data. Unified data enables accurate presentation of information and highlights the differences in selected cartographic methods [41]. For cartographic presentation in quantitative methods, the relationship between spatial variability and intensity of variability can be indicated [42]. The basic quantitative methods are: diagram map (cartodiagram), cartogram map, dot map, and contour lines. The element illustrating the intensity of a given phenomenon is the graphic scale chosen by the creator. To emphasize the change in the intensity of a given phenomenon, different shades (from light to dark) are more often used [43]. Surface diagrams usually use geometric figures to represent the proportional size of the phenomenon. The most common one in this group is the bar chart. It shows discrete, numerical comparisons between categories [42]. If the data is expressed in numerical form referring to a specific location, geostatistical methods can be used for visualization. However, the development of such maps requires the selection of an appropriate geostatistical or deterministic method and a method for validating the results [44,45]. Results of conducted analyses of land transferred for public purposes and determined levels of social development using the Hellwig method were visualized using the cartodiagram method. The maps were made in GIS software using Esri ArcGIS version 10.2 Redlans, California, USA. For symbolization, graduated colors in Natural Breaks classification were used, where, in each case, the data is divided into five classes. Natural Breaks classes are based on natural groupings inherent in the data. Class breaks are identified with best group similar values that maximize the differences between classes. The variables are divided into classes whose boundaries are set where there are relatively big differences in the data values. Natural breaks are data-specific classifications and are not useful for comparing multiple maps built from different underlying information. This classification is based on the Jenks’ Natural Breaks algorithm [46].
To symbolize the classes of social development of rural areas determined by the Hellwig method, the unique values method was used to present the obtained class results. The bar chart with the amount of land (in hectares) transferred by NSCA for a given territorial unit, was then plotted. In Poland, in accordance with the Regulation [47] Surveyor General of Poland performs and provides access to the territorial division of the country presenting, in particular, the state borders and the borders of the territorial division units of the country, including the basic three-stage territorial division of the country. Therefore, the results for communes and districts, i.e., for two main divisions of the territorial state of the Polish state, were developed.
3. Results
As part of the first stage of research, the social development classes of rural areas were determined using the Hellwig method. Due to the large amount of data and limited editing capabilities, Table 2 and Table 3 below present the final results of the social development class calculations carried out in accordance with the Hellwig method described in chapter 2. Table 2 shows the obtained results for the analyzed districts.
The obtained results show that, in 2005 and 2018, the majority of the analyzed districts (12 out of 19) were in the third class of social development (medium high level of development). No district was in the best first and second classes, which corresponds to the highest levels of development. In the period covered by the study (2005 and 2018), four districts (Giżycko, Mrągowo, Ostróda, and Węgorzewo) improved their classes by one level and one district (Nowe Miasto) improved its class by three levels. Three districts deteriorated. Elbląg improved its class by two levels and Nidzica and Pisz improved their classes by one level. Other districts maintained the level of social development. Similar results were obtained for the analyzed communes. It would seem that after Poland’s accession to the EU, there were many opportunities to raise funds for various purposes that a large part of local governments benefited from. Unfortunately, the obtained results do not confirm this. The analysis, however, only covered the social aspects of development. It is possible that, in the case of research related to wider socio-economic development, the results could be different.
The obtained results for communes are presented in Table 3.
As in the case of districts, most of the analyzed communes obtained the third class of social development including eight out of 15 in 2005, and 10 out of 15 in 2018. In addition, no commune obtained the best classes for 1st and 2nd place, which corresponds to the highest levels of development. During the period covered by the study (2005–2018), three communes: Bisztynek, Górowo Iławieckie, and Kiwity improved its class by one level. One commune (Reszel) deteriorated by two levels.
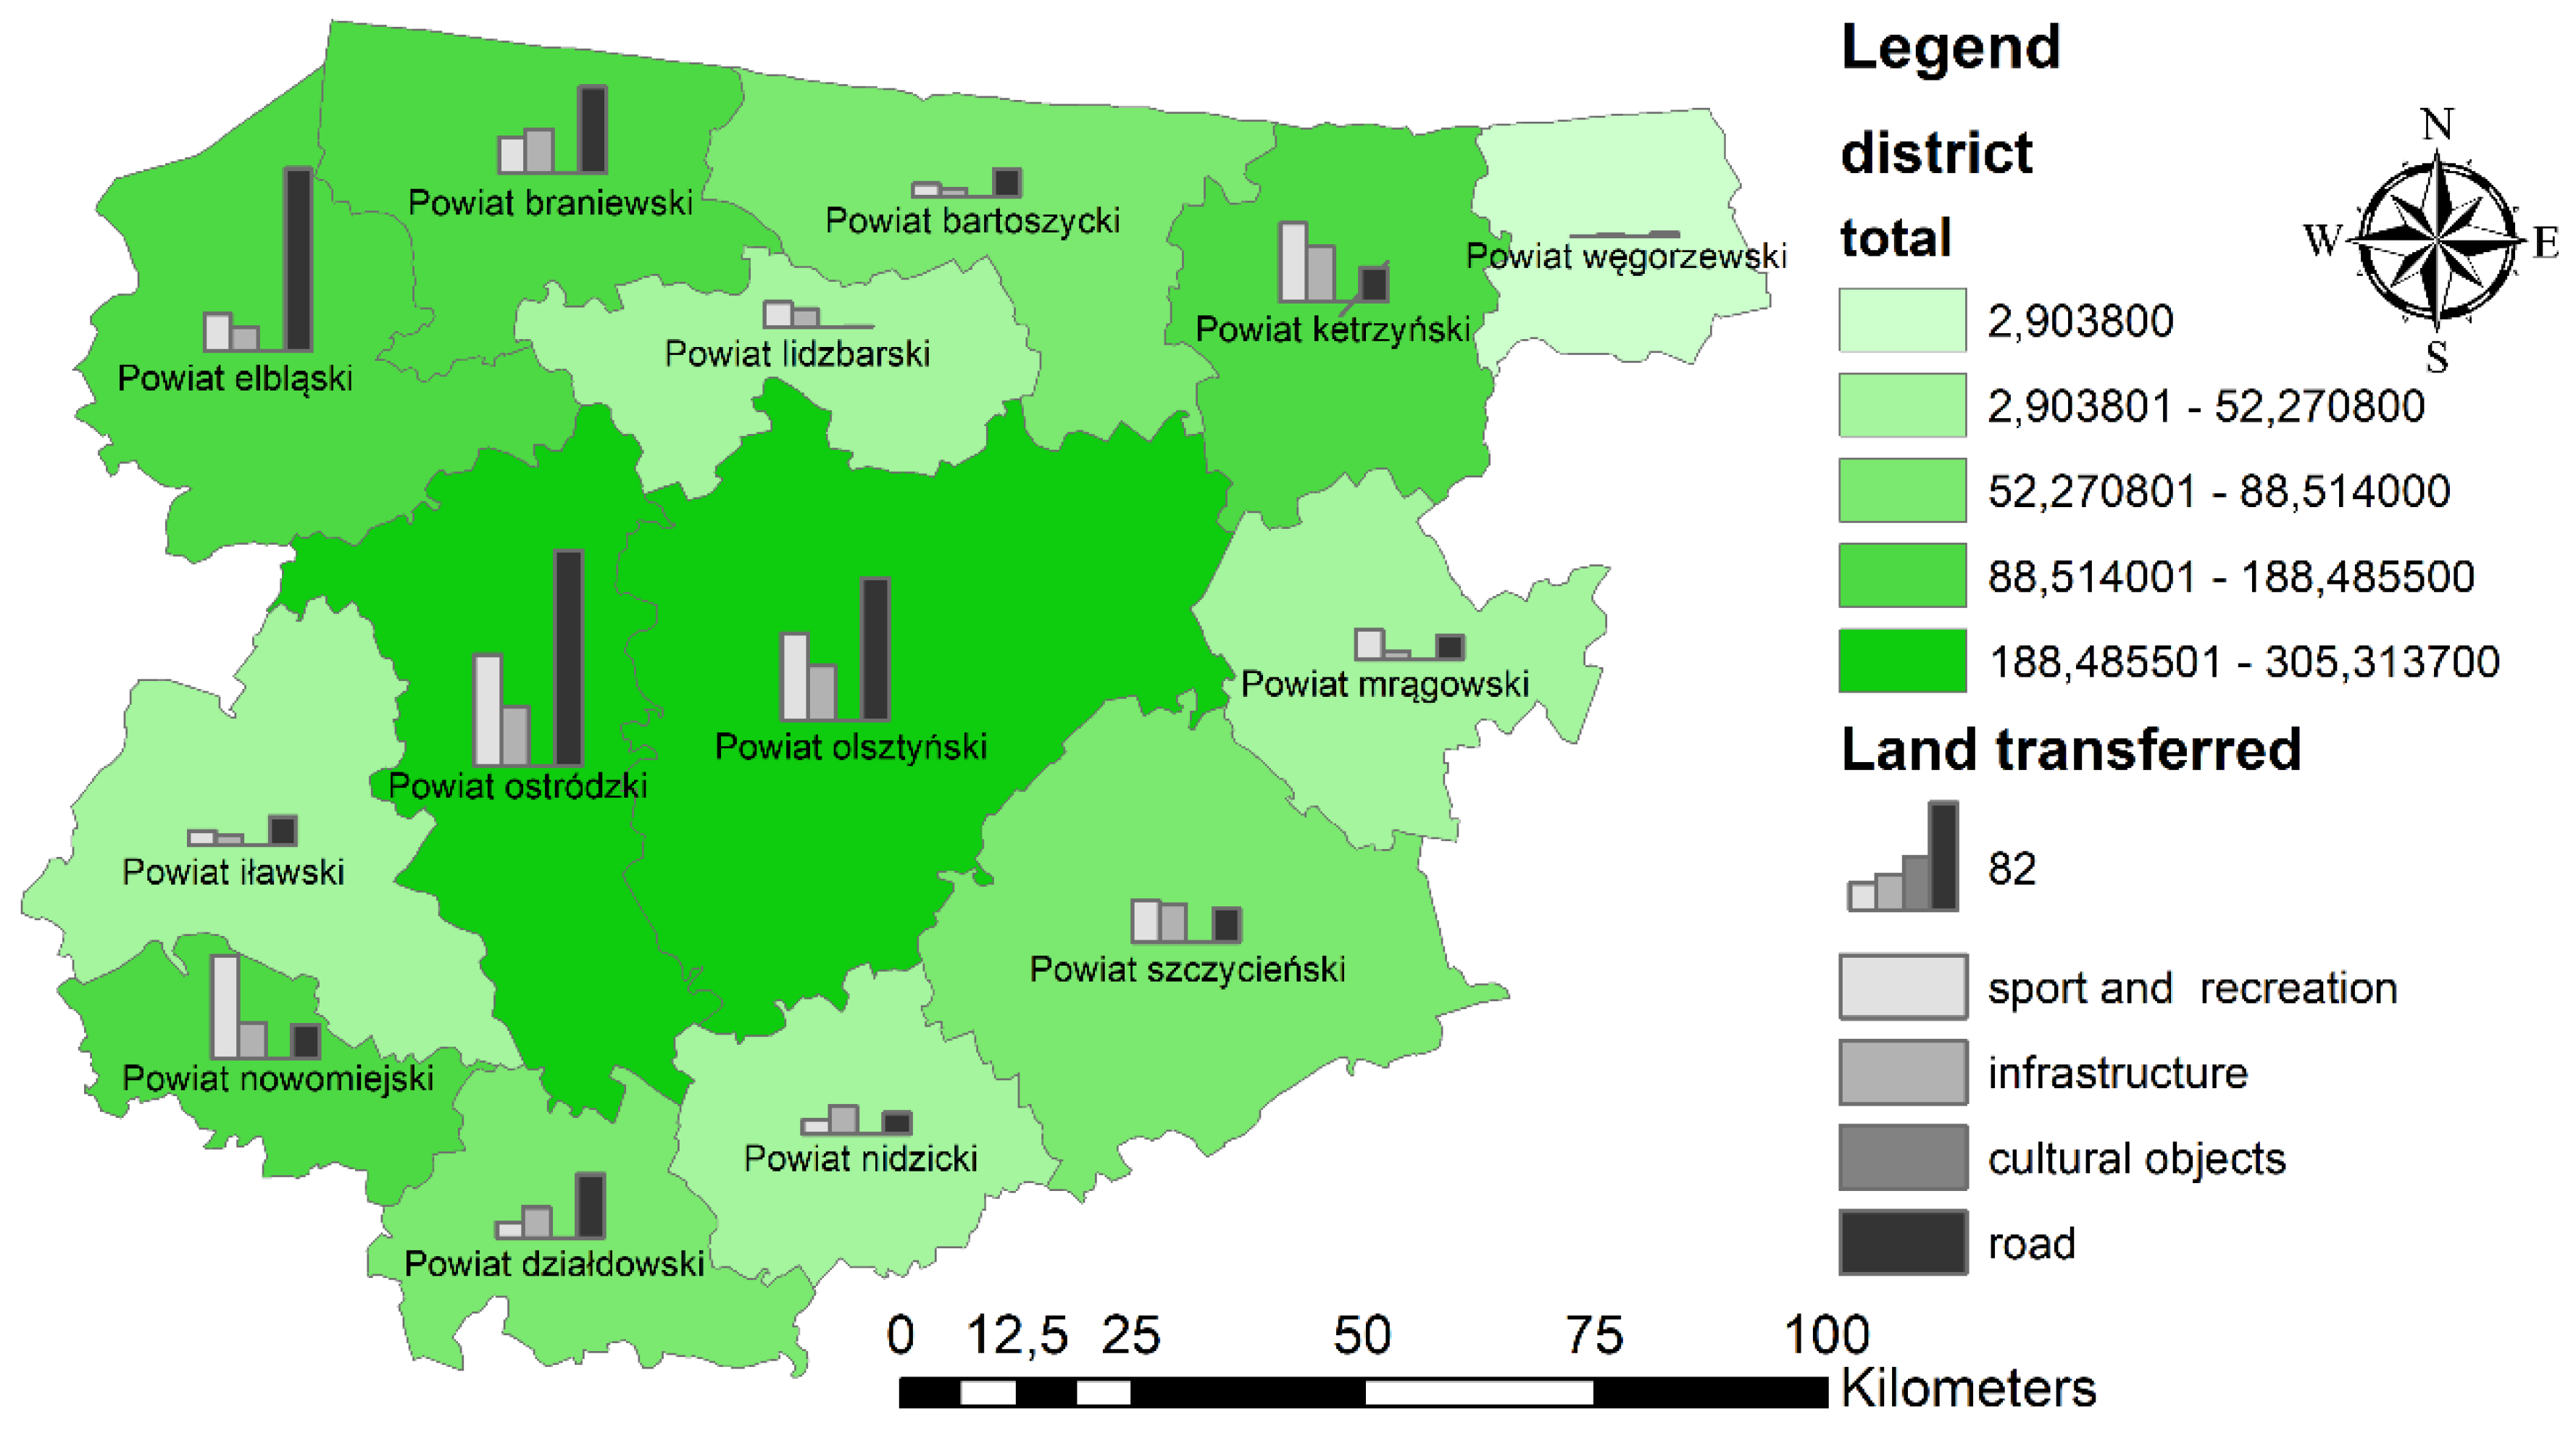
As a result of analyses carried out in the second stage of research, data on the land transferred by NSCA RO Olsztyn to local government units in the years 2004–2017 were prepared. This is visualized on the cartodiagram shown in Figure 2.
As can be seen in Figure 2, most land was transferred to sports and recreation (approximately 42%) as well as for road construction and modernization (39%). The least land was transferred to cultural facilities (approximately 5%). Most land was transferred in the following districts: Ostróda (approximately 18%) and Olsztyn (approximately 17%). The smallest amount of land was transferred in the Węgorzewo district (approximately 0.3%).
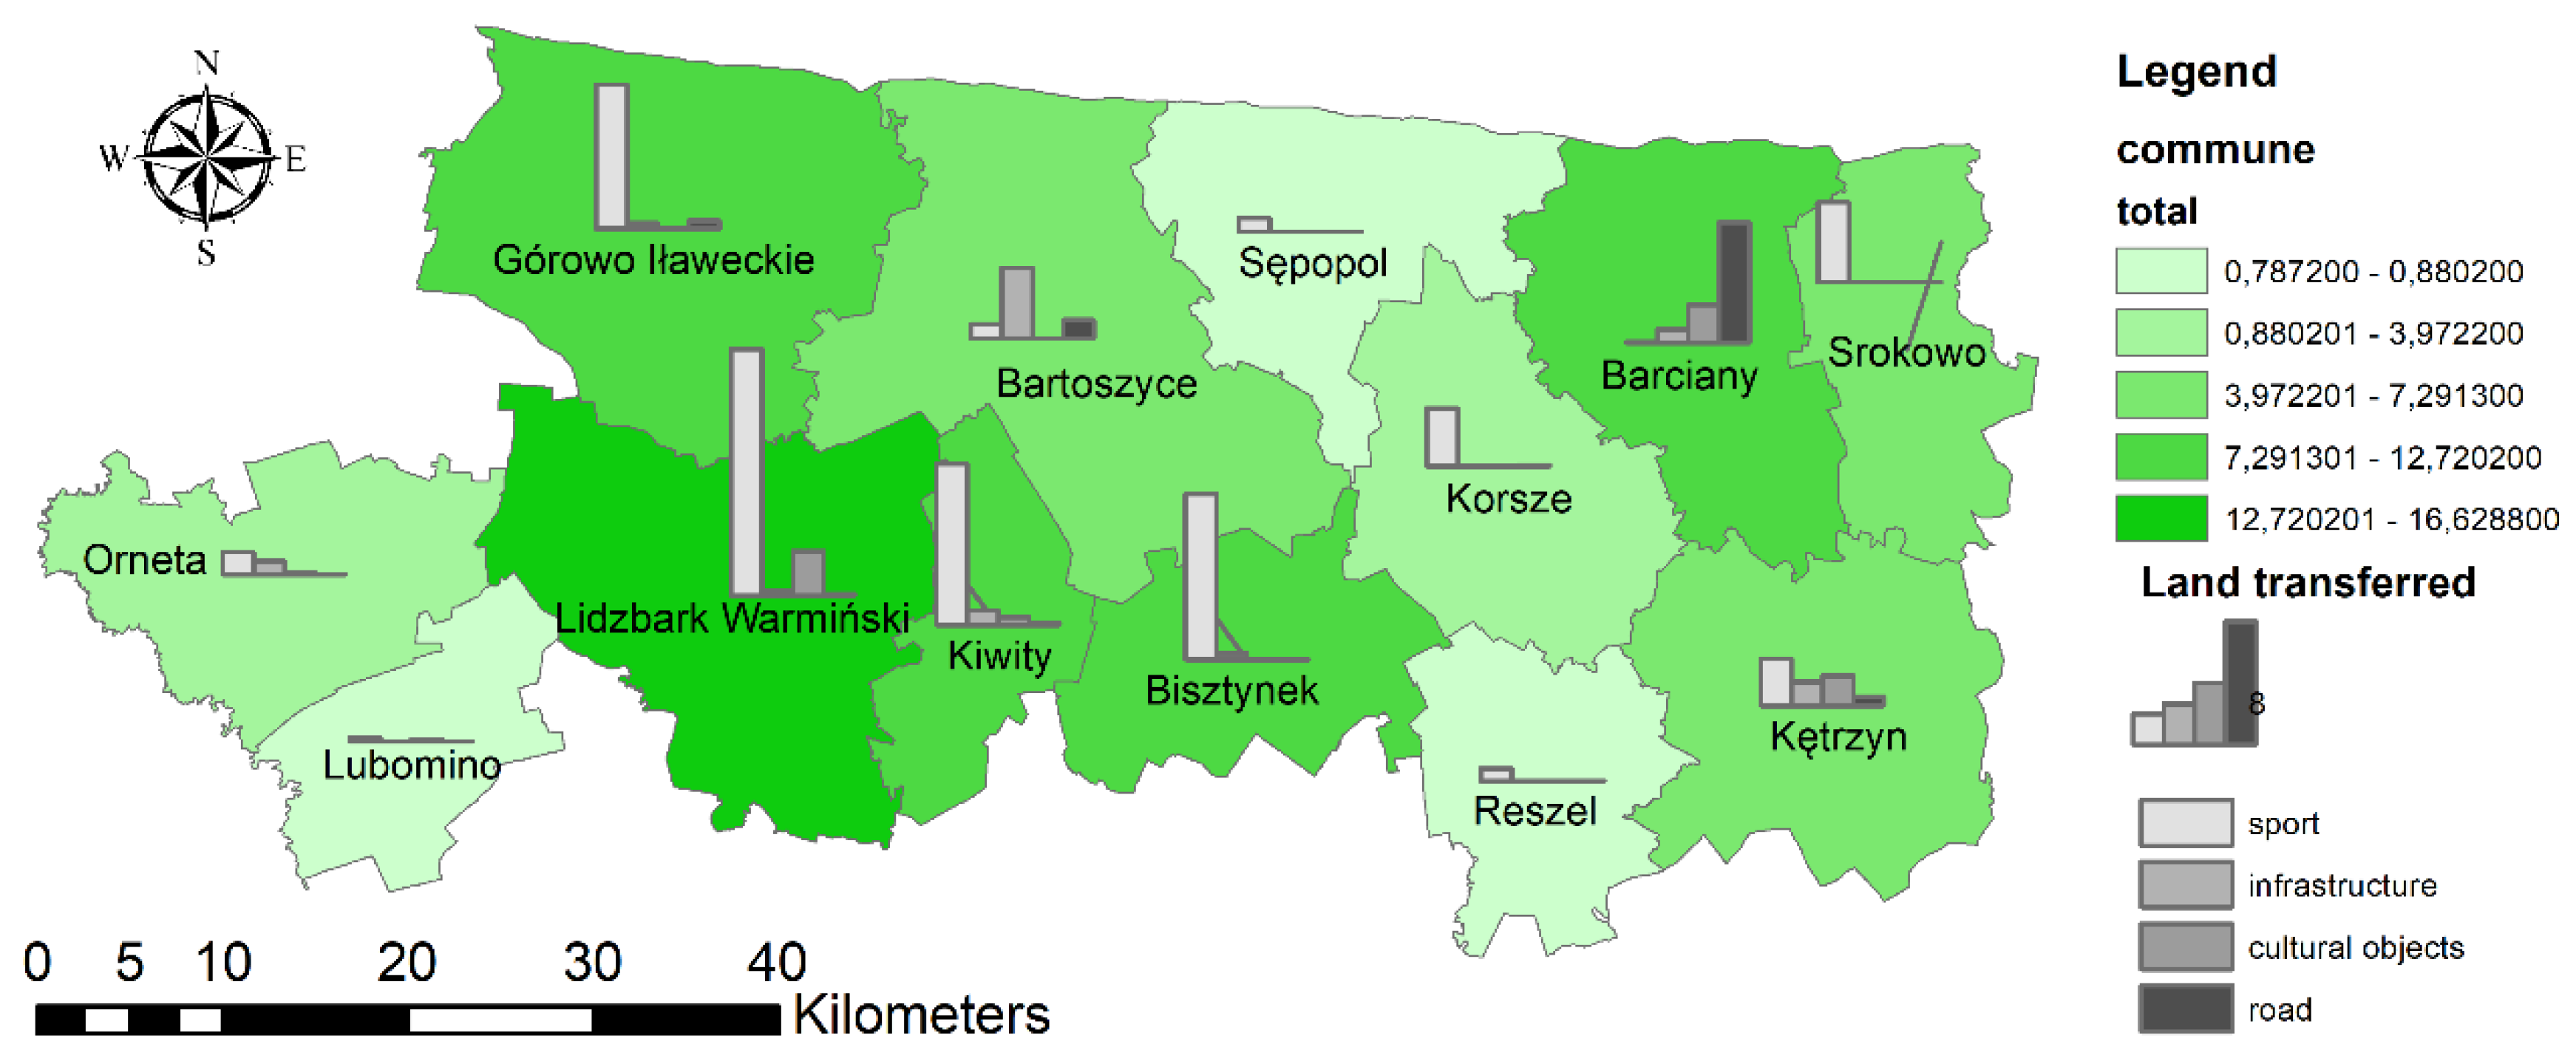
Results for the analyzed communes are displayed in the cartodiagram shown in Figure 3.
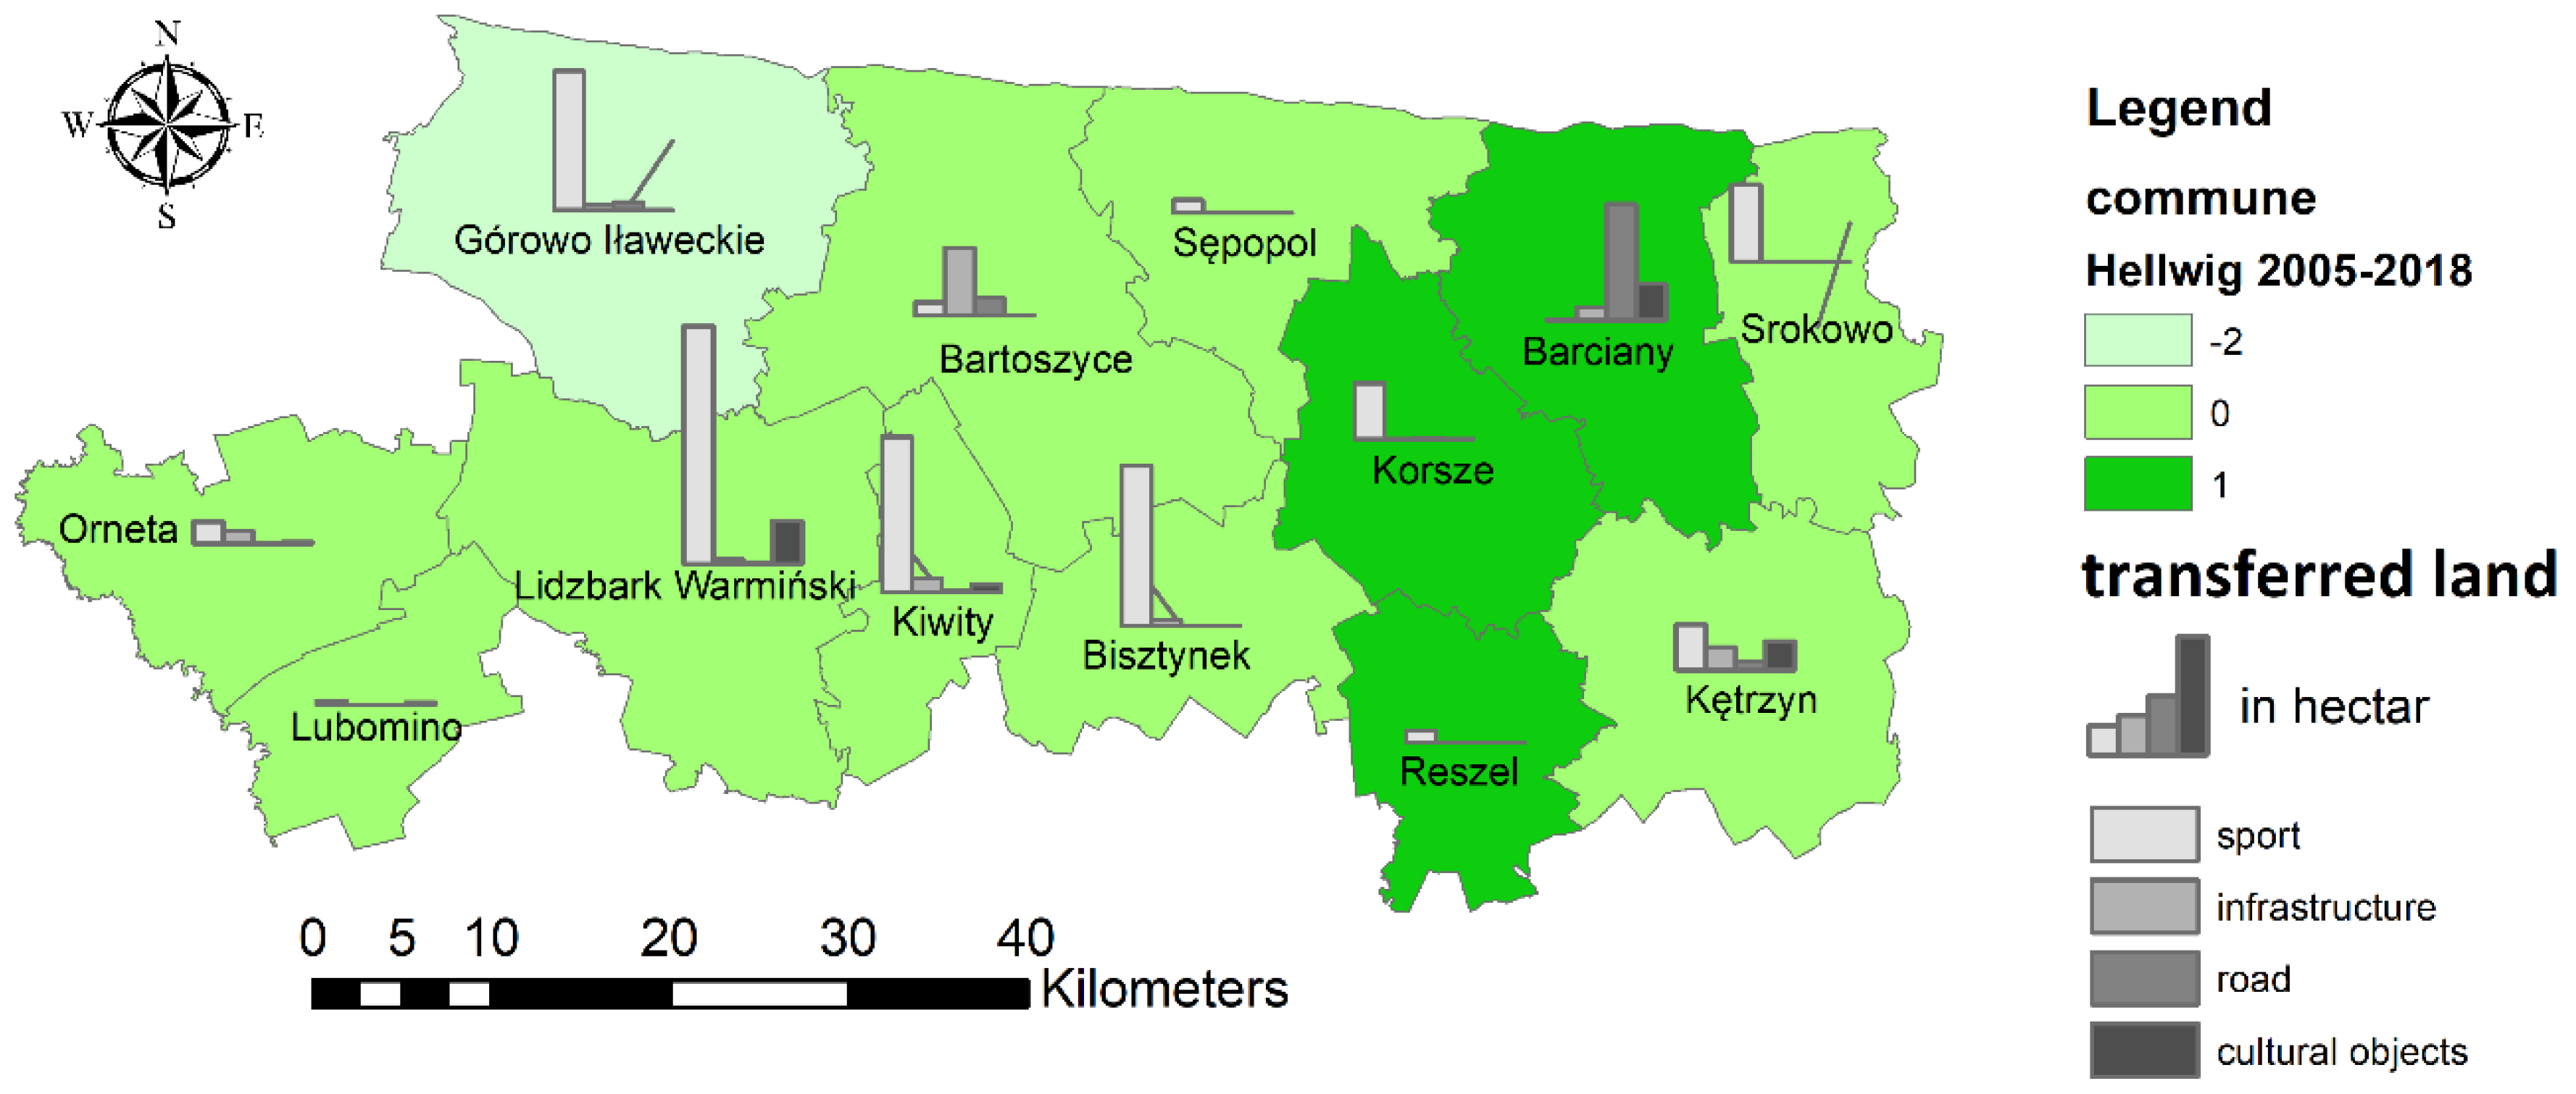
As can be seen in Figure 3, in the analyzed communes, the majority of land was also transferred to sports and recreation facilities (approximately 69%). The area of land transferred for other purposes was similar and ranged from around 9% in the case of cultural facilities to around 11% for the road construction and modernization. Most land was transferred in the commune of Lidzbark Warmiński (around 18%). The smallest amounts of land were transferred in the communes of Reszel (around 0.8%) and Sępopol (around 0.9%).
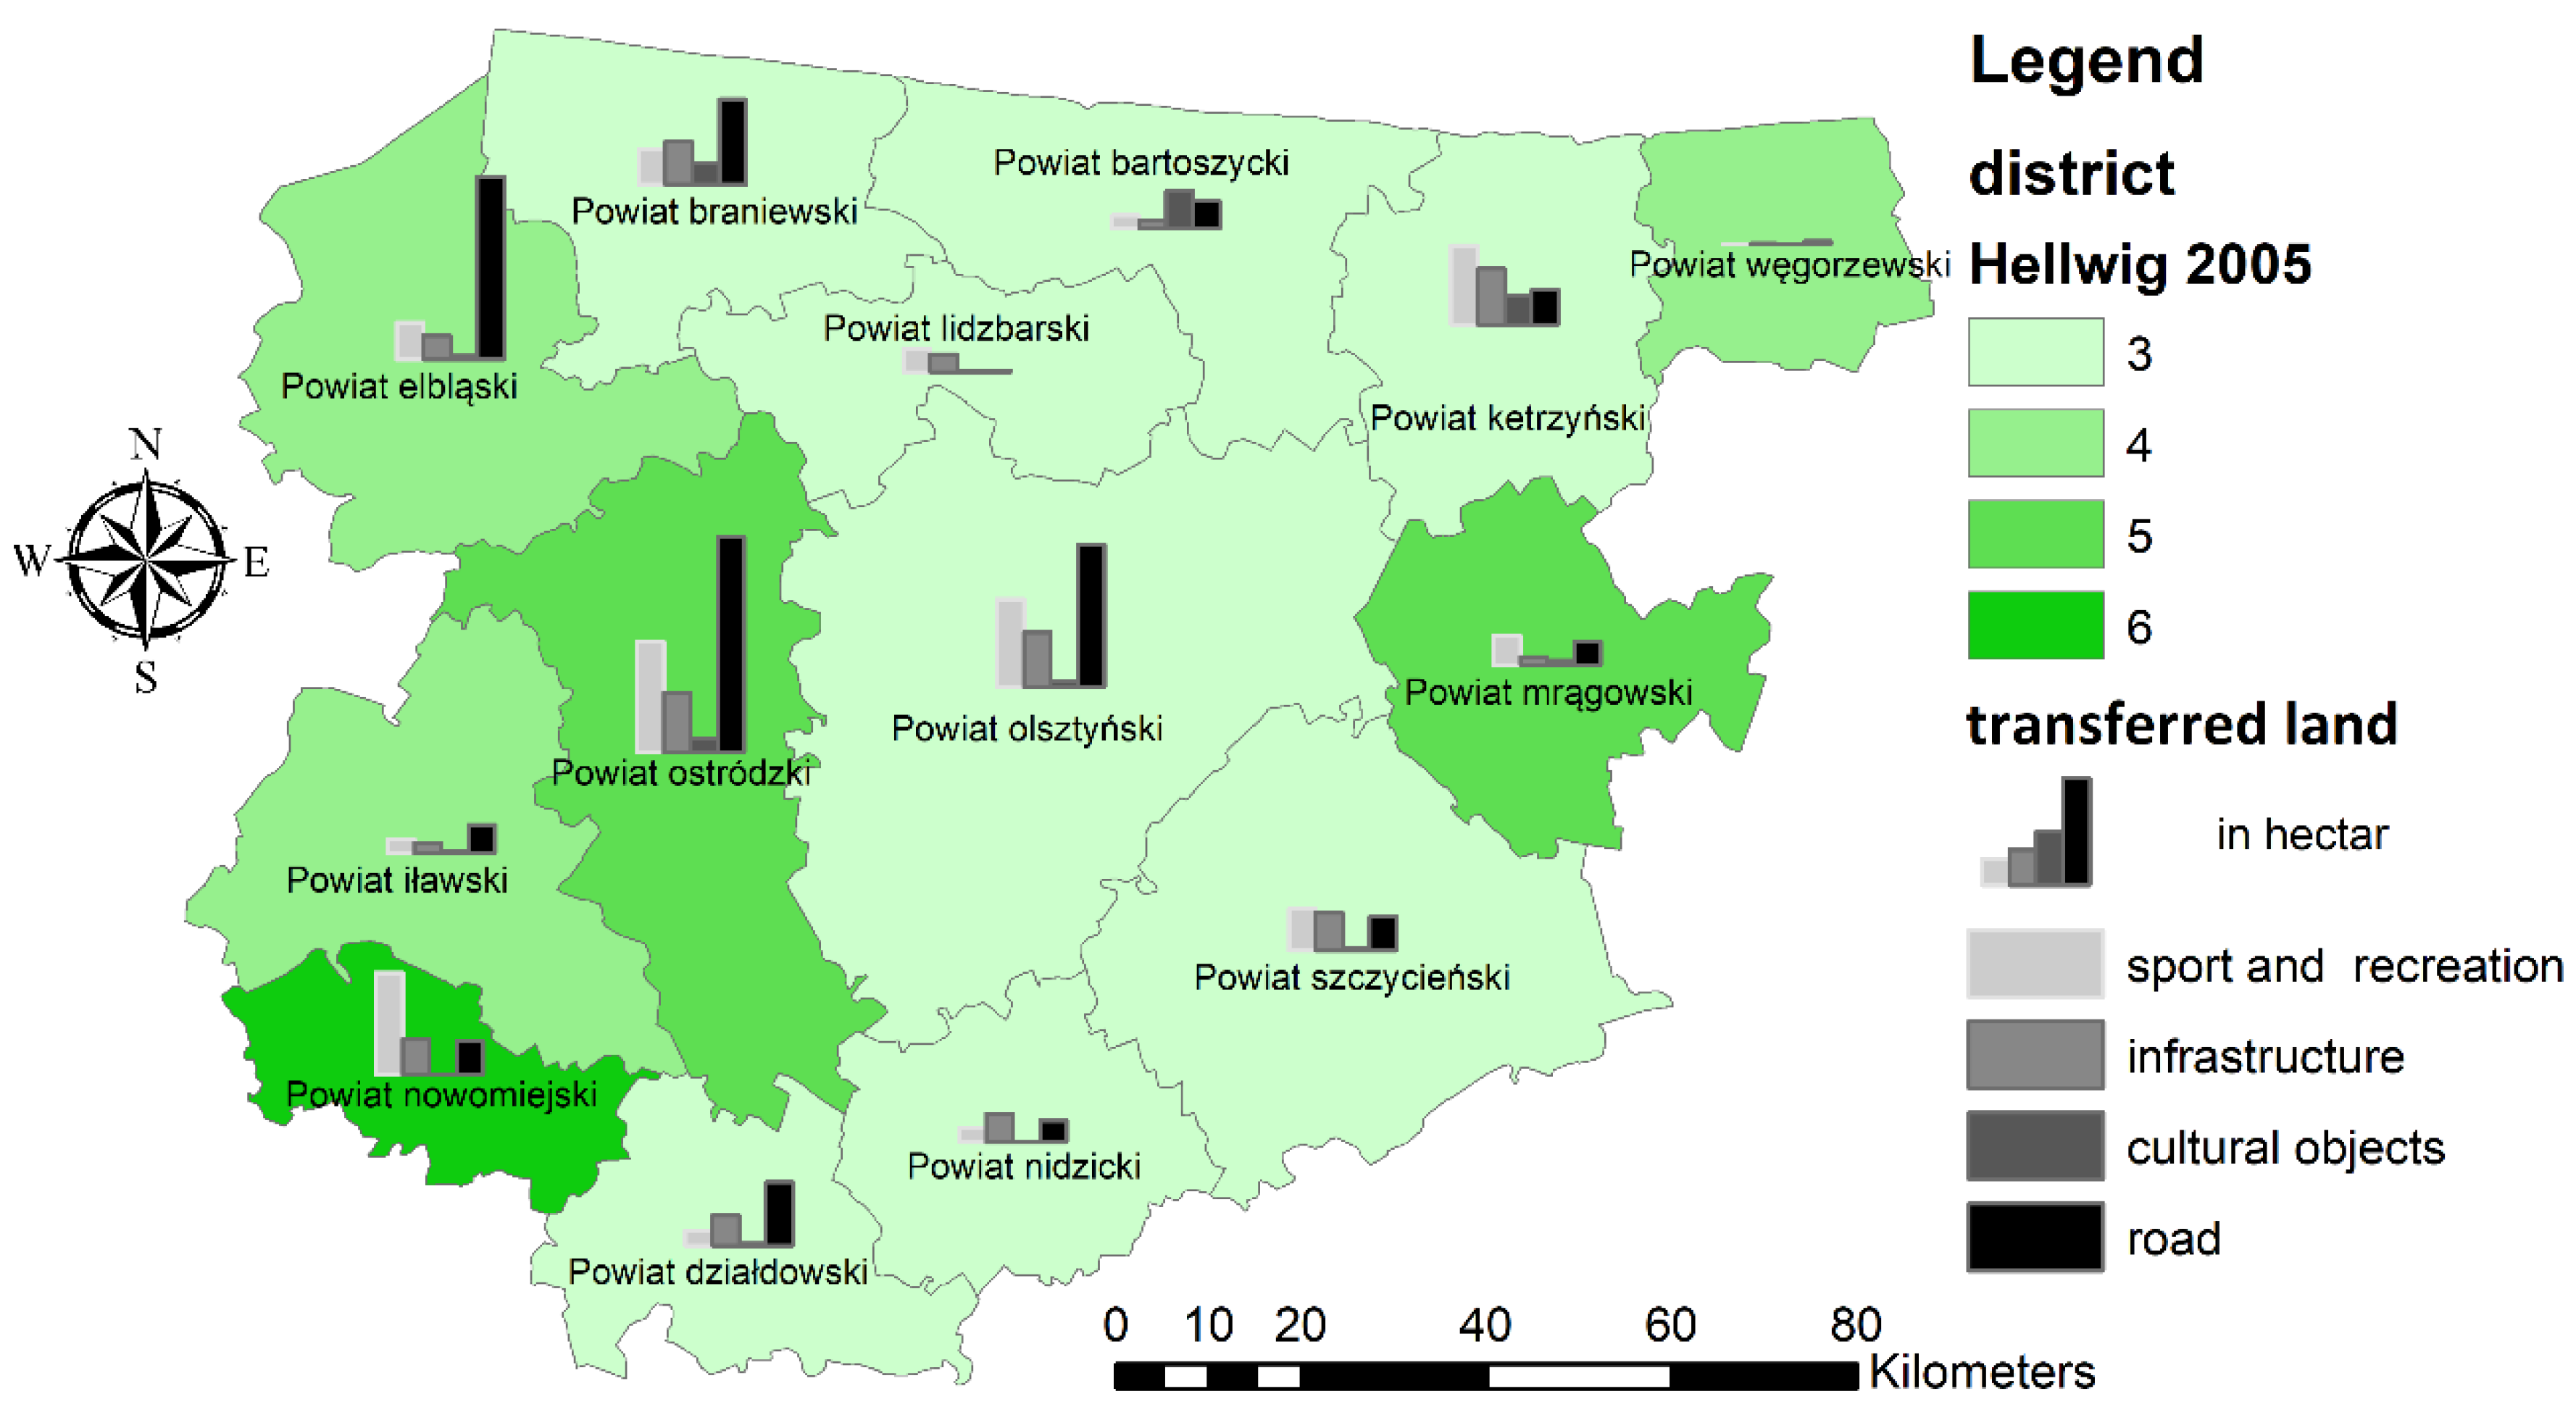
As part of the third stage of research, it was examined whether and to what extent the land transferred by NSCA RO Olsztyn to local government units had an impact on the level of social development of these units. For this purpose, the results obtained in the first stage (classes of social development) and the second stage (area of land transferred, with consideration of the specific purposes) were compared. The results for districts were displayed in the form of cartodiagrams shown in Figure 4, Figure 5 and Figure 6.
According to the described methodology, the Pearson correlation coefficient was calculated for various analysis variants. The obtained results for districts are presented in Table 4.
The obtained results allow us to conclude that the correlation of classes of the social development levels for 2005 calculated by the Hellwig method with the area of land transferred by NSCA is negative. An impact is visible, which is inversely proportional to the amount of land transferred. More land was transferred to districts with a lower level of social development. For 2018, the level of correlation is too low to speak of a clear impact of the land transferred on the level of social development. Therefore, this could indicate that the land transfer did not affect the level of social development for the studied area. However, by examining the correlation between the changes in the social development level classes for 2005 and 2018, the relationship is confirmed by a positive correlation. This means that the amount of land transferred by NSCA RO Olsztyn had an impact directly proportional to the achieved social changes. The more land area was transferred to a given district, the more the level of social development of a given district increased. Studies confirm that the participation and activities of NSCA RO Olsztyn were not accidental and its impact on rural development is visible and bears the mark of a well-planned procedure.
Figure 7, Figure 8 and Figure 9 show the visualization of results from the first and second stage of research for the analyzed communes.
Pearson correlation coefficient values obtained for communes are included in Table 5.
The obtained results indicate that, as in the case of districts, the correlation of total area of land transferred by NSCA with the classes of the social development level from 2005 is negative. This correlation is at level IV, i.e., a strong correlation. This confirms that NSCA RO Olsztyn supported areas, where social development was at a low level, required intervention. Despite the fact that, in the same way as in the case of 2005, in 2018, level I and level II of correlation were recorded (i.e., weak and very weak correlation), by examining the increases and decreases in social development by classes of the social development level. It can be concluded that the correlation is stronger for all data than for districts and for land transferred to sport and recreation. Results were obtained at the level of class III and IV correlation.
The value of the correlation of land transferred by NSCA to local government units with the level of social development among these units did not reach the highest level, but exceeded the authors’ expectations. Transfer of land from APS to local government units is one of many elements affecting the level of development of individual units. These elements include, above all, the level of absorption of EU funds, but also local environmental conditions and the efficiency of local authorities. The Warmian-Masurian Voivodship is a specific voivodship. On the one hand, it is agricultural, with a large share of rural areas. On the other hand, there is a large number of protected natural areas that limit the development of agricultural areas. In addition, plenty depends on the local authorities. If there are no applications for funding of various types of investment in a given area, it is hard to expect such areas to develop.
4. Discussion
The conducted research confirmed the validity of the research hypothesis. The obtained results show that the free transfer of land from the Agricultural Property Stock of the State Treasury and National Support Center for Agriculture to local government units for implementing social goals has an impact on the social development of rural areas. The methodology used is an original proposition not previously used by other researchers. The conducted research is completely original and fills the gap in the field of research on the social development of rural areas. Social aspects, according to the definition of sustainable development indicated in the Introduction, are one of the elements of sustainable development. The determination of the social development level of rural areas and the analyses carried out in the article are, thus, part of the research in the field of Sustainable Development of Rural Areas.
Authors are aware that an attempt to assess the level of social development itself may raise some doubts. Most studies of this type assess socio-economic development. However, due to the specifics of the research undertaken in the study (local conditions of the area, objectives of land transfer by NCSA), it was decided to choose indicators relating only to social development, and, thus, we attempted to assess only social elements. The answer to the question: whether the land transferring has influenced the broadly understood socio-economic development may contribute to further future research on this subject. It would only be necessary to significantly expand the number of diagnostic features, by supplementing it with typically economic ones. It would also require checking whether the local authorities carried out the intended investments on the transferred land (this also involves the efficiency of obtaining external sources of financing from the EU or the state budget). Such studies are planned in the future by the authors.
The conducted research allows us to formulate the following final conclusions, and summarize the obtained results.
- Determining the level of social development of rural areas using the Hellwig method confirms the universality of this method. The method can be successfully used to determine the level of economic or socio-economic development of the examined area. It can also be used for any administrative unit (in Poland: communes, districts, voivodships), as well as for analyses concerning entire countries.
- Low social development values of rural areas in the Warmian-Masurian Voivodship (most of the districts are in the medium-high level) is confirmed by the results of other authors using various assessment methods [48,49,50,51]. The Warmian-Masurian voivodship in Poland is usually below average, when comparing and assessing all voivodships of the country.
- Other factors could have also influenced the received correlation value. The authors have not obtained data on the distribution of all lands in the APS in the voivodship. There is a small chance that these lands are evenly distributed in all the districts and communes of the voivodship. It is possible that, in one of the districts or one of the communes, the area of land in APS was very low or very high. Since it constituted the basis for the transfer of land to local government units, this undoubtedly affected the amount of land transferred. Unfortunately, the authors did not have access to such data, as indicated above, and could not include it in the analyses.
- Other factors also influenced the amount of land transferred to local government units. The authors came across situations, where the land could not be transferred to communes for implementing social goals because of national defense. Such situations occurred due to the Warmian-Masurian Voivodship, and, thus, part of its districts and communes, borders with the Russian Federation. The land on the border is subject to special conditions, which limits the freedom of its development, especially if it concerns the EU external border. The amount of land transferred could also have been influenced by the factor mentioned in point 6, such as the efficiency of local authorities. NSCA may transfer land at the request of local government units, for implementing specific purposes. Some communes manage land more efficiently, while other communes manage land less efficiently.
- Conducting similar research in a broader scope (e.g., comparing the level of social development of rural areas in different countries) requires a reference to different definitions of these areas, used in other countries. However, it is possible after a certain standardization of the research area.
- The area of research was chosen partly due to the fact that the publication was created as part of the implementation of a research topic commissioned by NSCA RO Olsztyn, regarding specific indicated areas. However, the methodology presented in the article is universal. Using this method, any administrative area can be studied, and correlations with other factors can be sought. For example, the authors plan to conduct such studies to determine the impact of the absorption of EU funds on the development of rural areas in Poland.
- Authors also plan research in which they will compare the results of studies carried out in accordance with the methodology described with the results obtained using other methods. It can be particularly interesting to compare the results obtained from the classic taxonomic method with multi-criteria GIS (Geographic Information System) analysis in ArcGIS software. Such comparisons can be made for different areas (both administrative parts of a given country or different countries) and for different purposes (e.g., determining the level of urbanization, the level of agricultural development, or the level of sustainable development). In each case, a different set of variables describing the phenomenon will be required. The availability of reliable and current data can be a limitation in the wider application of this approach.
Author Contributions
Conceptualization, K.R., M.O., and R.Ź. Methodology, K.R., M.O., and R.Ź. Software, K.R., M.O., and R.Ź. Validation, K.R., M.O., and R.Ź. Formal analysis, K.R., M.O., and R.Ź. Investigation, K.R., M.O., and R.Ź. Resources, K.R., M.O., and R.Ź. Data curation, K.R., M.O., and R.Ź. Writing—original draft preparation, K.R., M.O., and R.Ź. Writing—review and editing, K.R., M.O., and R.Ź. Visualization, K.R., M.O., and R.Ź. Supervision, K.R., M.O., and R.Ź. Project administration, K.R., M.O., and R.Ź. Funding acquisition, K.R., M.O., and R.Ź.
Funding
The National Support Center for Agriculture Regional Office Olsztyn, grant “Analysis of current problems in managing the Agricultural Property Stock of the State Treasury” number 05/WFKIW/2019, funded this research.
Conflicts of Interest
The authors declare no conflict of interest. The funders had no role in the design of the study, in the collection, analyses, or interpretation of data, in the writing of the manuscript, or in the decision to publish the results.
References
- Główny Urząd Statystyczny Rocznik Statystyczny Rolnictwa; GUS: Warsaw, Poland, 2018; p. 151.
- Borawska, M.; Buciak, R.; Jankowski, Ł.; Lech, I.; Orleański, M.; Pytalska, A.; Wielechowska, K.; Wójcikowska-Rak, K. Obszary wiejskie w Polsce w 2016 r.; Morze, M., Rogalińska, D., Eds.; Główny Urząd Statystyczny Statistics Poland: Warszawa, Poland, 2017; ISBN 9788363285548. [Google Scholar]
- Cook, E. Agriculture, Forestry and Fishery Statistics 2018 Edition; Eurostat Publications Office of the European Union: Luxembourg, 2018; ISBN 9789279947582. [Google Scholar]
- Statistical Office of the European Communities Eurostat Regional Yearbook 2018. Eurostat Reg. Yearb. 2018 2018, 1, 216.
- Dmochowska, H. (Ed.) Obszary Wiejskie. Powszechny Spis Rolny 2010; Główny Urząd Statystyczny, Urząd Statystyczny w Olsztynie: Olsztyn, Poland, 2013; ISBN 978-83-88130-93-5. [Google Scholar]
- Rural 3.0. OECD: Paris, France, 2018; pp. 1–27. Available online: https://www.oecd.org/cfe/regional-policy/Rural-3.0-Policy-Note.pdf (accessed on 6 November 2019).
- Dijkstra, L.; Poelman, H. A Harmonised Definition of Cities and Rural Areas: The New Degree of Urbanisation. 2014, p. 28. Available online: https://ec.europa.eu/regional_policy/sources/docgener/work/2014_01_new_urban.pdf (accessed on 6 November 2019).
- Komisja Europejska. Mój Region, Moja Europa, Nasza przyszłość; Urząd Publikacji Unii Europejskiej: Luksemburg, 2017; ISBN 9789279718120. [Google Scholar]
- Delnicki, M.; Bielska, A.; Turek, A. Restrictions in Development of Rural Areas Resulting from Defective Structure of Cadastral Parcels. Geomat. Environ. Eng. 2019, 13, 17. [Google Scholar] [CrossRef]
- Salamon, J. Badania wielofunkcyjnego rozwoju obszarów wiejskich województwa świętokrzyskiego. Infrastrukt. i Ekol. Teren. Wiej. 2005, 145–155. [Google Scholar]
- Adamowicz, M.; Zwolińska-Ligaj, M. Koncepcja wielofunkcyjności jako element zrównoważonego rozwoju obszarów wiejskich. Sci. JOURNALS Warsaw Univ. Life Sci.–SGGW 2009, 2, 11–38. [Google Scholar]
- Wlazły, A. Zrównoważony rozwój obszarów wiejskich w aspekcie teorii wielofunkcyjności. Prog. Econ. Sci. 2018, 5, 65–94. [Google Scholar]
- Alkhalidi, A.; Qoaider, L.; Khashman, A.; Al-Alami, A.R.; Jiryes, S. Energy and Water as Indicators for Sustainable City SiteSelection and Design in Jordan using smart grid. Sustain. Cities Soc. 2018, 37, 125–132. [Google Scholar] [CrossRef]
- Antonopoulos, E. Sustainable Urban Development in Greece Using Integrated Territorial Investments. Eur. Struct. Invest. Funds J. 2018, 6, 28–34. [Google Scholar]
- Bell, S.; Morse, S. Routledge Handbook of Sustainability Indicators; Routledge: London, UK, 2018; ISBN 9781138674769. [Google Scholar]
- Act of 27 April 2001 Environmental Protection Law. 2001, Volume 62. Available online: https://www.global-regulation.com/translation/poland/10093814/the-act-of-27-april-2001%252c-the-environmental-protection-law.html (accessed on 6 November 2019).
- Act of 19 October 1991 on the Management of Agricultural Real Estate of the State Treasury; Kancelaria Sejmu: Warsaw, Poland, 1991.
- Podgórski, B.; Świętochowski, L. Gospodarowanie przez ANR Zasobem Własności Rolnej Skarbu Państwa. Wieś i Rol. 2015, 3, 157–172. [Google Scholar]
- Ogryzek, M.; Rząsa, K. The Social Aspects of Rural Development Policy. In Proceedings of the 8th International Scientific Conference Rural Development, Akademija, Lithuania, 23–24 November 2017; Raupelienė, A., Ed.; Aleksandras Stulginskis University: Kaunas, Lithuania, 2017; pp. 1232–1237. [Google Scholar]
- Rząsa, K.; Ogryzek, M. Social aspects of rural development. Balt. Surv. 2017, 7, 42–49. [Google Scholar]
- Ogryzek, M.P.; Rząsa, K.; Ciski, M. The role of the National Support Centre for Agriculture in the process of revitalization and renewal of the rural areas. J. Water L. Dev. 2019, 42, 143–149. [Google Scholar] [CrossRef] [Green Version]
- Zawisza, S.; Pachut, T. Wpływ integracji z Unią Europejską na rozwój obszarów wiejskich gminy Nowa Wieś Wielka. Rocz. Nauk. Stowarzyszenia Ekon. Rol. i Agrobisnesu 2015, XVII, 361–366. [Google Scholar]
- Kacprzak, E.; Kołodziejczak, A. (Eds.) Studia Obszarów Wiejskich, tom XXIV: Rola środków Unii Europejskiej w rozwoju obszarów wiejskich [The Role Of EU Funds In Rural Areas Development]; Komisja Obszarów Wiejskich Polskie Towarzystwo Geograficzne Zespół Badań Obszarów Wiejskich Instytut Geografii i Przestrzennego Zagospodarowania im. Stanisława Leszczyckiego PAN: Warszawa, Poland, 2010; ISBN 978-83-62089-14-7. [Google Scholar]
- Karwat-Woźniak, B. Wpływ wybranych instrumentów Wspólnej Polityki Rolnej na umacnianie i spowalnianie procesów rozwojowych w polskim rolnictwie. Nierówności Społeczne a Wzrost Gospod. 2019, 57, 304–315. [Google Scholar] [CrossRef]
- Stec, M. Analiza porównawcza rozwoju społeczno-gospodarczego powiatów województwa podkarpackiego. Nierówności społeczne a wzrost Gospod. 2012, 180–190. [Google Scholar]
- Podstawka, M.; Suchodolski, B. Assessment of the level of economic and social development of regions using the Hellwig taxonomic development measure. In Proceedings of the VII International Scientific Determinants of Regional Development, Pila, Poland, 12–13 April 2018. [Google Scholar]
- Dorożyński, T.; Dobrowolska, B.; Kuna-Marszałek, A. Institutional Quality As A Determinant of FDI Inflow: The case of Central and Eastern European Countries. J. Manag. Finans. Sci. 2019, XII, 103–122. [Google Scholar]
- Pomianek, I. Poziom Rozwoju Społeczno-Gospodarczego Obszarów Wiejskich Województwa Warmińsko-Mazurskiego. Acta Sci. Pol. Oeconomia. 2010, 9, 227–239. [Google Scholar]
- Łogwiniuk, K. The use of taxonomic methods in the comparative analysis of the access to the ICT infrastructure by schoolchildren in Poland. Econ. Manag. 2011, 1, 7–23. [Google Scholar]
- Sołek, K.; Sowa, B. Diversification of the Social Development of Podkarpackie Province Communes. Econ. Reg. Stud./Stud. Ekon. i Reg. 2019, 12, 45–55. [Google Scholar] [CrossRef] [Green Version]
- Niemczyk, A. Poziom rozwoju społecznego w nowym układzie administracyjnym Polski. Przegląd Stat. 2001, 48, 289–300. [Google Scholar]
- Ziemiańczyk, U. Ocena poziomu rozwoju społeczno-gospodarczego gmin wiejskich i miejsko-wiejskich w województwie małopolskim. Infrastrukt. i Ekol. Teren. Wiej. 2010, 14, 31–40. [Google Scholar]
- Jaworska, M.; Luty, L. Ocena rozwoju społeczno-gospodarczego powiatów województwa małopolskiego. Acta Sci. Pol. Oeconomia 2009, 8, 37–44. [Google Scholar]
- Dane wg stan una 2019.11.14. Available online: https://bdl.stat.gov.pl/BDL/dane/podgrup/temat (accessed on 6 November 2019).
- Hellwig, Z. Zastosowanie metody taksonomicznej do typologicznego podziału krajów ze względu na poziom rozwoju i strukturę kwalifikowanych kadr. Przegląd Stat. 1968, 4, 324. [Google Scholar]
- Nowak, E. Metody Taksonomiczne w Klasyfikacji Obiektów Społeczno-Gospodarczych; PWE Warszawa: Warsaw, Poland, 1990. [Google Scholar]
- Cohen, J. Statistical Power Analysis for the Behavioral Sciences; Lawrance Erlbaum Associates: New York, NY, USA, 1988; ISBN 0805802835. [Google Scholar]
- Buda, A.; Jarynowski, A. Life-Time of Correlations and Its Applications; Wydawnictwo Niezależne: Glogow, Poland, 2010; Volume 1. [Google Scholar]
- Guilford, J. Fundamental Statistics in Psychology and Education. Wiley Online Library, 1965. Available online: https://onlinelibrary.wiley.com/doi/abs/10.1002/sce.3730410357 (accessed on 6 November 2019).
- Cetera, W.; Grzegorek, J.; Suskiewicz, M.; Ziewiec, B. Dynamika Rozwoju Mediów i Poligrafii. 2014. Available online: https://www.researchgate.net/publication/274695226_Dynamika_rozwoju_mediow_i_poligrafii (accessed on 8 November 2019).
- Ogryzek, M.; Ciski, M. Cartographic Methods of Presentation the Average Transaction Prices of the Undeveloped Land. Civ. Environ. Eng. Rep. 2018, 28, 85–100. [Google Scholar] [CrossRef] [Green Version]
- Pasławski, J.; Horodyski, B. Wprowadzenie do kartografii i topografii; Wydawnictwo Nowa Era: Wroclaw, Poland, 2006; ISBN 9788374092296. [Google Scholar]
- Pasławski, J. Uwagi o klasyfikacji ilościowych form prezentacji kartograficznej. Pol. Przegląd Kartogr. 2005, 37, 95–100. [Google Scholar]
- Ogryzek, M. Parametric evaluation of the quality of estimation of maps developed by geostatistical methods. Stud. i Pr. WNEiZ 2018. [Google Scholar] [CrossRef]
- Ogryzek, M.P. Interdyscyplinarny Charakter Technologii. GIS w Praktyce; Texter: Waraw, Poland, 2015; ISBN 9788377907917. [Google Scholar]
- De Smith, M.J.; Goodchild, M.F.; Longley, P. Geospatial Analysis: A Comprehensive Guide to Principles, Techniques and Software Tools; Troubador Publishing Ltd.: Leicester, UK, 2018; ISBN 1912556030. [Google Scholar]
- Rozporządzenie Rady Ministrów w Sprawie Rodzajów Kartograficznych Opracowań Tematycznych i Specjalnych; Rada Ministrow: Warsaw, Poland, 2011.
- Michoń, D. Zróżnicowanie rozwoju społeczno-gospodarczego województw ze względu na realizację celów polityki spójności. Wiadomości Stat. 2017, 12, 80–94. [Google Scholar]
- Hozer-Koćmiel, M. Ocena rozwoju społeczno-ekonomicznego województw za pomocą HDI. Wiadomości Stat. 2018, 3, 40–49. [Google Scholar]
- Drabarczyk, K. Zrównoważony Rozwój Województw–Analiza Porównawcza. Zesz. Nauk. Politech. Częstochowskiej Zarządzanie 2017, 25, 23–34. [Google Scholar] [CrossRef]
- Stec, M. Analiza poziomu rozwoju społeczno-gospodarczego województw Polski z uwględnieniem dokładności danych statystycznych. Humanit. Soc. Sci. 2018, XXIII, 245–258. [Google Scholar]
Figure 1.
The research area.

Figure 2.
Area of transferred land, with the purpose of the transfer (districts) [in ha].

Figure 3.
Area of transferred land, with the purpose of the transfer (communes) [in ha].

Figure 4.
Social development classes for 2005 compared with the area of land transferred for various purposes. Data for districts.
Figure 4.
Social development classes for 2005 compared with the area of land transferred for various purposes. Data for districts.

Figure 5.
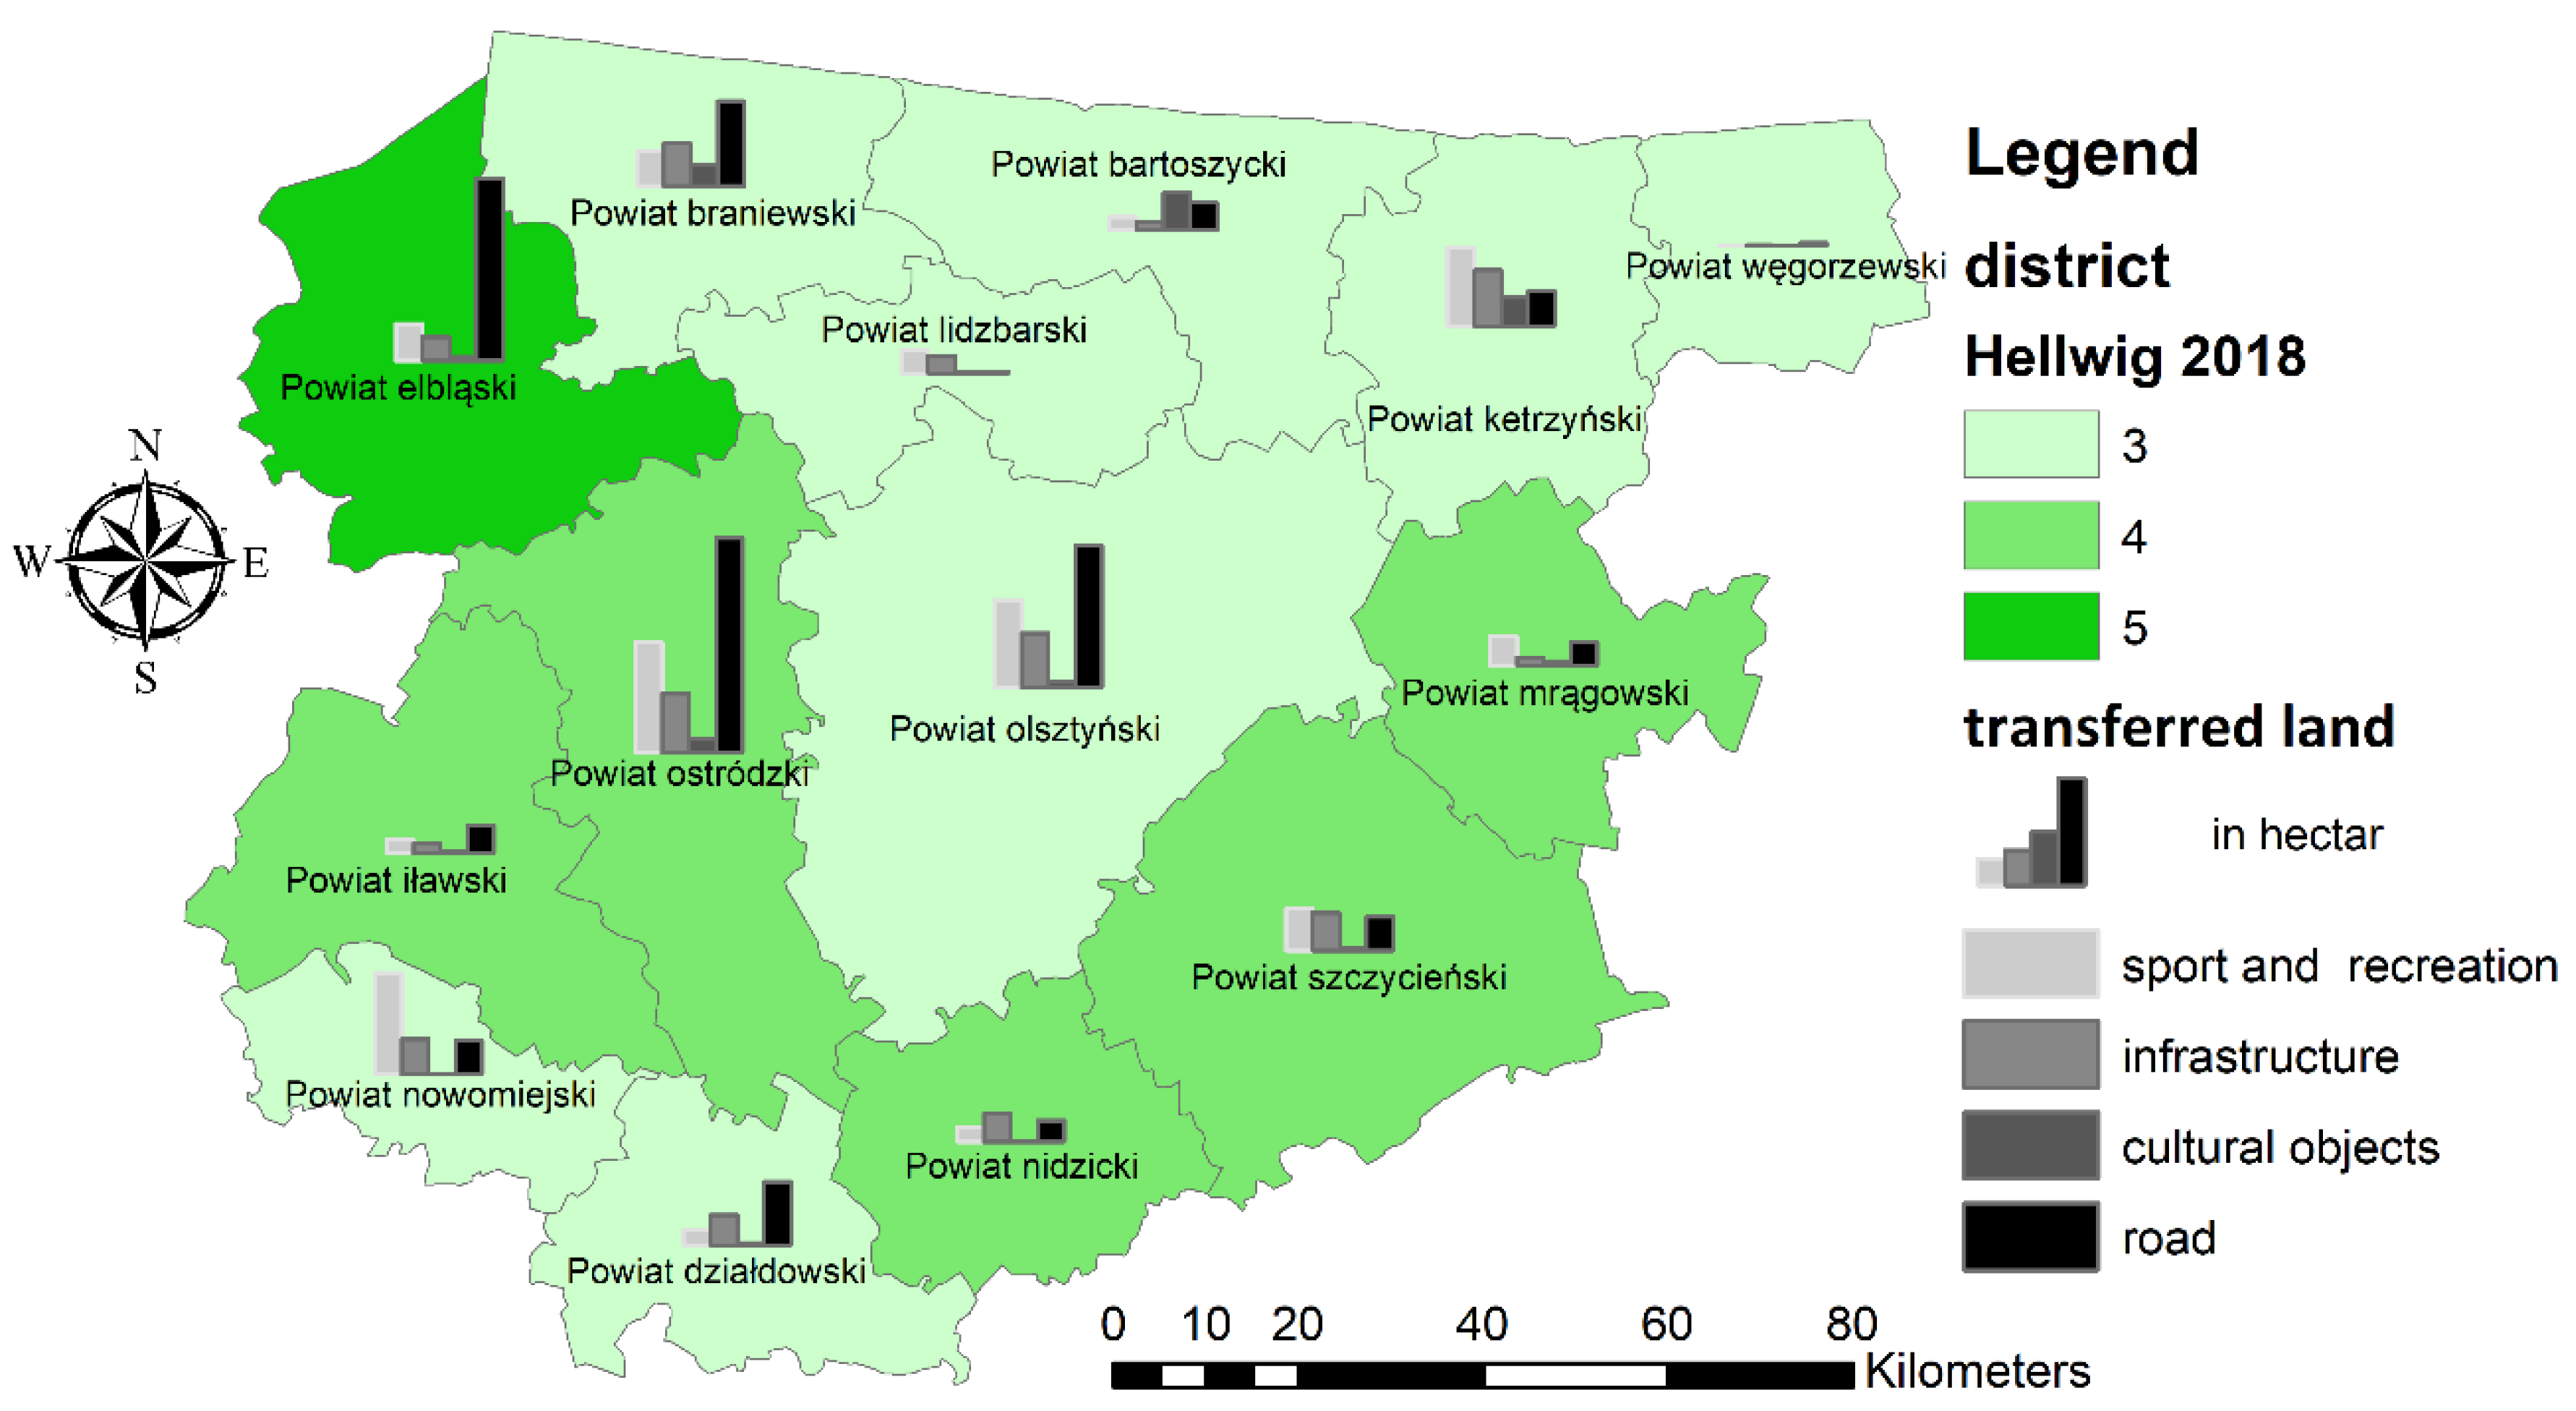
Social development classes for 2018 compared with the area of land transferred for various purposes. Data for districts.
Figure 5.
Social development classes for 2018 compared with the area of land transferred for various purposes. Data for districts.

Figure 6.
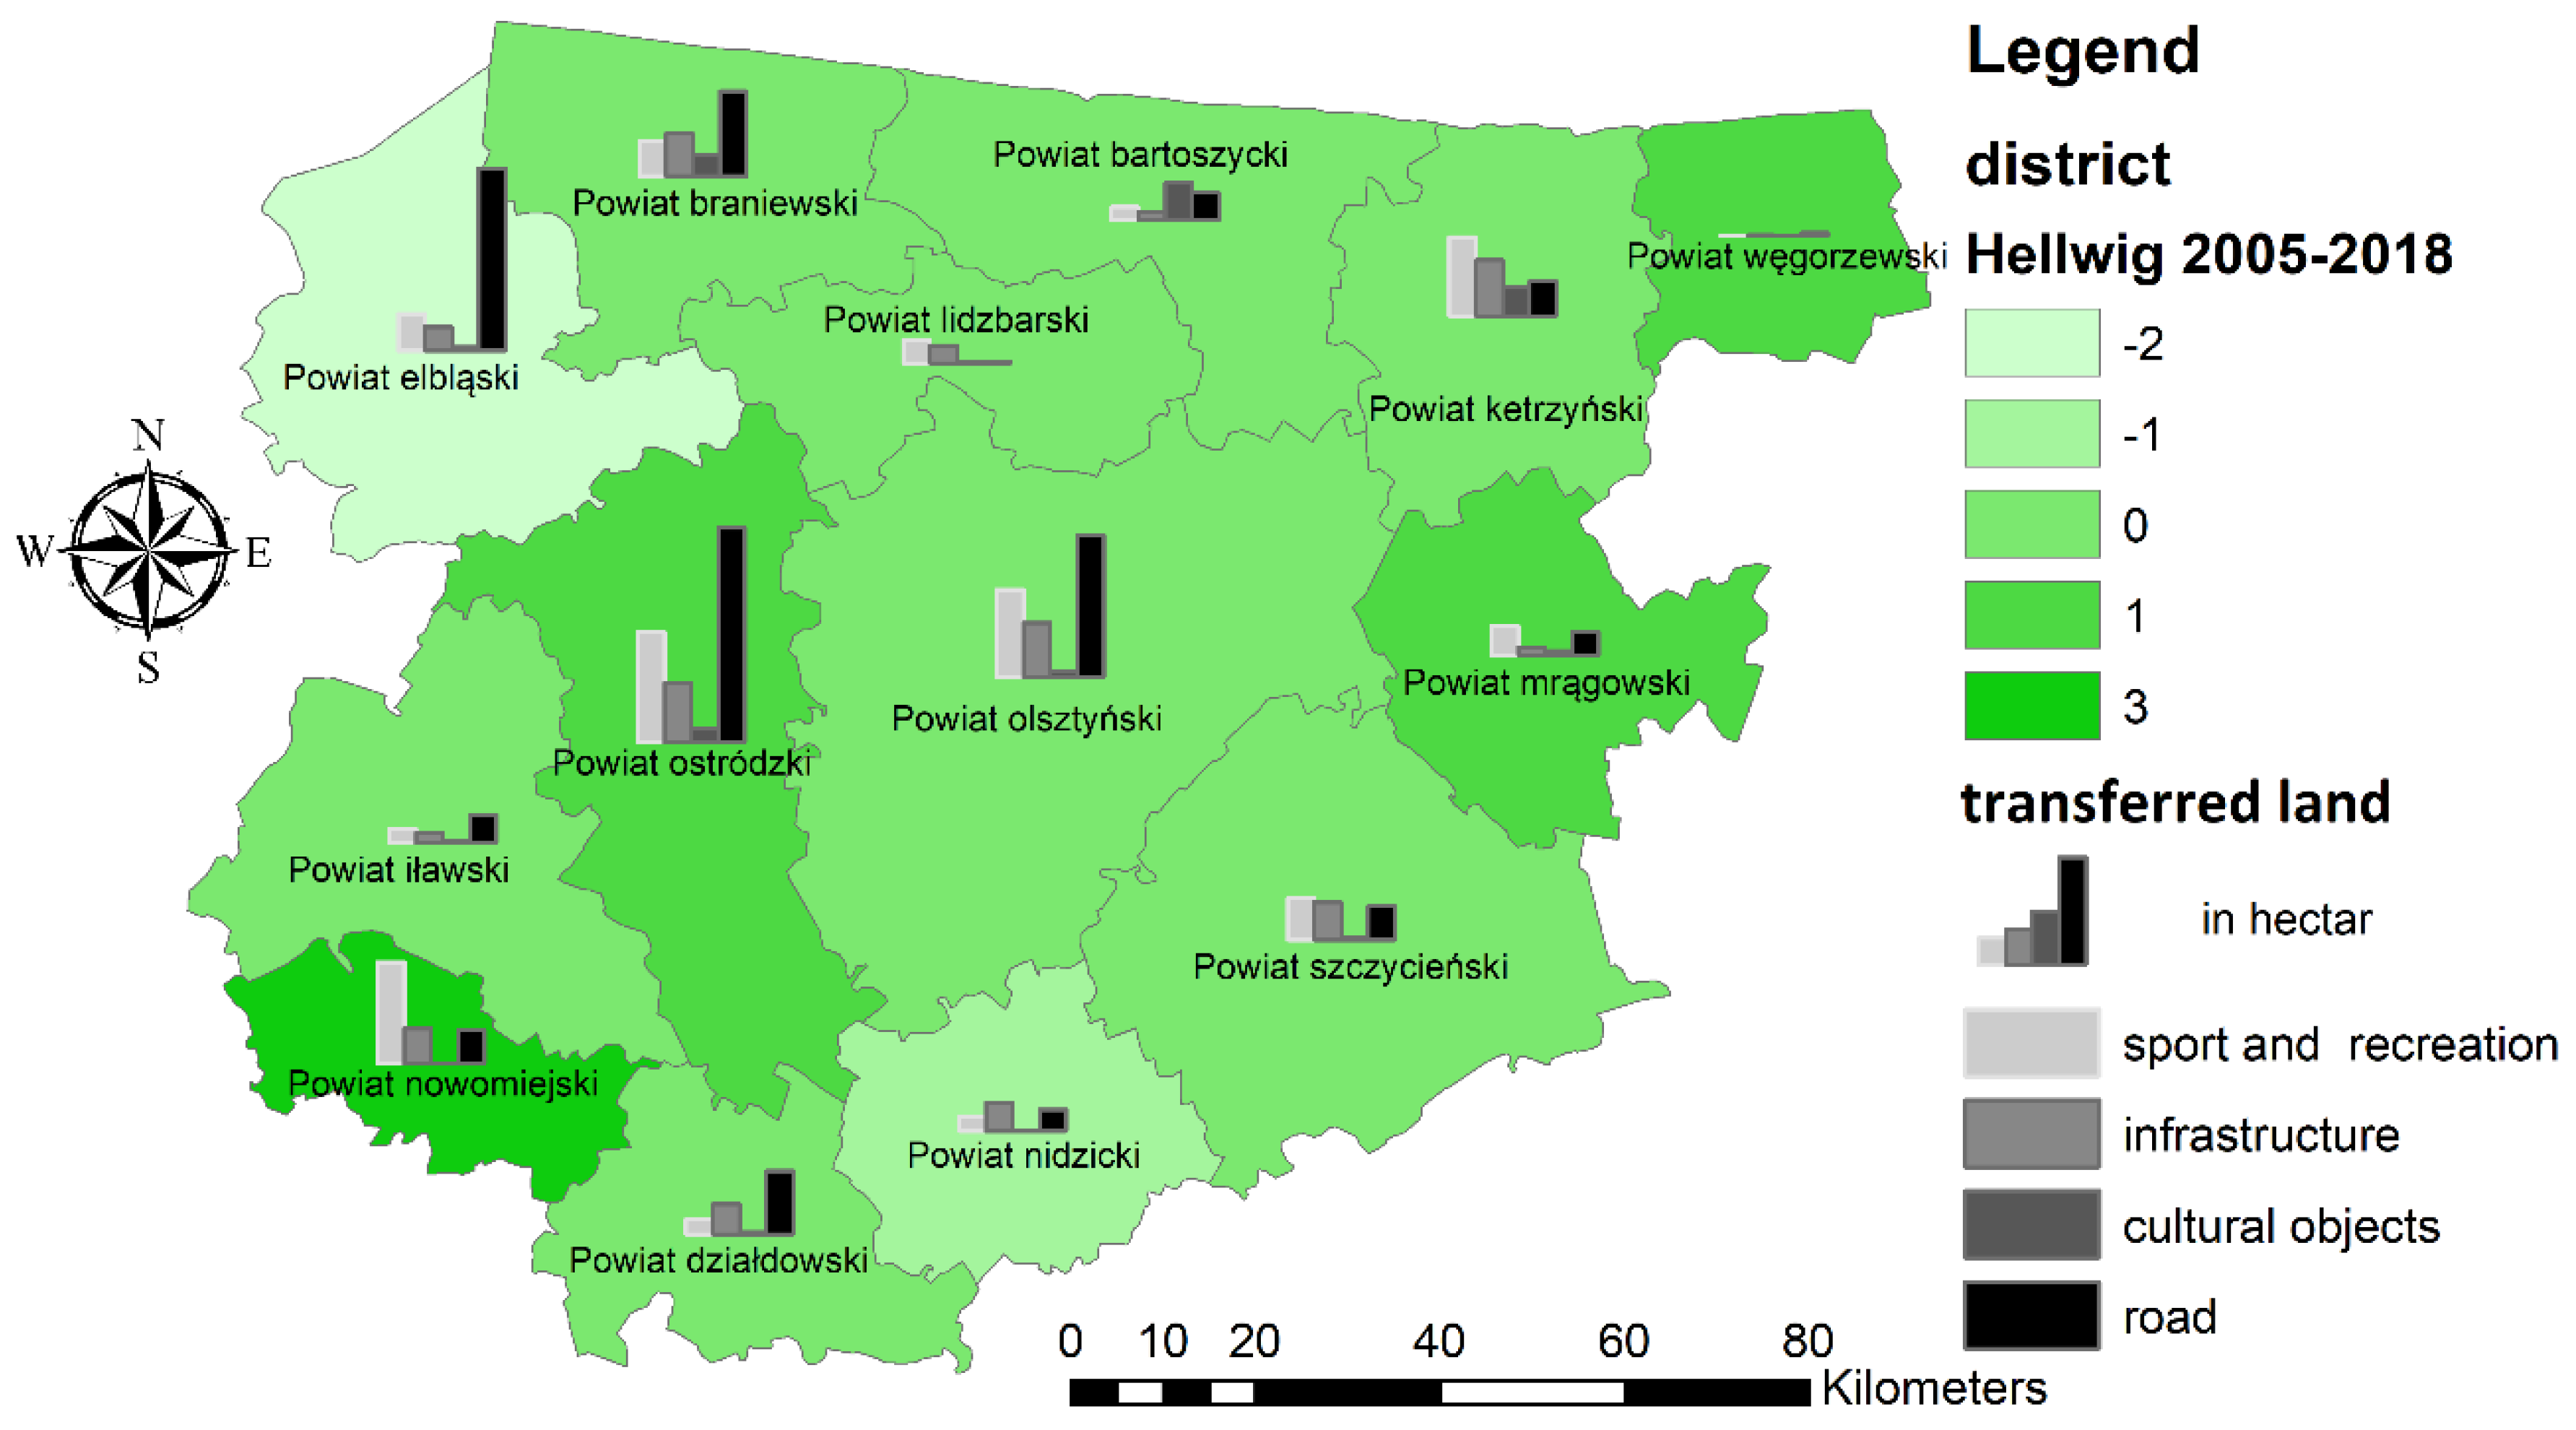
Change in the social development classes in the period 2005-2018 compared to the area of land transferred for various purposes. Data for districts.
Figure 6.
Change in the social development classes in the period 2005-2018 compared to the area of land transferred for various purposes. Data for districts.

Figure 7.
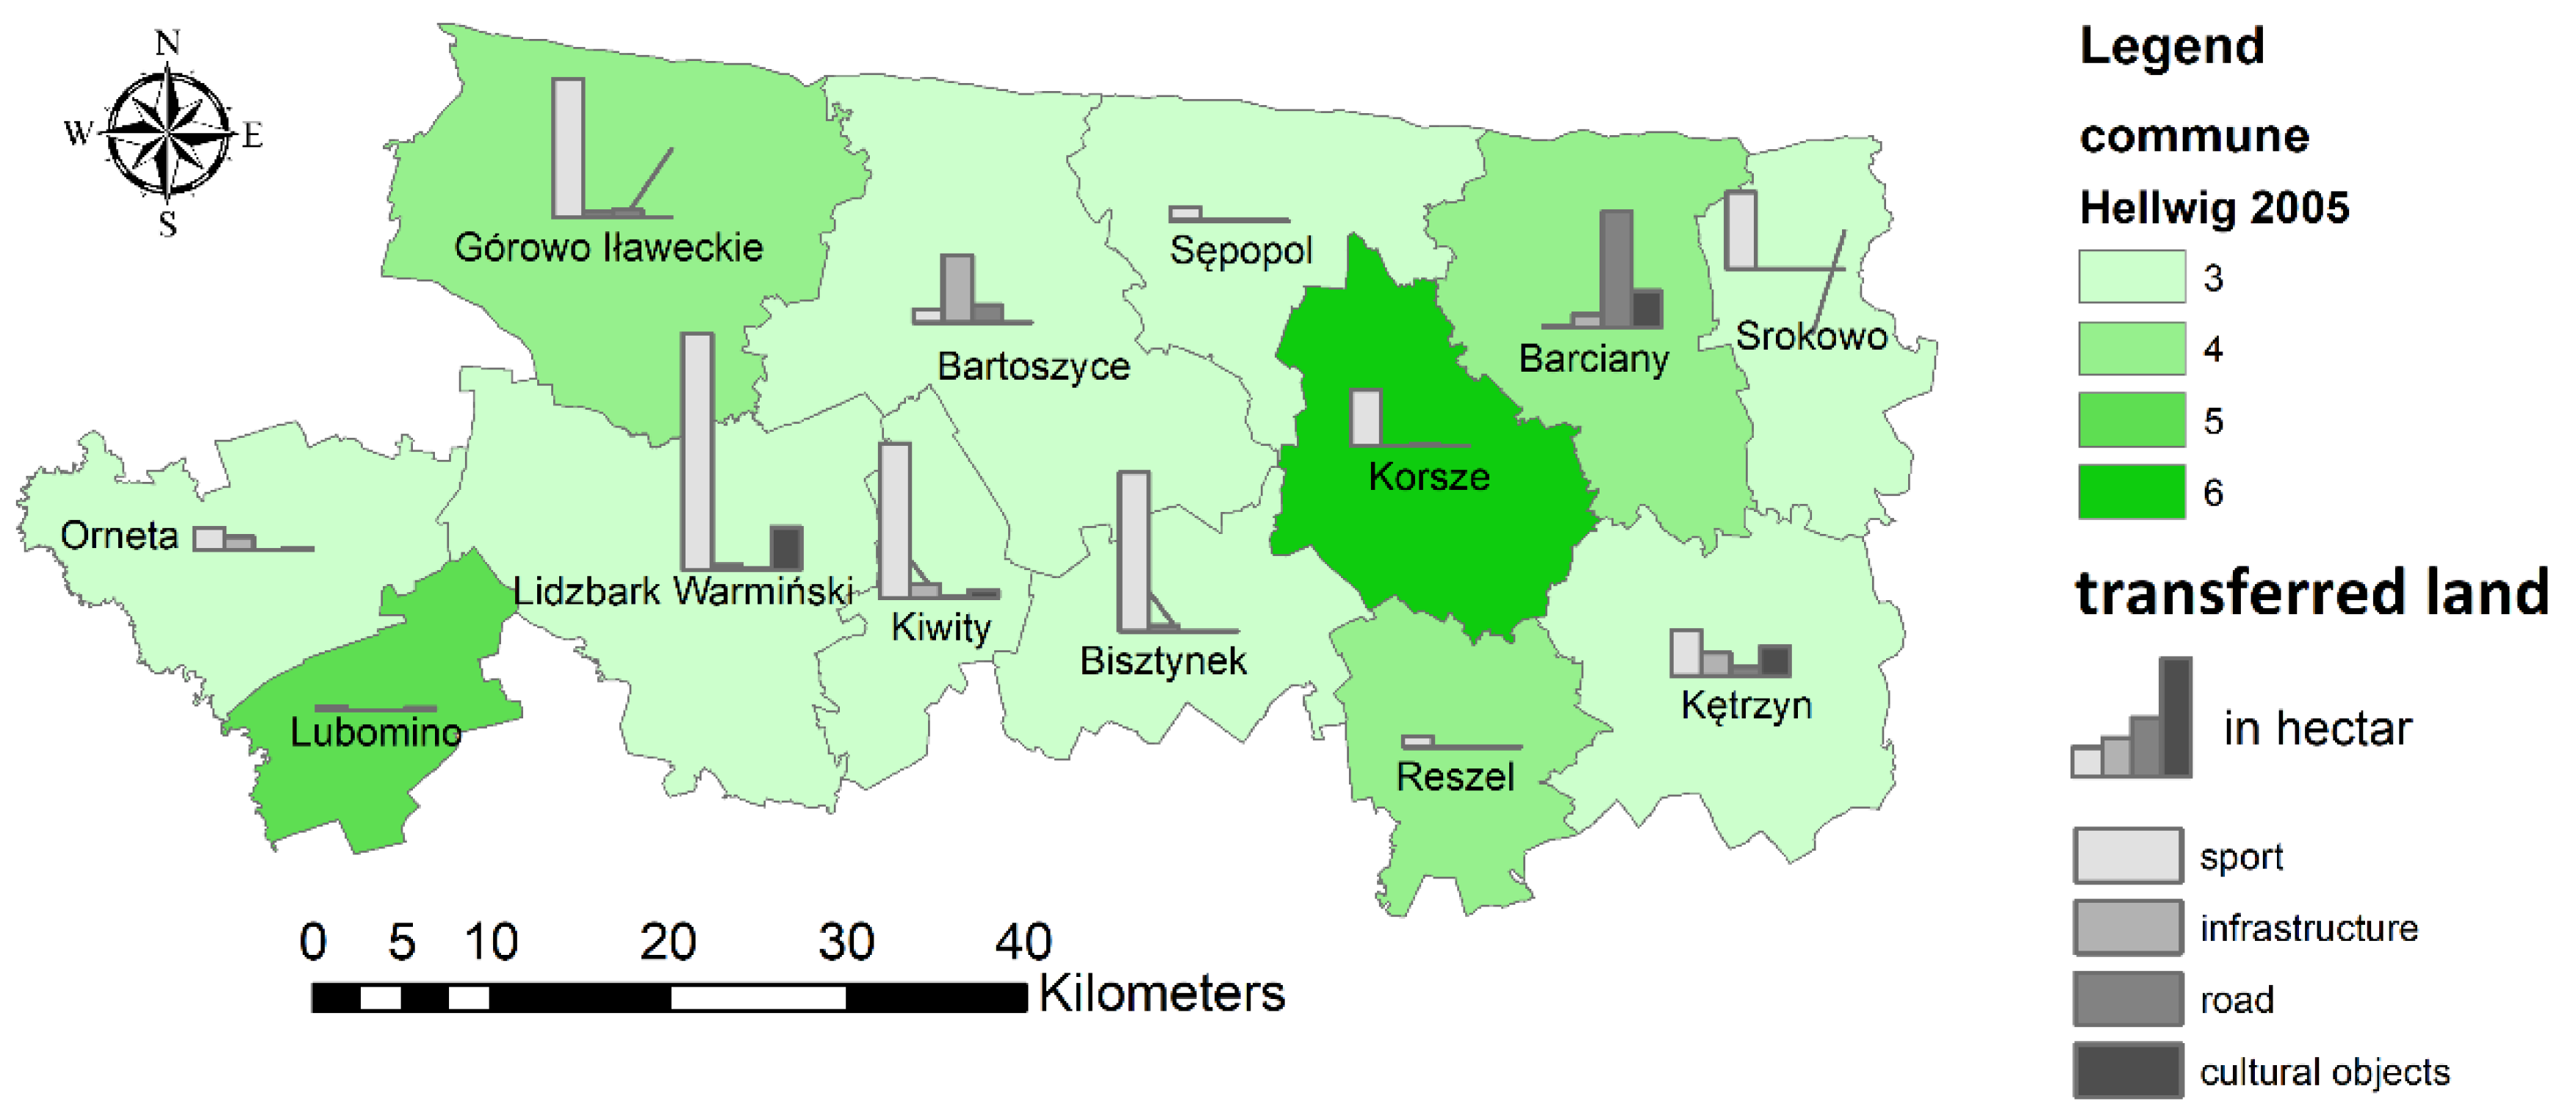
Social development classes for 2005 in comparison with the area of land transferred for various purposes. Data for communes.
Figure 7.
Social development classes for 2005 in comparison with the area of land transferred for various purposes. Data for communes.

Figure 8.
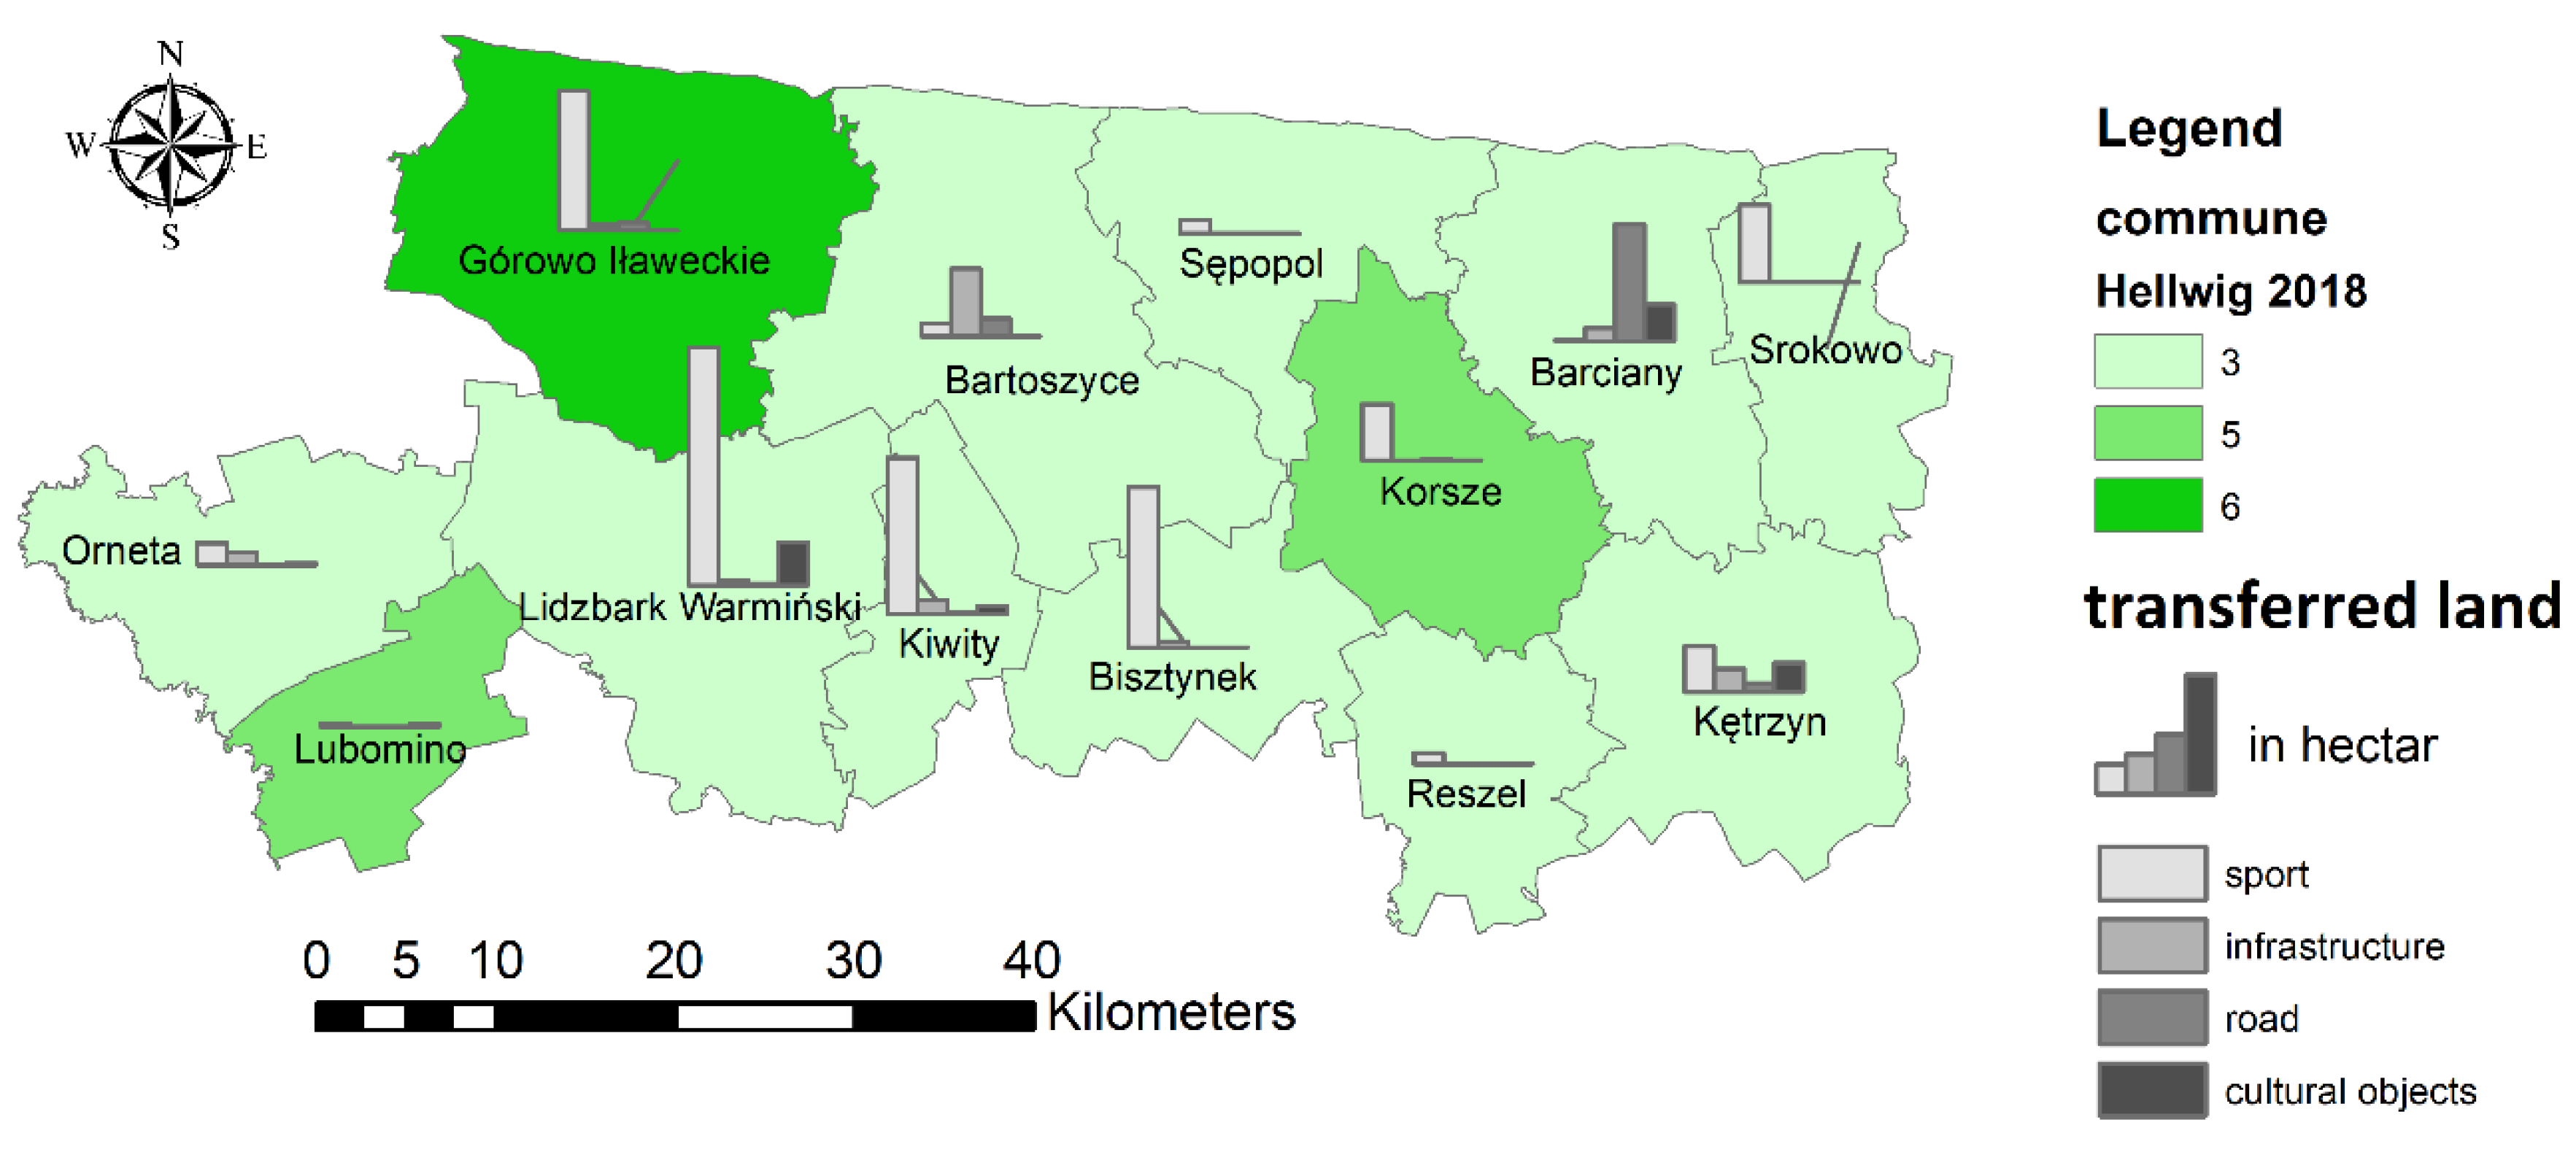
Social development classes for 2018 in comparison with the area of land transferred for various purposes. Data for communes.
Figure 8.
Social development classes for 2018 in comparison with the area of land transferred for various purposes. Data for communes.

Figure 9.
Change in the social development classes in the period from 2005–2018 compared to the area of land transferred for various purposes. Data for communes.
Figure 9.
Change in the social development classes in the period from 2005–2018 compared to the area of land transferred for various purposes. Data for communes.


Table 1.
Diagnostic variables used in the research.
| Symbol | Diagnostic Variables (Expressed as Indicators) |
|---|---|
| X1 | population per 1 km2 |
| X2 | rate of natural increase |
| X3 | net migration rate |
| X4 | population change per 1000 inhabitants |
| X5 | demographic dependency ratio (non-working age population per 100 persons of working age) |
| X6 | amount of dwelling allowances paid out per 1000 inhabitants |
| X7 | registered unemployment per 1000 inhabitants |
| X8 | water supply network/100 km2 |
| X9 | sewerage network/100 km2 |
| X10 | persons using water supply network in the percent of the total population |
| X11 | persons using sewerage network in the percent of the total population |
| X12 | population connected to wastewater treatment plants per 1000 inhabitants |
| X13 | number of museums, including branches per 1000 inhabitants |
| X14 | number of centers of culture, cultural centers and establishments, clubs, and community centers per 1000 inhabitants |
| X15 | population per library (including library service points presented according to the location of the main unit) |
| X16 | number of pharmacies per 1000 inhabitants |
| X17 | expenditures of communes per capita |
| X18 | stationary social welfare facilities (including branches) per 1000 inhabitants |
| X19 | places in stationary social welfare facilities (including branches) per 1000 inhabitants |
| X20 | enrollment rates (primary education) |
| X21 | children in preschool education establishments, per 1000 children aged 3–5 years |
Table 2.
Determining the level of social development for the analyzed districts.
| District | Year 2005 | Year 2018 | Change of the Class 2005–2018 | ||
|---|---|---|---|---|---|
| di | Development Class | di | Development Class | ||
| Bartoszyce | 0.9965141 | 3 | 0.9810698 | 3 | 0 |
| Braniewo | 0.9864988 | 3 | 0.9862427 | 3 | 0 |
| Działdowo | 0.9956589 | 3 | 0.9780275 | 3 | 0 |
| Elbląg | 0.8856022 | 4 | 0.5769169 | 6 | −2 |
| Ełk | 0.9926279 | 3 | 0.9873135 | 3 | 0 |
| Giżycko | 0.8680106 | 5 | 0.8495796 | 4 | +1 |
| Gołdap | 0.9491705 | 3 | 0.9926632 | 3 | 0 |
| Iława | 0.8874945 | 4 | 0.8663468 | 4 | 0 |
| Kętrzyn | 0.9994932 | 3 | 0.9995063 | 3 | 0 |
| Lidzbark | 0.9837612 | 3 | 0.9999118 | 3 | 0 |
| Mrągowo | 0.8604135 | 5 | 0.8807701 | 4 | +1 |
| Nidzica | 0.9476588 | 3 | 0.8901694 | 4 | −1 |
| Nowe Miasto | 0.7825811 | 6 | 0.9526216 | 3 | +3 |
| Olecko | 0.9996114 | 3 | 0.9705819 | 3 | 0 |
| Olsztyn | 0.9607827 | 3 | 0.9491993 | 3 | 0 |
| Ostróda | 0.8564616 | 5 | 0.9205355 | 4 | +1 |
| Pisz | 0.9464139 | 3 | 0.8953722 | 4 | −1 |
| Szczytno | 0.999539 | 3 | 0.9901888 | 3 | 0 |
| Węgorzewo | 0.9134627 | 4 | 0.9827357 | 3 | +1 |
Table 3.
Determining the level of social development for the analyzed communes.
| Commune | Year 2005 | Year 2018 | Change of the Class 2005–2018 | ||
|---|---|---|---|---|---|
| di | Development Class | di | Development Class | ||
| Barciany | 0.987195 | 3 | 0.9494804 | 3 | 0 |
| Bartoszyce | 0.9931615 | 3 | 0.9984152 | 3 | 0 |
| Bisztynek | 0.572102 | 6 | 0.7859537 | 5 | +1 |
| Górowo Iławeckie | 0.7945408 | 4 | 0.9353275 | 3 | +1 |
| Kętrzyn | 0.9769076 | 3 | 0.9324293 | 3 | 0 |
| Kiwity | 0.7684789 | 4 | 0.9355227 | 3 | +1 |
| Korsze | 0.9659991 | 3 | 0.978147 | 3 | 0 |
| Lidzbark Warmiński | 0.6509306 | 5 | 0.7823379 | 5 | 0 |
| Lubomino | 0.9956648 | 3 | 0.9856814 | 3 | 0 |
| Orneta | 0.9965788 | 3 | 0.9706776 | 3 | 0 |
| Reszel | 0.819355 | 4 | 0.703563 | 6 | −2 |
| Sępopol | 0.9089322 | 3 | 0.9608067 | 3 | 0 |
| Srokowo | 0.9981593 | 3 | 0.9997694 | 3 | 0 |
Table 4.
Pearson correlation coefficient values for all analysis variants/districts.
| Hellwig 2005 | Hellwig 2018 | Hellwig 2005–2018 | |
|---|---|---|---|
| Total area | −0.26 | 0.08 | 0.29 |
| Sport and recreation | −0.56 | −0.02 | 0.48 |
| Infrastructure | −0.12 | 0.31 | 0.34 |
| Cultural objects | 0.14 | 0.03 | 0.10 |
| Roads | −0.01 | 0.06 | 0.06 |
Table 5.
Pearson correlation coefficient values for all analysis variants/communes.
| Hellwig 2005 | Hellwig 2018 | Hellwig 2005–2018 | |
|---|---|---|---|
| Total area | −0.51 | −0.13 | 0.56 |
| Sport and recreation | −0.72 | −0.34 | 0.51 |
| Infrastructure | 0.20 | 0.25 | 0.08 |
| Cultural objects | 0.23 | 0.30 | 0.19 |
| Roads | 0.25 | 0.20 | 0.01 |
© 2019 by the authors. Licensee MDPI, Basel, Switzerland. This article is an open access article distributed under the terms and conditions of the Creative Commons Attribution (CC BY) license (http://creativecommons.org/licenses/by/4.0/).
Share and Cite
MDPI and ACS Style
Rząsa, K.; Ogryzek, M.; Źróbek, R. The Land Transfer from the State Treasury to Local Government Units as a Factor of Social Development of Rural Areas in Poland. Land 2019, 8, 170. https://0-doi-org.brum.beds.ac.uk/10.3390/land8110170
AMA Style
Rząsa K, Ogryzek M, Źróbek R. The Land Transfer from the State Treasury to Local Government Units as a Factor of Social Development of Rural Areas in Poland. Land. 2019; 8(11):170. https://0-doi-org.brum.beds.ac.uk/10.3390/land8110170
Chicago/Turabian StyleRząsa, Krzysztof, Marek Ogryzek, and Ryszard Źróbek. 2019. "The Land Transfer from the State Treasury to Local Government Units as a Factor of Social Development of Rural Areas in Poland" Land 8, no. 11: 170. https://0-doi-org.brum.beds.ac.uk/10.3390/land8110170
Note that from the first issue of 2016, this journal uses article numbers instead of page numbers. See further details here.