Changes in Farmland Ownership in Oregon, USA


Nohad A. Toulan School of Urban Studies and Planning: Center for Urban Studies, Portland State University, Portland, OR 97211, USA
Land 2019, 8(3), 39; https://0-doi-org.brum.beds.ac.uk/10.3390/land8030039
Submission received: 8 February 2019
/
Revised: 20 February 2019
/
Accepted: 21 February 2019
/
Published: 26 February 2019
Abstract
:The ownership of agricultural land has important implications for food systems, the environment, farmer livelihoods, and rural economies, communities, and landscapes. This article examines the changing ownership of agricultural lands in the United States, specifically focusing on Oregon, a state with a history of family farm ownership. I first review historical and recent trends in farmland ownership, including private enclosure, consolidation, investor purchase, development, and rising farmland prices. Next, I examine the county records for all Oregon farm properties that sold between 2010 and 2015. I provide summary statistics about the volume and pace of transactions, price per acre, and the type of owner. I also offer brief cases on top purchasers, attempting to understand their intentions with the farm properties. The findings demonstrate a rapid turnover in Oregon farmland and high prices, though that varies across the state. Agricultural corporations, investment companies, and real estate and development interests are buying large amounts of farmland. I conclude by offering reflections on the implications of the changing ownership and direction for further research.
1. Introduction
This article is organized as follows. I start by contextualizing recent trends in United States (U.S.) farmland ownership as influenced by capitalist land ownership practices and farm policy generally favoring the corporate food regime. Then I review recent farmland trends including consolidation, purchase by investors, development pressure, and rising farmland prices. Next, I provide rationale and context for focusing on the state of Oregon. I explain my methodology, which involved obtaining transfer records from 2010 to 2015 from various county assessor offices. In the empirical section of the paper, I present key findings about farmland sales, prices, and buyers. I also focus on a few regions where particularly interesting pattern emerge, and I identify and describe some of the most influential buyers and their potential motivations. In the discussion, I interpret these trends in terms of their impact on farming and rural communities and suggest implications for the future of agriculture. I conclude by commenting on methods and also identify future research steps.
First, farmland ownership in the United States is part of a broader model of capitalist, mainly private land ownership. The ownership model was implemented, beginning in the 16th century and continuing up until today, through the enclosure of land once stewarded by Native Americans. Prior to the enclosure of the land, Native American peoples practiced a wide range of ownership and land management strategies, ranging from communal management and open access to more restricted kin-group ownership [1,2].
As mainly European settlers arrived in the 16th through 19th centuries, many brought ideas of private land ownership with them which they implemented upon claiming land and establishing systems of land tenure. From the mid-1800s to the mid-1930s, the U.S. government led a massive land surveying and redistribution project [3]. The survey system facilitated the rapid transfer of vast amounts of land to private ownership by unambiguously delineating land tracts, making it simple to transfer land, and guaranteeing security of ownership. The main set of policies, the Homestead Acts, resulted in the transfer of almost 300 million acres of land (often taken from Native Americans) to one and a half million (mainly white) households, large farm operators, businesses, and speculators/actors that remain dominant in U.S. farming today [4,5]. Today, nearly 100% of cropland and two thirds of ranchland, in the U.S. in 2012 is owned privately, by American individuals or entities like partnerships or Limited Liability Corporations [6]. The bulk of farmland is held by individuals, trusts, or partnerships, with only small amounts owned by corporations, institutions, or investors, though this appears to be changing, something the article will explore in greater depth.
A second significant influence is that U.S. farm policy has for decades generally favored intensive production, industrialization, and relatedly, consolidation [7]. Scholars often contextualize the current era of U.S. farm policy as dominated by a corporate food regime [8,9]. Some of the characteristics of U.S. farm and food policy under this regime include the promotion of farm sales to deregulated global markets, the production of cheap commodities, the diffusion of productivist, industrial agricultural technology, and at least domestically in recent U.S. Farm Bills, and a strong aversion to price and supply management [10]. One of the impacts of this food regime is intense price competition among producers, and a response to price competition has been increasing consolidation into larger farms.
In the 1800s and early 1900s, many American farms were small-scale, family farms with diverse crops, though large, sprawling plantations throughout the South were exceptions [5]. In 1900, nearly 40% of the U.S. population lived on farms [11]. By 2000, that percentage had dropped to less than 2%. In the 2015 Census of Agriculture, ~3.2 million farmers operated 2.1 million farms, covering 915 million acres of land, compared to 5.3 operators, 5.4 million farms, and nearly 1.2 billion acres in the 1950 Census of Agriculture.
Larger farms own more of the nation’s farmland compared to a few decades ago. In 1987, farms with over 2000 acres operated 15 percent of the nation’s farmland. By 2012, they operated 36 percent [12]. The midpoint size of the U.S. farm nearly doubled from 650 acres in 1987 to 1201 acres in 2012. Large farms also account for an increasing amount of the economic value of production. In one measurement, large farms ($1,000,000 or more in gross cash farm income) accounted for ~3 percent of farms but 55 percent of the value of production [13].
A variety of actors are engaged in farm purchase and consolidation. One actor includes historically family-based farming operations that are scaling up, accessing more land, and growing larger contract quantities. They constitute a new actor which Pritchard et al. (2007) call “family farm entrepreneurs” [14]. They organize themselves in a variety of ways including as sole operators, partnerships, proprietary legal companies, and family trusts. A second actor is that of domestic and international agricultural companies, purchasing or leasing farmland as part of the process of vertical integration and market expansion.
A third actor engaged in farmland purchase is investors. In past decades, scholars have hypothesized that farmland ownership was unattractive to capital investment, for reasons ranging from its low liquidity, difficulties in managing labor, and the high risks and limits of profits being linked to production [15]. However, scholars have documented increasing ownership of land by financial investors, such as farmland investment firms and farmer/investor hybrid models, who are motivated both by the prospect of capital gains from rising land prices and the steady income provided through leases [10,16,17]. Investors are actively purchasing land both in the Global South [16,18,19] and North including in Australia [20], Canada [21,22,23,24], and the United States. There is no comprehensive data for the U.S., but Gunnoe suggests that in the USA, “we are witnessing an unprecedented integration between finance capital and land ownership that harkens back to previous eras of rentier control” [25] (p. 478).
Other significant actors engaged in farmland purchasing include amenity owners [26]. Amenity owners are people who buy property in rural areas based on the draw of natural and/or cultural amenities and for desired lifestyle, rather than for economic livelihood reasons [27]. Sutherland calls this trend “agricultural gentrification” [26] (p. 658). Gosnell and Abrams note its part in the larger process of ongoing rural restructuring, in which historically agricultural areas transition to so-called “postproductivist” landscapes [27]. Scholars identify some hallmarks of postproductivist landscapes, alternatively called neo-productivist or nonproductive landscapes, including growth in nonfarm employment, multifunctionality, more diversified farm production, changes in the regulatory structures and governance surrounding farming, and a greater focus on qualities versus quantity [28]. The terms and specifics of these processes are debated and the specific ways in which they are unfolding are highly contextual [29]. As examples, there is a high level of amenity owner purchase of historically working ranchland in the Greater Yellowstone area [30], in the Rocky West region [31], and in Montana [32]. Scholars suggest that increasing amenity ownership can impact farming in a number of ways, for example, by contributing to rising property values and by bringing different cultural values and land management practices and land uses.
Finally, real estate developers are also engaged in purchasing farmland, particularly on the fringes of metropolitan regions and in high amenity areas. This is a long-term trend in the U.S., since many cities and regions are located on highly productive farmland [33]. The trend of developer purchase of urban fringe farmland accelerated in earnest post World War II, with the subsidization of freeways and suburban living and subsequent sprawl of metropolitan areas and rise in acres developer per resident [34,35]. Between 1992 and 2012, 62% of all development occurred on farmland, and 11 million acres of highly productive farmland was lost [33]. Beyond the direct conversion of farmland to residential, commercial, industrial, and infrastructure uses, the social and environmental impacts of developer purchase are highly variable and depend on the kinds of development pursued by the developer.
With many actors competing over a limited land base, the rising price of farmland is perhaps unsurprising. The U.S. farm real estate value—the value of all land and buildings on farms—averaged $3,140 per acre in 2018, though this varied a lot regionally [36]. This was an increase of 136% for cropland and 121% for pastureland since 2004. The increase in farm land value is not a boon for all working farmers, notably not for those who lease or those seeking land. In another report by the United States Department of Agriculture during a similar time period, Burns et al. note that “farm real estate values have generally not been supported by current income, except during periods of high net cash farm income (2011–14). If net cash farm income continues to decline, farmers will be less able to service debt on real estate, and farmland will become less affordable—until land prices adjust downward” [37] (p. 26). In other words, rising land values may present a challenge for farmers, especially the over half with negative farm income [38], which could in turn make land even more susceptible to sale to developers, land consolidators, etcetera.
The above literature review highlights that significant changes are underway in the U.S.’s agricultural land ownership. Careful empirical work is needed in order to establish the scale and scope of the change, as well as potential impacts [23]. Scholars have noted an overall lack of data on rural land ownership, and called for more research on land ownership changes and the social, environmental and other implications. In the next section, I focus on how farmland ownership is changing in Oregon.
2. Materials and Methods
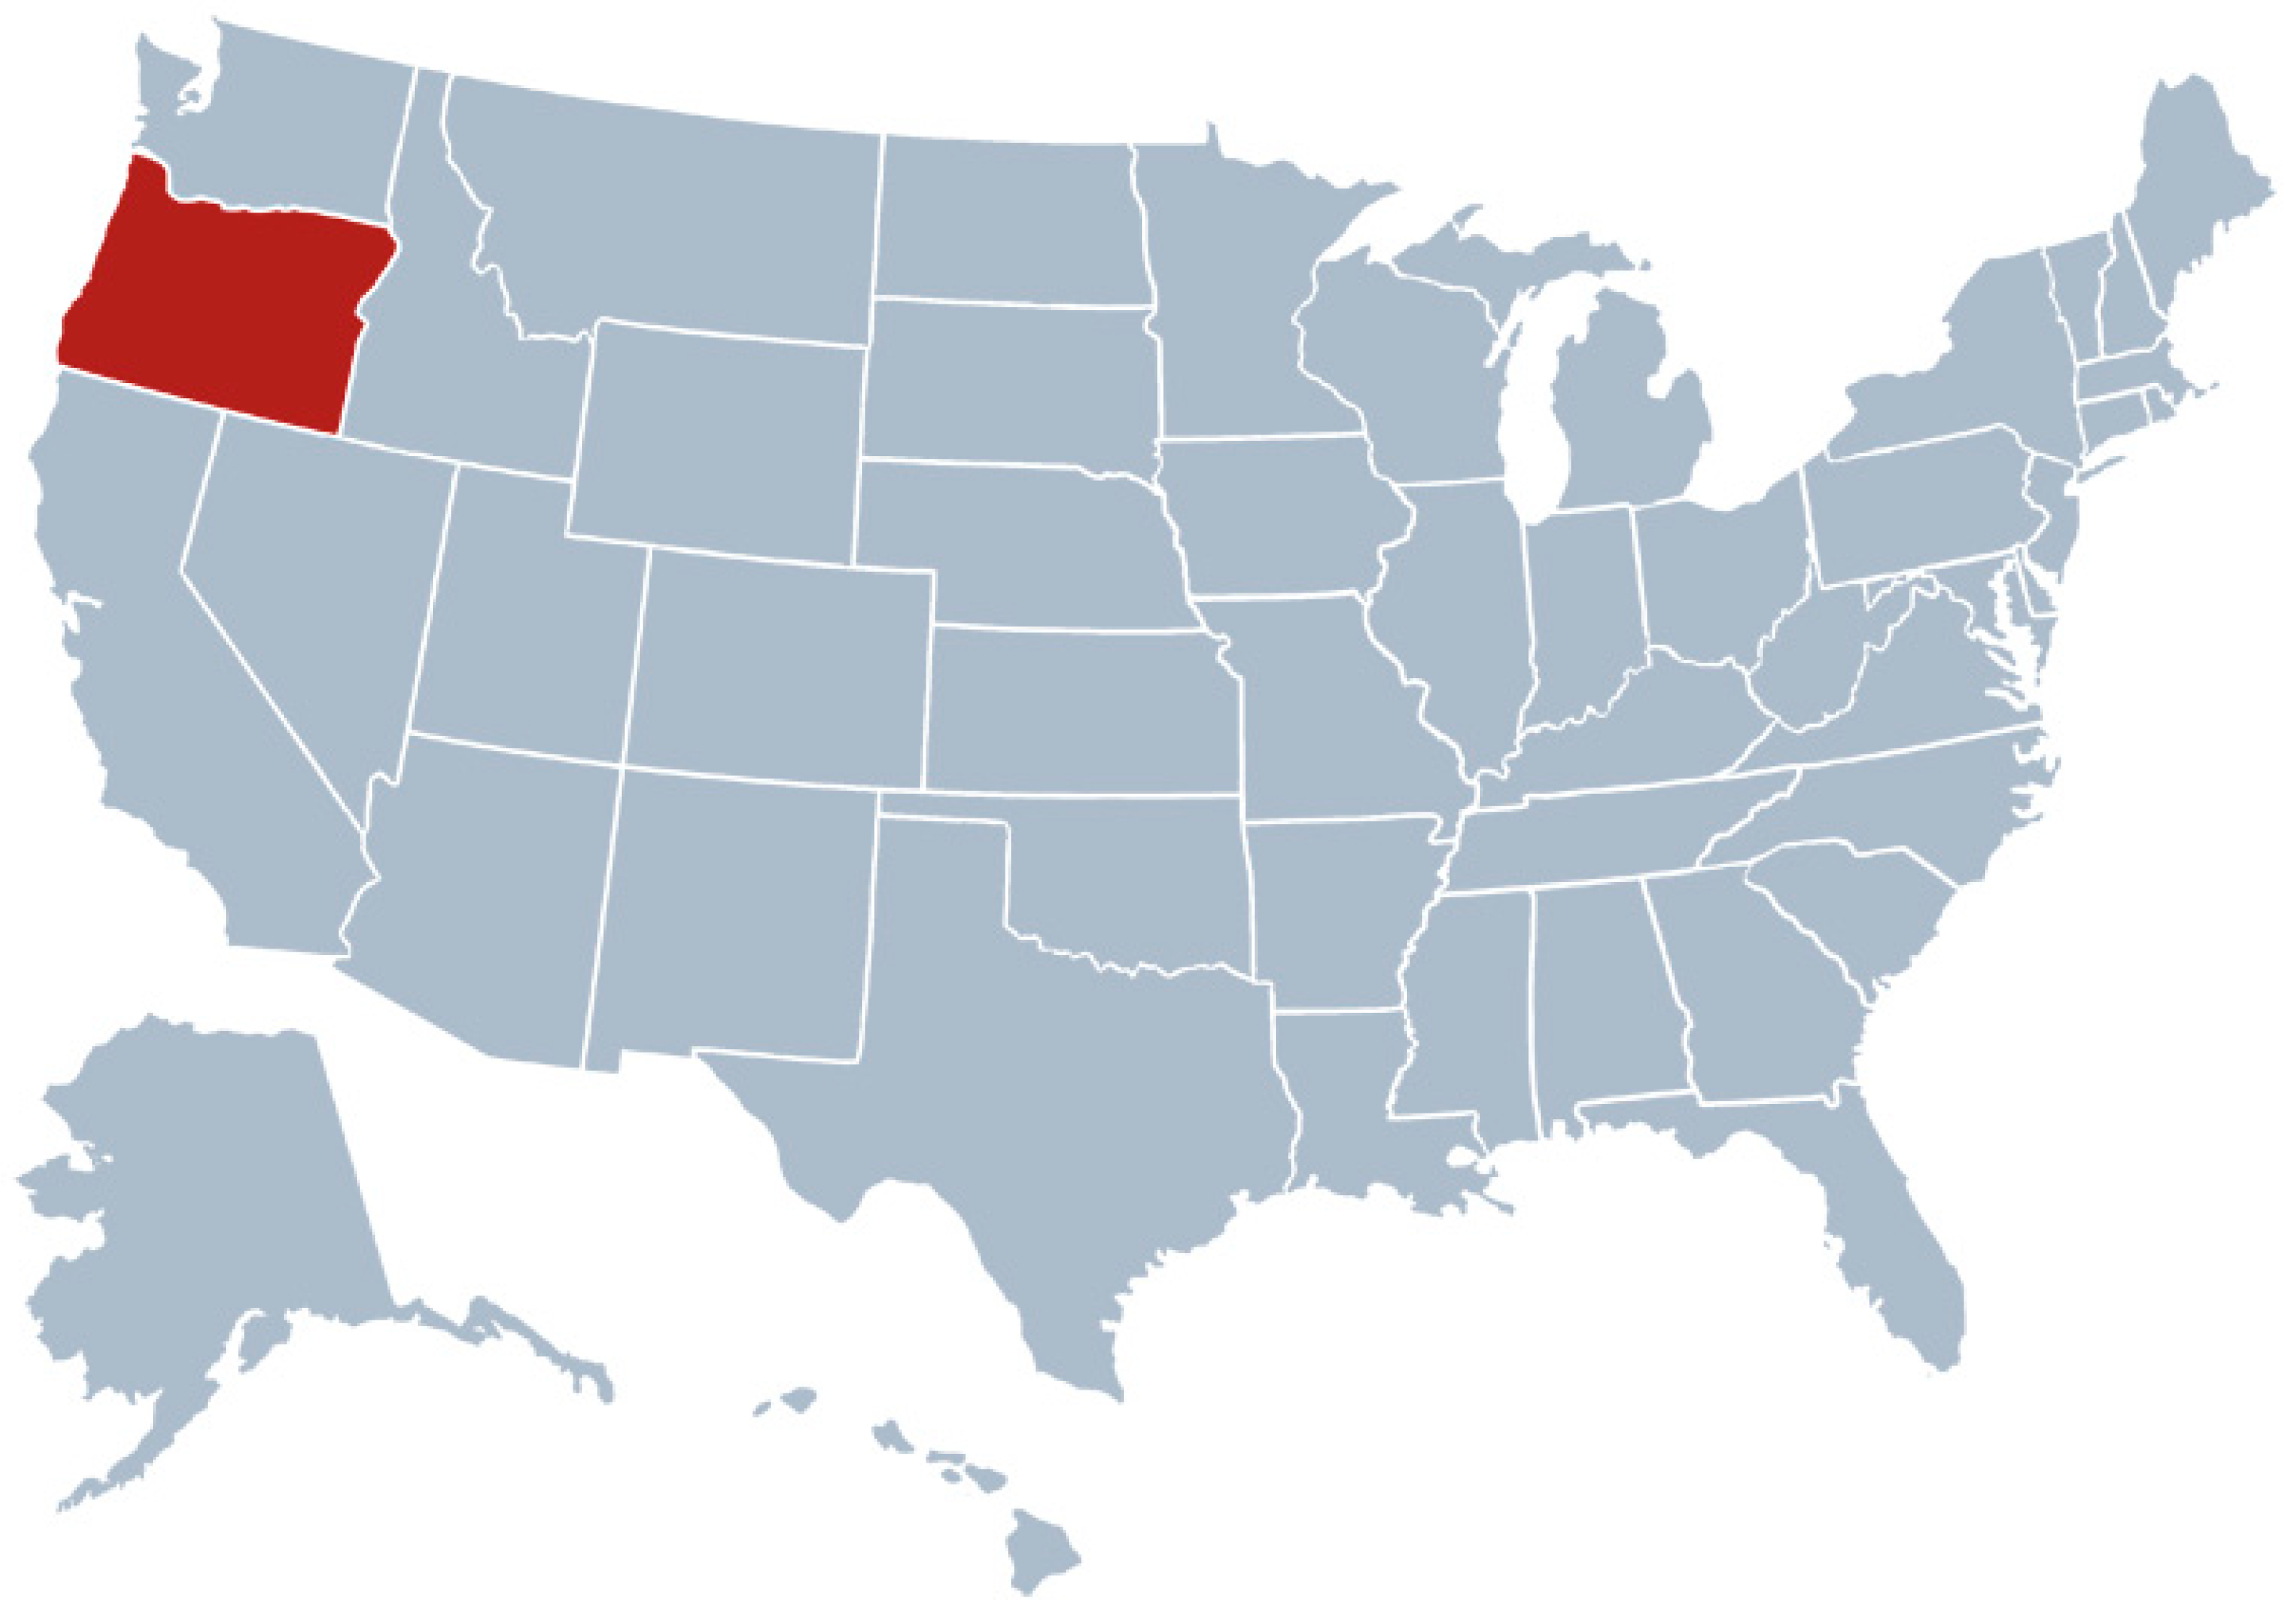
This paper examines recent patters in farmland purchase in Oregon in the northwestern U.S. (see Figure 1 for a map of the U.S. highlighting Oregon). In Oregon, farming is significant in terms of its land use and economic impacts. Oregon is often viewed as unique in the United States for its history of family farming and small-scale diversified agriculture, compared to, for example, California or the Midwest. Oregon has higher percentages of farms certified as USDA organic and farms serving direct markets. Oregon also has what many land use planning scholars consider the most robust statewide land use planning framework, which protects agricultural and forest land from development mainly through agricultural zoning (called Exclusive Farm Use or EFU zoning) and urban growth boundaries [35,39,40]. In addition, Oregon has some unique farm and food policies, including a very low minimum size for dairies (three cows), which may be related to its smaller farm sizes [41]. Another factor in Oregon, shared by other Western states and states with scenic farmland, is the growing amenity ownership of rural lands in some parts of the state [42]. Farmers and food systems activists have suggested that major changes to farmland ownership are underway in Oregon, based on their own observations and some anecdotal evidence. This paper seeks to add data to our understanding of the issue.
There is no one agreed upon method to examine changing farmland ownership. My methods were informed by others, notably Magnan et al. who documented the extent of investor ownership in Saskatchewan [23]. They focused on large farmland properties of 3000 acres or more. The authors examined the extent of investor ownership in Saskatchewan between 2003 and 2014 by comparing the list of farmland owners to a list of entities they believed to be investors or investment companies rather than farming operations (10). They concluded that as of mid-2014, three large entities owned more than 100,000 acres each, mainly clustered in a few areas.
In another study with comparable methods, Gosnell et al. [30] examined ranchland ownership dynamics between 1990 and 2001 in 10 counties in Montana and Wyoming near Yellowstone National Park. They gathered sales information on agricultural land of 400 acres or more from public and private appraisers and from public records. The authors then interviewed members of the local agricultural community, real estate agents, appraisers, conservationists, and representatives of local and federal government, which helped classify the owners as rancher, amenity buyer, investor, corporation, developer, conservation organization, or other. The authors found that the ownership regime in the Greater Yellowstone area is transitioning from ownership by mainly full-time livestock producers, to a more diverse group of landowners, including part-time ranchers, amenity owners, conservation owners, investors, and land developers.
In this paper, I adapted the above approaches in a way that seemed prudent for the research goals, which are to understand trends in farmland purchase, including pace of sales, prices, and the range of actors involved (not just investors) at the state, regional and county level in Oregon across all farmland types. To do this, I requested (and in some cases purchased) records of farmland sales from 2010–2015, from the assessor’s office at 36 of 39 counties. I was unable to obtain the remaining three counties despite numerous attempts. I specifically requested records of sales from 2010 to 2015, of land either zoned as Exclusive Farm Use (a specific agricultural zoning class in Oregon) or obtaining Special Farmland Tax Assessment (a tax reduction for properties engaged in agriculture). I did not establish a minimum size of farmland, meaning I included properties of all sizes. In an attempt to focus mainly on non-arm’s length transactions, I removed all sales of $1,000 or less. I also prepared the data to make it comparable across the counties, including adjusting all prices to 2015 dollars. When buyers made multiple purchases, I combined those that were on the same date and in neighboring parcels, as they appeared to be part of one larger acquisition of land. I did not combine purchases made by the same buyer that were months or years or miles apart.
I manually categorized sellers and buyers by different types including Individuals, Trust/LP/Estate, All Corporation Types, Fannie Mae or Bank Alone, and Unknown/Other. For All Corporation Types, I further distinguished business categories such as Agriculture, Banking/Finance/Mortgage Brokers, Investment Company, Real Estate/Land Development & Property Management, Wholesale/Retail, and Other, using information found in the Oregon Secretary of State Business Database and in a general internet search including of any relevant company websites and media. I also manually categorized buyers as In State, Out of State, and Unknown, based on the mailing address listed for the grantee.
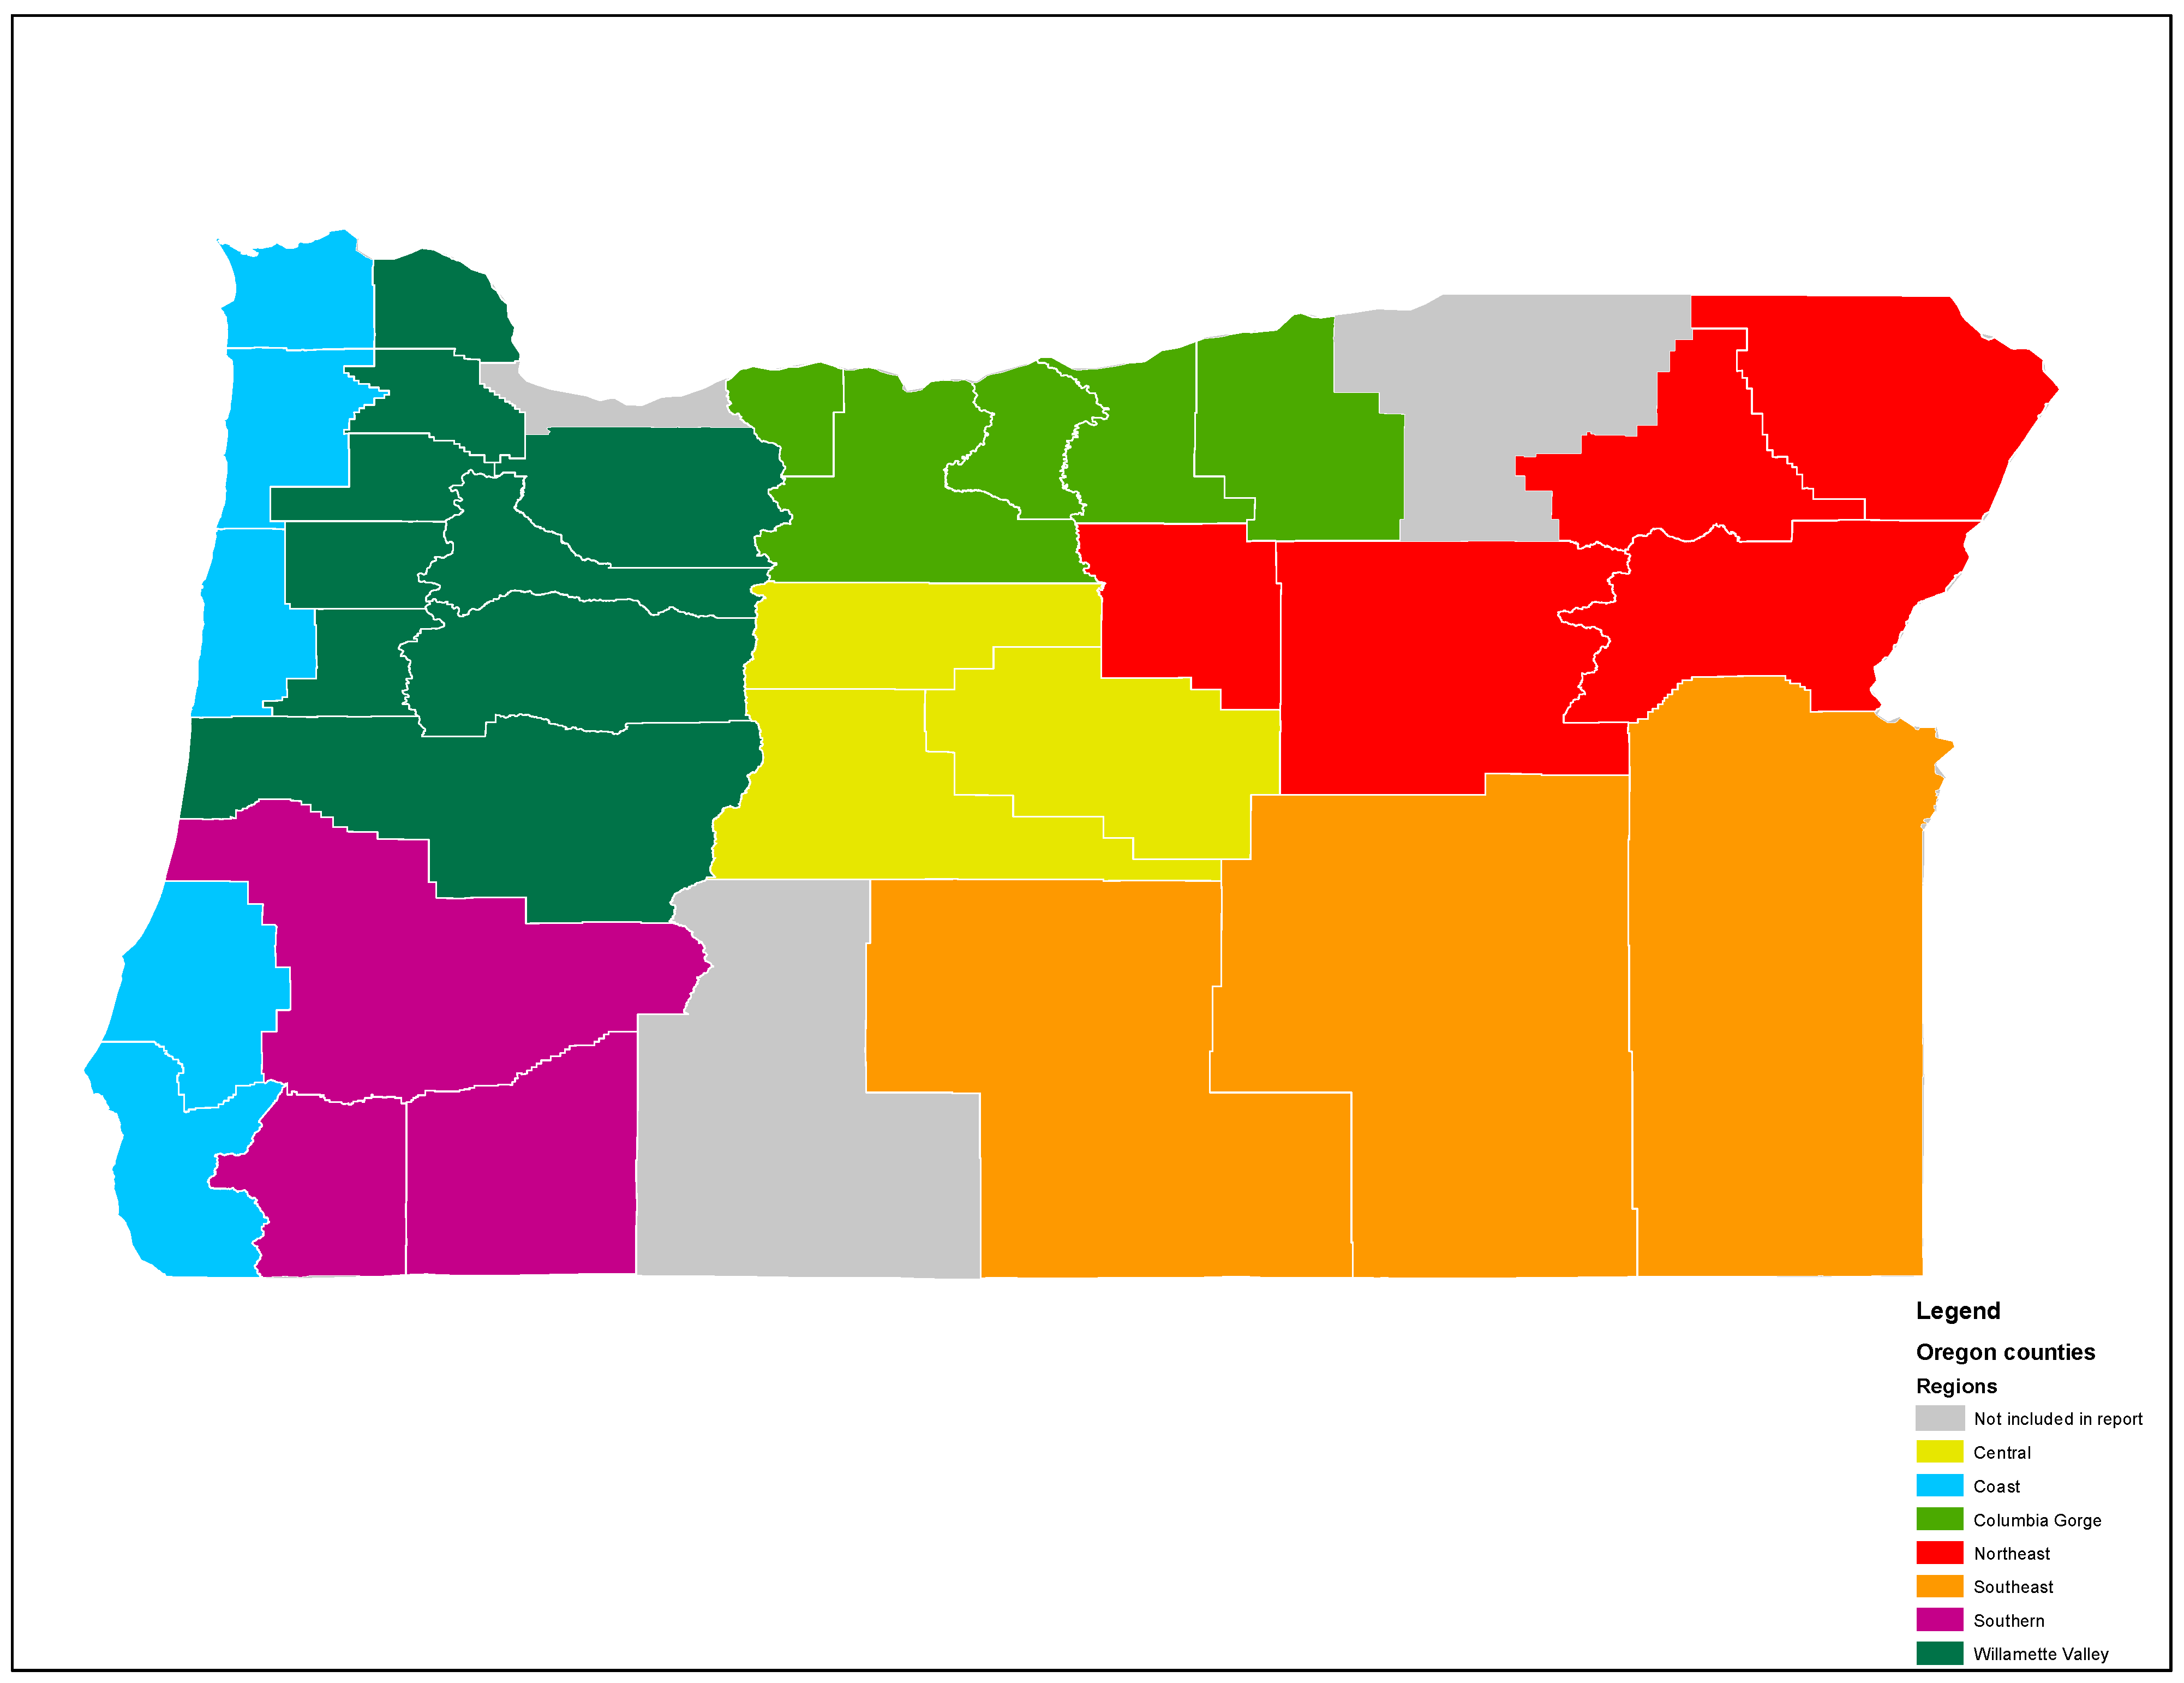
I then created a variety of pivot tables to examine the records at different geographies and by zoning class, property class, acreage/size, sales price, and seller type and buyer type. In the Findings section, I present descriptive and summary findings statewide, by region (following the seven agricultural regions of Oregon identified by the Oregon Department of Agriculture [44] and by individual county (See Figure 2).
In addition to the summary findings, I also attempted to understand more about particularly influential actors. In the three regions (Central, Columbia Gorge, and Willamette Valley) with highest farmland prices, I identified the top ten buyers by both price and acreage. For the top five in each region, I attempted to identify more information about the actor and their motivations, and anticipate the potential impacts.
3. Results
3.1. Volume and Pace of Sales
Statewide, 13,489 farm properties accounting for ~1.2 million acres of farmland were sold in the years 2010–2015 (See Table 1). Of those farm property transfers, 9909 sold for more than $1000. I removed the 3580 sales for under $1000 from the remainder of the analysis as those were likely not arm’s length sales.
Of the remaining qualified properties selling for at least $1000, ~1656 farms transferred annually. This represents an annual transfer of ~4.6% of the number of farms counted by the USDA Census of Agriculture in Oregon in 2012 (while these are not comparable definitions of farms, the comparison may offer some insight into the pace of sales). Approximately 194,295 acres transferred annually, or ~1.2% of the 16 million acres of Census of Agriculture identified farmland in the state. Overall, small farms are selling at a faster rate than larger farms. Over the time period, the volume of sales increased. The total number of properties (nearly 2000) sold in in 2015 was higher relative to years prior.
Over a quarter, or ~2500 farmland sales were of properties greater than 80 acres, while there were nearly 1500 sales each from the size categories of 5–10 acres, 10–20, and 20–40 acres. The median acreage of farms sold was much smaller, at ~20 acres. The average acreage was 199 acres, or approximately a quarter of the average farm size reported in the 2012 Census of Agriculture. This again emphasizes that smaller farms are changing ownership more, but is also related to the generous definition of farmland used. The size of farmland sales varied significantly by region, with larger properties transferring in Central and Eastern Oregon and the Columbia Gorge, and smaller properties transferring in the Willamette Valley.
Regionally, the Willamette Valley region had the most farmland sales, with 5238 sales, or over three quarters of the state’s qualified sales. The Northeastern region had the most acres sold (about 340 thousand acres), followed by the Southeast (about 292 thousand acres) and the Willamette Valley (170 thousand acres).
3.2. Price
Over the full time period, the median price per acre for qualified farmland sales was $10,512 (See Table 1). Statewide, the median price per acre of farmland declined in 2011 compared to 2010, but then increased steadily each year from 2011 to 2015. The average price per acre followed a similar overall trend over the time period, trending up from 2011 to 2014 (though down in 2015 compared to 2014), and was consistently about three to four times higher than the median price per acre. Over the full time period, the average price per acre was $33,166.
Smaller properties had significantly higher prices per acre than larger properties. For example, the median sales price for properties less than 5 acres was $64,386, compared to $4245 per acre for properties 20 acres or larger. This price differential likely reflects that smaller properties are priced mainly for their capacity for residential living, and also tend to be located in parts of the state with higher land values in general.
The median price per acre also varied by property type. Statewide, the median price per acre for Exclusive Farm Use-zoned land was $9841, or about half that of non-EFU-zoned land at $19,357. The higher price for other zoned land is likely due to its more flexible zoning than EFU zoning, which is restricted mainly for agricultural land use in Oregon. Likewise, improved properties (referring to properties with houses or other infrastructure like barns, processing facilities, etc.) unsurprisingly had a higher median price ($15,685) than unimproved properties ($4487).
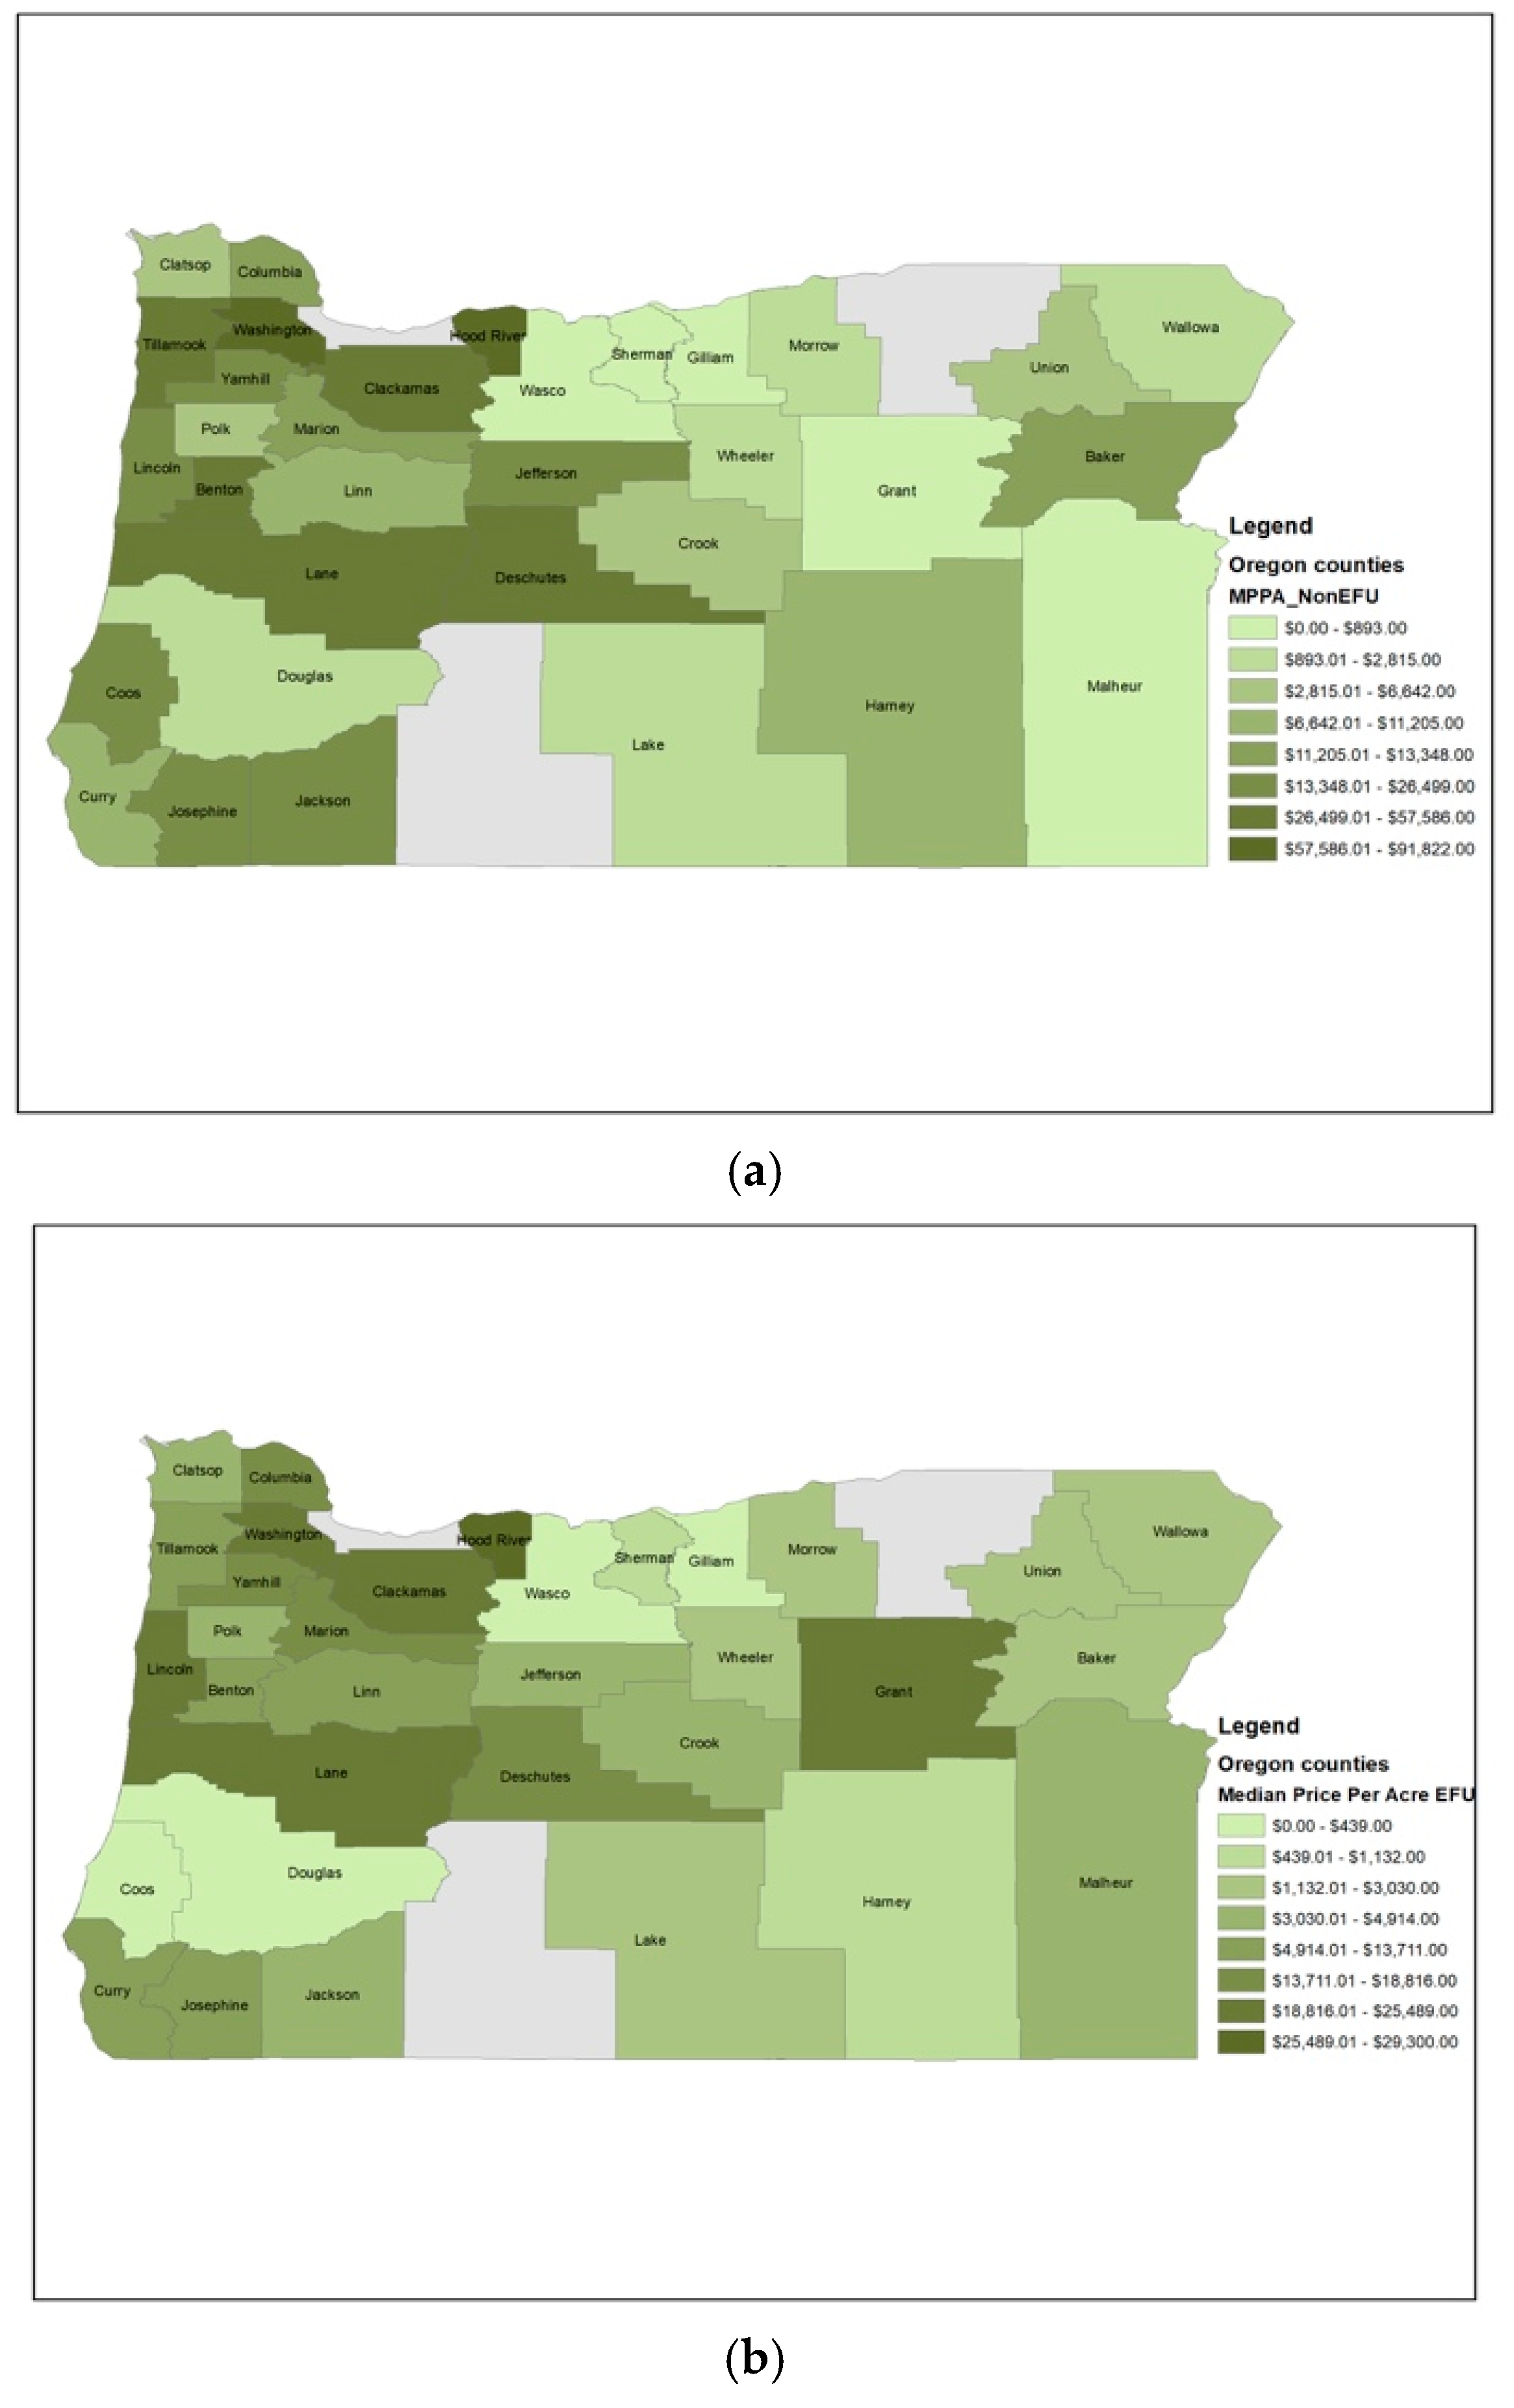
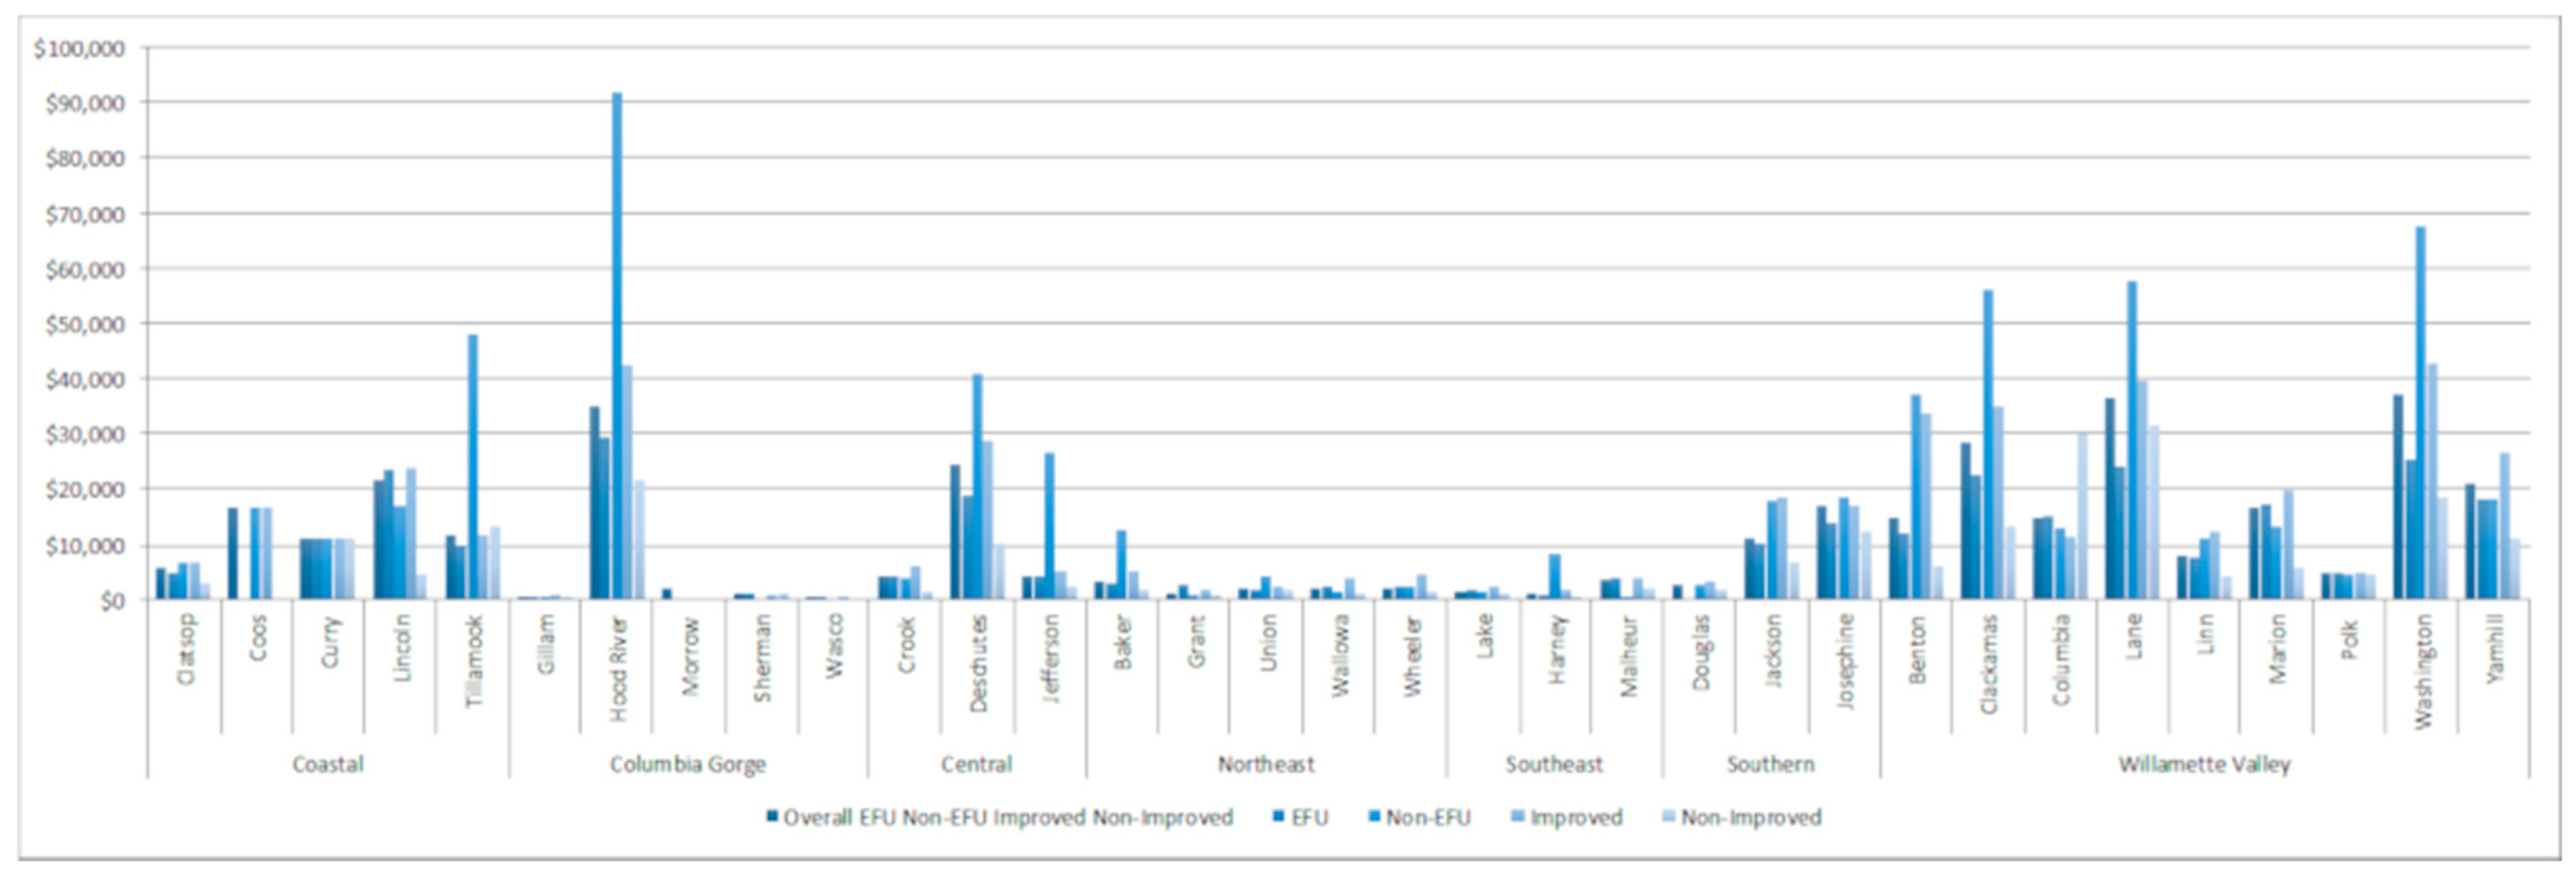
Prices also varied by location, as shown in Figure 3 and Figure 4. The Willamette Valley region, with high quality farmland soil and proximity to I-5 corridor and major metropolitan areas, had the highest median price per acre overall ($18,596), while the Southeast region, mainly arid grazing land far from any major population center, had the lowest median price per acre ($1711). The Willamette Valley region had the highest median price per acre ($36,279) for EFU-zoned farmland. The Willamette Valley region also had the highest median price per acre for improved properties regardless of zoning ($24,739). The Columbia Gorge region had the highest median price per acre for non-EFU-zoned farmland receiving farm-use assessment ($69,721).
Among counties, Hood River, Washington, and Lane counties had the highest median prices overall (see Figure 1). Hood River County ($29,300), Washington County ($25,489), and Lane County ($24,267) had the highest prices per acre for EFU-zoned land, as well as non-EFU land and improved land (See Figure 3 and Figure 4).
3.3. Buyers
I focus on the origin of buyers and then types of buyers. First, the majority of buyers had recorded in-state address. Known out of state buyers accounted for ~10% of properties though this likely undercounts the number of out-of-state buyers, as described further in the limitations section. Out-of-state buyers accounted for 26% of acres purchased, meaning they bought larger properties than in-state buyers. These out-of-state buyers came from a variety of states, including California, Washington, and Texas and some came from other countries such as Canada and China. Interestingly, out of state buyers paid higher median purchase prices than in-state buyers (not shown). Regionally, the Columbia Gorge region had the highest percentage of properties purchased by out-of-state buyers (14%), while the Southeast region had the highest percentage of acres purchased by out-of-state buyers (almost 40%).
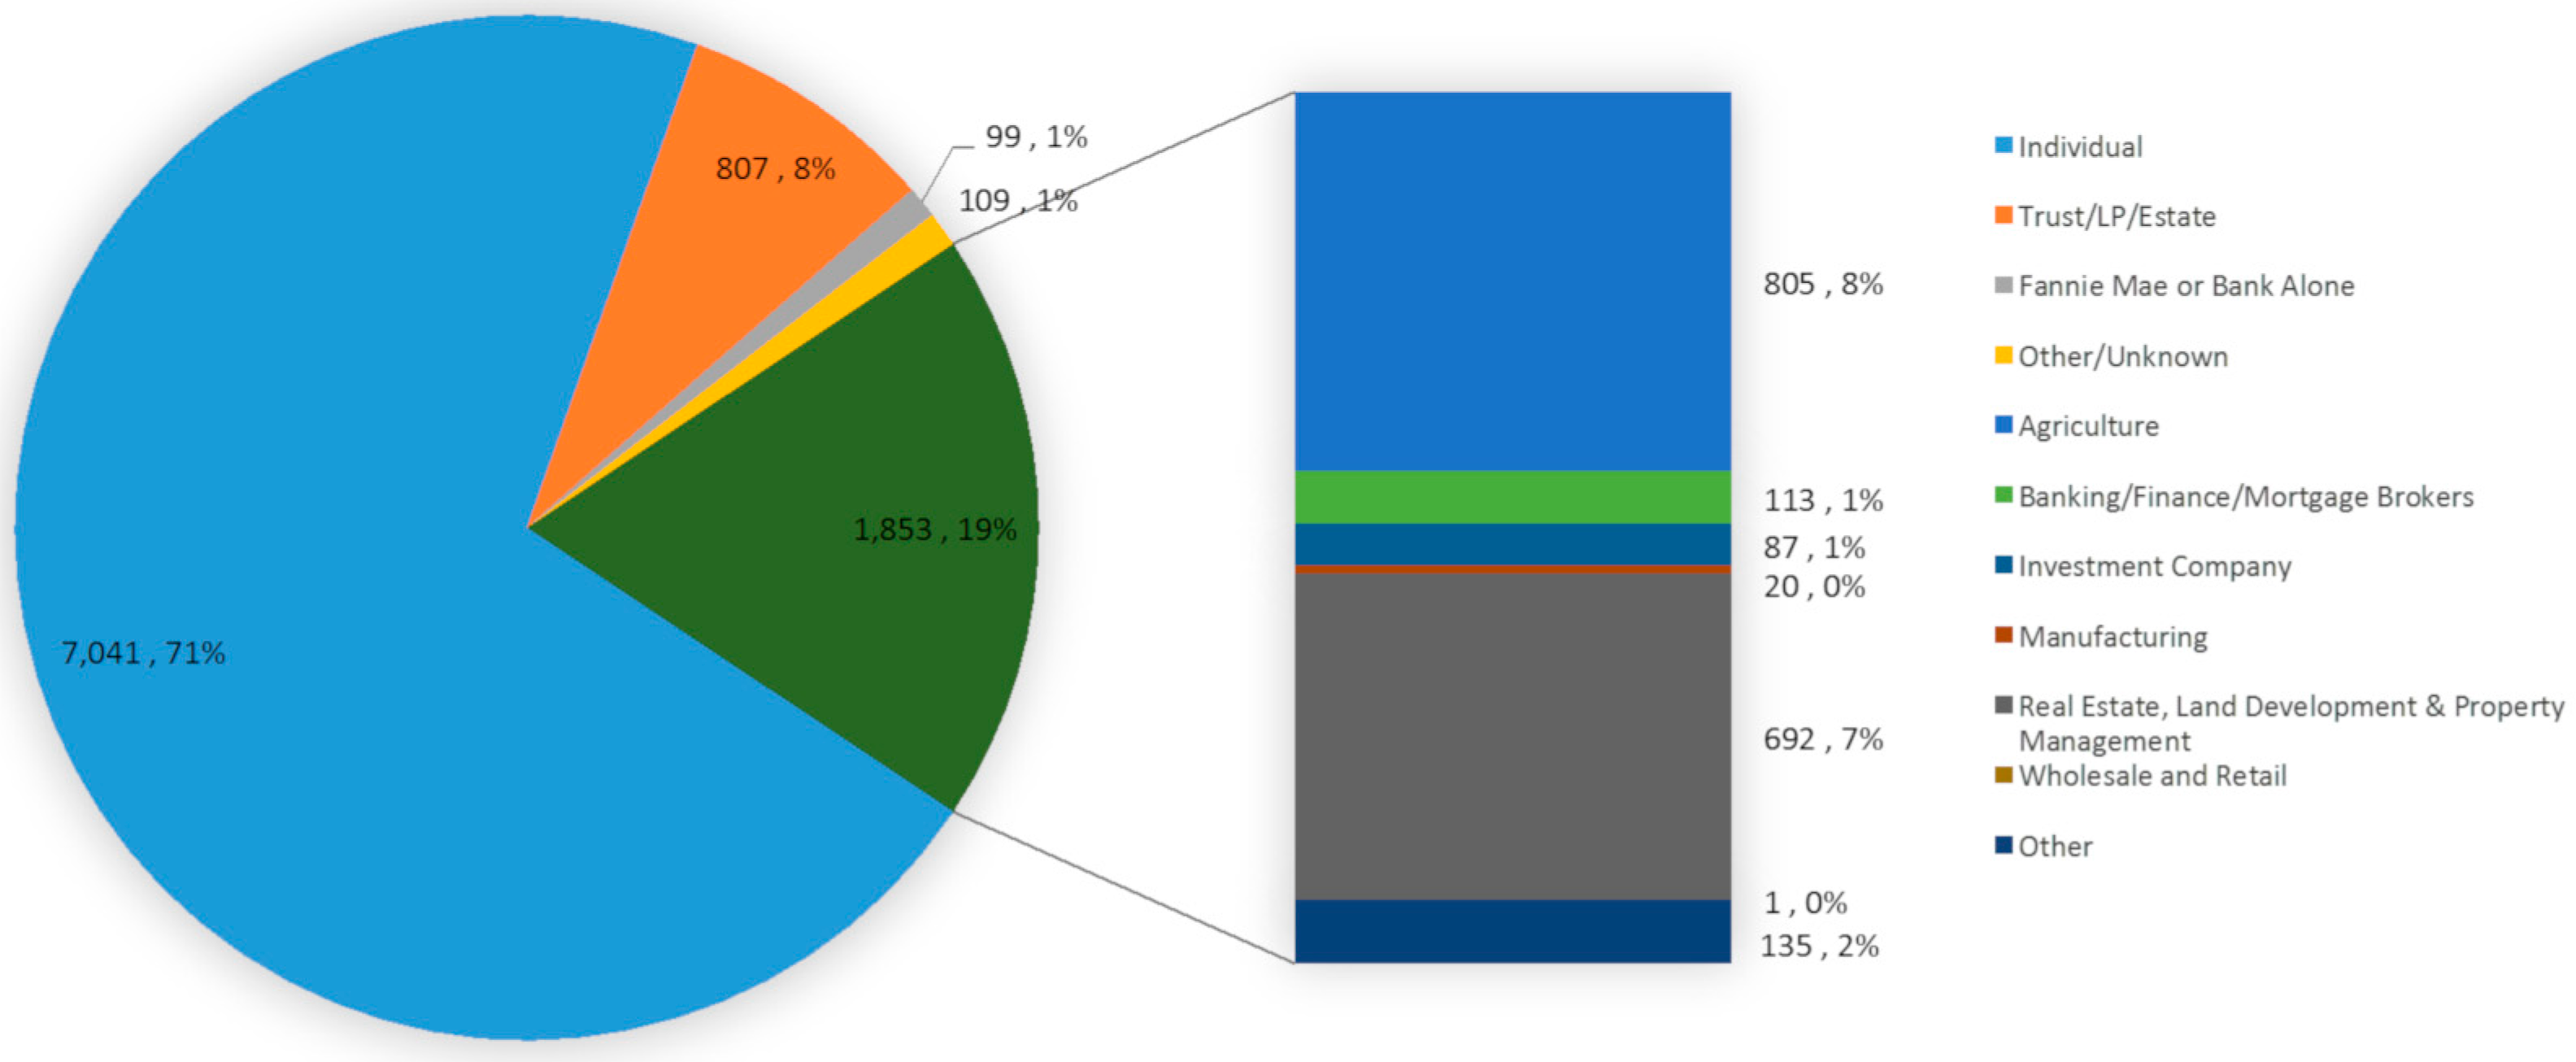
Among types of buyers, individuals (71%) and trusts/estates/LPs (8%) accounted together for 79% of farmland properties purchased and 54% of acres purchased (See Figure 5). Corporations accounted for a little more than 12% of sales and over 40% of acres purchased. In other words, corporations are buying larger properties than other buyer types. Corporations bought approximately 40 properties of farmland annually, shifting ownership of ~40 properties and 6265 acres of farmland annually from individuals to corporations. Approximately 1% of buyers and 3% of total acres transferred were classified as Other or Unknown. These buyers included a range of actors, including conservation organizations and public entities like ports and parks departments.
Among the 1853 corporate buyers statewide in the time period, less than half (805) were corporations with clear connections to agriculture. More than half did not have clear connections to agriculture and instead were involved in real estate/property development, investing, manufacturing, or other areas such as renewable energy. Real estate, land development and property management-related corporations accounted for 7% of all sales and 14% of acres purchased. Some of the top purchasers in the state by acreage or by price are nonagricultural corporations.
Regionally, the percentage of corporate buyers was highest in the Columbia Gorge (25%) and Central Regions (25%). Corporate buyers bought the most land in in the Central region (59% of land transferred) and in the Southeast region (46%).
3.4. Top Buyers
In this section I take a closer look at top buyers in the Willamette Valley, Columbia Gorge, and Central Oregon regions—regions that included counties with the highest farm prices. In each region, I identify the top ten buyers by price and by acreage (see Table 2 and Table 3). I also discuss the individual top five buyers by price and land (excluding individuals), highlighting the type of buyers, their history, and their intended use of the land, as possible.
3.4.1. Central Region
In the Central region, the top ten buyers by price included six LLCs, one land trust, and three individuals. Of the top four buyers by price, four were LLCs.
- RBH Oregon LLC: Example of a multifaceted large business, with real estate development interests. RBH Oregon LCC purchased 180 acres in Crook County in 2014 for $11.76 million. RBH Oregon LLC appears to be a multifaceted large business or set of businesses involved in a wide range of business activities including land holdings, real estate development, management, and financing. I could not determine more details about the business or their specific intention with this property.
- Stafford Ranches LLC: Example of a family farm entrepreneur. Stafford Ranches LLC bought 637 acres in Crook County for $10.45 million in 2014. LLC. Stafford Ranches LLC appears to be what Pritchard et al. (2007) call a “family farm entrepreneur”, with roots as a family farming operation. Stafford Ranches LLC now owns farm, ranch and timber properties throughout Central Oregon. During the research time period, Stafford Ranches LLC bought a number of properties in Crook County at different points during the study period, with this one being the largest.
- Hamilton Ranches LLC: Example of a multifaceted large business, with real estate development interests. Also in Crook County in 2014, Hamilton Ranches, LLC purchased 7077 acres for $7.57 million, making it the third top buyer in terms of price and first in terms of acreage in the region in the study period. The LCC was formed in 2014 by the Chief Executive Officer of the company Bonaventure Senior Living, which operates over 20 retirement communities in the Northwest. [45,46] Their long-term plans for the property are not clear, though a Oregon State University extension agent in Crook County said in a newspaper story that the current plan is for the LLC to continue raising cattle on the ranch [45].
- Loyal Land LLC: Example of a real estate development company. Loyal Land LLC purchased 1,783 acres of ranchland west of the town of Redmond in DesChutes County for $8 million in 2011. Loyal Land LLC, with its base address in California, incorporated 2011 with real estate as its focus. According to newspaper and legal accounts, Loyal Land LLC purchased the property from the bankrupt Thornburgh Resort Company, with a plan to develop the property into a destination resort with over 1000 houses, a hotel, water ski lake, and three golf courses [47]. However, numerous entities appealed the plan, and the case went all the way to the Oregon Supreme Court, where the State ruled that the plan was not legal, mainly due to its impact on water [48]. As of summer 2018, Loyal Land LLC had resubmitted a similar development proposal, saying they had resolved issues including water and traffic [49]. The future of the property in question remains unclear.
- 1100 LLC. 1100 LLC is aa domestic LLC with members living in California, Oregon, and Colorado. 1100 LLC bought 9237 acres of improved EFU-zoned land in Crook County in 2015. I could find no further information.
- 96 Ranch LLC. 96 Ranch LLC is a domestic LLC engaged in farming and ranching. It bought 3552 acres in Crook County in 2013. I could find no further information.
3.4.2. Columbia Gorge Region
- Oregon Trail Highway LLC: Example investor. Oregon Trail Highway LLC purchased 1897 acres in Morrow County in 2013 for $13,855 million. The LLC, based in Virginia, formed in 2013 as part of the lager Gladstone Land LCC with a declared business activity as REIT subsidiary. According to Gladstone Land LLC’s website [50], “Gladstone Land Corporation (common stock listed on NASDAQ: LAND) is a real estate investment trust that specializes in purchasing farms and farm-related properties and leasing them to farmers…Gladstone Land owns farmland in Arizona, California, Colorado, Florida, Michigan, Nebraska, North Carolina, Oregon, and Washington. As of June 30, 2018 our portfolio has an appraised value of approximately $537.4 million. We are actively seeking other farm properties to purchase across the United States.” The authors could not find any specific information about either Oregon Trail Highway LLC or Gladstone Land Corporation’s ongoing involvement with this specific property.
- Neal J Dow Family Limited: Example family farm entrepreneur. Neal J Dow Family Limited purchased 13,273 acres of a mix of EFU-zoned land for $6.7 million in Morrow County in 2014. Neal J Dow Family Limited is a family partnership, based in California, with a stated business interest in cattle ranching. The website of Dow Ranches, a seemingly related organization, indicates that they own two high desert locations in Central and North Central Oregon totaling over 33,000 acres, along with winter grass range located in Central California [51]; they raise Wagyu beef.
- Western River Conservancy: Example conservation organization. Western River Conservancy purchased 14,148 acres for $61 million in Gillam County in 2014. According to their website, Western Rivers Conservancy is a nonprofit land conservancy that protects outstanding river ecosystems throughout the western United States. Their mission, as stated on their website [52], is to “acquire land to conserve critical habitat, provide public access for compatible use and enjoyment, and cooperate with other agencies and organizations to secure the health of whole ecosystems.” In this particular purchase, Western River Conservancy was interested in several aspects, including the property’s access to the John Day river which is both important salmon habitat and high value recreation access to previously inaccessible parts of the river. As stated on their website, Western Rivers Conservancy intends to remove development rights from the property, convey the deed to the Bureau of Land Management, and to continue ranching while implementing sustainable grazing practices.
- Eagle Creek Northwest, LLC: Example investor. Eagle Creek Northwest, LLC purchased 33 acres for $5.1 million in Hood River County in 2010. Eagle Creek Northwest LLC registered with the State of Oregon as a foreign limited liability company in 2011, based in Connecticut, with the business activity of real estate investments. As noted in its business records, Eagle Creek Northwest LLC is related to UBS Agrivest, LLC, a global investment firm which according to their website “specializes in the acquisition, management, and disposition of US agricultural real estate investments for institutional clients.” I could not find specific information about Eagle Creek Northwest LLC’s intent and use of the property in Hood River County.
3.4.3. Willamette Valley Region
- ACMPC LLC 1 & ACMPC LLC 2: Example investor. I write about ACMPC Oregon LLC 1 and ACMPC Oregon LLC 2 together, as it appears they are both affiliated with Agricultural Capital Management Permanent Crops, the food and agriculture arm of Portland-based Equilibrium Capital Management [53]. Both ACMPC Oregon LLC 1 and ACMPC Oregon LLC 2 made substantial and similar purchases of over 2200 acres of farmland for over $1.2 million in Polk County in 2014. As stated on their website [54], ACMPC “invests in farm land and food processing assets to build consumer driven, vertically integrated, appropriately scaled, and regenerative businesses that support the planet and the communities in which we operate. ACMPC, LLC specializes in making investments in permanent cropland including citrus, berries, table grapes, and nuts, along with related midstream businesses involved in the agriculture and food processing, packaging, storage, distribution, growing, and marketing of produce on the United States West Coast with a focus on Oregon, California, and Washington, also has land in Australia.” There are currently five different companies with ACMPC in the name registered with the State of Oregon, and they together purchased a number of properties during the study period, though the two discussed here were the largest and costliest.
- Tualatin Hills Park and Recreation: Example public agency, Parks & Recreation District. Tualatin Hills Park and Recreation purchased 22 acres of non-EFU-zoned farmland in Washington County in 2011 for $8 million, the third most expensive purchase in the Willamette Valley region in the study period. Formed in 1955, Tualatin Hills Park and Recreation is the largest special park district in Oregon, covering ~50 square miles (~129 square kilometers) and serving 250,000 residents in the greater Beaverton, OR, area. The district has been involved in significant land acquisition after the passage of a 2008 voter-approved bond measure. The property purchased in 2011 had historically been operated as a wholesale nursery [55]. Tualatin Hills Park and purchased it to develop it into a developed park and connect it to neighboring natural areas and the local trail network.
- Finnegan Farms Inc: Example family farm entrepreneur. Finnegan Farms Inc. bought 405 acres of EFU-zoned land in Washington County in 2015 for $5.9 million. Finnegan Farms Inc. appears to be a family-based corporation, based in Cornelius, Oregon that transferred ownership from a previous LLC (Finnegan & Sons, LLC) The family has been in the farming business for a long time, and their homestead recently achieved Century Farm Status [56]. The newspaper article suggests they own 1000 acres and farm 2000 more acres, mainly crops including nursery stock, grass seed, clover seed, sweet corn, wheat, green beans, and more, though it seems likely they own and farm more than that now.
- Port of St. Helens: Example public agency with development interests. The Port of St. Helens is a public agency with elected commissioners that manage riverfront sites along the Columbia River for industrial development and maritime access to the Pacific Ocean. The Port purchased 737 acres at Port Westward in late 2010, from the Lower Columbia Tree Farm [57]. In 2017 the Port voted to rezone the property from previous EFU zoning to industrial zoning, to enable industrial development of the property. Subsequently, the advocacy organizations Columbia Riverkeeper and 1000 Friends of Oregon filed an appeal to the Oregon Land Use Board of Appeals seeking to overturn the county’s ruling, citing concerns over the impact to agriculture [58]. The future of the property is contested and the outcome is unclear.
- McElligott LLC: Example family farm entrepreneur. McElligott LLC bought 6148 acres for $1.65 million of improved farmland in Gillam County in 2010. McElligott LLC registered as a domestic LLC in the state of Oregon in 2008. It has business in farming wheat and ranching, as indicated by applications to the Oregon Water Resource Department. McElligott LLC is presumably affiliated with other companies with the same family name, such as DCJ McElliogt Associates LLC and McElligott & Associates LLC which are also involved in ranching and farming in the Columbia Gorge region.
4. Discussion
This article provides insight into the transfer of ownership of Oregon farm properties in recent years. Statewide, there was a brisk pace of arms-length farm property sales in the time period of around 4.6% of existing USDA farms being sold annually, and 1.1% of farmland acres. If I extrapolate this, I can anticipate a turnover of ~45% of farm properties and 11% of farm acreage in a decade. The rate is even higher when including sales for under $1000, likely non-arms-length transactions. This turnover rate is comparable to the turnover rate found for ranch land in the area around Yellowstone National Park, which was estimated at ~50% turnover of ranch properties in a decade in some counties [30]. In another U.S. study, 35% of Californian hardwood rangeland properties changed ownership over a 7-year period [59]. The recorded turnover rate also lends some credibility to the often-mentioned prediction that over two thirds of farmland is expected to change ownership in the next few decades [60], though this study shows that smaller properties are changing ownership more quickly but overall acreage more slowly.
The number of sales per year increased each year during the time period, with almost double the number of sales of farmland in 2015 compared to 2010. As noted by Pritchard et al. [20], the turnover rate of farmland is influenced by a range of factors including the agricultural cycle (including commodity prices), the rural property market, and the broader economy. Lacking comparative data about turnover rate from other moments in time, I can only note that the rate seems comparable to other regions studied, and increased during the study period, which was a time that the property market heated back up postrecession.
The median price per acre increased from 2011 to 2015, after an initial decline in 2010–2011 (which may have relayed to a delayed recession impact on farm properties). The 2015 median price per acre was similar to the 2010 price. Notably, I found higher median prices per acre than reported by the United States Department of Agriculture for a similar time period [37], suggesting that the method of tracking actual sales transactions may more accurately reflect the price arms-length buyer’s experience than government-reported measures. The median price per acre varied significantly by region and county, with the counties with known high-quality agricultural land and in proximity to cities and major transportation corridors having higher prices; the median price per acre also varied by type of property. The median price per acre was higher for smaller properties and improved properties compared to larger and unimproved properties.
A lot of actors, including in-state, out-of-state, and out-of-country actors and individuals, trusts, investors, and corporations are involved in farmland sales. Individuals and trusts continue to be the main buyers, comprising ~78% of buyers in Oregon, while corporations and investors comprised 19% of buyers in the timer period. In terms of land, however, corporate buyers and investors purchased over 40% of acres, meaning they bought much larger properties. The overall trend appears to be away from individual ownership to more corporate ownership especially of larger properties. Corporations bought approximately 40 properties of farmland annually, shifting ownership of about 6265 acres of farmland annually from individuals to corporations. Of those corporations, about half had explicit business activities related to agriculture, but the other half had stated activities in nonagricultural activities like land and real estate development.
Businesses identified specifically as investment companies accounted for ~1% of sales, notably lower than in Saskatchewan [23] and Iowa [61], where the percentages ranged from 25 to 50%. My methods, however, are not directly comparable, in that some of the corporations identified as land development-, property management-, and agricultural-related corporations (not investors) in this study could have been classified as investors in other studies depending on their approach.
I then attempted to understand more about the top (nonindividual) farmland buyers, in terms of acreage and price. Those actors included a range of buyer types, from family farm entrepreneurs to businesses with real estate development interests. Other notable buyers included public entities and conservation organizations, mainly land trusts. In sum, the picture painted about the future of farming in Oregon, at least from the largest purchases, suggests greater consolidation, more ownership by nonlocal entities, greater pressure on short and long-term financial returns from farmland from investment companies, and some conversion of land into other uses. Some of the development-related buyers (e.g., RBH, Hamilton Ranches LLC, and Loyal Land LLC) appear interested in converting the land to resorts and other highly developed uses, while public agencies bought farmland to turn into ports and parks. Those with developer interest have been met with some pushback, for example in the cases of the St. Helens Port and in the resort in Central Oregon, but the future of those properties remains in question.
In the case of the conservation organizations, Western Rivers Conservancy appears committed to pursuing the continuation of sustainable agriculture alongside ecological protection and restoration, but other conservation organizations may forgo agriculture altogether.
There has been a lot of attention to investor purchase, and it appears that that investor activity, while a relatively low percentage of buyers, is occurring and particularly noticeable among the list of top investors by price and acreage. Oregon Trail Highway LLC appears to be an investor that then leases the land to farmers, while ACMPC appears to be more of a foreign-based vertically integrated investor/operator focused on farmland acquisition throughout the world. The implications of increasing investor ownership are not entirely clear, but other authors have raised concerns that investor ownership puts extreme pressure on farmland and farmers to return both short-term and long-term profits, which could lead to farm managers making decisions that prioritize short-term profits and economic maximization at the expense of, for example, fair labor and environmental practices. Another possible impact from greater investor ownership is that farmers and farmworkers have less chance to own land themselves, and thus potentially less motivation to invest in long-term in the land. They also carry less of the risk and, ultimately, less of the reward, associated with land ownership. Another unknown impact is to that of labor. It is unclear if investor companies will hire local labor, try to bring in labor from outside, or move to more mechanized farming practices to avoid labor altogether. Their actions will have differing impacts to people in rural communities.
The other impacts to farmers, rural communities, food systems, and the environment from the pattern of recent sales documented in this study can only be speculated. One noteworthy trend among smaller farms is their high prices, especially relative to expected income from farming. The high land prices likely pose a significant barrier for beginning farmers, small-scale farmers, and farmers without financial resources. It may also be problematic overall for farmers if farm net incomes continue to be compressed. Landowners may feel extra pressure to sell to other buyers when land prices are high.
This study shows evidence of ongoing consolidation and nonlocal ownership, issues that other authors have suggested contributes to lower rural populations, declining tax bases, and a loss of social connectivity and trust [24].
As for impacts of the food system and to the environment, one obvious impact is that some of the owners plan to convert farmland to other uses, resulting in a loss of farmland base. The specific environmental practices of all of the owners are not known. Some of the buyers have made public statements about their commitment to sustainable practices, though their actual practices must be studied over time before conclusions can be made.
The study demonstrated a new method for examining farmland ownership using assessor records, and also had some important limitations. One of the main limitations is my limited ability to analyze specific owners. This limit comes from the source of the data, which was ownership transfer records obtained from the County assessor’s office. The analysis of in-state and out-of-state was limited to the grantee address in the records, but this may not be their actual previous residence. For example, some out-of-state grantees may have established Oregon mailing addresses and thus appeared as in-state grantees. Most counties did not record the last legal mailing address for grantees before the finalization of sales. In some cases, mailing addresses were not provided at all.
Another limit relevant to the ability to analyze owners is that the records only included names of individuals. I was unable to investigate individuals further than their name, and thus am unable to say anything about the motivations and intent of individuals, for example, wealthy individuals or family trusts. As for business entities, this analysis was limited to searches in the Oregon Business Records, on company websites and on the internet for media. I was able to share information about past and stated business activities and potential intent with these purchases, but was not able to conduct interviews with insiders to better understand their investment strategies. I also was not able to track the properties over time or do a full assessment to understand the full impacts to agriculture, the environment and rural communities.
A third limitation was the constrained time period, 2010–2015. A lot of activity has happened since then, and we are unable to report on that. While I was able to track changes from grantor to grantee, I was not able to compare the overall data to historical time periods.
A fourth limitation is that I did not attempt to track whether some actors bought multiple parcels on different dates or in different counties during the study period. Without doing that, it is possible I missed other actors who bought cumulatively more land or spent more money than the actors I focused on in this paper. Follow-up research may want to consider tracking owners that purchase and own multiple properties.
A final noteworthy limitation is that I used a very broad definition of farmland in this study, and thus ended up including very small parcels including those of less than 5 acres, which is a very different type of farm property than properties of 20, 40, and 80+ acres. Future researchers may want to distinguish between smaller and larger properties. I suspect that different kinds of actors are involved in purchases of different properties but I was unable to investigate the owners of smaller properties in part because those often were individuals.
5. Conclusions
This article addresses one aspect of the long-standing agrarian question, by examining the ongoing capitalist transition on agricultural lands and the social and economic consequences of this transition [62]. More specifically, I examined which actors are buying farmland and the potential impacts. Who owns our agricultural land has important implications for food systems, the environment, farmer livelihoods, and rural economies, communities and landscapes.
In this paper, I showed that while Oregon continues to have a strong majority of individual land ownership associated with family farming, that picture is changing incrementally to more ownership by corporations and investors. A wide range of nonfamily actors, including some without agricultural motivations, are buying larger farm properties. As is the case across the globe, investors are actively involved in buying farmland, and this research began identifying the names and details of key investors. Meanwhile, some family-owned farms are consolidating and scaling up. The pattern varies across the state, and by property type. The experience in Oregon article adds place-specific empirical understanding of ongoing trends in farmland ownership and dynamics in rural land transactions, notably rising prices, corporatization, consolidation, and financialization.
Future research could build on these methods by analyzing farmland sales by location at a finer scale than by county (e.g., by zip code) and incorporating additional information about housing, proximity to transportation, soil class, and water rights. This will, however, require more standardized reporting from county assessors, since the recorded I obtained did not include complete or standardized addresses or locations.
Future researchers may also seek to interview buyers and community members, and/or to track individual parcels over time as ownership changes, to track the impacts of different owners on farmland management, practices, and other social and environmental impacts. In terms of environmental impacts, one consideration for further research is to examine which farms are certified Organic by the US Department of Agriculture.
One point that the research illuminates is that farmland ownership will likely continue to change in Oregon. Without changes to agricultural policy, the real estate market, the economics of farming, and more, we will likely see continuing consolidation, corporatization, investor ownership, and conversion of farmland to other uses not just in Oregon but elsewhere in agricultural landscapes in the United States.
If rural community members, policy makers, agriculturalists, and food movement leaders are concerned about these trends, they will need to evaluate policies and other strategies that constrain corporate or financial ownership, reduce or remove the development attractiveness of farmland properties, and facilitate farmland purchase and livelihoods by farming families and small and medium-scale farming operations.
Funding
This research was funded by Portland State University, Faculty Enhancement Grant. Publication of this article in an open access journal was funded by the Portland State University Library’s Open Access Fund.
Acknowledgments
I am grateful for the assistance in data collection and analysis by the following graduate students: including Andrea Villaroel, Sarah Baca, Ansel Carr, and most notably, Chris DeVenicia. I also appreciate the feedback on earlier versions of this study by members of the Oregon Community Food Systems Network, Access to Land Committee.
Conflicts of Interest
The author declares no conflicts of interest.
References
- Geisler, C. Disowned by the ownership society: How Native Americans lost their land. Rural Sociol. 2014, 79, 56–78. [Google Scholar] [CrossRef]
- Dunbar-Ortiz, R. An Indigenous Peoples’ History of the United States; Beacon Press: Boston, MA, USA, 2014. [Google Scholar]
- Salamon, S. Cultural Dimensions of Land Tenure in the United States. In Who Owns America? Land and Natural Resource Tenure Issues in a Changing Environment Conference; Land Tenure Center at the University of Wisconsin-Madison: Madison, WI, USA, 1995. [Google Scholar]
- Feagin, J.; Sherraden, M.; Morris, L. Documenting the Costs of Slavery, Segregation, and Contemporary Discrimination: Are Reparations in Order for African Americans? Report No.: 00-10; Center for Social Development, Washington University: St. Louis, MO, USA, 2000. [Google Scholar]
- Opie, J. The Law of the Land: Two Hundred Years of American Farmland Policy; University of Nebraska Press: Lincoln, NE, USA, 1987. [Google Scholar]
- United States Department of Agriculture. Farmland Ownership and Tenure; United States Department of Agriculture: Washington, DC, USA, 2014.
- Graddy-Lovelace, G.; Diamond, A. From supply management to agricultural subsidies—and back again? The U.S. Farm Bill & agrarian (in)viability. J. Rural Stud. 2017, 50, 70–83. [Google Scholar]
- McMichael, P. A food regime genealogy. J. Peasant Stud. 2009, 36, 139–169. [Google Scholar] [CrossRef]
- Friedmann, H. Discussion: Moving Food Regimes forward: Reflections on Symposium Essays; Agric Human Values; Springer: Dordrecht, The Netherlands, 2009; Volume 26, pp. 335–344. [Google Scholar]
- Desmarais, A.; Magnan, A.; Qualman, D.; Wiebe, N. Land grabbing and land concentration: Mapping changing patterns of farmland ownership in three rural municipalities in Saskatchewan, Canada. Can. Food Stud./La Rev. Can. Des Études Sur. L’alimentation 2015, 2, 16–47. [Google Scholar] [CrossRef]
- Dimitri, C.; Effland, A.; Conklin, N. The 20th Century Transformation of U.S. Agriculture and Farm Policy; United States Department of Agriculture, Economic Research Service: Washington, DC, USA, 2005.
- Macdonald, J.M.; Hoppe, R.A.; Newton, D. Three Decades of Consolidation in U.S. Agriculture; United States Department of Agriculture: Washington, DC, USA, 2018.
- United States Department of Agriculture Economic Research Service. Farming and Farm Income. Available online: https://www.ers.usda.gov/data-products/ag-and-food-statistics-charting-the-essentials/farming-and-farm-income/ (accessed on 15 January 2019).
- Pritchard, B.; Burch, D.; Lawrence, G. Neither ‘family’ nor ‘corporate’ farming: Australian tomato growers as farm family entrepreneurs. J. Rural Stud. 2007, 23, 75–87. [Google Scholar] [CrossRef]
- Lewontin, R.C. The Maturing of Capitalist Agriculture: Farmer as Proletarian; Monthly Review Foundation, Inc.: New York, NY, USA, 1998; Volume 50, pp. 72–85. [Google Scholar]
- Fairbairn, M. ‘Like gold with yield’: Evolving intersections between farmland and finance. J. Peasant Stud. 2014, 41, 777–795. [Google Scholar] [CrossRef]
- De Maria, M. Understanding Land in the Context of Large-Scale Land Acquisitions: A Brief History of Land in Economics. Land 2019, 8, 15. [Google Scholar] [CrossRef]
- Edelman, M.; León, A. Cycles of land grabbing in Central America: An argument for history and a case study in the Bajo Aguán, Honduras. Third World Q. 2013, 34, 1697–1722. [Google Scholar] [CrossRef]
- White, B.; Borras, S.M., Jr.; Hall, R.; Scoones, I.; Wolford, W. The new enclosures: Critical perspectives on corporate land deals. J. Peasant Stud. 2012, 39, 619–647. [Google Scholar] [CrossRef]
- Pritchard, B.; Neave, M.; Hickey, D.; Troy, L. Rural Land in Australia: A Framework for the Measurement and Analysis of Nationwide Patterns of Ownership Change, Aggregation and Fragmentation; Rural Industries Research and Development Corporation: Barton, Australia, 2012. [Google Scholar]
- Sommerville, M.; Magnan, A. ‘Pinstripes on the prairies’: Examining the financialization of farming systems in the Canadian prairie provinces. J. Peasant Stud. 2015, 42, 119–144. [Google Scholar] [CrossRef]
- Magnan, A. The financialization of agri-food in Canada and Australia: Corporate farmland and farm ownership in the grains and oilseed sector. J. Rural Stud. 2015, 41, 1–12. [Google Scholar] [CrossRef]
- Magnan, A.; Sunley, S. Farmland investment and financialization in Saskatchewan, 2003–2014: An empirical analysis of farmland transactions. J. Rural Stud. 2017, 49, 92–103. [Google Scholar] [CrossRef]
- Desmarais, A.A.; Qualman, D.; Magnan, A.; Wiebe, N. Investor ownership or social investment? Changing farmland ownership in Saskatchewan, Canada. Agric. Hum. Values 2017, 34, 149–166. [Google Scholar] [CrossRef]
- Gunnoe, A. The political economy of institutional landownership: Neorentier society and the financialization of land. Rural Sociol. 2014, 79, 478–504. [Google Scholar] [CrossRef]
- Sutherland, L.A. Return of the gentleman farmer? Conceptualising gentrification in UK agriculture. J. Rural Stud. 2012, 28, 568–576. [Google Scholar] [CrossRef]
- Gosnell, H.; Abrams, J. Amenity migration: Diverse conceptualizations of drivers, socioeconomic dimensions, and emerging challenges. GeoJournal 2011, 76, 303–322. [Google Scholar] [CrossRef]
- Prosperi, P.; Kirwan, J.; Maye, D.; Bartolini, F.; Vergamini, D.; Brunori, G. Adaptation strategies of small-scale fisheries within changing market and regulatory conditions in the EU. Mar. Policy 2019, 100, 316–323. [Google Scholar] [CrossRef]
- Wilson, G.A.; Burton, R.J.F. ‘Neo-productivist’ agriculture: Spatio-temporal versus structuralist perspectives. J. Rural Stud. 2015, 38, 52–64. [Google Scholar] [CrossRef]
- Gosnell, H.; Haggerty, J.H.; Travis, W.R. Ranchland ownership change in the Greater Yellowstone Ecosystem, 1990–2001: Implications for conservation. Soc. Nat. Resour. 2006, 19, 743–758. [Google Scholar] [CrossRef]
- Gosnell, H.; Travis, W.R. Ranchland ownership dynamics in the Rocky Mountain West. Rangel Ecol Manag. 2009, 58, 191–198. [Google Scholar] [CrossRef]
- Bryson, J.; Wyckoff, W. Rural gentrification and nature in the Old and New Wests. J. Cult. Geogr. 2010, 27, 53–75. [Google Scholar] [CrossRef]
- American Farmland Trust. Farms Under Threat: The State of America’s Farmland. 2018. Available online: https://www.farmland.org/ (accessed on 26 February 2019).
- Lopez, R.A.; Adelaja, A.O.; Andrews, M.S. The effects of suburbanization on agriculture. Am. J. Agric. Econ. 1988, 70, 346. [Google Scholar] [CrossRef]
- Wu, J.; Cho, S.-H. The effect of local land use regulations on urban development in the Western United States. Reg. Sci. Urban Econ. 2007, 37, 69–86. [Google Scholar] [CrossRef]
- USDA-National Agricultural Statistics Service. Trends in U.S. Agriculture-Land Values. Available online: https://www.nass.usda.gov/Publications/Trends_in_U.S._Agriculture/Land_Values/index.php (accessed on 11 January 2019).
- Burns, C.; Key, N.; Tulman, S.; Borchers, A.; Weber, J. Farmland Values, Land Ownership, and Returns to Farmland, 2000–2016. United States Department of Agriculture (USDA): Washington, DC, USA, 2018. [Google Scholar]
- United States Department of Agriculture Economic Research Service. Highlights From the Farm Income Forecast. Available online: https://www.ers.usda.gov/topics/farm-economy/farm-sector-income-finances/highlights-from-the-farm-income-forecast/ (accessed on 11 January 2019).
- Gosnell, H.; Kline, J.D.; Chrostek, G.; Duncan, J. Is Oregon’s land use planning program conserving forest and farm land? A review of the evidence. Land Use Policy 2010, 28, 185–192. [Google Scholar] [CrossRef]
- Gray, A.; Hubner, D.; Lettman, G.J.; Mckay, N.; Thompson, J. Land Use Change on Non-Federal Land in Oregon 1974–2014; Oregon Department of Forestry: Salem, OR, USA, 2016.
- Oregon Department of Agriculture. Dairy Licensing. Available online: https://www.oregon.gov/oda/programs/foodsafety/fslicensing/pages/dairy.aspx (accessed on 20 February 2019).
- Abrams, J.B.; Gosnell, H. The politics of marginality in Wallowa County, Oregon: Contesting the production of landscapes of consumption. J. Rural Stud. 2012, 28, 30–37. [Google Scholar] [CrossRef]
- Oregon. Available online: https://www.50states.com/images/redesign/maps/or-largemap.png (accessed on 7 February 2019).
- Oregon Department of Agriculture. Oregon Agricultural Regions; Oregon Department of Agriculture: Salem, OR, USA, 2017.
- Perkowski, M. 77,000-Acre Cattle Operation Changes Hands; Capital Press: Salem, OR, USA, 2014. [Google Scholar]
- Ditzler, J. Historic, 21,500-Acre Crook County Ranch Sold; Sale is Second Large Ranch in County to Sell in Two Months; The Bulletin: Hong Kong, China, 2014. [Google Scholar]
- Shorack, T. Rulings Unfavorable to Thornburgh Resort Plan; Proposed Development West of Redmond Going back to Deschutes County; The Bulletin: Hong Kong, China, 2015. [Google Scholar]
- Land Use Board of Appeals. Final Opinion and Order, Central Land and Cattle Company, LLC and Kameron Delashmutt vs. DesChutes County; Land Use Board of Appeals: Salem, OR, USA, 2015.
- Zuniga, K. Long-Debated Resort Near Redmond Back for Another Try—KTVZ. Available online: KTVZ.com (accessed on 30 December 2018).
- Gladstone Land Corporation. Available online: https://ir.gladstoneland.com/investor-relations (accessed on 5 February 2019).
- Dow Ranches. Available online: http://dowranches.com/ (accessed on 5 February 2019).
- Western Rivers Conservancy. Thirtymile Creek, John Day River. Available online: http://www.westernrivers.org/projectatlas/john-day-thirtymile-creek/ (accessed on 5 February 2019).
- Culverwell, W. Portland firm closes $250M fund to support sustainable berry and hazelnut farms. Portland Bus. J. 2015. [Google Scholar]
- Agriculture Capital. Available online: https://agriculturecapital.com/ (accessed on 5 February 2019).
- Tualatin Hills Park and Recreation District. 23-acre Teufel Site to be Future Park; THPRD also Buys Land for Natural Area, Trail Connection; Oregon Live: Portland, OR, USA, 2011. [Google Scholar]
- Haugen, S. Country Kids Continue Century of Farming. News Times. Available online: https://pamplinmedia.com/fgnt/36-news/267401-141184-country-kids-continue-century-of-farming?fbclid=IwAR2Uw0s6JTZv-dk-eFP9H099FH6F2oBjqhXMA_MeImMPnji9wKfX4LvVj3k (accessed on 5 February 2019).
- Borgaard, C. New Port of St. Helens Executive Director Eyes Expansion. The Daily News. 2011. Available online: https://tdn.com/news/local/new-port-of-st-helens-executive-director-eyes-expansion/article_ca79a872-5c03-11e0-b9bd-001cc4c002e0.html (accessed on 26 February 2019).
- Plaven, G. County Land Use Decision Faces Appeal; Capital Press: Salem, OR, USA, 2018; Available online: https://www.capitalpress.com/state/oregon/county-land-use-decision-faces-appeal/article_4b461d58-c05f-581c-93a0-25939486be3e.html (accessed on 5 February 2019).
- Huntsinger, L.; Johnson, M.; Stafford, M.; Fried, J. Hardwood rangeland landowners in California from 1985 to 2004: Production, ecosystem services, and permanence. Rangel. Ecol. Manag. 2010, 63, 324–334. [Google Scholar] [CrossRef]
- Brekken, C.A.; Gwin, L.; Horst, M.; Mcadams, N.; Martin, S.; Stephenson, G. The Future of Oregon’s Agricultural Land; Portland State University: Portland, OR, USA, 2016. [Google Scholar]
- Duffy, M.; Johanns, A. Farmland Ownership and Tenure in Iowa 2012; Iowa State University Extension and Outreach: Ames, IA, USA, 2014. [Google Scholar]
- Goodman, D.; Watts, M. Globalising Food: Agrarian Questions and Global Restructuring; Goodman, D., Watts, M., Eds.; Routledge: London, UK, 1997. [Google Scholar]
Figure 1.
Location of Oregon, U.S.A. [43].
Figure 1.
Location of Oregon, U.S.A. [43].

Figure 2.
Seven agricultural regions of Oregon

Figure 3.
(a) Price per acre of non-EFU-zoned farmland, by county. (b) Price per acre of EFU-zoned farmland, by county.
Figure 3.
(a) Price per acre of non-EFU-zoned farmland, by county. (b) Price per acre of EFU-zoned farmland, by county.

Figure 4.
Price per acre by farmland type, county, and region.

Figure 5.
Buyer types, by number and percentages.


Table 1.
Oregon region farmland sales (2010–2015).
| Total Number of Farmland Property Sales 2010–2015 | 13,489 |
| Total Number of Farmland Acres Sold 2010–2015 | 1,392,155 |
| Qualified Farmland Property Sales 2010–2015 (Sales over $1000) | 9909 |
| Average Annual Qualified Farmland Property Sales | 1656 |
| Total Qualified Farmland Acres Sold | 1,169,552 |
| Average Annual Farmland Acres Sold | 194,295 |
| Median Acreage/Average Acreage Per Sale | 20/119 |
| Median Price Per Acre | $10,512 |
| Median Price Per Acre, Improved/Unimproved | $15,685/$4487 |
| Median Price Per Acre, Zoned Exclusive Farm Use/Not Zoned Exclusive Farm Use | $9841/$19,357 |
Table 2.
Top ten purchases by price (2010–2015).
| Central Region | |||||||
| Sale Price | Name of Buyer | Buyer Type | Total Acres/Price Per Acre | County | Year Purchased | Property Type | |
| 1 | $11,766,936 | RBH Oregon LLC | LLC: Multifaceted | 160 acres/$73,740 | Crook | 2014 | EFU-zoned, vacant |
| 2 | $10,445,10* | Stafford Ranches LLC | LLC: Agriculture | 637 acres/$18,471 | Crook | 2014 | Combination |
| 3 | $7,577,319* | Hamilton Ranch LLC | LLC: Real Estate, Land Development & Property Management | 17,077 acres/$534 | Crook | 2014 | Combination |
| 4 | $8,000,0000 | Loyal Land LLC | LLC: Real Estate, Land Development & Property Management | 1,783 acres/$4487 | DesChutes | 2011 | EFU-zoned, vacant |
| 5 | $6,307,401 | Individual | Individual | 80 acres/$78,843 | DesChutes | 2010 | EFU-zoned, improved |
| 6 | $5,300,000* | Malott Mark & Ann & Ann LLC | LLC: Agriculture | 777 acres/$6818 | Crook | 2014 | EFU-zoned, vacant |
| 7 | $3,100,000 | AJ Dairy LLC | LLC: Agriculture | 378 acres/$8201 | Jefferson | 2012 | EFU-zoned, improved |
| 8 | $2,600,000 | Individual | Individual | 413 acres/$6295 | DesChutes | 2011 | EFU-zoned, improved |
| Columbia Gorge Region | |||||||
| Sale Price | Name of Buyer | Buyer Type | Total Acres/Price Per Acre | County | Year | Property Type | |
| 1 | $65,000,000 | Individual | Individual | 7289 acres/$ 8918 | Morrow | 2015 | EFU, improved |
| 2 | $13,855,000 | Oregon Trail Highway LLC | Real Estate, Land Development & Property Management | 1897 acres/$7300 | Morrow | 2013 | EFU, improved |
| 3 | $6,669,000 | Neal J Dow Family Limited Partners LP | Trust/LP/Estate | 13,273 acres/$502 | Morrow | 2014 | EFU, improved |
| 4 | $6,100,000 | Western River Conservancy | Conservation Organization | 14,148 acres/$431 | Gillam | 2014 | EFU, improved |
| 5 | $5,134,971 | Eagle Creek Northwest LLC* | Real Estate, Land Development & Property Management | 33 acres/$151,922 | Hood River | 2010 | EFU, improved |
| 6 | $3,610,758 | State of Oregon | Government Agency | 3406 acres/$1060 | Gillam | 2013 | EFU, unimproved |
| 7 | $3,600,000 | Weedman Brothers | Agriculture | 3970 acres/$907 | Gillam | 2012 | EFU, improved |
| 8 | $3,130,000* | JPD Land Company LLC | Real Estate, Land Development & Property Management | 184.5 acres/$17,056 | Hood River | 2012 | EFU, improved |
| $3,425,000 | Meadowbrook Farms LLC* | Agriculture | 2036 acres/$1681 | Morrow | 2014 | EFU, improved | |
| $2,350,000 | Bellinger Properties LLC | Real Estate, Land Development & Property Management | 339 acres/$6930 | Morrow | 2013 | EFU, improved | |
| Willamette Valley Region | |||||||
| Sale Price | Name of Buyer | Buyer Type | Total Acres/Price Per Acre | County | Year | Property Type | |
| 1 | $4,766,254 | ACMPC Oregon 1 LLC | LLC: Agriculture | 1211 acres, $3936 | Polk | 2014 | EFU, improved |
| 2 | $4,733,746 | ACMPC Oregon 2 LLC | LLC: Agriculture | 1202 acres, $3936 | Polk | 2014 | EFU, improved |
| 3 | $8,000,000 | Tualatin Hills Park & Recreation* | Public Agency | 22 acres, $357,622 | Washington County | 2011 | Non-EFU, unimproved |
| 4 | $6,141,278 | Individual | Individual | 11.42 acres, $537,765 | Clackamas | 2014 | EFU, improved |
| 5 | $5,900,000 | Finnegan Farms, Inc. | Inc: Agriculture | 405 acres, $7270 | Washington | 2015 | EFU, improved |
| 6 | $5,850,000 | Individual | Individual | 468 acres, $12,492 | Marion | 2012 | EFU, improved |
| 7 | $5,700,000 | Woodburn Organic Farms LLC | LLC: Agriculture | 393 acres, $14,483 | Marion | 2013 | EFU, improved |
| 8 | $5,295,000 | Columbia Land Trust | Conservation Organization | 920 acres, $5754 | Columbia | 2015 | EFU, improved |
| 9 | $4,394,597 | Lennar Northwest Inc* | Inc: Real Estate, Land Development & Property Management | 18 acres, $241,196 | Clackamas | 2015 | Non-EFU, improved |
| 10 | $4,380,000 | RB Pamplin Corporation | Corp: Investment Company | 289 acres $15,104 | Washington | 2012 | EFU, improved |
Table 3.
Top 10 purchasers by acreage (2010–2015).
| Central Region | |||||||
| Size (Acres) | Name of Buyer | Buyer Type | Price, Price Per Acre | County | Year | Property Type | |
| 1 | 17,077 | Hamilton Ranch LLC* | LLC: Real Estate, Land Development & Property Management | $7,577,319/$534 | Crook | 2014 | Combination |
| 2 | 9237 | 1100 LLC* | LLC: Real Estate, Land Development & Property Management | $4,036,569/$437 per acre | Crook | 2015 | Combination |
| 3 | 5977 | Family Trust | Trust/LP/Estate | $1,947,518$325 per acre | Crook | 2013 | Combination |
| 4 | 4753 | Individual | Individual | $61,500/$13 per acre | Jefferson | 2012 | EFU, unimproved |
| 5 | 3552 | 96 Ranch LLC | LLC: Agriculture | $1,272,500/$358 per acre | Crook | 2013 | EFU, improved |
| 6 | 2856 | Fryer Creek Ranch LLC | LLC: Agriculture | $1,165,606/$408 per acre | Crook | 2011 | EFU, improved |
| 7 | 6235 | Milgard James DBA Desert Creek Ranch | Agriculture | $2,450,000/$413 per acre | Crook | 2015 | EFU, improved |
| 8 | 2418 | Circle F Ranches Inc | Inc: Agriculture | $2,020,000/$835 per acre | Crook | 2015 | EFU, unimproved |
| 9 | 2305 | RB Pamplin | Corp: Investment Company | $1,100,000/$477 per acre | Jefferson | 2012 | EFU, unimproved |
| 10 | 1716 | Individual | Individual | $287,074/$167 per acre | Crook | 2010 | EFU, unimproved |
| Colombia Gorge Region | |||||||
| Size (Acres) | Name of Buyer | Buyer Type | Total Price, Price Per Acre | County | Year | Property Type | |
| 1 | 14,148 | Western River Conservancy | Conservation Organization | $6,100,000/$431 per acre | Gillam | 2014 | EFU, improved |
| 2 | 13,273 | Neal J Dow Family Limited Partners LP | Trust/LP/Estate | $6,669,000/$502 per acre | Morrow | 2014 | EFU, improved |
| 3 | 7288 | Individual | Individual | $65,000,000/$8918 per acre | Morrow | 2015 | EFU, improved |
| 4 | 6149 | McElligott LLC | LLC: Agriculture | $1,650,00/$268 per acre | Gillam | 2010 | EFU, improved |
| 5 | 5752 | Tritazu Investments LLC | LLC: Real Estate, Land Development & Property Management | $1,955,000/$340 per acre | Gillam | 2013 | EFU, improved |
| 6 | 5234 | Oregon Eat, LLC | LLC: Unknown | $1,900,000/$363 per acre | Morrow | 2015 | EFU, improved |
| 7 | 3970 | Weedman Brothers | Agriculture | $3,600,00/$907 per acre | Gillam | 2012 | EFU, improved |
| 8 | 3949 | Individual Co-Trustees | Trust/LP/Estate | $1,600,000/$405 per acre | Gillam | 2015 | Non-EFU, improved |
| 9 | 3406 | State of Oregon | Government Agency | $3,610,75/$1060 per acre | Gillam | 2011 | EFU, improved |
| 10 | 3135 | Kamerrer Farms Inc | Inc: Agriculture | $1,400,00/$447 per acre | Gillam | 2014 | EFU, improved |
| Willamette Valley Region | |||||||
| Size (Acres) | Name of Buyer | Buyer Type | Total Price, Price Per Acre | County | Year | Property Type | |
| 1 | 1211 | ACMPC Oregon 1 LLC | LLC: Agriculture | $4,766,496/$3936 per acre | Polk | 2014 | EFU, improved |
| 2 | 1203 | ACMPC Oregon 2 LLC | LLC: Agriculture | $4,734,260/$3936 per acre | Polk | 2014 | EFU, improved |
| 3 | 926 | Individual | Individual | $5,330,966/5754 per acre | Yamhill | 2013 | EFU, improved |
| 4 | 920 | Columbia Land Trust | Conservation Organization | $3,680,760/$4000 per acre | Columbia | 2012 | EFU, improved |
| 5 | 737 | Port of St. Helens | Public Agency | $2,787,409.8/$3780 per acre | Columbia | 2010 | EFU, improved |
| 6 | 675 | Turner Stayton Properties LLC | LLC: Real Estate, Land Development & Property Management | $1,546,620/$2290 per acre | Marion | 2013 | EFU, unimproved |
| 7 | 655 | Jackson Family Investments III LLC | LLC: Agriculture | $2,234,205/$3411 per acre | Polk | 2013 | Non-EFU, unimproved |
| 8 | 594 | ED Beitel Farm LLC | LLC: Real Estate, Land Development & Property Management | $2,264,965/$3815 per acre | Marion | 2010 | EFU, unimproved |
| 9 | 577 | RB Webber Development LLC | LLC: Real Estate, Land Development & Property Management | $2,742,912/$4762 per acre | Polk | 2012 | EFU, unimproved |
| 10 | 511 | El Presidente I-Salem LLC | LLC: Real Estate, Land Development & Property Management | $2,274,090/$4459 per acre | Linn | 2015 | EFU, improved |
© 2019 by the author. Licensee MDPI, Basel, Switzerland. This article is an open access article distributed under the terms and conditions of the Creative Commons Attribution (CC BY) license (http://creativecommons.org/licenses/by/4.0/).
Share and Cite
MDPI and ACS Style
Horst, M. Changes in Farmland Ownership in Oregon, USA. Land 2019, 8, 39. https://0-doi-org.brum.beds.ac.uk/10.3390/land8030039
AMA Style
Horst M. Changes in Farmland Ownership in Oregon, USA. Land. 2019; 8(3):39. https://0-doi-org.brum.beds.ac.uk/10.3390/land8030039
Chicago/Turabian StyleHorst, Megan. 2019. "Changes in Farmland Ownership in Oregon, USA" Land 8, no. 3: 39. https://0-doi-org.brum.beds.ac.uk/10.3390/land8030039
Note that from the first issue of 2016, this journal uses article numbers instead of page numbers. See further details here.