Article

Classifying and Mapping Periurban Areas of Rapidly Growing Medium-Sized Sub-Saharan African Cities: A Multi-Method Approach Applied to Tamale, Ghana

by
Hanna Karg
1,*,
Rafael Hologa
1,
Johannes Schlesinger
2,
Axel Drescher
3,
Gordana Kranjac-Berisavljevic
4 and
Rüdiger Glaser
1
1
Physical Geography, University of Freiburg, Schreiberstraße 20, 79085 Freiburg, Germany
2
svGeosolutions GmbH, Lise-Meitner-Str. 2, 79100 Freiburg, Germany
3
Institute of Geography, University of Erlangen-Nürnberg, Wetterkreuz 15, 91058 Erlangen, Germany
4
Directorate of International Relationships and Advancement (DIRA), University for Development Studies, Post Office Box TL 1350, Tamale, Ghana
*
Author to whom correspondence should be addressed.
Submission received: 8 January 2019 / Revised: 18 February 2019 / Accepted: 19 February 2019 / Published: 27 February 2019

Abstract

:
Periurban areas of growing cities in developing countries have been conceptualised as highly dynamic landscapes characterised by a mixture of socioeconomic structures, land uses and functions. While the body of conceptual literature on periurban areas has significantly increased over the past two decades, methods for operationalising these multi-dimensional concepts are rather limited. Yet, information about the location and areal extent of periurban areas is needed for integrated planning in the urban–rural interface. This article presents the results of a study aiming at classifying and mapping periurban areas along the urban–rural gradient of Tamale, a medium-sized city in Ghana. The study used a quantitative, multi-dimensional methodology involving the following as core elements: (1) a relative measure of how urban a place and its people are in terms of services, infrastructure and livelihoods (urbanicity index); (2) the diversity of households regarding their livelihoods and access to urban services; and (3) land use dynamics. Therefore, data from a household survey, as well as land use and other secondary geospatial data were collected and analysed at different spatial scales. The findings suggested that the periurban space consists of two main zones. Inner periurban areas are driven by urban expansion and the conversion of non-urban into urban land use is most visible here. These areas exhibit higher levels of socioeconomic diversity, compared to both rural and urban areas. Outer periurban areas are less dynamic in terms of land use change and exhibit lower building densities, and compared with rural areas, hold stronger links to the city related to the movement of people and goods. The spatial analysis revealed that periurban areas develop mainly along major transport corridors across administrative divisions, as well as in the form of periurban islands in the rural zone. This study set out to extend existing methodologies to map urban and periurban development in medium-sized cities in sub-Saharan Africa, useful for urban and regional planning beyond administrative boundaries.

1. Introduction

Rapidly growing urban populations come with a variety of major socioeconomic and ecological changes, in particular in developing countries. In sub-Saharan Africa, the urban transition is a relatively recent phenomenon, with urban growth rates being among the highest in the world [1]. In West Africa, the urban population is expected to increase from 44.9% in 2011 to 65.7% by 2050 (ibid.). This can be, to a large extent, attributed to the growth of towns and intermediate cities. Between 2000 and 2010, urban settlements with fewer than 300,000 dwellers accounted for 58% of Africa’s urban growth [2].
The areas facing the most significant changes regarding land use, farming systems, livelihoods, infrastructure, and pollution are those located between the fully urbanised core and the rural hinterland [3]. In the past two decades, these so-called periurban, or semi-urban areas have received attention in research and development as areas with distinct characteristics that need to be addressed on their own terms. Despite an increasing body of literature, no common explanatory theory or definition has been established, due to different disciplinary traditions and approaches, and the debate as to whether a fuzzy concept such as the periurban can be measured and compared [4]. However, in view of the increasing interest in holistic, integrated (landscape) research and related sustainability policies, a number of scholars have stressed the need for a general framework for periurban areas, including definitions, measurement and interpretation tools [5].
Having an idea about the spatial extent of these areas is useful, for example, when aggregating spatial data (e.g., the contribution of resources supplied by these areas). A spatial assessment of the periurban can also facilitate urban, rural and regional planning, but must go beyond the physical definition, often understood as clearly limited administrative entities, to a broader understanding of the “complex patterns of settlement and resource use, the flow of natural resources, of capital, goods, services and people” [6]. This notion was incorporated into the most recent global agendas such as the Sustainable Development Goals (SDGs) and the New Urban Agenda, which advocates an integrated urban and territorial approach to foster “urban-rural interactions and connectivity by strengthening sustainable transport and mobility, and technology and communication networks and infrastructure” [7].
This study aimed at classifying and mapping periurban areas in the context of medium-sized sub-Saharan African cities, using the example of Tamale, Ghana. It reflects on implications for planning and thus contributes to the development of territorial planning spaces beyond ‘rural’ or ‘urban’ administrative entities.

2. State of the Art

2.1. The Periurban Space in Planning

There is no standard definition of the ‘periurban’ while the categories of ‘urban’ and ‘rural’ are not consistently defined across countries. National criteria for classifying an area as urban are usually based on one or a combination of characteristics such as a population threshold, population density, proportion of people employed in the non-agricultural sector, and the presence of infrastructure [8]. Yet, conceptions of urban and rural on the one hand and the periurban space on the other continue to underpin planning policies [6]. Allen (2003) points to the challenge of overlapping institutions with different spatial and physical remits in the rural–urban interface, whereby “institutional arrangements or areas of responsibility tend to be either too small or too large, too urban or too rural in their orientation” to effectively address planning challenges [6]. Apart from its fuzzy boundaries and unclear remits, planning in the periurban areas is also challenged by its highly dynamic character and “non-linear” development [9], as well as by weak institutions, in particular in the context of sub-Saharan Africa.
There is an increasing recognition that the periurban area is more than an intermediary space between urban and rural and should be regarded as a landscape on its own. While there is no single, overarching theory explaining the periurban [4] due to the highly diverse contexts and settings, similar descriptions of the periurban and its properties and functions exist. Drescher & Iaquinta (2002) stressed the dynamic character of the periurban sphere, which is characterised by a “heterogeneous mosaic” of land uses, highly diverse and dynamic socio-economic structures, and a lack of institutions relevant to periurban areas [10]. Similarly, Allen et al. (2006) conceptualised the periurban interface as a mosaic of natural, agro-, and urban ecosystems affected by material and energy flows demanded by urban and rural areas [11]. Webster (2002) conceived the periurban as a process rather than as a type of region [12]. This process is strongly linked to flows of people (migration), goods (trade) and money (investment) driven largely by the activities within the urban zone [13,14].
These processes and flows are changing the “morphological and physical appearance” of an area [15]. Simon et al. (2004) stressed that “there are different types of transition zones between city and countryside […]. Some may resemble relatively uniform sprawl, others honeycomb structures or spines of growth along specific corridors” [16]. In the context of developing countries, Leeming & Soussan (1979) distinguished between two distinct spatial areas: the urban fringe constituted by former rural areas into which the city is physically expanding and a more extensive hinterland that is linked to the city in functional respects [17]. Two decades later, the Universities of Nottingham and Liverpool (1999) referred to these two broadly defined areas as, respectively, a zone experiencing the direct impacts of land demands from urban growth, pollution, commute, etc. and a broader market-related zone which is defined by trade and administrative links to the city [18].

2.2. Measuring the Periurban

Concepts of ‘urbanicity’ are commonly used to describe the “relative urban nature of a place” [19] along the urban–rural gradient. Introduced by Martin (1976) [20], the term has been further developed and refers to the “presence of conditions that are particular to urban areas or present to a much greater extent than in nonurban areas” [21].
Although country-specific differences exist, urbanicity parameters are commonly based on household, land use and/or secondary data, and range from population size or density, through services such as markets, education, health care and water/electricity, to transport, agriculture, and social factors. In a number of studies, an urbanicity index was created based on these parameters, and areas in the urban-rural interface were classified accordingly [19,22,23,24,25,26]. In general, the relevant studies differ with respect to (1) spatial scale (city, community, region, and country level), (2) data source (primary vs. secondary data), (3) time scale/frame (multi-temporal vs. single point in time), and (4) level of resolution (discrete administrative units vs. continuous units).
Gradient studies were employed to analyse changing landscape metrics along the urban–rural gradient, such as Luck and Wu’s (2002) study on Phoenix [27] and Yu and Ng’s (2007) analysis for Gunagzhou [28]. Most studies on sub-Saharan Africa—a region with a relatively recent history of urbanisation—have been small-scale and local, and therefore, limited to a small number of cities. The Department for International Development (DFID) [18,29] and Schlesinger (2013, 2018) [13,30] carried out two of the very few studies that used primary empirical data to classify periurban areas beyond the relative measure of urbanicity. Schlesinger (2013) based his analysis on land use and socioeconomic changes along the urban–rural gradient in Moshi, Tanzania and Bamenda, Cameroon, with data from ground mapping and a standardised household survey [13]. Adam (2001) characterised the periurban area of Kumasi, Ghana, using a stratified random sample of 66 villages within a 40 km radius from the city. Data from key informant interviews on farming systems, public transport and market links were used to cluster villages into three groups (urban, periurban and rural) [29]. Both studies offer interesting approaches, but also have their limitations. Adam’s (2001) village survey did not include household level data and therefore, the characterisation and diversity of households living in these areas were not assessed. Schlesinger’s (2013) transect approach does not allow for scaling up the smaller scale household and mapping data to the entire urban rural extent which, with a radius of 15 km, was rather limited.

3. Material and Methods
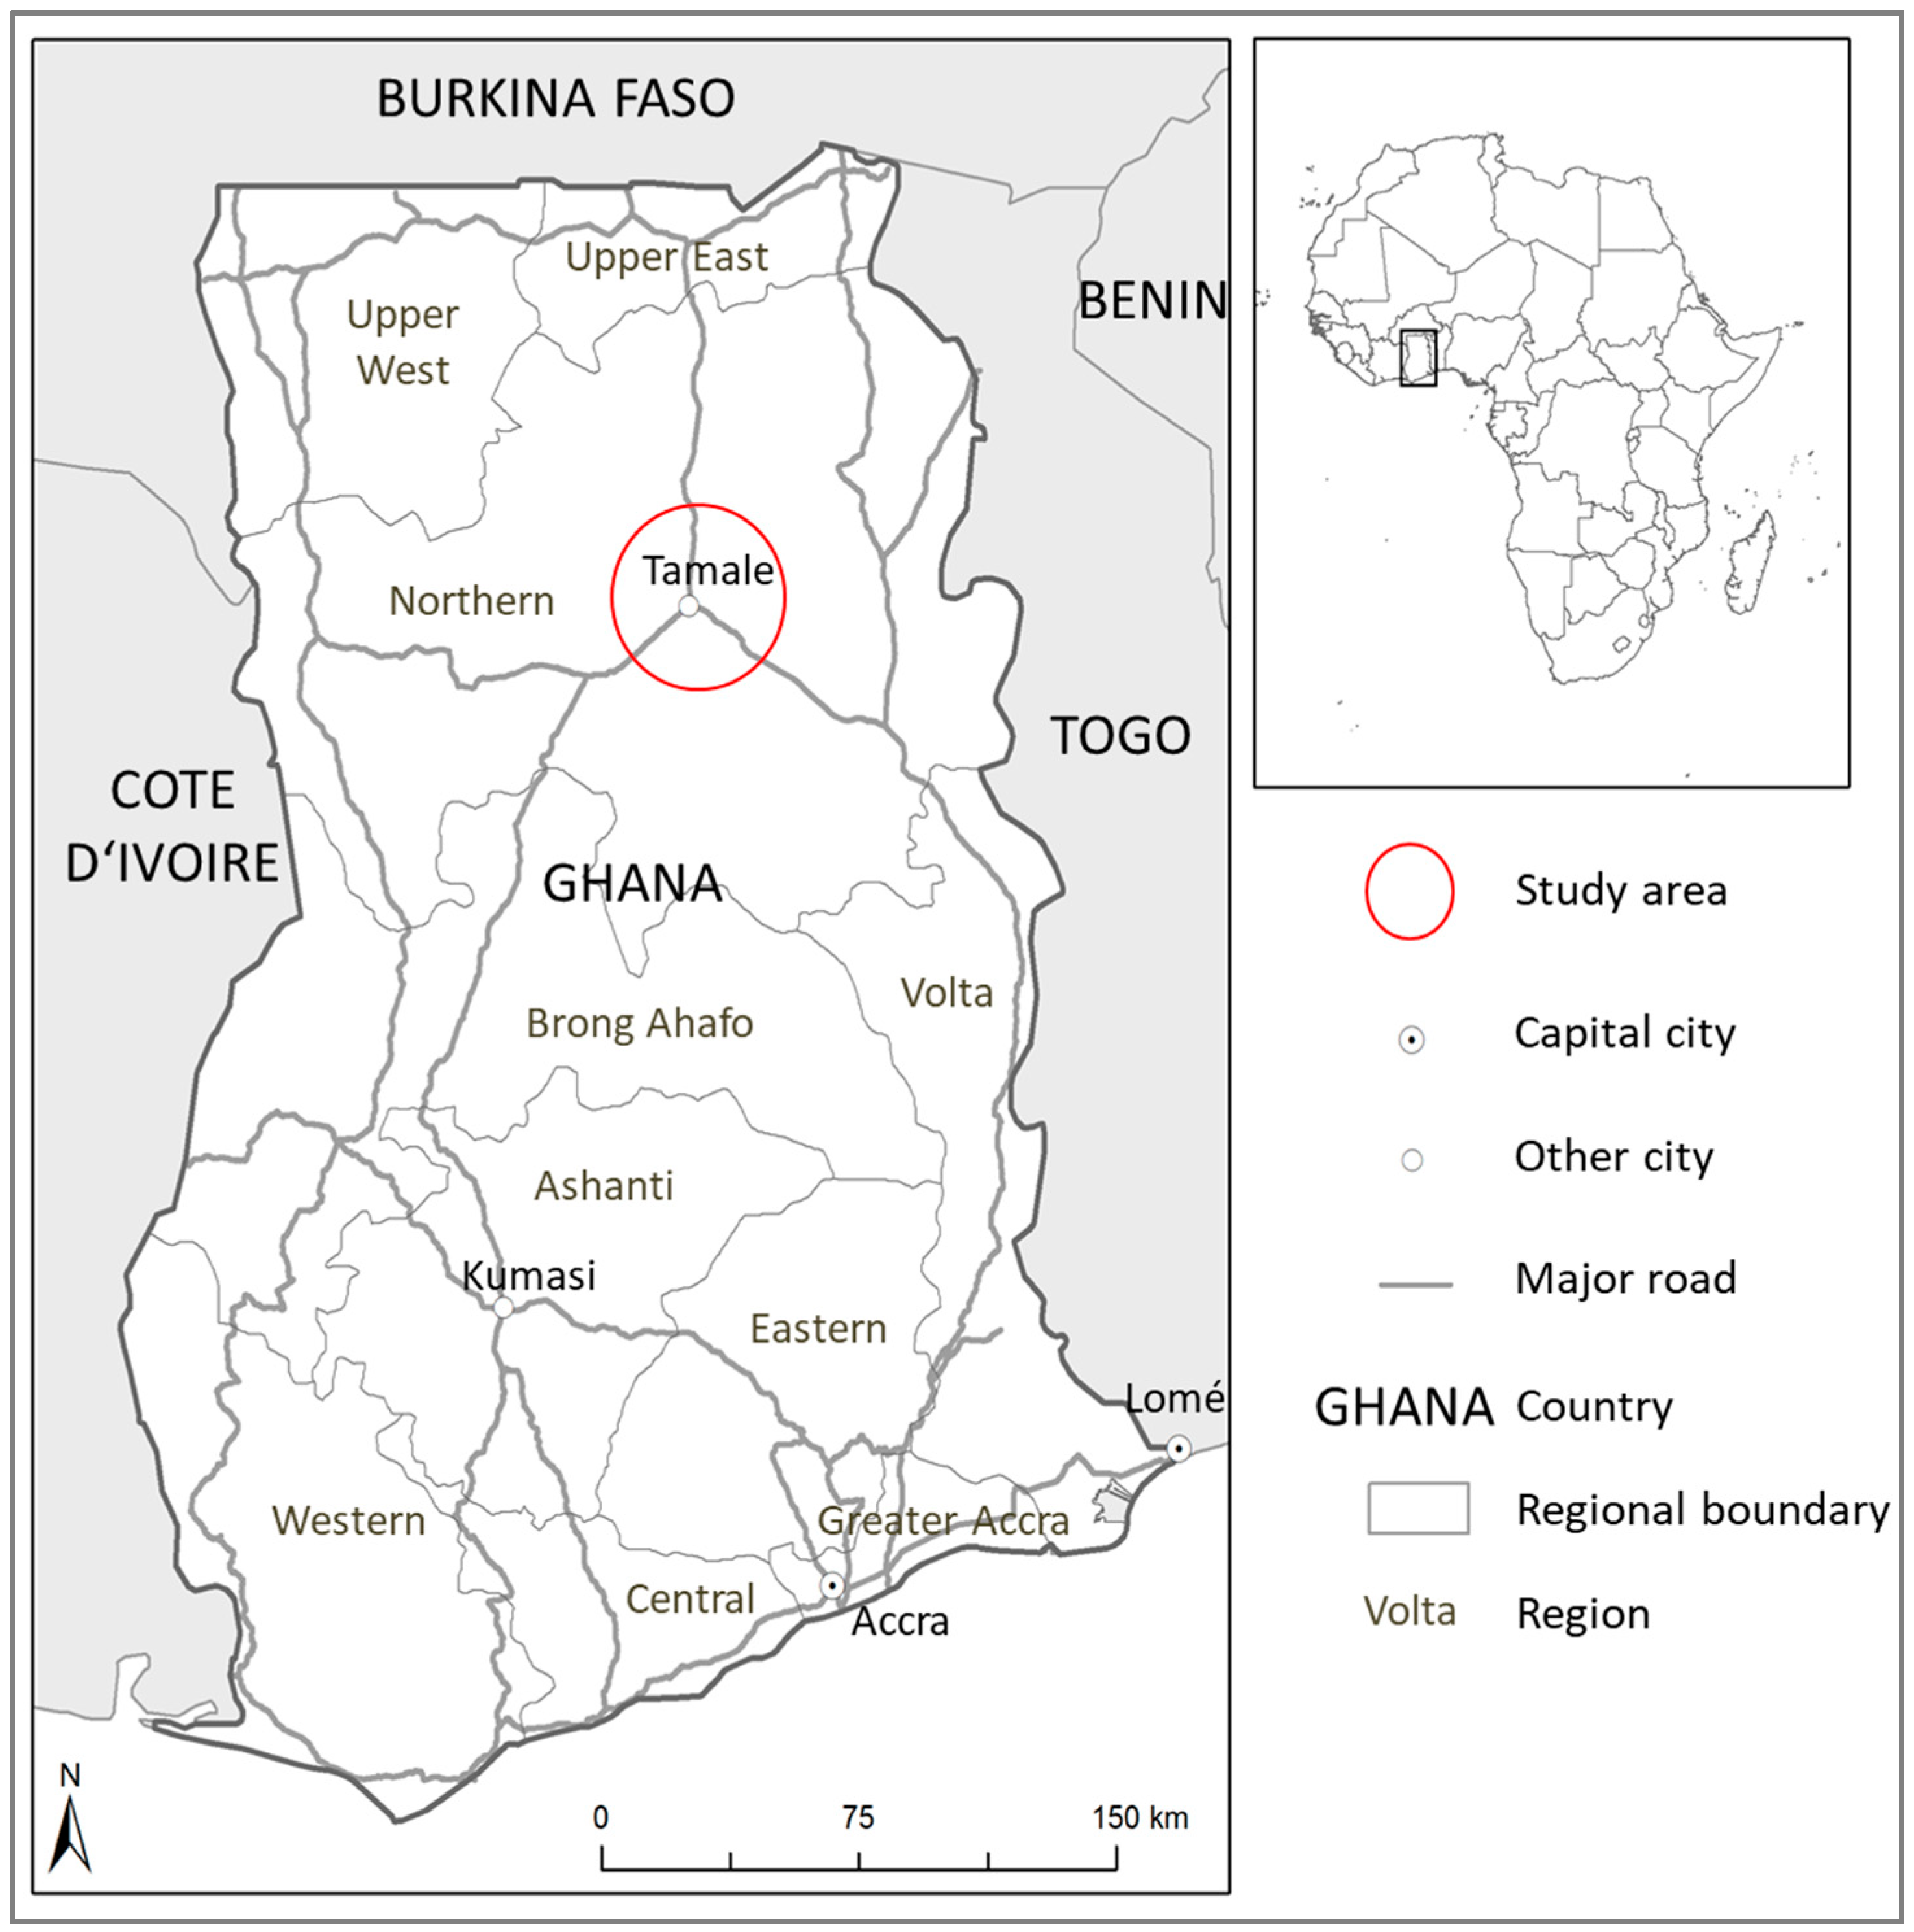
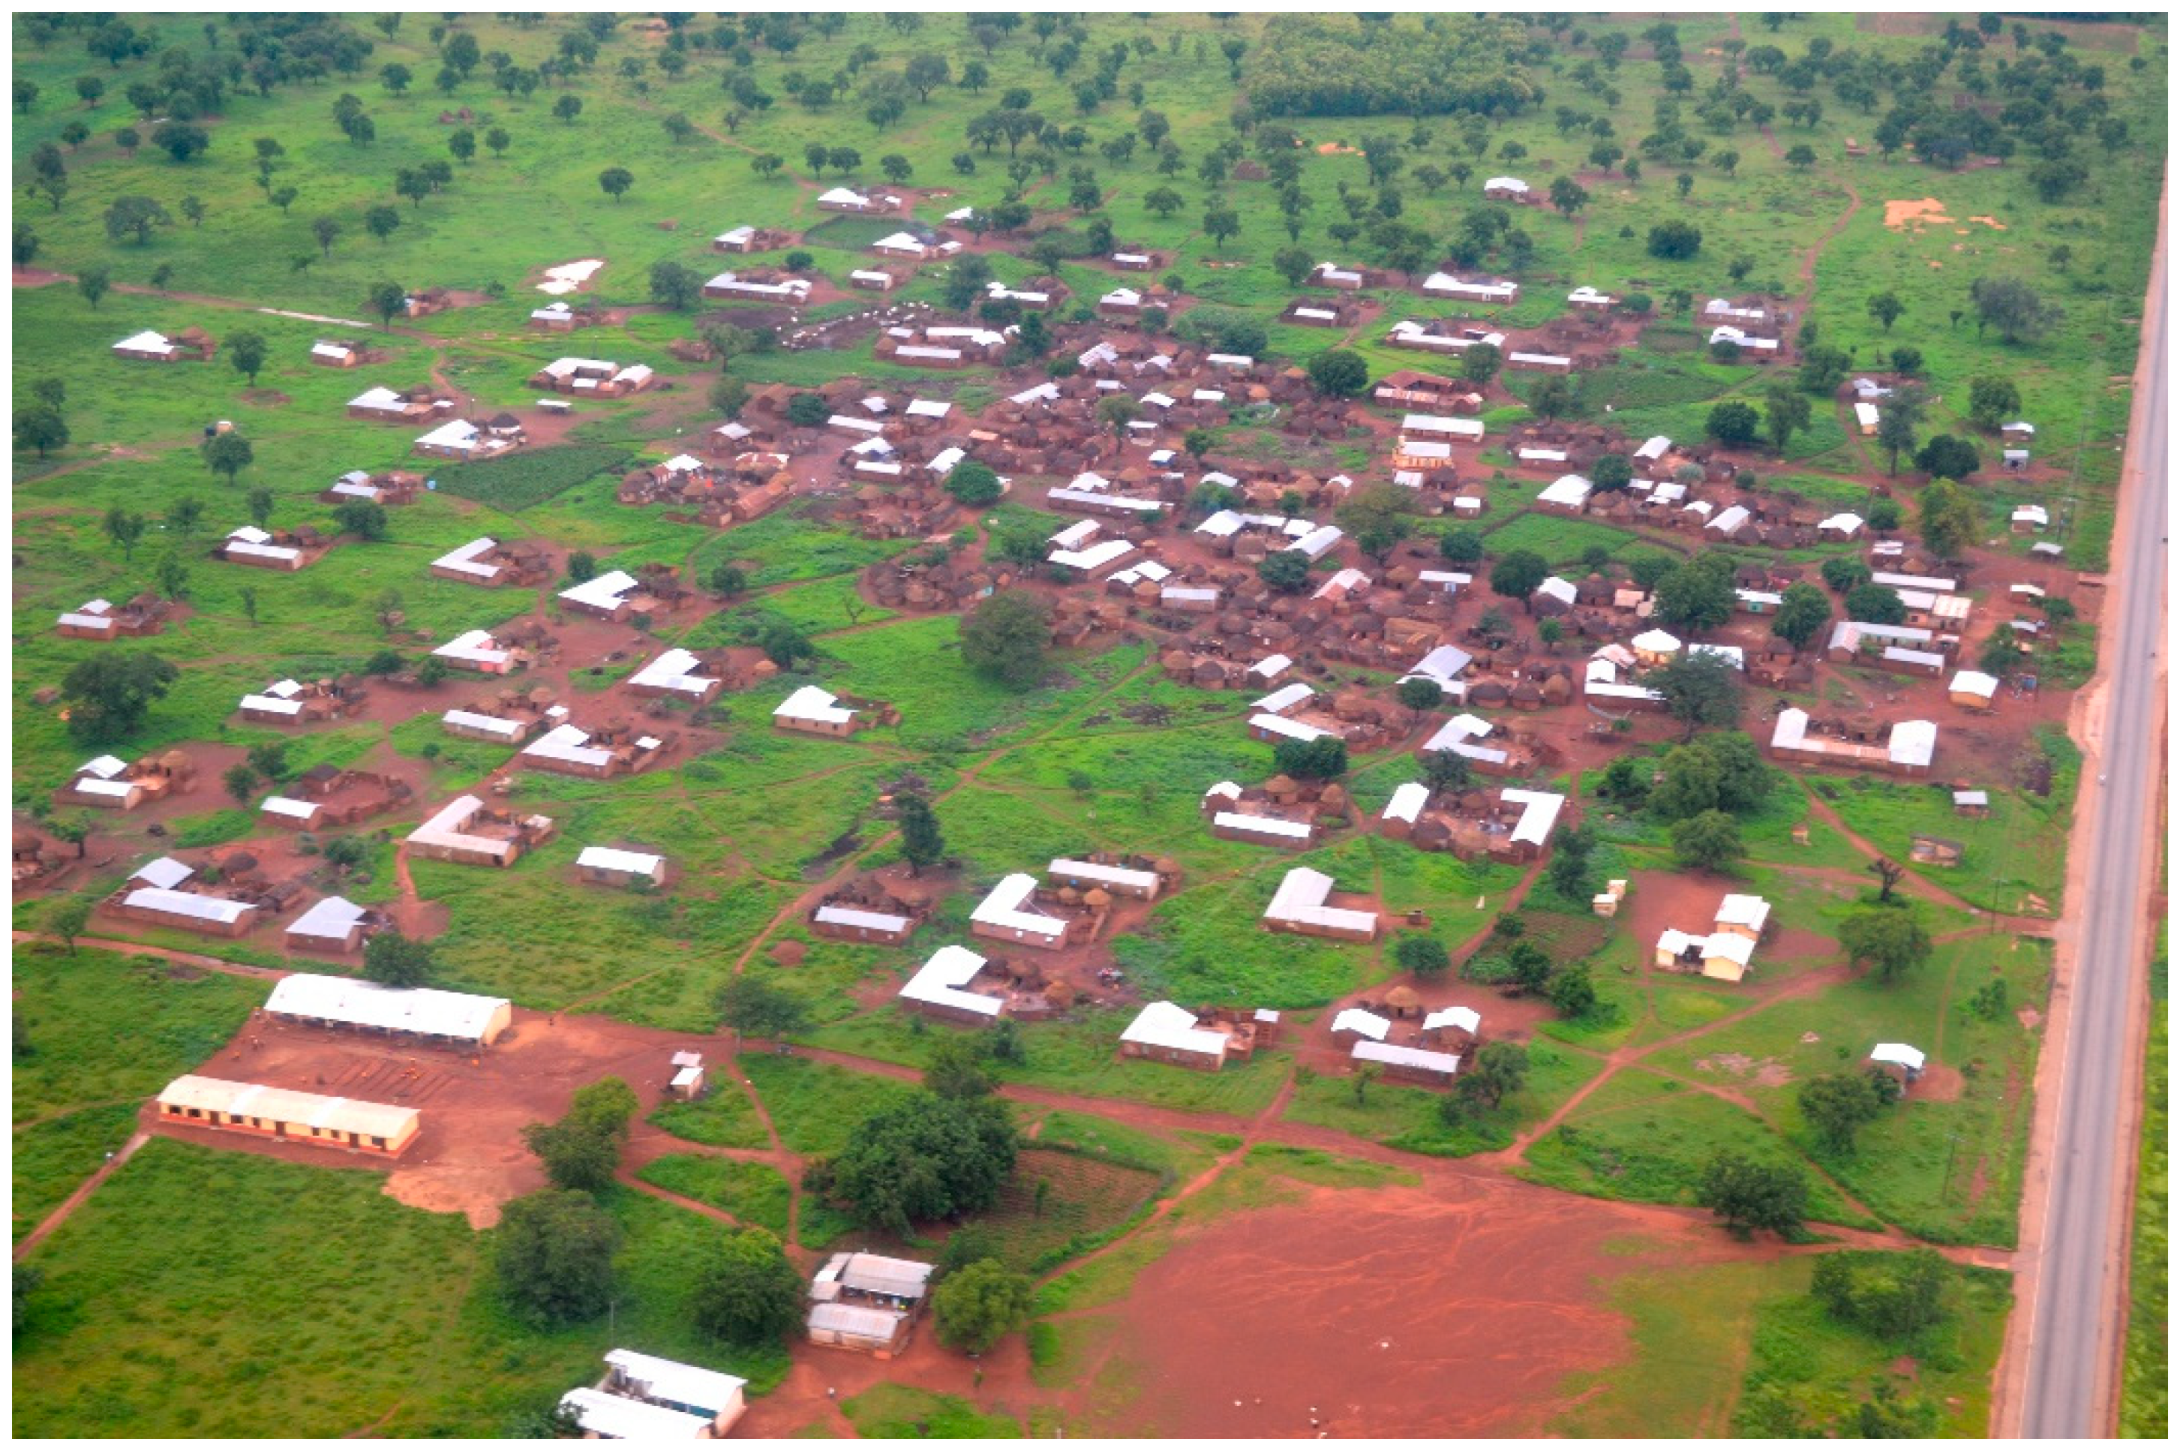
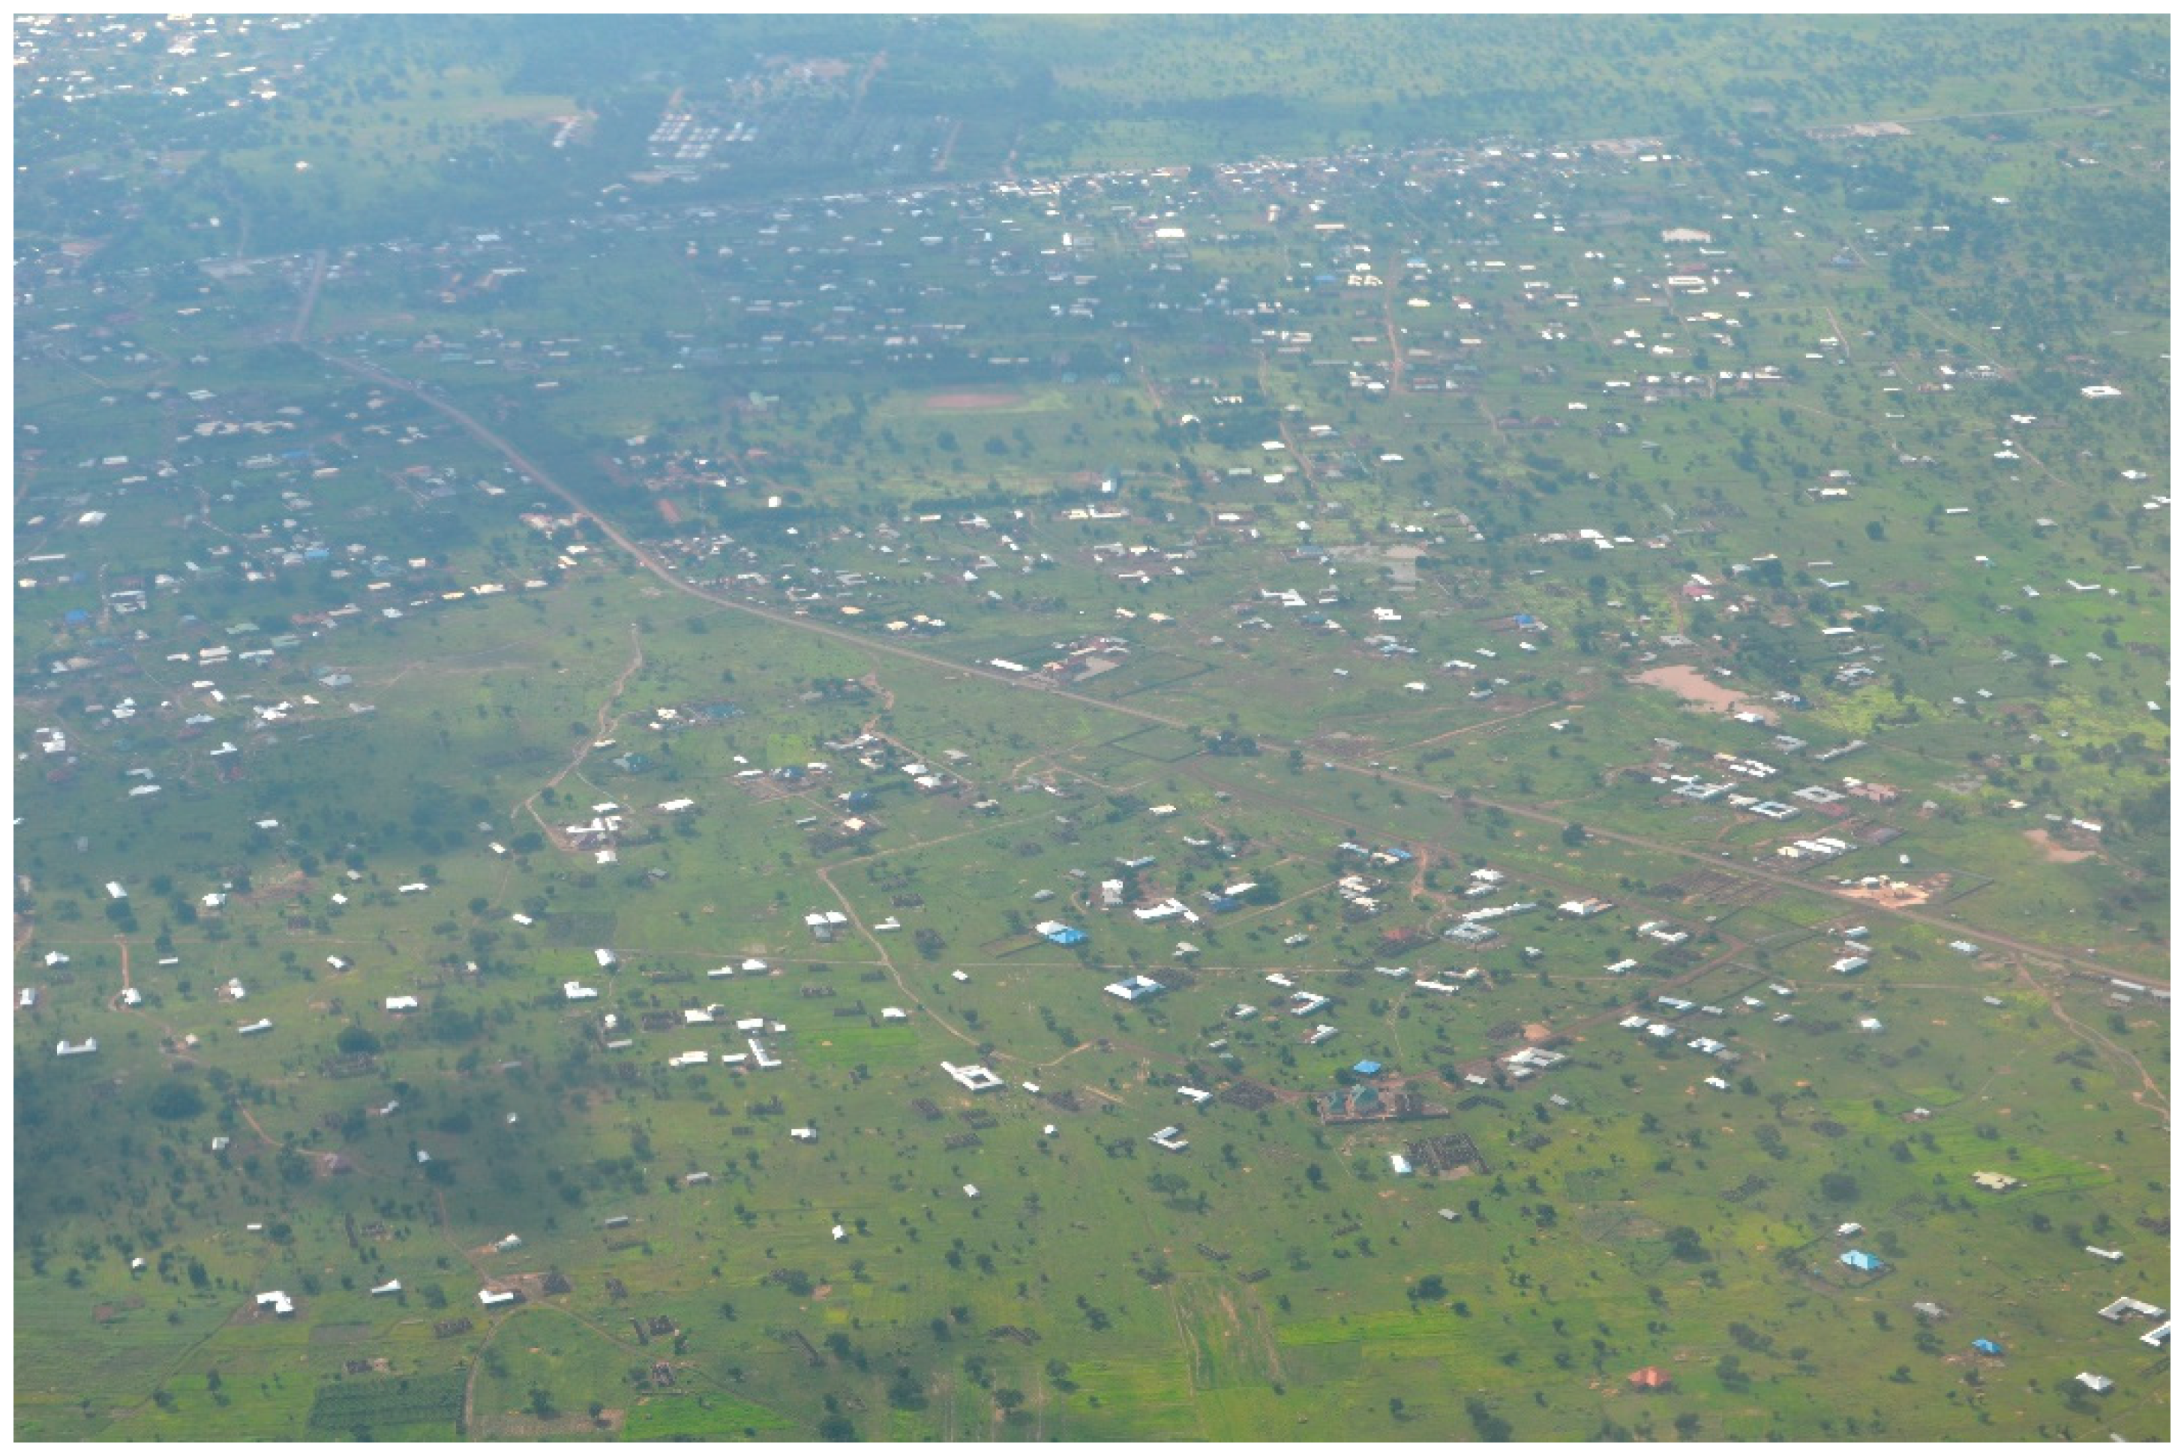
3.1. Study Area

The study area centred on the city of Tamale, the regional capital of the Northern Region in Ghana, as shown in Figure 1. The city represents one of the many rapidly growing, medium-sized cities in sub-Saharan Africa that experience uncontrolled and unplanned urban growth and the expansion of vast periurban landscapes. With a population of ~370,000, Tamale is the third largest urban centre in Ghana, after Accra and Kumasi [31]. Tamale has attracted migrants from the impoverished rural areas of northern Ghana in particular and has experienced annual urban growth rates of 4% during the past decade [31]. This rapid urban growth poses challenges for urban infrastructure and service provision and has resulted in increased competition over land use, while effective planning to address present and future urban growth is lacking. In Tamale, conflicts over the allocation and use of land between traditional authorities, responsible for managing 90% of the land, and governmental planning institutions makes proper urban planning even more difficult [32].

3.2. Objectives

The objective of this study was to classify and map periurban areas in the context of medium-sized sub-Saharan African cities using a quantitative, multi-scale and multi-dimensional approach. The classification of areas along the urban-rural gradient into urban, periurban, rural spaces was based on parameters relating to (1) urbanicity, (2) diversity in terms of a mix of urban and rural features, and (3) land use dynamics. The integration of various spatial scales ensured both a fine spatial resolution and a good areal coverage of the urban–rural interface.
A variety of different methods was used to derive parameters capable of revealing distinct spatial structures along the urban–rural gradient. Data sources ranged from primary household data to remote sensing and secondary data (see Figure 2 for the overall methodological framework, including input data, processing stages and outputs).

3.3. Data and Parameters
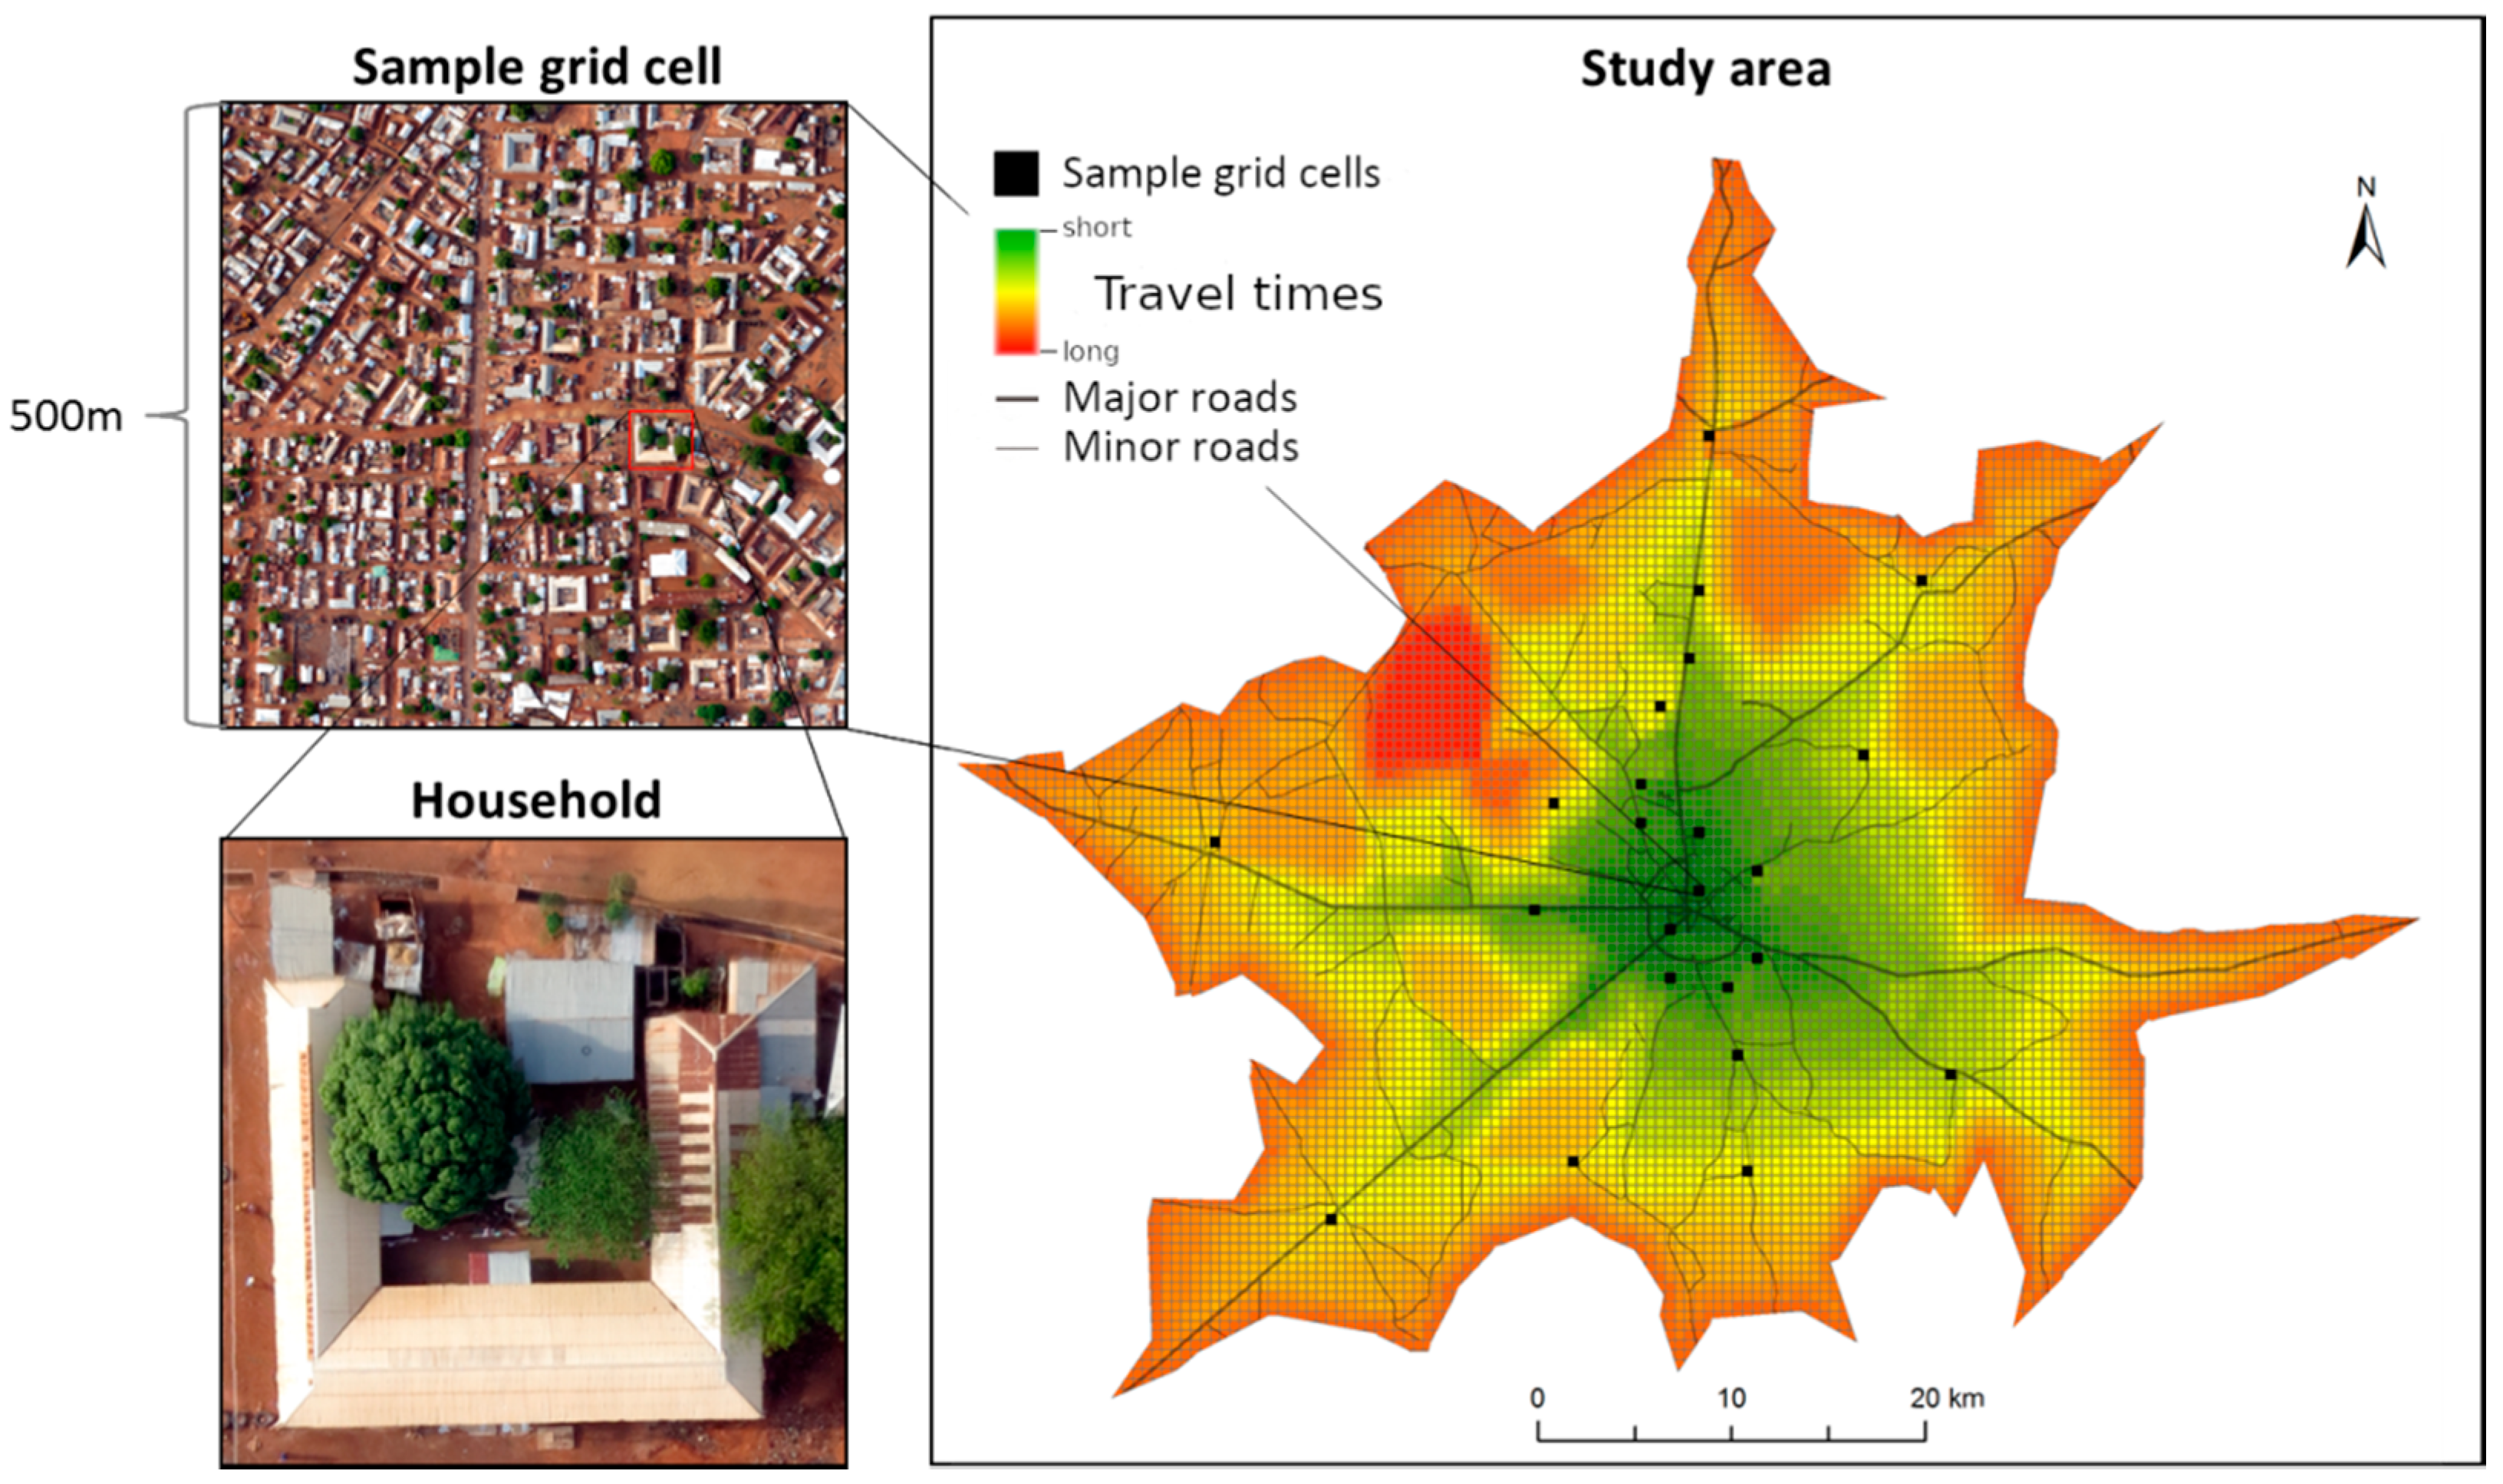
3.3.1. Sampling

The applied multi-scale approach involved the household level, a number of randomly sampled grid cells of 25 ha each in size containing settlement structures, and the entire study area, covering urban, periurban and near rural areas (Figure 3).
In line with Adam (2001) [29], we conducted a random sampling within a given sampling extent. Unlike Adam who took an arbitrary circle, with a radius of 40 km from the city centre, we applied a travel-time approach [13] to generate the sampling extent. This approach takes into account the estimated time required to reach the city centre from any point using the road network (60 km/h on primary roads, 40 km/h on secondary and tertiary roads, 10 km/h on path-like roads). Usual modes of motorised transportation are motorbikes, taxis and minibuses. Travel times are considered to be the most appropriate indicator of accessibility [16] and were used to map accessibility to urban centres worldwide [33]. In accordance with Drechsel & Keraita (2014) [34], we chose the 40-min boundary, which extends up to 40 km along the main road and has a minimum distance of 20 km from the city centre (study area) (Figure 3). A grid of 500 m × 500 m was overlaid, resulting in 8321 grid cells, and used as a basis for sampling. Out of 4373 grid cells containing settlement structures, 23 grid cells were randomly selected and stratified according to building density and travel times (sample grid cells) [35]. In each of the 23 sample grid cells, household data were collected from 20 randomly selected households, through a survey conducted in March and April 2014. A household was defined as a group of people living together and eating from the same pot [36]. Data were processed and analysed using the software programs ‘R’ and ‘ArcGIS’.

3.3.2. Selection of Parameters

The selection of household parameters used for the ‘urbanicity’ and ‘diversity’ indices was carried out step-wise. On the basis of the reviewed literature, a variety of data covering services and facilities, livelihood indicators, and morphological and functional parameters were collected. The final selection was based on a consultation with local experts, a wide distribution of values along the urban-rural gradient and the avoidance of correlation between parameters of the same category. As a result, some parameters used in other studies (such as distance to health care and markets) were not considered appropriate in the local context, due to their low variability and bias towards the city centre, and were therefore not included in this analysis. Others, such as land disputes and social problems, were not taken into account since they represent potential consequences of periurban processes, rather than general patterns. At the sample grid cell level, multi-temporal satellite images were used to analyse temporal dynamics. At the study area level, parameters forming the infrastructure index were selected on the basis of available secondary data and classified satellite imagery. Appendix A shows a list of all the parameters used, the processing involved and the respective data sources.

3.4. Analysis

3.4.1. Classifying sample grid cells

It has been acknowledged that periurban areas of growing cities are undergoing rapid change, which is one major factor underlying the diversity of the social and physical environment [3,10,12,16,18]. Therefore, the analysis was based on the assumption that periurban areas exhibit relatively high values, where both their level of diversity and land use change (dynamics) were concerned while they exhibit values between those observed for rural and urban areas where their degree of urbanicity was concerned. In the context of Tamale, access to piped water, electricity and sanitation, a ‘modern’ (square, as opposed to traditional round huts) house type, frequent visits to the city centre, the possession of a fridge and an occupation other than farming as the main household livelihood activity were rated highly urban, i.e., 1.
The first stage of the analysis was to assess the degree of urbanicity in each sample grid cell. An urbanicity index was created for each household and each sample grid, based on the mean value of all seven household parameters, ranging from 0 to 1, with the same weight assigned to each parameter. Continuous variables were converted to dummy variables (see Appendix A). The variance of urbanicity values within one sample grid cell served as a proxy for socioeconomic diversity, i.e., a high diversity was given where half of the households exhibited high urbanicity values and the other half exhibited low urbanicity values. The degree of change in the built-up area, based on recent and past high resolution satellite images by Google Earth (2008 and 2014) [37,38], was used as an indication of the land use dynamics in each sample grid cell. To this end, images were extracted from Google Earth Pro; the buildings were then digitised for both dates and the change quantified (Figure 4). The quantification of land use change inevitably refers to a specific time period. For this study, the six years preceding the household survey form the basis for the land use change analysis.
On the basis of these three indices: ‘urbanicity’, ‘diversity’, and ‘dynamics’, the sample grid cells were classified as ‘urban’, ‘rural’ and ‘periurban’. This was done by grouping sample grid cells along the urbanicity gradient according to natural breaks in the data (‘baseline scenario’).

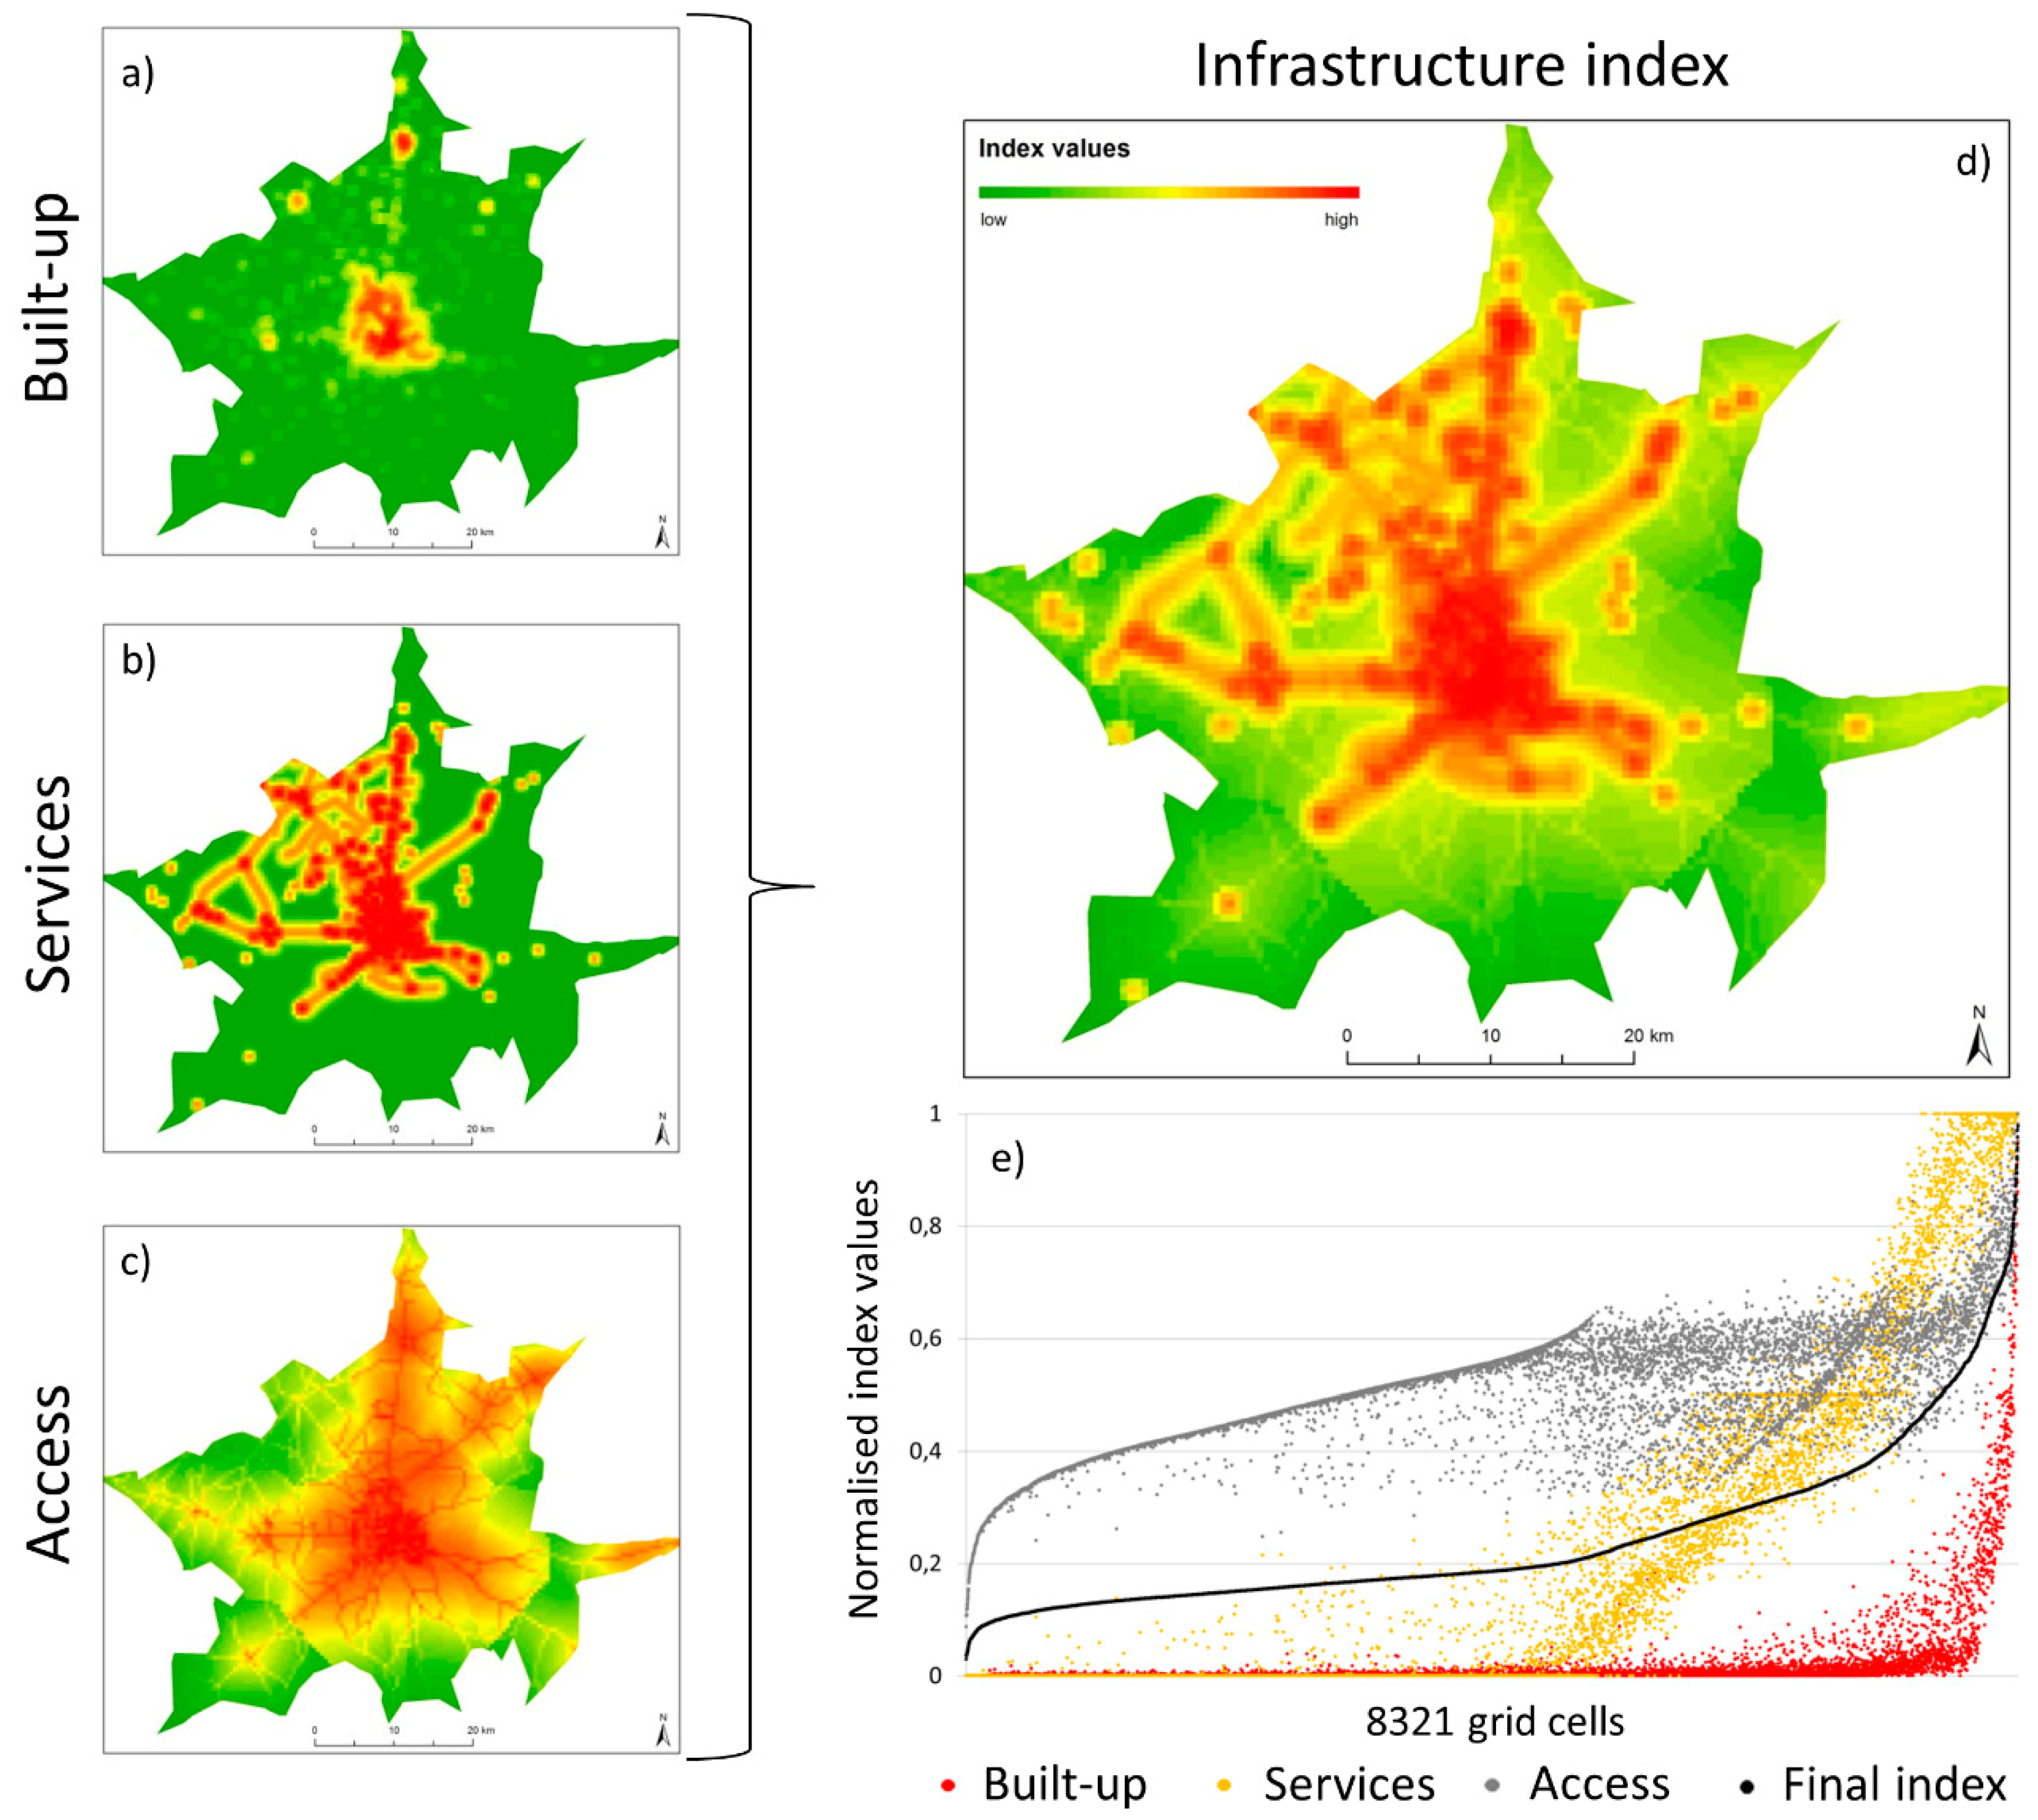
3.4.2. Developing an Infrastructure Index at The Study Area Level

An infrastructure index was created at the study area level and calculated for each of the 8321 grid cells, including those without a built-up area, using secondary and remote sensing data (Appendix A). This index involved three rubrics, namely (1) access, (2) services and (3) built-up area:
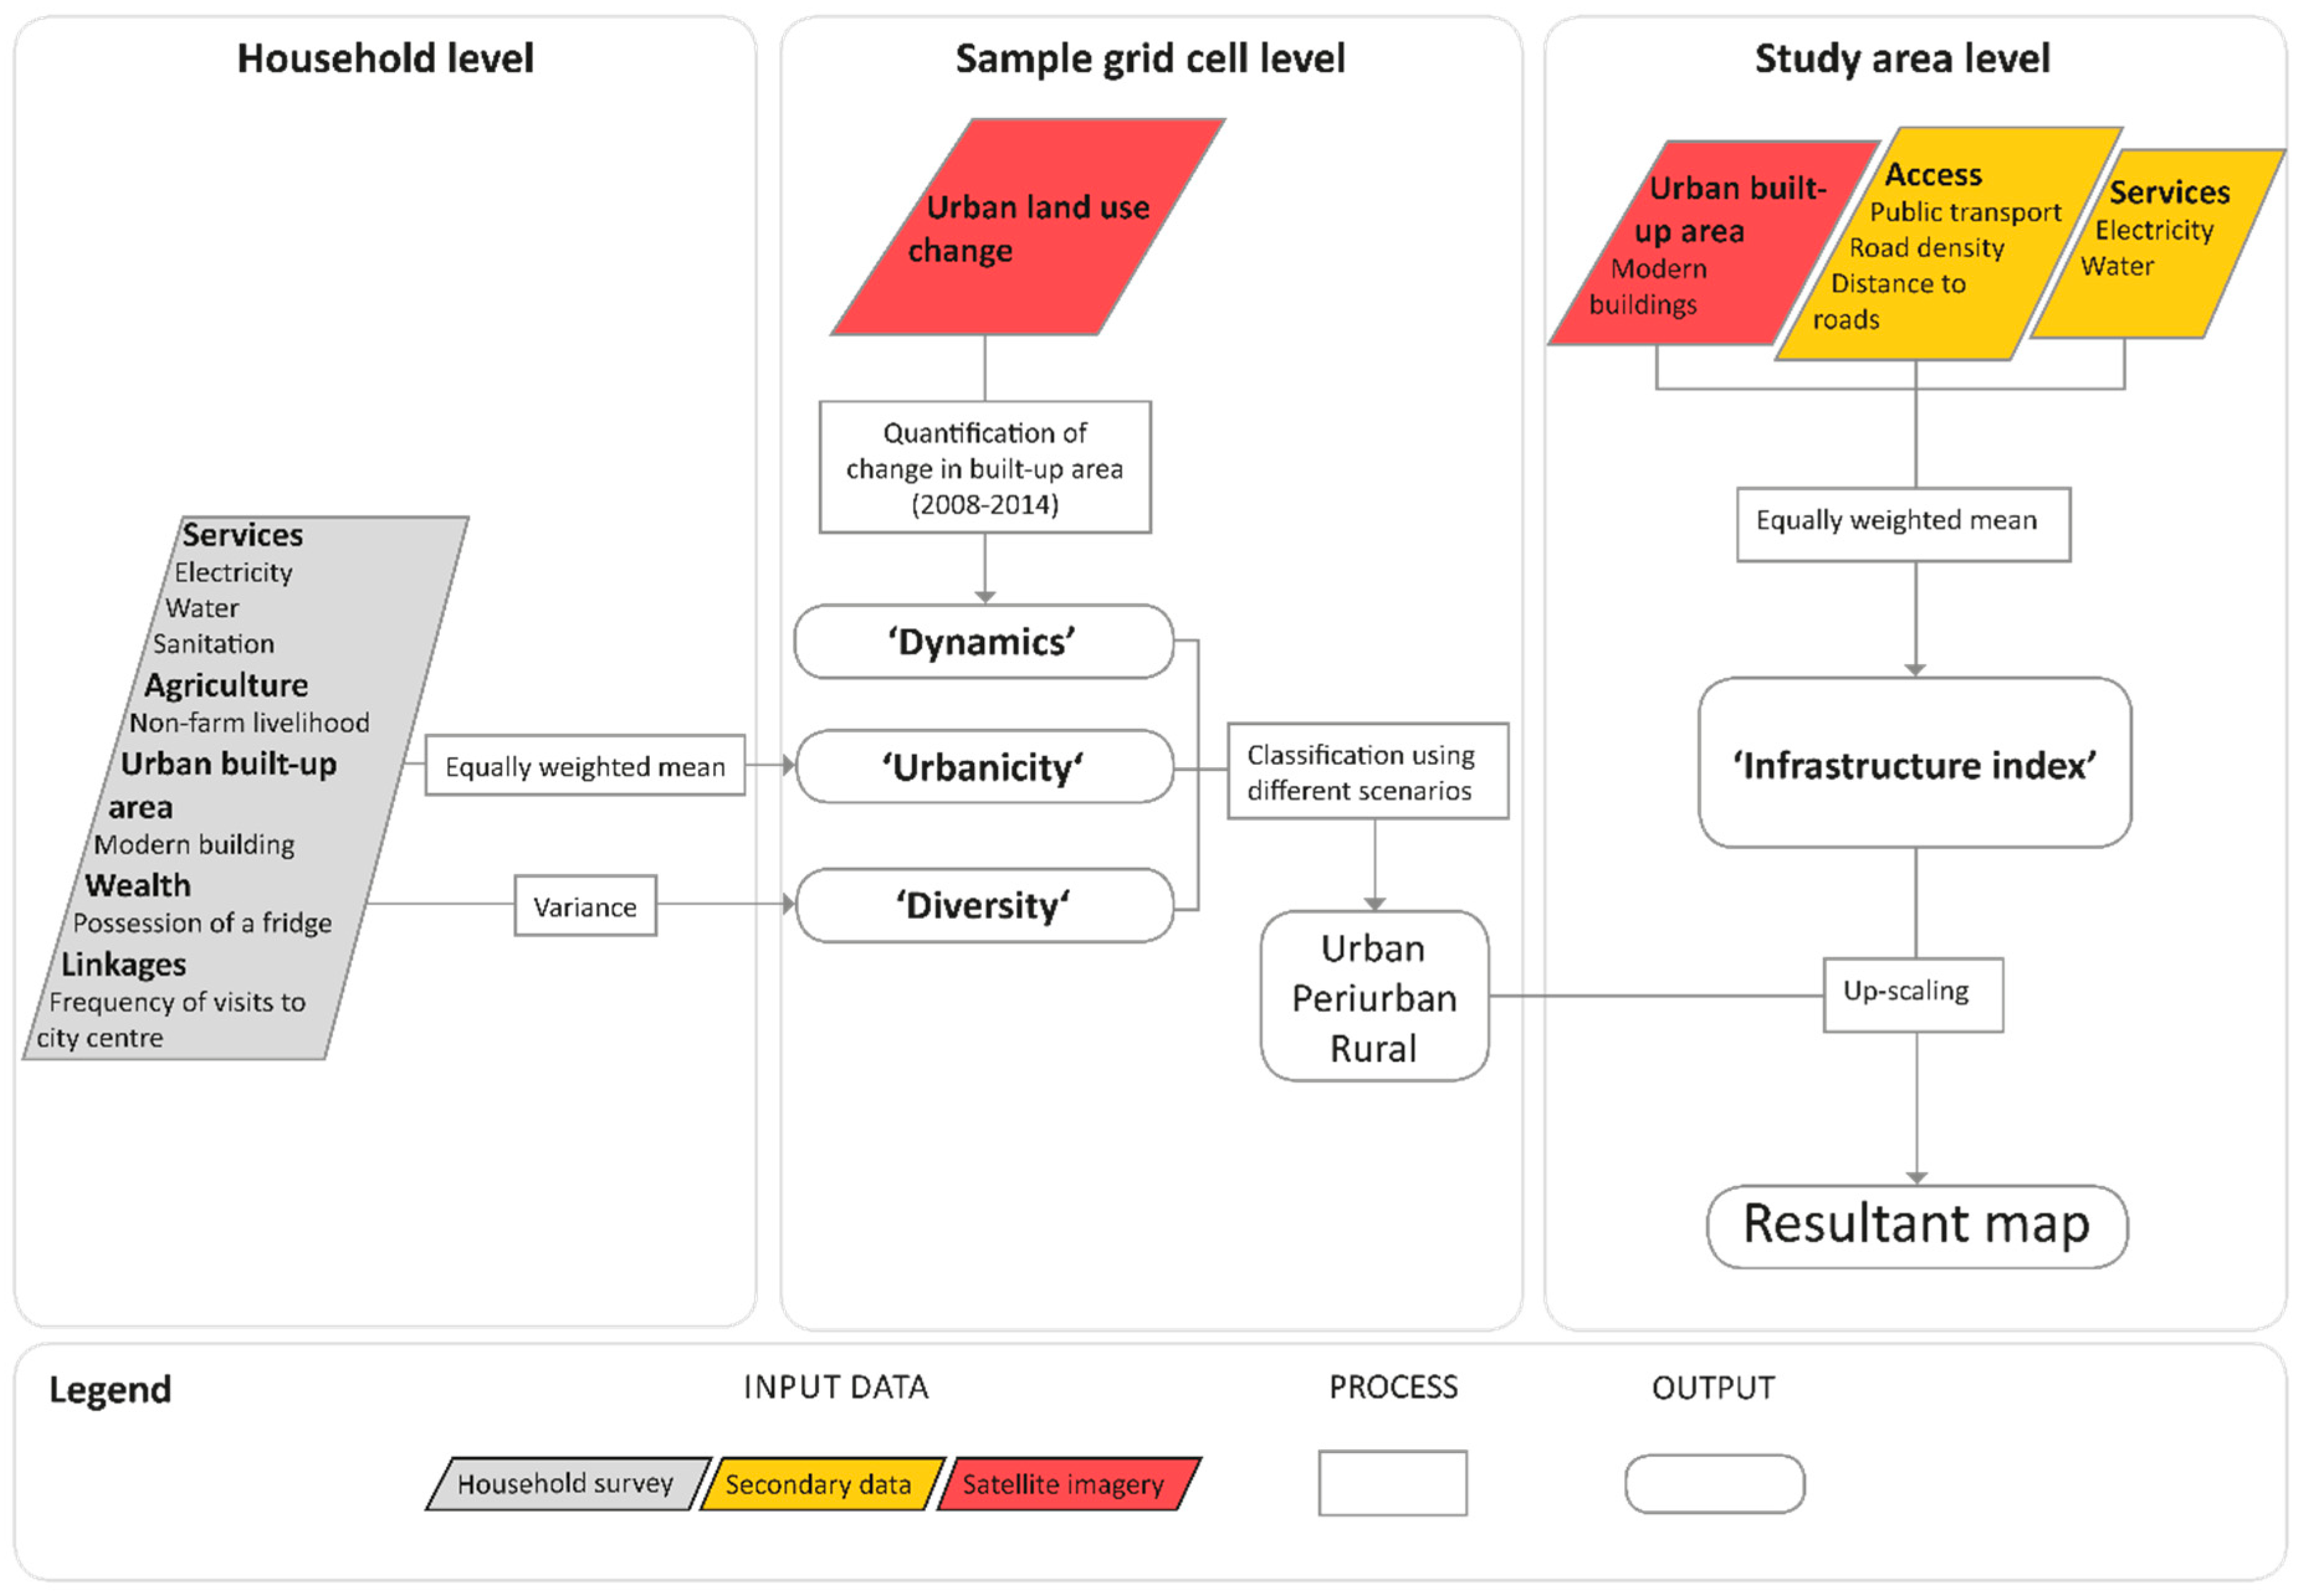
  • Access comprised three parameters: road density, distance from roads and access to public transport. The denser the road network within a grid cell, the smaller the distance from the next road; and the better the access to public transportation linking the grid cell with Tamale’s city centre, the more urban a given grid cell was considered (with values closer to 1).
  • Services were defined according to the distance from a water pipe (within 2 km) and an electricity station (within 1 km). Distance thresholds (within which access is likely) were discussed with representatives of the water and electricity companies.
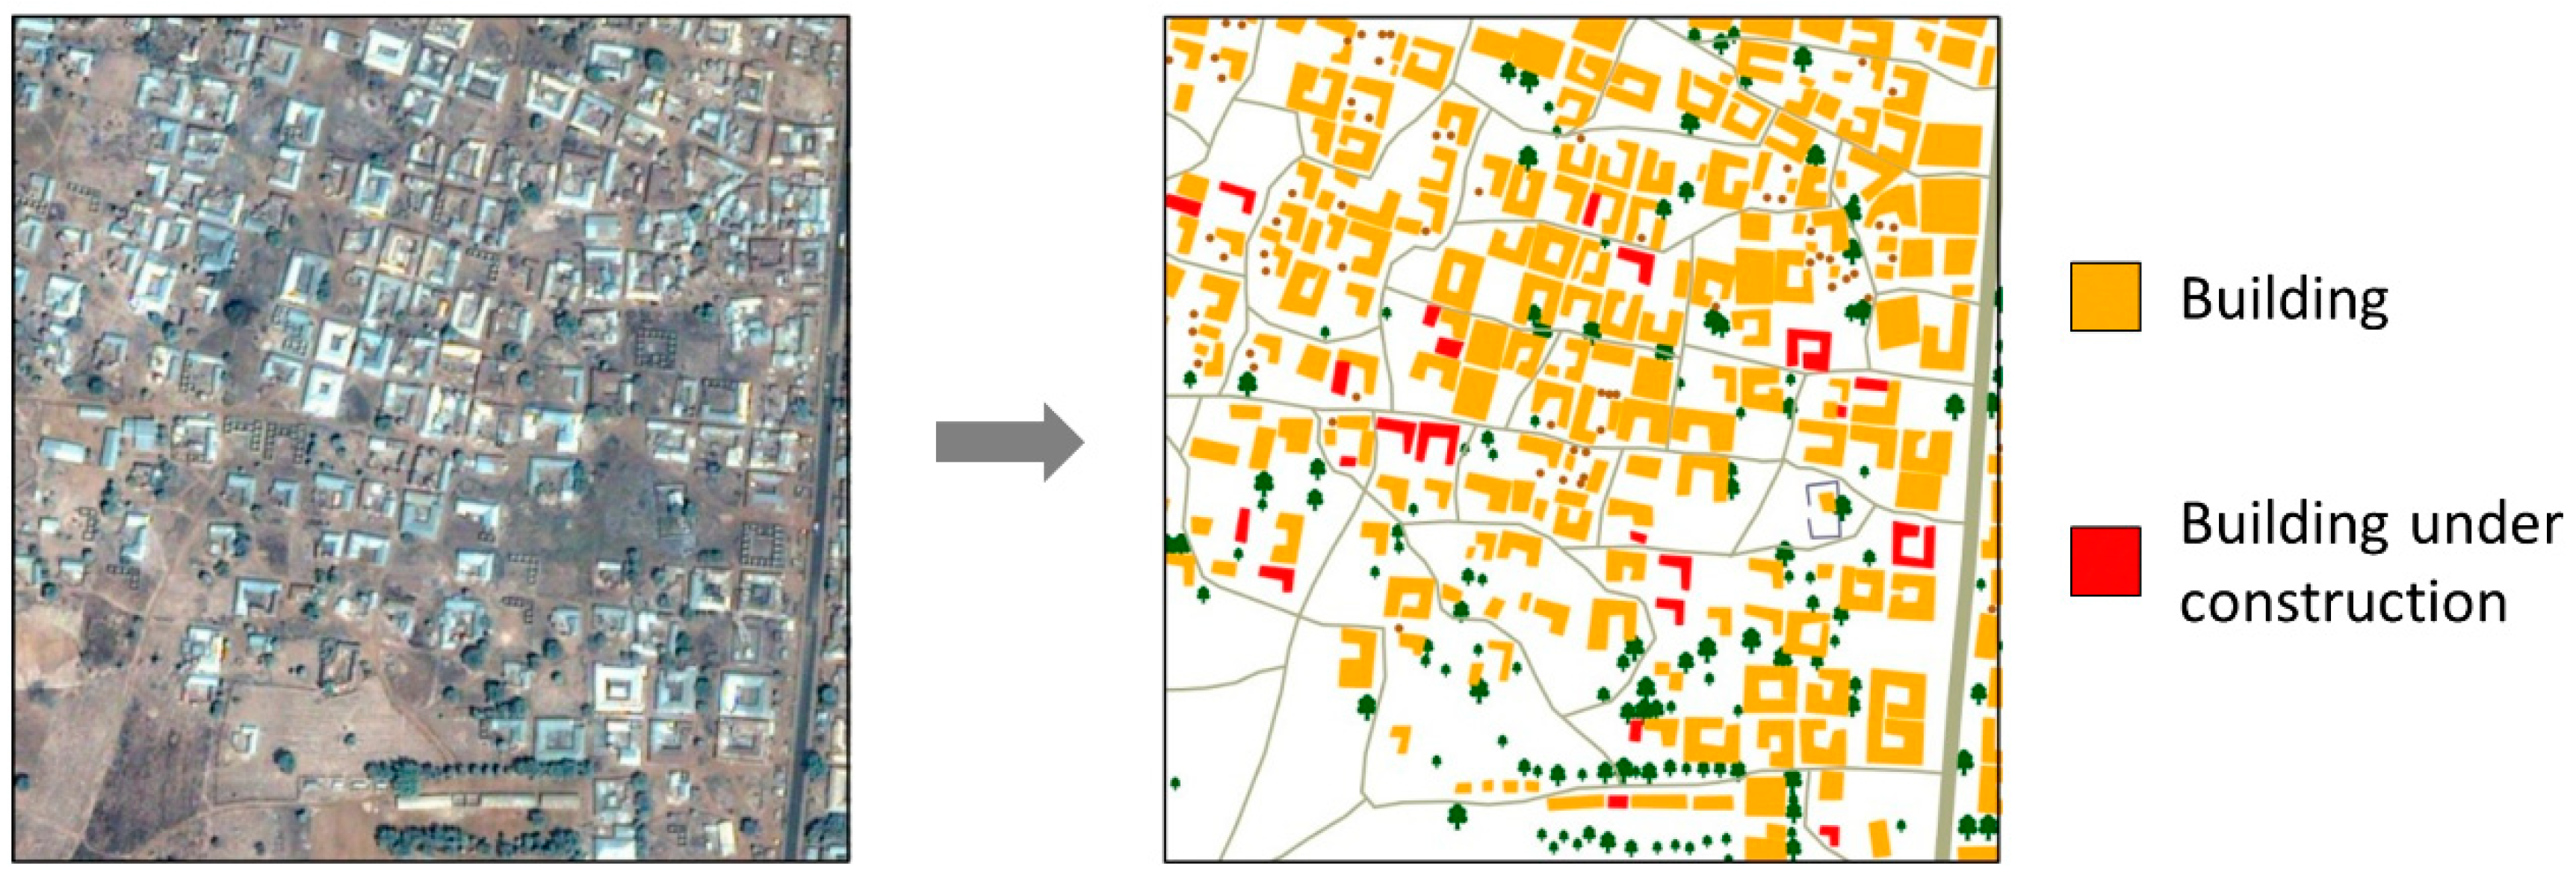
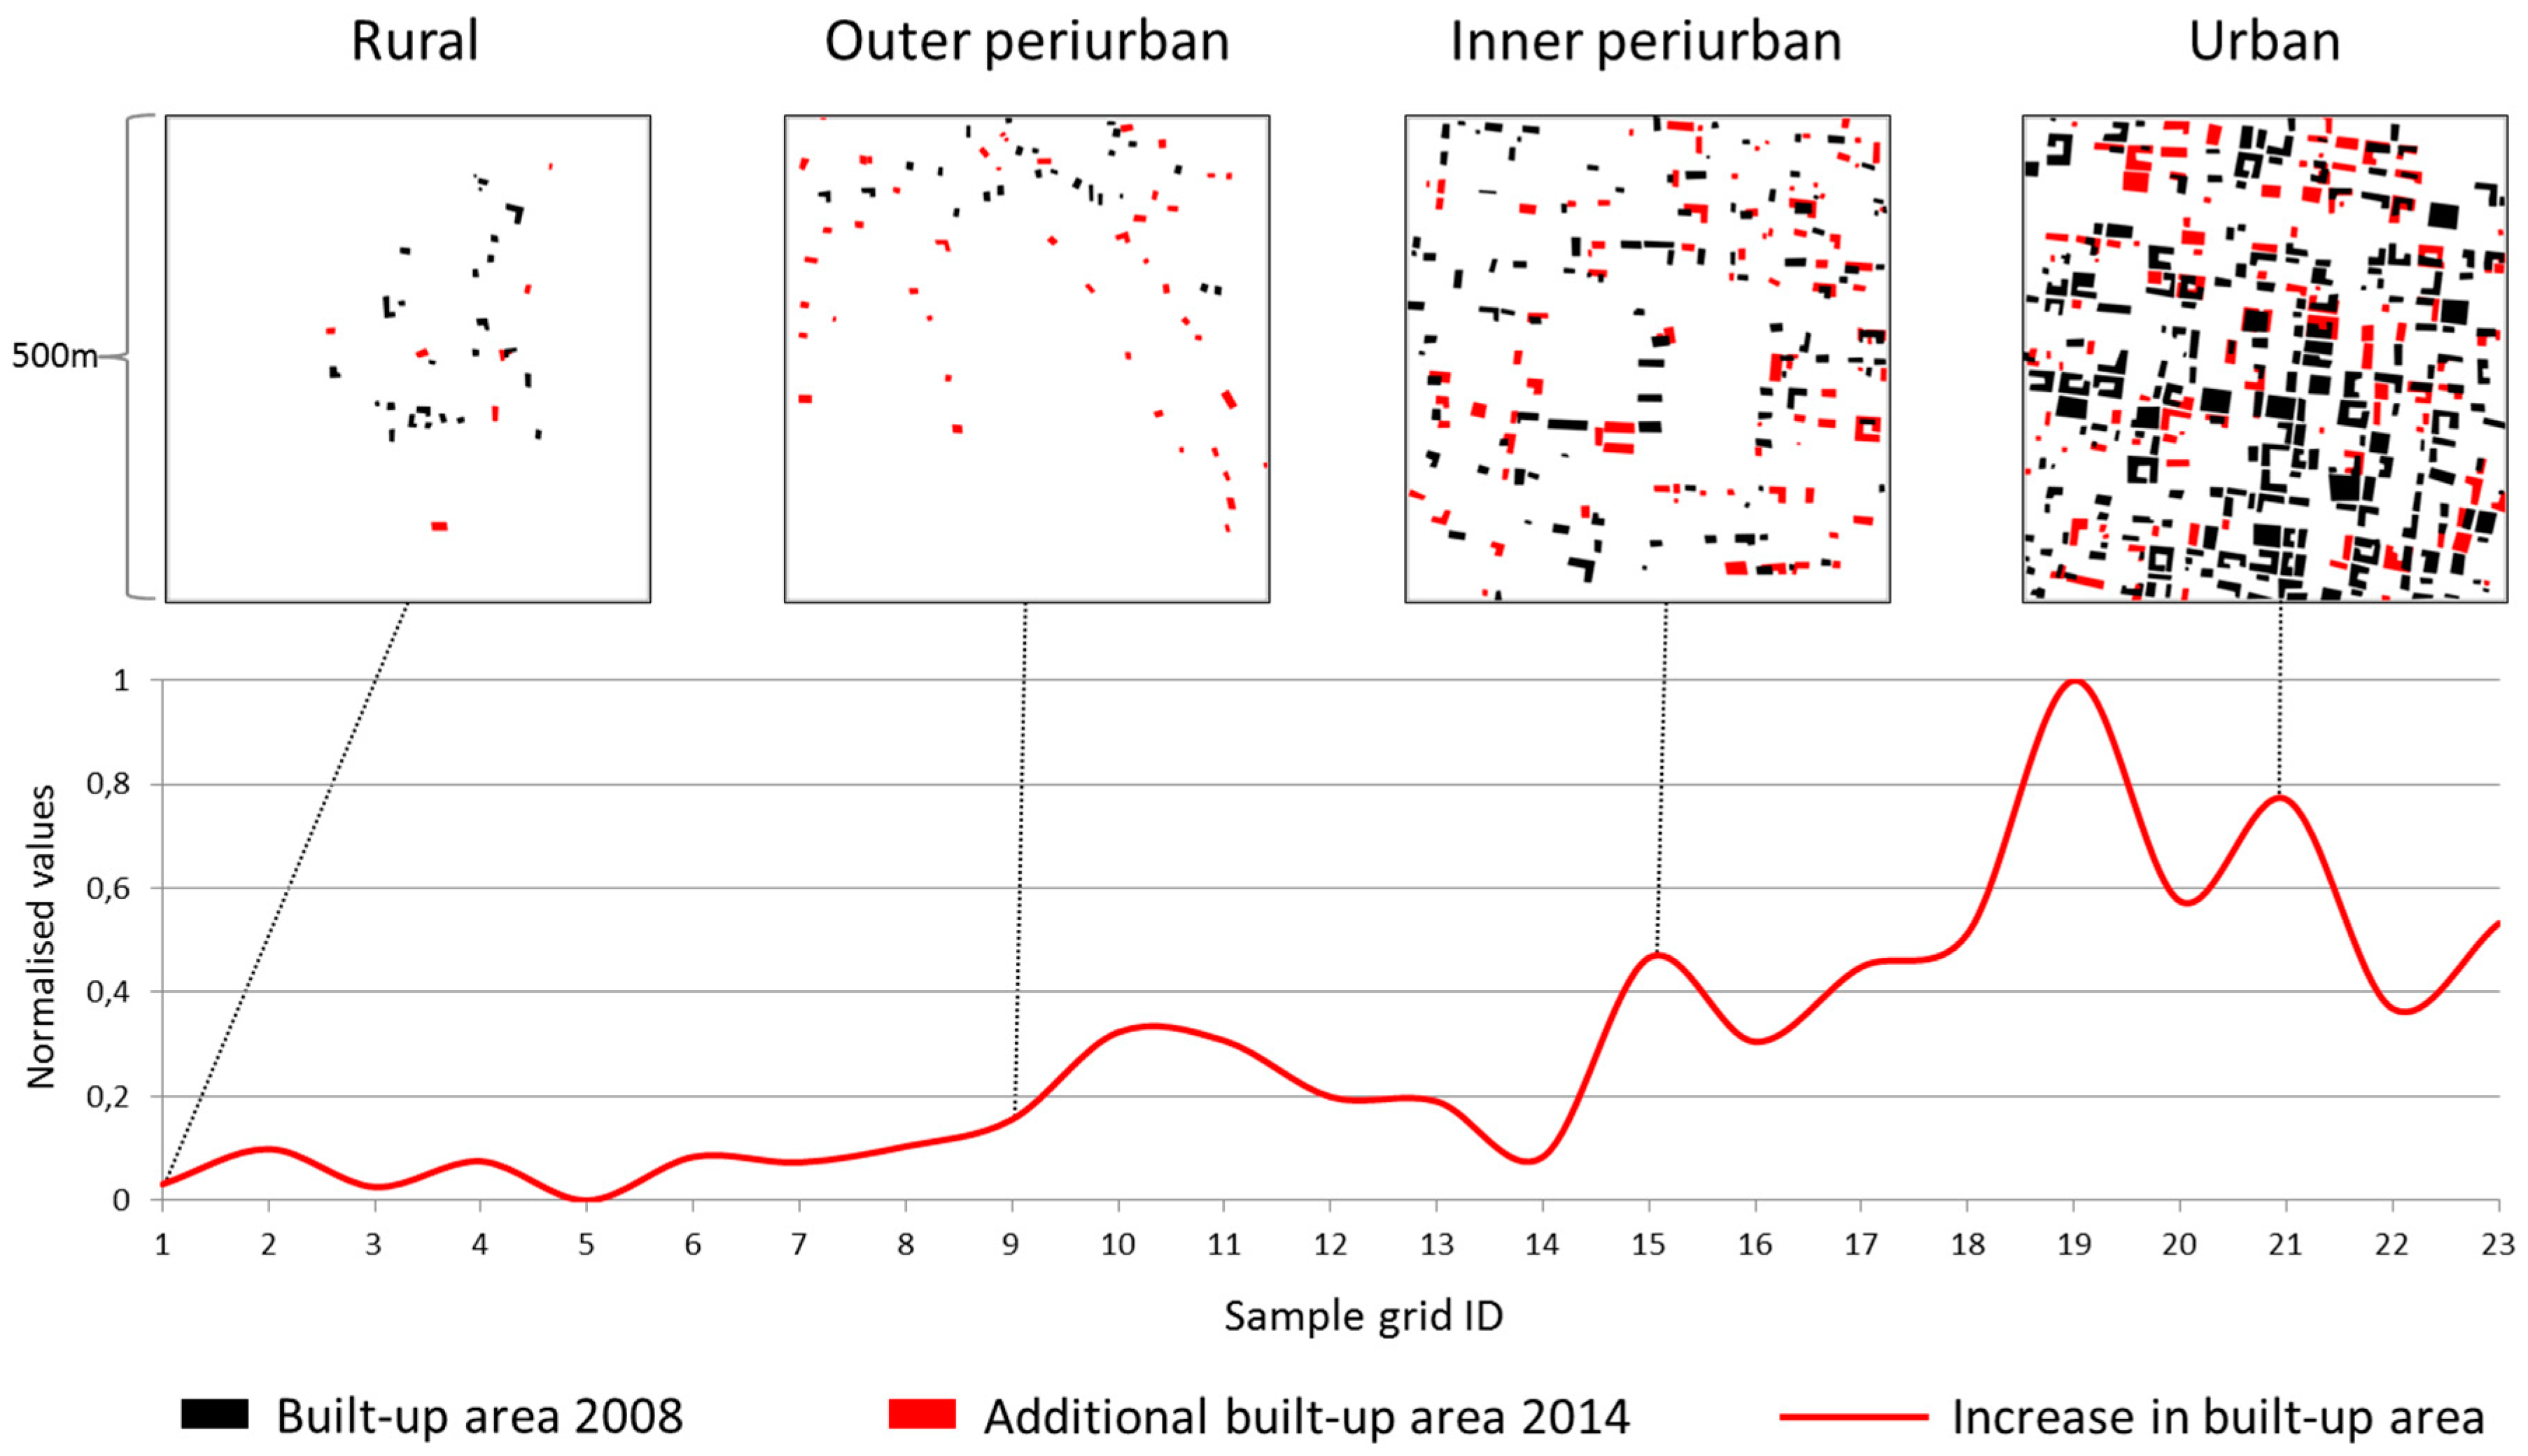
  • The built-up area was quantified from 1.5 m colour merge resolution SPOT 6 images (October 2013) with an overall accuracy of 97%, using an object-based hierarchical classification approach (Appendix B). In order to account for the surrounding environment, the levels of built-up area for the eight neighbouring grids were included and the mean built-up area was assigned to the grid cell in question.
Each grid cell was assigned a value for each parameter. These values were normalised and, where several parameters form a rubric, the mean value was taken, assigning the same weight to each parameter. The infrastructure index was built by taking the mean of the normalised rubrics, again assigning the same weight to each rubric. Each of the 8321 grid cells within the study area, including the 23 sample grid cells, was thus attributed an index value on the basis of these three rubrics.

3.4.3. Up-Scaling

In order to assess the spatial extent of urban, periurban and rural areas, the respective categories derived at the sample grid cell level were scaled up to the entire study area. Prior to this, we verified that the household characteristics were reflected in the physical and infrastructural environment. Therefore, we determined the degree of statistical dependence between the urbanicity index (available only for the sample grid cells) and the infrastructure index (available for all 8321 grid cells) for the 23 sample grid cells. Infrastructure index values were used to create confidence intervals for each category at the sample grid cell level (e.g., those classified as urban). Using a Student’s t test, we tested whether a given unclassified grid cell (those not included in the sample of 23) fell within the 95% confidence interval of a category. Grid cells falling outside these confidence intervals were not assigned to any category (0.38% of all grid cells), because of their low statistical probability. Grid cells with a higher statistical probability were assigned to the category (rural, inner periurban, outer periurban and urban) with the most plausible p-value. The sensitivity of these up-scaling results to changes in the baseline classification—as determined by urbanicity, diversity and dynamics at the sample grid cell level—was assessed by performing the up-scaling process for another four classification scenarios. Therefore, the threshold values for the boundaries of the classes were slightly shifted.

4. Results

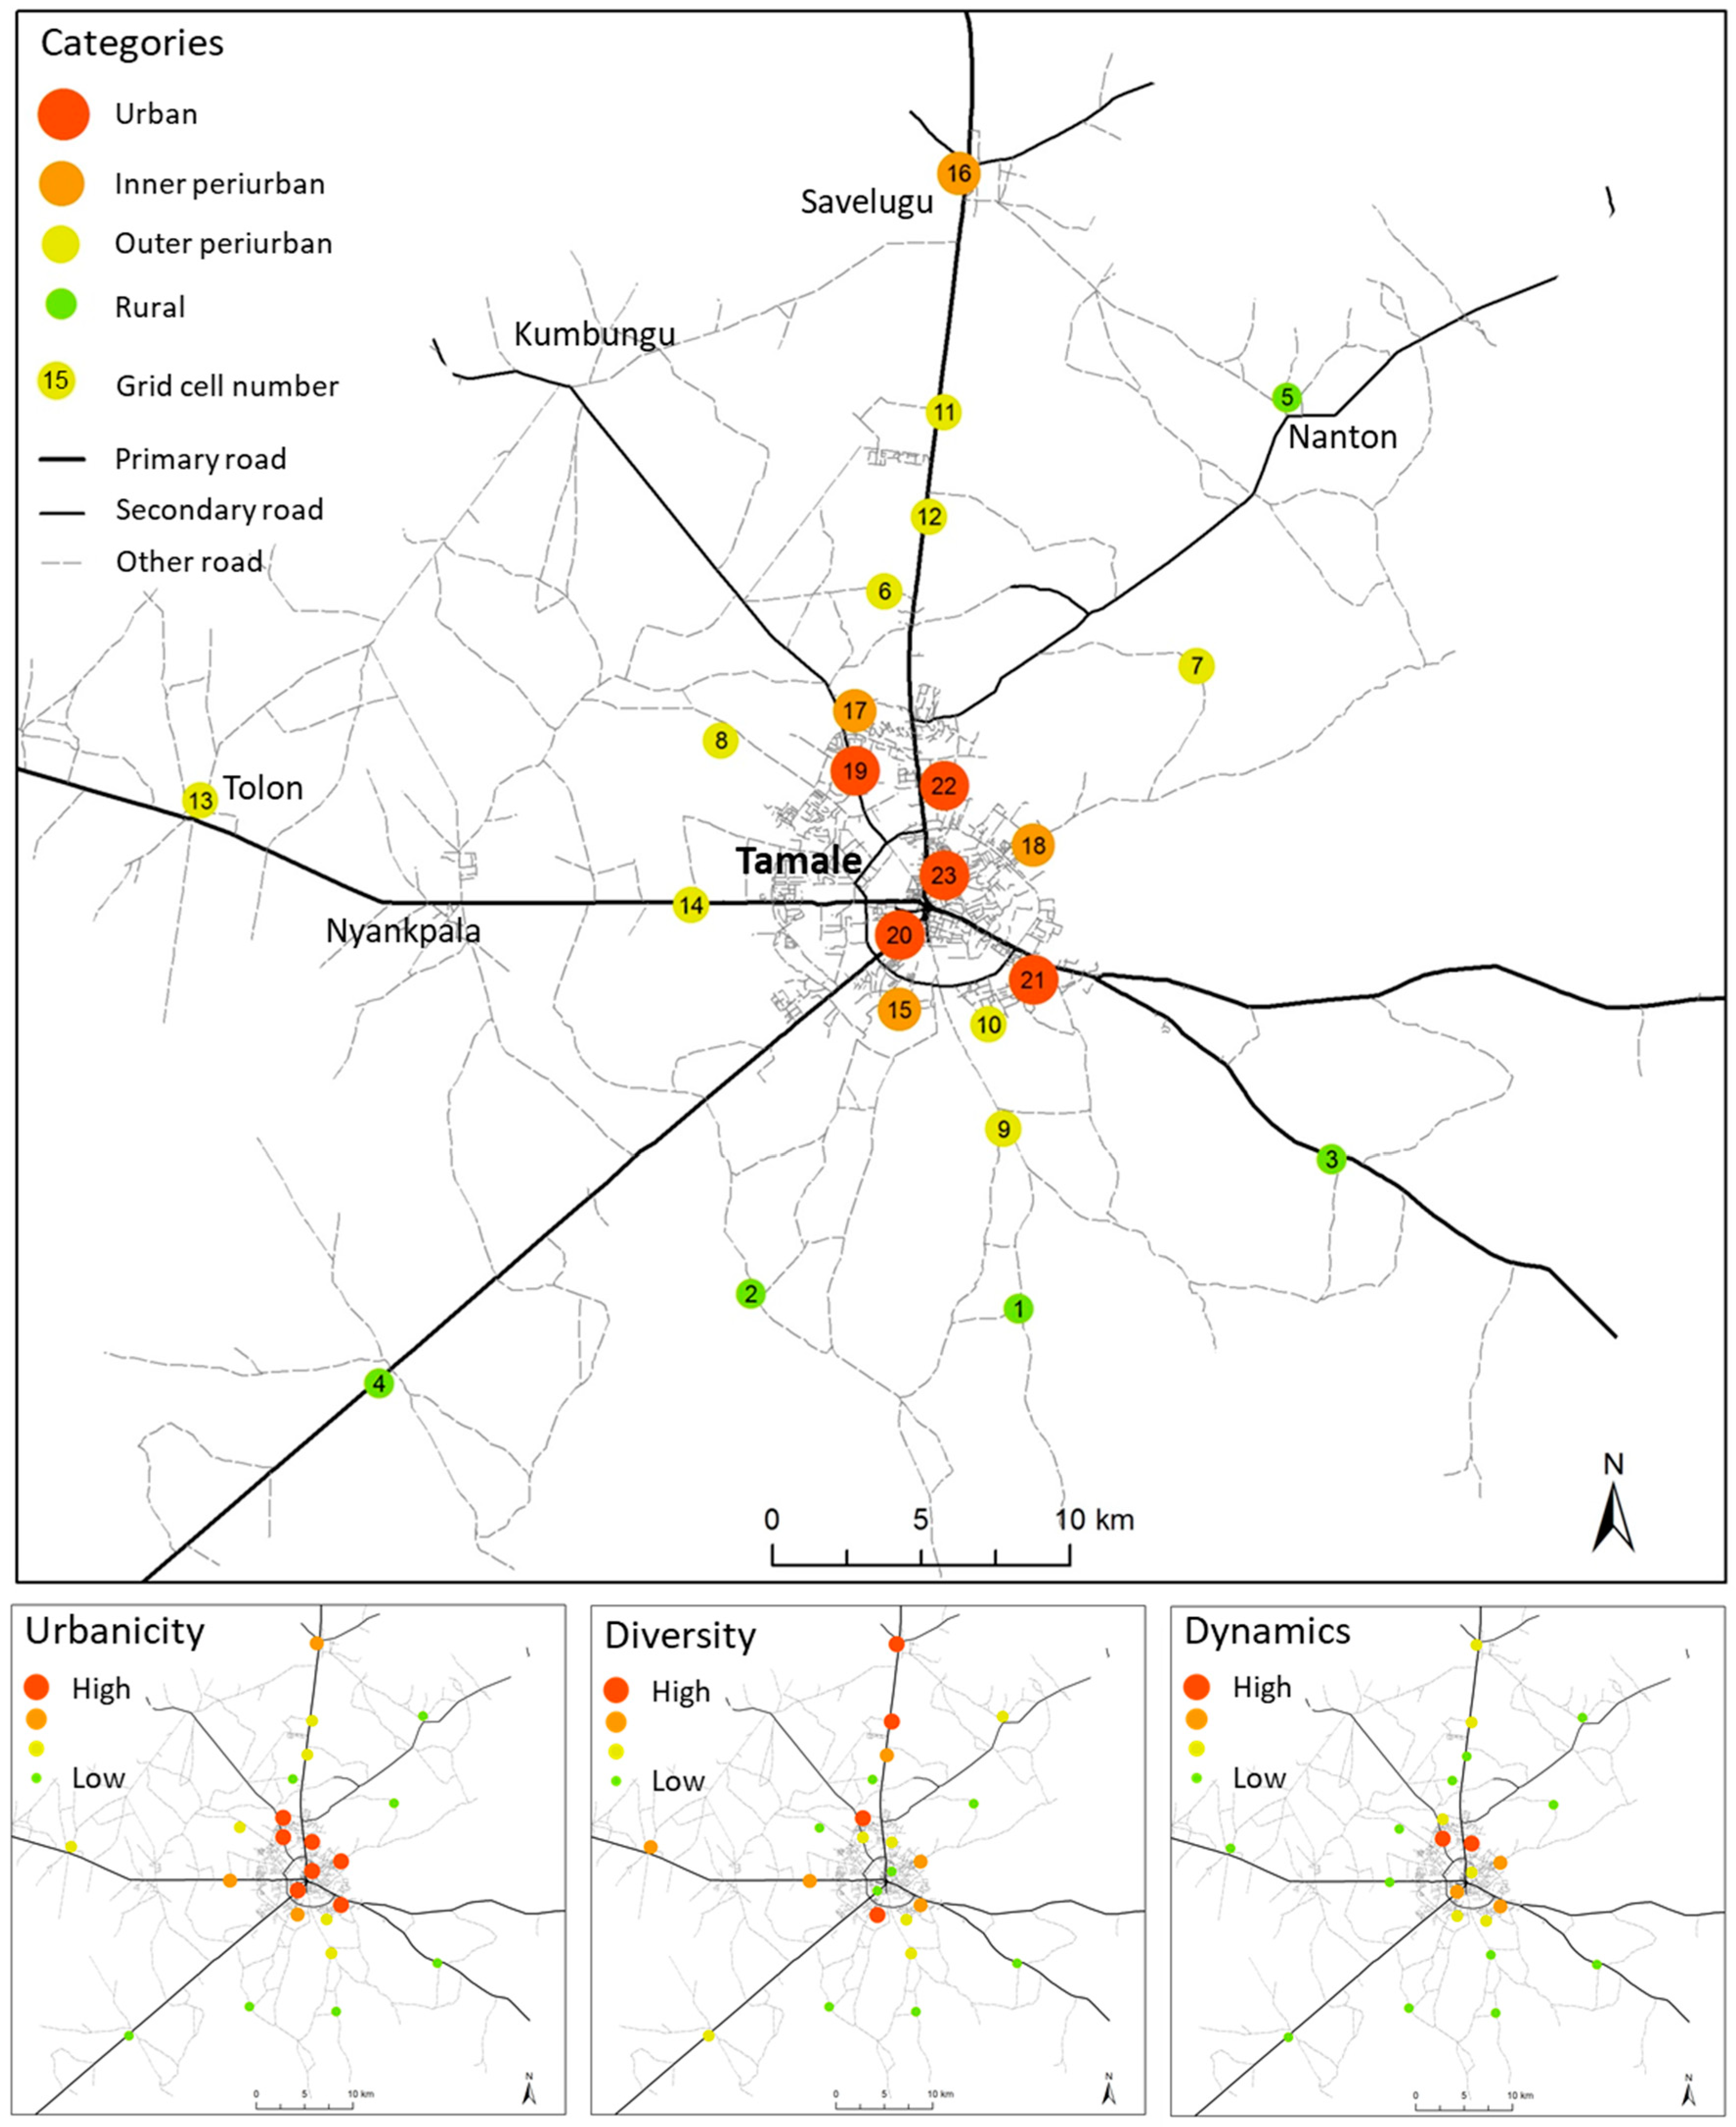
4.1. Classification of Sample Grid Cells as Urban, Periurban or Rural

The household-level urbanicity index consisted of seven parameters derived from the household survey (Figure 5). A value close to 1 implies high urbanicity, and values close to 0 imply low urbanicity.
The urbanicity values in the 23 sample grid cells ranged from 0.06 to 0.88. As urbanicity decreased, the number of households possessing a fridge and the number of square houses (as opposed to the traditional round huts) decreased more quickly than the number of households with access to sanitation facilities and the number of households not dependent on farming as their main livelihood activity. The share of households with access to water and electricity, as well as the frequency of visits to the centre of Tamale only declined with overall low urbanicity values (Figure 5). As expected, high urbanicity values were found in Tamale’s urban core (Figure 6). The highest diversity values were found in sample grid cells with medium urbanicity values, while diversity was generally low in grid cells with either high or low urbanicity values. The highest increase in new buildings was observed in the vicinity of the urban core, where in some sample grid cells the built-up area more than doubled in size in less than 6 years (Figure 7).
Different degrees of urbanicity, diversity and dynamics determined the classification of sample grid cells as urban, periurban or rural (Figure 8). The boundaries were drawn on the basis of trends in the data. We identified a number of sample grid cells for each of the four categories (‘baseline scenario’). Different groupings or scenarios were considered to take into account ambiguous grid cells that may fall into one group or the other (Figure 8). The sample grid cells classified as rural were characterised by low urbanicity, diversity and dynamics values. On account of the variability of the data, the sample grid cells classified as periurban were divided into two groups. The outer periurban areas exhibited low to medium urbanicity and dynamics levels (Figure 9), while the inner periurban areas were characterised by medium to high urbanicity levels and comparatively higher dynamics values (Figure 10). Both inner and outer periurban areas exhibited a relatively high variance of urbanicity values as an indication of a diverse mix of households (Figure 8). Inner periurban areas showed on average of 2.5 times more construction activities as compared with the outer periurban areas for the reference period and were thus more dynamic in terms of land use change. As noted above, land use change values necessarily reflect a change that occurred in the past. Therefore, it is likely that periurban areas are currently undergoing rapid change, whereas in urban areas exhibiting high change values, this process is already completed. As expected, the change rate declined within the most highly urbanised sample grid cells. Alongside relatively high levels of change, areas classified as urban exhibited high urbanicity and low to medium diversity values.

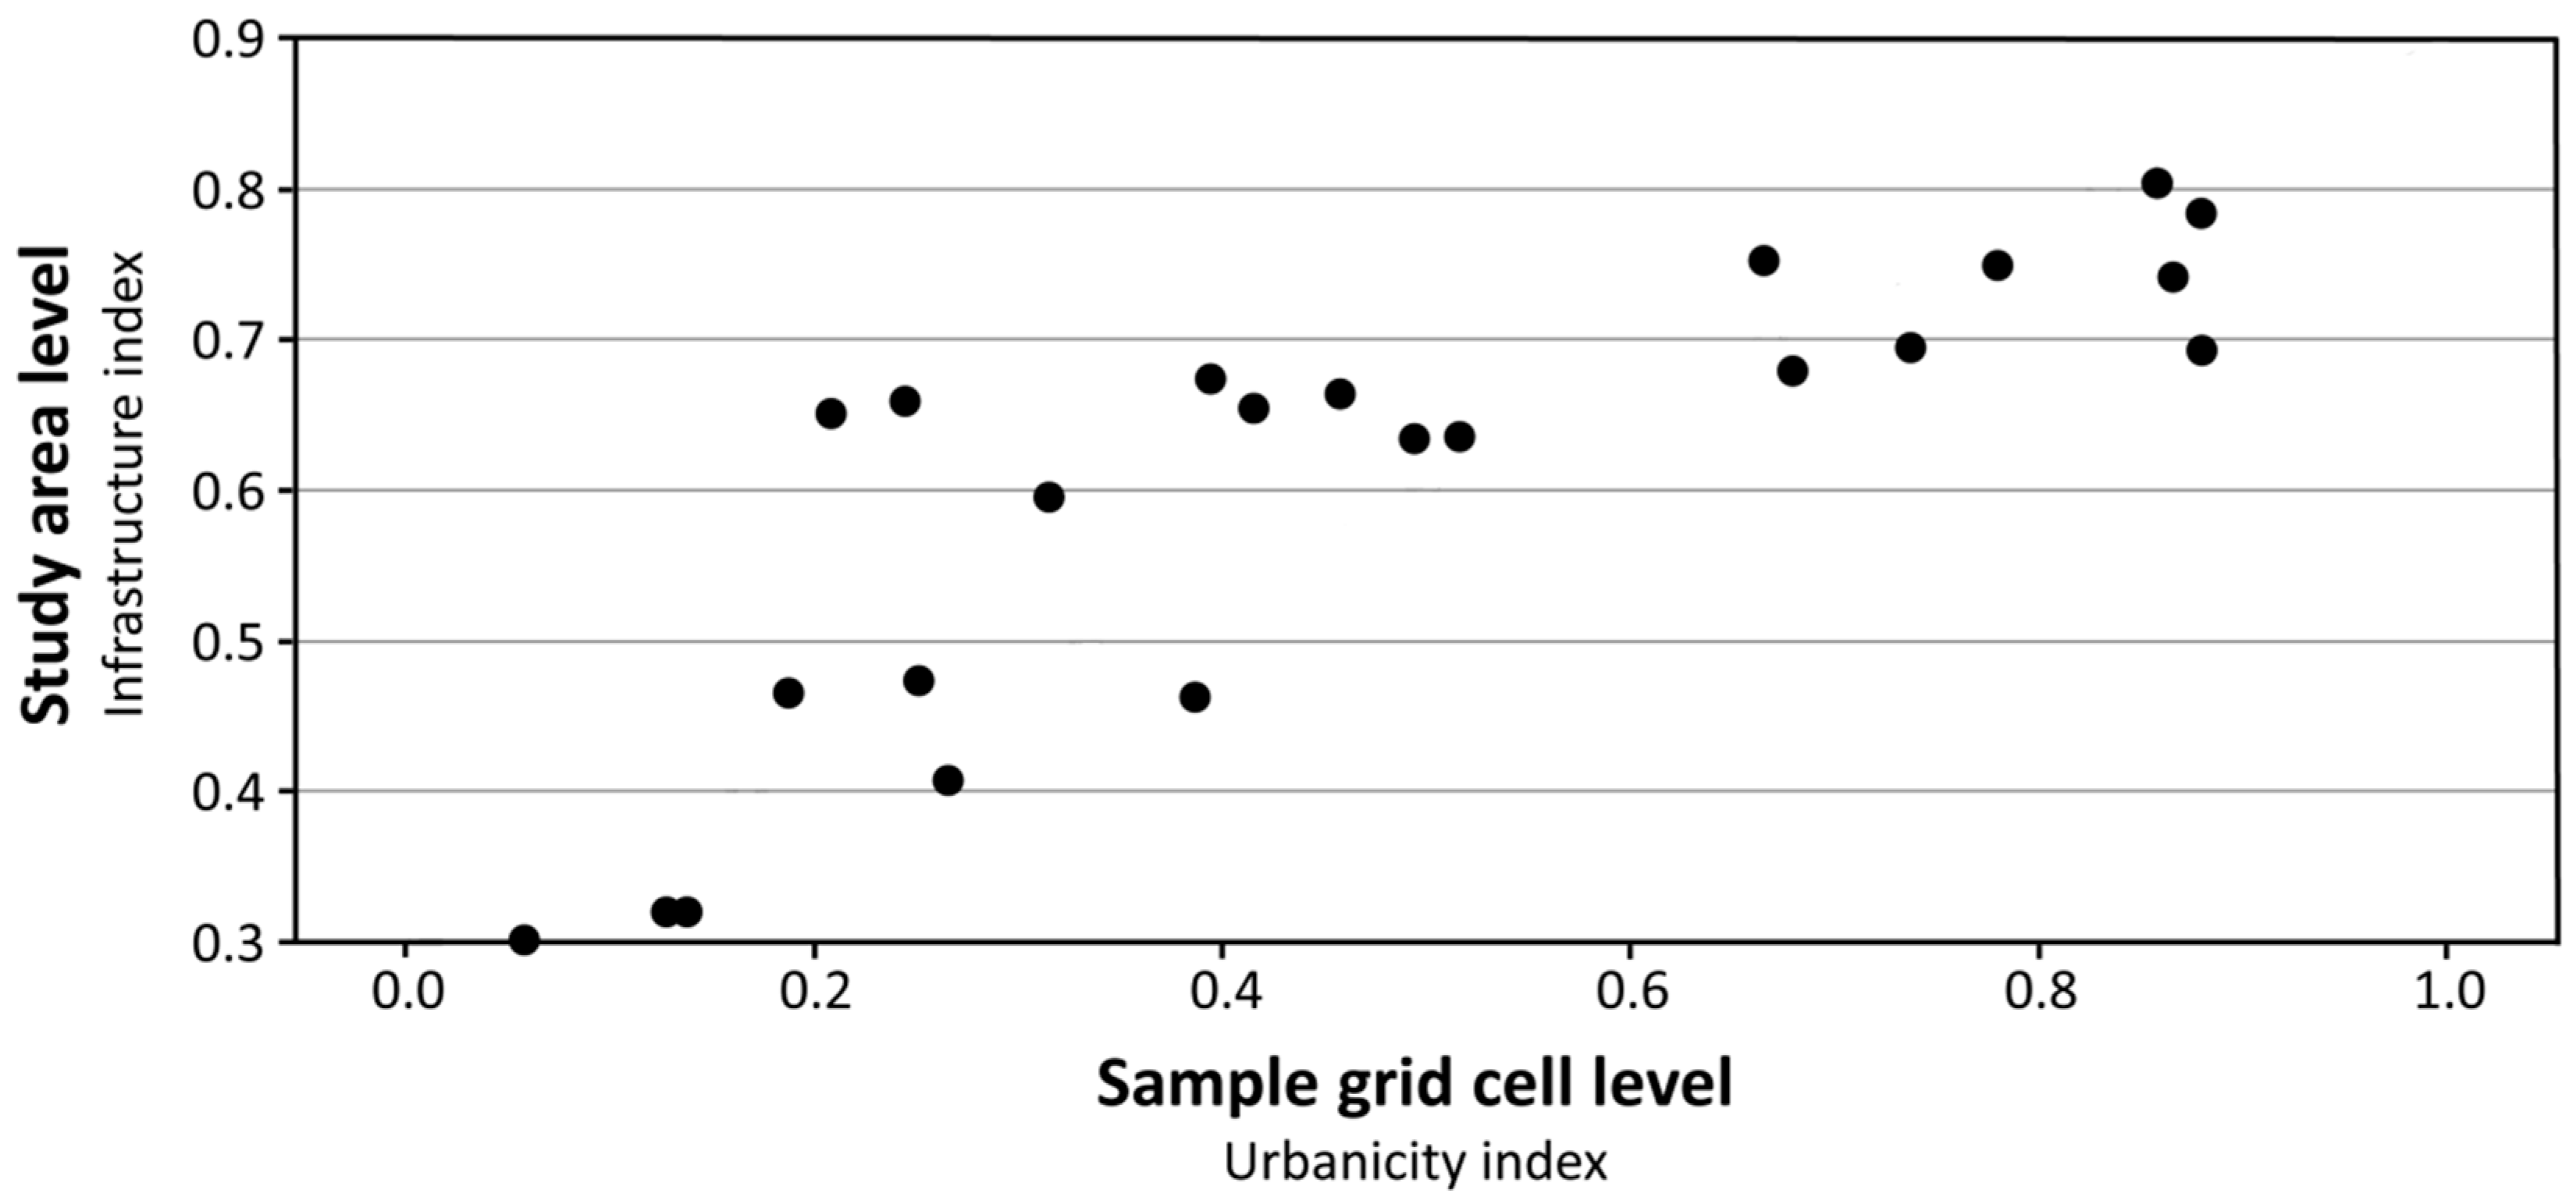
4.2. Infrastructure at Study Area Level

The contribution made by built-up area was highest in the actual urban centres, whereas the importance of services, i.e., access to electricity and water, was not limited to the urban areas. In the north-west of the area, high values were observed for ‘services’, which can be explained by the fact that the piped water network was expanded as part of community development efforts due to the proximity of the water source (White Volta). With regard to the rubric of access, comprising road length per grid cell, distance from the road and access to public transport, high values were recorded over a relatively widespread area, indicating that even remote villages are well connected to the city (Figure 11).

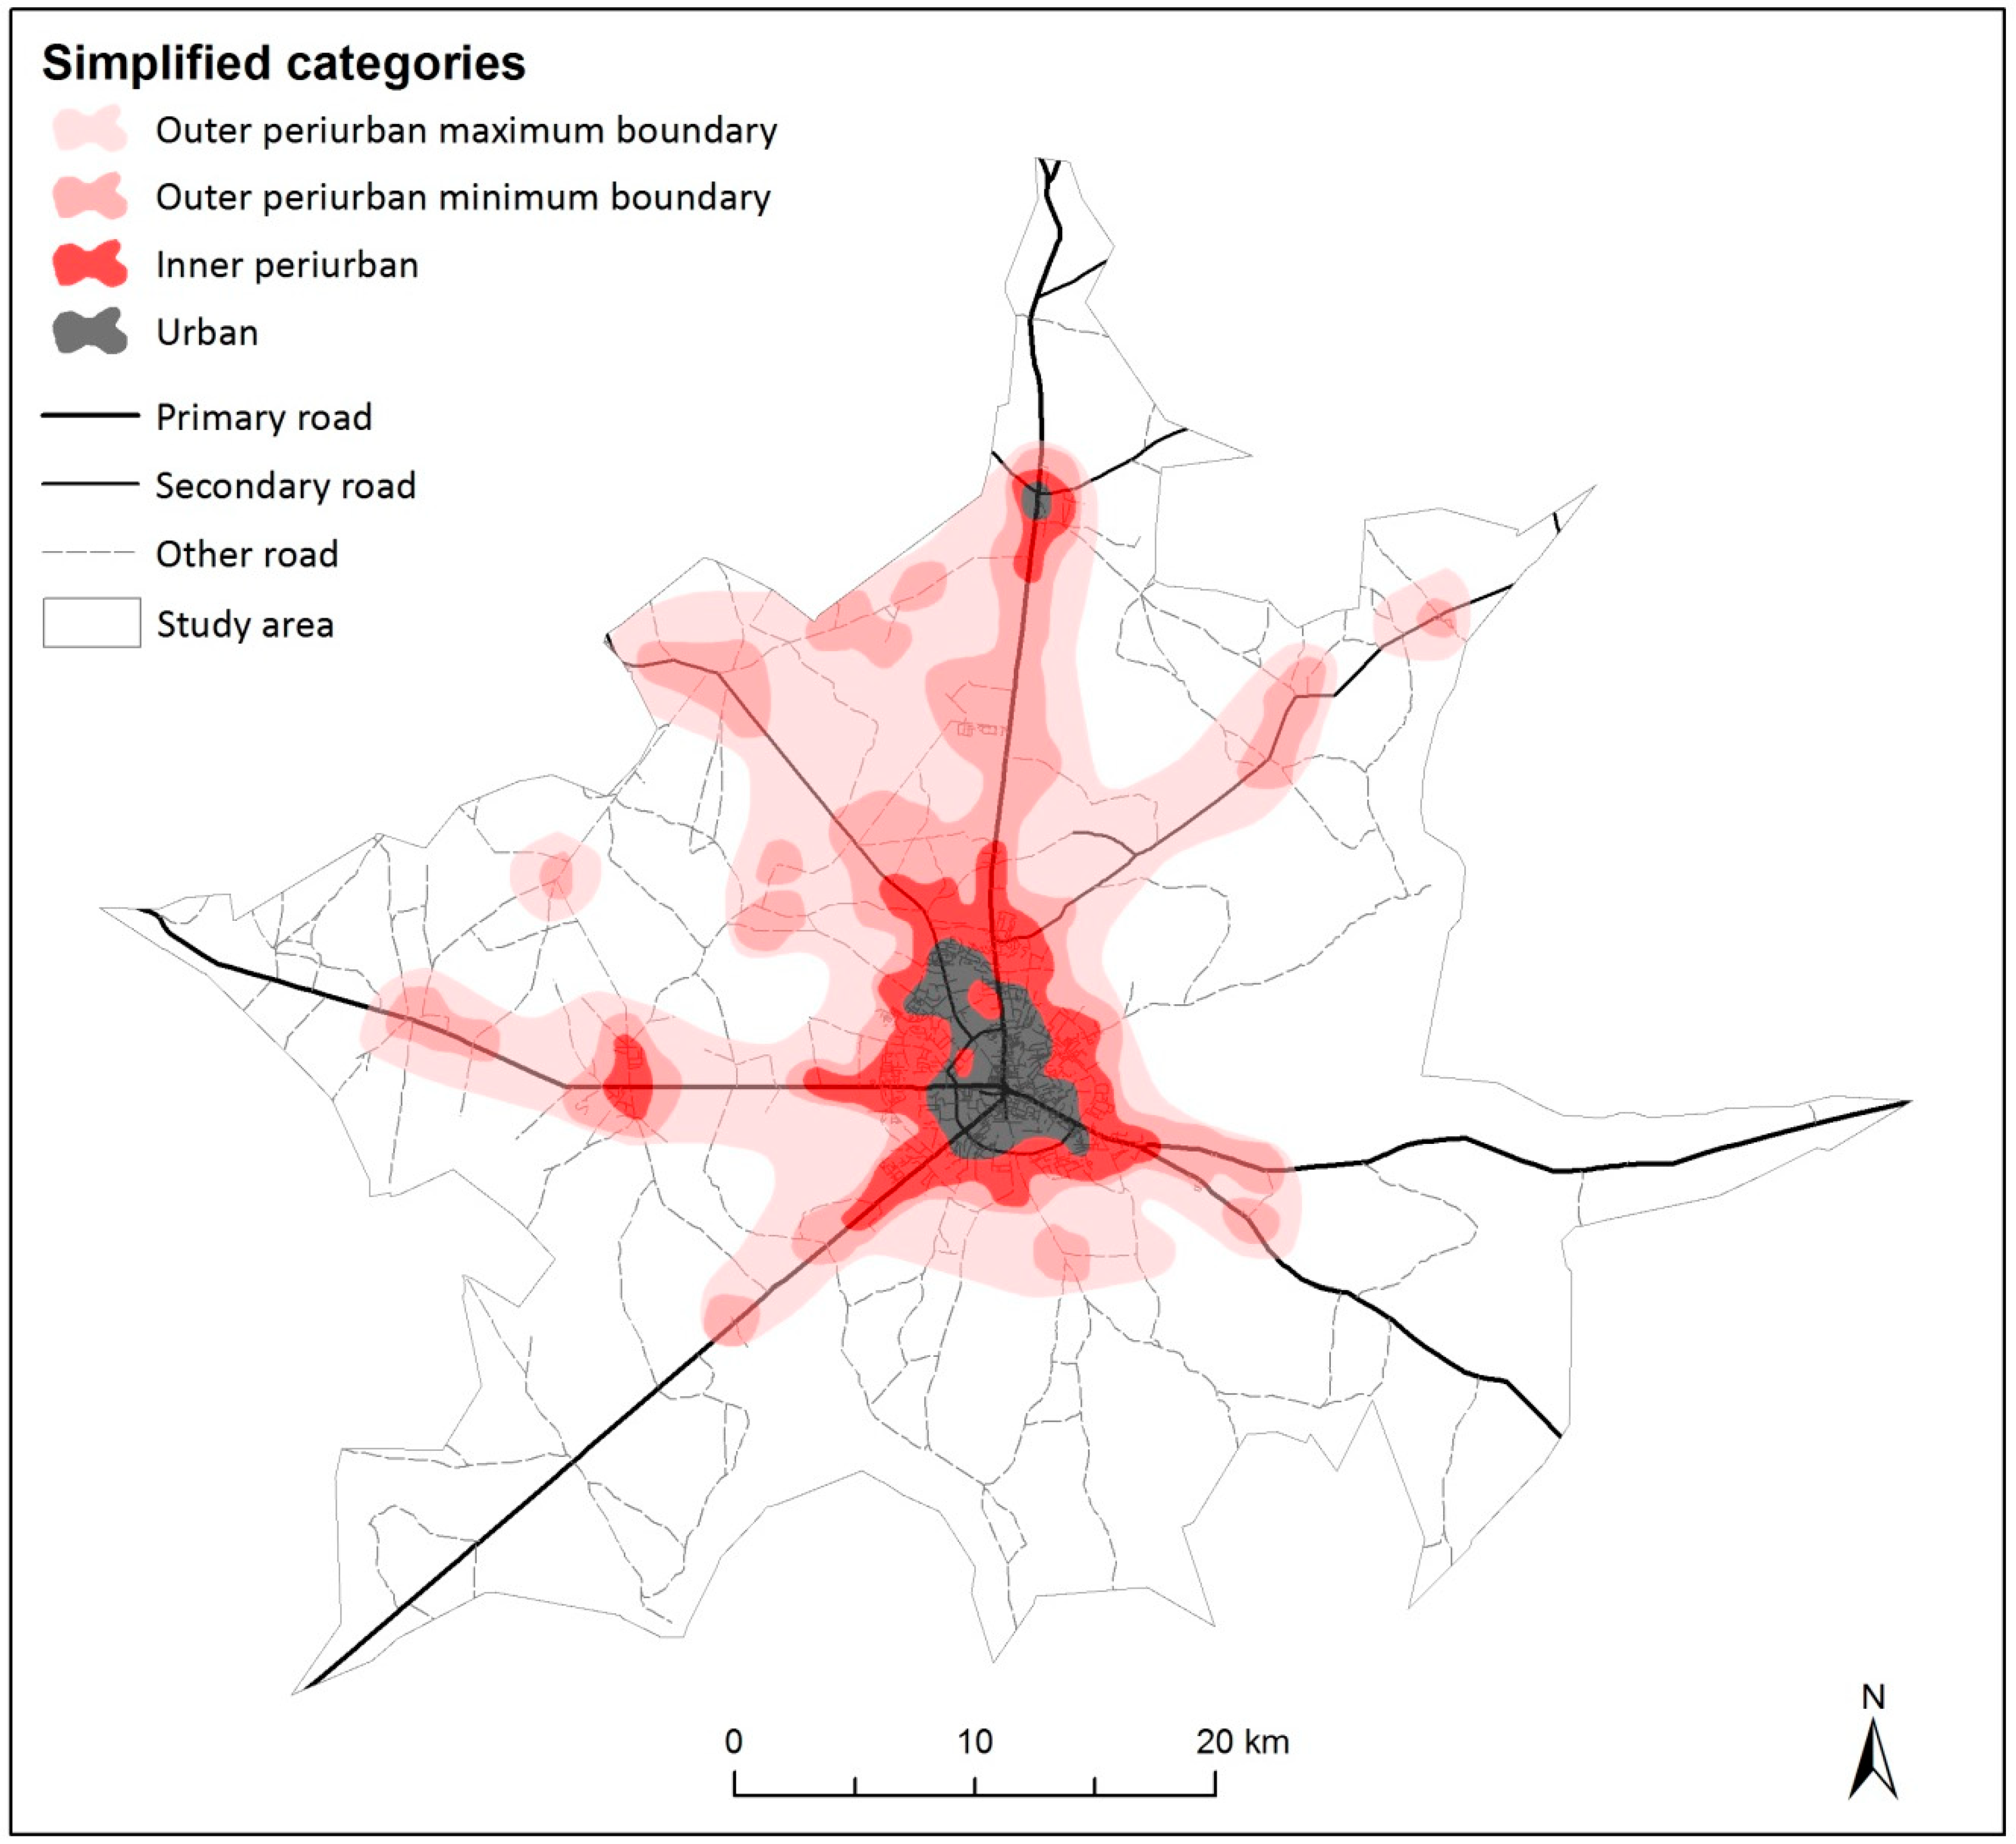
4.3. Classification Results Up-Scaled to The Study Area

The Pearson product-moment correlation coefficient confirmed that there is a positive linear correlation between urbanicity and infrastructure (r = 0.8) (Figure 12). The Shapiro–Wilk test was used to confirm the normal distribution of both urbanicity and infrastructure index values. Using student’s t-test and based on the positive linear correlation between urbanicity and infrastructure values, 8289 out of the 8321 grid cells were assigned to the most likely category (Figure 12).
The up-scaling results showed that around Tamale’s urban core, urban grid cells constituted an almost contiguous area, which also extended along the north-eastern road to Kumbungu and the town of Savelugu to the north of Tamale (Figure 13). The largest proportion of the cells classified as ‘inner periurban’ surrounded the inner city cells designated as ‘urban’, along with a few grid cells covering villages and small towns, generally along major roads. ‘Outer periurban’ areas adjoined the ‘inner periurban’ grid cells and extended along major roads. The road connecting Tamale and Savelugu and the adjacent grid cells were all classified as ‘periurban’. In order to account for alternative classifications of sample grid cells into the respective categories and to assess its influence on the up-scaling results, another four potential up-scaling scenarios were considered (Figure 8). In these scenarios, the category assignment did not change for 88.5% of the grid cells. The robustness levels also showed that the classification of grid cells along roads, in particular along the roads between Tamale and the closest towns and villages, was ambiguous. Inner periurban areas were the least robust, with 25–32% of cell classifications being ambiguous.

5. Discussion

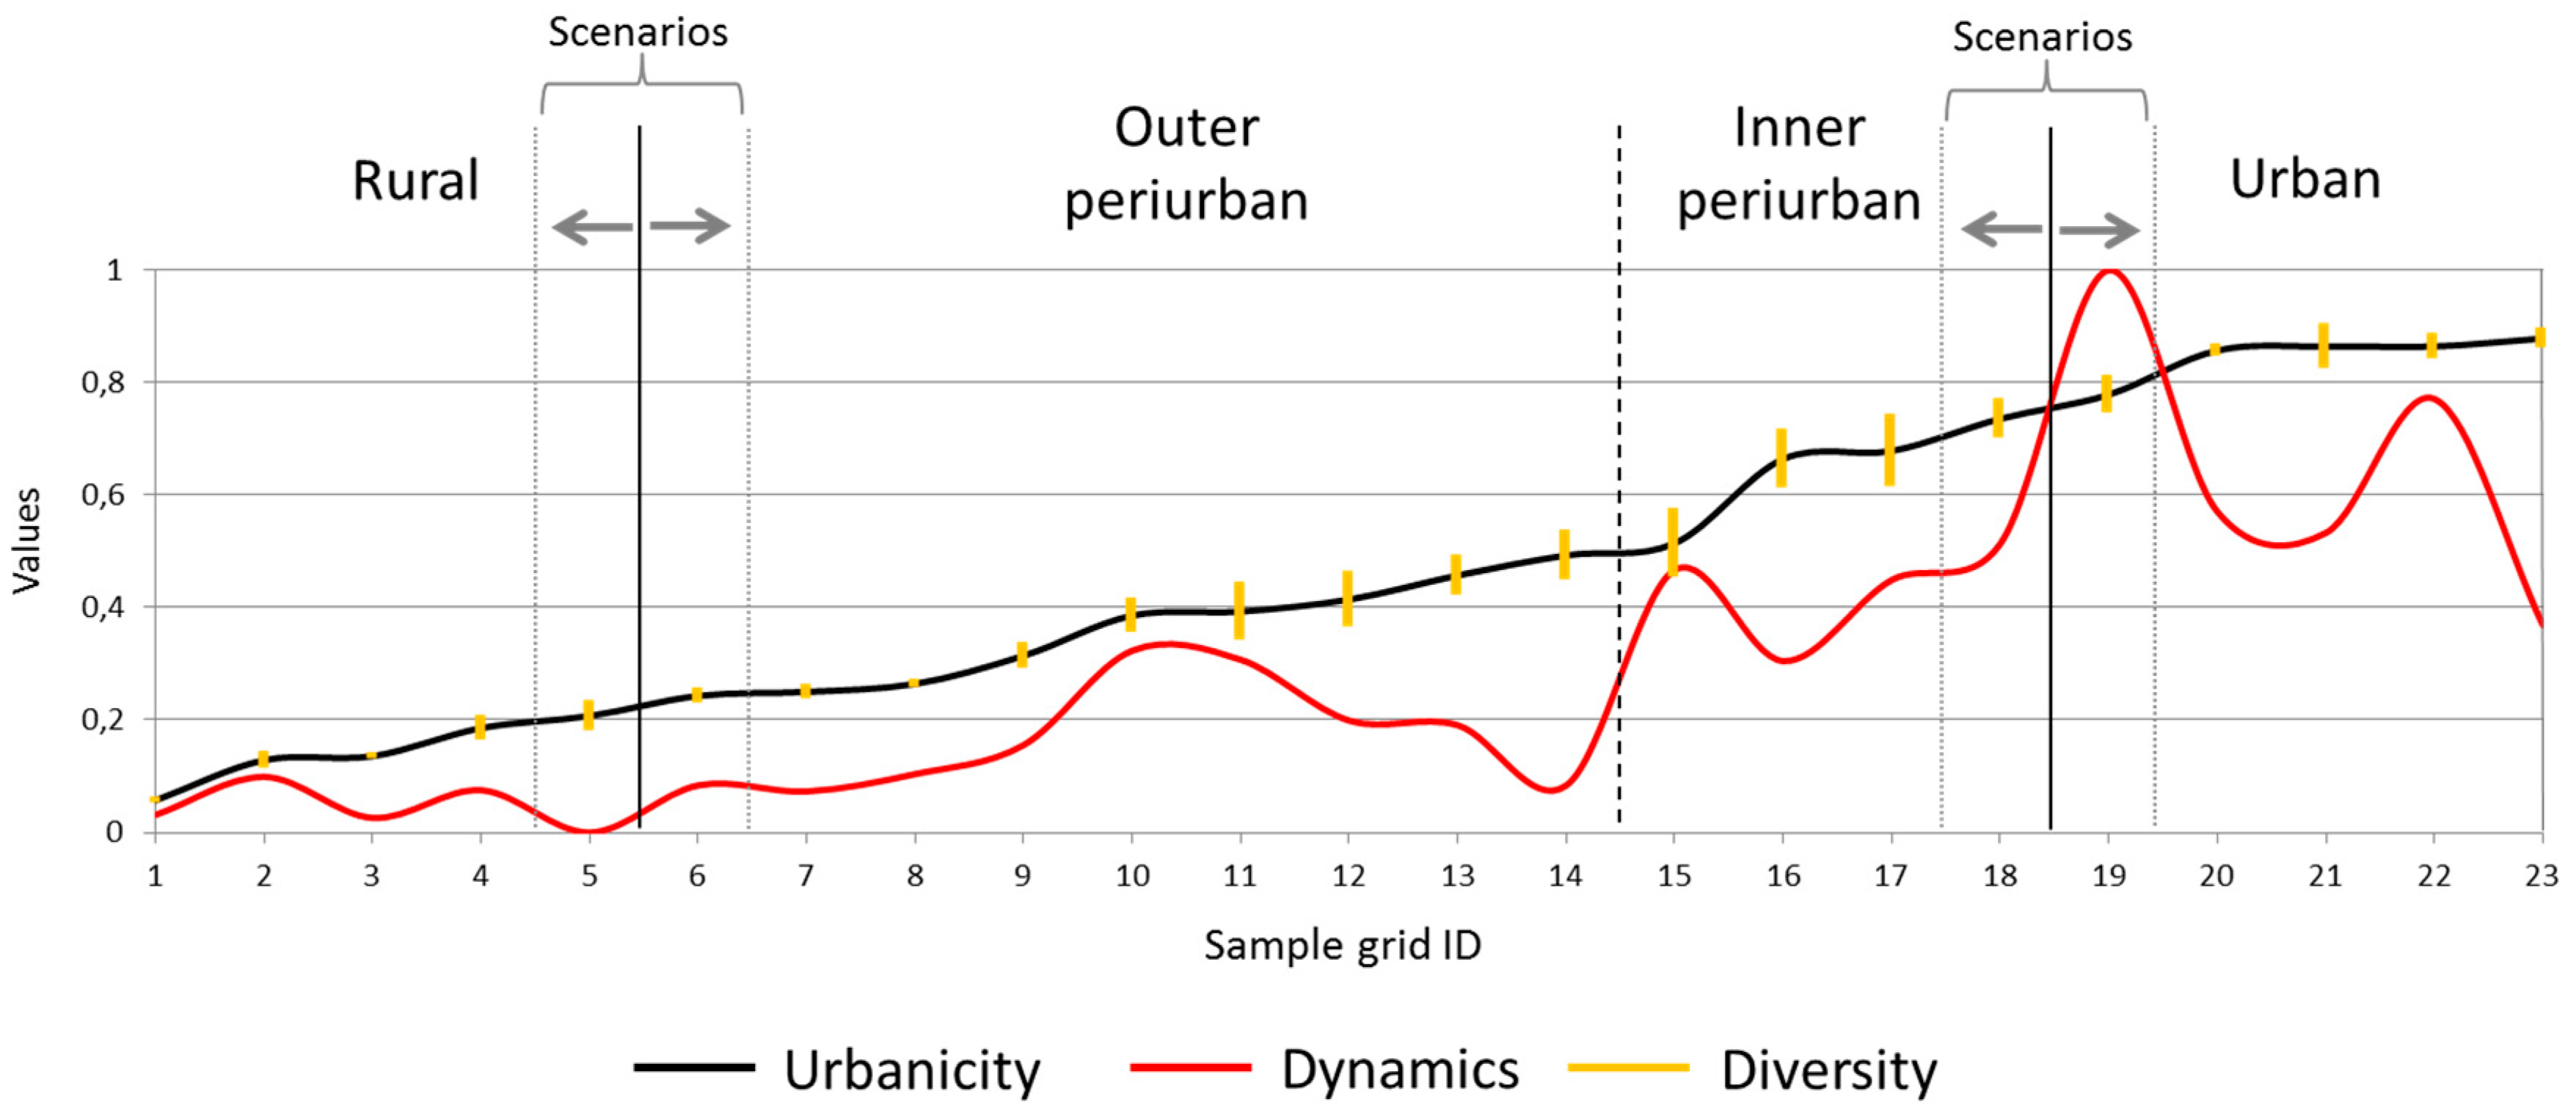
5.1. The Periurban: Two Areas of Transition Along the Urban-Rural Gradient

The contribution of household parameters to the urbanicity index varied along the urban-rural gradient. Whereas urban housing structures were most pronounced within and in close proximity to the city, other household-level parameters positively associated with urbanicity, such as access to water and electricity services, and the frequency of visits to the city centre, were more evenly spread across the study area, including inner, outer periurban, as well as selected rural areas. The latter indicates that the connection between people and the city (for labour, markets, etc.) is not restricted to the mere presence of urban housing. As expected, the results showed that the characteristics of those areas lying between the extremes of the urbanicity scale were not clear and unambiguous but rather patchy and “lumpy” [39] in terms of their levels of change and diversity (Figure 8). Two main areas of transition could be identified, albeit with fuzzy boundaries, representing the two “different concepts of periurbanness” [29], see also [13,17,18]:
1. The inner periurban areas are highly dynamic and thus, experience increasing population pressure, as reflected by the significant change in the levels of built-up area. The dynamic character of the inner periurban area, also referred to as the “zone of direct impact” [18], or the “urban fringe” [17], also suggests an intense land use competition and a conversion from agricultural to non-agricultural land uses (Figure 8). The high rates of construction activities suggest in-migration of people, from urban as well as rural areas, as has been noted with respect to Tamale by Oppong & Yeboah (2013) [40]. The high diversity values, reflecting the mixed socioeconomic structures, also indicate the simultaneous occurrence of rural and urban activities in these areas. Settlements classified into inner periurban vary in their appearance, history and proximity to the urban centre. They range from towns like Savelugu, a district capital 20 km north of Tamale (Figure 13) sharing strong market links with Tamale, over nearby villages that have been absorbed by the city with traditional housing layouts and low infrastructure development, to previously vacant areas that have undergone more planning including a regular road structure and some infrastructure provisioning (Figure 10).
2. The outer periurban area, also referred to as the “market-related zone of influence” [18] or “hinterland” [17], was more extensive than the inner periurban area. Some of the sample grid cells classified as outer periurban are as distant from the city centre as some sample grid cells classified as rural. However, these areas have urban infrastructure in place or better access to the city centre, as indicated by the relatively high contribution of the rubrics ‘services’ (access to electricity and water) and ‘linkages’ (frequency of visits to the city centre) to the urbanicity index. These sample grid cells also exhibited higher diversity levels as compared with the rural grid cells, thus suggesting a broader socioeconomic mix of households. This may be due to the greater number of potential livelihoods open to households and thus, options for non-farm employment in these areas, as opposed to households in rural areas with poor access to urban markets and services. These settlements range from traditional villages with rather rural lifestyles, relatively close to and therefore exhibiting relatively strong links to the city, over villages increasingly absorbed by urban growth, to growing villages with a relatively high heterogeneity among their inhabitants possibly due to their proximity to urban facilities (airport; Figure 9) and the existence of a market place (Nanton; Figure 13). Yet, the majority of households depend on farming as their main livelihood activity and may have traditionally lived in these areas. This accords with the levels of change in built-up area that were low to medium (Figure 8), indicating that this zone is not driven by growth and migration pressure to the same extent as the inner periurban area.

5.2. Spatial Patterns of Periurbanisation

The up-scaling results revealed that most of the areas classified as urban constituted a spatially contiguous area around the urban core of Tamale. This area was surrounded by inner periurban areas, forming a more or less continuous area of land, more extensive along roads and towards the north. Inner periurban areas, that will soon become urban, might have developed as a result of villages being absorbed into the city (“absorbed periurban”, see Reference [10]), or via diffuse urban sprawl (Figure 9). By contrast, the spatial patterns found in the outer periurban areas rather evoke the image of ribbon development, with development following transportation axes, such that “lands adjacent to [these] corridors are developed, but those without direct access remain in rural uses” [41] (Figure 10). As such, the outer periurban extent reached up to 30 km outside the city centre. The inner periurban area extended up to 10 km from Tamale’s centre. Adam (2001) found for Kumasi a similarly irregular pattern, with the periurban area reaching up to 40 and the inner periurban area (“commuting zone”) up to 30 km from the city centre [29]. A graduated shift from more urban to more rural areas can thus be observed as one moves further away from the city, with a less steep transition along major roads (see Reference [16]). Yet, as Simon et al. (2004) [16] noted, there may be “islands of “urbanness” in the outer (more rural) segment if pre-existing settlements of considerable size and distinctive economic mix have recently come to be within the zone.” This accords with Drescher & Iaquinta’s (2000) notion of “village periurban” or “rural places with urban consciousness” [10], which are not necessarily in the proximity of the city. The town of Savelugu, a district capital 20 km north of Tamale, constitutes such an urban island, and this has resulted in most sections of the road between Tamale and Savelugu being classified as periurban. The high number of periurban grid cells towards the north of the study area reflects the importance of the northern access road. By contrast, in the southern part of the city, the periurban zone is narrower and does not appear to play such a significant role within urban development. Other periurban islands include several small towns in rural areas, such as Nanton, Nyankpala, Kumbungu and Tolon, which, as market towns, have strong links to Tamale (Figure 13). Likewise, “zones […] of more rural character may persist” within the urban area [16]. One example of this “sectoral interaction” is urban agriculture [42], which is a widespread activity in Tamale [43]. It takes place, for example, on the ‘Gumbehene New Dam’ in the western part of Tamale’s centre (Figure 13). This zone was classified as inner periurban and is surrounded by grid cells classified as urban. Agricultural land use within Tamale’s urban and inner periurban areas is characterised by irrigated commercial vegetable production on open spaces, such as designated green belt areas, and rain-fed cereal production on interstitial spaces, which have emerged in the course of unplanned urban growth [43]. Moving further out of the city towards more rural areas, hybrid farming systems dominate where farmers produce for subsistence (in particular maize) as well as for the market (such as soybean) [44]. Further urban expansion is likely to change rural farming systems and livelihoods [45] and boost more intensive production systems to meet the urban demand for fresh vegetables, dairy products and meat.

5.3. Implications for Planning

Friedmann (2016) argues against the formulation of general theories of periurbanisation for the purpose of policy and planning as related strategies should always be specific to given places and times as well as institutional contexts [4]. On the other hand, planning policies are de facto based on existing planning models, oftentimes reflected in administrative, dichotomous entities of ‘urban’ and ‘rural’ that do not adequately reflect the real-world situation in many cities. We make the case for a working definition of periurban for the purpose of planning and at the same time acknowledge inevitable trade-offs. These include the context-specific vs. general nature of the periurban, the delineation of boundaries vs. the fact that boundaries cannot be unambiguously established and the moment-in-time research vs. the dynamic nature of the periurban.
Due to the fuzzy nature of the periurban, its use as an analytical unit with rigid boundaries has to be handled with care. This particularly concerns the outer periurban extent that, unlike the urban and inner periurban areas, consists of isolated settlements and long stretches along the road. Therefore, we simplified the respective boundaries in order not to simulate an unrealistic level of accuracy (Figure 14). For the outer periurban extent, we used an inner (along those grids classified as outer periurban) and outer boundary which includes ambiguous cells and surrounding non-built-up area. The simplified classification still reflects distinct spatial patterns, such as larger areas of land, as well as more isolated spots well connected to the city and relatively well equipped with infrastructural facilities. On the other hand, the classification shows vast underserved areas and a lack of transport infrastructure. Such an assessment can support a territorial approach to planning by demonstrating which areas are lagging behind and which areas will be most affected by urban expansion. Inner periurban areas are very likely to expand in the near future, leaving urban areas behind. Holistic urban planning, taking into account the spatial, institutional, as well as the historical context in which future urban areas develop, can substantially contribute to improve quality of life in these highly dynamic areas. This includes minimising negative environmental and health effects by creating access to basic services including adequate sanitation, water supply (see [46] for water shortage in Tamale), waste disposal, and food markets. One of the challenges to a sustainable urban transformation is conflicts over the allocation and use of land between the traditional authorities on the one hand and governmental planning institutions on the other. In Ghana, as in many African countries, periurban land is often held under communal tenure. This facilitates corruption, “especially where […] vast profits are available almost instantly” [47]. A sharp increase in land values in Tamale, reported by Naab et al. (2013) [48], resulted in the sale of land by traditional leaders (chiefs) for private use [32]. Periurban farmers are therefore increasingly faced with insecure land tenure and erosion of their livelihoods [45].
With respect to outer periurban and close-by rural settlements, planning can support links to the city and help inhabitants benefit from the proximity to urban markets, services and administration. For example, linking urban consumers to periurban and rural producers can foster economic development in this zone and boost non-farm employment. Therefore, policy measures can include the development of road infrastructure and transport facilities and, besides improving physical infrastructure, strengthen governance capacity across urban and rural spaces and administrative boundaries.

5.4. Critical Reflection on the Methodology

This study is a snapshot in time, and despite the highly dynamic nature of the city and its surroundings, it gives an insight into some of the manifold social, infrastructural and land use characteristics and changes that are taking place in the inner periurban areas of Tamale in particular. These processes may occur simultaneously, or may be triggered by other factors and even induce further changes. Newly built settlements, for instance, may lead to infrastructural development that in turn attracts new migrants. The choice of the overall study area has an impact on whether a settlement that may be classified as periurban is conceived to fall under that category. For this reason, the study area has to be carefully determined by incorporating the entire urban–rural gradient by means of a wide distribution of parameters suited to representing urbanicity in a given context, as well as taking the overall spatial configuration of the relevant settlements into account. The method takes multiple spatial scales and a variety of parameters and data sources into account. The household level parameters are partly context-specific and would have to be adjusted in another setting on the basis of expert knowledge. Other attributes are generic and are applicable across contexts [15]. This study set out to extend existing methodologies to classify and map urban and periurban development in a medium-sized city in sub-Saharan Africa. Cross-country studies should be explored in the future to test application in other sub-Saharan medium-sized cities.

6. Conclusions

Periurban areas of growing cities in developing countries have been conceptualised as highly dynamic landscapes characterised by a mixture of socioeconomic structures, land uses and functions. For planning and development purposes, it is useful to know the spatial extent of such zones, although it is a matter of debate as to whether the multitude of elements that constitute these phenomena can be measured and compared.
The results of this multi-dimensional study show that areas lying between the extreme ends of the urbanicity scale exhibit higher levels of land use change and socioeconomic diversity, confirming certain claims made in the literature. The results also suggest that the periurban area consists of two main zones. The inner periurban area is driven by urban expansion and is currently undergoing tremendous changes from non-urban to urban land. The outer periurban area is part of a wider functional city region with strong links to the city and is characterised by a more socioeconomically diverse mix of households as compared to rural areas, possibly due to the greater range of potential livelihoods resulting from better access to urban markets and services. Changes in land use here are less substantial than in the inner periurban area, and the physical appearance of these areas may not differ from rural villages, albeit with better access to urban facilities. Results indicate more pronounced periurban development along major transport corridors, as well as periurban islands in the rural zone. However, delineations of boundaries dividing the different zones should not be considered discrete, but rather fuzzy in space and dynamic in time.
The focus of this study was not on the impact of periurbanisation on people and the environment. Yet, in Tamale, as in many other West African cities, rapid urban growth and the conversion of agricultural land in urban land, poor planning and land-use conflicts necessarily have an impact on local livelihoods and on the provision of public infrastructure necessary to minimise negative health and environmental effects. Inner and outer periurban areas are thereby affected in different ways and hence may need a different planning and policy response. Therefore, knowing where these processes take place is crucial. The fine resolution used in the study makes it possible to detect distinct spatial patterns of periurban development. This will help planners and policy-makers make informed and integrated decisions beyond administrative boundaries. Taking an integrated approach and considering the entire urban–rural gradient can support positive links between urban, periurban and rural areas, reduce inequalities as well as better understand spatial developments in urbanising environments.

Author Contributions

Conceptualization, H.K., R.H., J.S., A.D., G.K.-B. and R.G.; Data curation, H.K., R.H. and J.S.; Formal analysis, H.K. and R.H.; Investigation, H.K. and R.H.; Methodology, H.K., R.H., J.S., A.D. and R.G.; Software, R.H.; Supervision, A.D., G.K.-B. and R.G.; Visualization, H.K. and R.H.; Writing—original draft, H.K.; Writing—review & editing, H.K., R.H., J.S., A.D., G.K.-B. and R.G.

Funding

This research was funded by German Federal Ministry for Education and Research (BMBF) and the German Federal Ministry for Economic Cooperation and Development (BMZ) grant number 031A242-D.

Acknowledgments

This work was carried out as part of the UrbanFoodPlus project under the initiative GlobE – Research for the Global Food Supply. We thank the Volta River Authority, the Ghana Water Company, the Town & Country Planning Department, and the Ghana Private Road Transport Union in Tamale for kindly sharing their data. We are also grateful to the University for Development Studies in Tamale, in particular to Prof. Dr. George Nyarko for his support during field work. The article processing charge was funded by the German Research Foundation (DFG) and the University of Freiburg in the funding programme Open Access Publishing.

Conflicts of Interest

The authors declare no conflict of interest.

Appendix A. List of Rubrics, Parameters, Processing Stages and Data Sources

RubricParameterSample Grid Cell Level Study Area Level
Included in the AnalysisProcessingSourceIncluded in the AnalysisProcessingSource
ServicesElectricityx1 = yes
0 = no
Household survey (2014)x1 = Access to electricity station based on distance (within 1 km buffer)
0 = no access (beyond 1 km)
Volta River
Authority (2015)
Water x1 = private/public pipe
0 = dam
Household survey (2014)x1 = Access to water pipe based on distance (within 2 km)
0 = no access (beyond 2 km)
Ghana Water
Company (2014)
Sanitationx1 = private/public toilet
0 = open defecation
Household survey (2014)
AgricultureNon-farm employment as main livelihood activityx1 = yes
0 = no
Household survey (2014)
AccessPublic transport xDistance either from station (public minibuses) or taxi route * taxi/minibus fare Ghana Private Road
Transport Union
(Tamale) (2015)
Road density xRoad length/grid cell, including primary, secondary, tertiary, residential and unclassified roads
Weight according to primary (0.5), secondary (0.33), and other roads (0.17)
OpenStreetMap OSM (2015)
Distance to roads xDistance to road, including primary, secondary, tertiary, residential and unclassified roadsOSM (2015)
Urban built-up areaModern (square) housesx1 = yes
0 = no
Household survey (2014)xBuilt-up area (excluding round huts) of each grid cell and the 8 neighbouring grid cells based on a RGB composite at a resolution of 1.5 mSPOT (2013)
WealthFridgex1 = yes
0 = no
Household survey (2014)
LinkagesFrequency of visits to city centrex1 = 4–7 times/week
0 = 0–3 times/week
Household survey (2014)
Urban land use changeAreal change in modern building xQuantification of absolute change in built-up area from past and recent satellite imagery Google Earth imagery (2008, 2014) at a resolution of 0.5–1 m [37,38]
Land 08 00040 i001

Appendix B. Flow Chart Describing the Object-Based Image Classification

Land 08 00040 i002

References

  1. United Nations Human Settlements Programme (UN-Habitat). The State of African Cities 2014, Re-imagining Sustainable Urban Transitions; UN-Habitat: Nairobi, Kenya, 2014. [Google Scholar]
  2. African Development Bank; Organisation for Economic Co-operation and Development; United Nations Development Programme. African Economic Outlook 2016, Sustainable Cities and Structural Transformation; OECD Publishing: Paris, France, 2016. [Google Scholar]
  3. Rakodi, C. Poverty and Wellbeing in the Peri-Urban Interface of Developing Country Cities: A Review. DFID NRSP Programme Development Report PD070: Review of the Poverty Relevance of the Peri-Urban Interface Production System Research; NRSP: Hemel Hempstead, UK, 1999. [Google Scholar]
  4. Friedmann, J. The future of periurban research. Cities 2016, 53, 163–165. [Google Scholar] [CrossRef]
  5. Meeus, S.J.; Gulinck, H. Semi-Urban Areas in Landscape Research: A Review. Living Rev. Landsc. Res. 2008, 2, 1–45. [Google Scholar] [CrossRef]
  6. Allen, A. Environmental planning and management of the peri-urban interface: Perspective on an emerging field. Environ. Urban. 2003, 15, 135–148. [Google Scholar] [CrossRef]
  7. United Nations Human Settlements Programme (UN-Habitat). HABITAT III. In Revised Zero Draft of the New Urban Agenda; UN-Habitat: Nairobi, Kenya, 2016. [Google Scholar]
  8. United Nations Department of Economic and Social Affairs, Population Division. World Urbanization Prospects: The 2014 Revision Highlights; UN DESA: New York, NY, USA, 2014. [Google Scholar]
  9. Rauws, W.S.; de Roo, G. Exploring Transitions in the Peri-Urban Area. Plan. Theory Pract. 2011, 12, 269–284. [Google Scholar] [CrossRef] [Green Version]
  10. Drescher, A.W.; Iaquinta, D.L. Urbanization—Linking Development across the Changing Landscape. Final Draft. State of Food and Agriculture (SOFA)—Special Chapter on Urbanization; Food and Agriculture Organization of the United Nations (FAO): Rome, Italy, 2002. [Google Scholar]
  11. Allen, A.; Dávila, J.D.; Hofmann, P. Governance of Water and Sanitation Services for the Peri-Urban Poor; The Development Planning Unit, University College London: London, UK, 2006. [Google Scholar]
  12. Webster, D. On the Edge: Shaping the Future of Peri-Urban East Asia; Asia/Pacific Research Center: Stanford, CA, USA, 2002. [Google Scholar]
  13. Schlesinger, J. Agriculture along the Rural-Urban Continuum: A GIS-Based Analysis of Spatio-Temporal Dynamics in Two Medium-Sized African Cities. Ph.D. Thesis, University of Freiburg, Freiburg, Germany, 2013. [Google Scholar]
  14. Tacoli, C. The links between urban and rural development. Environ. Urban. 2016, 15, 3–12. [Google Scholar] [CrossRef]
  15. Woltjer, J. A Global Review on Peri-Urban Development and Planning. J. Perenc. Wil. Dan Kota 2014, 25, 1–6. [Google Scholar] [CrossRef]
  16. Simon, D.; McGregor, D.; Nsiah-Gyabaah, K. The changing urban–rural interface of African cities: Definitional issues and an application to Kumasi, Ghana. Environ. Urban. 2004, 16, 235–248. [Google Scholar]
  17. Leeming, F.; Soussan, J. Structures at the fringe of a city. Int. Soc. Sci. J. 1979, 31, 273–281. [Google Scholar]
  18. University of Nottingham; University of Liverpool. Literature Review on Peri-Urban Natural Resource Conceptualisation and Management Approaches; Final Technical Report; NRSP: Hemel Hempstead, UK, 1999. [Google Scholar]
  19. Saksena, S.; Fox, J.; Spencer, J.; Castrence, M.; DiGregorio, M.; Epprecht, M.; Sultana, N.; Finucane, M.; Nguyen, L.; Vien, T.D. Classifying and mapping the urban transition in Vietnam. Appl. Geogr. 2014, 50, 80–89. [Google Scholar] [CrossRef]
  20. Martin, W.A. The Conceptualization and Measurement of Urbanization. Ph.D. Thesis, University of Texas, Austin, TX, USA, 1976. [Google Scholar]
  21. Vlahov, D. Urbanization, Urbanicity, and Health. J. Urban Health Bull. N. Y. Acad. Med. 2002, 79, S1–S2. [Google Scholar] [CrossRef]
  22. Jones-Smith, J.C.; Popkin, B.M. Understanding community context and adult health changes in China: Development of an urbanicity scale. Soc. Sci. Med. 2010, 71, 1436–1446. [Google Scholar] [CrossRef] [PubMed] [Green Version]
  23. McDade, T.W.; Adair, L.S. Defining the “urban” in urbanization and health: A factor analysis approach. Soc. Sci. Med. 2001, 53, 55–70. [Google Scholar] [CrossRef]
  24. Dahly, D.L.; Adair, L.S. Quantifying the urban environment: A scale measure of urbanicity outperforms the urban-rural dichotomy. Author manuscript. Soc. Sci. Med. 2007, 64, 1407–1419. [Google Scholar] [CrossRef] [PubMed]
  25. Novak, N.L.; Allender, S.; Scarborough, P.; West, D. The development and validation of an urbanicity scale in a multi-country study. BMC Public Health 2012, 12, 530. [Google Scholar] [CrossRef] [PubMed]
  26. Van de Poel, E.; O’Donnell, O.; van Doorslaer, E. Urbanization and the spread of diseases of affluence in China. Econ. Hum. Biol. 2009, 7, 200–216. [Google Scholar] [CrossRef] [PubMed]
  27. Luck, M.; Wu, J. A gradient analysis of urban landscape pattern: A case study from the Phoenix metropolitan region, Arizona, USA. Landsc. Ecol. 2002, 17, 327–339. [Google Scholar] [CrossRef]
  28. Yu, X.J.; Ng, C.N. Spatial and temporal dynamics of urban sprawl along two urban–rural transects: A case study of Guangzhou, China. Landsc. Urban Plan. 2007, 79, 96–109. [Google Scholar] [CrossRef]
  29. Adam, M. Definition and Boundaries of the Peri-urban Interface: Patterns in the Patchwork. In Waste Composting for Urban and Peri-Urban Agriculture: Closing the Rural–Urban Nutrient Cycle in Sub-Saharan Africa; Drechsel, P., Kunze, D., Eds.; International Water Management Institute: Colombo, Sri Lanka; Food and Agriculture Organization of the United Nations: Rome, Italy; CABI Publishing: Wallingford, UK; New York, NY, USA, 2001; pp. 193–208. [Google Scholar]
  30. Schlesinger, J.; Drescher, A.W. Agricultural land use and the urban-rural gradient: An analysis of landscape metrics in Moshi, Tanzania. Afr. Geogr. Rev. 2018, 37, 14–29. [Google Scholar] [CrossRef]
  31. Ghana Statistical Service. 2010 Population & Housing Census: National Analytical Report; Ghana Statistical Service: Accra, Ghana, 2013. [Google Scholar]
  32. Nchanji, E.B.; Bellwood-Howard, I.; Schareika, N. Institutional Conflict and Resource Access in Ghanaian Urban and Peri-Urban Agriculture; Tropentag Conference: Berlin, Germany, 2015. [Google Scholar]
  33. Weiss, D.J.; Nelson, A.; Gibson, H.S.; Temperley, W.; Peedell, S.; Lieber, A.; Hancher, M.; Poyart, E.; Belchior, S.; Fullman, N.; et al. A global map of travel time to cities to assess inequalities in accessibility in 2015. Nature 2018, 553, 333. [Google Scholar] [CrossRef] [PubMed]
  34. Drechsel, P.; Keraita, B. Irrigated Urban Vegetable Production in Ghana: Characteristics, Benefits and Risk Mitigation; International Water Management Institute (IWMI): Colombo, Sri Lanka, 2014. [Google Scholar]
  35. Hologa, R. Grade von Urbanität und Ihre Siedlungstypen in Tamale, Ghana. Master’s Thesis, University of Freiburg, Freiburg, Germany, 2014. [Google Scholar]
  36. Urassa, M.; Boerma, J.T.; Isingo, R.; Ngalula, J.; Ng’weshemi, J.; Mwaluko, G.; Zaba, B. The impact of HIV/AIDS on mortality and household mobility in rural Tanzania. AIDS 2001, 15, 2017–2023. [Google Scholar] [CrossRef] [PubMed] [Green Version]
  37. Google Earth: Tamale, Ghana. 9°24′16.8″N 0°50′33.8″W, Viewed August 2015. 2008. Available online: http://www.google.com/earth/index.html (accessed on 15 November 2018).
  38. Google Earth: Tamale, Ghana. 9°24′16.8″N 0°50′33.8″W, Viewed August 2015. 2014. Available online: http://www.google.com/earth/index.html (accessed on 15 November 2018).
  39. Iaquinta, D.L.; Drescher, A.W. Defining Periurban: Understanding Rural-Urban Linkages and Their Connection to Institutional Contexts. In Proceedings of the Tenth World Congress of the International Rural Sociology Association, Rio de Janeiro, Brazil, 1 August 2000; pp. 8–27. [Google Scholar]
  40. Oppong, R.A.; Yeboah, E. Empirical Examinations of Conflicts and Contradictions in Architecture, Land and Suburban Sprawl: The Case of Tamale, Ghana. J. Sci. Technol. 2013, 33, 99–104. [Google Scholar] [CrossRef]
  41. Barnes, K.B.; Morgan, J.M., III; Roberge, M.C.; Lowe, S. Sprawl Development: Its Patterns, Consequences, and Measurement; Towson University: Towson, MD, USA, 2002. [Google Scholar]
  42. Adell, G. Theories and Models of the Peri-Urban Interface: A Changing Conceptual Landscape; Draft for discussion: London, UK, 1999. [Google Scholar]
  43. Bellwood-Howard, I.; Shakya, M.; Korbeogo, G.; Schlesinger, J. The role of backyard farms in two West African urban landscapes. Landsc. Urban Plan. 2018, 170, 34–47. [Google Scholar] [CrossRef]
  44. Karg, H.; Bellwood-Howard, I.; Akoto-Danso, E.K.; Schlesinger, J.; Chagomoka, T.; Drescher, A. Small-Town Agricultural Markets in Northern Ghana and Their Connection to Rural and Urban Transformation. Eur. J. Dev. Res. 2019, 31, 95–117. [Google Scholar] [CrossRef]
  45. Nashiru, S.; Yiran, G.A. Urbanisation and Smallholder Livelihood Security in Africa: A Case Study of Coping Strategies of Peri-urban Dwellers in Tamale, Ghana. In Rural-Urban Linkages and Sustainable Development in Africa; Kudo, S., Mfune, O., Hansen, M., Nyerere, J., Eds.; Spears Media Press: Denver, FL, USA, 2018; pp. 76–92. [Google Scholar]
  46. Gyasi, E.A.; Kranjac-Berisavljevic, G.; Fosu, M.; Mensah, A.M.; Yiran, G.; Fuseini, I. Managing Threats and Opportunities of Urbanisation for Urban and Peri-urban Agriculture in Tamale, Ghana BT. In The Security of Water, Food, Energy and Liveability of Cities: Challenges and Opportunities for Peri-Urban Futures; Maheshwari, B., Purohit, R., Malano, H., Singh, V.P., Amerasinghe, P., Eds.; Springer: Dordrecht, The Netherlands, 2014; pp. 87–97. [Google Scholar]
  47. Simon, D. Urban environments: Issues on the peri-urban fringe. Annu. Rev. Environ. Resour. 2008, 33, 167–185. [Google Scholar] [CrossRef]
  48. Naab, F.Z.; Dinye, R.D.; Kasanga, R.K. Urbanisation and its impact on agricultural lands in growing cities in developing countries: A case study of Tamale in Ghana. Mod. Soc. Sci. J. 2013, 2, 256–287. [Google Scholar]
Figure 1. Location map of Tamale in the Northern Region of Ghana.
Land 08 00040 g001
Figure 2. Methodological framework.
Land 08 00040 g002
Figure 3. Multi-scale sampling scheme comprising households, sample grid cells and the entire study area.
Land 08 00040 g003
Figure 4. Digitised buildings based on Google Earth imagery (source: Google Earth, 2014). Note: Buildings under construction were not included in the land use change analysis.
Land 08 00040 g004
Figure 5. Household-level urbanicity and the contribution of the different parameters (sorted according to urbanicity values).
Land 08 00040 g005
Figure 6. Map depicting urbanicity, diversity and dynamics values per sample grid cell and the assignment of land classification categories. Note: For the maps illustrating urbanicity, diversity and dynamics, values were divided into equal intervals and classified accordingly.
Land 08 00040 g006
Figure 7. Absolute changes in built-up area between 2008 and 2014 exemplified by four sample grid cells representing the four categories (sorted according to urbanicity values).
Land 08 00040 g007
Figure 8. Urban, periurban and rural classification scenarios in relation to urbanicity, diversity and dynamics levels per sample grid cell (sorted according to urbanicity values).
Land 08 00040 g008
Figure 9. Periurban village located along the major Tamale–Savelugu road in the outer periurban zone 19 km away from Tamale’s city centre (source: Author, 2014).
Land 08 00040 g009
Figure 10. Diffuse sprawl in the north-eastern inner periurban zone, 6.5 km away from Tamale’s city centre (source: Author, 2014).
Land 08 00040 g010
Figure 11. Infrastructure index (d) and the respective contributions of the three rubrics (ac). (e) shows the index and sub index values for all 8321 grid cells (sorted according to infrastructure index values).
Land 08 00040 g011
Figure 12. Correlation between urbanicity and infrastructure index values (r = 0.8, significant at 0.01 level).
Land 08 00040 g012
Figure 13. Resultant map: up-scaled categories and levels of robustness.
Land 08 00040 g013
Figure 14. Simplified boundaries showing urban, periurban and rural boundaries.
Land 08 00040 g014

