Tick Bite Risk as a Socio-Spatial Representation—An Exploratory Study in Massif Central, France


INRA, Joint Research Unit (JRU) Territoires, 63122 Saint-Genès-Champanelle, France
*
Author to whom correspondence should be addressed.
Land 2019, 8(3), 46; https://0-doi-org.brum.beds.ac.uk/10.3390/land8030046
Submission received: 13 February 2019
/
Revised: 7 March 2019
/
Accepted: 11 March 2019
/
Published: 13 March 2019
(This article belongs to the Special Issue European Landscapes and Quality of Life)
Abstract
:Ticks are responsible for the largest number of transmissions of vector-borne diseases in the northern hemisphere, which makes the risk from tick bites a serious public health problem. Biological scientific research and prevention studies are important, but they have not focused on the population’s perception of tick bite risk, especially at a spatial level. This exploratory article sets out to study this point through an innovative methodology involving the collection of 133 mental maps associated with a semi-structured interview and a socio-demographic questionnaire collected in the Massif Central region, France. The results show a strong link between the representation of the tick bite risk and the representation of particular landscapes. Forests appear as dangerous for the population, especially in the traditional activities of family walking or hiking. This calls into question overly anxiogenic prevention approaches that neglect the impact on practices in risk-prone spaces. It accentuates the need for localized education measure to improve knowledge about tick biology and avoid stereotypical and unnecessary negative representations associated with the environment.
1. Introduction
The majority of vector-borne diseases in temperate regions of the northern hemisphere are due to acarines, mainly ticks. According to the World Health Organization [1], Lyme borreliosis is currently the most common vector-borne disease throughout its range, which appears to be closely related to that of its vector, the Ixodes ticks, found from Japan to North America and from Scandinavia to North Africa [2]. Tick-borne diseases are therefore a major problem in industrialized countries and an emergent problem in less developed countries [3]. They are the subject of abundant multidisciplinary scientific literature in cell biology, epidemiology, and the medical sciences, however, in the humanities and social sciences, publications remain more limited [4]. In a review of the literature, Mowbray et al. [5] showed that the majority of articles focus on the study of prevention behaviors. It appears that the knowledge of the risk related to ticks remains low in the population [6], therefore, most orientation is directed toward the socio-cognitive dimension associated with prevention behaviors, such as personal efficiency [6,7,8,9]. However, the risk factors related to the local environment are well established [10,11], especially among professional populations [12]. The presence or absence of agricultural and industrial areas that lead to significant changes in the abiotic and biotic environment, as well as the existing socio-economic conditions (unemployment and inequalities), may have increased the abundance of infected ticks and human contact with them. For example, abandoned agricultural fields have become adapted to transmission through rodent hosts, pesticide use and industrial air pollutant emissions have dropped, and wildlife hosts for ticks have increased, resulting in changes in tick populations. In addition, significant differences were found between regions in terms of preventive behaviors and exposure factors. For example, people living in certain grassland areas are more likely to adopt preventive behaviors [13]. This shows that the effects of lifestyle on health are often mistakenly thought to operate the same way on all individuals [14], but it is more likely that they vary according to practices, even when there is no geographical determinism [15]. These results strongly suggest that social and contextual factors, such as the epidemiological status of a region, are important to consider when designing effective prevention campaigns [16]. It also stresses the importance for public health authorities to better understand and control these factors in targeted local populations to be able to implement prevention programs that are well adapted to a population and its epidemiological context. The spatial dimension of tick bite risk (TBR) is therefore a major factor [17]. Yet the capacity for a spatial understanding of risk in the population remains undervalued. While social and contextual elements are important, we sometimes forget how the risk is perceived [4]. There is no research on the population’s representation of TBR with respect to its socio-spatial dimension. However, in a study at the hyper-localized scale of a French forest, Meha [18,19] shows that the TBR, at least its representation, influences the practices and the behaviors of the people who frequent forest areas.
Within a multidisciplinary research project combining epidemiology and social sciences, we focused on the public’s socio-spatial representation [20] of TBR by linking it to the risk from an epidemiological point of view. Contemporary society is increasingly inclined to seek security, and as a result, risks appear more prominently in the media and in policy [21]. The study of a population’s acceptance of risks is undertaken through social and environmental psychology approaches, such as studying how individuals assess risk [22]. Risk is a social representation [23,24], which has a strong spatial and temporal consonance. It is an often studied element in environmental psychology and social geography. The TBR corresponds to this in the sense that the way individuals think of this risk depends on a social and spatial identity (education, social groups, spatial practices, etc.) as well as on a cognitive perception or a personal experience (bite) of this risk. The risk cannot be explained independently of the context; it appears as a value constructed by the subject using information that is more of a social or individual order than one that is purely technical [22]. The relation of the individual to the risks will depend on himself (his norms, his values, his aspirations, etc.) and on the way he understands and represents his environment (social environment, but also spatial and temporal) [25]. Thus, the representation is not the simple product of a mechanical processing of information. It is situated in a complex socio-cognitive process, actively constructed by the subject through the meanings conferred on the space, the goals of the subject, and the social rules used in this space [26]. It is individuals who give meaning to their environment [27], who read into this space experiences from their own personal history [28,29], as well as events found in their collective history [30]. A representation of the TBR with respect to its space includes the social norms assembled through education and socialization that integrate a social history of the risk of being bitten as conveyed by various media or, more personally, in a “common sense”, oral tradition that varies according to places and lifestyles. This adds the perspective of the individual’s own activities, especially the risk found in leisure activities related to nature.
The purpose of this article is threefold: To highlight the elements familiar to the public in their representation of the TBR, especially the spatialized aspect; to understand how this risk is socially constructed from a spatial point of view; and to identify any gap between the individuals’ understanding of the risk and access to the information that researchers want to disseminate.
2. Materials and Methods
2.1. Collection Area
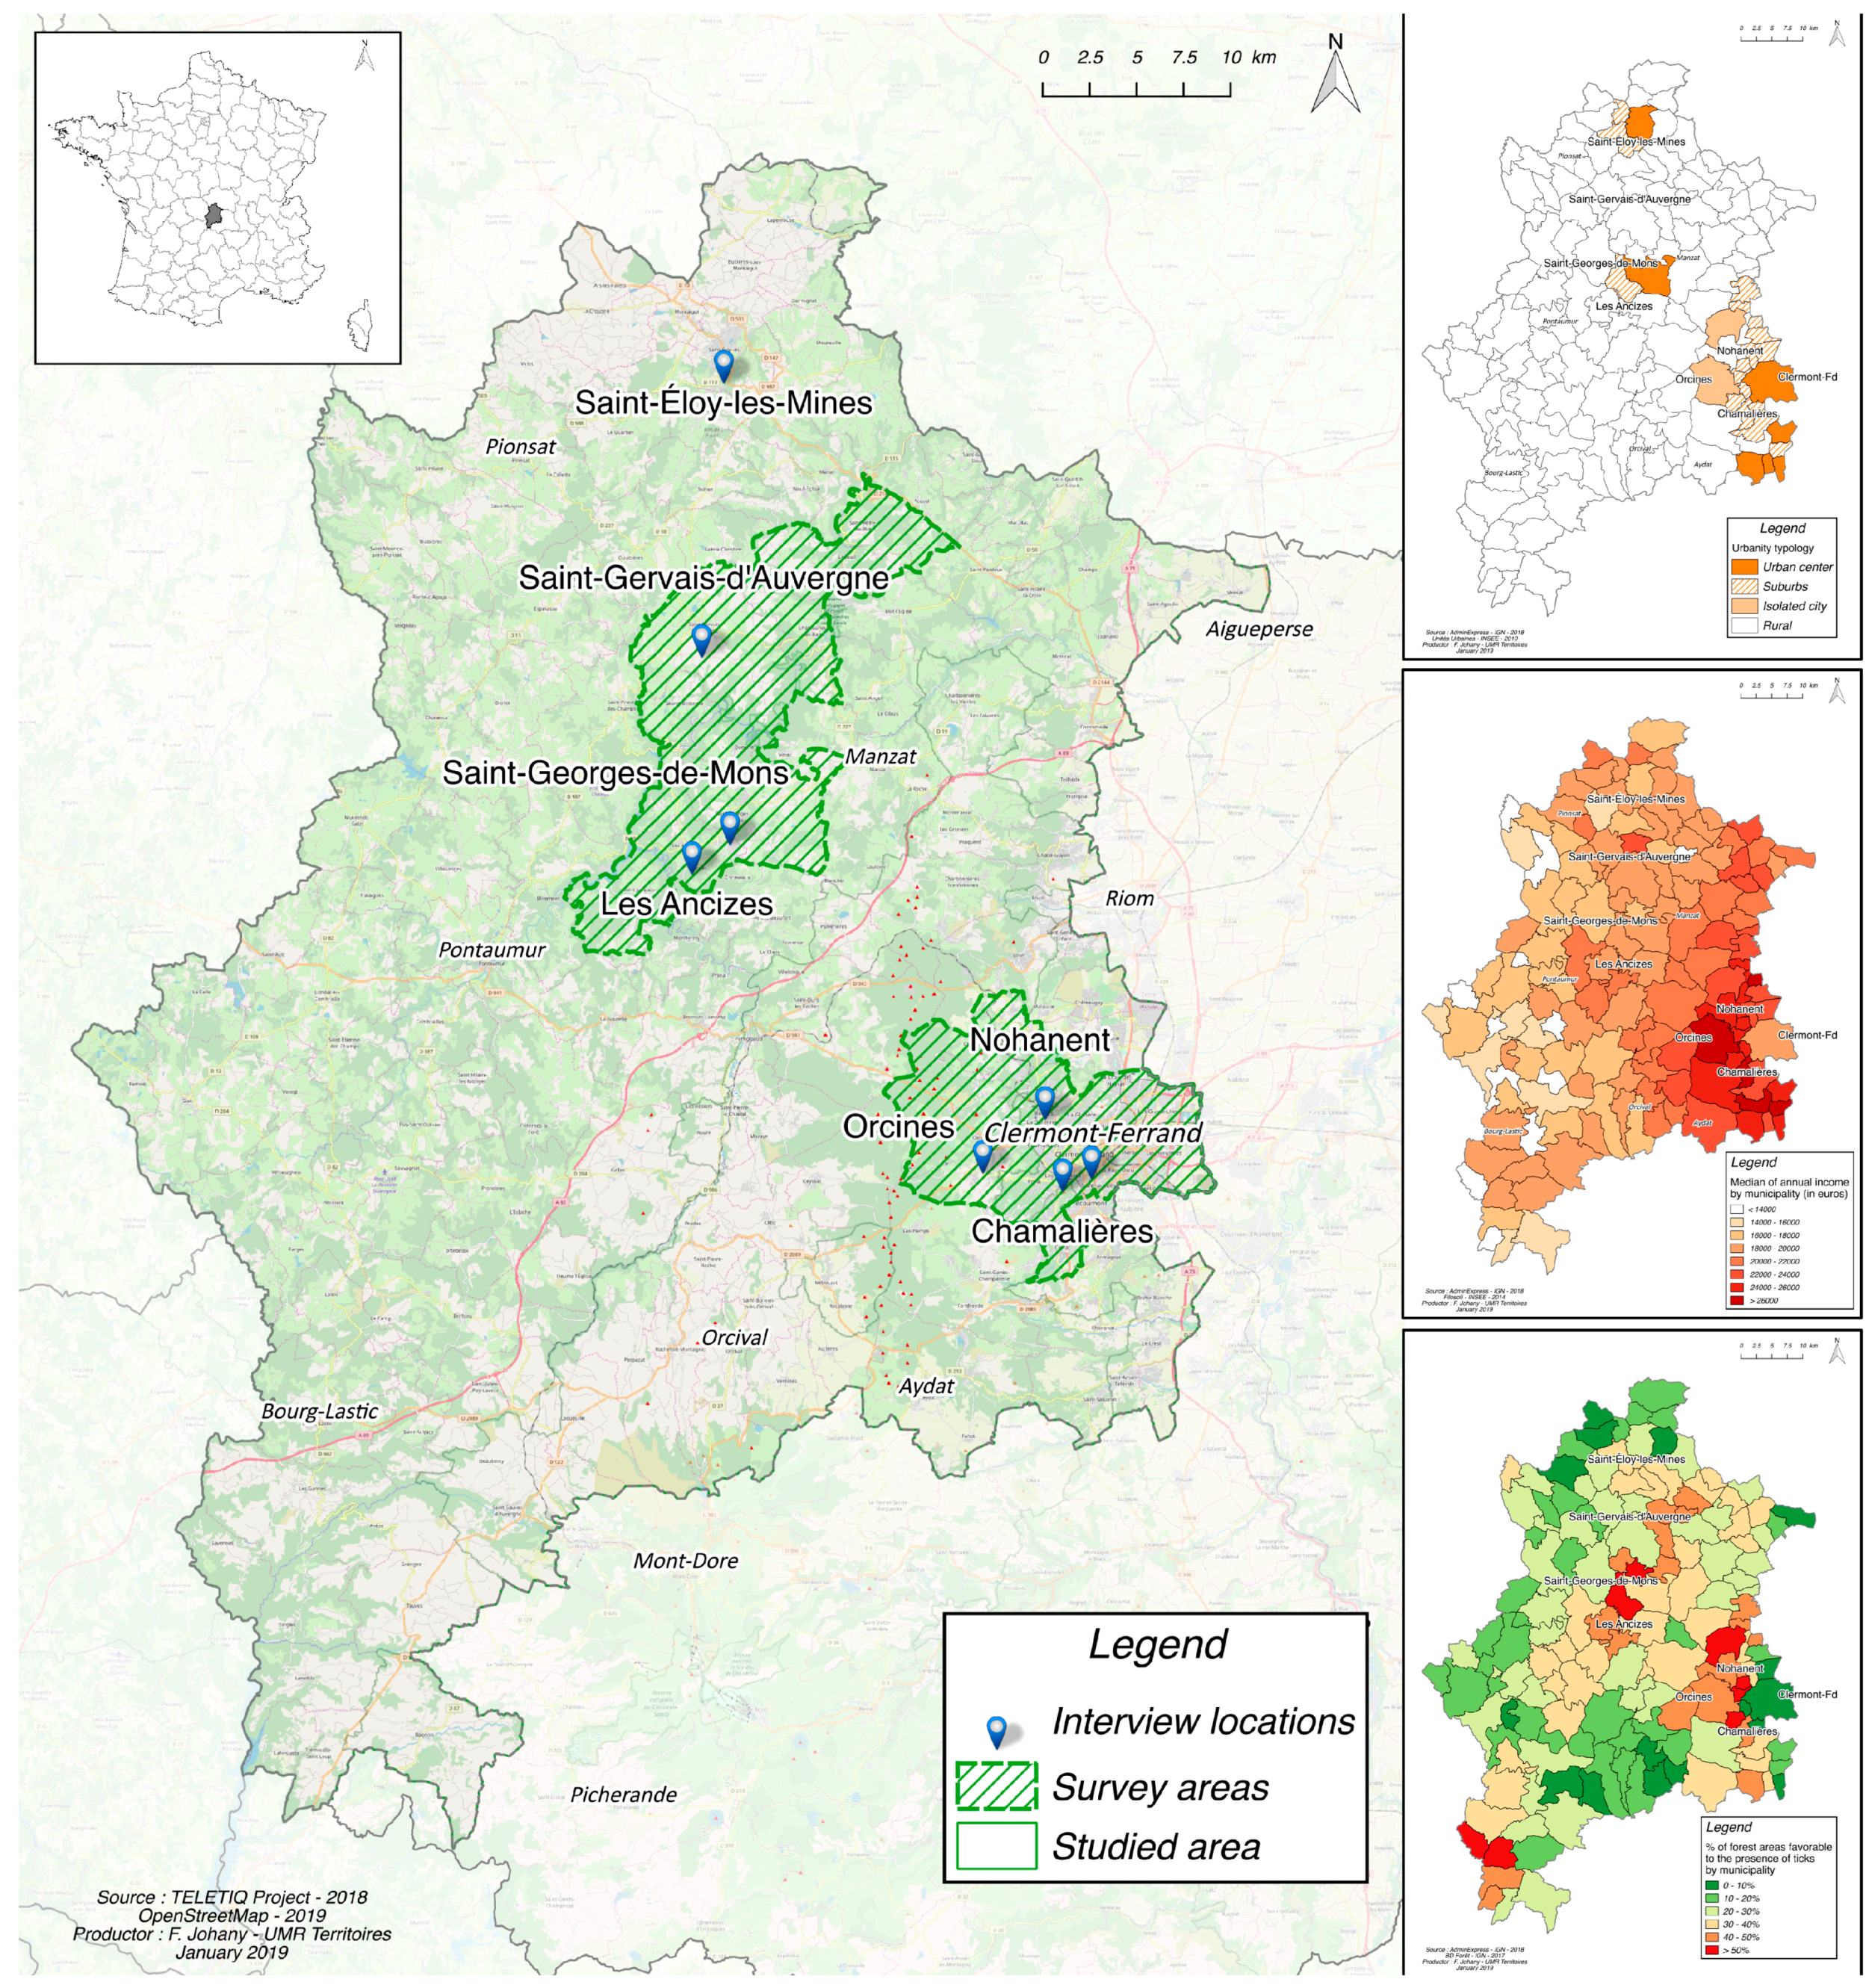
The biological-epidemiological literature shows that the Ixodes ricinus tick is the most widespread tick species in France. The risk of disease transmission by this tick correlates with human exposure to the environmental hazard, and thus exists when there is overlap between spatial distributions of humans, Ixodes ricinus ticks, and pathogens [31]. The hazard is generally estimated by the average density of infected ticks in a given area (called acarological risk). Tick density depends on a variety of factors, the three main ones being climate, vegetation cover, and host density. Ixodes ricinus generally prefers deciduous, or mixed deciduous and coniferous forests, which provide a suitable ground vegetation and climate, which is also required for the tick’s hosts. Wierzbicka et al. [32] have confirmed that the prevalence of Lyme borreliosis in Central Europe is positively correlated with the use of forests by humans, and De Keukeleire et al. [12,33] have shown that the accessibility to the forest and its distance from the home of an individual impacts the risk of exposure. The increasing proximity of densely populated urban areas to forests seems to be the main reason for the emergence of this risk, particularly since many of the habitats favorable to tick populations coincide with newly developed areas where residential properties have gradually encroached on forests [34]. The number of infected ticks can reach very high levels in fragmented areas, creating pockets of malady in the vicinity of humans, sometimes in very urban areas [35] and on private land [36]. Whether in the United States [37] or in Europe [38], we observe that the majority of indexed cases are related to outdoor activities in heavily forested areas located on the periphery of cities. This creates a paradox with the fact that periurban forest areas are increasingly perceived as natural spaces that provide a preventative health function [39]. However, restricting our image of spaces where people are active to those that are in close proximity to their place of residence can lead to the trap of an exclusively local approach that does not address the day to day spatial reality of many inhabitants [15,40]. The inhabitants’ standard of living is also a factor. Most of the time, individuals stay within an area that they can comfortably afford, described by Rémy [41] as a “territory of withdrawal,” whereas those with more financial means are able to move about more easily. This highlights the need to understand the distribution of the population in terms of income levels. Specific activities, where they take place, distances traveled, and the constraints imposed on certain individuals or groups are all parameters influenced by the population’s standard of living and their representations of their socio-physical environment [42,43]. These elements determine the variety of regional or local contexts in various terms (biological, climatic, sociological, economic, and political) that in turn determine the risk of exposure to ticks. In rural areas, this risk is endemic and thus well known, but it poses a new problem in the peri-urban spaces where large human populations are in close proximity to forests [19]. In order to evaluate this population’s perception, or their socio-spatial representations, of TBR, we consider it important to include three particular criteria in the approach: The environmental hazard characterized by the distance from hardwood forests; the urban, peri-urban, or rural character; and, finally, the economic capital, defined by the average income of households in the municipalities studied (Figure 1).
To collect data on these target populations and to remain consistent with a social approach, collections sites must be established in a geographical area that does not encompass excessive heterogeneity in socio-spatial practices. To ensure data consistency, it is better to collect data on a larger population living in a similar territory than on small numbers scattered over various remote locations. With this in mind, we selected data collection sites in an area surrounding the city of Clermont-Ferrand and a rural area in the Combrailles region of France’s central mountains (Massif Central). This area has been the focus of significant research in terms of highlighting both the ecological factors influencing the presence of Ixodes ricinus ticks [44], and the correlation between the infection of Ixodes ricinus by the bacteria which causes Lyme borreliosis and the occurrence of the disease in the population [45]. This allows us to investigate the complementarity of epidemiology and health modeling approaches that we can use in our analysis. These spatially integrated analyses can provide a better understanding of the interactions between changes in ecosystems and climate, land use and human behavior, and the ecology of vectors and infectious hosts [46]. The rural area identified is characterized by a hedgerow landscape, alternating between pasture, wood, and hedgerows. The region’s climate has oceanic aspects conducive to the development of tick populations. Agriculture in the Combrailles area is primarily dedicated to livestock farming, which results in a close proximity between domestic animals, wildlife, and the human population. Therefore, the local population risks contact with infected ticks through both professional and leisure activities.
Figure 1 shows the two zones studied. The northwestern zone, which is situated in the Combrailles region and the mountains of the Chaîne des Puys, is most exposed to TBR. The environmental hazard posed by hardwood forests is less present in the second zone, which includes Clemont-Ferrand and the adjacent plain. The two zones selected correspond to our objectives of data coherence and the spatiality of the participants’ lifestyles: To the north, a rural zone close to forests in the Combraille region, where the standard of living is below the national average; and to the south, an urban area around the city of Clermont-Ferrand, which is partially surrounded by forests, and has a population with a higher standard of living.
2.2. Collection Method
Data was collected during one-to-one interviews lasting about 20 min. Interviews started with a presentation of the research framework (in accordance with French regulations at the time of data collection, each participant signed a consent form authorizing the collection and secure storage of their data), proceeded with the interview, and finished with the signing of an agreement on the use and confidentiality of the data.
The methodology is based on the use of mental maps coupled with a recording of the accompanying verbalization [47]. This method aims to identify the socio-spatial representations of the individuals interviewed as expressed in their mental maps. Concretely, it is a question of asking an individual to draw a spatial representation of how he understands the TBR. In the interview, each participant was provided with a white A4 sheet of paper and a single-color pen, and then asked to “draw a place, an area, an environment in which you could be bitten by a tick”. While drawing, the participant commented verbally on the selected elements and his justifications for them. The participant also decided when to stop drawing. The verbalization adds complementary information to the mental map, providing elements of understanding and helping to identify aspects not represented, but present in the participant’s mind (temporal dynamics for example). The realization of the drawing was filmed to be able to restore a posteriori the construction of the mental map, and the speech was recorded with a dictaphone. At the end of the drawing process, the interviewee was asked if the drawing realized evoked a specific place or if it was completely invented.
Finally, an anonymous questionnaire containing the socio-demographic characteristics of the participant was proposed. It collected information on the gender, age, place of residence, profession, any experience or not with tick bites (personally or among relatives or animals), practices related to outdoor recreation (hiking, biking, walks, outdoor work, etc.), and asked if the participant felt they are well informed about where ticks are found. At the end of the questionnaire, the participant was thanked for their participation.
This method of collection was tested beforehand with 11 people (researchers and general public), allowing us to adjust the inductions and make sure the instructions and the questions were understood. These preliminary tests did not identify any specific problems.
The data were collected in France between February and July 2018 by two investigators on eight sites around the city of Clermont-Ferrand and the region of Combrailles as shown in Figure 1.
The interviews were conducted during the week or the weekend depending on the likelihood of finding willing participants. In rural areas, they were conducted in municipal halls during local markets to facilitate contact with the resident population. In urban areas, they were held in municipal libraries during their busiest days. In both areas, respondents were unaware that they would be interviewed about TBR. The researchers asked them to participate in a survey on “environmental risks”. This made it possible to avoid a specific preconception among the respondents, or a bias toward participants that were particularly concerned by the topic of TBR (such as hikers and patients with Lyme borreliosis). Recruitment of participants was undertaken directly in the local gathering place by approaching individuals face to face (with the authorization of the mayor and municipal services). At the low-density rural sites, a prior announcement was made in the local newspaper specifying a scientific study on “environmental risks”, along with the place and the date.
2.3. Data Analysis Methods
The collected data were classified and recorded under a key enabling the identification of each set of data, each place of collection, and each individual participating anonymously. The audio recordings were fully transcribed. Mental maps and their transcriptions were analyzed individually and manually by a specifically developed method. Out of 143 interviews, only 133 were selected for analysis. Six individuals did not want to draw, three drawings were completely illegible, and one drawing included elements that identify the participant and invalidate the anonymity required for the analysis. The responses of those individuals were not analyzed.
The analysis was performed using a triangulation method [48]. This approach is particularly adapted to the study of social representations [49] and is designed to highlight the combinations of elements that spatially structure the studied representation [47]. There are three parts to this type of analysis.
The drawing was initially analyzed by its characteristics. For each drawing, we considered a number of elements, which are conventionally used in mental maps [50]. We used the classification system of Maurel [51] to assign a type to each drawing: Cartographic (map-like), photographic (like a photo), schematic (no geographical features), plan (a way-finding drawing), and mixed (multiple categories). We also noted the scale of the drawing: National (France), regional (a French administrative region or department), intermediate (an area with or without administrative boundaries, but corresponding to social, technical, or physical elements, such as a set of villages or towns), local (a city or a village), micro-local (a small area), without scale, and multi-scale. We then noted the inclusion of any humans, animals, ticks, or dynamics elements, like climate. We also identified the presence and type of text: Nominative (to complement drawing elements), illustrative (to replace a non-drawn element), or legend (used as in a traditional map). The analysis of the drawings continued with a “pre-iconographic” technique proposed by Le Moel, Moliner, and Ramadier [52]. The first step was to identify the different spatial “shapes” represented on the drawings. A shape is the analog representation of an object (a forest, fields, a path, etc.). After a detailed examination of each drawing, a list of the elements drawn was identified. In the second step, these elements were grouped into object categories. Using this information, each drawing was then characterized by the object categories that it contained. For a given category, a drawing is identified as containing, or not, one or more shapes belonging to that category. A multiple correspondence analysis (MCA) was then carried out under the software R 3.5.1 version, FactoMineR package on the different categories to study their coexistence, followed by a hierarchical classification that allows the grouping of profiles from similar drawings [53]. This makes it possible to study relationships between variables and associations between categories. Two categories were considered closely associated if they were often seen together. We were then able to characterize groups of individuals by these analyses.
In the second part, the transcriptions of the audio recordings were examined through a textual analysis, the objective of which was to analyze the socio-spatial representations and verbal practices in the subject’s verbalization during the drawing. In previous analyses, we have shown the importance of spatial verbalization [47]. We used the Reinert method [54], processed with IRaMuTeQ software IramuteQ 0.7 alpha 2 [55,56]. This method focuses on studying the representations contained in the corpus by using the redundancy of word associations, where the words are studied with those surrounding them. The corpus was cut into fragments of a similar size. A factorial correspondence analysis (FCA) was performed on these fragments, followed by the application of a hierarchical ascending classification (HAC). The software statistically ranks words according to their similarity or dissimilarity. The classification begins by dividing the complete corpus into two groups according to vocabulary. The operation is repeated by dividing the largest opposing classes, maximizing khi2, and then repeating again if necessary. This ensures a distribution of opposing classes distinguished from each other by the contrast of their vocabulary. The software provided the list of words most significantly present (depending on khi2) in the “lexical world” of a class. The results were then projected onto the FCA (performed on the contingency table), which highlights the categories of verbalization and the associated representations.
Finally, the variables from the socio-demographic complementary questionnaires (respondent profile, knowledge of tick risks and outdoor practices) as well as the combinations of categories of identified objects (in pre-iconographic analysis) were crossed with the textual analysis to identify distinct groups in the representation characterized by different socio-spatial postures. The IramuteQ software provides each verbalization class with a list of significant associated variables (again depending on the khi2). These illustrative variables were included in the FCA to illustrate the classes of verbalization.
3. Results
3.1. Sample
Table 1 shows the distribution of the number of people surveyed according to the places of collection. There is some imbalance between urban and rural areas given the difficulty of finding participants willing to respond to the survey in the rural area. The table also shows that one site accounts for almost half of the rural area’s sample.
The sample was established with the aim of differentiating the population on three variables: Urban or rural residence, income level, and proximity to a forest area conducive to TBR. The analysis of the socio-demographic data of the sample is presented in Table 2. We interviewed 143 people.
The surveyed population is relatively balanced in terms of gender, age, and community. A large proportion of the of socio-professional categories is composed of retired individuals. This can be explained in part by the preponderance of retired individuals in the rural population (approximately half of the local rural population), and by the fact that this group was more accessible during the weekday collection sessions. Although the number of participants in the primarily rural, Combrailles region is smaller in the study area that includes the urban area of Clermont-Ferrand, the overall number of rural versus urban participants remains balanced because the more populated urban/peri-urban zone also includes participants from the rural, outer fringes of this selection area. Finally, the majority of the surveyed population has a relatively modest standard of living; approximately 65% of the households earned less than 2500 euros per month.
The analysis of outdoor practices in the surveyed population, shown in Table 3, is interesting relative to TBR. It shows that most of the population participate in activities that expose them to the risk of tick bites (96.5% of those interviewed claim to practice at least one outdoor activity). This is particularly the case for outdoor walking activities (walks, hikes, etc.) that are practiced at least once a month by nearly 72% of those surveyed. Gardening, which is an activity with potential exposure to ticks closer to home, is practiced by 84.62% of respondents, 64.1% of whom say they garden at least once a month. It should be noted that 73.9% of the population do not practice outdoor activities at a distance greater than 30 km from the family home more than once a month, and the majority of the population (53.5%) do not practice such activities (at distances greater than 30 km away) more than three times a year. The declared outdoor practices therefore remain principally local activities for the population and thus correspond to the defined natural environment of the collection area.
The analysis of the TBR questionnaire in Table 4 shows that the population studied has considerable experience with tick bites. More than 90% of the interviewed participants have had experience with bites in their immediate social environment (themselves, family, friends, or pets) and nearly 50% of them have been bitten at least once. As a result, most of the interviewees (nearly 85%) feel they have good or average knowledge of areas conducive to tick bites. Only 14.5% feel they have no knowledge. However, knowledge about means of prevention is lower. Only about 60% of respondents believe they have good or average knowledge about these means. The experience of being bitten therefore seems to be more affected by the representation of the knowledge of the areas where one risks being bitten than the representation of methods of prevention.
3.2. Pre-Iconographic Analysis
3.2.1. Characteristics of Drawings
The step of characterizing the drawings was performed independently of their specific elements. It focuses on the types of representations chosen and how they are organized in the drawing activity.
• Type of Drawings
The photographic type, which translates more naturally as a landscape, was the most frequently assigned classification. As shown in Table A1, this type represents more than half of the drawings. The schematic type represents nearly one-third of the drawings. Although there is no geographical information depicted in this drawing type, there is still some sense of a photo taken by the individual to express his ideas. We can see that the induction request favors the individual’s notion of a landscape rather than a map or cartographic type drawing. Thus, unsurprisingly, only 12 drawings are classified as cartographic. It can also be said that mixed-type drawings are closely associated with the photographic type drawings.
• Scales
More than 70% of the drawings are at a micro-local or local scale. Table A2 shows that few drawings were made at larger scales, which points to a correlation with the time the bite occurred, the bite experience itself, or its representation. The drawings show no actual cartographical elements relating to the risk of tick bite. This relates back to the predominance of the photographic type, which seems to mark the subject’s photo-like impression of a particular instance in time associated with a tick bite. A number of drawings are multi-scale, but tend to orient several localized representations in a larger set. Others do not express a scale of representations.
• Imagined or Real Place
Table 5 shows that the majority of respondents make reference to an actual location with which they are familiar when they are asked to draw a place related to TBR. This is an important element because it shows that actual experiences in their environment strongly influence the representation.
Figure 2 maps the locations indicated in the participants’ drawings. We see that the vast majority of them are places identified with TBR. It also shows that the participants draw a place that is relatively near to their residence or the area where they live (according to the elements of residence collected in the questionnaire). This suggests that their representation is conditioned to some degree by local influences.
• Textual Elements
Only one-third of the drawings incorporate textual elements as shown in Table A3 and Table A4. None of them make reference to a legend, which reinforces their classification among non-cartographic drawings. When textual elements exist, they are generally used to facilitate an understanding of other elements in the drawing, or to situate the drawing in a context, for example, the word “countryside” to localize a path crossing fields.
3.2.2. Identification of Objects
We identified 663 objects in the 133 drawings analyzed, an average of almost 5 objects per drawing (average: 4.96, median: 4, min: 1, max: 14, standard deviation: 2.57). These objects are grouped into 125 different forms, and assigned to 11 different classes, which include 6 spatial and 4 non-spatial classes and 1 class for “other” elements). Seventy-nine of the object forms were only drawn once, representing approximately 60% of the total number of forms. The relatively low number of different forms reflects the significant recurrence of certain objects within the drawings. This can be interpreted as evidence of a shared representation among the participants. The following paragraphs present the characterization of each class and its results.
• Presence of Humans, Ticks, and Animals
The first three classes of objects are presented in Table 6. They mark the presence of humans, ticks, and animals in the drawings. They are separated to differentiate three dimensions. The presence of humans in the drawing shows the projection of the individual in his environment and the potential anthropization of the space. The presence of ticks highlights the perception of their presence in the environment. The presence of animals is an important factor in the analysis because it indicates an understanding of the risk involved in the interaction with potential hosts, such as wild animals and, particularly, the close proximity with pets (usually dogs).
We can see clearly that these three classes are not frequently found in the drawing. The most significant is the presence of animals in nearly a third of the drawings. These are mostly pets represented by 21 dogs and 8 cats. This points to the relationship between these domestic animals and the representation of the tick bite risk. The other animals in the drawings are mostly farm animals (horses, cows) and wild animals (deer). However, only one drawing refers to small wild animals (a hedgehog), and only four refer to birds. These smaller animals are the main hosts of ticks and greatly contribute to the spread of disease. Moreover, we see no link between the drawing of ticks and animals, or ticks and humans, but humans and domestic animals are frequently seen together (in 20 drawings). Ticks are represented independently, and the drawings contain no reference to the mechanisms of transmission between species.
• Elements of Climate or Weather
Weather and climate play an important role in tick biting. However, these elements do not appear frequently in the drawings. Only about 20% of participants (Table A5) include objects related to this factor in the drawings. The most frequently found is the sun (22 times), which is intended to express the notion of good weather or warmth.
• Landscape Elements
The analysis of the drawings reveals five categories of elements related to the space and more specifically to the landscape represented by the participants (Table 7). Two categories concern elements of plant cover. We split these into two categories to differentiate trees from other plants. Forest cover is important in the proliferation of ticks, which is linked to the presence of host animals and consistent levels of moisture in the soil, and in the sampling of our population, who live near forests. Thus, nearly three-quarters of the drawings show trees, and often in the form of forested areas. This shows that participants made a strong link between this type of plant cover and TBR. More specifically, in a number of drawings, it was possible to differentiate between hardwood (37 times) and coniferous (23 times) trees. This important aspect may indicate a lack of understanding among certain participants, since coniferous forests are less suitable for ticks and harbor less risk than hardwood or mixed forests. Other types of vegetation cover are present in more than four-fifths of the drawings. This is the main element for the majority in the sample. The participants associate the risk of tick bites with the presence of plants. Thus, the representation of tall grass, the most frequent element of the class, appears in about 92 drawings. This is a classic element associated with ticks, which do indeed climb on plants of an average size to wait for a host. It is therefore an element well integrated by participants, along with the presence of trees. Note that among plants (without trees), the variety of objects is greater than in the previous category. Along with tall grass, there are also bushes (26 times), flowers (15 times), and even mushrooms (12 times).
Another category, pathways, is found in about half of the drawings. These are mostly a representation of paths or trails (63 times) that cross the plant landscape mentioned above. They often evoke examples of walking or hiking that show the association between this type of activity and the risk of tick bite (linked, for example, with a depiction of mushrooms). It is interesting to note that the three remaining landscape categories are not often present. The relationship between pathways and plants in landscapes is therefore an important structuring element in the representations. Nevertheless, there is a presence of relief elements (mountains are observed in more than 20% of the participants’ drawings. This may seem surprising since ticks are found less often at altitudes above 1500 m (although warming trends raise this limit)). However, two explanations can be proposed: The link with the image of walking or hiking trails and the sampling that covers a population that lives in or near a mountainous area. Some respondents also note the presence of elements of an aquatic environment (lake, pond, river). Even though ticks do not live in the water, it is possible that this association is again a link with wild, undeveloped areas accessible on foot. This would then correspond to the relative absence of the final category that refers to developed space. Houses, gardens, villages, and towns are poorly represented. This suggests that the image of an environment harboring more risk of tick bite is more often associated with a natural space than an urbanized one.
• Other Elements
Finally, the drawings also contain a number of other elements that cannot be placed in a previous category and are too few to be classified in a new category (Table A6). Given their heterogeneity, they are grouped into another class. For example, there is a drawing of an umbrella, garbage bins, a shovel, and a barbecue. They are explained more specifically by the individual drawing in which they were produced. However, nearly 80% of the drawings do not have elements of this category, which supports the completeness of the proposed categorization.
3.2.3. Multiple Correspondence Analysis and Hierarchical Clustering
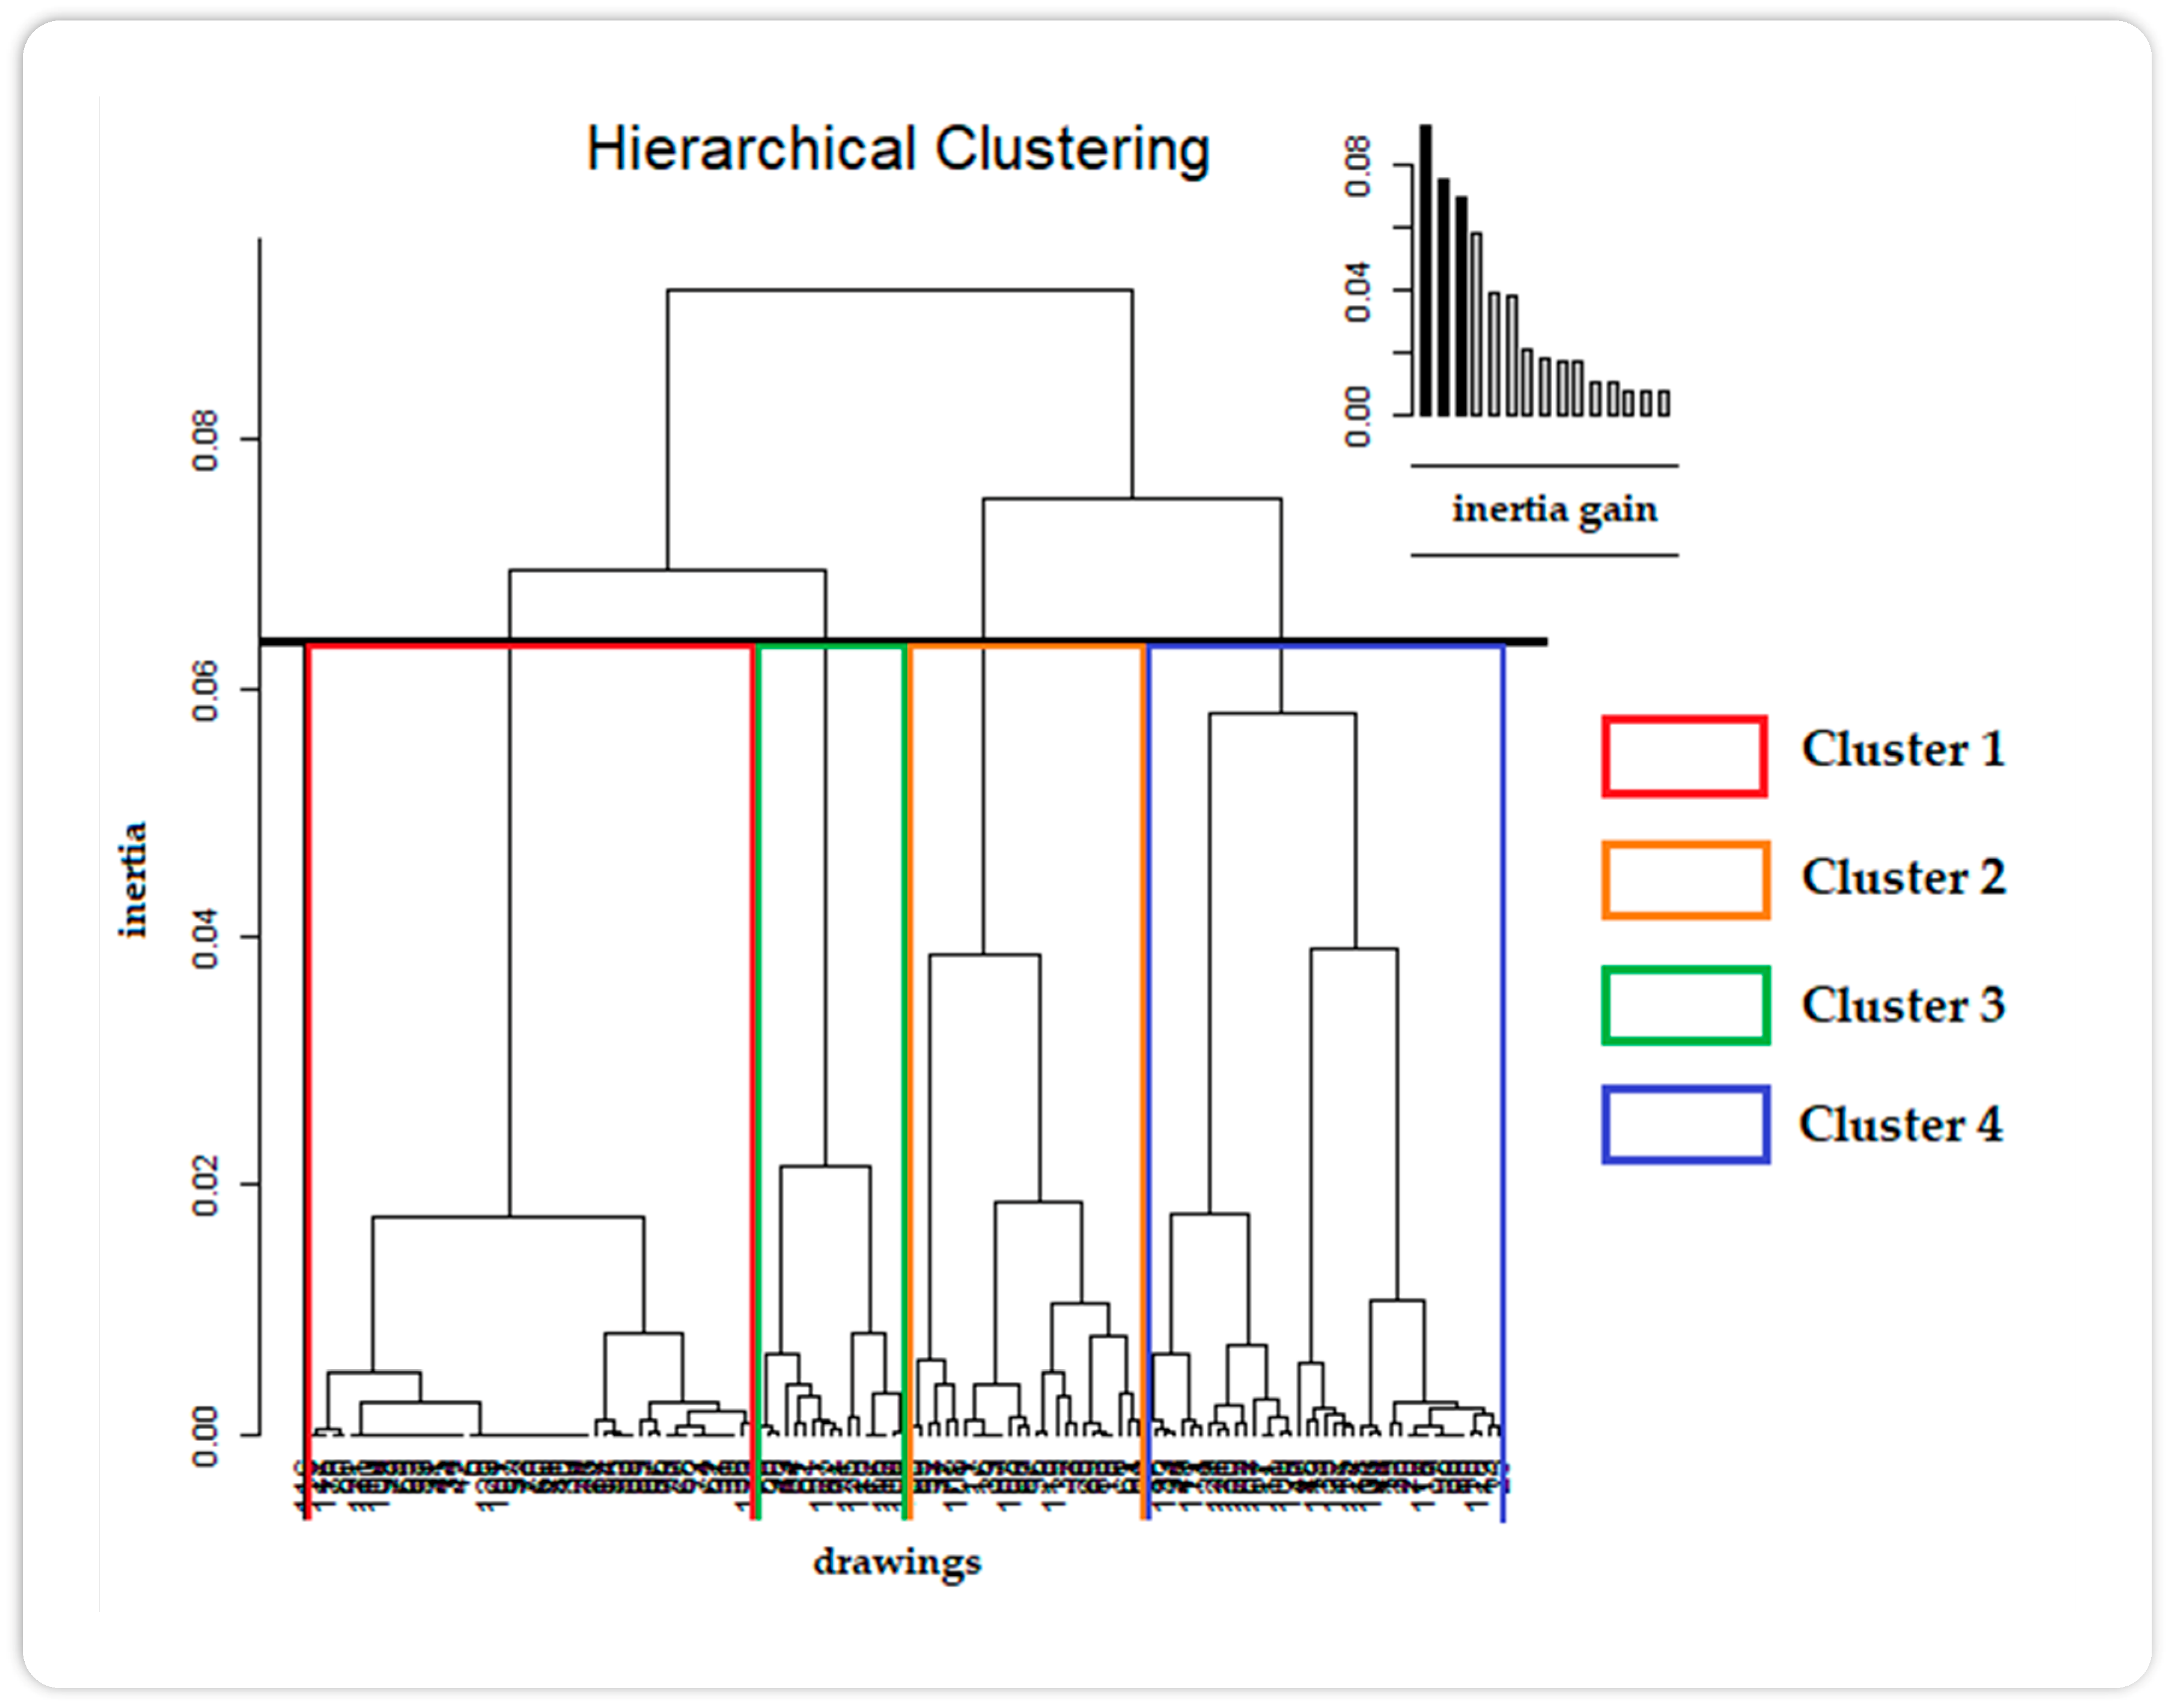
The hierarchical clustering derived from the multiple correspondence analysis on the pre-iconographic analysis data shows a relevant four-class distribution that maximizes inter-class inertia. This classification is visible in the dendrogram in Figure 3. It does not take into account type or scale criteria, which exert too much influence on the results, but focuses on the categories of objects represented in the participants’ drawings. The statistical analysis shows that the element categories which best explain this classification are the presence or absence of buildings, humans, plants, climate elements, or geographical reliefs.
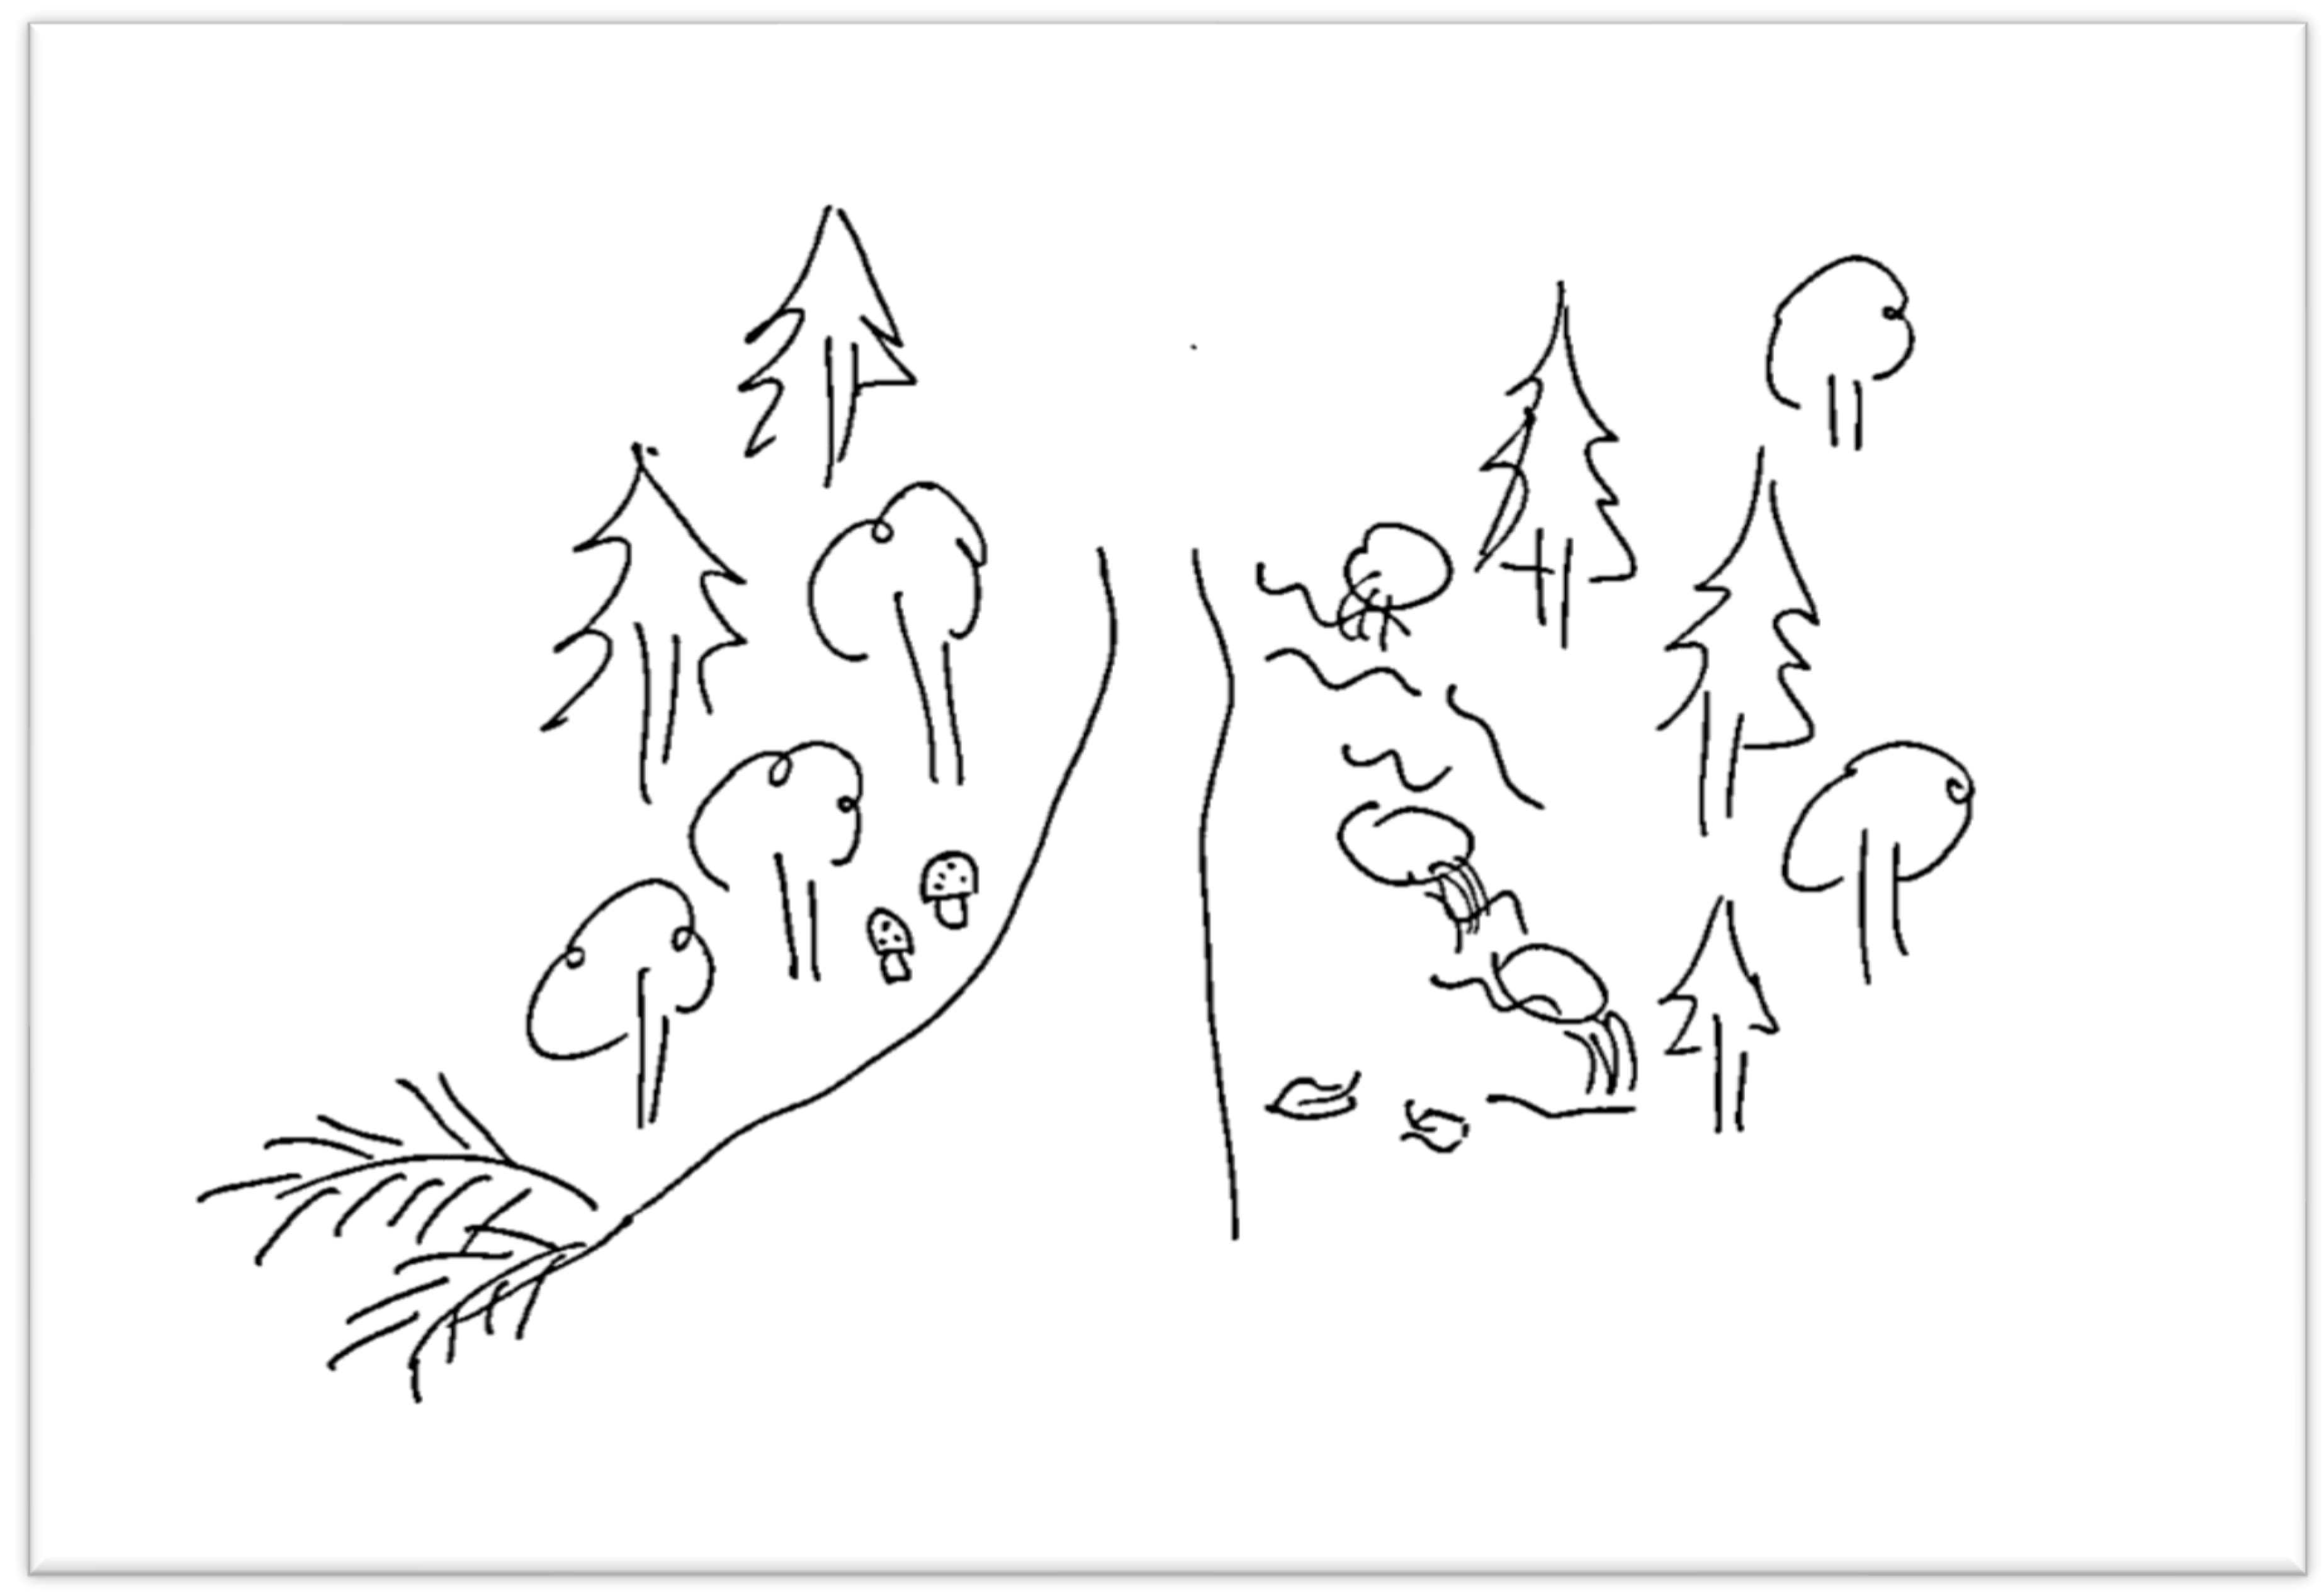
The first class (cluster 1 of the dendrogram) groups together 50 drawings. This is the main class. It is formed by drawings that are characterized by the absence of elements indicating anthropization (humans or buildings), and the absence of ticks, geographical reliefs, or elements of climate. It is particularly characterized by the presence of plant cover (especially ground vegetation as opposed to tree canopy) and, to a lesser extent, animals and/or pathways. Often, this class simply reflects a representation centered around a pathway crossing a plant cover. The drawing of Figure 4 is characteristic of this class.
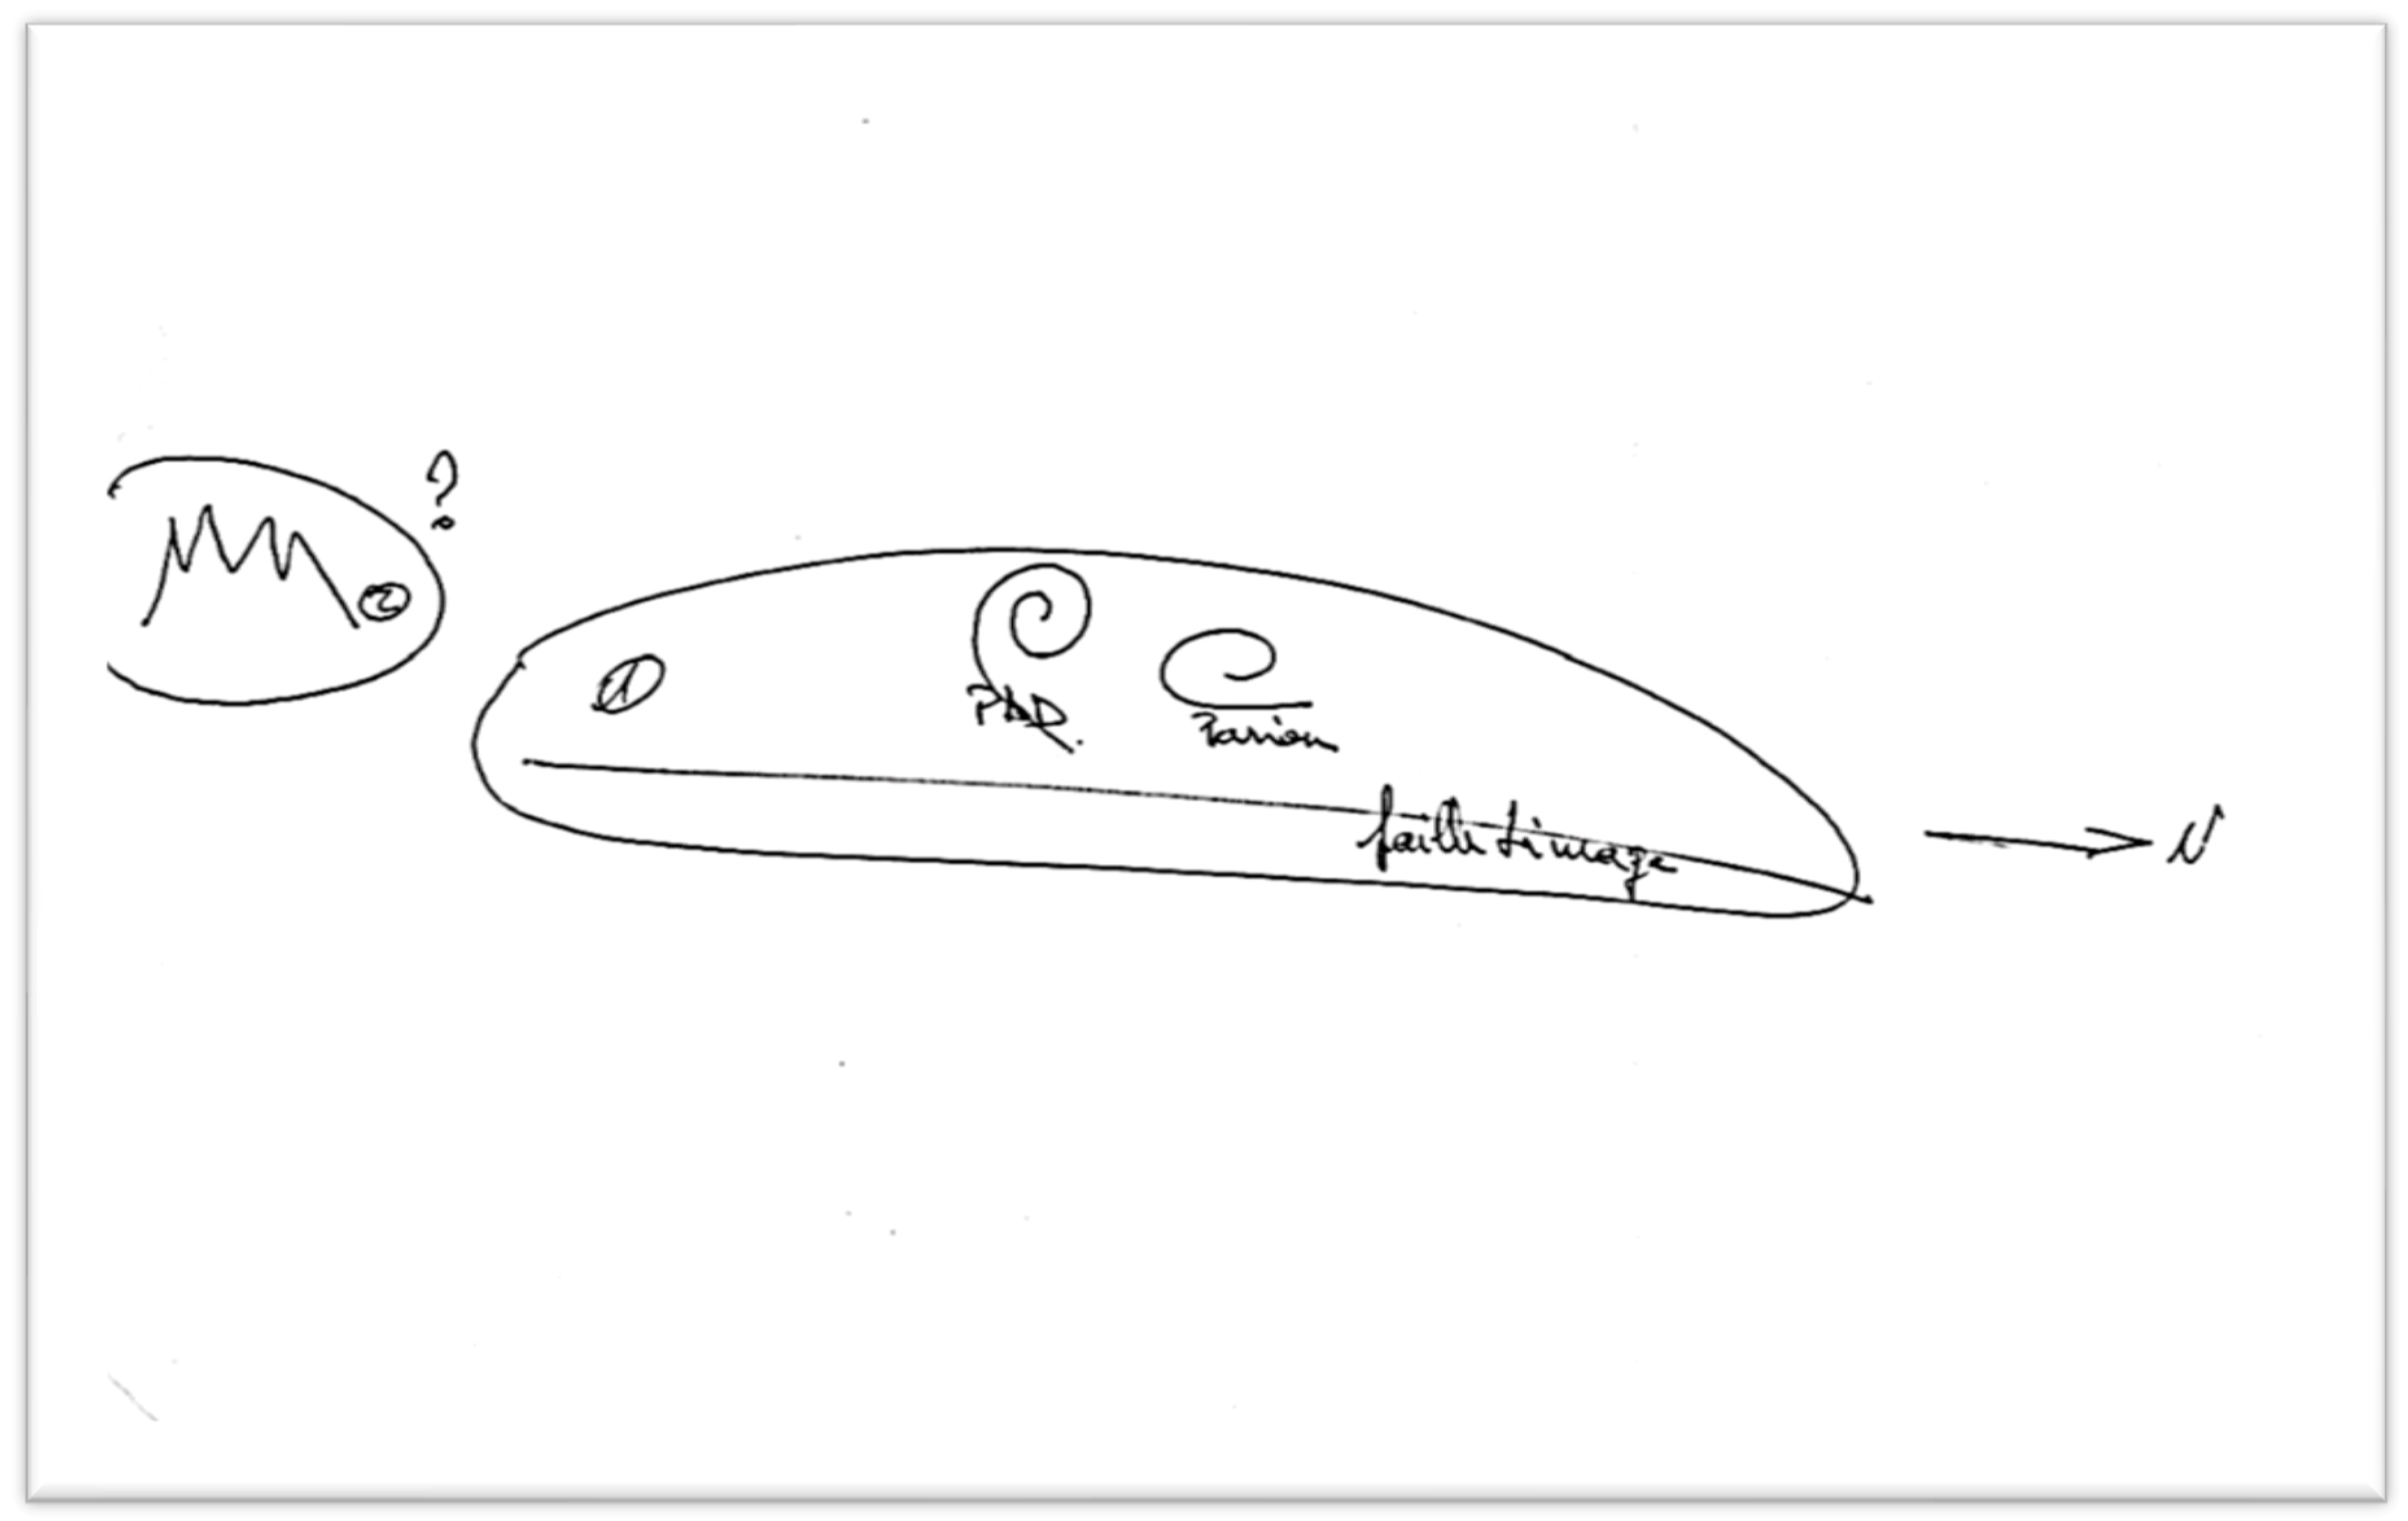
The second class (cluster 2 of the dendrogram) groups together 26 drawings. In direct contrast to the first class, these drawings do not feature elements of vegetal cover or pathways. This class also includes the category, “others”, and drawings characterized by the presence of reliefs. The objects in these drawings represent little or no spatialization, sometimes describing specific landscape elements (a mountain range) or a specific situation, such as a campsite. The images in this class leave the impression of being drawn by individuals who had difficulty drawing or difficulty understanding the instructions. Figure 5 shows a typical drawing from this class.
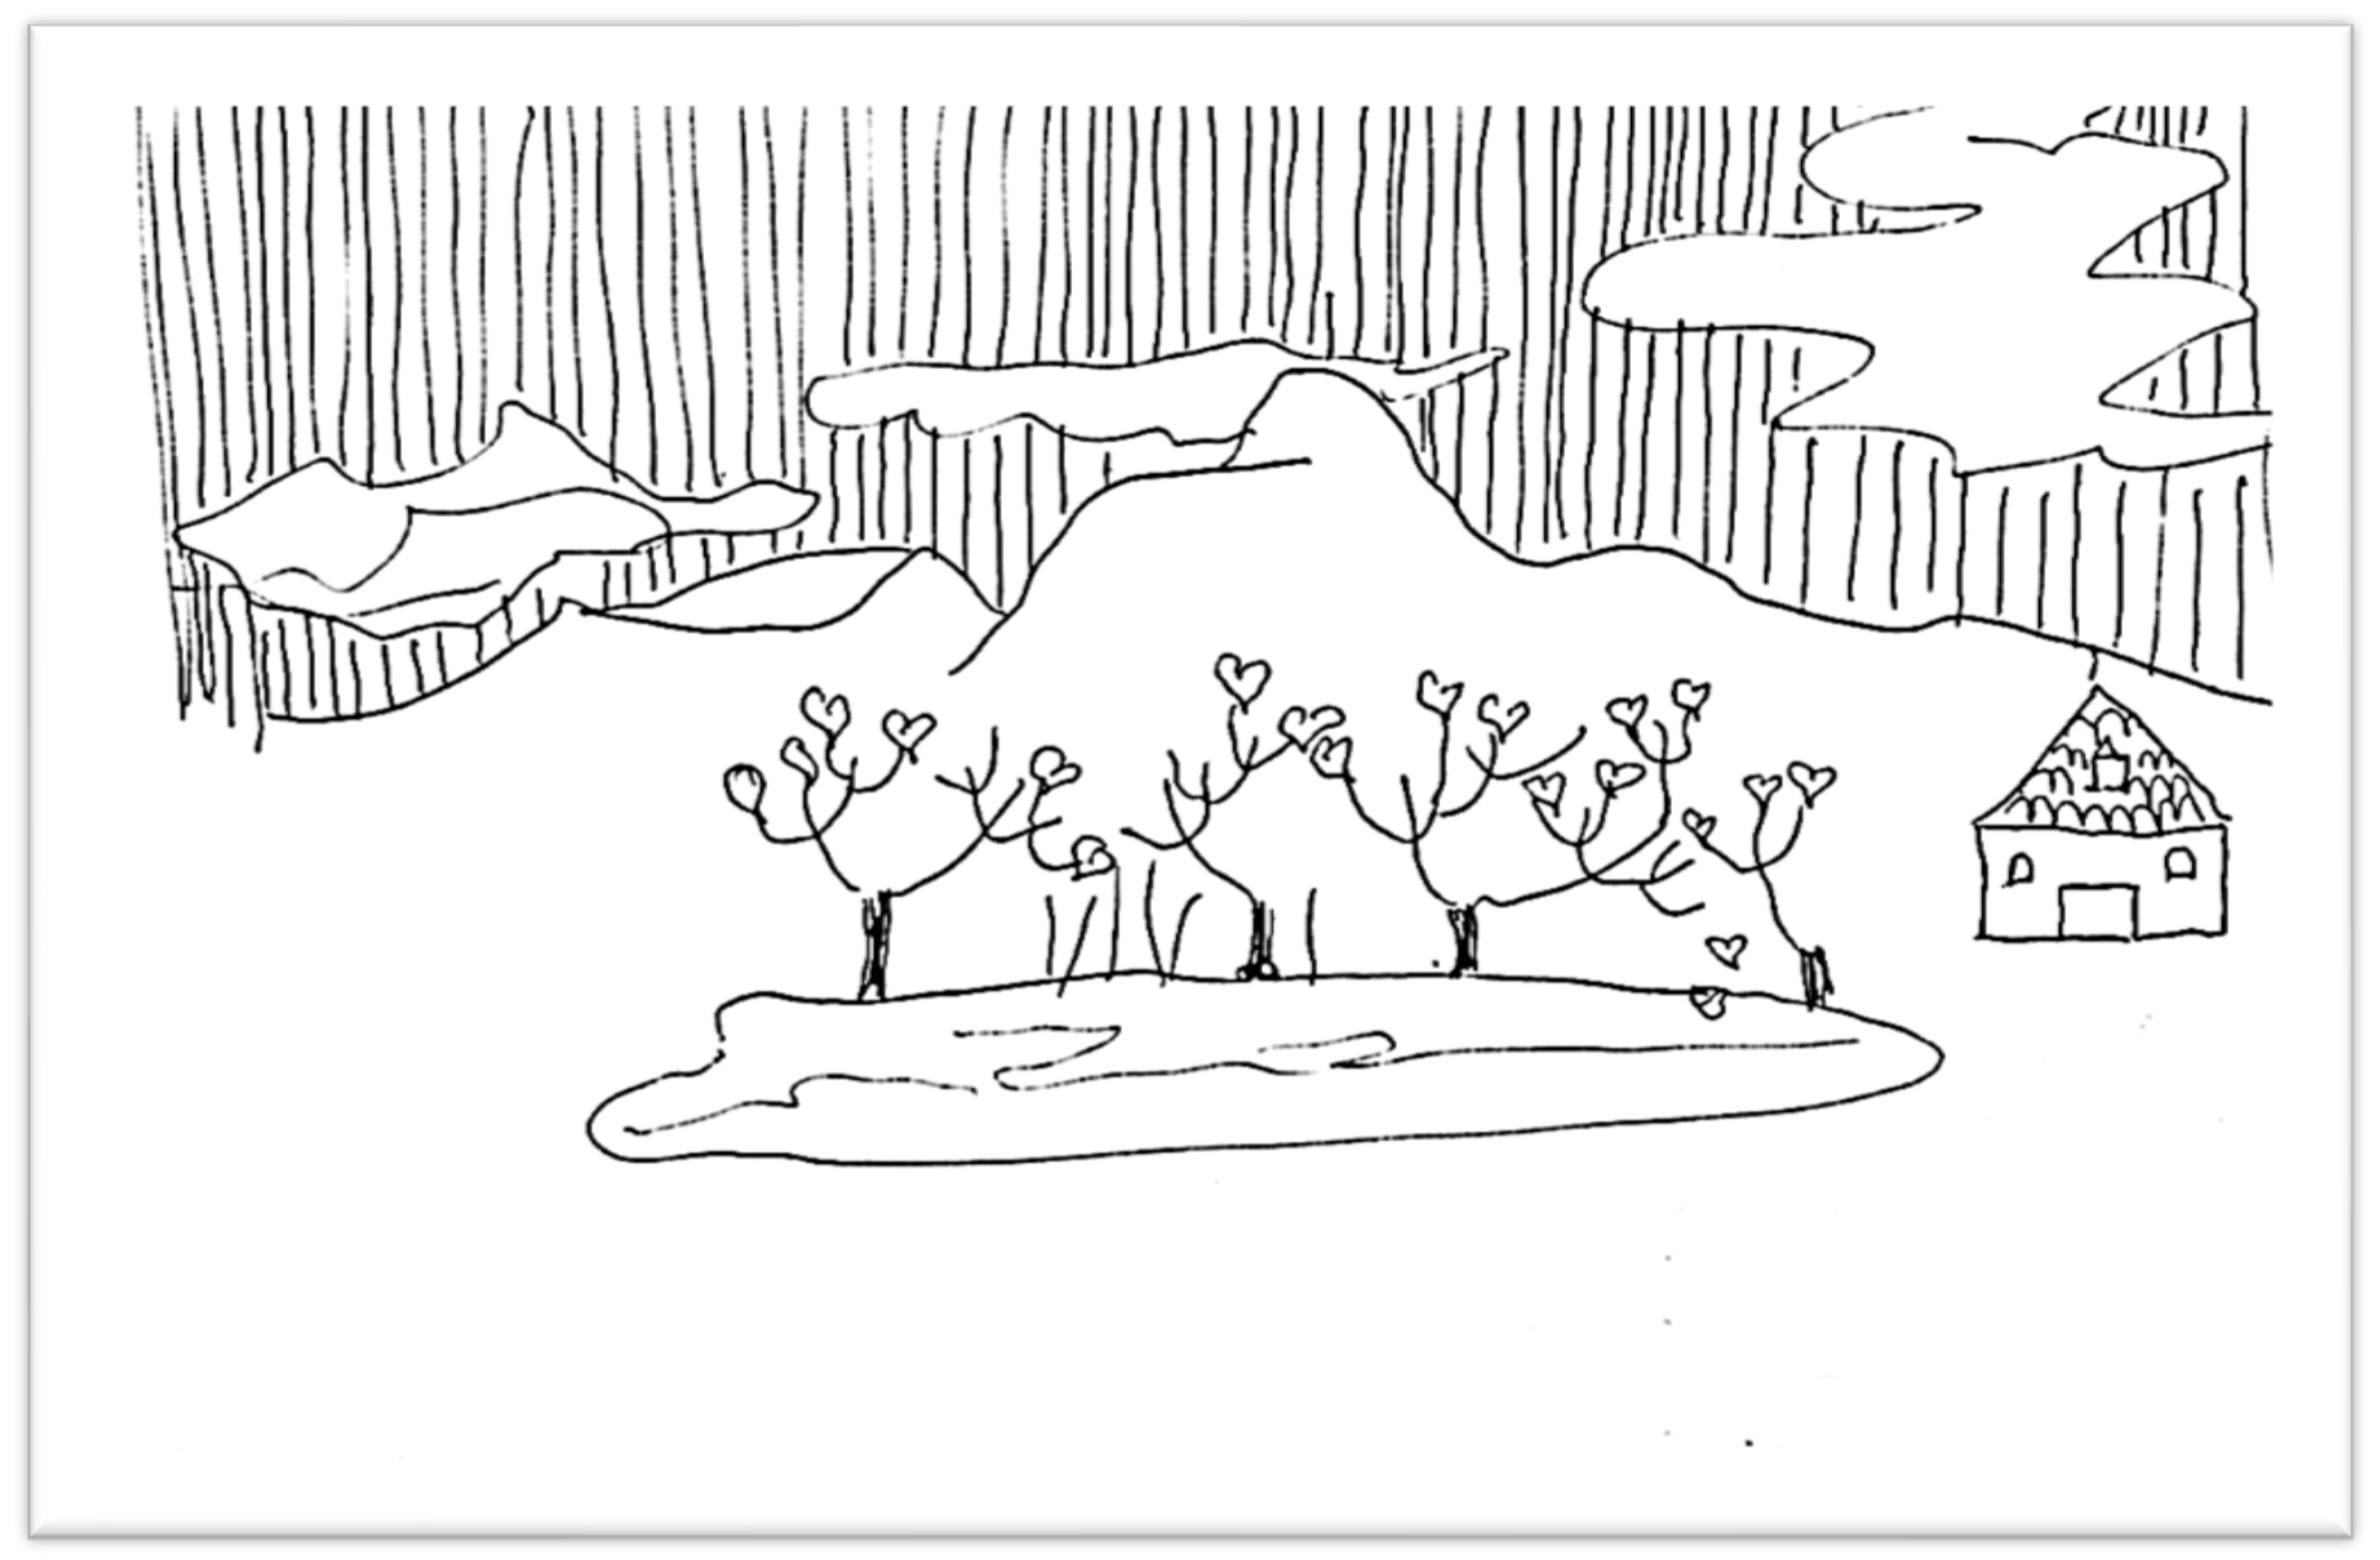
The third class (cluster 3 of the dendrogram) includes 17 drawings. This class presents the most objects referring to climate, plants, buildings, and/or elements of an aquatic environment. These are drawings that characterize fairly specific and anthropized environments, such as family gardens, or recreational parks and lakes, where nature is constrained to a greater extent by humans. The drawing in Figure 6 is characteristic of this class.
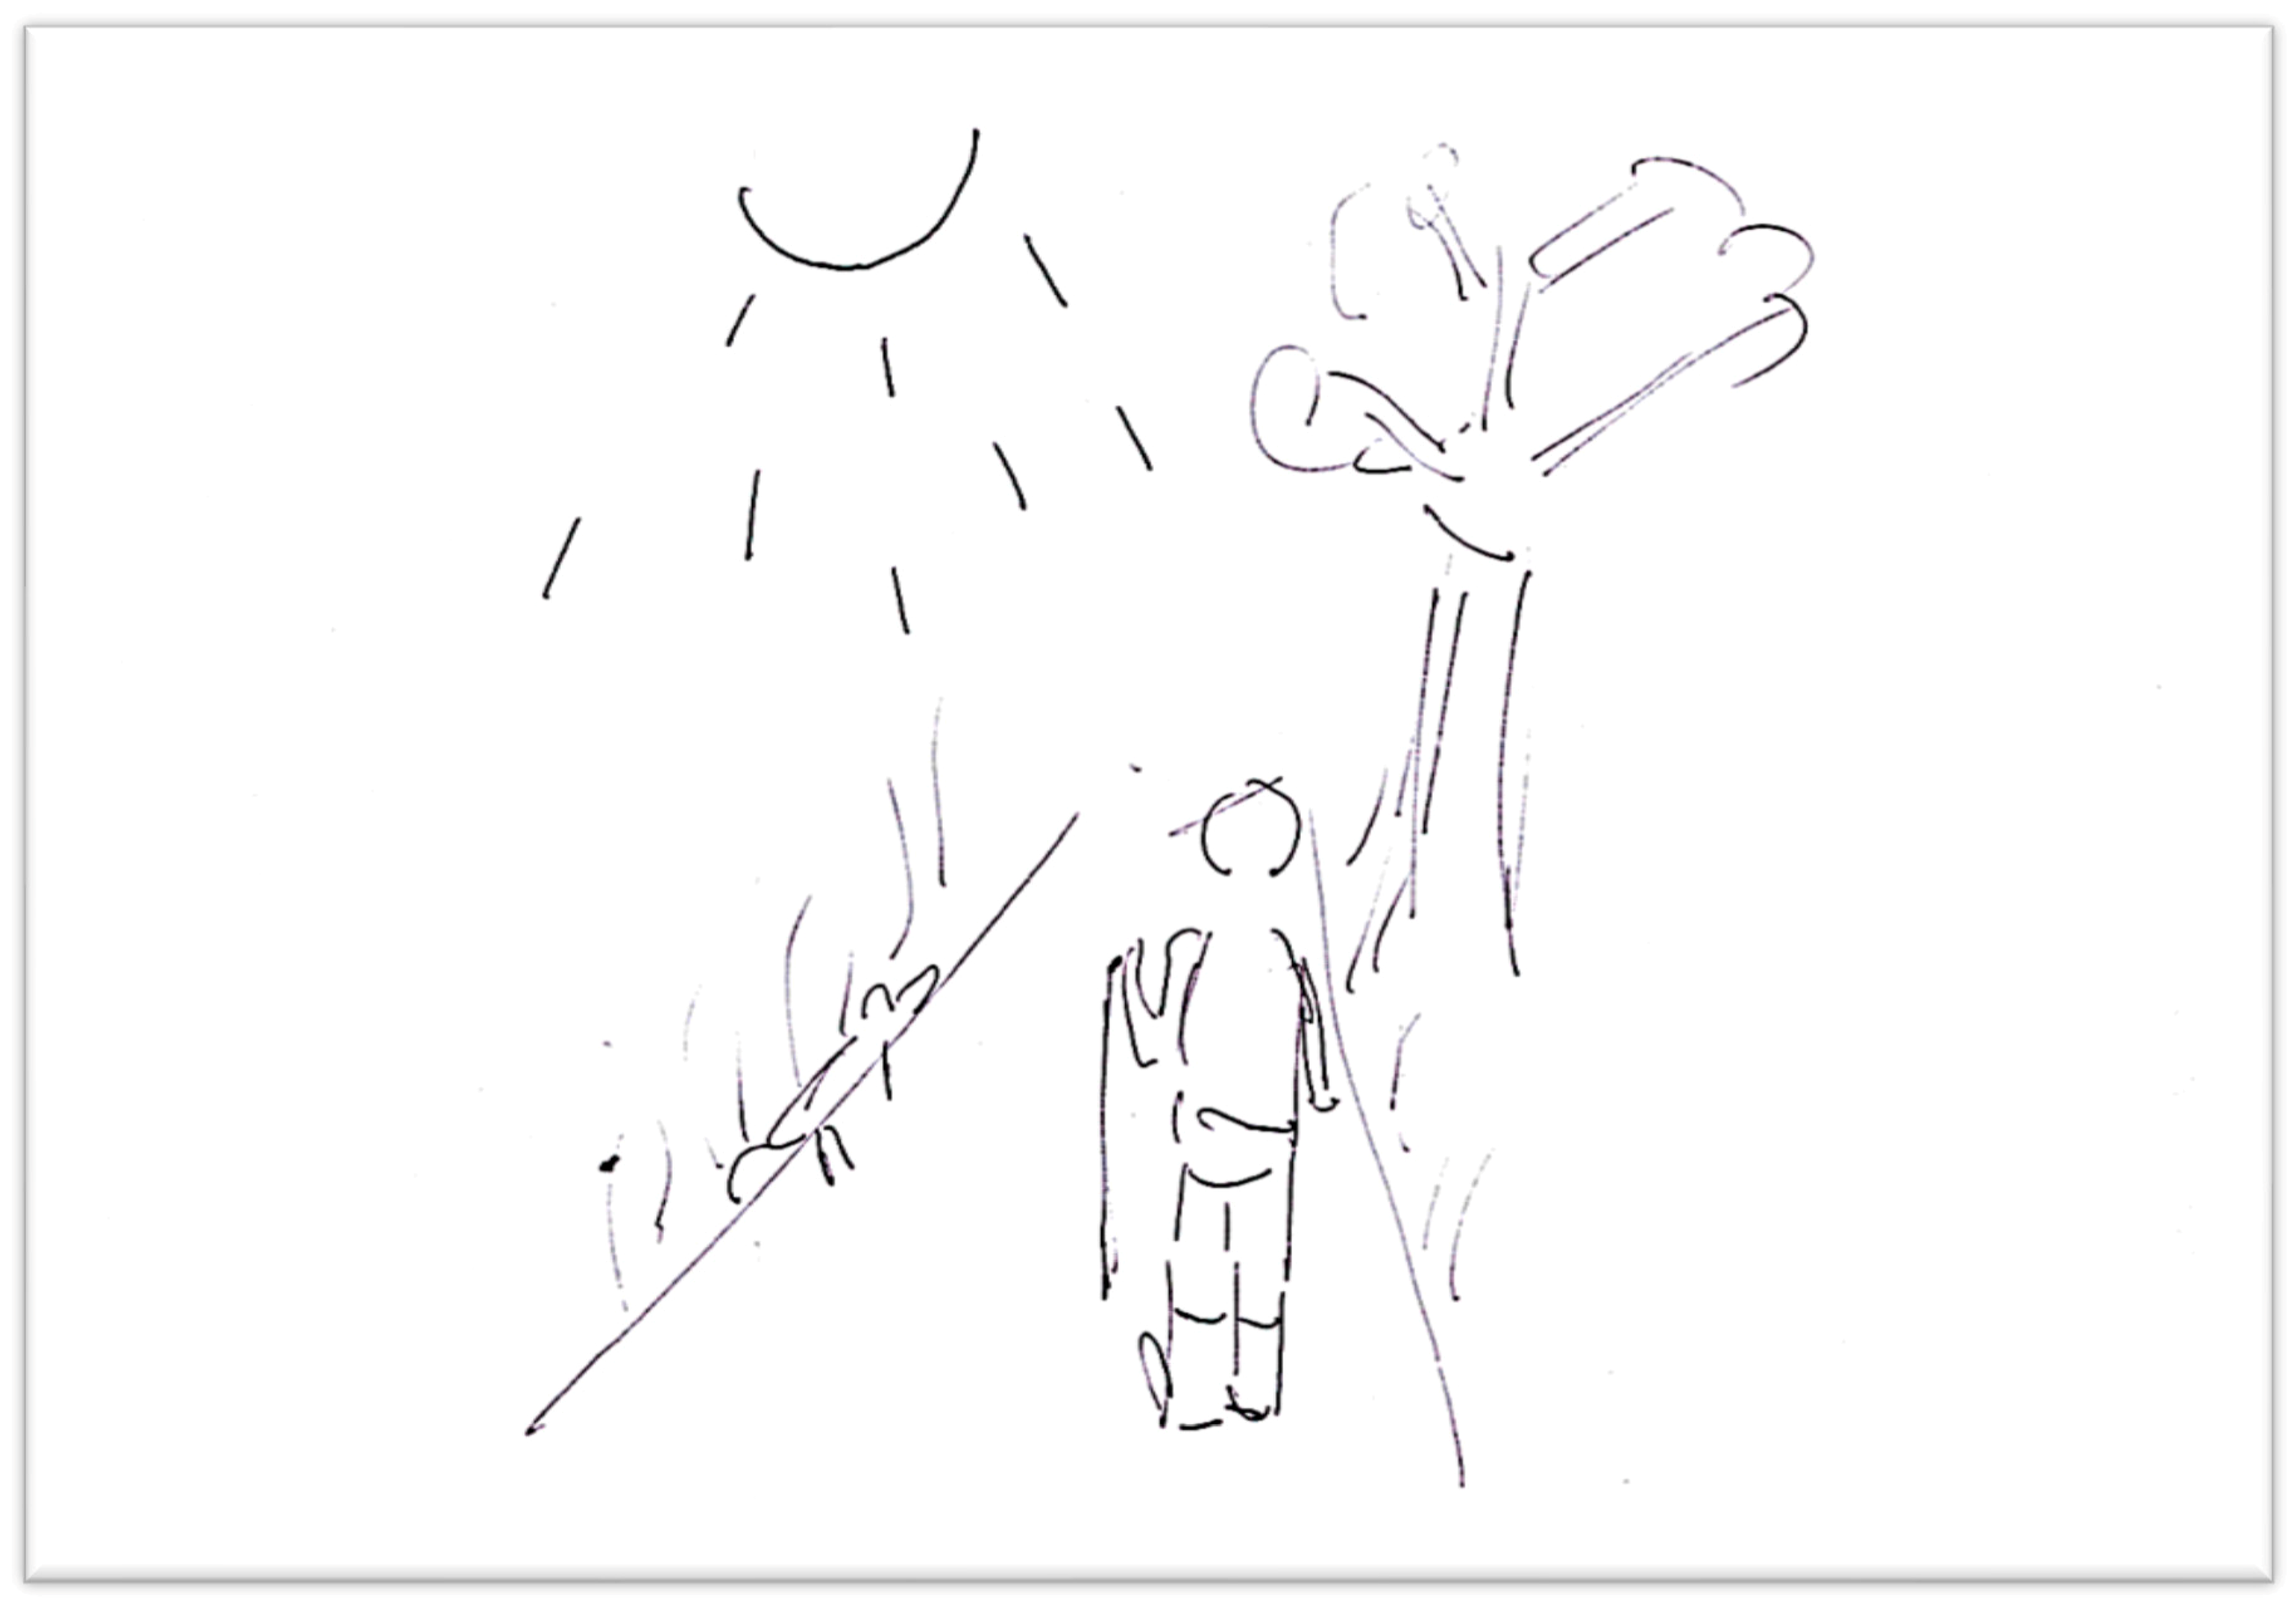
The fourth class (cluster 4 of the dendrogram) groups together 40 drawings. Numerically, this is the second largest class of drawings. It is similar to class 1 in the sense that it strongly emphasizes the presence of vegetation cover (especially trees), animals, and pathways. This class is also characterized by the absence of buildings, however, its drawings often depict the presence of humans and/or ticks, where the interviewee describes himself (or humans in general) in a more precise place in the TBR environment. In these drawings, we can see that the human becomes the central element in the perception of the path crossing a plant cover along with the presence of pets. The drawing in Figure 7 is typical of this class.
The hierarchical classification identifies two main classes (class 1 and class 4) accounting for nearly 68% of the drawings. Both classes are largely based on the representation of a pathway crossing a vegetation cover that frequently includes an image of pets. These are therefore the central elements in the interviewed population’s representation, which is more often a depiction of a wild and less anthropized nature. This is contrary to the depictions in the third class, which present a representation of TBR corresponding to the proximity with buildings and/or places of leisure. The second class remains the most remote by virtue of its minimal or absent spatial character, where the image of a landscape less pronounced.
3.3. Textual Analysis
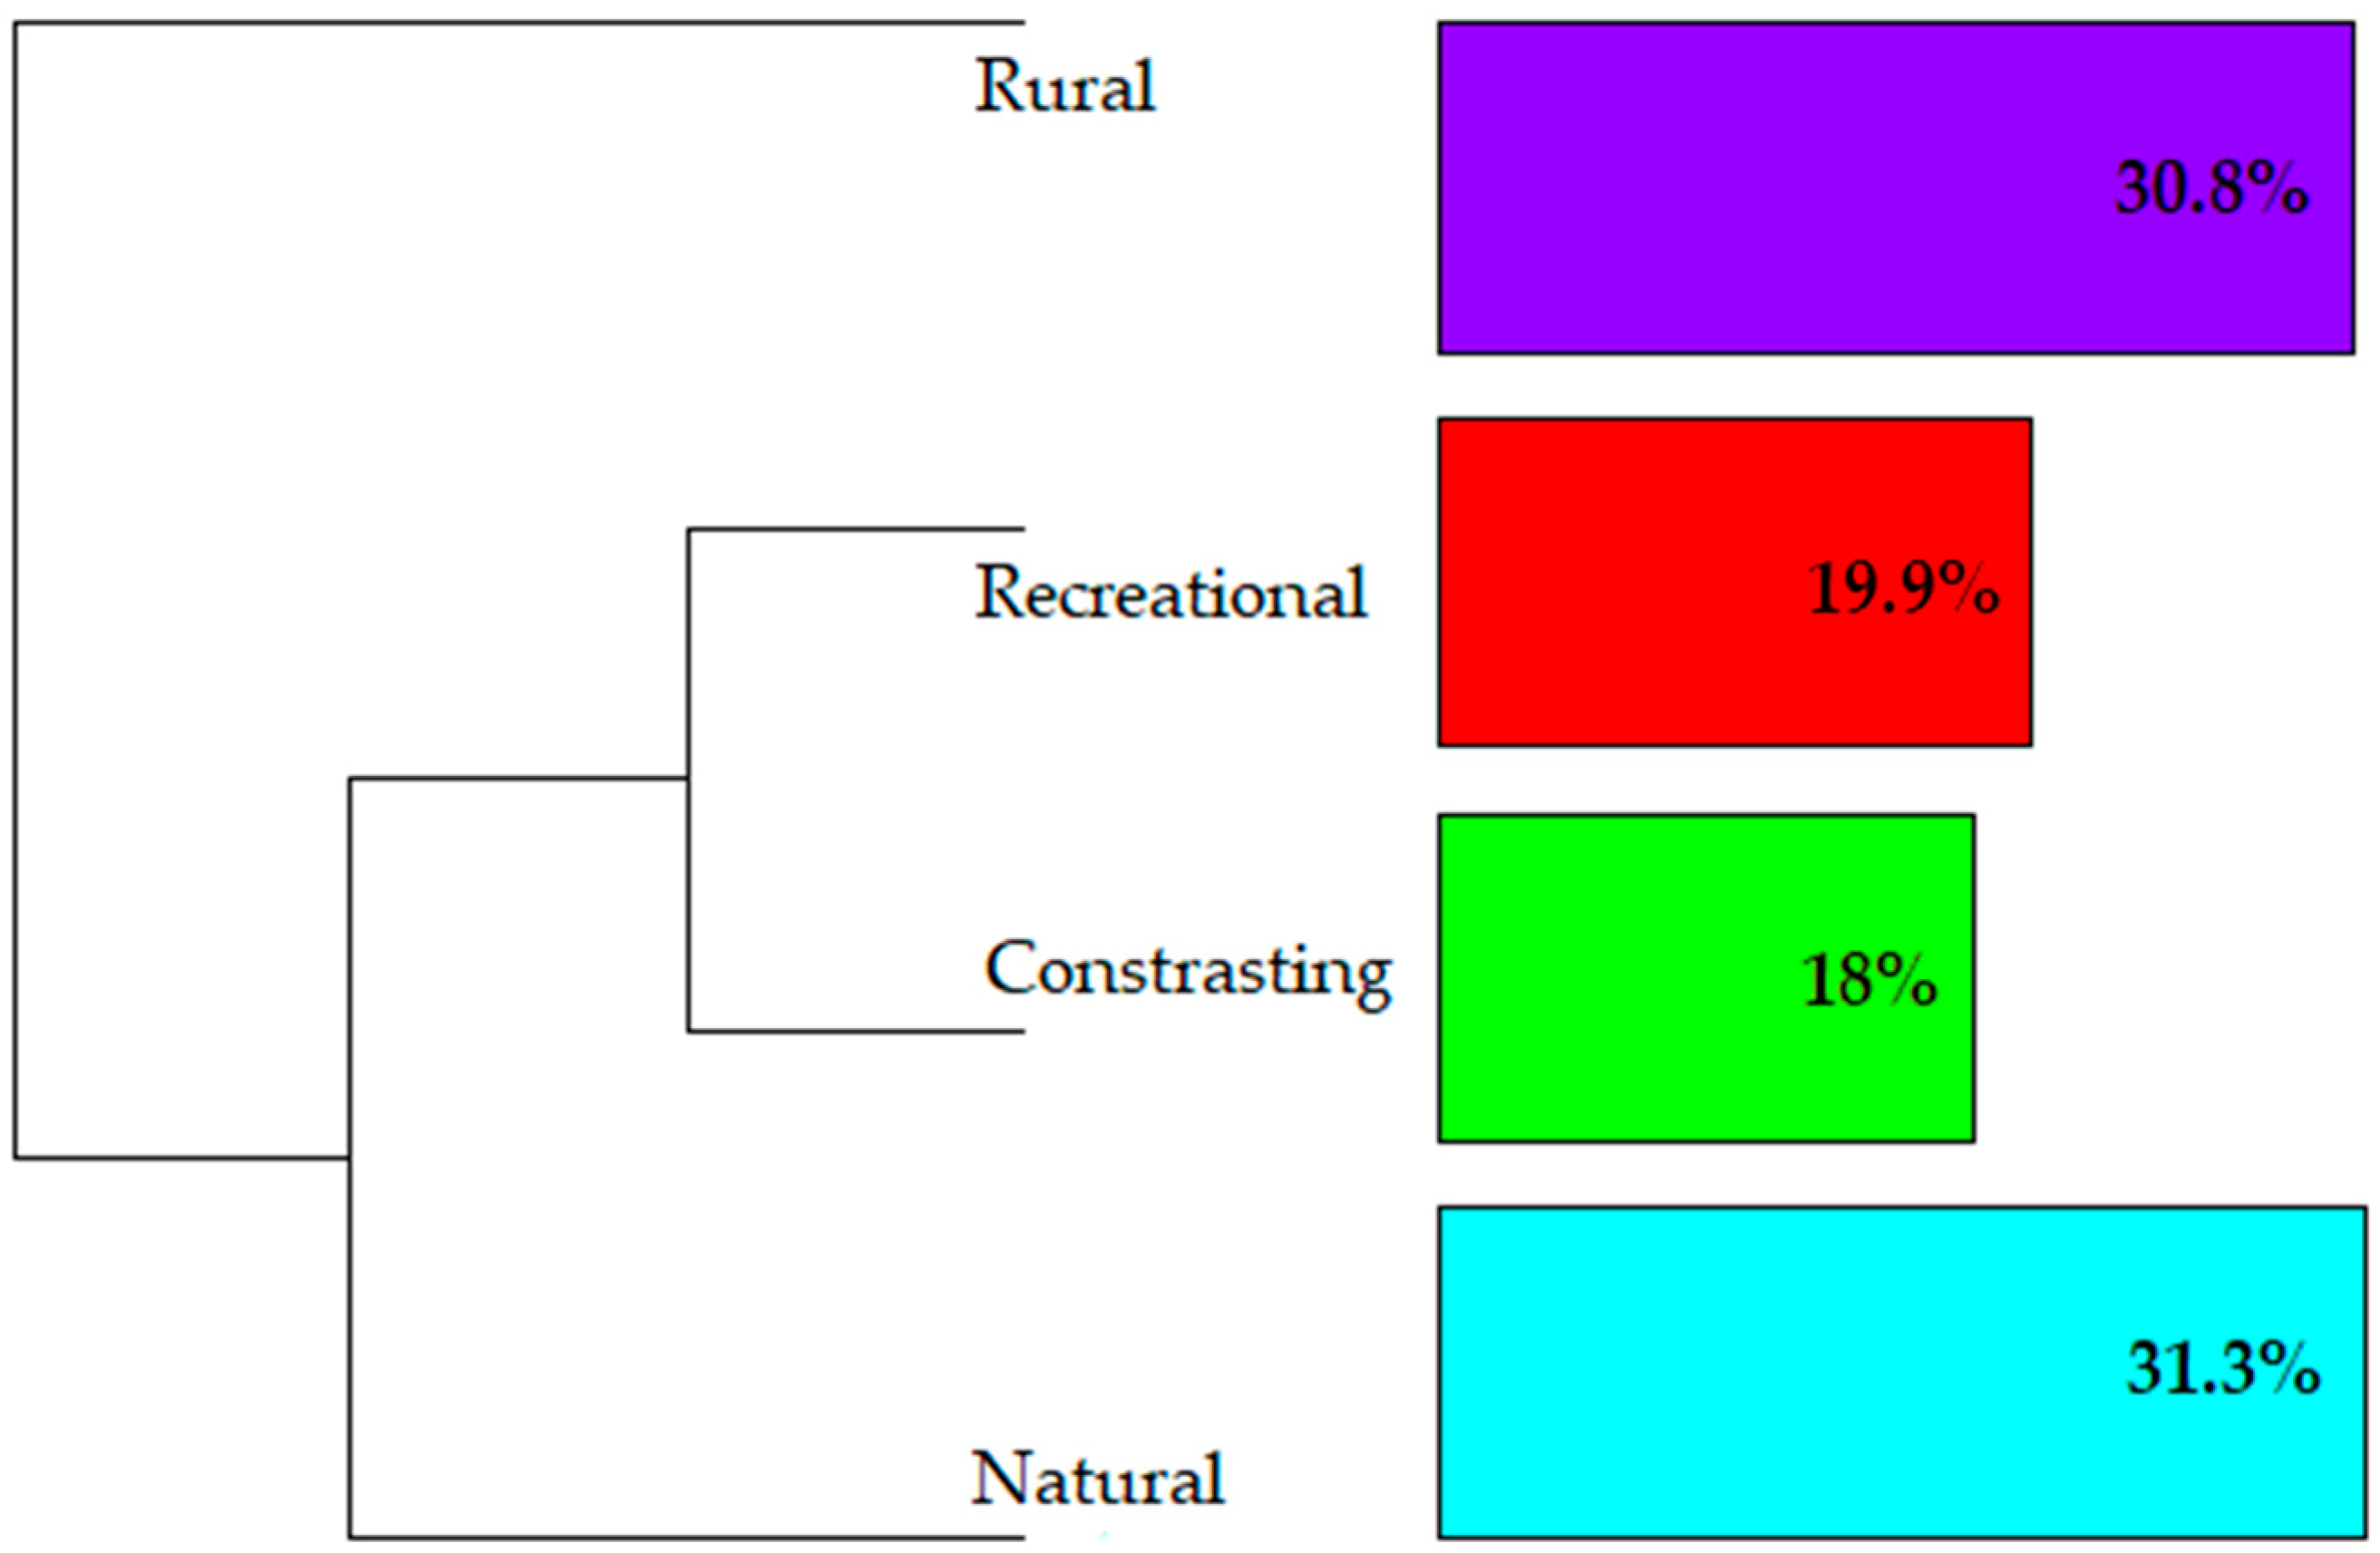
As noted earlier, we performed a textual analysis of the participants’ verbalization, which was recorded during the drawing phase of the interview. This analysis allowed us to establish four classes of verbalization that more explicitly reveal how individuals interpret the TBR. These classes correspond to specific perceptions that are partially independent from the drawings themselves. The analysis provides a dendrogram (Figure 8) showing one class of speech that represents 30.8% of the corpus and remains independent of the other three classes as part of the initial partitioning of the hierarchical clustering.
This first class of verbalization, described as “rural” (30.8%), includes the majority of the expressions of animals: dogs (χ2: 36.58, p < 0.05), cats (13.38, p < 0.05), wild animals (9.07, p < 0.05)) and farm animals, such as cows (25.37, p < 0.05) or herds (6.79, p < 0.05)). It characterizes a more rural view of TBR with associated landscape terms: Pond (11.37, p < 0.05), vegetable garden (11.37, p < 0.05), hedge (11.21, p < 0.05), pasture (11.37, p < 0.05)), or words, like boot (11.37, p < 0.05). It is also the class where the place of humans (15.99, p < 0.05) is central in the drawing description and where disease or Lyme disease itself is mentioned: disease (7.47 p < 0.05), Lyme disease (5.74, p < 0.05). Following is a typical transcript of verbalization in this class:
“It’s quickly seen, I’m going to make you a place, I’m doing a house, that’s it. There I am going to make a small path. There I will make you a forest quickly. So there the forest, the little path, little path. There I am going to make you a stable, I mark stable, I have right, a stable and then I’ll put, I put a key, a small barrier, a small stream, I mark? A small stream, there are fields, there are grass, small flowers too. There is the cow, I’m bad at drawing anyway, I’m bad, cow. There I think that’s the risk. In any case, for me the risk is in rural areas it is not in urban environment though… Oh no, there are also dogs, dogs that go in the weeds near the creeks. It makes me think a little about the farm at my parents’ house, well, what does it do, because wood… I do not think so. Yesterday I went to the wood I did not chop and yesterday when I went to give the flour with the cows, there are ticks they have and dogs bring us back. Ah, and in the hay too, the little haystack. I’m a little peasant on the edges.”(Text B1)
The other three classes of speech are more closely related, but maintain some differences. They all refer to forest vegetation cover, but offer certain contrasts.
The largest class, which we called “natural”, represents 31.3% of the verbalization recorded. The words in this class are more likely to identify details of the natural environment and make no reference to anthropized elements except for paths (χ2: 26.39, p < 0.05) where the individual goes (9.03, p < 0.05) or walks (9.25, p < 0.05). Most of the details concern the vegetation (14.2, p < 0.05): Tall grasses (71.89, p < 0.05), bushes (26.73, p < 0.05), trees (21.85, p < 0.05), brambles (13.37, p < 0.05), wastelands (6.64, p < 0.05), ferns (3.7, p < 0.05), woodlands (3.59, p < 0.06), etc. There are also elements qualifying the relief as mountains (10.86, p < 0.05) or the presence of aquatic environments, such as river (18.68, p < 0.05), wet (9.03, p < 0.05), and water (6.56, p < 0.05)). Following is an example of this type of verbalization:
“Then I will see a way because potentially more mountainous, it is not a marked path but especially not a paved road. Herbs, tall grass everywhere, on the way or next to it, small bushes in various places. We will not put them on the way because if there is a path there is no bush, trees, that’s it. Of the forest too, small trees, medium trees and potentially we do not just stay on the way when we walk and we can go to that side where possibly. We can believe in safety but we can is not always. That’s the idea for me, both of the grass of the trees, of the vegetation.”(Text B2)
The “recreational” class is next and concerns 19.9% of the words recorded in the verbalization. It is characterized by terms related to recreational activities in nature. The following are examples of activities that are mainly found in this class: Gathering (χ2: 35.25, p < 0.05), mushroom picking (28.54, p < 0.05), picnics (20.36, p < 0.05), hiking (15.53, p < 0.05), lake swimming (11.85, p < 0.05), stroll (4.14, p < 0.05), and eat (4.14, p < 0.05). Here, we also find references to trees that are less characteristic to TBR, such as conifers (35.72, p < 0.05). The following is an example of verbalization in this class:
“Well, it can be in nature in a forest. A surrounding forest of the chain of Puys for example. Here. If I evolve with little protection in the legs, arms, during a search for mushrooms for example. I do not know if it looks like mushrooms, that’s mushrooms. The forest… After it can be during a friendly picnic in the nature at the edge of a lake in the grass. Can we make a lake? I can write, so lake. It’s minimalist like drawing, lake. After we are in the herbs, the herbs, in the flowers and then we are lying in there, or sitting, we rest we relax, moments like that. It can be in the garden too. I have a vegetable garden with vegetables. I am in it I work my land, and then vegetable garden. Around there is also grass and it can be in also on this occasion. Let’s say that I work my garden, I’m not very good in drawing, it’s not an artistic contest but for example I would like to make a tool, like a spade, knowing that I do not dig in the middle of summer it would be rather a fork can -being a hoe, in the kitchen garden […] So picking in the forest, mushrooms, lake, picnic, gardening, it’s situations.”(Text B3)
“Contrasting” is the last class and represents 18.01% of the verbalization. Its unique aspect comes from the fact that it is the only class that does not specifically characterize the natural environment. There are more generic words that relate to drawing skills, such as draw (χ2: 28.18, p < 0.05) and represent (21.0, p < 0.05); words related to urban life, such as house (11.61, p < 0.05) and city (7.2, p < 0.05) and live (22.25, p < 0.05); words related to means of transportation, such as car (13.76, p < 0.05) and train (6.04, p < 0.05) and boat (4.84, p < 0.05); or related to ticks themselves, such as bite (14.92, p < 0.05), paw (13.76, p < 0.05), species (2.98, p < 0.05), or ticks (9.5, p < 0.05). In general, it is a class of verbalization that involves traditional descriptions of the natural environment and the activities related to it. The following two transcriptions are typical of the verbalization that characterizes this class:
“So what comes to mind is grass, it’s not too hard but it’s very badly drawn. And after, it can be in the countryside but it can be in a garden in town. I caught it not so long ago in a garden in town. As long as there is grass for me it is everywhere where there is grass and animals often. It can be dogs or something else but that’s all. Me where we meet them is in the grass.”(Text B4)
“I do not know, I do not know where they are in nature but where I will be afraid of being bitten it is admitted that one is in my room, there I have my bed, there is my dog who is lying on it, I am here and then for some reason he scratches himself and the tick comes out of his coat and it comes on me. This is where I will be most afraid of being stung. I do not know if there is any in the nature where anything, on the cover yes…”(Text B5)
3.4. Cross Analysis
The cross analysis allowed us to combine the data from the pre-iconographic analysis of the drawings with that of the textual analysis of the verbalization, and to include the socio-demographic characteristics of the individuals, their knowledge on the TBR (biting experiences, knowledge of bite sites, knowledge of prevention methods), and their outdoor activities. The results of this analysis, shown in Table 8, make it possible to qualify the verbalization according to the class of drawing and the variables.
The “rural” class of verbalization reflects the characteristics of an older population (aged over 60), with limited formal education and a lower standard of living, who live in rural areas, and are either retired or work in the agricultural sector. They practice outdoor activities, such as fishing or woodcutting. The verbalization in the rural class is primarily associated with class 1 drawings, which includes drawings that are primarily images of nature and suggest non-anthropized spaces where humans are rarely represented. It reflects this rural population’s knowledge of their everyday environment.
The “natural” class of verbalization corresponds to a population that features more educated, professional categories that include well paid, middle-aged individuals living in peri-urban areas. The climate is present in their drawings, as is the notion of pathways. Class 4 drawings refer to a population that takes regular hiking trips further away from their home where they encounter TBR.
The “recreational” class is characterized by the presence of a majority of women. It also includes households with higher incomes and those who participate in frequent outdoor activities, further from home, such as picnicking or hunting for wild mushrooms or berries. As with the natural class, the recreational class is often associated with class 4 drawings and an urban profile, but is marked by the absence of hiking as the primary leisure activity.
The final class of verbalization, “contrasting,” is particularly identified with the class 2 drawings. Here, we find a population that is not often familiar with TBR and is rarely confronted with the risk, except in urban or peri-urban activities (such as jogging). It is mostly a younger population that displays little knowledge of places associated with TBR. Drawings from both classes 2 and 3 reflect a close proximity to urban space in the representation and a difficulty of projecting experience to a wider, unknown environment. These last three verbalization classes primarily reflect the urban population surveyed around Clermont-Ferrand, and the socio-demographic characteristics of the area’s collection sites.
This cross analysis shows that the verbalization which occurred during the drawing of mental maps is a fundamental element of the analysis and undeniably enriches the data. The verbalization of most interviewees adds essential elements (experiences, precision, etc.) that complement the unspoken elements of the interview’s drawing process. This corresponds with the methodological position discussed previously [47].
4. Discussion
4.1. Tick Bite Risk and Socio-Spatial Representations
The perception of TBR appears to be built from the individual’s social and spatial identities that echo past experiences and the ability to understand this risk in a spatial sense. These are socio-spatial representations of the TBR and not simply collective representations [24].
4.1.1. Representational Elements
First, we see a variety of elements that make up this representation. The pre-iconographic analysis, reinforced by textual analysis, highlights the predominance of natural spaces that encompass various forms of vegetation cover, such as tall grass, shrubs, or forests. The vegetation cover is often detailed (genet, fern, brambles, etc.). The representations suggest that risk is associated with the distance from certain species judged as dangerous. Moreover, most participants also identified the forest in their drawings. This reflects the statistical reality of an increased risk of tick bites in forests, especially hardwood or mixed (deciduous and coniferous) [12,33,57,58]. However, the difference in risk according to the type of forest appears to be unknown to most individuals. Few indicated the lower risk from coniferous forests either in drawings or verbally. As a sort of inhospitable universe, the forests are often described as dense or dark, and risky plant cover is described as wastelands, brambles, and bushes. Forests with sufficient humidity and the presence of typical animal hosts (rodents, birds, deer, etc.) do, in fact, provide favorable terrains for the ixodes ticks.
Animals have an important place in the representations, but these are often pets rather than wild animals (particularly noticeable in the Combrailles sector). A large proportion of individuals included pets in their representation because of their independent ability to bring back ticks. This suggests that the participants are aware of the risk of disease transmission to animals (even if specific animal diseases are not mentioned). The link between animals and the transmission of Lyme borreliosis is present in the representations, even if the animals themselves do not transmit the disease to humans. They are of course hosts for ticks, but not all animals carry the bacteria that causes Lyme borreliosis. The presence of pets is also a symbol associated with the practice of outdoor activities. For example, the dog is often associated with walks in the countryside, and the cat with activities in the garden.
This leads to other reference elements, such as recreational spaces or objects. These are more loosely defined elements, but they reveal the association between TBR and outdoor recreational practices, such as hiking, walking, hunting for edible plants, picnics, etc. Included are references to elements and accessories related to these activities (resorts, mushrooms, berries, hiking shoes, shorts, bathing suits, picnic tables, etc.). However, the activities and elements related to walking are in the majority of drawings and correspond to a stereotype of the TBR typically projected as an image of a person walking in nature. The marked presence of paths in a large portion of the drawings reflects this fact even if it is not the path itself, but the vegetation bordering the path that presents the risk. More developed paths would generally offer less risk than undeveloped ones, where there is likely to be more contact with adjacent vegetation.
To a lesser degree, individuals also cite aquatic environments, such as lakes, ponds, rivers, marshes, etc. Although they can be considered a factor favoring humidity, the presence of ticks in or in the immediate vicinity of water is unfounded. There appears to be a misconception among these participants. The urban environment seldom appears in the drawings, but is associated with questions that people might have about TBR: Are ticks found in town? Are urban gardens infested? Do they live in our houses? There are clearly misconceptions concerning the biology and behavior of ticks, which people see only occasionally in natural surroundings. For example, interviewees speak of ticks often falling from trees. Even if a tick could theoretically fall from a bird or tree, all of the situations where the interviewees encountered ticks or bites were typical of expectations that these would come from a low branch, a bush, or grasses, or when one is already hooked (on an animal or person). Similarly, the elements of climate are also significant. Individuals rarely referred to it, or did so only in a sense limited to the sun and summer. However, ticks can be present for most of the year, any time when it is not too cold or too dry, and autumn are particularly favorable. Global warming has extended natural tick habitats [59] and it is not impossible to see one in winter or at increasingly higher altitudes.
4.1.2. Socio-Spatial Anchoring
The content elements described above are expressed differently depending on the individual and therefore contribute to representations that differ in their social anchoring. First, there is a fairly clear demarcation between rural residents and those living in urban or peri-urban areas.
In our sampling, the individuals from rural areas generally have a lower standard of living, less formal education, and are significantly older. The outdoor practices they reference are related to their environment, such as walking, cutting wood, and fishing. Outdoor activities are rarely practiced far from the family home and anchor the representation of the TBR in the immediate area of their rural lifestyle. This environment is often linked to agriculture (meadow, pasture, cows, etc.) and neighboring forests. Specific places are indicated where the interviewees believe they can be bitten: The kitchen garden, a field, the banks of a river, an area where mushrooms grow. The representation is often linked to a personal or family history that involves their environment [28]. The knowledge of ticks is, however, not perfect and gaps remain with respect to means of prevention. The fear of Lyme borreliosis is strong, and even though this is often the case in older populations, it does denote an aspect of collective or shared knowledge.
Individuals from urban and peri-urban areas have higher levels of income, education, and employment. Their outdoor practices (walking, hiking, etc.) are also noticeably close to the rural environment, but often require more travel, further from the family home (particularly hiking), even when they stay within a local radius of less than 30 km. The representation of the TBR is thus less specific. It mixes tangible personal experiences with shared or socially acquired knowledge, which elicits qualified verbalization, such as “maybe,” “not sure,” or “I think.” Knowledge of ticks and prevention is less than average and experience with bites is less evident than among participants in rural areas. The drawings are more likely to refer to a known place than a conceptualized landscape.
Nevertheless, there is little homogeneity in this more urban group. We can see that outdoor practices often differ depending on the age of the individuals. The younger children leave the urban space less often and rarely identify places related to ticks. Their practices are more limited (picnics, for example), more localized (primarily in the urban space of Clermont-Ferrand), and representations use more elements, which reflect information from media or from common sense in the general public. Older and more affluent individuals are more likely to regularly practice outdoor recreation, such as hiking or walking. Their representation usually includes detailed information about the natural environment encountered, and they exhibit the most verbalization referring to the plant cover next to roads. The forests dominate their representations and are associated with the risk of bites even if their biological knowledge about ticks is limited (effects of seasons, cycle of bites). The description of generic, regional landscapes is typical in their drawings: Hills, mixed or coniferous forest, lakes, etc. The Puy-de-Dôme, an emblematic mountain in the region, is regularly mentioned, not as a precise memory, but as a general of reference. This demonstrates an anchoring identity linked to the region, which shows a strong association in the way individuals identify the landscape with TBR.
This brings us back to the definition of the socio-spatial representation proposed by Dias and Ramadier [26]: A representation is situated in a complex socio-cognitive process, actively constructed by the subject through the meanings conferred on the space, the goals of the subject, and the social rules used in this space. The various anchors can help us identify the gap that may exist between the ability of individuals to recognize the risk and the means of helping these individuals access the information that researchers seek to disseminate.
Finally, there is one marginal phenomenon to note. Four of the interviewed participants were students or younger salaried individuals with foreign origins. Newly arrived in the region (less than two years), they had no prior knowledge of ticks native to France or the risk of related diseases because these are different from the ticks found in their own countries (Africa, South America). However, they indicated that they participate in activities that allow them to discover the natural environment (walk, hike) and are thus exposed to bites.
4.1.3. Potential Limits of the Analysis
It is important to note that several limits are anticipated. These can reduce the scope of the results obtained and should therefore be taken into account in the discussion.
The first limit concerns the sample size of the surveyed population. This study only incorporated interviews from 133 individuals. It therefore cannot be seen as a wide scope of the general population. However, it should be noted that the sampling was very precise and enabled the inclusion of a wide heterogeneity in profiles (age, profession, education, origin, etc.), especially for a qualitative method requiring a 20 min, face to face exchange at a table with each participant. This aspect is rare in mental map methods, and in this case, particularly so because the theme was hidden before the interview in order to avoid a captive population. This was a limiting factor in other studies, where the interviewed individuals participated because of an interest in the subject, thus reducing the strength of the interpretation. The second limit concerns the geographical area of the study. Here again, limiting this study to a region with specific characteristics limits its general scope: The presence of ticks in the region naturally leads to a population more knowledgeable about TBR, the presence of rich natural terrains encourages outdoor activities that harbor TBR, and, finally, the information presented to the population by researchers and health services also contributes to a better knowledge of TBR. However, our access to epidemiological and environmental information made it possible to reduce the impact of certain factors (weather, climate, etc.), to focus the study on two particularly significant areas, and to approach TBR from a social perspective. The third limit concerns the methodology. As with any analysis of mental maps, there remains an element of subjectivity. However, the mobilization of a pre-iconographic and systematic analysis of the drawings reduced this subjectivity by allowing the analysis to ignore the perception of the drawing and focus on quantifying the elements present. These data were then used to identify global socio-spatial trends rather than provide an interpreted meaning of the drawings (as in iconology).
4.2. TBR and Prevention Policies
The analysis of the collected data questions the way in which the population interprets the surrounding landscape with regards to the risks associated with tick bites. The link between the various spatial and non-spatial objects within the representation of TBR acts as a weak interaction that tends to modify the image of a natural setting. It should be noted that the practices declared by the respondents (mainly walks and hikes) point to the recreational or preventative health benefits of engaging in activities in natural landscapes. Papillon and Dodier [39] show that these spaces, particularly forests, previously considered simply as recreational spaces, are increasingly thought to provide health benefits as well. The development of silvotherapy (called Shinrin-Yoku) in many countries is a marker of this trend [60]. However, the assembled representations that articulate TBR can negatively affect this perception of health benefits. Therefore, we could see the emergence of a perspective associated with the danger to health from tick transmitted diseases, and evolve from a vision of the health benefits to one focused on the danger presented by the natural landscape. In this case individuals would make adjustments in their representations [61] that reflect this relationship between health and the landscape environment.
In this sense, the representation exhibits a Calder effect [62], in the form of a system that incorporates multiple unstable elements, which tend to evolve over time. This variability suggests that the population has no innate or fixed spatial understanding of TBR. Instead, there is a system of associated elements of representation that are apprehended through the individuals’ interrelationships and social anchorage. This interpretation allows us to apply Bauer and Gaskell’s concept of “wind-roses” [63], which the authors use as a metaphor for the evolution of individuals and social groups through their interpersonal and intergroup relations. Their different representations overlap and intertwine within these relationships, and the objects of these representations are therefore subject to the same interrelationships.
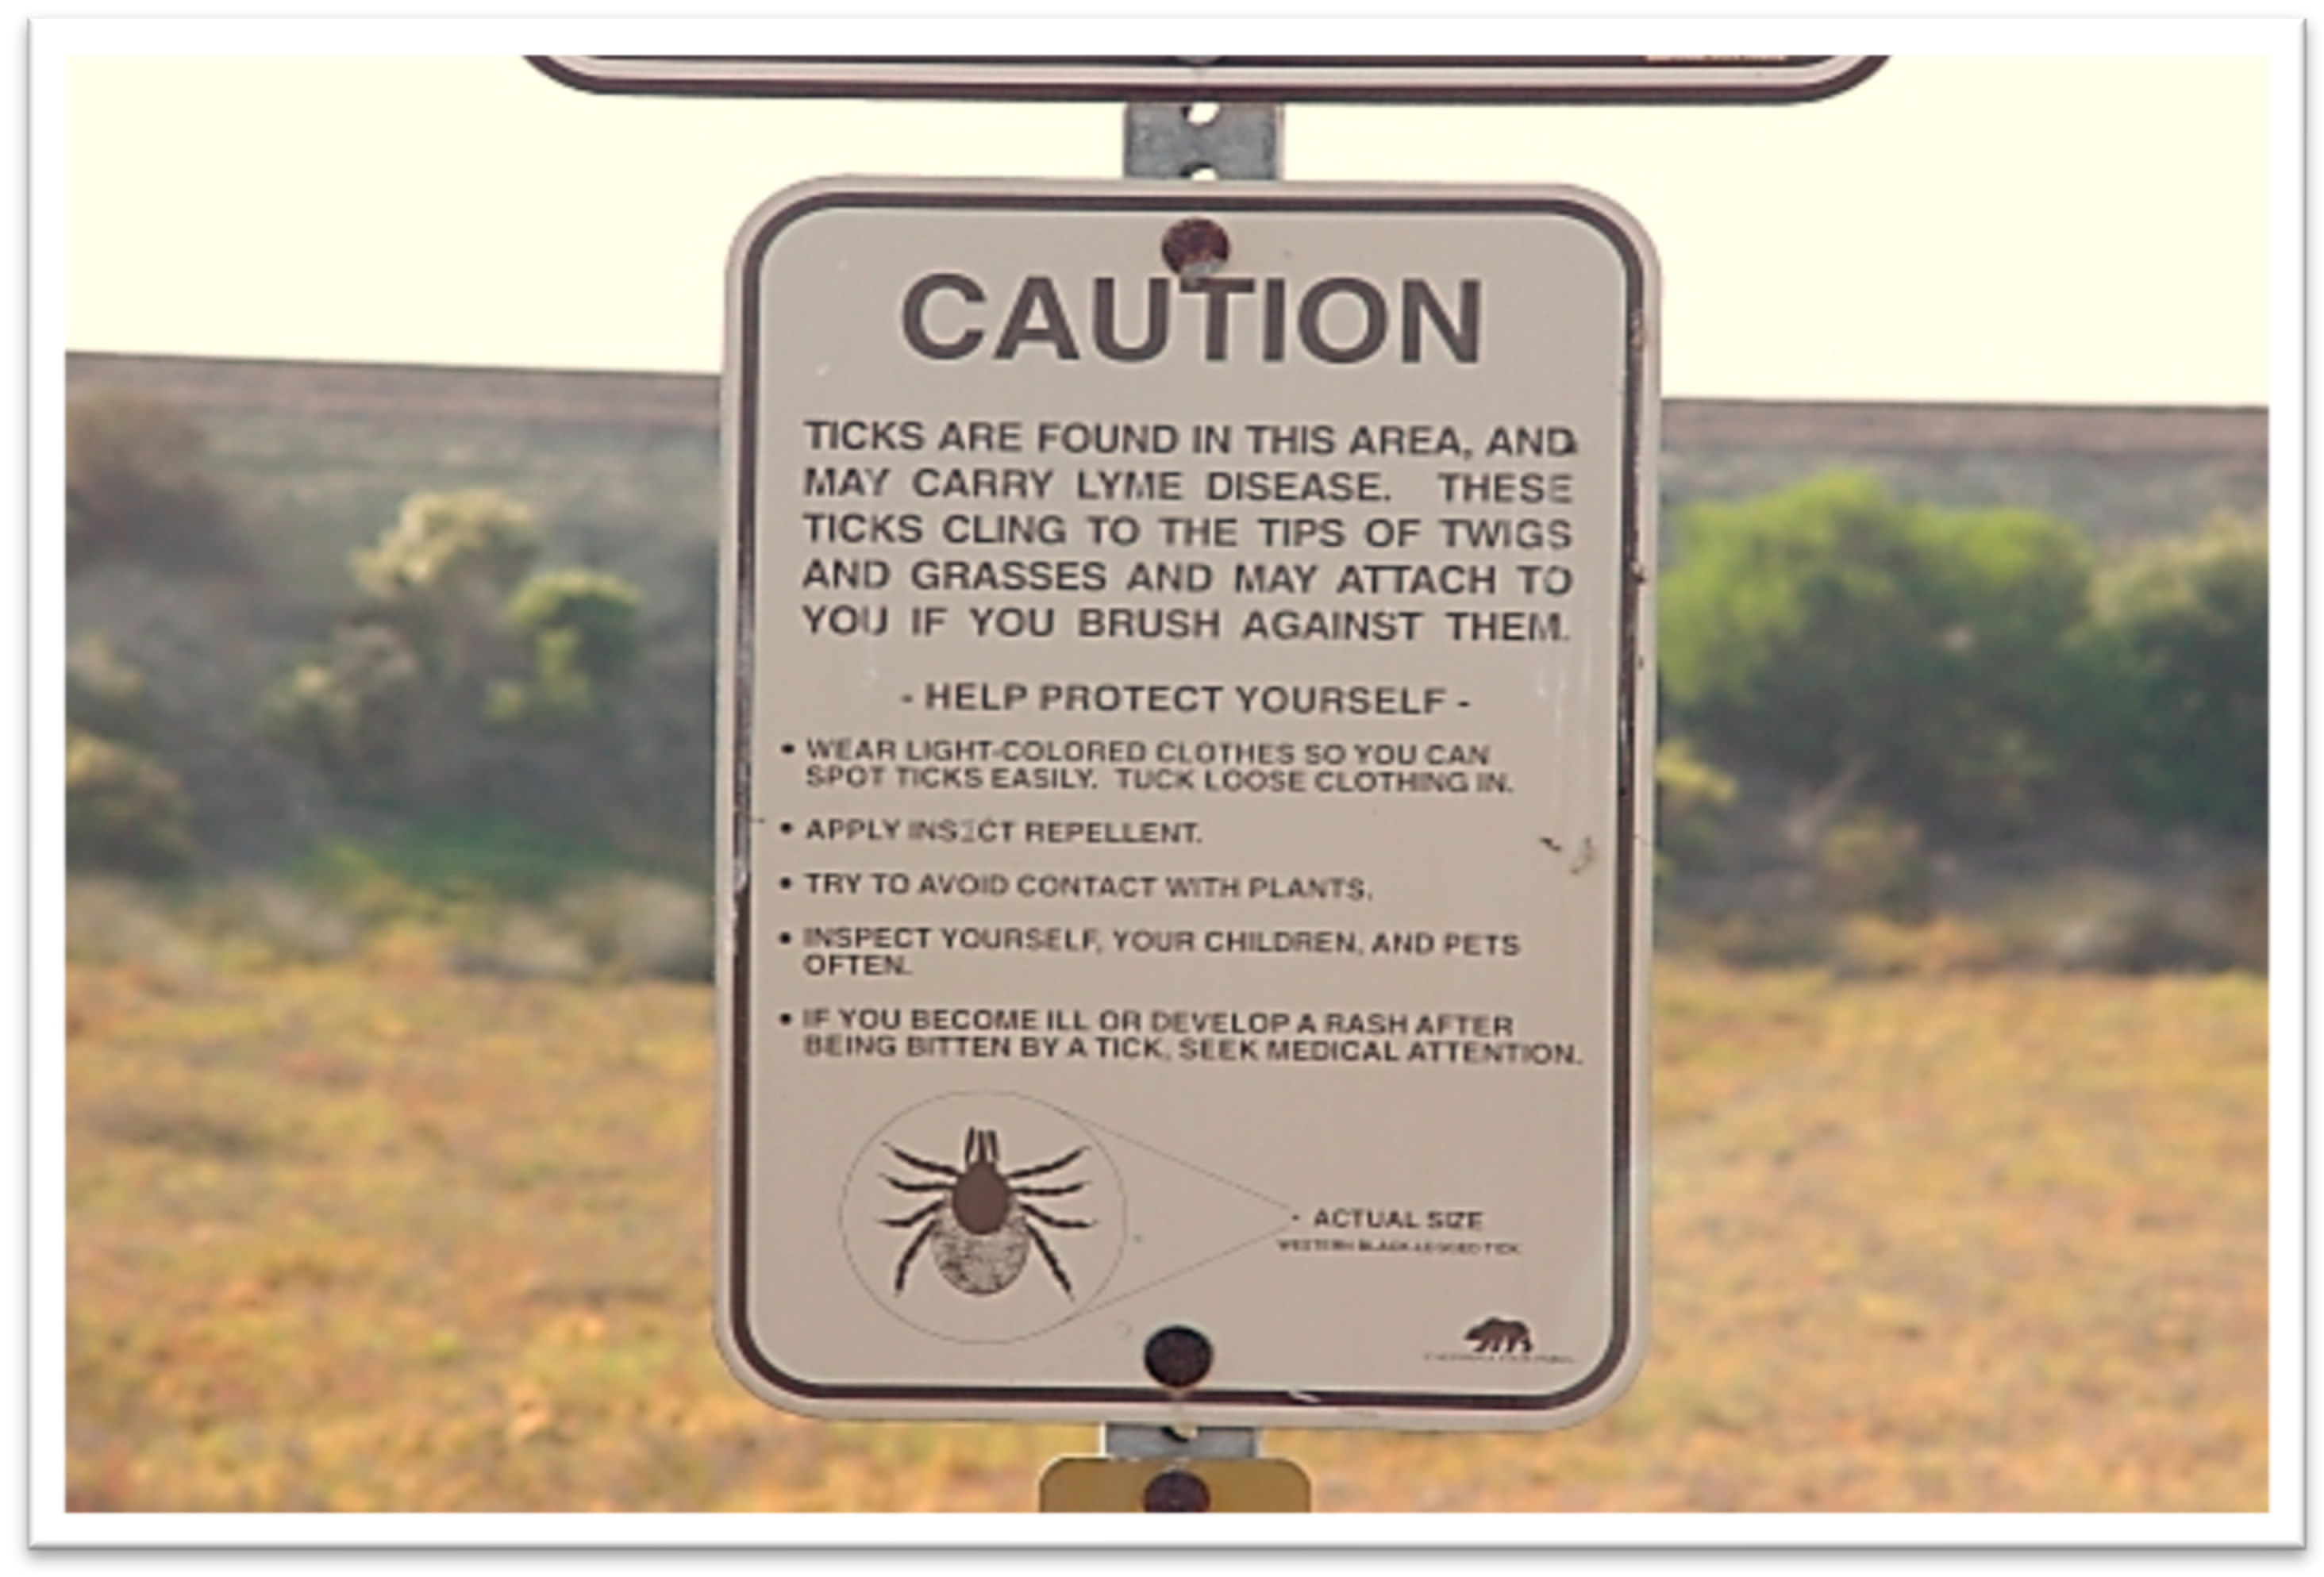
The results of our research correspond to this perspective. The different types of speech classes and drawings in the results show that there is not a system of homogeneous representations of TBR. There is instead a sense that the perception of TBR relies on the constructions of each individual or group of individuals as it relates to their spatial environment. The notion of a common sense about TBR emerges from a negotiation between these individuals and groups in accordance with their different anchorages and their personal, family, and socio-spatial experiences. This negotiation then relies more or less on the mobilization of their representation of nature. To understand the behavior towards ticks, and to improve prevention, it is thus necessary to understand the dynamics of negotiation between the objects of representation. The systemic dimension is then fundamental. If we start with the proposition that the spatialized representation of TBR is an actionable key to the understanding of behavior, then acting on this representation would suggest the need to also act on the environment. We can assume that the modification of an object of the representation tends to modify the other objects of the representation to some degree, more or less. Thus, a communication about Lyme borreliosis on a hiking trail, as seen in the example in Figure 9, will tend to transform the associated landscape object into a representation suggesting danger.
Our interpretation of the results encourages the use of spatialized risk-based prevention to further the sense of nature as an area beneficial to health while clarifying the notion of risk. This spatialization is even more important in view of the local territory of individuals. Even if contemporary lifestyles tend to be more mobile, the results of this study show that individuals practice most of their outdoor activities in close proximity to their place of residence, and some are even restricted to private spaces (gardening) as seen in other studies [36]. This is important with regard to prevention behaviors, which are more thoroughly integrated if they take into account the local adaptation, in the sense of people’s attachment to the places where they live [64,65]. Bour [66] addresses individuals’ appropriation of the “territory” they occupy through the notion of “psycho-territorial” anchoring. For her, the shared socio-spatial representations of a place or area emerge from the individuals’ feelings of attachment and belonging to the place where they live. This supports the idea that a localized prevention strategy for TBR can be useful [67]. Using socio-spatial representations to identify people’s interactions with a specific territory [68] can then facilitate the development of engaging communication in a prevention action that is favorable to lasting behavioral change [69]. For example, this might involve establishing programs at community centers to help local residents with risk management.
For this type of preventative action, it may be useful to underline a few aspects brought to light by the results of this study: (i) The absence of references to climate change, (ii) the need for better knowledge on tick biology, and (iii) better knowledge about potential tick habitats.
The effects of climate change do not appear in the data obtained from our interviews with participants even though it is an important and widely recognized element in the evolution of TBR [59,70,71]. Climatic change is modifying the phenology and distribution of ticks and therefore the diseases they transmit. It accentuates the current risk represented by indigenous ticks (Ixodes ricinus) and their pathogens: Wider spatial spread (especially in the mountains) and longer time distribution (with less severe winters). There is also a complementary risk represented by invasive exotic ticks from warmer regions, such as Hyalomma marginatum. These ticks could become a vector of new diseases in temperate zones, such as the South of France. It has been noted that the perception of local impacts from climate change tends to make people more responsible [72]. However, taking into account the notion of increased risk from climate change should not be allowed to accentuate the negative effect on the perceptions of nature and forests. This requires a better understanding of tick biology: The development cycle, its host-seeking strategy, habitats, densities, and ranges, and population dynamics. The link to spatialization is important to help us understand the differences in the risk when it is associated with different environments (a forest as compared to a garden, for example, or a deciduous forest, which is more suitable for ticks as compared to a coniferous forest), and also the differences inside the same environment (depending on the seasons, weather, spatial practices, etc.). This accentuates the need for localized intervention with the general public to avoid stereotypical and unnecessary negative representations associated with the environment.
5. Conclusions
The results obtained encourage us to go further to better understand the perception of TBR in the population. This study constituted an initial empirical approach to validate the theoretical proposition, which addressed this perception as a social representation in a system conditioned in part by a spatial dimension. It would appear logical to increase the size of the surveyed population by increasing the perimeter of the collection sites. Conducted in France’s central mountains (Massif Central), this study referred in particular to certain outdoor practices and a close proximity to a natural environment, both aspects that increase exposure to the risk of Lyme borreliosis, here more than in other French regions and differently than in some Western countries. These aspects can influence the responses, or even limit the identified Calder effect related to the spatial elements. Nevertheless, the methodological approach demonstrates its usefulness and effectiveness in understanding TBR and could be applied to other risk factors associated with socio-spatial dimensions, such as emerging diseases, technological risks, or climate change. In addition, it reinforces the proposal of a pre-iconographic analysis [52] by a more complete approach, including textual analysis, while bypassing the limits already identified in the chorematic approach that would have been ineffective here [47]. This confirms the value of this methodology for analyzing mental maps in the study of socio-spatial representations.
Author Contributions
Conceptualization, S.D.; methodology, S.D. and F.J.; software, S.D.; GIS, F.J.; validation, S.D. and F.J.; formal analysis, S.D. and F.J.; investigation, S.D. and F.J.; resources, S.D. and F.J.; data curation, S.D. and F.J.; writing—original draft preparation, S.D.; writing—review and editing, S.D. and F.J.; visualization, S.D. and F.J.; supervision, S.D. and F.J.; project administration, F.J.; funding acquisition, S.D. and F.J.
Funding
This research was funded by Emergence project 2017, I-Site Clermont-Ferrand CAP 20-25 initiative.
Acknowledgments
The authors wish to thank Ben Boswell for his precious assistance in final editing.
Conflicts of Interest
The authors declare no conflict of interest. The funders had no role in the design of the study, in the collection, analyses, or interpretation of data, in the writing of the manuscript, or in the decision to publish the results.
Appendix A

Table A1.
Types of drawings (n = 133).
| Characteristics | Number | % | |
|---|---|---|---|
| Types | Photographic | 69 | 51.9 |
| Schematic | 43 | 32.3 | |
| Cartographic | 12 | 9.0 | |
| Mixed | 7 | 5.3 | |
| Plan | 2 | 1.5 |
Table A2.
Scales of drawings (n = 133).
| Characteristics | Number | % | |
|---|---|---|---|
| Scales | Micro-local | 75 | 56.4 |
| Local | 20 | 15.0 | |
| Intermediate | 5 | 3.8 | |
| Regional | 1 | 0.8 | |
| (Inter)National | 1 | 0.8 | |
| Multi-scales | 15 | 11.3 | |
| Without scale | 16 | 12.0 |
Table A3.
Textual elements in drawings (n = 133).
| Characteristics | Number | % | |
|---|---|---|---|
| Textual elements | Yes | 41 | 30.8 |
| No | 92 | 69.2 |
Table A4.
Types of textual elements in drawings (n = 133).
| Characteristics | Number | % | |
|---|---|---|---|
| Types of textual elements | Nominative | 27 | 65.9 |
| Illustrative | 14 | 34.1 | |
| Legend | 0 | 0.0 |
Table A5.
Climate elements in drawings (n = 133).
| Characteristics | Number | % | |
|---|---|---|---|
| Climate | Yes | 29 | 21.8 |
| No | 104 | 78.2 |
Table A6.
Other elements in drawings (n = 133).
| Characteristics | Number | % | |
|---|---|---|---|
| Others | Yes | 26 | 19.5 |
| No | 107 | 80.5 |
Appendix B
B1. Typical original French transcript of verbalization in the “rural” class:
“C’est vite vu, je vais vous faire un endroit, là je fais une maison, voilà. Là je vais faire un petit sentier. Là je vais vous faire une forêt vite fait. Donc là la forêt, le petit sentier, petit sentier. Là je vais vous faire une étable, je marque étable, j’ai droit, une étable et puis là je vais mettre, je mets une clé, une petite barrière, un petit ruisseau, je marque ? Un petit ruisseau, là c’est champs, là il y a les herbes, des petites fleurs aussi. Là il y a la vache, moi je suis nul en dessin de toute façon, je suis nul, vache. Là je crois que c’est là le risque. Dans tous les cas, pour moi le risque il est en milieu rural il est pas en milieu urbain quoique… Ah non, il y a les chiens aussi, les chiens qui vont dans les herbes folles près des ruisseaux. Cela me fait penser un peu à la ferme chez mes parents, enfin vite fait quoi, parce que le bois… je ne pense pas. Hier je suis allé faire du bois j’en ai pas choppé et hier quand je suis allé donner la farine avec les vaches, il y en a des tiques elles en ont et les chiens nous en ramènent. Ah et dans le foin aussi, la petite botte de foin. Je suis un peu paysanne sur les bords…”
B2. Typical original French transcript of verbalization in the “natural” class:
“Alors moi je verrai bien un chemin parce que potentiellement plutôt de montagne, ce n’est pas un chemin balisé mais surtout pas un chemin goudronné. Des herbes, des herbes hautes un peu partout, sur le chemin ou à côté, des petits buissons à des endroits divers et variés. On ne va pas les mettre sur le chemin car s’il y a un chemin il y a pas de buisson, des arbres, voilà. […] De la forêt aussi, des petits arbres, des moyens arbres et potentiellement on ne reste pas que sur le chemin quand on se ballade et on peut aller à côté-là éventuellement où… On peut se croire en sécurité mais on l’est pas toujours… C’est ça l’idée pour moi, à la fois de l’herbe des arbres, de la végétation.”
B3. Typical original French transcript of verbalization in the “recreational” class:
“Ben c’est, ça peut être en pleine nature dans une forêt. Une forêt environnante de la chaîne des Puys par exemple. Voilà. Si j’évolue avec peu de protections au niveau des jambes, des bras, à l’occasion d’une recherche de champignons par exemple. Je ne sais pas si ça ressemble à des champignons, voilà champignons. La forêt… Après ça peut être au cours d’un pique-nique convivial dans la nature au bord d’un lac dans l’herbe. On peut faire un lac ? Je peux écrire, donc lac. C’est minimaliste comme dessin, lac. Après on est dans les herbes, les herbes, dans les fleurs et puis on est allongé là-dedans, ou assis, on se repose on se détend, des moments comme ça. Ça peut–être aussi dans le jardin. J’ai un jardin potager avec des légumes. Je suis dedans je travaille ma terre, et puis potager. Autour il y a aussi de l’herbe et ça peut être dedans aussi à cette occasion-là. Disons que je travaille mon jardin, je ne suis pas très bonne en dessin, c’est pas un concours artistique mais par exemple je voudrais faire un outil, genre une bêche, sachant que je bêche pas en plein été ce serait plutôt une fourche peut-être une binette, dans le potager […] Donc cueillette en forêt, champignons, lac, pique-nique, jardinage, c’est des situations.”
B4. Typical original French transcript of verbalization in the “contrasting” class:
“Alors moi ce qui me vient à l’esprit c’est de l’herbe, ce n’est pas trop dur mais c’est très mal dessiné. Et après, ça peut être à la campagne mais ça peut être dans un jardin en ville. J’en ai attrapé il n’y a pas si longtemps que cela dans un jardin en ville. Du moment qu’il y a de l’herbe pour moi c’est partout où il y a de l’herbe et des animaux souvent. Ça peut être des chiens ou autre chose mais c’est tout. Moi où on les rencontre c’est dans l’herbe.”
B5. Typical original French transcript of verbalization in the “contrasting” class:
“Je sais pas, je sais pas où elles sont dans la nature mais là où j’aurai peur de me faire piquer c’est admettons que l’on soit dans ma chambre, là j’ai mon lit, il y a mon chien qui est allongé dessus, moi je suis ici et puis pour je ne sais quelle raison il se gratte et la tique elle sort de son pelage et elle vient sur moi. Moi c’est là que j’aurai le plus peur de me faire piquer. Je ne sais pas s’il y en a dans la nature où quoi que ce soit, sur la couverture oui… ”
References
- World Health Organization (WHO). Vector-Borne Diseases. Available online: https://www.who.int/mediacentre/factsheets/fs387/en/index10.html (accessed on 23 January 2019).
- Greenspan, J. Rising Above Lyme Disease: A Revolutionary, Holistic Approach to Managing and Reversing the Symptoms of Lyme Disease and Reclaiming Your Life; Fair Winds Press: Beverly, MA, USA, 2019; ISBN 978-1-63159-689-6. [Google Scholar]
- Jongejan, F.; Uilenberg, G. The global importance of ticks. Parasitology 2005, 129, S3–S14. [Google Scholar] [CrossRef]
- Peretti-Watel, P.; Ward, J.; Lutaud, R.; Seror, V. Lyme disease: Insight from social sciences. Médecine et Maladies Infectieuses 2019, in press. [Google Scholar] [CrossRef] [PubMed]
- Mowbray, F.; Amlôt, R.; Rubin, G.J. Predictors of protective behaviour against ticks in the UK: A mixed methods study. Ticks Tick-Borne Dis. 2014, 5, 392–400. [Google Scholar] [CrossRef] [PubMed]
- Butler, A.D.; Sedghi, T.; Petrini, J.R.; Ahmadi, R. Tick-borne disease preventive practices and perceptions in an endemic area. Ticks Tick-Borne Dis. 2016, 7, 331–337. [Google Scholar] [CrossRef] [PubMed]
- Bayles, B.R.; Evans, G.; Allan, B.F. Knowledge and prevention of tick-borne diseases vary across an urban-to-rural human land-use gradient. Ticks Tick-Borne Dis. 2013, 4, 352–358. [Google Scholar] [CrossRef] [PubMed]
- Zöldi, V.; Turunen, T.; Lyytikäinen, O.; Sane, J. Knowledge, attitudes, and practices regarding ticks and tick-borne diseases, Finland. Ticks Tick-Borne Dis. 2017, 8, 872–877. [Google Scholar] [CrossRef] [PubMed]
- Van der Heijden, A.; Mulder, B.C.; Poortvliet, P.M.; van Vliet, A.J.H. Social-cognitive determinants of the tick check: A cross-sectional study on self-protective behavior in combatting Lyme disease. BMC Public Health 2017, 17, 900. [Google Scholar] [CrossRef]
- Šumilo, D.; Bormane, A.; Asokliene, L.; Lucenko, I.; Vasilenko, V.; Randolph, S. Tick-borne encephalitis in the Baltic States: Identifying risk factors in space and time. Int. J. Med. Microbiol. 2006, 296, 76–79. [Google Scholar] [CrossRef]
- Woolhouse, M.E.J.; Dye, C.; Randolph Sarah, E. The shifting landscape of tick-borne zoonoses: Tick-borne encephalitis and Lyme borreliosis in Europe. Philos. Trans. R. Soc. Lond. Ser. B Biol. Sci. 2001, 356, 1045–1056. [Google Scholar] [CrossRef]
- De Keukeleire, M.; Robert, A.; Luyasu, V.; Kabamba, B.; Vanwambeke, S.O. Seroprevalence of Borrelia burgdorferi in Belgian forestry workers and associated risk factors. Parasit. Vectors 2018, 11, 277. [Google Scholar] [CrossRef]
- Aenishaenslin, C.; Bouchard, C.; Koffi, J.K.; Ogden, N.H. Exposure and preventive behaviours toward ticks and Lyme disease in Canada: Results from a first national survey. Ticks Tick-Borne Dis. 2017, 8, 112–118. [Google Scholar] [CrossRef]
- Macintyre, S.; Ellaway, A.; Cummins, S. Place effects on health: How can we conceptualise, operationalise and measure them? Soc. Sci. Med. 2002, 55, 125–139. [Google Scholar] [CrossRef]
- Vallée, J.; Cadot, E.; Grillo, F.; Parizot, I.; Chauvin, P. The combined effects of activity space and neighbourhood of residence on participation in preventive health-care activities: The case of cervical screening in the Paris metropolitan area (France). Health Place 2010, 16, 838–852. [Google Scholar] [CrossRef]
- Aenishaenslin, C.; Michel, P.; Ravel, A.; Gern, L.; Milord, F.; Waaub, J.-P.; Bélanger, D. Factors associated with preventive behaviors regarding Lyme disease in Canada and Switzerland: A comparative study. BMC Public Health 2015, 15. [Google Scholar] [CrossRef]
- Braks, M.A.H.; Mulder, A.C.; Swart, A.; Wint, W. Grasping risk mapping. In Ecology and Prevention of Lyme Borreliosis; Ecology and Control of Vector-borne diseases; Wageningen Academic Publishers: Wageningen, The Netherlands, 2016; Volume 4, pp. 351–371. ISBN 978-90-8686-293-1. [Google Scholar]
- Meha, C. Influence de la structure du paysage forestier sur l’exposition des populations humaines aux tiques. Le cas de la borréliose de Lyme en forêt de Sénart (Île-de-France) (Influence of forest landscape structures on human populations ’ exposure to ticks. The case of Lyme borreliosis in Sénart forest). Bullet. de l’Association de Géographes Français 2012, 89, 255–266. [Google Scholar]
- Méha, C.; Godard, V.; Moulin, B.; Haddad, H. La borréliose de Lyme: Un risque sanitaire émergent dans les forêts franciliennes? Cybergeo Eur. J. Geogr. 2012. [Google Scholar] [CrossRef]
- Dias, P.; Ramadier, T. Social trajectory and socio-spatial representation of urban space: The relation between social and cognitive structures. J. Environ. Psychol. 2015, 41, 135–144. [Google Scholar] [CrossRef]
- Karine, W.; Rateau, P. Psychologie Sociale et Environnementale. 2018; in press. [Google Scholar]
- Kouabénan, D.R.; Cadet, B.; Hermand, D.; Sastre, M.T.M. Introduction. Psychologie du Risque ou Pourquoi Étudier la Perception et L’évaluation du Risque; De Boeck Supérieur: Louvain-La-Neuve, Belgique, 2007; ISBN 978-2-8041-5543-8. [Google Scholar]
- Joffe, H. Risk: From perception to social representation. Br. J. Soc. Psychol. 2003, 42, 55–73. [Google Scholar] [CrossRef]
- Chesterman, A.; Lopez, A.; Rateau, P.; Weiss, K. When factors of risk perception are an obstacle to risk representation: Earthquakes in Southern France. Revue Européenne de Psychologie Appliquée 2019. [Google Scholar] [CrossRef]
- Krien, N.; Michel-Guillou, É. Place des risques côtiers dans les représentations sociales du cadre de vie d’habitants de communes littorales. Les Cahiers Internationaux de Psychologie Sociale 2014, 101, 101–122. [Google Scholar] [CrossRef]
- Dias, P.; Ramadier, T. Representational Structures as Stances: Examining Relationships to the City Under the Lens of Socio-Spatial Representations. Int. Rev. Soc. Psychol. 2018, 31, 24. [Google Scholar] [CrossRef]
- Jodelet, D. La représentation: Notion transversale, outil de la transdisciplinarité. Cadernos de Pesquisa 2016, 46, 1258–1271. [Google Scholar] [CrossRef]
- De Alba, M. A methodological approach to the study of urban memory: Narratives about Mexico City. Forum: Qualitative Sozialforschung/Forum Qual. Soc. Res. 2012, 13, Art.27. [Google Scholar] [CrossRef]
- De Alba González, M. Teorías en diálogo: Representaciones sociales y memoria colectiva. Iztapalapa: Revista de Ciencias Sociales y Humanidades 2016, 37, 131–151. [Google Scholar] [CrossRef]
- Haas, V. Approche psychosociale d’une reconstruction historique. Le cas vichyssois. Les cahiers Internationaux de Psychologie Sociale 2002, 53, 32–45. [Google Scholar]
- Vourc’h, G.; Abrial, D.; Bord, S.; Jacquot, M.; Masséglia, S.; Poux, V.; Pisanu, B.; Bailly, X.; Chapuis, J.-L. Mapping human risk of infection with Borrelia burgdorferi sensu lato, the agent of Lyme borreliosis, in a periurban forest in France. Ticks Tick-Borne Dis. 2016, 7, 644–652. [Google Scholar] [CrossRef]
- Wierzbicka, A.; Rączka, G.; Skorupski, M.; Michalik, J.; Lane, R.S. Human behaviors elevating the risk of exposure to Ixodes ricinus larvae and nymphs in two types of lowland coniferous forests in west-central Poland. Ticks Tick-Borne Dis. 2016, 7, 1180–1185. [Google Scholar] [CrossRef] [PubMed]
- De Keukeleire, M.; Vanwambeke, S.O.; Somassè, E.; Kabamba, B.; Luyasu, V.; Robert, A. Scouts, forests, and ticks: Impact of landscapes on human-tick contacts. Ticks Tick-Borne Dis. 2015, 6, 636–644. [Google Scholar] [CrossRef]
- Randolph, S.E. Human activities predominate in determining changing incidence of tick-borne encephalitis in Europe. Eurosurveillance 2010, 15, 19606. [Google Scholar] [CrossRef]
- Noden, B.H.; Loss, S.R.; Maichak, C.; Williams, F. Risk of encountering ticks and tick-borne pathogens in a rapidly growing metropolitan area in the U.S. Great Plains. Ticks Tick-Borne Dis. 2017, 8, 119–124. [Google Scholar] [CrossRef]
- Mead, P.; Hook, S.; Niesobecki, S.; Ray, J.; Meek, J.; Delorey, M.; Prue, C.; Hinckley, A. Risk factors for tick exposure in suburban settings in the Northeastern United States. Ticks Tick-Borne Dis. 2018, 9, 319–324. [Google Scholar] [CrossRef]
- Kitron, U.; Kazmierczak, J.J. Spatial Analysis of the Distribution of Lyme Disease in Wisconsin. Am. J. Epidemiol. 1997, 145, 558–566. [Google Scholar] [CrossRef] [PubMed]
- George, J.C.; Chastel, C. Maladies vectorielles à tiques et modifications de l’écosystème en Lorraine. Bull. Soc. Pathol. Exot. 2002, 95, 95–100. [Google Scholar] [PubMed]
- Papillon, P.; Dodier, R. Periurban forests shifting from recreation to wellness. J. Alpine Res. Revue de Géographie Alpine 2011. [Google Scholar] [CrossRef]
- Vallée, J.; Cadot, E.; Roustit, C.; Parizot, I.; Chauvin, P. The role of daily mobility in mental health inequalities: The interactive influence of activity space and neighbourhood of residence on depression. Soc. Sci. Med. 2011, 73, 1133–1144. [Google Scholar] [CrossRef]
- Rémy, J. Compte rendu thématique. Espaces et Sociétés 2004, 118, 251–266. [Google Scholar] [CrossRef]
- Carpentier, S. Une analyse exploratoire des liens entre mobilité quotidienne et ancrage résidentiel. Vers une approche écologique de la mobilité? Articulo J. Urban Res. 2007, 3. [Google Scholar] [CrossRef]
- Depeau, T.R. Se déplacer Pour se Situer; Presses Universitaires de Rennes: Rennes, France, 2016; ISBN 978-2-7535-3674-6. [Google Scholar]
- Halos, L.; Bord, S.; Cotté, V.; Gasqui, P.; Abrial, D.; Barnouin, J.; Boulouis, H.-J.; Vayssier-Taussat, M.; Vourc’h, G. Ecological Factors Characterizing the Prevalence of Bacterial Tick-Borne Pathogens in Ixodes ricinus Ticks in Pastures and Woodlands. Appl. Environ. Microbiol. 2010, 76, 4413–4420. [Google Scholar] [CrossRef]
- Beytout, J.; George, J.C.; Malaval, J.; Garnier, M.; Beytout, M.; Baranton, G.; Ferquel, E.; Postic, D. Lyme Borreliosis Incidence in Two French Departments: Correlation with Infection of Ixodes ricinus Ticks by Borrelia burgdorferi Sensu Lato. Vector-Borne Zoonotic Dis. 2007, 7, 507–518. [Google Scholar] [CrossRef]
- Lambin, E.F.; Tran, A.; Vanwambeke, S.O.; Linard, C.; Soti, V. Pathogenic landscapes: Interactions between land, people, disease vectors, and their animal hosts. Int. J. Health Geogr. 2010, 9, 54. [Google Scholar] [CrossRef]
- Dernat, S.; Johany, F.; Lardon, S. Identifying choremes in mental maps to better understand socio-spatial representations. Cybergeo Eur. J. Geogr. 2016. [Google Scholar] [CrossRef]
- Flick, U. Doing Triangulation and Mixed Methods; SAGE: Newcastle upon Tyne, UK, 2018; ISBN 978-1-5264-2622-2. [Google Scholar]
- Sammut, G.; Andreouli, E.; Gaskell, G.; Valsiner, J. The Cambridge Handbook of Social Representations; Cambridge University Press: Cambridge, UK, 2015; ISBN 978-1-107-04200-1. [Google Scholar]
- Gieseking, J.J. Where We Go from Here: The Mental Sketch Mapping Method and Its Analytic Components. Qual. Inq. 2013, 19, 712–724. [Google Scholar] [CrossRef]
- Lardon, S.; Maurel, P.; Piveteau, V. Représentations Spatiales et Développement Territorial; Hermès Science: Paris, France, 2001; ISBN 978-2-7462-0252-8. [Google Scholar]
- Moel, B.L.; Moliner, P.; Ramadier, T. Représentation sociale du milieu marin et iconographie du territoire chez des élus de communes littorales françaises. VertigO-la Revue Électronique en Sciences de L’environnement 2015, 15. [Google Scholar] [CrossRef]
- Husson, F.; Josse, J.; Pagès, J. Analyse de données avec R—Complémentarité des méthodes d’analyse factorielle et de classification. In Proceedings of the 42èmes Journées de Statistique, Marseille, France, 25–29 May 2010. [Google Scholar]
- Reinert, A. Une méthode de classification descendante hiérarchique: Application à l’analyse lexicale par contexte. Les Cahiers de L’analyse de Données 1983, 8, 187–198. [Google Scholar]
- De Souza, M.A.R.; Wall, M.L.; de Thuler, A.C.M.C.; Lowen, I.M.V.; Peres, A.M. O uso do software IRAMUTEQ na análise de dados em pesquisas qualitativas. Revista da Escola de Enfermagem da USP 2018, 52. [Google Scholar] [CrossRef]
- Chaves, M.M.N.; dos Santos, A.P.R.; dos Santosa, N.P.; Larocca, L.M. Use of the Software IRAMUTEQ in Qualitative Research: An Experience Report. In Computer Supported Qualitative Research; Costa, A.P., Reis, L.P., de Sousa, F.N., Moreira, A., Lamas, D., Eds.; Studies in Systems, Decision and Control; Springer International Publishing: Cham, Switzerland, 2017; pp. 39–48. ISBN 978-3-319-43270-0. [Google Scholar]
- Keukeleire, M.D.; Robert, A.; Kabamba, B.; Dion, E.; Luyasu, V.; Vanwambeke, S.O. Individual and environmental factors associated with the seroprevalence of Borrelia burgdorferi in Belgian farmers and veterinarians. Infect. Ecol. Epidemiol. 2016, 6, 32793. [Google Scholar] [CrossRef]
- Lindsay, L.; Ogden, N.; Schofield, S. Examen des méthodes visant à prévenir et à réduire le risque de contracter la maladie de Lyme. Relevé des Maladies Transmissibles au Canada 2015, 41, 169–177. [Google Scholar] [CrossRef]
- Jore, S.; Vanwambeke, S.O.; Viljugrein, H.; Isaksen, K.; Kristoffersen, A.B.; Woldehiwet, Z.; Johansen, B.; Brun, E.; Brun-Hansen, H.; Westermann, S.; et al. Climate and environmental change drives Ixodes ricinus geographical expansion at the northern range margin. Parasites Vectors 2014, 7, 11. [Google Scholar] [CrossRef]
- Hansen, M.M.; Jones, R.; Tocchini, K. Shinrin-Yoku (Forest Bathing) and Nature Therapy: A State-of-the-Art Review. Int. J. Environ. Res. Public Health 2017, 14, 851. [Google Scholar] [CrossRef]
- Ramadier, T. Adjustment to Geographical Space and Psychological Well-Being. In Handbook of Environmental Psychology and Quality of Life Research; Fleury-Bahi, G., Pol, E., Navarro, O., Eds.; International Handbooks of Quality-of-Life; Springer International Publishing: Cham, Switzerland, 2017; pp. 291–307. ISBN 978-3-319-31414-3. [Google Scholar]
- Dernat, S.; Siméone, A. A socio-spatial dimension of career choices in veterinary education. Br. J. Guid. Couns. 2018, 1–19. [Google Scholar] [CrossRef]
- Bauer, M.W.; Gaskell, G. Social representations theory: A progressive research programme for social psychology. J. Theory Soc. Behav. 2008, 38, 335–353. [Google Scholar] [CrossRef]
- Weiss, K.; Marchand, D. Psychologie Sociale de L’environnement; Presses Universitaires de Rennes: Rennes, France, 2006; ISBN 2-7535-0312-5. [Google Scholar]
- Rouifed, S.; Cottet, M.; de Battista, M.; Le Lay, Y.-F.; Piola, F.; Rateau, P.; Rivière-Honegger, A. Landscape perceptions and social representations of Fallopia spp. in France. Sci. Nat. 2018, 105, 67. [Google Scholar] [CrossRef]
- Bour, E. Les Représentations de L’identité Communale: Psychosociologie d’un Village re-Composé, Gigouzac. Ph.D. Thesis, Université Toulouse le Mirail-Toulouse II, Toulouse, France, 2013. [Google Scholar]
- Bouchard, C.; Aenishaenslin, C.; Rees, E.E.; Koffi, J.K.; Pelcat, Y.; Ripoche, M.; Milord, F.; Lindsay, L.R.; Ogden, N.H.; Leighton, P.A. Integrated Social-Behavioral and Ecological Risk Maps to Prioritize Local Public Health Responses to Lyme Disease. Environ. Health Perspect. 2018, 126, 047008. [Google Scholar] [CrossRef]
- Dias, P.; Ramadier, T. Relations sociales et cartographie cognitive. Les points de référence comme noyau central des représentations spatiales. Les Cahiers Internationaux de Psychologie Sociale 2017, 116, 319–349. [Google Scholar] [CrossRef]
- Rateau, P.; Weiss, K. Psychologie sociale appliquée à l’environnement. Prat. Psychol. 2011, 17, 213–218. [Google Scholar] [CrossRef]
- Semenza, J.C.; Suk, J.E. Vector-borne diseases and climate change: A European perspective. FEMS Microbiol. Lett. 2018. [Google Scholar] [CrossRef]
- Ostfeld, R.S.; Brunner, J.L. Climate change and Ixodes tick-borne diseases of humans. Phil. Trans. R. Soc. B 2015, 370, 20140051. [Google Scholar] [CrossRef]
- Michel-Guillou, É.; Richard, I.; Weiss, K. Évaluation locale d’un problème global: La représentation sociale du changement climatique en France et au Groenland, Local Evaluation of a Global Problem: The Social Representation of Climate Change in France and Greenland. Bullet. Psychol. 2017, 548, 117–129. [Google Scholar] [CrossRef]
Figure 1.
Maps of the collection area.

Figure 2.
Map of the locations indicated in the participants’ drawings.

Figure 3.
Dendrogram of the hierarchical clustering.

Figure 4.
Example of a typical drawing in class 1.

Figure 5.
Example of a typical drawing in class 2.

Figure 6.
Example of a typical drawing in class 3.

Figure 7.
Example of a typical drawing in class 4.

Figure 8.
Dendrogram resulting from the textual analysis of the interviewees’ recorded verbalization during the drawing of mental maps (n = 133).
Figure 8.
Dendrogram resulting from the textual analysis of the interviewees’ recorded verbalization during the drawing of mental maps (n = 133).

Figure 9.
Caution sign about ticks at the entrance to Del Mar—Carmel Valley Road trail in Los Penasquitos Lagoon, California, USA (Simnia, Wikimedia Commons, Self-published work).
Figure 9.
Caution sign about ticks at the entrance to Del Mar—Carmel Valley Road trail in Los Penasquitos Lagoon, California, USA (Simnia, Wikimedia Commons, Self-published work).

Table 1.
Distribution of surveyed population (n = 143).
| Collect Sites | Number | % of Area | % Global |
|---|---|---|---|
| Urban area | 95 | 100 | 66.4 |
| Clermont-Ferrand | 26 | 27.3 | 18.2 |
| Chamalières | 26 | 27.3 | 18.2 |
| Orcines | 13 | 13.7 | 9.1 |
| Nohanent | 30 | 31.7 | 21.0 |
| Rural area | 48 | 100 | 33.6 |
| Les Ancizes | 6 | 12.5 | 4.2 |
| Saint-Georges-de-Mons | 11 | 22.9 | 7.7 |
| Saint-Gervais-d’Auvergne | 22 | 45.8 | 15.4 |
| Saint-Eloy-les-Mines | 9 | 18.7 | 6.3 |
Table 2.
Characteristics of the interviewed population (n = 143).
| Characteristics | Number | % | |
|---|---|---|---|
| Gender | Women | 81 | 56.64 |
| Men | 62 | 43.36 | |
| Age | Average | 52 | |
| Median | 55 | ||
| Age groups | 0–19 1 | 10 | 06.99 |
| 20–39 | 31 | 21.68 | |
| 40–59 | 39 | 27.27 | |
| 60–74 | 53 | 37.06 | |
| >74 | 10 | 6.99 | |
| Living environment | Rural | 60 | 41.96 |
| Periurban | 38 | 26.57 | |
| Urban | 45 | 31.47 | |
| Socio-professional categories 2 | Farmers | 2 | 1.4 |
| Craftsmen, tradesmen | 10 | 6.99 | |
| Managers, intellectual professions | 35 | 24.48 | |
| Employees, workers | 23 | 16.08 | |
| Intermediate professions | 9 | 6.29 | |
| Students | 16 | 11.19 | |
| Retirees or without professions | 48 | 33.57 | |
| Average monthly household income | 4000 € and more | 20 | 13.99 |
| Between 2500 € and 3999 € | 30 | 20.98 | |
| Between 1000 € and 2499 € | 71 | 46.65 | |
| Less than 1000 € | 22 | 15.38 | |
1 Interviews with minor respondents, subsequent to parental consent. 2 According to the nomenclature of the French national institute of economic statistics (INSEE).
Table 3.
Outdoor activities practiced by respondents (n = 143).
| Outdoor Activities | Number | % |
|---|---|---|
| Nearby walks, picnic… | 138 | 96.5 |
| Hiking | 131 | 91.61 |
| Gardening | 121 | 84.62 |
| Mountain biking/cycling | 62 | 43.36 |
| Snow sports | 56 | 39.16 |
| Cutting wood | 52 | 36.36 |
| Canoeing and water sports | 49 | 34.27 |
| Climbing | 30 | 20.98 |
| Running | 28 | 19.58 |
| Fishing/hunting | 27 | 18.88 |
| Riding | 9 | 6.29 |
| Other outdoor activities 1 | 11 | 7.69 |
1 Painting, yoga, etc.
Table 4.
Knowledge of tick bites among respondents (n = 143).
| Characteristics | Number | % | |
|---|---|---|---|
| Tick bites experience | Bitten several times | 59 | 41.3 |
| Bitten once | 16 | 11.2 | |
| Bites on family, friends | 39 | 27.3 | |
| Bites on family pets | 14 | 9.8 | |
| Heard about bites | 5 | 3.5 | |
| Nothing | 9 | 6.3 | |
| Knowledge of places conducive to being bitten | Good | 35 | 24.5 |
| Medium | 86 | 60.1 | |
| None | 21 | 14.7 | |
| Knowledge about prevention means | Good | 17 | 11.9 |
| Medium | 69 | 48.3 | |
| None | 57 | 39.9 |
Table 5.
Type of representation in the drawings (n = 133).
| Characteristics | Number | % | |
|---|---|---|---|
| Place | Imagined | 62 | 46.6 |
| Real | 71 | 53.4 |
Table 6.
Presence of humans, ticks, and animals in drawings (n = 133).
| Presence | Number | % | |
|---|---|---|---|
| Humans | Yes | 28 | 21.1 |
| No | 105 | 78.9 | |
| Ticks | Yes | 18 | 13.5 |
| No | 115 | 86.5 | |
| Animals | Yes | 39 | 29.3 |
| No | 94 | 70.7 |
Table 7.
Landscape elements in drawings (n = 133).
| Characteristics | Number | % | |
|---|---|---|---|
| Forested | Yes | 102 | 76.7 |
| No | 31 | 23.3 | |
| Plants (without trees) | Yes | 108 | 81.2 |
| No | 25 | 18.8 | |
| Pathways | Yes | 65 | 48.9 |
| No | 68 | 51.1 | |
| Buildings | Yes | 19 | 14.3 |
| No | 114 | 85.7 | |
| Reliefs | Yes | 29 | 21.8 |
| No | 104 | 78.2 | |
| Water environment | Yes | 22 | 16.5 |
| No | 111 | 83.5 |
Table 8.
Verbalization classes from the textual analysis with the sample and drawing variable (n = 133).
Table 8.
Verbalization classes from the textual analysis with the sample and drawing variable (n = 133).
| “Rural” | “Natural” | ||||
| Variable | X2 | p | Variable | χ2 | p |
| Expbite_none | 8.03 | <0.05 | Cat-comchannels_yes | 4.29 | <0.05 |
| Cat-animals_yes | 7.52 | <0.05 | Cat-climat_yes | 3.88 | <0.05 |
| Fishing_yes | 6.66 | <0.05 | Class_drawing_4 | 4.41 | <0.05 |
| Woodcutting_yes | 3.29 | <0.05 | Actdistance_1/week | 2.4 | <0.05 |
| Diploma_vocationnal | 5.54 | <0.05 | Occup_group_3 | 3.29 | <0.05 |
| Occup-group_1 | 5.51 | <0.05 | Agerange_40-59 | 2.49 | <0.05 |
| Class_drawing_1 | 4.92 | <0.05 | Income_2500-4000€ | 8.25 | <0.05 |
| Agerange_60-74 | 4.62 | <0.05 | Area_periurban | 3.61 | <0.05 |
| Agerange_75+ | 2.93 | <0.05 | |||
| Area_rural | 4.57 | <0.05 | |||
| Occup-group_6 | 2.65 | <0.05 | |||
| “Recreational” | “Contrasting” | ||||
| Variable | X2 | p | Variable | χ2 | p |
| Actdistance_2-3/month | 2.84 | <0.05 | Cat-others_yes | 12.55 | <0.05 |
| Class_drawing _4 | 5.49 | <0.05 | Cat-building_yes | 4.36 | <0.05 |
| Sex_w | 5.89 | <0.05 | Actdistance_rare | 8.22 | <0.05 |
| Agerange_0-19 | 4.68 | <0.05 | |||
| Agerange_20-39 | 2.78 | <0.05 | |||
| Running_yes | 2.2 | <0.05 | |||
| Area_periurban | 2.06 | <0.05 | |||
| Area_urban | 2.16 | <0.05 | |||
| Class_drawing _2 | 2.39 | <0.05 | |||
| Class_drawing _3 | 3.68 | <0.05 | |||
© 2019 by the authors. Licensee MDPI, Basel, Switzerland. This article is an open access article distributed under the terms and conditions of the Creative Commons Attribution (CC BY) license (http://creativecommons.org/licenses/by/4.0/).
Share and Cite
MDPI and ACS Style
Dernat, S.; Johany, F. Tick Bite Risk as a Socio-Spatial Representation—An Exploratory Study in Massif Central, France. Land 2019, 8, 46. https://0-doi-org.brum.beds.ac.uk/10.3390/land8030046
AMA Style
Dernat S, Johany F. Tick Bite Risk as a Socio-Spatial Representation—An Exploratory Study in Massif Central, France. Land. 2019; 8(3):46. https://0-doi-org.brum.beds.ac.uk/10.3390/land8030046
Chicago/Turabian StyleDernat, Sylvain, and François Johany. 2019. "Tick Bite Risk as a Socio-Spatial Representation—An Exploratory Study in Massif Central, France" Land 8, no. 3: 46. https://0-doi-org.brum.beds.ac.uk/10.3390/land8030046
Note that from the first issue of 2016, this journal uses article numbers instead of page numbers. See further details here.