Mapping the Loss of Ecosystem Services in a Region Under Intensive Land Use Along the Southern Coast of South Africa


1
Strategic Landscape Planning and Management, School of Life Sciences Weihenstephan, Technical University of Munich, Emil-Ramann-Str. 6, 85354 Freising, Germany
2
Department of Forestry, Weihenstephan-Triesdorf University of Applied Sciences, Hans-Carl-von-Carlowitz-Platz 3, 85354 Freising, Germany
*
Author to whom correspondence should be addressed.
Land 2019, 8(3), 51; https://0-doi-org.brum.beds.ac.uk/10.3390/land8030051
Submission received: 21 February 2019
/
Revised: 15 March 2019
/
Accepted: 15 March 2019
/
Published: 21 March 2019
(This article belongs to the Special Issue Towards the Sustainable Management of Ecosystem Services in Social-Ecological Systems)
Abstract
:Intensive land use activities worldwide have caused considerable loss to many ecosystem services. The dynamics of these threats must be quickly investigated to ensure timely update of management strategies and policies. Compared with complex models, mapping approaches that use scoring matrices to link land use/land cover and landscape properties with ecosystem services are relatively efficient and easier to apply. In this study, scoring matrices are developed and spatially explicit assessments of five ecosystem services, such as erosion control, water flow regulation, water quality maintenance, soil quality maintenance, and biodiversity maintenance, are conducted for a region under intense land use along the southern coast of South Africa. The complex interaction of land use/land cover and ecosystem services within a particular landscape is further elucidated by performing a spatial overview of the high-risk areas that contribute to the loss of ecosystem services. Results indicate that both agricultural activities and urban development contribute to the loss of ecosystem services. This study reveals that with sufficient knowledge from previous literature and inputs from experts, the use of scoring matrices can be adapted to different regional characteristics. This approach can be improved by adding additional landscape properties and/or adapting the matrix values as new data become available.
1. Introduction
The Millennium Ecosystem Assessment defines ecosystem services as “the benefits that humans derive from ecosystems to sustain human well-being” [1]. Some well-known classification systems have categorized ecosystem services into provisioning services (provisioning of freshwater for human use); regulation and maintenance services (water flow regulation, erosion control, and soil fertility maintenance); and cultural services (recreation) [2]. Another ecosystem service category, known as ecological integrity, describes the ability of ecosystems to provide various ecosystem services, including supporting services, such as biodiversity [3].
The contribution of the natural environment to human well-being can be better understood by mapping ecosystem services [4], which facilitate the quantification and visualization of spatial information related to the capacity of ecosystems to provide or maintain ecosystem services derived from complex systems [4,5]. Mapping approaches are therefore useful to recognize and implement ecosystem services in decision making and land management strategies [4,5,6,7]. These approaches incorporate land use/land cover (LULC) to assess the effects of land use activities on ecosystem services. Many mapping approaches use complex models and extensive geodatabases [8,9,10,11], which make their application challenging and time-consuming. However, mapping approaches that rely on available data, literature, and the knowledge of experts are useful to ensure timely decision making [3,12,13,14,15,16,17]. Simple and robust mapping approaches that relate LULC classes to ecosystem services using a scoring matrix [3,14,17] are useful, particularly in data-scarce regions wherein expert knowledge may be used [3]. For the matrix approach, the values to link LULC with ecosystem services are given by the authors on the basis of an evaluation of available case studies and literature on ecosystem service criteria, as well as inputs from consulting experts in the field [3,14,17]. To ensure a spatially explicit assessment of the effects of LULC on ecosystem services, the capacity of the natural ecosystem to provide certain ecosystem services are considered [12,15,16] and the landscape potentials developed for each studied ecosystem service are parameterized [15,16]. The landscape potentials are based on existing methods that require lengthy calculations; however, Lima et al. [12] simply scored landscape properties relevant to each ecosystem service as an additional scoring matrix based on knowledge gained from the available literature and inputs from experts.
Mapping approaches employed in South Africa have primarily focused on identifying ecosystem service priority areas and determining the correspondence of ecosystem services with natural vegetation and biodiversity hotspots [18,19,20,21]. These approaches require the integration of proxy datasets, which are occasionally available. Furthermore, only two studies have evaluated the effects of LULC on various ecosystem services using mapping approaches [22,23]. Reyers et al. [22] indicated the loss of ecosystem services, due to the degradation and transformation of land cover, whereas O’Farrell et al. [23] assessed the effects of more refined LULC classes on ecosystem services. Applying matrix approaches to assess the effects of LULC on ecosystem services in South Africa is needed, especially since such approaches are less data-intensive, and the evaluation of expert knowledge may be incorporated. After the South African political change in 1994, the southern coastal region of the Western Cape Province (WCP) began experiencing a considerable population influx, thereby increasing urban development and agricultural activities [24] and causing a potential loss of certain ecosystem services. A simplified scoring approach can be applied to effectively identify high-risk areas that are contributing the most to the loss of ecosystem services from land use activities in the region. The regional characteristics make this region suitable for testing the effectiveness of using a landscape property scoring matrix to provide supplementary input data.
This study aims to use a simple and robust mapping approach to identify the high-risk areas that show a loss of ecosystem services, due to land use activities in a specific study region located along the southern coast of the WCP in South Africa. Available literature and knowledge from experts were evaluated to develop the scoring matrices by linking LULC and landscape properties with ecosystem services. The values from the scoring matrices were used to map the ecosystem service values for the most recent LULC situation (including land use activities) and a natural land cover reference situation (excluding land use activities). To identify the high-risk areas, risk maps were created using the ecosystem service difference values derived from the reference and LULC situations.
2. Methods
2.1. Study Region
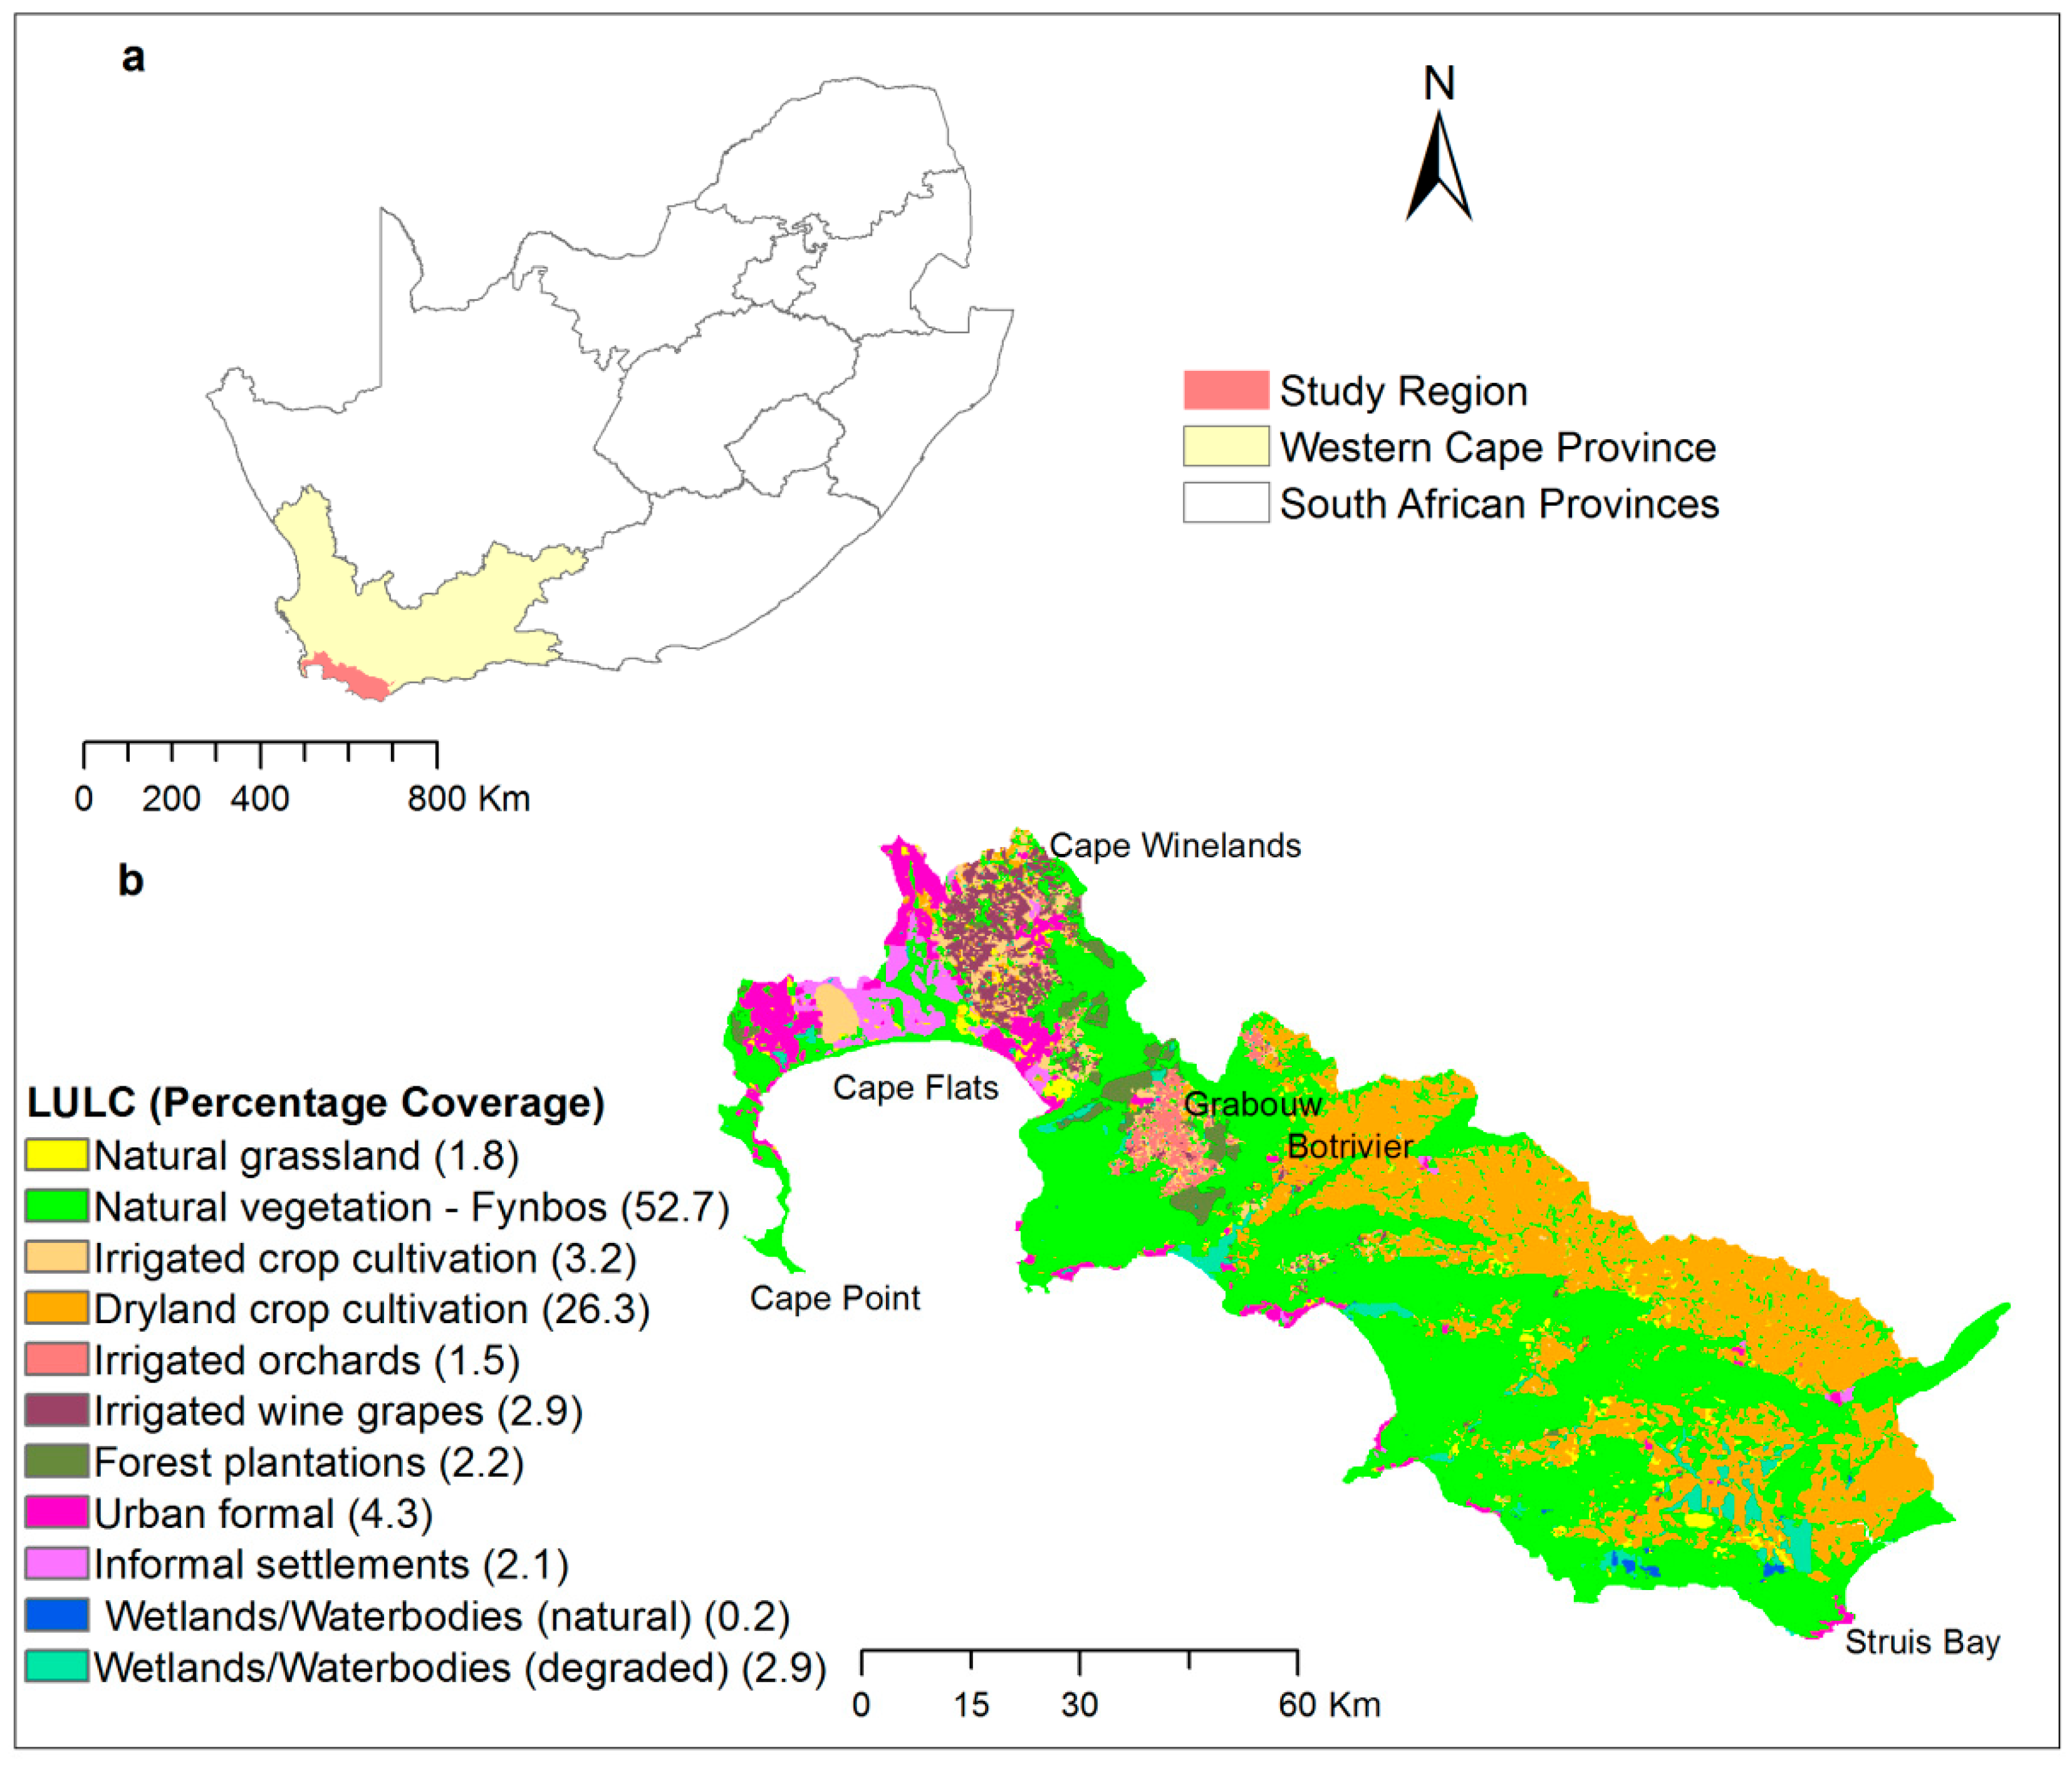
The mapping approach was applied to a particular study region (Figure 1a) along the southern coast of the WCP, South Africa. The study region extends along the coastline from Cape Point (34°21′ S; 18°28′ E) to 22 km east of Struis Bay (34°48′ S; 20°03′ E). It extends approximately 50 km inland and includes regions of the Cape Flats, the Cape Winelands District, and the Overberg District, covering a land surface area of 643,542 ha. The study region is characterized by a Mediterranean climate with hot and dry summer seasons, rainy winter seasons, and mild to warm autumn and spring seasons. A mean annual precipitation gradient exists along the southern coastal region extending eastward. The highest mean annual precipitation in the coastal and mountainous regions is 1000–1200 mm, whereas the lowest mean annual precipitation is measured eastward along coastal areas and the inland region at 200–400 mm [25].
The 2000 National Land Cover data [26], incorporating the 2013 map of Agricultural Commodities in the WCP [27], were used to represent the LULC and the percentage coverage of each class (Figure 1b). Various land use types, including urban areas, agricultural land, forest plantations, and natural vegetation, are present in the study region. The natural vegetation “Fynbos” is one of the biodiversity hotspots of the world [28]. Fynbos covers much of the land surface along the coast and in the mountainous regions. Three major clusters of land use activities are evident (Figure 1b). (i) The first cluster is in the Cape Flats/Winelands area in the western part of the study region. The Cape Flats portion primarily includes informal urban development and irrigated crop cultivation, and the Cape Winelands portion primarily includes formal urban development, irrigated production of wine grapes, and less extensively irrigated crop cultivation. (ii) The second cluster is in the Grabouw area and includes irrigated orchards and less extensively irrigated crop cultivation, whereas forest plantations border the irrigated orchards. (iii) The third cluster includes dryland crop cultivation covering much of the land surface from Botrivier extending eastward to Struis Bay. Other types of LULC include natural grassland, wetlands, and waterbodies.
2.2. Generating Ecosystem Service and Risk Maps
The study region supports nationally important water- and soil-related ecosystem services, including water flow regulation and soil retention [20,21]. The WCP indicates a particularly high potential risk of soil erosion [29] and soil erosion occurs in areas of this region [30]. Water sources in the region are also documented to be in a poor state [31]. The region is a biodiversity hotspot that underpins the provisioning of most ecosystem services [3,19]. Furthermore, the loss of habitat threatens the biodiversity in the region [32]. The selected ecosystem services therefore include (1) erosion control, (2) water flow regulation, (3) water quality maintenance, (4) soil quality maintenance, and (5) biodiversity maintenance.
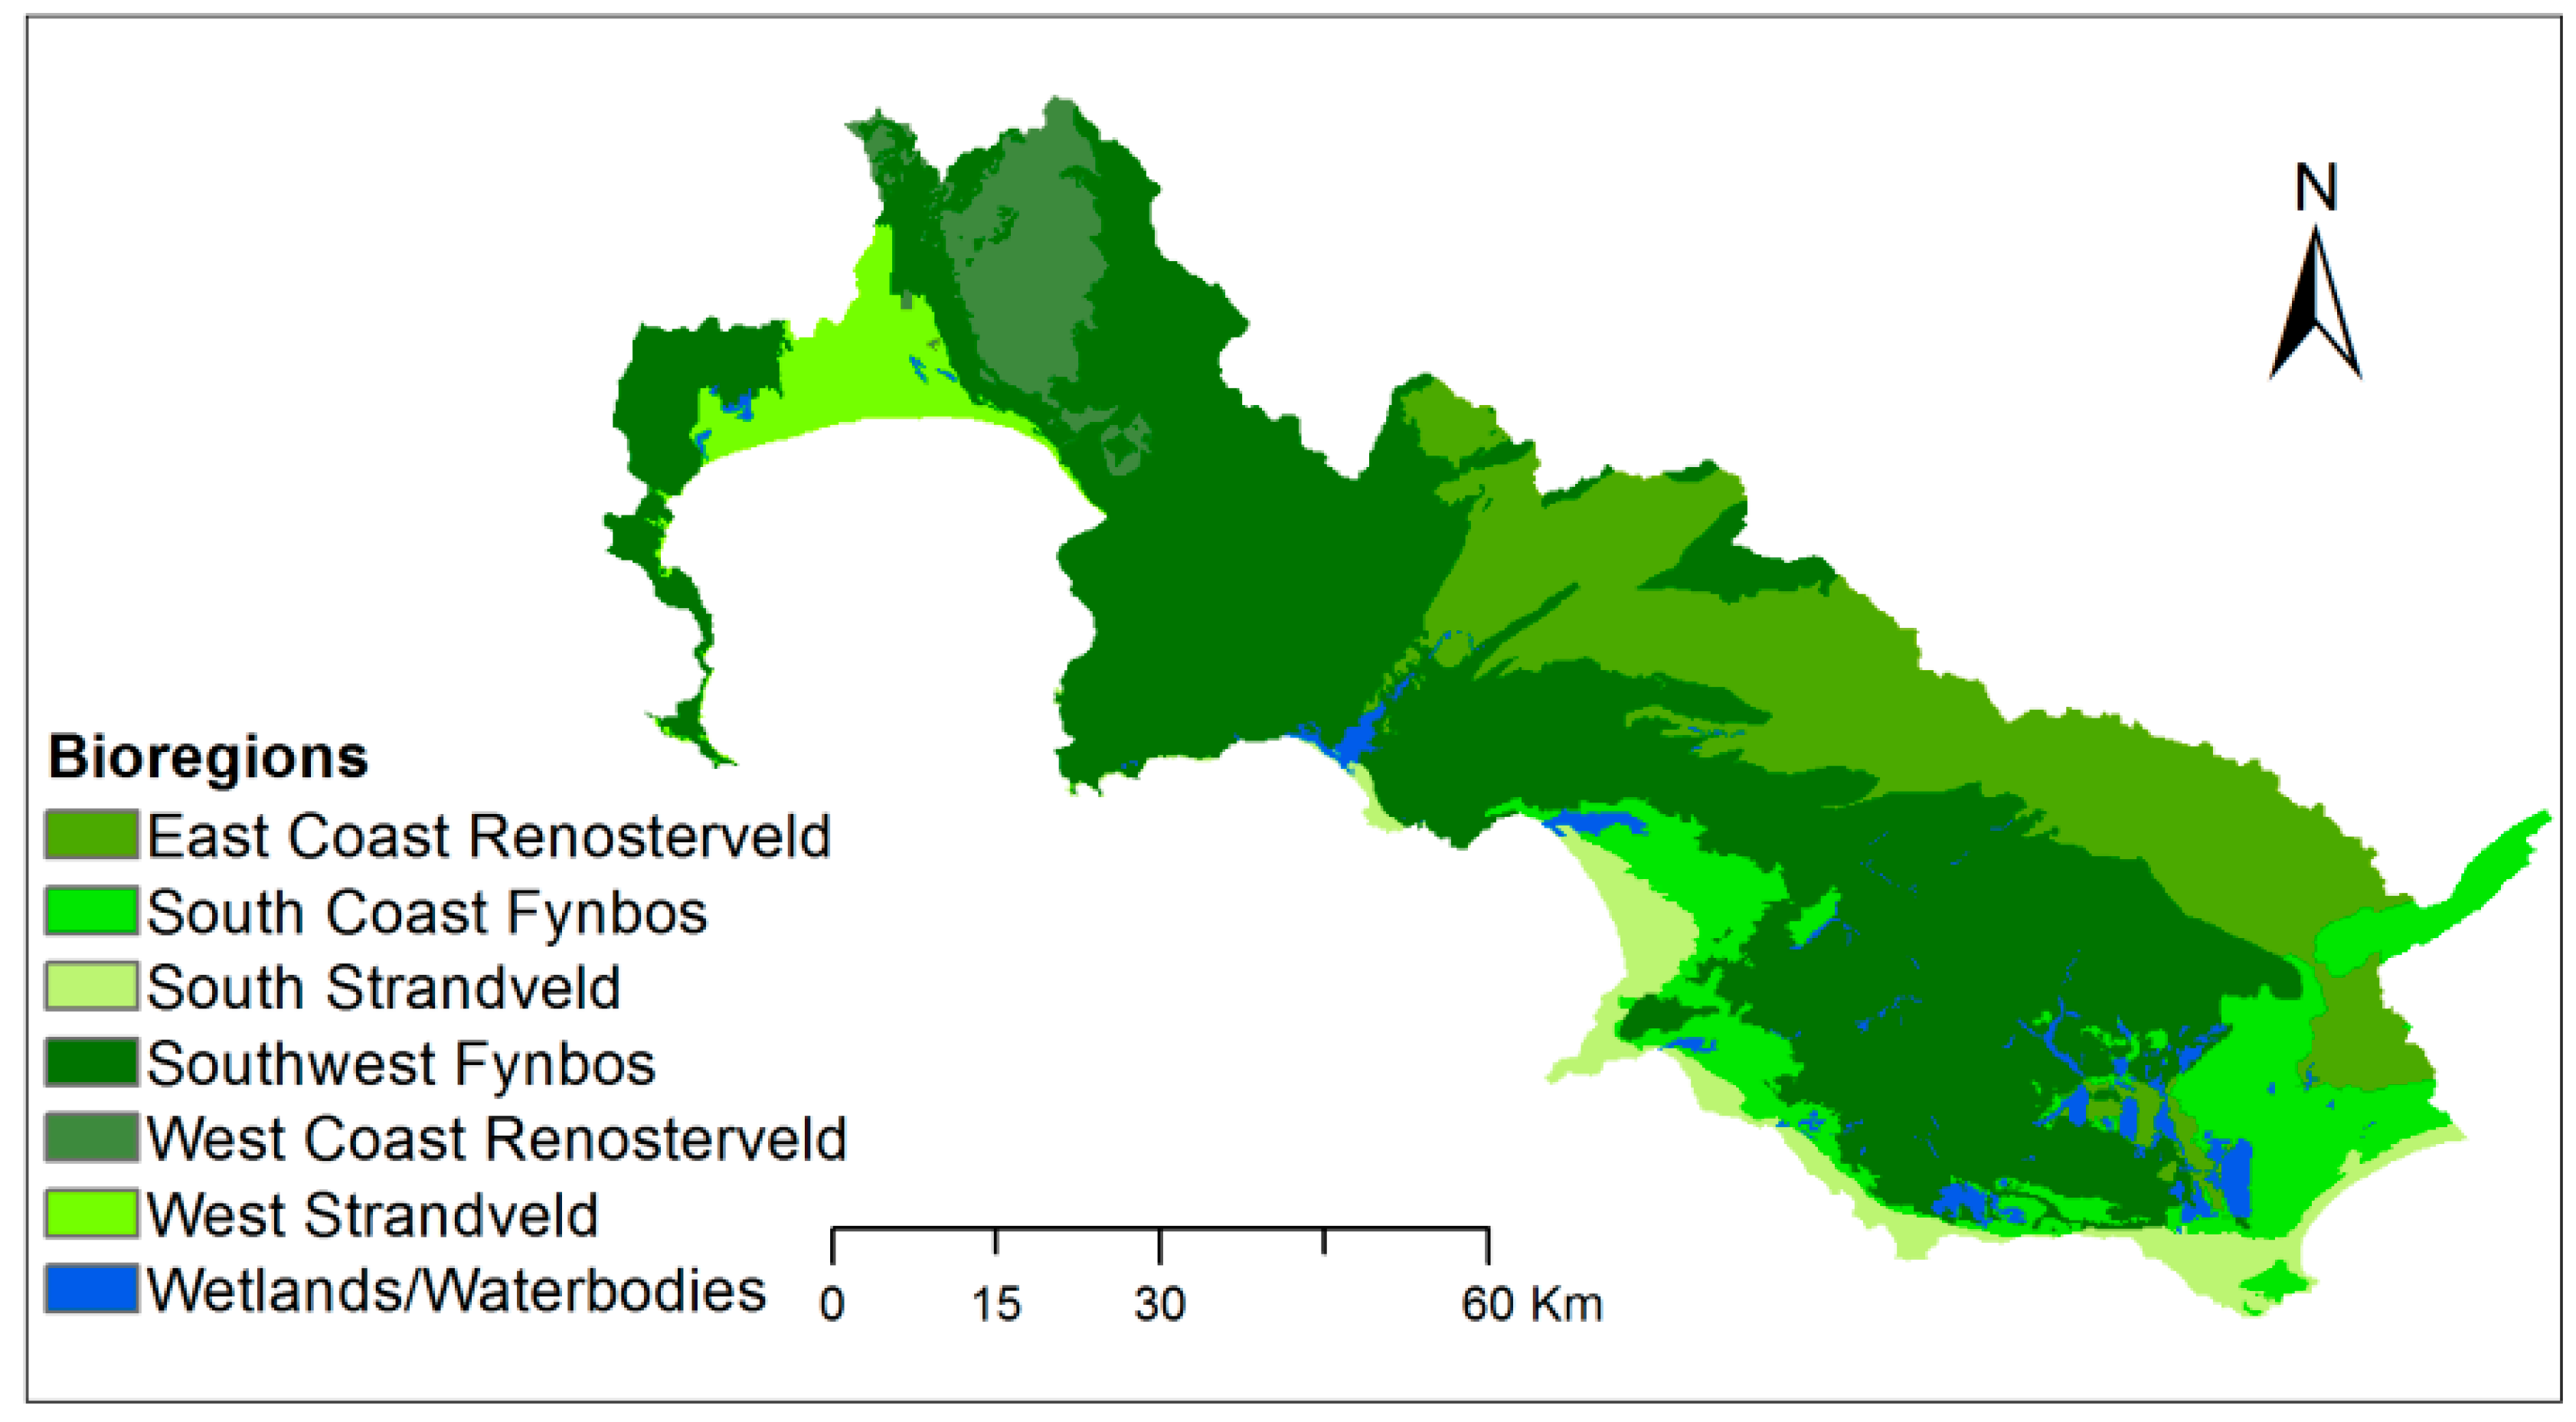
To generate risk maps that show the loss of ecosystem services from land use activities, an ecosystem service assessment based on the most recent LULC map (henceforth referred to as the LULC map) (Figure 1b) and the natural land cover reference map (henceforth referred to as the reference map) was conducted. The 2006 map of the potential natural vegetation [33] was used as the reference map for the study region, which includes different Fynbos biomes, wetlands, and waterbodies (Figure 2).
Figure 3 shows the general workflow used to generate the ecosystem service and risk maps. Three principal steps were employed:
(i) First, two scoring matrices were developed and used as input data. Using the values from the scoring matrices, less-intensive data input is required, and maps can be obtained in a timelier manner; this process is beneficial because it allows evaluating and using the knowledge gained from literature and experts in the field [3,12,14,17]. For the first scoring matrix, the LULC was related to each ecosystem service based on certain criteria. For a spatially explicit assessment, a second scoring matrix was developed that relates landscape properties (soil texture, slope, and distance to the river network) to each ecosystem service. The study region is suitable for using a landscape property scoring matrix given by flat plains and mountainous terrains with variable soil textures. Further details for developing the scoring matrices are discussed in Section 2.3.
(ii) Second, the ecosystem service maps for both the LULC and reference maps were generated. This was accomplished by multiplying the values given for the LULC scoring matrix with the values given for the landscape property scoring matrix.
(iii) Finally, risk maps were created by subtracting the LULC ecosystem service values from the reference ecosystem service values. The differences in the ecosystem service values were classified in risk classes as low, medium, and high in percentile intervals, including low (0–50th percentile), medium (50–80th percentile), and high (80–100th percentile).
From the risk maps, the high-risk areas of land use activity clusters that contribute the most to decreases in ecosystem service values were identified. Data were processed using ArcGIS version 10.1 software [34].
2.3. Relating LULC and Landscape Properties to Ecosystem Services
To relate the LULC and landscape properties to each ecosystem service, values were assigned by the authors on the basis of an evaluation of the available literature and knowledge obtained from expert consultations. Lima et al. [12] and Burkhard et al. [14] provided a comprehensive list of ecosystem service criteria that served as a basis to search for relevant literature. This section overviews the literature; an interpretation of the relevant literature is provided in Section 3.1, along with detailed explanations for assigning the values and developing the scoring matrices.
To relate the LULC to each ecosystem service for the LULC and reference maps, values were assigned according to the capacity of the landscape to provide or maintain the ecosystem services. For this study, the LULC were related to each ecosystem service on a scale from 0 to 5, with 5 being the highest capacity to provide or maintain the ecosystem service and 0 indicating no capacity. From reviewing the selected literature, LULC classes that have little or no impacts on a certain ecosystem service or its related criteria support the capacity of the landscape to provide or maintain the ecosystem service; these classes were given high scores. The LULC classes that were identified to impact a certain ecosystem service or its related criteria cause a loss in the capacity of the landscape to provide or maintain the specific ecosystem service; these classes were given low scores.
The literature on ecosystem services and related criteria specific to the study region and similar regions of South Africa is somewhat limited, but received the most consideration in value assignment [28,30,35,36,37,38]. For example, Gebel et al. [30] identified the land use activities that mostly contribute to sediment and nutrients reaching river networks in the same study region. For the same study region, Malherbe et al. [35] assigned the LULC classes with impact scores to indicate the nutrient, sediment, and chemical inputs from LULC. Such impact scores were also developed by O’Farrell et al. [36] for a similar study region situated further east along the southern coast of the WCP. These references were helpful in the development of values that link LULC with erosion control and water quality maintenance. A review published by Mills and Fey [37] regarding the effects of agricultural activities on soil properties in South Africa was also utilized to develop these values for soil quality maintenance. Scholes and Biggs [38] presented a biodiversity intactness index under different land conditions, specifically for southern Africa. Although they did not differentiate between cultivated lands and types of urban development, their research was useful in the development of the biodiversity maintenance scores. Other literature also highlights that natural vegetation of South Africa plays an important role to provide and maintain water- and soil-related ecosystem services [18,20]. Information gained from Egoh et al. [18,20] was useful in the linking of natural vegetation with erosion control, water flow regulation, and soil quality maintenance.
Due to a limited amount of information about the study region, the knowledge gained from the available literature, which includes global information regarding the consequences of land use activities on ecosystem services, and related criteria were also evaluated [39,40]. Moreover, values given to scoring matrices for other regions of the globe [3,12,14] were adjusted using local knowledge gained from literature and by consulting experts. Local knowledge from literature includes information about the use of fertilizer [41] and wastewater disposal [42] and that gained by consulting experts includes information about the infrastructure.
Table 1 lists the references used to link the LULC with each ecosystem service. Different Fynbos biomes (Figure 2) represent the natural vegetation of the study region and are not considered to affect the selected ecosystem services. The Fynbos biomes were therefore given the highest capacity to provide or maintain the ecosystem services. The same values given for Fynbos and wetlands and waterbodies (natural) from the LULC map were used for the reference map.
The landscape properties were related to each ecosystem service on a scale from 0 to 1, where 1 does not impede and 0 fully impedes the ecosystem’s capacity to provide or maintain the ecosystem service. The landscape properties included soil texture, slope, and distance from the river network. Values that relate landscape properties to erosion control and water flow regulation were adapted according to our study region based on a study reported by Marks et al. [43]. The humus content of the study region was <2%. Such low percentages have little to no effect on erosion resistance [43] and were not considered in this study. The gravel content of the study region affects the erosion resistance. The gravel content was therefore included when relating the soil texture to erosion control [43]. The root zone available water capacity (RZAWC) affects water flow regulation, and Marks et al. [43] provided RZAWC values based on soil texture. Values for relating landscape properties to water quality maintenance, soil quality maintenance, and biodiversity maintenance were adapted according to our study region based on the findings of Lima et al. [12].
The soil texture and topsoil gravel content were obtained from the Harmonized World Soil Database at a resolution of 30 arc seconds of longitude and latitude (~1 km) [44]. The slope was calculated using the Stellenbosch University Digital Elevation Model for South Africa at a resolution of 5 m [45]. Distances to river network (buffer strips), with the same distances as those used by Malherbe et al. [35] for the same study region, were created on both sides of each river reach at 0–25, 25–50, 50–125, 125–500, and 500–1000 m.
2.4. Reference Threshold
For this study, LULC is related to ecosystem services based on ecosystem service criteria. Methodological errors are observed when measuring ecosystem service criteria [46]; therefore, reference thresholds exist because of the methods used to measure ecosystem service criteria. A reference threshold showing lower and upper threshold values for the ecosystem services can be used in order to establish if the differences between the ecosystem service values calculated for the reference and LULC maps can be assigned to particular land use activities. A range of reference thresholds with lower and upper threshold values was determined for each ecosystem service. Changes from the reference to the LULC ecosystem service values that fall outside the range of thresholds were most likely associated with land use activities. Range factors were combined with each reference ecosystem service value to determine the lower and upper threshold values for each ecosystem service.
Range factors are defined on the basis of methodological errors, which exist when measuring ecosystem service criteria [12]. The range factors were determined using expert knowledge regarding the complexity of generating reliable ecosystem service criteria data. The knowledge regarding the processes that support biodiversity is somewhat limited, and transferring soil quality point data to spatial data leads to very high uncertainties. Measuring criteria for biodiversity maintenance and soil quality maintenance is therefore quite complex and were given a high range factor of 0.4 [12]. Generating sediment flow data and other water quality measurements are also rather complex. Erosion control and water quality maintenance were given a range factor of 0.3 [12]. Water flow regulation was given the lowest range factor of 0.1 as baseflow can be measured with a higher degree of accuracy [12].
3. Results
3.1. Development of Scoring Matrices Including LULC and Landscape Properties
This section provides more detailed examples of the relation between ecosystem services and (i) LULC and (ii) landscape properties. The values linking LULC classes to each ecosystem service are presented in Table 2. Findings for South Africa indicated that natural vegetation, including Fynbos and grassland, plays an important role in erosion control, water flow regulation, and water quality maintenance [18,20,35,36] (value = 5), which is also the case for wetlands and waterbodies in their natural state [35,36] (value = 5 for erosion control and water quality maintenance, but 3 for water flow regulation). Degraded wetlands and waterbodies lose their ability to support erosion control, water flow regulation, and water quality maintenance to their full potential (value = 3, but 2 for water flow regulation). Biological, physical, and chemical properties of soil are good indications of soil quality and are maintained by landscapes in their natural state [37] (value = 5). Natural vegetation, wetlands, and waterbodies in their natural state are important for biodiversity maintenance [3,28,38] (value = 5).
Agricultural activities considerably impact the selected ecosystem services and related ecosystem service criteria. For example, simulation results for the same study region indicate that the critical source areas for sedimentation and nutrient inputs are from irrigated crop cultivation of vegetables, irrigated orchards, irrigated wine grapes, and dryland crop cultivation [30]. In addition, for the same study region, impact scores given for sediment input are the highest for irrigated crop cultivation and dryland crop cultivation, followed by irrigated orchards, irrigated wine grapes, and forest plantations [35]. The impact scores given for nutrient input are highest for all the previously mentioned irrigated agricultural activities [35]. Low sediment retention is also determined for irrigated crop cultivation, irrigated orchards, and forest plantations for a similar region situated further east along the coast [36]. Based on the previously mentioned literature, irrigated crop cultivation of vegetables do not support erosion control and water quality maintenance (value = 0); however, irrigated wine grapes and irrigated orchards support these ecosystem services to a very small extent (value = 1). Dryland crop cultivation also does not support erosion control (value = 0). Considering the low amount of fertilizer used for dryland crop cultivation [41], landscapes subject to this activity have a slightly higher capacity to maintain water quality compared with that of the other agricultural activities (value = 2). Erosion control is limited for forest plantations (value = 1); however, compared with other agricultural activities, the water quality maintenance for forest plantations is higher (value = 3). Agricultural activities are widely known to have significant impacts on soil properties [37,40] and biodiversity [3,38,40]. Landscapes subject to agricultural activities therefore have a low capacity to maintain soil quality (value = 1, but 2 for forest plantations) and biodiversity (value = 1, but 2 for forest plantations and irrigated orchards).
Wastewater disposal in the informal settlements of South Africa is relatively poor [42]. Based on local knowledge, the region’s informal settlements also have a limited number of paved roads and provide no green space. This supports the high impact scores for nutrient and sediment inputs attributed to informal settlements [35]. This suggests that informal settlements impede the capacity of the landscape to provide or maintain the selected ecosystem services (value = 0). The sediment retention is determined to be high [36] and the wastewater disposal is more efficient [42] for formal urban development in the region. The impact scores given for nutrient and sediment inputs are therefore low for formal urban development [30]. For this study, formal urban development was found to have a greater capacity to support erosion control and water quality maintenance (value = 4). Green space in formal urban areas supports biodiversity maintenance to some extent [3] (value = 2).
The values linking landscape properties to each ecosystem service are listed in Table 3. Under natural conditions, soil texture does not impede soil quality maintenance and biodiversity maintenance [12] (value = 1) and slope does not impede biodiversity maintenance [12] (value = 1). As the slope increases, the capacity of the landscape to support erosion control, water flow regulation, water quality maintenance, and soil quality maintenance decreases [12,43] (decreasing values are represented by an increasing slope). The distance to the river network was only considered for water quality maintenance [12]. Riparian zonation minimizes pollutants entering rivers and streams [47]. The closer land use activities are to river networks, the higher is the potential impact (increasing values are given with increasing distance).
3.2. Ecosystem Service and Risk Maps
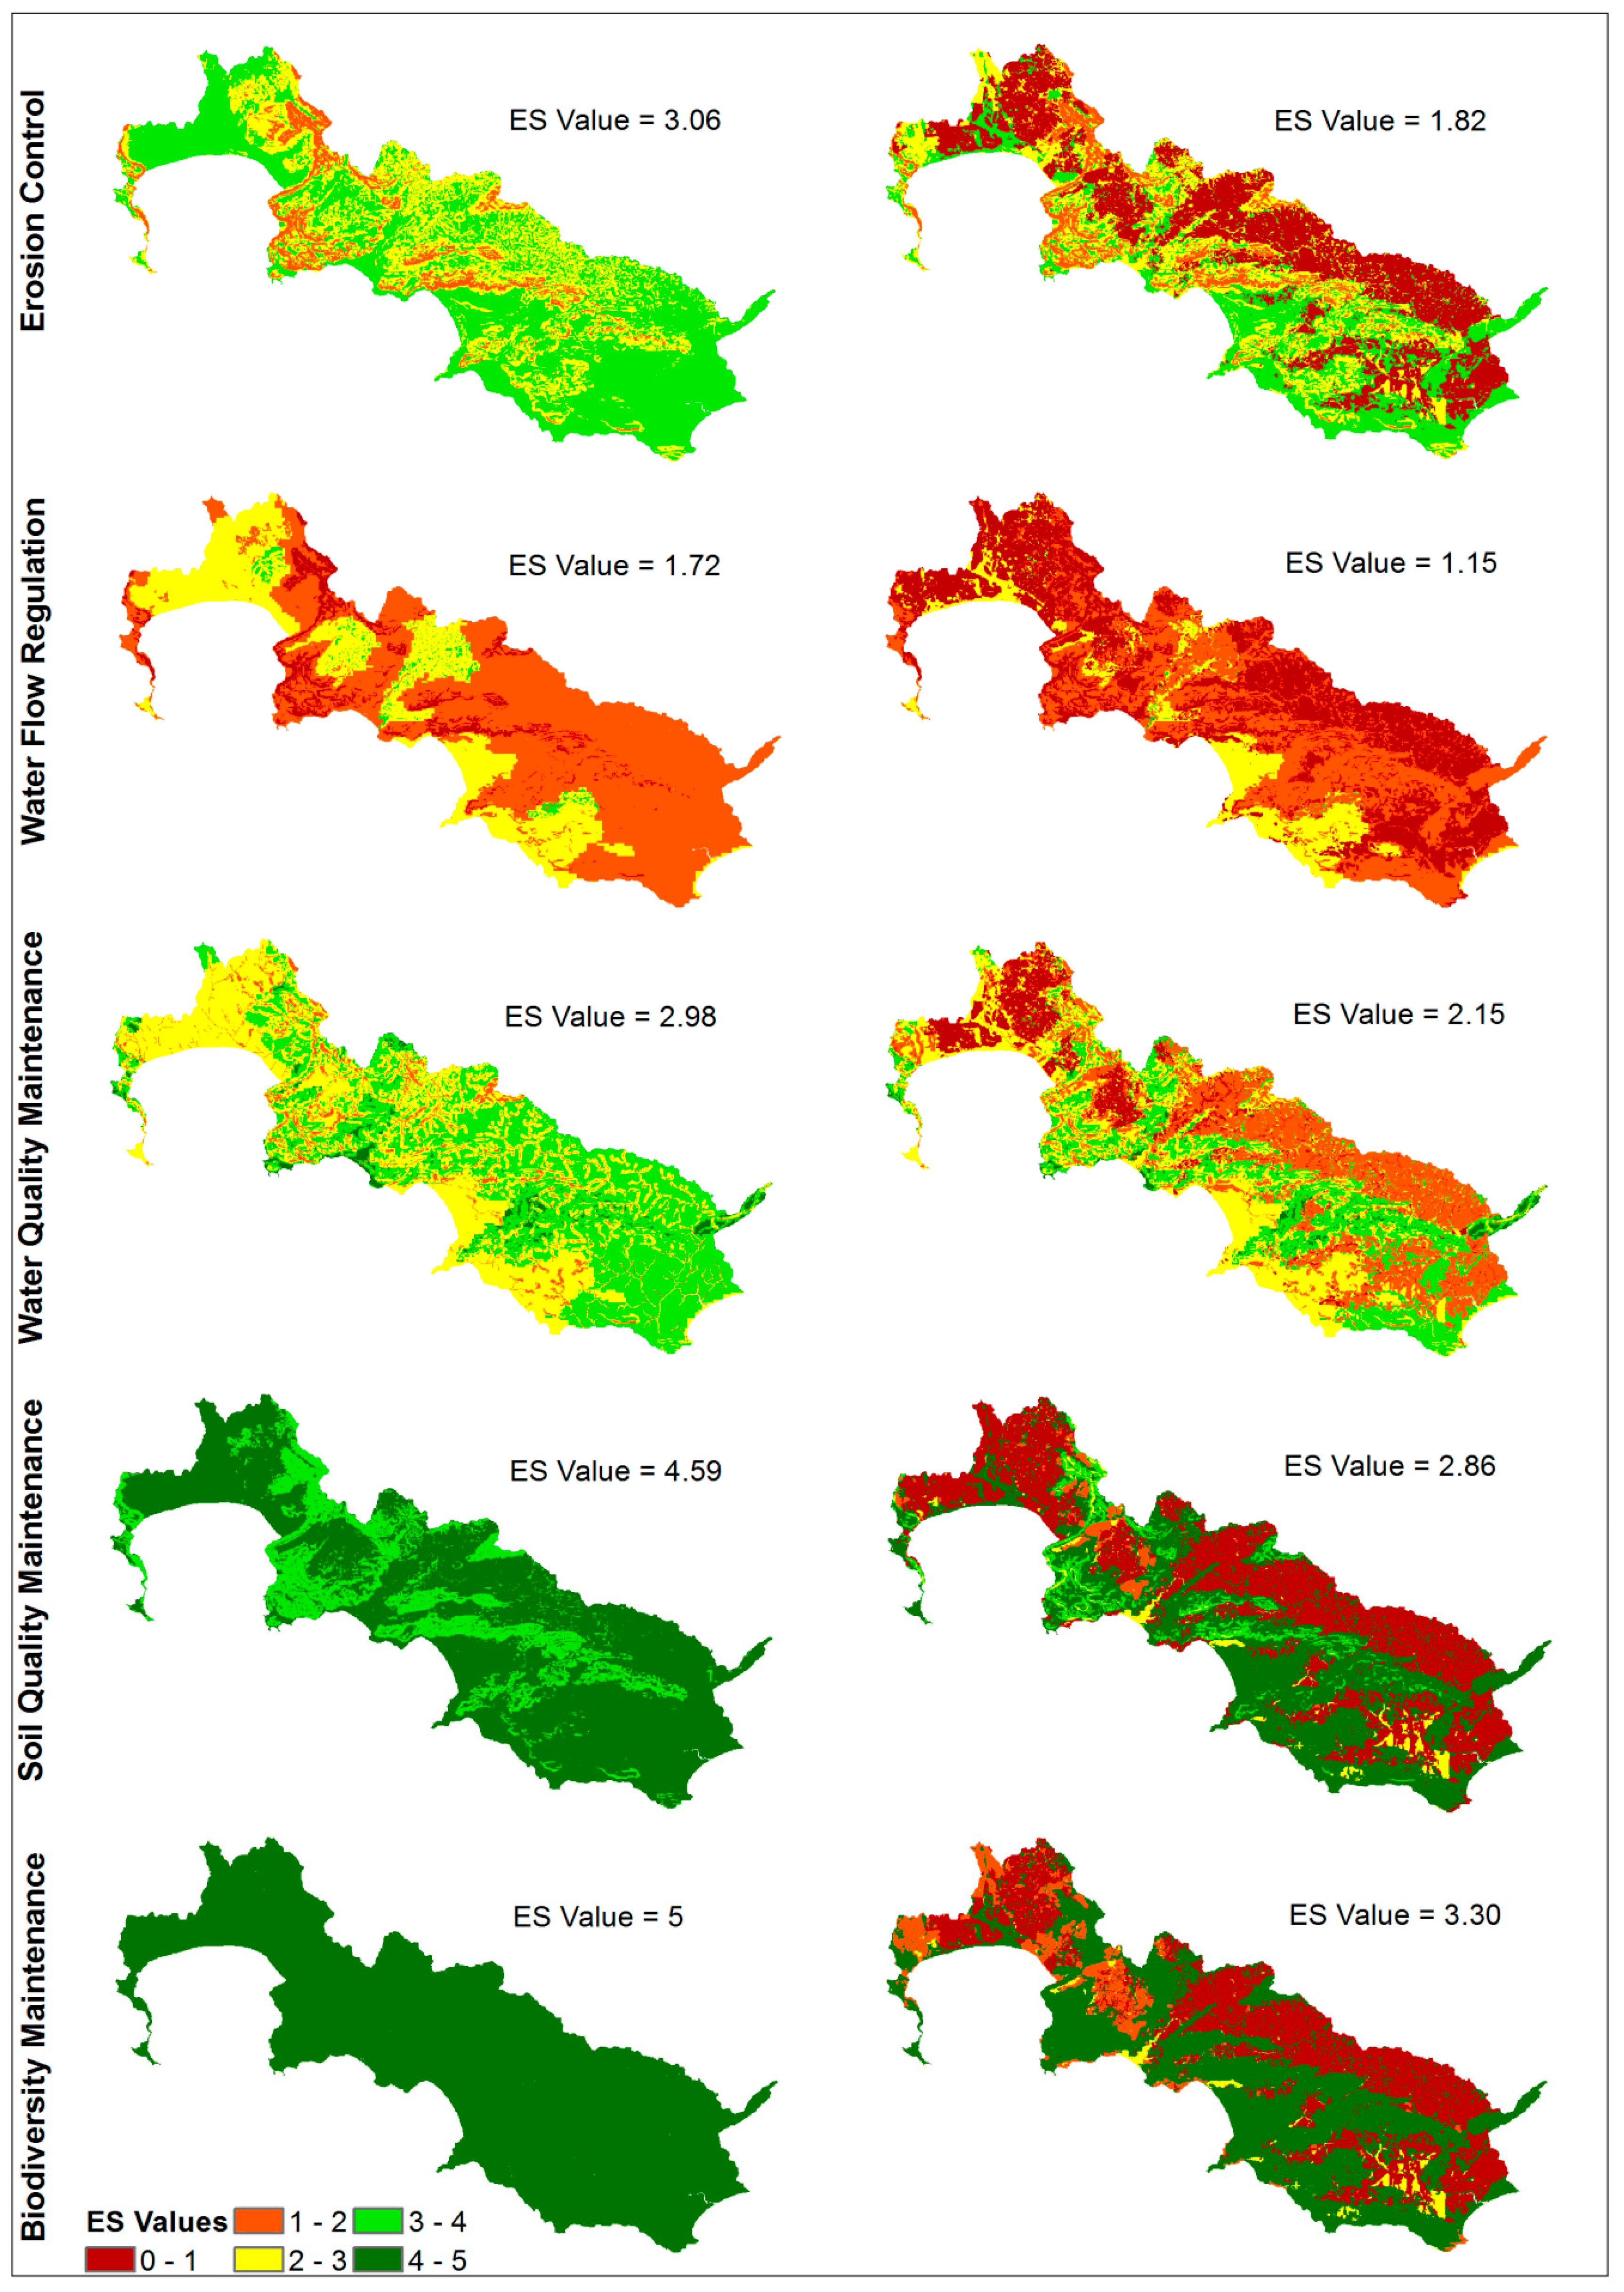
Figure 4 shows the total ecosystem service values for the reference and LULC maps. Comparing the reference and LULC ecosystem service values, an overall loss for each ecosystem service is evident. The highest losses were found to be associated with soil quality maintenance and biodiversity maintenance, followed by erosion control, water quality maintenance, and water flow regulation.
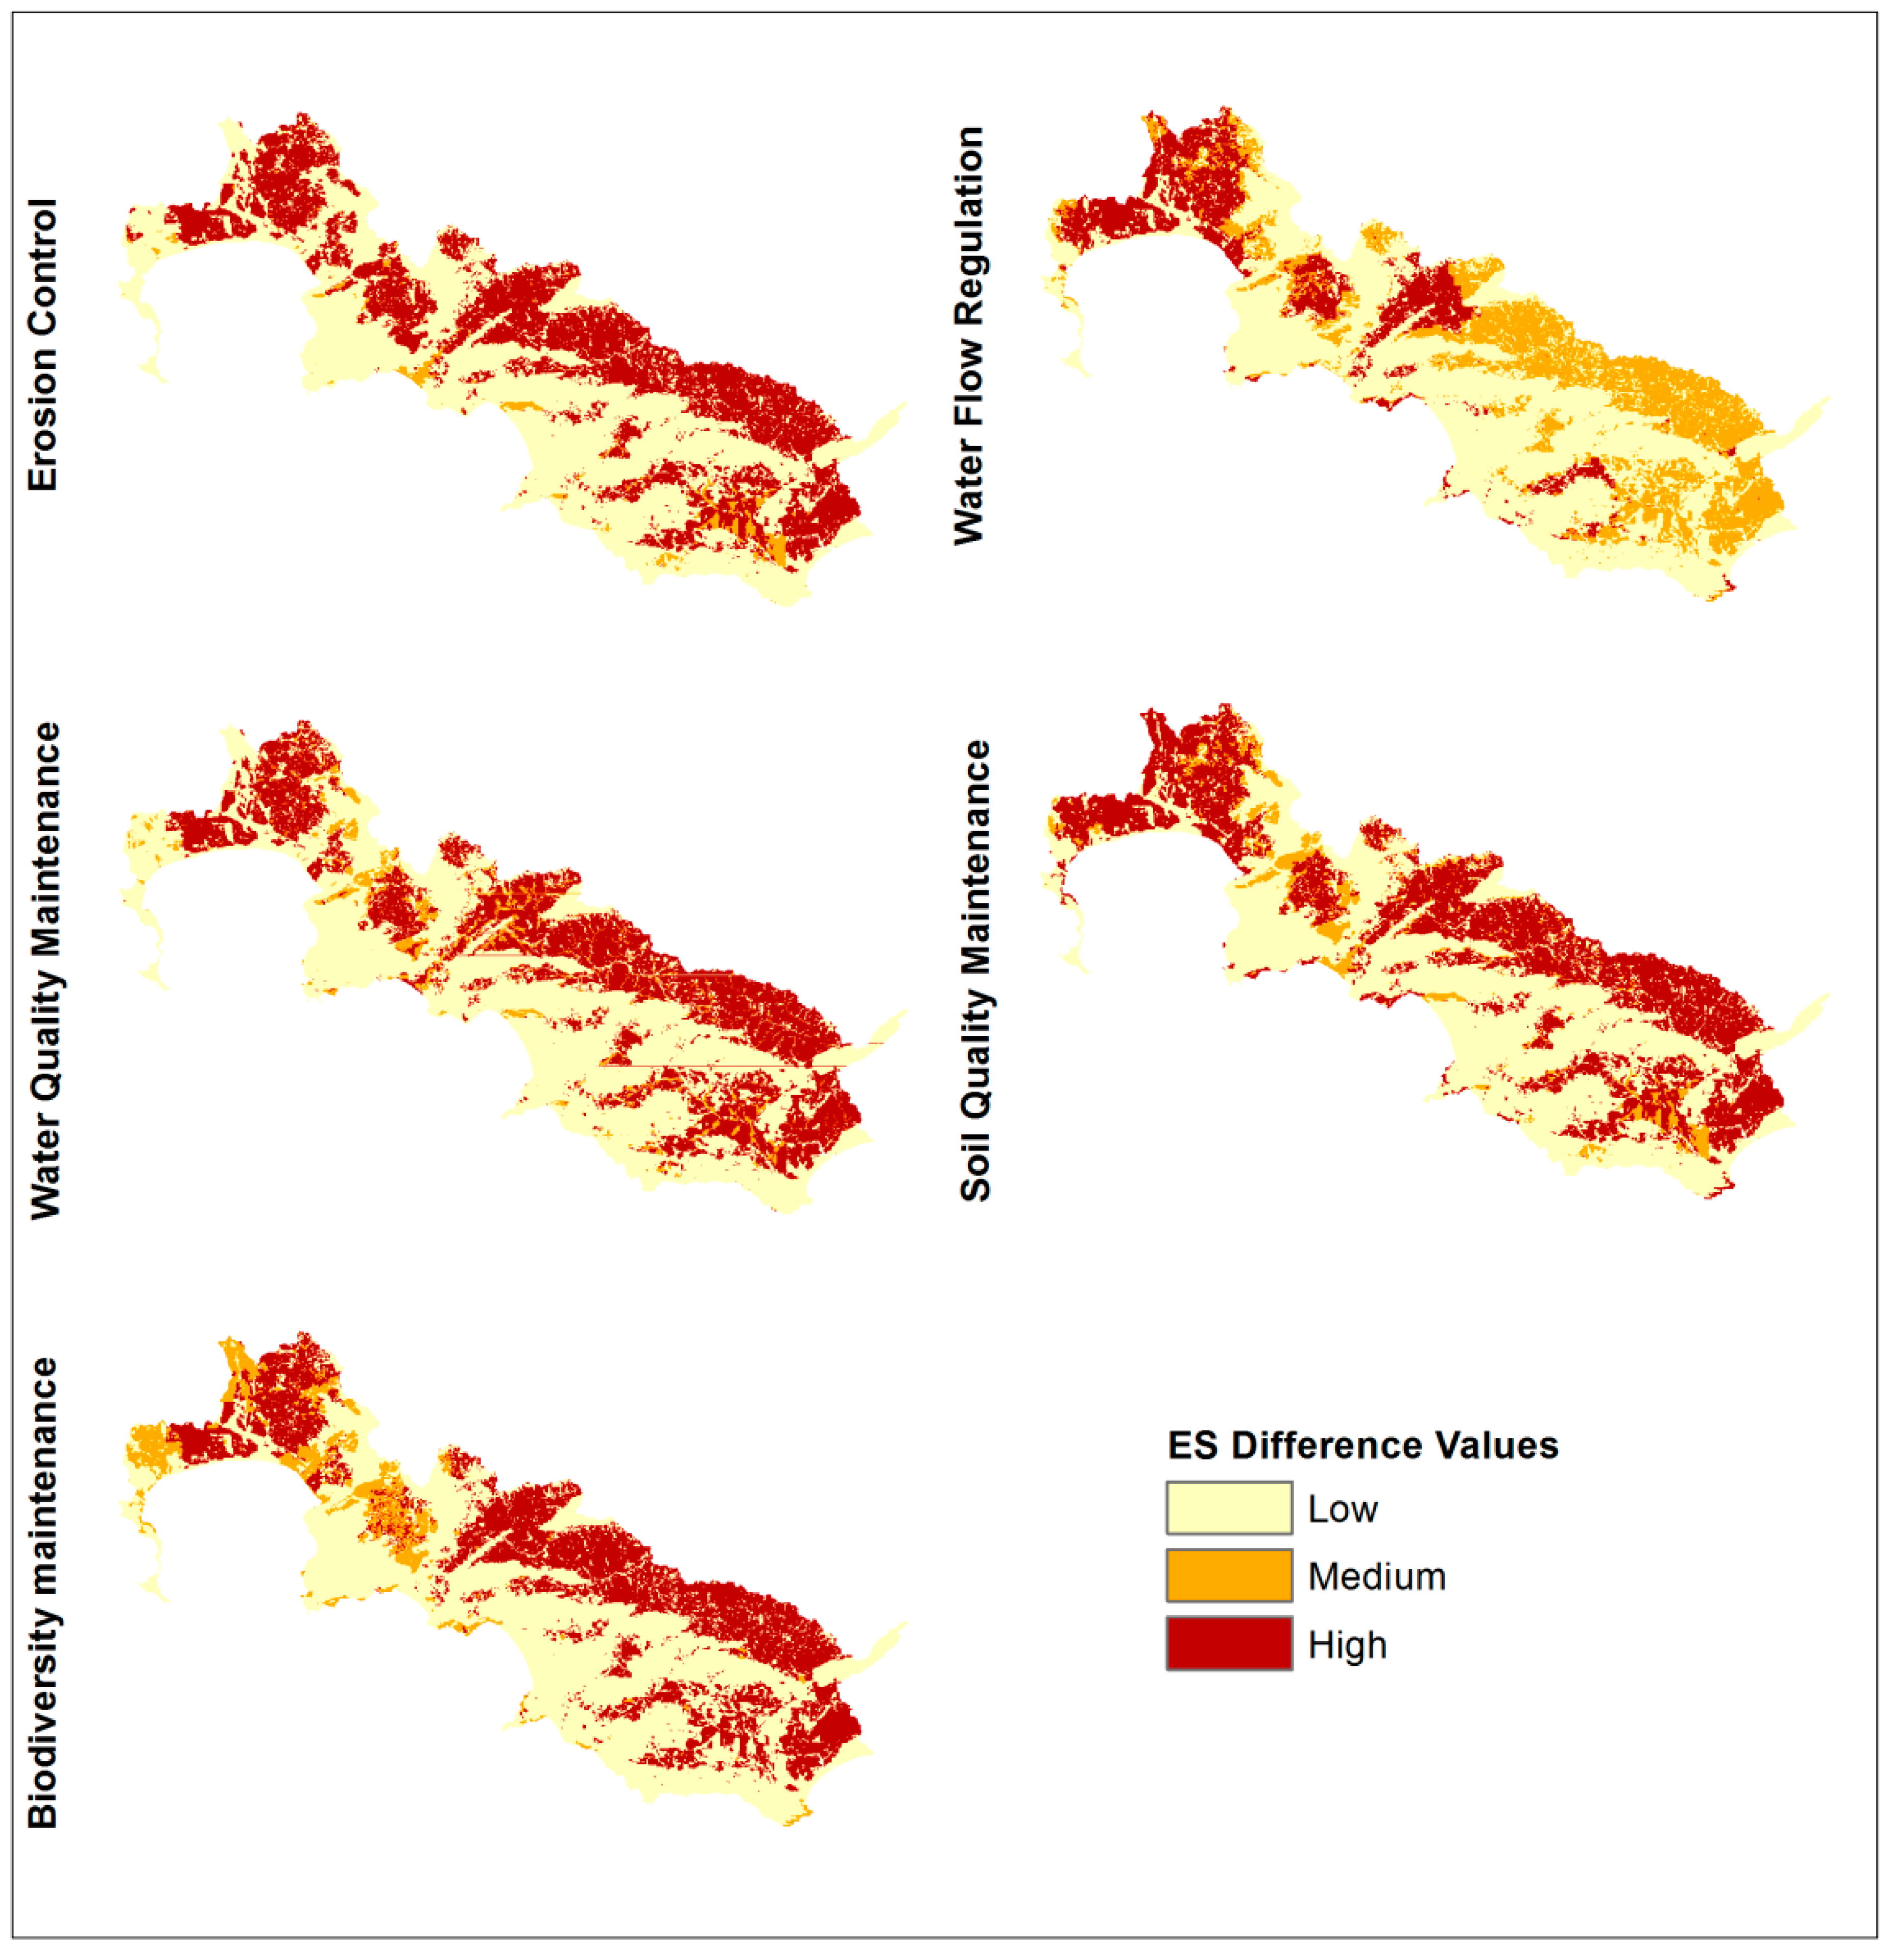
To understand the extent that land use activities contribute to ecosystem service loss, risk maps of each ecosystem service are presented in Figure 5. Three high-risk areas of land use activity clusters that contribute the most to the loss of each ecosystem service are evident. These include the Cape Flats/Winelands cluster, Grabouw cluster, and Botrivier to Struis Bay cluster.
There was a high loss of erosion control from the reference to the LULC situation, resulting in a decrease of the ecosystem service value from 3.06 to 1.82 (Figure 4). High-risk areas displaying a loss of erosion control included all three clusters (Figure 5). The irrigated crop cultivation of vegetables in the Cape Flats/Winelands and Grabouw clusters and the dryland crop cultivation in the Botrivier to Struis Bay cluster were largely responsible for the loss of erosion control (value = 0) (Table 2). This was followed by the irrigated production of wine grapes in the Cape Winelands and the irrigated orchards and forest plantations in the Grabouw cluster (value = 1) (Table 2). Vineyards in the Cape Winelands, the irrigated agricultural activities in the Grabouw cluster, and the dryland crop cultivation in the Botrivier to Struis Bay cluster are located in hilly areas, which reduce the capacity of the landscape to control erosion (Table 3). Informal settlements in the Cape Flats also contributed to substantial losses of erosion control (value = 0) (Table 2). These settlements cover vast sandy areas that also decrease erosion control (Table 3).
Although not as influential as erosion control, there is a loss of water quality maintenance from the reference to the LULC situation (i.e., from 2.95 to 2.15) (Figure 4). The high-risk areas also included all three clusters (Figure 5). As per erosion control, irrigated agricultural activities and informal settlements substantially contributed to the loss of water quality maintenance (value = 0) (Table 2). However, the loss of water quality maintenance was lower for dryland crop cultivation in the Botrivier to Struis Bay cluster (value = 2) and forest plantations in the Grabouw cluster (value = 3) (Table 2), which explains the reason for the lower overall loss of water quality maintenance than erosion control. Water quality maintenance for the reference situation had a lower value closer to river networks (Figure 4) because buffers limit the potential of pollutants to reach waterways (Table 3).
Water flow regulation shows the lowest ecosystem service value loss from the reference to the LULC situation, decreasing from 1.72 to 1.15 (Figure 4). The soil texture (clay loam and sandy clay loam) that underpins much of the natural vegetation contributes to the low water flow regulation values in such areas (Table 3). The two primary high-risk areas include the Cape Flats/Winelands and Grabouw clusters. The area surrounding Botrivier was also a high-risk area, whereas the area extending further east from Botrivier provided a medium contribution to the loss of water flow regulation (Figure 5). The contribution of agricultural activities to the loss of water flow regulation is similar to erosion control and water quality maintenance (Table 2). However, for urban development, particularly in the Cape Flats/Winelands cluster, the loss of water flow regulation was substantial (value = 1 for formal and 0 for informal urban development) (Table 2).
The loss of ecosystem service values from the reference to the LULC situation was the highest for soil quality maintenance (4.59–2.86) and biodiversity maintenance (5–3.30) (Figure 4). The high-risk areas for soil quality maintenance included all three clusters (Figure 5). Irrigated agricultural activities and dryland crop cultivation were found to substantially contribute to the loss of soil quality (value = 1), followed by forest plantations (value = 2) (Table 2) whereas urban development (informal and formal) destroys soils, which is largely responsible for the loss of soil quality (value = 0) (Table 2). The reference situation fully supports biodiversity maintenance (Figure 4) because natural vegetation provides habitat. The high-risk areas include the Cape Flats/Winelands and the Botrivier to Struis Bay clusters, whereas the Grabouw cluster provided a medium contribution to the loss of biodiversity maintenance (Figure 5). Agricultural activities in high-risk areas substantially contribute to the loss of biodiversity (value = 1) (Table 2). However, irrigated orchards and forest plantations in the Grabouw cluster support biodiversity slightly more (value = 2) (Table 2). Informal urban development in the Cape Flats cluster is the largest contributor to the loss of biodiversity maintenance, whereas the formal urban development displayed a medium contribution to such losses (value = 0 for informal and 2 for formal urban development) (Table 2).
The total ecosystem service values of the reference and LULC maps, including the lower and upper threshold values, are presented in Table 4 and Figure 6. A wide range of threshold values was evident for soil quality maintenance and biodiversity maintenance. The range of threshold values was not much lower for erosion control and water quality maintenance. Water flow regulation displayed the lowest range of threshold values (Table 4 and Figure 6).
The net loss of erosion control and water flow regulation falls outside the range of the threshold values (Figure 6). It can be assumed that land use activities do have an impact on erosion control and water flow regulation. In contrast, the loss of water quality maintenance, soil quality maintenance, and biodiversity maintenance fall inside the range of threshold values (Figure 6), and the effects of land use change from the reference to the LULC situation on these particular ecosystem services are not completely known.
4. Discussion
The inclusion of environmental data provides meaningful refinements to ensure spatially explicit assessments of the effects of LULC on ecosystem services [15]; however, existing approaches that exclude complex modeling still rely on lengthy calculations [15,16]. Findings of this study strengthen the credibility of the approach developed by Lima et al. [12], which includes a landscape property scoring matrix by simply scoring relevant landscape properties with each ecosystem service. Results reveal that landscape properties have the potential to affect the capacity of landscapes to provide or maintain ecosystem services. For example, the reference situations, particularly erosion control, water flow regulation, and water quality maintenance, clearly indicate that the capacity of the landscape to support a specific ecosystem service is not the same for all areas. This is consistent with the reference situation maps for erosion control and water quality maintenance reported by Lima et al. [12]. Lima et al. [12] did not assess water flow regulation; however, water flow regulation is successfully assessed in this study. This highlights the simplicity of the approach to expand its use in the evaluation of other ecosystem services. To do so, only the basic input layers, including LULC, soil texture and digital elevation models, and the evaluation of sufficient knowledge obtained from literature and/or the consultation of experts are necessary. This approach is further developed herein by considering the gravel content of soils to assess for erosion control. Another advantage is that the hypothesized values in such studies can be adjusted as more accurate and comprehensive data become available in the future.
Based on the range of threshold values, the land use activities appear to contribute to the loss of erosion control and water flow regulation. The loss of the other studied ecosystem services, due to land use activities is not completely clear, but must not be disregarded. Although the actual effect of land use changes from the reference situation cannot be determined, the findings of this study fill critical gaps in our knowledge regarding the complex interaction of LULC and ecosystem services within a particular landscape by performing a spatial overview of high-risk areas contributing to the loss of ecosystem services that can be used for making decisions regarding the implementation of more effective management strategies. The high-risk areas identified in this study show that both agricultural activities and urban development contribute to the loss of ecosystem services.
As mentioned previously, the WCP indicates a particularly high potential risk of soil erosion [29]. The findings show that the irrigated and dryland agricultural activities and forest plantations in the Cape Winelands, Grabouw cluster, and Botrivier to Struis Bay cluster are mainly located in elevated areas that contribute to an increase in erosion. Lorz et al. [16] reported an increase in sediment input in agricultural areas for the Cerrado biome in Brazil that was also increased by elevated slopes. The irrigated crop cultivation of vegetables in the Cape Flats is located on erodible sandy soils, which increase the risk of soil erosion. Another substantial loss of erosion control is associated with the cultivation of irrigated vegetable crops and informal settlements in the Cape Flats. The informal settlements cover vast sandy areas that presumably contribute to the loss of erosion control.
Widespread impacts of land use activities on water quality primarily include increased sediment, nutrient, and chemical inputs [39,48,49], and the agricultural activities and urban development along the southern coast of the WCP greatly contribute to such impacts [35,36,50]. The findings show that irrigated and dryland agricultural activities in the Cape Flats/Winelands, Grabouw, and Botrivier to Struis Bay clusters contribute to the loss of water quality maintenance. One reason is presumably associated with the previously mentioned increase in erosion and the use of fertilizer. Informal settlements also contribute to a loss of water quality maintenance, which is most likely a result of poor wastewater disposal practices [42]. Similar to the finding from Lima et al. [12], a decreasing contribution to water quality maintenance for areas closer to river networks was evident.
In the tropical regions of Southeast Asia, the decline of natural forest has drastically decreased water flow regulation [51]. A loss of water flow regulation was also evident in regions of South Africa, where a decline in the amount of natural vegetation in favor of crop cultivation is prevalent [20]. For example, land degradation in the Little Karoo is indicative of a decrease in water flow regulation [22]. Our findings also revealed a loss of water flow regulation in cultivated regions, especially for irrigated agricultural activities. The soil texture supporting the dryland crop cultivation between Botrivier and Struis Bay most likely supports water flow regulation more than sandier soils. Water flow regulation displayed a profound loss in both formal and informal urban developed areas of the Cape Flats, which was presumably intensified by the sandy soils in the area.
Under natural conditions, soil properties mostly remain undisturbed, which maintains soil quality and is evident for the reference situation of this study. Natural conditions provide the maximum potential for biodiversity maintenance [12], which is also evident for the reference situation for biodiversity maintenance. Human interference has a significant impact on soil quality and biodiversity [37,40]. The agricultural activities and urban development in the Cape Flats/Winelands, Grabouw, and Botrivier to Struis Bay clusters substantially contribute to the loss of soil quality maintenance, biodiversity maintenance, or both of these ecosystem services. For soil quality maintenance, the loss can be attributed to the use of fertilizer or the total destruction of soils from urban development, regardless of it being formal or informal development. The impacts on biodiversity in cultivated areas is slightly more than for forest plantations in southern Africa [38], which is also evident based on the results for this study. Although urbanization usually causes the total destruction of habitats, the formal urban development in the Cape Flats/Winelands cluster has green urban spaces and explains the medium contribution of formal urban development to the loss of biodiversity maintenance.
5. Conclusions
Findings of this study indicate that landscape properties have the potential to affect the capacity of the landscape to provide and maintain ecosystem services. Applying a matrix approach to assess the effects of LULC on ecosystem services must therefore not neglect the addition of landscape properties. Results further reveal that, with sufficient knowledge from previous literature and the inputs from experts, the approach can be adapted to the characteristics of other regions, particularly regions with limited data and resources. The approach can be further improved by adding additional landscape properties. Herein, the approach is improved by adding the gravel content to the soil texture for the assessment of erosion control. The values given for the matrices can also be changed and improved as new data become available. For future reference, testing different versions of the approach is recommended based on further improvements.
Compared to complex modeling, the application of the approach is also relatively fast because it involves inputs from experts. However, limited knowledge regarding the complex interactions, including the landscape, land use activities, and ecosystem services, presents a certain limitation in its application. The actual effects of the land use activities on the ecosystem services are therefore not certain, and it is difficult to provide recommendations. Regardless, the approach does deliver a good spatial overview to understand the extent and magnitude of impact that land use activities have on the loss of ecosystem services by highlighting high-risk areas. Obtaining knowledge about the areas and associated land use activities that contribute to increasing risks of the loss of ecosystem services is important to make decisions regarding further in-depth research that may require costly resources.
Global policies and strategies focus on the conservation of biodiversity because conserving biodiversity targets the protection of ecosystem services [52]. However, since the establishment of the Intergovernmental Science-Policy Platform on Biodiversity and Ecosystem Services [53], there is a trend of focusing on the conservation and sustainable use of both biodiversity and ecosystem services [52,53]. To ensure the continuity of the delivery of ecosystem services, it is important to enhance the global knowledge of the threats to ecosystem services. It is therefore important to direct research toward simple and relatively fast assessment approaches, such as this study, to understand and tackle the negative effects of land use activities on ecosystem services. This will facilitate the improvement of management strategies and policies that focus on biodiversity conservation and ensure the continuous delivery of ecosystem services threatened by human interference and the restoration of lost ecosystem services.
Author Contributions
Conceptualization, H.M. and C.L.; Methodology, H.M. and C.L.; Formal Analysis, H.M.; Data Curation, H.M.; Writing—Original Draft Preparation, H.M.; Writing—Review and Editing, C.L. and S.P.; Visualization, H.M.; Funding Acquisition, H.M. and C.L.
Funding
This research was funded by the Deutscher Akademischer Austauschdienst | German Academic Exchange Service (57076405) and the Bundesministerium für Bildung und Forschung | German Federal Ministry of Education and Research (FKZ 02WSP1306D).
Acknowledgments
This study forms part of the Science Partnerships for the Assessment of Complex Earth System Processes (SPACES) project: groundwater/seawater interaction along the southern coast, WCP, South Africa and its effects on ecosystem services and sustainable water resource management. We would like to thank M. Wallace (Elsenburg, South Africa), A. van Niekerk (Centre for Geographical Analysis, Stellenbosch University, South Africa), B. Egoh (Council for Scientific and Industrial Research, South Africa) and the Agricultural Research Council-Institute for Soil, Climate and Water for their corporation and the provision of data.
Conflicts of Interest
All authors explicitly reveal all potential financial, personal, or professional conflicts of interest. All authors explicitly state that there is no such conflict regarding the publication of the article.
References
- Millennium Ecosystem Assessment. Ecosystems and Human Well-Being: Synthesis; Island Press: Washington, DC, USA, 2005; ISBN 1-59726-040-1. [Google Scholar]
- Haines-Young, R.; Potschin, M. Typology/Classification of Ecosystem Services. In OpenNess Ecosystem Services Reference Book; Potschin, M., Jax, K., Eds.; EC FP7 Grant Agreement no. 308428; 2014; Available online: http://www.openness-project.eu/library/reference-book (accessed on 1 May 2018).
- Burkhard, B.; Kroll, F.; Müller, F.; Windhorst, W. Capacities to provide ecosystem services—A concept for land-cover based assessments. Landsc. Online 2009, 15, 1–22. [Google Scholar] [CrossRef]
- Maes, J.; Crossman, N.D.; Burkhard, B. Mapping ecosystem services. In Routledge Handbook of Ecosystem Services; Potschin, P., Haines-Young, R., Fish, R., Turner, R.K., Eds.; Routledge: London, UK, 2016; pp. 188–204. ISBN 978-1-138-02508-0. [Google Scholar]
- Crossman, N.D.; Burkhard, B.; Nedkov, S. Quantifying and mapping ecosystem services. Int. J. Biodivers. Sci. Ecosyst. Serv. Manag. 2012, 8, 1–4. [Google Scholar] [CrossRef]
- De Groot, R.S.; Alkemade, R.; Braat, L.; Hein, L.; Willemen, L. Challenges in integrating the concept of ecosystem services and values in landscape planning, management and decision making. Ecol. Complex. 2010, 7, 260–272. [Google Scholar] [CrossRef]
- Burkhard, B.; de Groot, R.; Costanza, R.; Seppelt, R.; Jørgensen, S.E.; Potschin, M. Solutions for sustaining natural capital and ecosystem services. Ecol. Indic. 2012, 21, 1–6. [Google Scholar] [CrossRef]
- Lüke, A.; Hack, J. Comparing the applicability of commonly used hydrological ecosystem services models for integrated decision-support. Sustainability 2018, 10, 346. [Google Scholar] [CrossRef]
- Duku, C.; Rathjens, H.; Zwart, S.J.; Hein, L. Towards ecosystem accounting: A comprehensive approach to modelling multiple hydrological ecosystem services. Hydrol. Earth Syst. Sci. 2015, 19, 4377–4396. [Google Scholar] [CrossRef]
- Nedkov, S.; Boyanova, K.; Burkhard, B. Quantifying, modelling and mapping ecosystem services in watersheds. In Ecosystem Services and River Basin Ecohydrology; Chicharo, L., Müller, F., Fohrer, N., Eds.; Springer: Dordrecht, The Netherlands; Berlin/Heidelberg, Germany, 2015; pp. 133–150. ISBN 978-94-017-9845-7. [Google Scholar]
- Lautenbach, S.; Maes, J.; Kattwinkel, M.; Seppelt, R.; Strauch, M.; Scholz, M.; Schulz-Zunkel, C.; Volk, M.; Weinert, J.; Dormann, C.F. Mapping water quality-related ecosystem services: Concepts and applications for nitrogen retention and pesticide risk reduction. Int. J. Biodivers. Sci. Ecosyst. Serv. Manag. 2012, 8, 35–49. [Google Scholar] [CrossRef]
- Lima, J.E.F.W.; de Gois Aquino, F.; Chaves, T.A.; Lorz, C. Development of a spatially explicit approach for mapping ecosystem services in Brazilian Savanna—MapES. Ecol. Indic. 2017, 82, 513–525. [Google Scholar] [CrossRef]
- Vrebos, D.; Staes, J.; Vadenbroucke, T.; D’Haeyer, T.; Johnston, R.; Muhumuza, M.; Kasabeke, C.; Meire, P. Mapping ecosystem service flows with land cover scoring maps for data scarce regions. Ecosyst. Serv. 2015, 13, 28–40. [Google Scholar] [CrossRef]
- Burkhard, B.; Kandziora, M.; Hou, Y.; Müller, F. Ecosystem service potentials, flows and demands–concepts for spatial localisation, indication and quantification. Landsc. Online 2014, 34, 1–32. [Google Scholar] [CrossRef]
- Koschke, L.; Lorz, C.; Fürst, C.; Lehmann, T.; Makeschin, F. Assessing hydrological and provisioning ecosystem services in a case study in Western Central Brazil. Ecol. Process. 2014, 3. [Google Scholar] [CrossRef]
- Lorz, C.; Neumann, C.; Bakker, F.; Pietzsch, K.; Weiß, H.; Makeschin, F. A web-based planning support tool for sediment management in a meso-scale river basin in Western Central Brazil. J. Environ. Manag. 2013, 127, 15–23. [Google Scholar] [CrossRef]
- Burkhard, B.; Kroll, F.; Nedkov, S.; Müller, F. Mapping ecosystem service supply, demand and budgets. Ecol. Indic. 2012, 21, 17–29. [Google Scholar] [CrossRef]
- Egoh, B.N.; Reyers, B.; Rouget, M.; Richardson, D.M. Identifying priority areas for ecosystem service management in South African grasslands. J. Environ. Manag. 2011, 92, 1642–1650. [Google Scholar] [CrossRef]
- O’Farrell, P.J.; Reyers, B.; Le Maitre, D.C.; Milton, S.J.; Egoh, B.; Maherry, A.; Colvin, C.; Atkinson, D.; de Lange, W.; Blignaut, J.N.; et al. Multi-functional landscapes in semi-arid environments: Implications for biodiversity and ecosystem services. Landsc. Ecol. 2010, 25, 1231–1246. [Google Scholar] [CrossRef]
- Egoh, B.; Reyers, B.; Rouget, M.; Boded, M.; Richardson, D.M. Spatial congruence between biodiversity and ecosystem services in South Africa. Biol. Conserv. 2009, 142, 553–562. [Google Scholar] [CrossRef]
- Egoh, B.; Reyers, B.; Rouget, M.; Richardson, D.M.; Le Maitre, D.C.; van Jaarsveld, A.S. Mapping ecosystem services for planning and management. Agric. Ecosyst. Environ. 2008, 127, 135–140. [Google Scholar] [CrossRef]
- Reyers, B.; O’Farrell, P.J.; Cowling, R.M.; Egoh, B.N.; Le Maitre, D.C.; Vlok, J.H.J. Ecosystem services, land-cover change, and stakeholders: Finding a sustainable foothold for a semiarid biodiversity hotspot. Ecol. Soc. 2009, 14, 38. [Google Scholar] [CrossRef]
- O’Farrell, P.J.; Anderson, P.M.L.; Le Maitre, D.C.; Holmes, P.M. Insights and opportunities offered by a rapid ecosystem service assessment in promoting a conservation agenda in an urban biodiversity hotspot. Ecol. Soc. 2012, 17, 27. [Google Scholar] [CrossRef]
- Department of Environmental Affairs and Development Planning (DEAP). Western Cape State of the Environment Report, (Year One); Department of Environmental Affairs and Development Planning (DEAP): Cape Town, South Africa, 2005.
- Lynch, S.D. Development of a Raster Database of Annual, Monthly and Daily Rainfall for Southern Africa; Report No: 1156/1/04; Water Research Commission (WRC): Cape Town, South Africa, 2004. [Google Scholar]
- Van den Berg, E.C.; Plarre, C.; Van den Berg, H.M.; Thompson, M.W. The South African National Land Cover (NLC) 2000; Report No: GW/A/2008/86; Agricultural Research Council-Institute for Soil, Climate and Water (ARC-ISCW): Pretoria, South Africa, 2008. [Google Scholar]
- Western Cape Department of Agriculture (WCDA). Mapping of Agricultural Commodities in the Western Cape 2013, Undertaken by Spatial Intelligence (SiQ) on Behalf of the Western Cape Department of Agriculture, South Africa; Western Cape Department of Agriculture: Cape Town, South Africa, 2013.
- Manning, J. Field Guide to Fynbos; Struik Nature: Cape Town, South Africa, 2007; ISBN 9781770072657. [Google Scholar]
- Le Roux, J.J.; Morgenthal, T.L.; Malherbe, J.; Pretorius, D.J.; Sumner, P.D. Water erosion prediction at a national scale for South Africa. Water SA 2008, 34, 305–314. [Google Scholar]
- Gebel, M.; Bürger, S.; Wallace, M.; Malherbe, H.; Vogt, H.; Lorz, C. Simulation of land use impacts on sediment and nutrient transfer in coastal areas of Western Cape, South Africa. Chang. Adapt. Socioecol. Syst. 2017, 3, 1–17. [Google Scholar] [CrossRef]
- Nel, J.L.; Roux, D.J.; Maree, G.; Kleynhans, C.J.; Moolman, J.; Reyers, B.; Rouget, M.; Cowling, R.M. Rivers in peril inside and outside protected areas: A systematic approach to conservation assessment of river ecosystems. Divers. Distrib. 2007, 13, 341–352. [Google Scholar] [CrossRef]
- Pool-Stanvliet, R.; Duffell-Canham, A.; Pence, G.; Smart, R. Western Cape Biodiversity Spatial Plan Handbook; CapeNature: Stellenbosch, South Africa, 2017; ISBN 978-0-621-45456-7. [Google Scholar]
- Mucina, L.; Rutherford, M.C.; Powrie, L.W. Logic of the map: Approaches and procedures. In The vegetation of South Africa, Lesotho and Swaziland, 1st ed.; Mucina, L., Rutherford, M.C., Eds.; South African National Biodiversity Institute: Pretoria, South Africa, 2006; pp. 12–29. ISBN 9781919976662. [Google Scholar]
- ArcGIS version 10.1, Computer Software; Esri: Redlands, CA, USA, 2012.
- Malherbe, H.; Le Maitre, D.; Le Roux, J.; Pauleit, S.; Lorz, C. A simplified method to assess the impact of sediment and nutrient inputs on river water quality in two regions of the southern coast of South Africa. Environ. Manag. 2019. [Google Scholar] [CrossRef] [PubMed]
- O’Farrell, P.; Roux, D.; Fabricius, C.; Le Maitre, D.; Sitas, N.; Reyers, B.; Nel, J.; McCulloch, S.; Smith-Adao, L.; Roos, A.; et al. Towards Building Resilient Landscapes by Understanding and Linking Social Networks and Social Capital to Ecological Infrastructure; Report No: 2267/1/15; Water Research Commission (WRC): Cape Town, South Africa, 2015. [Google Scholar]
- Mills, A.J.; Fey, M.V. Declining soil quality in South Africa: Effects of land use on soil organic matter and surface crusting. J. Plant Soil 2004, 21, 388–398. [Google Scholar] [CrossRef]
- Scholes, R.J.; Biggs, R. A biodiversity intactness index. Nature 2005, 434, 45–49. [Google Scholar] [CrossRef] [PubMed]
- Foley, J.A.; DeFries, R.; Asner, G.P.; Barford, C.; Bonan, G.; Carpenter, S.R.; Chapin, F.S.; Coe, M.T.; Daily, G.C.; Gibbs, H.K.; et al. Global consequences of land use. Science 2005, 309, 570–574. [Google Scholar] [CrossRef] [PubMed]
- Matson, P.A.; Parton, W.J.; Power, A.G.; Swift, M.J. Agricultural intensification and ecosystem properties. Science 1997, 277, 504–509. [Google Scholar] [CrossRef] [PubMed]
- Food and Agricultural Organization (FAO). Fertilizer Use by Crop in South Africa, First Version; FAO: Rome, Italy, 2005; Available online: http://www.fao.org/tempref/agl/agll/docs/fertusesouthafrica.pdf (accessed on 1 November 2018).
- Mels, A.; Castellano, D.; Braadbaart, O.; Veenstra, S.; Dijkstra, I.; Meulmand, B.; Singels, A.; Wilsenach, J.A. Sanitation services for the informal settlements of Cape Town, South Africa. Desalination 2010, 251, 330–337. [Google Scholar] [CrossRef]
- Marks, R.; Müller, M.J.; Leser, H.; Klink, H.J. Anleitung zur Bewertung des Lesitungs vermögens des Landscaftshaushaltes. In Analyse und ökologische Bewertung der Landschaft, 2nd ed.; Bastian, O., Schreiber, K., Eds.; Spektrum Akademischer Verlag: Heidelberg, Germany, 1999; ISBN 9783827409140. [Google Scholar]
- Food and Agricultural Organization (FAO). Harmonized World Soil Database v 1.2; FAO: Rome, Italy, 2012; Available online: http://www.fao.org/soils-portal/soil-survey/soil-maps-and-databases/harmonized-world-soil-database-v12/en/ (accessed on 1 April 2014).
- Van Niekerk, A. Stellenbosch University Digital Elevation Model (SUDEM)–2015 Edition; Centre for Geographical Analysis, Stellenbosch University: Stellenbosch, South Africa, 2015. [Google Scholar]
- Müller, F.; Burkhard, B.; Hou, Y.; Kruse, M.; Ma, L.; Wangai, P. Indicators for ecosystem services. In Routledge Handbook of Ecosystem Services, 1st ed.; Potschin, M., Haines-Young, R., Fish, R.U., Turner, R.K., Eds.; Routledge: New York, NY, USA, 2016; ISBN 978-1-138-02508-0. [Google Scholar]
- Kemper, N.P. Riparian Vegetation Index (RVI); Report No: 850/3/01; Water Research Commission (WRC): Cape Town, South Africa, 2001. [Google Scholar]
- Vörösmarty, C.J.; McIntyre, P.B.; Gessner, M.O.; Dudgeon, D.; Prusevich, A. Rivers in crisis: Global water insecurity for humans and biodiversity. Nature 2010, 467, 555–561. [Google Scholar] [CrossRef]
- Meybeck, M. Global analysis of river systems: From earth system controls to Anthropocene syndrome. Philos. Trans. R. Soc. Lond. Biol. Sci. 2003, 358, 1935–1955. [Google Scholar] [CrossRef]
- Malherbe, H.; Gebel, M.; Pauleit, S.; Lorz, C. Land use pollution potential of water sources along the southern coast of South Africa. Chang. Adapt. Socioecol. Syst. 2018, 4, 7–20. [Google Scholar] [CrossRef]
- Tarigan, S.; Wiegand, K.; Slamet, B. Minimum forest cover for sustainable water flow of a watershed: A case study in Jambi Province, Indonesia. Hydrol. Earth Syst. Sci. 2018, 22, 581–594. [Google Scholar] [CrossRef]
- Convention on Biological Diversity (CBD). The convention on biological diversity. In Proceedings of the 10th Meeting of the Conference of Parties (COP10): Decision X/2 on Strategic Plan for Biodiversity 2011–2020, Nagoya, Japan, 18–29 October 2010; Available online: https://www.cbd.int/decision/cop/?id=12268 (accessed on 1 November 2018).
- The Intergovernmental Science-Policy Platform on Biodiversity and Ecosystem Services (IPBES). Functions, operating principles and institutional arrangements of ecosystem services. Presented at the Second Session of the Plenary Meeting to Determine the Modalities and Institutional Arrangements for IPBES, Panama City, Panama, 16–21 April 2012; Available online: https://www.ipbes.net/system/tdf/downloads/Functions%20operating%20principles%20and%20institutional%20arrangements%20of%20IPBES_2012.pdf?file=1&type=node&id=15250 (accessed on 1 November 2018).
Figure 1.
(a) Location of the study regions along the southern coast, Western Cape Province, South Africa. (b) Land use/land cover of the study region, including the percentage coverage of each class [26,27].

Figure 2.
The 2006 natural vegetation map for the study region [33].
Figure 2.
The 2006 natural vegetation map for the study region [33].

Figure 3.
The three principal steps of the general workflow required to generate the ecosystem service and risk maps. (*ES: Ecosystem service). Figure created by authors.
Figure 3.
The three principal steps of the general workflow required to generate the ecosystem service and risk maps. (*ES: Ecosystem service). Figure created by authors.

Figure 4.
The values for different ecosystem services, reference (left) and LULC (right) maps.

Figure 5.
Risk maps showing the ecosystem service difference values from the reference to the LULC situation.
Figure 5.
Risk maps showing the ecosystem service difference values from the reference to the LULC situation.

Figure 6.
Visualization of the total ecosystem service values for the LULC and reference situations and the range of threshold values for the reference situation with lower and upper threshold values for each ecosystem service.
Figure 6.
Visualization of the total ecosystem service values for the LULC and reference situations and the range of threshold values for the reference situation with lower and upper threshold values for each ecosystem service.


Table 1.
References used to assign the values of land use/land cover (LULC) and ecosystem services.
| LULC | Erosion Control | Water Flow Regulation | Water Quality Maintenance | Soil Quality Maintenance | Biodiversity Maintenance |
|---|---|---|---|---|---|
| Natural grassland | Egoh et al. [18] Egoh et al. [20] Malherbe et al. [35] | Egoh et al. [18] Egoh et al. [20] | Malherbe et al. [35] | Egoh et al. [18] Egoh et al. [20] | Scholes and Biggs [38] |
| Natural vegetation–Fynbos | Egoh et al. [20] Malherbe et al. [35] O’Farrell et al. [36] | Egoh et al. [20] | Malherbe et al. [35] O’Farrell et al. [36] | Egoh et al. [20] Mills and Fey [37] | Manning [28] Scholes and Biggs [38] |
| Irrigated crop cultivation | Gebel et al. [30] Malherbe et al. [35] O’Farrell et al. [36] Foley et al. [39] | Foley et al. [39] | Gebel et al. [30] Malherbe et al. [35] O’Farrell et al. [36] Foley et al. [39] Matson et al. [40] FAO et al. [41] | Mills and Fey [37] Matson et al. [40] | Burkhard et al. [3] Scholes and Biggs [38] Matson et al. [40] |
| Dryland crop cultivation | Gebel et al. [30] Malherbe et al. [35] Foley et al. [39] | Burkhard et al. [14] Foley et al. [39] | Gebel et al. [30] Malherbe et al. [35] Foley et al. [39] Matson et al. [40] FAO et al. [41] | Mills and Fey [37] Matson et al. [40] | Burkhard et al. [3] Scholes and Biggs [38] Matson et al. [40] |
| Irrigated orchards | Gebel et al. [30] Malherbe et al. [35] O’Farrell et al. [36] | Burkhard et al. [14] | Gebel et al. [30] Malherbe et al. [35] O’Farrell et al. [36] FAO et al. [41] | Mills and Fey [37] | Burkhard et al. [3] Scholes and Biggs [38] |
| Irrigated wine grapes | Gebel et al. [30] Malherbe et al. [35] | Burkhard et al. [14] | Gebel et al. [30] Malherbe et al. [35] O’Farrell et al. [36] FAO et al. [41] | Mills and Fey [37] | Burkhard et al. [3] Scholes and Biggs [38] |
| Forest plantations | Malherbe et al. [35] O’Farrell et al. [36] | Malherbe et al. [35] O’Farrell et al. [36] | Mills and Fey [37] | Scholes and Biggs [38] | |
| Urban formal | Malherbe et al. [35] O’Farrell et al. [36] | Burkhard et al. [14] | Malherbe et al. [35] O’Farrell et al. [36] | Lima et al. [12] | Burkhard et al. [3] Scholes and Biggs [38] |
| Informal settlements | Malherbe et al. [35] | Malherbe et al. [35] Mels et al. [42] | |||
| Wetlands/Waterbodies (natural) | Malherbe et al. [35] O’Farrell et al. [36] | Burkhard et al. [14] | Malherbe et al. [35] O’Farrell et al. [36] | Burkhard et al. [3] | |
| Wetlands/Waterbodies (degraded) | O’Farrell et al. [36] | O’Farrell et al. [36] |
Table 2.
Assigned values of LULC classes and ecosystem service (5 = the highest capacity and 0 = no capacity).
Table 2.
Assigned values of LULC classes and ecosystem service (5 = the highest capacity and 0 = no capacity).
| LULC | Erosion Control | Water Flow Regulation | Water Quality Maintenance | Soil Quality Maintenance | Biodiversity Maintenance |
|---|---|---|---|---|---|
| Natural grassland | 5 | 5 | 5 | 5 | 5 |
| Natural vegetation–Fynbos | 5 | 5 | 5 | 5 | 5 |
| Irrigated crop cultivation | 0 | 1 | 0 | 1 | 1 |
| Dryland crop cultivation | 0 | 2 | 2 | 1 | 1 |
| Irrigated orchards | 1 | 2 | 1 | 1 | 2 |
| Irrigated wine grapes | 1 | 1 | 1 | 1 | 1 |
| Forest plantations | 1 | 2 | 3 | 2 | 2 |
| Urban formal | 4 | 1 | 4 | 0 | 2 |
| Informal settlements | 0 | 0 | 0 | 0 | 0 |
| Wetlands/Waterbodies (natural) | 5 | 3 | 5 | 5 | 5 |
| Wetlands/Waterbodies (degraded) | 3 | 2 | 3 | 3 | 3 |
Table 3.
Assigned values of landscape properties and ecosystem services.
| Soil Texture | Erosion Control | Water Flow Regulation | Water Quality Maintenance | Soil Quality Maintenance | Biodiversity Maintenance |
|---|---|---|---|---|---|
| Loamy sand | 0.9 | 0.6 | 1 | 1 | |
| Sandy loam | 0.7 | 0.7 | 1 | 1 | |
| Sandy clay loam/Loam | 0.5 | 0.8 | 1 | 1 | |
| Clay loam | 0.5 | 0.9 | 1 | 1 | |
| Loamy sand, Clay loam, Sandy clay loam—Topsoil gravel 11–30% | 0.8 | ||||
| Loamy sand, Clay loam, Sandy clay loam—Topsoil gravel <10% & Sandy loam—Topsoil gravel 11–30% | 0.7 | ||||
| Sandy loam—Topsoil gravel <10% | 0.5 | ||||
| Soil (Available water capacity in root zone nFk in l/m3) | |||||
| Sandy loam (140–200) | 0.9 | ||||
| Sandy clay loam/loam (90–140) | 0.7 | ||||
| Loamy sand (50–90) | 0.5 | ||||
| Slope (%) | |||||
| <3 | 1 | 1 | 1 | 1 | 1 |
| 36 | 0.9 | 0.9 | 0.9 | 1 | 1 |
| 6–12 | 0.8 | 0.9 | 0.8 | 0.9 | 1 |
| 12–26 | 0.7 | 0.7 | 0.7 | 0.8 | 1 |
| 26–60 | 0.5 | 0.5 | 0.5 | 0.7 | 1 |
| >60 | 0.4 | 0.3 | 0.4 | 0.6 | 1 |
| Distance (m) | |||||
| <25 | 0.4 | ||||
| 25–50 | 0.6 | ||||
| 50–125 | 0.7 | ||||
| 125–500 | 0.8 | ||||
| >500 | 1 |
Table 4.
Total ecosystem service values for the LULC and reference situations, range factors, and the calculated lower and upper threshold values for each ecosystem service. The lower and upper threshold values indicate the range of threshold values for the reference situation.
Table 4.
Total ecosystem service values for the LULC and reference situations, range factors, and the calculated lower and upper threshold values for each ecosystem service. The lower and upper threshold values indicate the range of threshold values for the reference situation.
| Ecosystem Service | Total Ecosystem Service Values | Range Factors | Thresholds of Ecosystem Service Values | ||
|---|---|---|---|---|---|
| LULC | Reference | Lower | Upper | ||
| Erosion control | 1.82 | 3.06 | 0.3 | 2.14 | 3.98 |
| Water flow regulation | 1.15 | 1.72 | 0.1 | 1.55 | 1.89 |
| Water quality maintenance | 2.15 | 2.98 | 0.3 | 2.09 | 3.87 |
| Soil quality maintenance | 2.86 | 4.59 | 0.4 | 2.75 | 5 |
| Biodiversity maintenance | 3.30 | 5 | 0.4 | 3 | 5 |
© 2019 by the authors. Licensee MDPI, Basel, Switzerland. This article is an open access article distributed under the terms and conditions of the Creative Commons Attribution (CC BY) license (http://creativecommons.org/licenses/by/4.0/).
Share and Cite
MDPI and ACS Style
Malherbe, H.; Pauleit, S.; Lorz, C. Mapping the Loss of Ecosystem Services in a Region Under Intensive Land Use Along the Southern Coast of South Africa. Land 2019, 8, 51. https://0-doi-org.brum.beds.ac.uk/10.3390/land8030051
AMA Style
Malherbe H, Pauleit S, Lorz C. Mapping the Loss of Ecosystem Services in a Region Under Intensive Land Use Along the Southern Coast of South Africa. Land. 2019; 8(3):51. https://0-doi-org.brum.beds.ac.uk/10.3390/land8030051
Chicago/Turabian StyleMalherbe, Hanlie, Stephan Pauleit, and Carsten Lorz. 2019. "Mapping the Loss of Ecosystem Services in a Region Under Intensive Land Use Along the Southern Coast of South Africa" Land 8, no. 3: 51. https://0-doi-org.brum.beds.ac.uk/10.3390/land8030051
Note that from the first issue of 2016, this journal uses article numbers instead of page numbers. See further details here.