Ecosystem Productivity and Water Stress in Tropical East Africa: A Case Study of the 2010–2011 Drought


1
Department of Earth, Environmental, and Planetary Sciences, Brown University, Providence, RI 02912, USA
2
Department of Environmental Sciences, University of Virginia, Charlottesville, VA 22904, USA
*
Author to whom correspondence should be addressed.
Land 2019, 8(3), 52; https://0-doi-org.brum.beds.ac.uk/10.3390/land8030052
Submission received: 25 January 2019
/
Revised: 7 March 2019
/
Accepted: 12 March 2019
/
Published: 22 March 2019
(This article belongs to the Special Issue Global Vegetation and Land Surface Dynamics in a Changing Climate)
Abstract
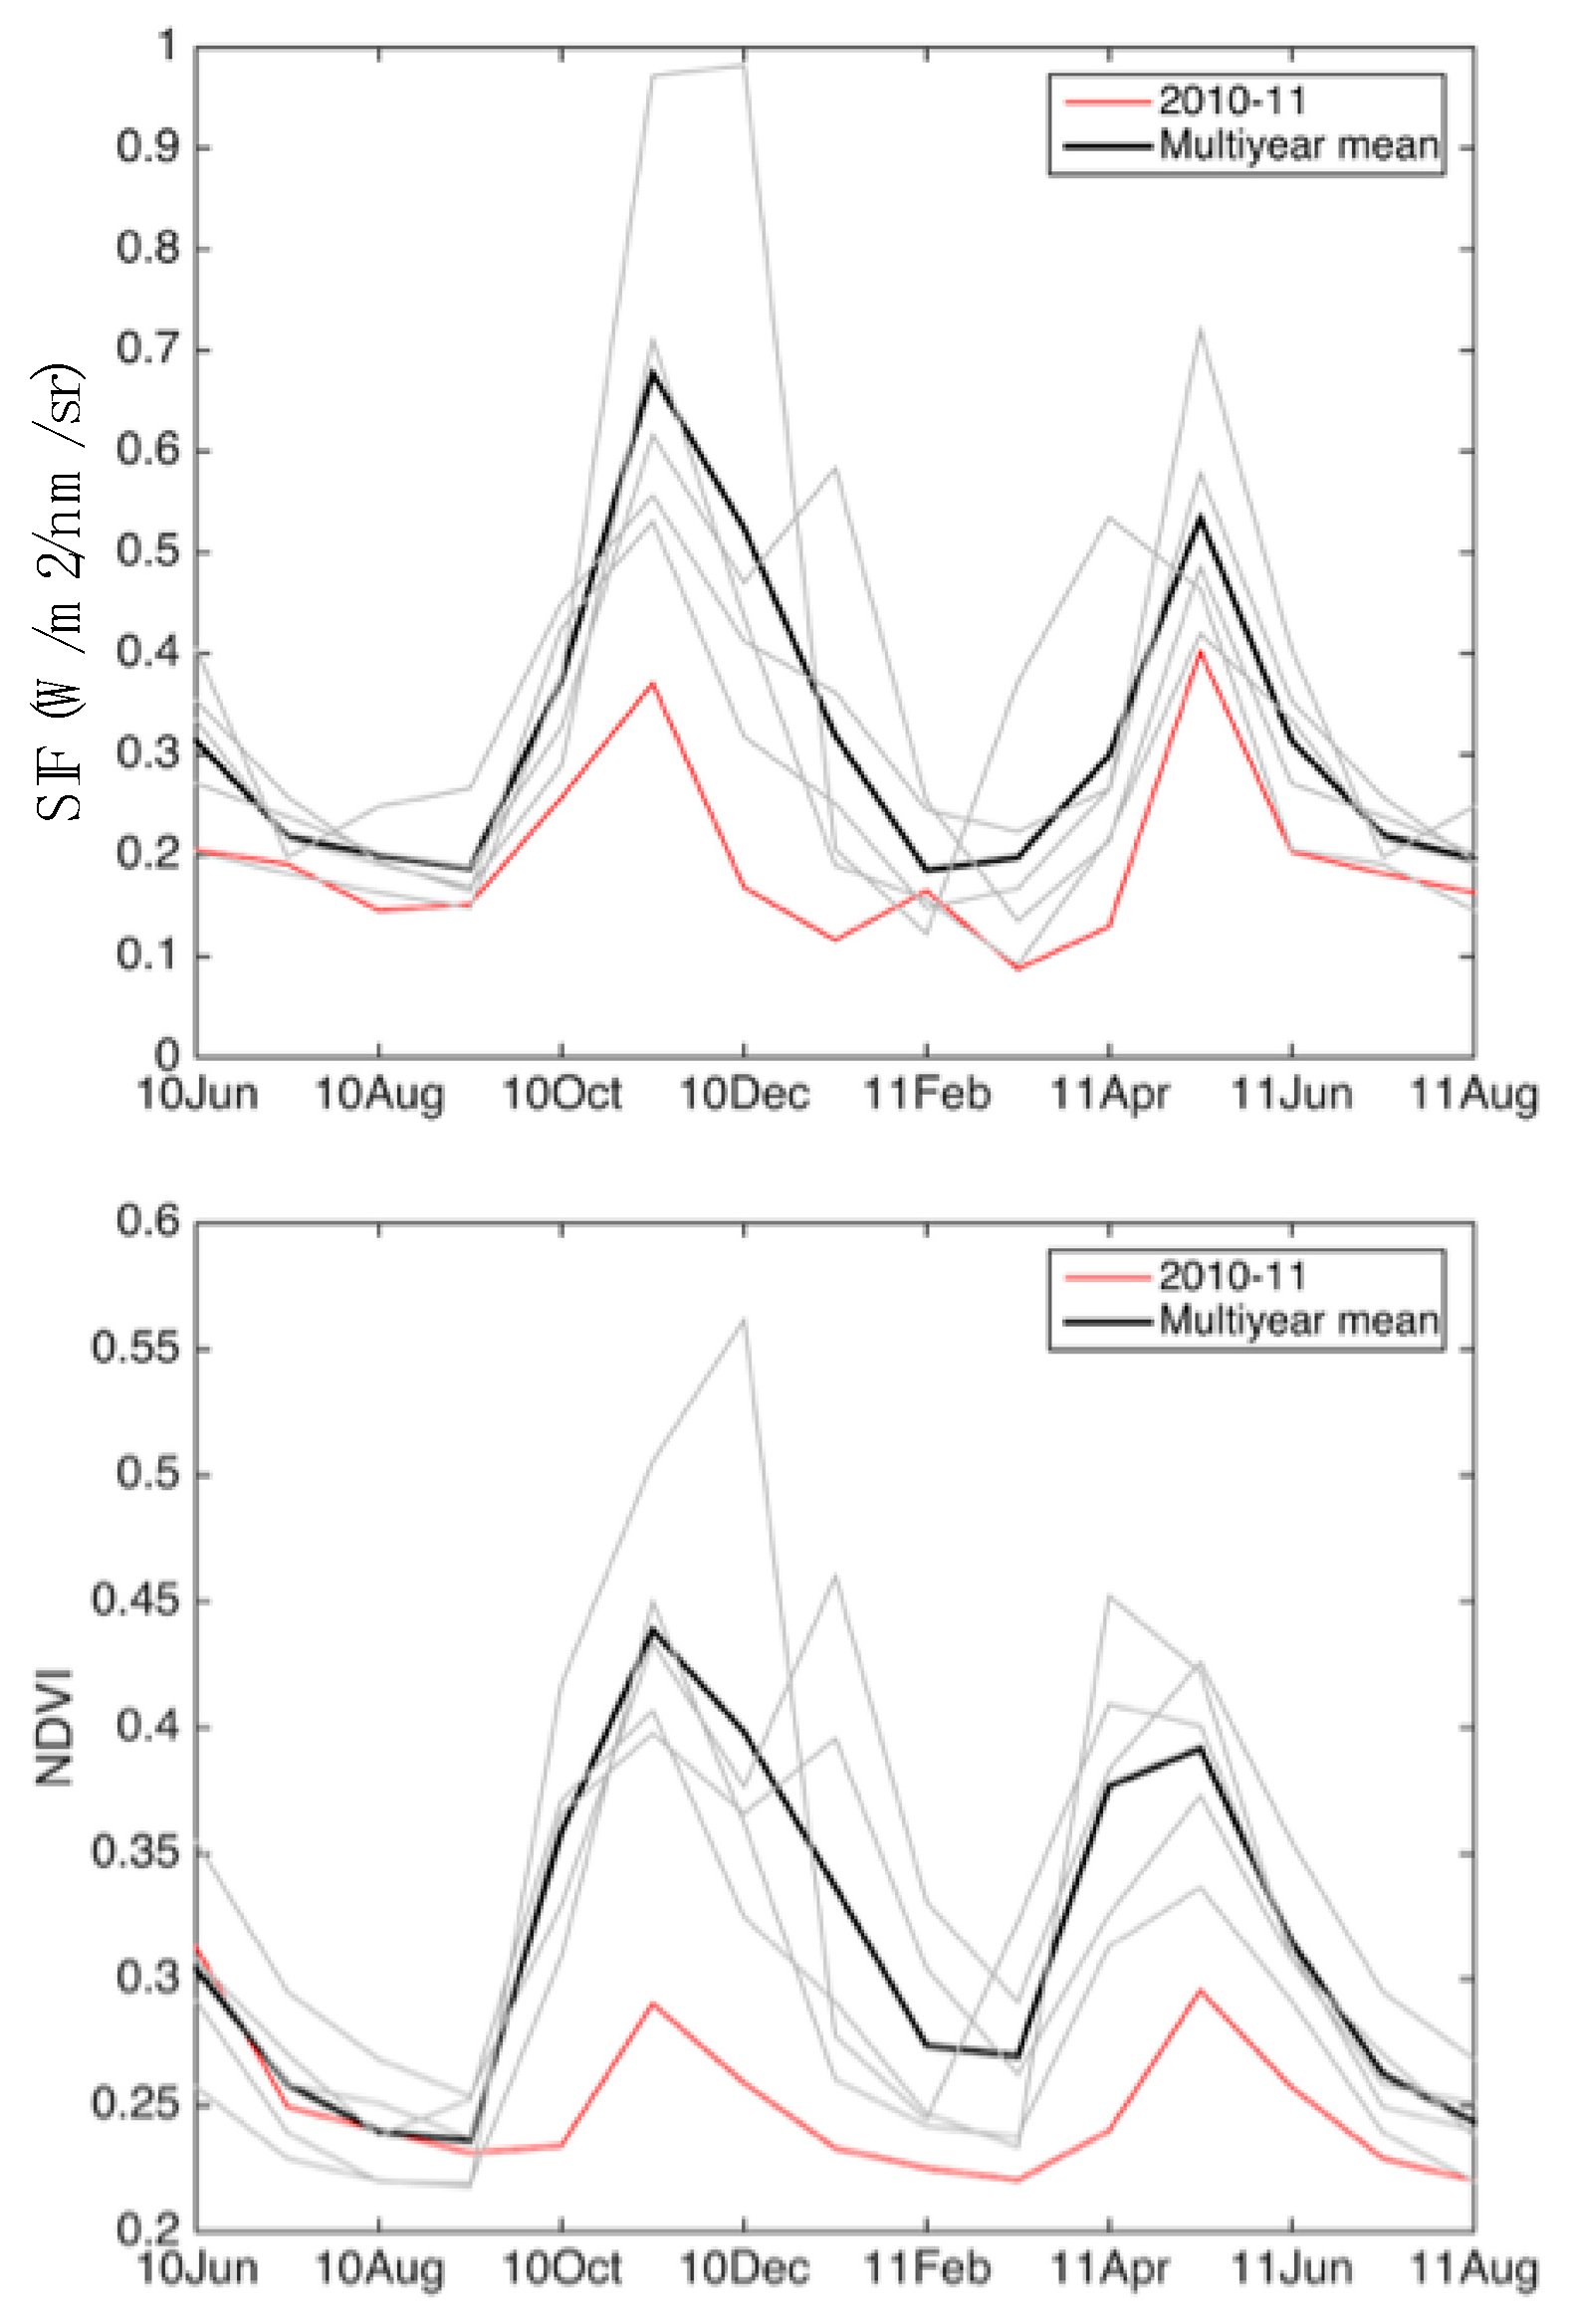
:Characterizing the spatiotemporal patterns of ecosystem responses to drought is important in understanding the impact of water stress on tropical ecosystems and projecting future land cover transitions in the East African tropics. Through the analysis of satellite measurements of solar-induced chlorophyll fluorescence (SIF) and the normalized difference vegetation index (NDVI), soil moisture, rainfall, and reanalysis data, here we characterize the 2010–2011 drought in tropical East Africa. The 2010–2011 drought included the consecutive failure of rainy seasons in October–November–December 2010 and March–April–May 2011 and extended further east and south compared with previous regional droughts. During 2010–2011, SIF, a proxy of ecosystem productivity, showed a concomitant decline (~32% lower gross primary productivity, or GPP, based on an empirical SIF–GPP relationship, as compared to the long-term average) with water stress, expressed by lower precipitation and soil moisture. Both SIF and NDVI showed a negative response to drought, and SIF captured the response to soil moisture with a lag of 16 days, even if it had lower spatial resolution and much smaller energy compared with NDVI, suggesting that SIF can also serve as an early indicator of drought in the future. This work demonstrates the unique characteristics of the 2010–2011 East African drought and the ability of SIF and NDVI to track the levels of water stress during the drought.
1. Introduction
Droughts impact not only ecosystem functions but also the well-being of affected human populations [1,2]. The temporal and geospatial responses to drought are varied, and they threaten regions that are less well-adapted to water stress. A better understanding of the relationship between photosynthesis and water stress has broad reaching implications for our understanding of the global carbon and hydrological cycles.
Roughly half of the global variability in terrestrial carbon cycling can be attributed to carbon dioxide fluxes in tropical Africa, but the impact of drought on these fluxes is still modeled with significant uncertainty [3]. Further research on continental carbon fluxes is limited by data availability and characterization of regional productivity responses to drought [4,5]. The future of ecosystem productivity in the tropics is limited by how well plants cope with water stress but the influence of seasonal water stress on productivity, particularly in Africa’s tropical regions, has rarely been characterized [6,7].
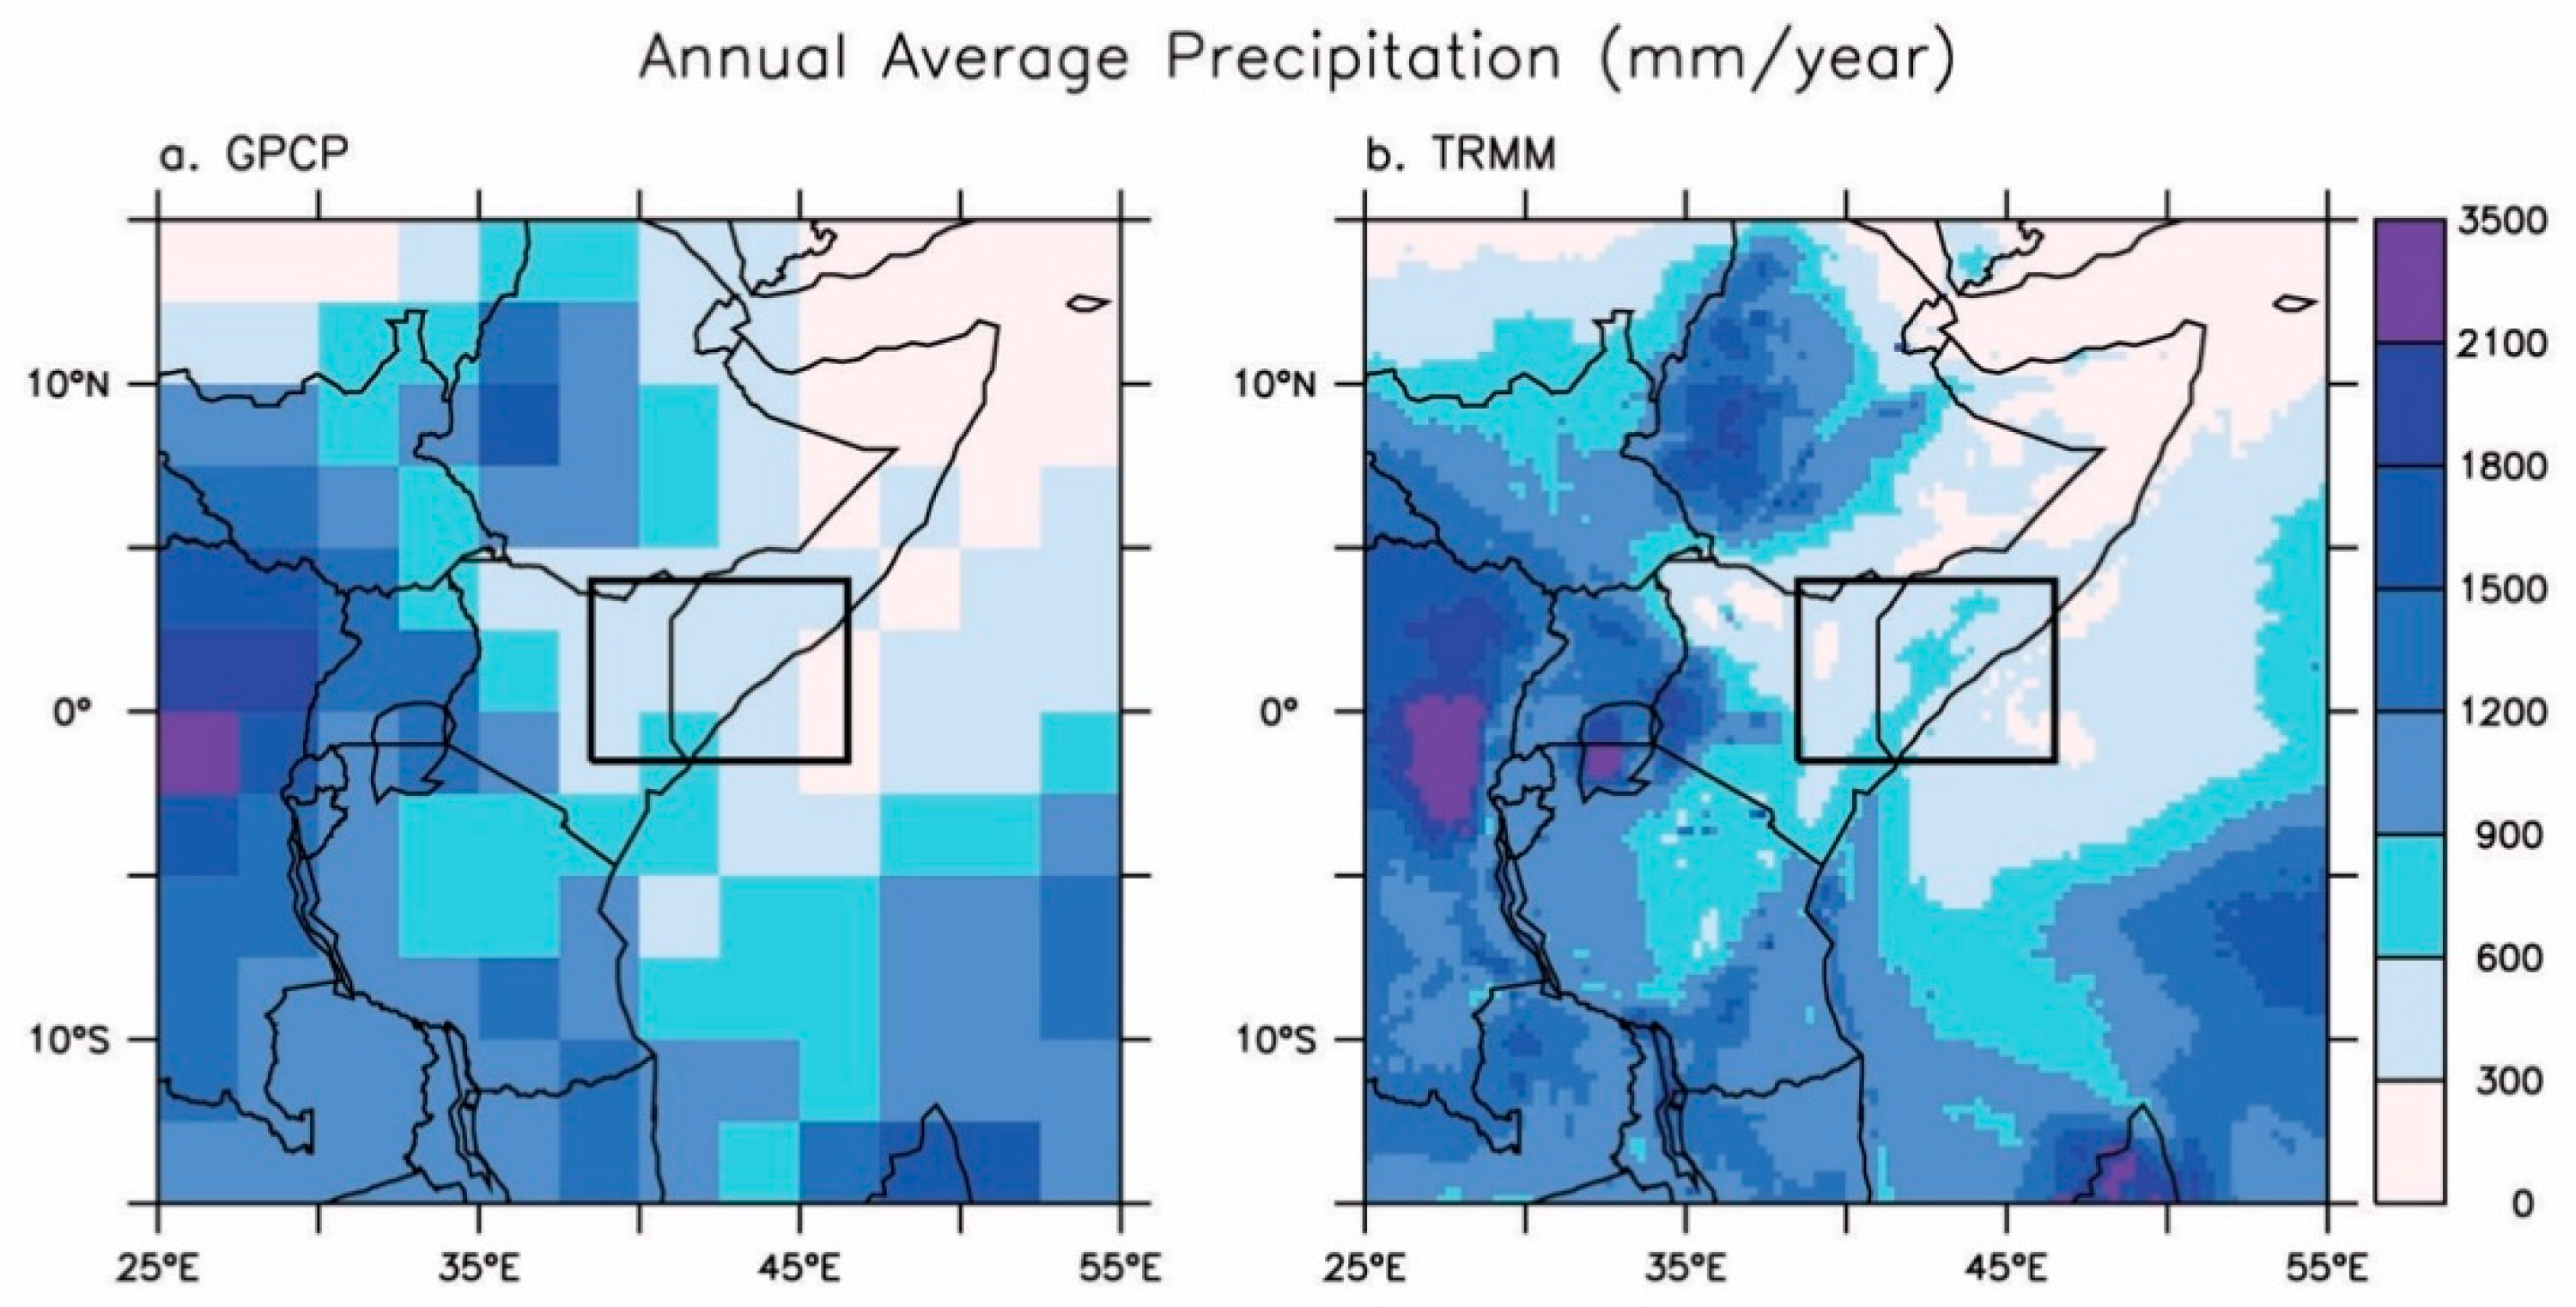
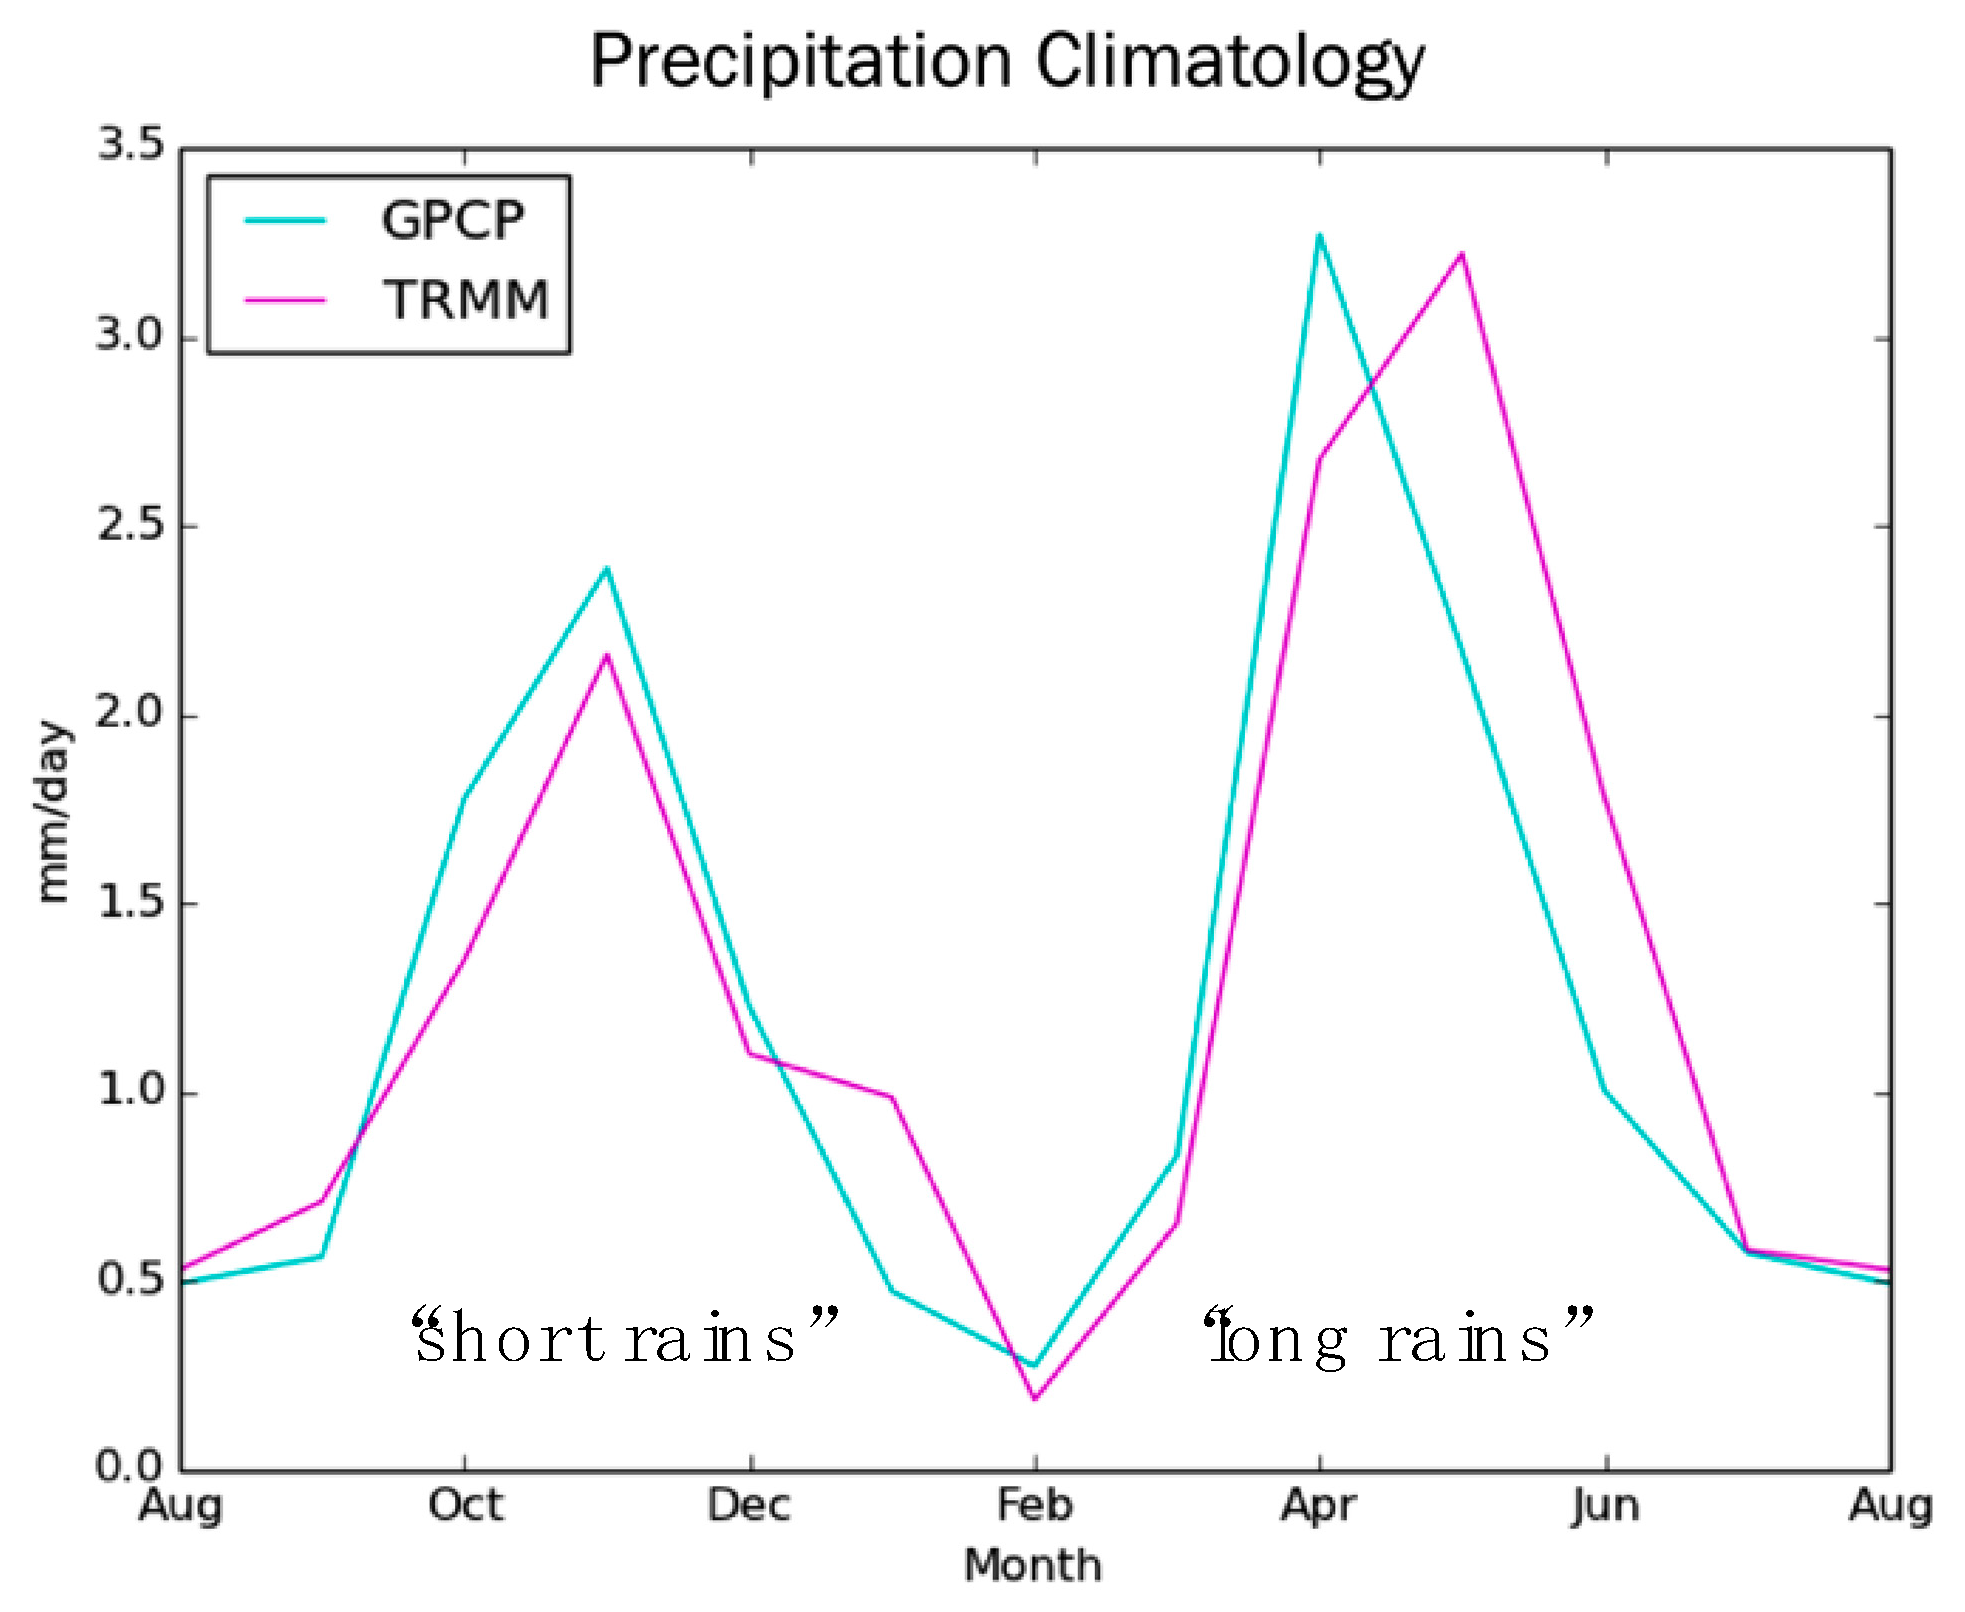
African climate is characterized by summer rainfall in the northern and southern tropics with an equatorial bimodal regime in-between. Regional variations notwithstanding (Figure 1), rainfall in tropical East Africa is delivered during the boreal spring and fall (Figure 2), accompanying local solar insolation maxima. The rainy season from March to May, known as the “long rains” in Kenya, “Belg” in Ethiopia, and “Gu” in Somalia, includes the majority of annual regional rainfall. A second rainy season occurs during the boreal fall and is referred to as the “short rains” in Kenya, “Keremt” in Ethiopia, and “Deyr” in Somalia. For simplicity, Kenyan terminology is employed in this study along with March, April, May (MAM) and October, November, December (OND) to refer to respective rainy months. In the area of our interest (black boxes in Figure 1), annual mean precipitation is 439 mm/year; this is a dry region where the two growing seasons (Figure 3) are susceptible to even small decreases in precipitation.
Climate extremes on the African continent are well studied due to their potential to produce far-reaching economic and social consequences. East Africa has faced at least one major drought per decade over the last half century [8]. That said, regional droughts are typically isolated to only one of the two rainy seasons; consecutive failed rains are uncommon phenomena given the differing influences on precipitation for each rainy season. The successive failure of 2010 short rains and 2011 long rains produced the worst East African drought in the last 60 years [9], causing humanitarian crises in East Africa.
This study seeks to characterize the productivity response of tropical East Africa to water stress while identifying the unique spatial and temporal characteristics of the 2010–2011 drought. Related research on gross primary production (GPP) change in other tropical ecosystems and drought impacts relies on satellite-derived measurements because in situ measurements there remain scarce, largely due to operational constraints [10]. Here, we use relatively new satellite measurements of solar induced chlorophyll fluorescence (SIF) [11] to study the change in East African productivity during the drought, in conjunction with other atmospheric and terrestrial datasets. In Section 2, we describe the data and methods that we used. The results and discussion are presented in Section 3 and Section 4. We summarize and conclude our study in Section 5.
2. Materials and Methods
2.1. Study Area
Our study area is the Horn of Africa region around the equator (Figure 1) where precipitation has two maxima (Figure 2). The Horn of Africa region, including Kenya, Ethiopia, and Somalia, collectively referred to as ‘East Africa’ (e.g., [12]), has been historically susceptible to droughts [13]. The El Niño Southern Oscillation (ENSO) significantly impacts OND precipitation [14]. The March and April precipitation signal, on the other hand, is more influenced by the position of the Intertropical Convergence Zone (ITCZ) (and thus the Indian Ocean warm pool temperatures [12]), and May rain is heavily influenced by the divergent low-level winds of the Indian monsoon [15].
2.2. Atmospheric Datasets
We used satellite-derived rainfall estimates from the Tropical Rainfall Measuring Mission Multisatellite (TRMM) Precipitation Analysis (TMPA) 3B43 product, averaged monthly from 1998 to 2013 at a 0.25-degree spatial resolution [16]. TRMM precipitation is calculated from the radiative and emissive properties of cloud hydrometers at visible, infrared, and microwave wavelengths, which serve as proxies for rainfall rate. The TRMM 3B43 dataset combines rain gauge, infrared, passive-microwave, and precipitation radar estimates and is generally well correlated at a monthly time scale with African rain gauge measurements across the continent [17] and over East Africa’s complex topography [18]. To supplement TRMM data, we used the Global Precipitation Climatology Project (GPCP 1979–2012) [19] dataset because it has a longer record, starting from 1979, and is thereby valuable to compare the 2010–2011 drought with other historic droughts. GPCP data are derived from rain gauge and satellite data. We note that the number of rain gauges has declined throughout this region (40 in 1979 to 5 in 2010) [20].
Soil moisture data integrate precipitation anomalies in time and were used here to depict the spatial distribution of contemporary African droughts. Soil moisture products retrieved from Advanced Scatterometer (ASCAT) and Advanced Microwave Scanning Radiometer–Earth Observing System (AMSR–E) represents soil moisture in the top 1–2 cm of soil at a spatial resolution of ~50 km, sensitive to small precipitation events [21]. Land emissivity is a function of soil moisture; AMSR–E employs a low-frequency passive microwave remote sensing approach to measure the brightness temperature at Earth’s surface [21]. The ASCAT is an active microwave sensor that measures backscatter from the surface, which is a function of soil moisture. This resulting soil moisture estimate demonstrates potential for drought monitoring [22]. Remotely-sensed soil moisture measurements are used in similar studies to monitor drought, including to characterize the spatial and temporal distribution of the 2010–2011 East Africa drought [23]. This study differentiates itself from previous research in that it characterizes the vegetation response to these conditions.
Reanalysis data from the European Centre for Medium-Range Weather Forecasts (ECMWF) were used to characterize the atmospheric and land surface conditions that led to the successive failure of the 2010–2011 East African monsoons [24]. Variables analyzed for drought monitoring extended from January 1979 to present and were analyzed to assess different drought effects and dynamics. Two m air temperature was selected due to its relationship to surface soil drying (as in [25]), its associated role as a climate driver (as in [26]), and because higher temperatures reduce water use efficiency during photosynthesis [27]; water vapor flux data were selected to monitor regional moisture transport. Sea surface temperature (SST) data were from the HadISST [28].
2.3. Terrestrial Datasets
Data related to both canopy structure and plant physiological activities were included in this study to characterize surface-level drought impacts. We used the normalized difference vegetation index (NDVI) from the moderate resolution imaging spectrometer (MODIS) MOD13C2 product. The resolution was 250 m, and we used data from 2007–2012 at 16-day, 0.05-degree resolution to characterize the change in potential or accumulated productivity [29]. We used solar induced chlorophyll fluorescence (SIF) as an indicator of actual photosynthetic activity from the Global Ozone Monitoring Experiment-2 (GOME-2)) [11]. GOME-2 measures this fluorescence signal at 9:30 am local time and provides global coverage every 1.5 days. The nadir footprint size is 40 km × 80 km; here we used both monthly and weekly GOME-2 products from NASA at a spatial resolution of 0.5°.
Fluorescence occurs when a solar photon is absorbed and is elevated to an excited state in the light reaction of photosynthesis. Typically, between 2 and 5 percent of photons absorbed by chlorophyll are re-emitted at longer wavelengths as fluorescence [30]. Canopy-level SIF measurements demonstrate that fluorescence capture productivity decreases even when NDVI remains constant [31]. SIF retrievals are also sensitive to seasonal dynamics of vegetation, independent from the structure of the canopy, and have been employed for stress detection in ground [32], aircraft [33], drone [34], and satellite-based instruments at wavelengths surrounding the oxygen A and B bands or Frauhoefer lines [35].
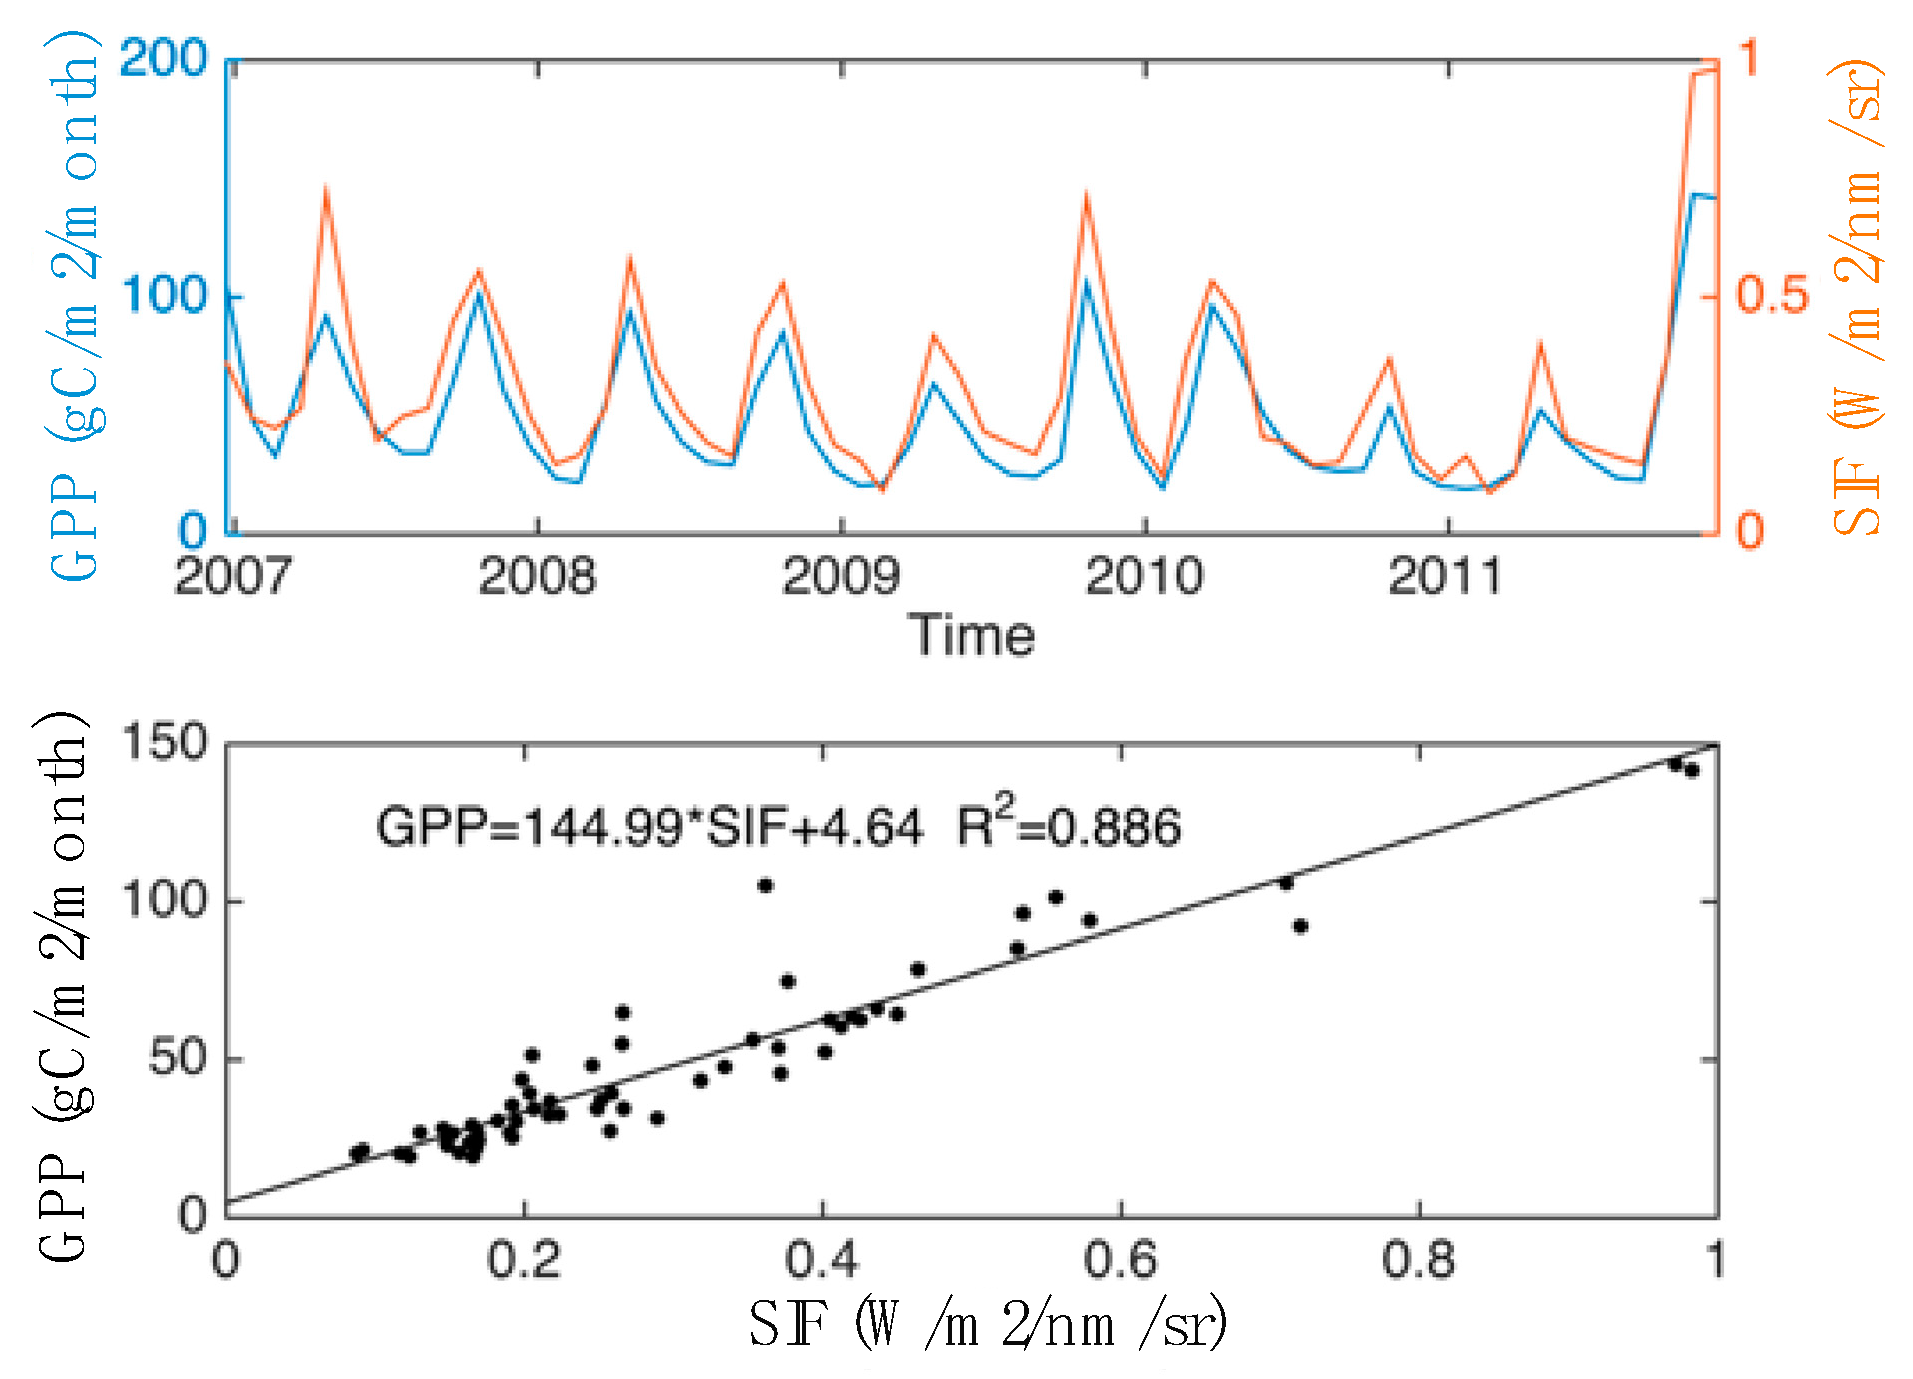
To assess the impact of the 2010–2011 drought on GPP, we scaled SIF to GPP using a linear relationship between monthly SIF and a GPP product, Fluxnet Multi-Tree Ensemble (MTE) GPP [36] during 2007–2011 (Figure 3). The Fluxnet GPP data were calculated using a machine-learning approach with eddy covariance datasets from flux towers, climatic variables, and remote sensing products. The dataset spanned from 1983 to 2011. The GOME-2 monthly SIF overlapped with Fluxnet–MTE over the 2007–2011 period. We then calculated the difference between 2010–2011 SIF and SIF climatology (2007–2012). We limited our analysis between 2007–2012 because GOME2 SIF showed a decreasing trend after 2013, likely caused by a sensor drift [37]. We calculated the GPP reduction during the drought period by using this relationship between SIF and GPP.
2.4. Analysis
Remotely-sensed proxies for terrestrial vegetation activity (SIF and NDVI) and atmospheric reanalysis data were processed via the same methodology. These data were presented as standardized anomalies (z-scores), calculated by removing climatological mean values and dividing by the standard deviation of the mean. The resulting signal was therefore corrected for seasonal variability and the differences in the magnitude of the anomaly among different variables. In this analysis, multi-year means were calculated over as long a time period as the record permitted. For zonally averaged values, the drought focus region was defined as the land area between 1.5° S to 4° N and 38.5° E to 46.5° E (see black box in Figure 1), modified from [20].
In our analysis, the 2010–2011 drought was compared to previous droughts in East Africa as recorded in the emergency events database EM-DAT: The International Disaster Database, consistent with [38]. EM-DAT provides global historical drought records. In our study we included all EM-DAT-recorded drought events in Kenya, Ethiopia, and Somalia with the exception of 1987, 1988, and 1989, which were excluded because the drought season could not be determined. Previous regional drought years in the Horn of Africa include 1980 (MAM), 1983 (OND), 1991 (OND), 1994 (MAM), 1997 (MAM), 1998 (OND), 1999 (MAM), 2000 (MAM), 2003 (MAM), 2004 (MAM), 2005 (OND), 2008 (MAM), and 2009 (MAM). We note that 1998–1999 is the only other consecutive set of drought events before the 2010–2011 drought in the past 30 years.
3. Results
3.1. Spatial and Temporal Patterns of the 2010–2011 Drought
During the 2010–2011 drought, regional reductions in rainfall were evident spatially and temporally (Figure 4, Figure 5 and Figure 6). The 2010–2011 drought, in fact, represented a significant reduction (as large as three standard deviations less) in rainfall, not only as compared to the climatology (Figure 5D and Figure 6D), but also as compared to the region’s substantial drought history (as large as 1.5 standard deviations; Figure 5F and Figure 6F). During the previous drought years (a ‘drought climatology’ is presented in Figure 5B and Figure 6B), a negative rainfall anomaly of the short rains (OND) was primarily between 40° E and 43° E, whereas the 2010 drought extended further east and with greatest intensity further westward than the average of 41.5° E (Figure 5E,F and Figure 6E,F). The decrease of the ensuing long rains (MAM) was one standard deviation below that of previous droughts (Figure 5B and Figure 6B) in the southern hemisphere, exacerbating drought started in the season of short rains. In both rainy seasons, the 2010–2011 drought extended further east than in previous drought events. The 2010–2011 drought was spatially distinct from previous regional droughts.
The ITCZ does not extend over East Africa during the rainy seasons but its spatial coherence over the West Indian Ocean can be considered as a proxy for moisture transport to East Africa because the Indian Ocean temperature alters the local Walker Circulation [13]. East Indian Ocean SST is warmer than West Indian Ocean SST (Figure 7), and this east–west gradient in the SST pattern has been associated with droughts in East Africa [13]. A strong negative correlation exists between SSTs in the tropical Indian and Pacific Oceans and East African rainfall [39].
In August and September of 2010, the precipitation that eventually became the southern maximum of the West Indian Ocean double ITCZ was significantly reduced in intensity and showed a less robust spatial integrity than was evident in the climatology (Figure 6 and Figure 7). Anomalously low precipitation over the western Indian Ocean in the months preceding the OND long rains yielded a reduced westward extension of the southern ITCZ and correspondingly reduced water vapor transport to East Africa. Ultimately, this resulted in less distinct double ITCZs over the West Indian Ocean and reduced precipitation over East Africa.
Failed formation of the double ITCZ over the West Indian Ocean continued into the MAM season, a season with a typically weaker double ITCZ (Figure 7). Precipitation in the West Indian Ocean was anomalously low during MAM of 2011, particularly over the southern maxima of the double ITCZ (Figure 8). Wind divergence from the southern ITCZ during January and February 2011, coupled with reduced long rains over the same area (Figure 9), produced a significantly weakened southern ITCZ, when compared to previous drought years. Water vapor for East African rainfall was heavily linked to this precipitation, and a relationship between rainfall in West Indian Ocean and East Africa was clear: strongly reduced rainfall in the West Indian Ocean resulted in (or was at least a strong proxy for) decreased precipitation in East Africa (e.g., [13]).
3.2. Photosynthetic Responses to the Drought
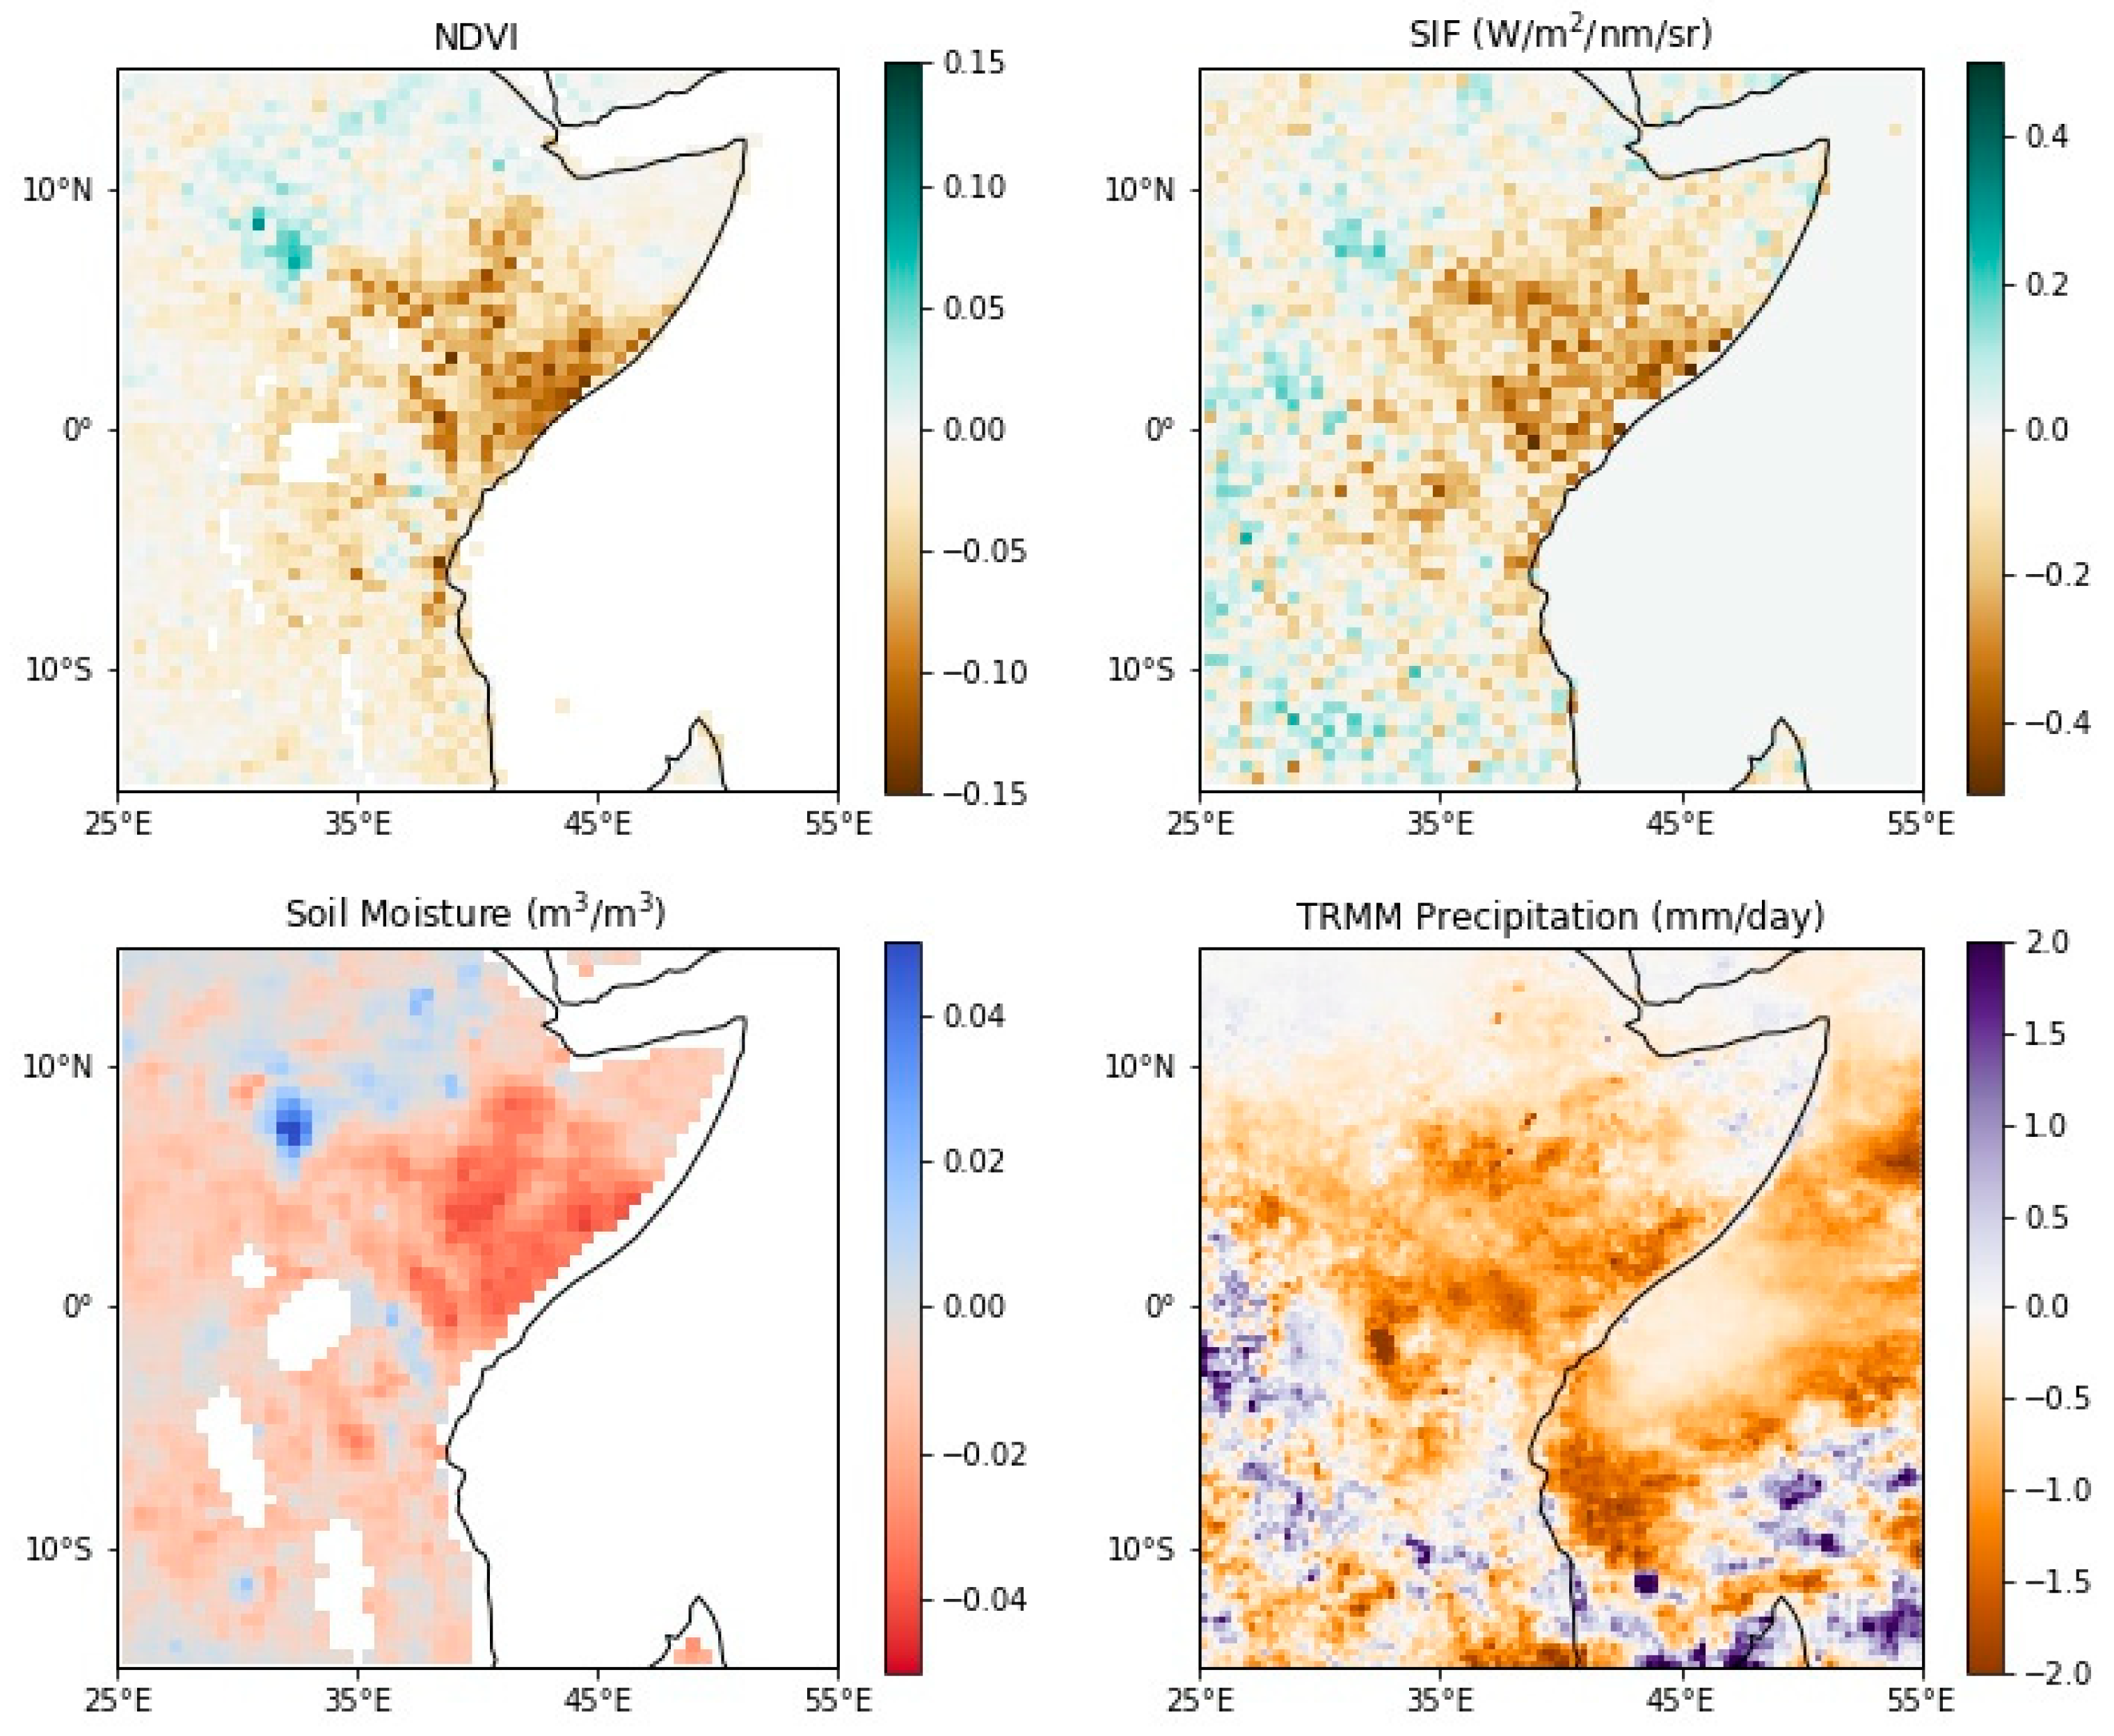
SIF captures the spatial distribution and severity of the 2010–2011 East African drought (Figure 10). Anomalously low photosynthetic activity spatially correlated with soil moisture anomaly over the duration of the drought. MODIS NDVI spatially (Figure 10) and temporally (Figure 11) approximated the extent of the 2010–2011 drought, particularly within 10° of the equator.
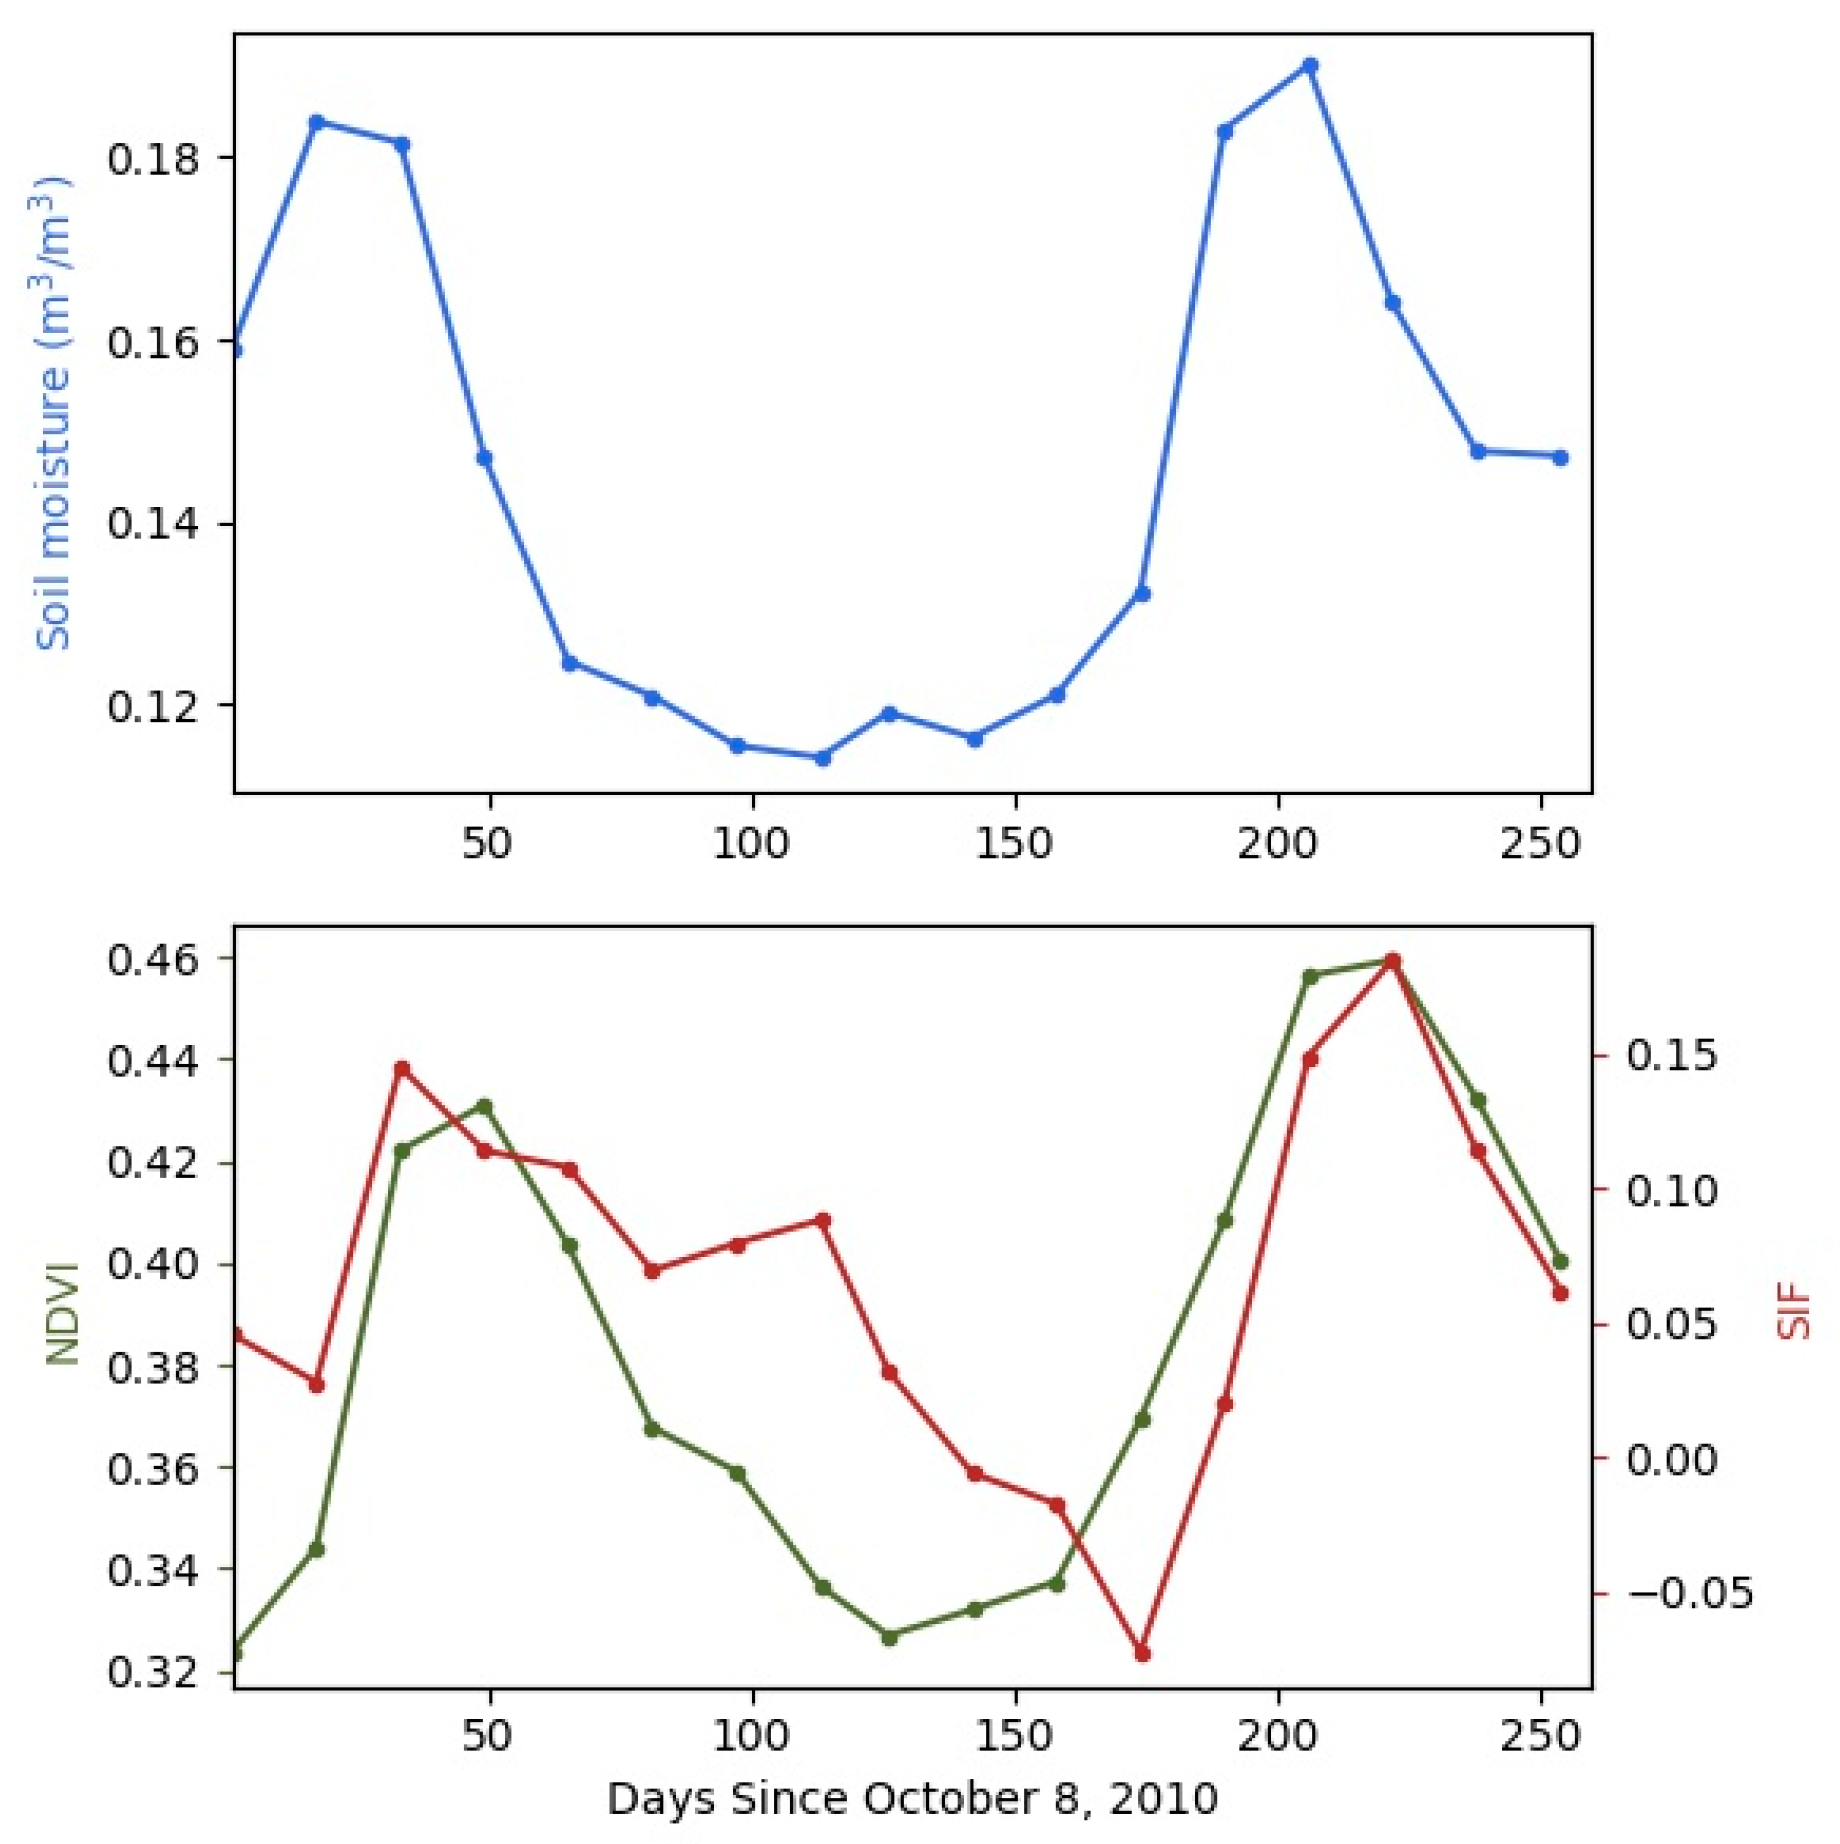
The temporal response of NDVI or SIF followed soil moisture (Figure 11). The relationship was stronger with a lagged correlation (NDVI or SIF lags soil moisture) (Table 1), probably because the response of the ecosystem productivity took time. A 16-day lagged correlation has higher coefficient values (0.83 and 0.76 for NDVI and SIF) compared with no-lag correlation (0.56 and 0.35 for NDVI and SIF,). Both SIF and NDVI values were sensitive to soil moisture or water stress (Figure 11).
The small signal of SIF (1–2% of total APAR), and the large footprint of the GOME-2 sensor likely produced significant noise, as evidenced by the anomalies on the western extent of Figure 10. The considerably greater spatial resolution of the MODIS product likely yielded spatial precision in the MODIS NDVI panel of Figure 10.
As was demonstrated in previous studies [11,35], SIF scales well with GPP (Figure 3). We calculated GPP reduction using the relationship between GOME 2 SIF and Fluxnet–MTE GPP. For the long rain period, the total reduction in GPP was 117.47 gC m−2 (95% CI: 110.55, 124.40). For the short rain period, the total reduction in GPP was 64.4 gC m2 (95% CI: 61.43, 67.38). The total reduction of GPP during this drought accounted for 32.1% of annual mean GPP (mean annual GPP in this area is 565.6 gC m−2).
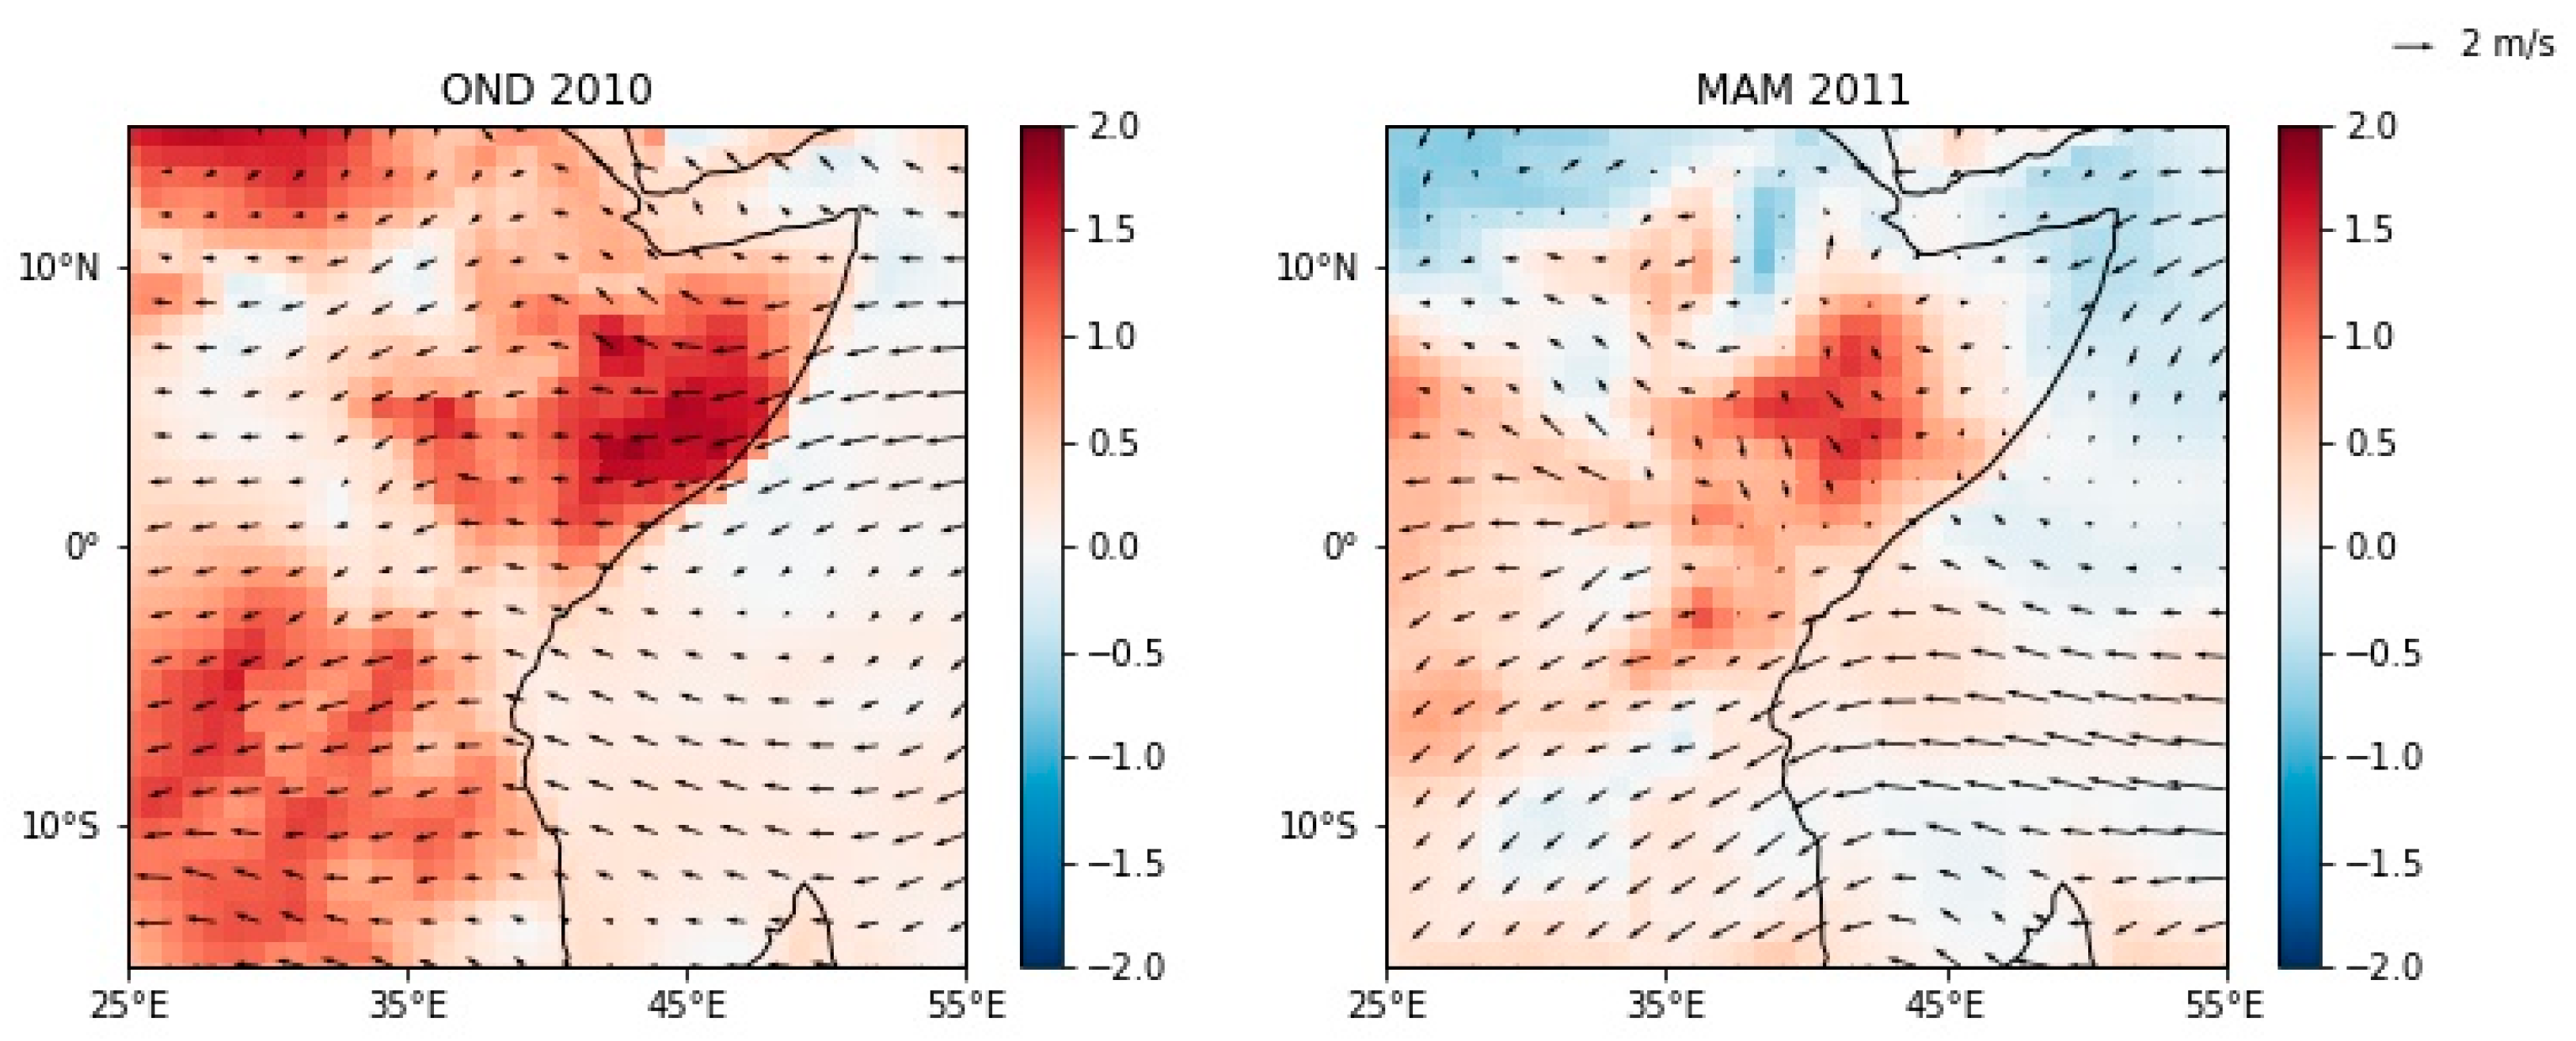
The spatial distribution of surface temperature anomalies calculated from ERAI monthly averages since 1979 suggested that decreased photosynthetic activity was correlated with temperature increases of between 0.8 and 1.3 degrees Celsius in the fall of 2010. Temperature anomalies were less pronounced in MAM 2011 (Figure 9).
4. Discussion
The mean annual cycle of precipitation in East Africa is already difficult to characterize in modeled results and interpolated data sets [40]. A dearth of regional climate data contributes to this problem: precipitation estimates are limited by a low density of rain gauges and the short record of high spatial resolution soil moisture data (SMOS data only dates back to 2010) [41]. Long term reductions to the long rains are linked to rising SSTs in the western Indian Ocean, a trend likely to continue as a consequence of anthropogenic climate change [12]. If the West Indian Ocean becomes warmer, long rains are projected to fail with increased frequency, as is evident since 1999.
Intergovernmental Panel on Climate Change (IPCC) projections for the region suggest a future characterized by increased episodic, extreme precipitation events, meaning there will be more rain and more droughts [42]. Other studies project an increase of rainfall in East Africa during the short rains in response to a large scale weakening of the Walker circulation [13]. Possible land-cover/land-use change as a consequence of agricultural technology adaption further exacerbates this uncertainty and are relevant to both natural ecosystems and agricultural regions, especially in food-insecure areas with high population densities [43].
Additionally, water stress is certain to have a substantial influence on natural ecosystems of East Africa in the coming decades. Previous research in the Amazon basin documented the impacts of drought on tropical ecosystems and was partially corroborated by this study [27]. Decreased water availability causes plant stomata to close, effectively shutting down photosynthesis. Increased temperature reduces the enzyme activity that enhances photosynthesis. Temperatures in East Africa are projected to rise with global warming and therefore the positive temperature anomaly during the OND 2010 drought offers insight into the productivity response of East Africa to this inevitable trend. Rising temperatures increase potential evaporation, thereby decreasing effective moisture. This mechanism is correlated with the drought stress influencing regional photosynthesis and suggests that water stress exhibits a first order control on ecosystem productivity in East Africa. A temporal analysis of surface temperature would be needed to corroborate this hypothesis and future work decoupling the relationship between temperature, water stress, and regional productivity is critical to an accurate projection of East Africa’s future amidst climate change.
Previous research established the impact of rising global sea surface temperatures on the short rains: the dominant mode of variability in the tropical warm pool is related to global temperatures [39]—increased temperatures are likely to further dry East Africa due to the strong relationship between “short rains” and Indian Ocean sea surface temperatures. Efforts to link East African spring rains with sea surface temperature indices in the Pacific and Indian Ocean [44] continue, thus far suggesting that MAM rains are most sensitive to January sea surface temperatures (SSTs).
Both SIF and MODIS NDVI spatially approximated the extent of the 2010–2011 drought as compared to soil moisture and previous analysis [45], and SIF captured the response almost as well as did the NDVI, even if it has lower spatial resolution and much smaller energy, suggesting that SIF can also serve as an early indicator of drought in the future. However, state-of-the-art retrievals from GOME-2 are still limited by the sensor’s design; the satellite was intended to monitor ozone, not SIF. Further, GOME-2 measurements occur at 0930 local time, well before the midday insolation and accompanying light saturation that causes stomata to close and thus shut down photosynthesis; vegetation may not be fully stressed at the time of SIF measurements. Taken together, these caveats suggest that GOME-2 SIF data may have under-reported water stress during the 2010–2011 drought. Measurements by an optimized sensor at peak insolation could serve as an improved record of vegetation stress.
The spatial extent of the failed 2011 long rains was amplified by the reduced availability of water resources following the failed short rains in the previous season. Failed rainy seasons amplify the consequences of subsequent reductions in rainfall. The converse, however, was not true in 2010–2011: anomalously high rainfall in MAM 2010 did not protect the region from the failed rains of OND 2010.
5. Conclusions
The failures of 2010 short rains (rainfall in OND) and subsequent long rains (rainfall in MAM) in East Africa caused a pronounced decrease in productivity, leading to a humanitarian crisis. Here we characterize the atmospheric and terrestrial response of tropical East Africa to the 2010–2011 drought. The 2010–2011 drought was extraordinary in temporal, spatial, and intensity anomalies even as compared to previous drought events. A stronger understanding of drought dynamics in East Africa will contribute to improved drought predictions [46] with hopes that their impacts can be prepared for in advance.
The successive failure of the rainy seasons in the 2010–2011 drought resulted in a devastating humanitarian crisis in East Africa. The decreasing trend of the long rains [12], particularly when the short rains fail as a result of the ENSO activity, could yield land cover changes and biome redistribution while fomenting social unrest and food insecurity. Future work related to the 2010–2011 East Africa drought will focus on determining the spatial variability of previous regional droughts to contextualize the unique features of the 2010–2011 event. An improved understanding of the ecosystem productivity response to water stress in these regions is critical due to the carbon impacts of increased drought incidence as a consequence of climate change. In the context of global changes in precipitation seasonality [47], this analysis concludes that SIF is an effective tool to track the response of vegetation to water stress. SIF responds to the water stress of the 2010–2011 East African drought, and it captures the response almost as well as the NDVI even if it has lower spatial resolution and much smaller energy.
Author Contributions
Conceptualization, J.-E.L.; Methodology, E.S.R., X.Y., J.-E.L.; Formal Analysis, E.S.R., X.Y.; Writing—Original Draft Preparation, E.S.R.; Writing—Review & Editing, E.S.R., X.Y., J.-E.L.; Visualization, E.S.R., X.Y.
Funding
This research received no external funding.
Acknowledgments
ESR thanks Greg Jordan-Detamore for his help with layout and design of figures. All data used in this study can be accessed online (see methods section).
Conflicts of Interest
The authors declare no conflict of interest.
References
- Allen, C.D.; Macalady, A.K.; Chenchouni, H.; Bachelet, D.; McDowell, N.; Vennetier, M.; Kitzberger, T.; Rigling, A.; Breshears, D.D.; Hogg, E.H.; et al. A global overview of drought and heat-induced tree mortality reveals emerging climate change risks for forests. For. Ecol. Manag. 2010, 259, 660–684. [Google Scholar] [CrossRef]
- Lesk, C.; Rowhani, P.; Ramankutty, N. Influence of extreme weather disasters on global crop production. Nature 2016, 529, 84–87. [Google Scholar] [CrossRef]
- Fisher, J.B.; Sikka, M.; Sitch, S.; Ciais, P.; Poulter, B.; Galbraith, D.; Lee, J.E.; Huntingford, C.; Viovy, N.; Zeng, N.; et al. African tropical rainforest net carbon dioxide fluxes in the twentieth century. Philos. Trans. R. Soc. Lond. B Biol. Sci. 2013, 368, 20120376. [Google Scholar] [CrossRef]
- Lewis, S.L. Tropical forests and the changing earth system. Philos. Trans. R. Soc. Lond. B Biol. Sci. 2006, 361, 195–210. [Google Scholar] [CrossRef]
- Lewis, S.L.; Lopez-Gonzalez, G.; Sonke, B.; Affum-Baffoe, K.; Baker, T.R.; Ojo, L.O.; Phillips, O.L.; Reitsma, J.M.; White, L.; Comiskey, J.A.; et al. Increasing carbon storage in intact African tropical forests. Nature 2009, 457, 1003–1006. [Google Scholar] [CrossRef]
- Guan, K.; Pan, M.; Li, H.; Wolf, A.; Wu, J.; Medvigy, D.; Caylor, K.K.; Sheffield, J.; Wood, E.F.; Malhi, Y.; et al. Photosynthetic seasonality of global tropical forests constrained by hydroclimate. Nat. Geosci. 2015, 8, 284–289. [Google Scholar] [CrossRef]
- Schimel, D.; Stephens, B.B.; Fisher, J.B. Effect of increasing CO2 on the terrestrial carbon cycle. Proc. Natl. Acad. Sci. USA 2015, 112, 436–441. [Google Scholar] [CrossRef]
- Mwangi, E.; Wetterhall, F.; Dutra, E.; Di Giuseppe, F.; Pappenberger, F. Forecasting droughts in East Africa. Hydrol. Earth Syst. Sci. 2014, 18, 611–620. [Google Scholar] [CrossRef]
- Loewenberg, S. Humanitarian response inadequate in Horn of Africa crisis. Lancet 2011, 378, 555–558. [Google Scholar] [CrossRef]
- Anderegg, W.R.; Plavcova, L.; Anderegg, L.D.; Hacke, U.G.; Berry, J.A.; Field, C.B. Drought’s legacy: Multiyear hydraulic deterioration underlies widespread aspen forest die-off and portends increased future risk. Glob. Chang. Biol. 2013, 19, 1188–1196. [Google Scholar] [CrossRef]
- Frankenberg, C.; Fisher, J.B.; Worden, J.; Badgley, G.; Saatchi, S.S.; Lee, J.-E.; Toon, G.C.; Butz, A.; Jung, M.; Kuze, A.; et al. New global observations of the terrestrial carbon cycle from GOSAT: Patterns of plant fluorescence with gross primary productivity. Geophys. Res. Lett. 2011, 38. [Google Scholar] [CrossRef]
- Lyon, B.; DeWitt, D.G. A recent and abrupt decline in the East African long rains. Geophs. Res. Lett. 2012, 39. [Google Scholar] [CrossRef]
- Tierney, J.E.; Smerdon, J.E.; Anchukaitis, K.J.; Seager, R. Multidecadal variability in East African hydroclimate controlled by the Indian Ocean. Nature 2013, 493, 389–392. [Google Scholar] [CrossRef]
- Nicholson, S.E.; Kim, J. The relationship of the El Niño—Southern oscillation to African rainfall. Int. J. Climatol. 1997, 17, 117–135. [Google Scholar] [CrossRef]
- Camberlin, P.; Philippon, N. The East African March-May rainy season: Associated atmospheric dynamics and predictability over the 1968–97 period. J. Clim. 2002, 15, 1002–1019. [Google Scholar] [CrossRef]
- Huffman, G.J.; Bolvin, D.T.; Nelkin, E.J.; Wolff, D.B.; Adler, R.F.; Gu, G.; Hong, Y.; Bowman, K.P.; Stocker, E.F. The TRMM Multisatellite Precipitation Analysis (TMPA): Quasi-Global, Multiyear, Combined-Sensor Precipitation Estimates at Fine Scales. J. Hydrometeorol. 2007, 8, 38–55. [Google Scholar] [CrossRef]
- Herrmann, S.M.; Mohr, K.I. A Continental-Scale Classification of Rainfall Seasonality Regimes in Africa Based on Gridded Precipitation and Land Surface Temperature Products. J. Appl. Meteorol. Climatol. 2011, 50, 2504–2513. [Google Scholar] [CrossRef]
- Dinku, T.; Ceccato, P.; Grover-Kopec, E.; Lemma, M.; Connor, S.J.; Ropelewski, C.F. Validation of satellite rainfall products over East Africa’s complex topography. Int. J. Remote Sens. 2007, 28, 1503–1526. [Google Scholar] [CrossRef]
- Adler, R.F.; Huffman, G.J.; Chang, A.; Ferraro, R.; Xie, P.P.; Janowiak, J.; Rudolf, B.; Schneider, U.; Curtis, S.; Bolvin, D.; et al. The version-2 global precipitation climatology project (GPCP) monthly precipitation analysis (1979-present). J. Hydrometeorol. 2003, 4, 1147–1167. [Google Scholar] [CrossRef]
- Dutra, E.; Magnusson, L.; Wetterhall, F.; Cloke, H.L.; Balsamo, G.; Boussetta, S.; Pappenberger, F. The 2010–2011 drought in the Horn of Africa in ECMWF reanalysis and seasonal forecast products. Int. J. Climatol. 2013, 33, 1720–1729. [Google Scholar] [CrossRef]
- Kolassa, J.; Gentine, P.; Prigent, C.; Aires, F. Soil moisture retrieval from AMSR-E and ASCAT microwave observation synergy. Part 1: Satellite data analysis. Remote Sens. Environ. 2016, 173, 1–14. [Google Scholar] [CrossRef]
- Kolassa, J.; Gentine, P.; Prigent, C.; Aires, F.; Alemohammad, S.H. Soil moisture retrieval from AMSR-E and ASCAT microwave observation synergy. Part 2: Product evaluation. Remote Sens. Environ. 2017, 195, 202–217. [Google Scholar] [CrossRef]
- Anderson, L.O.; Malhi, Y.; Aragao, L.E.; Ladle, R.; Arai, E.; Barbier, N.; Phillips, O. Remote sensing detection of droughts in Amazonian forest canopies. New Phytol. 2010, 187, 733–750. [Google Scholar] [CrossRef]
- Dee, D.P.; Uppala, S.M.; Simmons, A.J.; Berrisford, P.; Poli, P.; Kobayashi, S.; Andrae, U.; Balmaseda, M.A.; Balsamo, G.; Bauer, P.; et al. The ERA-Interim reanalysis: Configuration and performance of the data assimilation system. Q. J. R. Meteorol. Soc. 2011, 137, 553–597. [Google Scholar] [CrossRef]
- Zhou, L.; Tian, Y.; Myneni, R.B.; Ciais, P.; Saatchi, S.; Liu, Y.Y.; Piao, S.; Chen, H.; Vermote, E.F.; Song, C.; et al. Widespread decline of Congo rainforest greenness in the past decade. Nature 2014, 509, 86–90. [Google Scholar] [CrossRef]
- Cook, K.H.; Vizy, E.K. Projected Changes in East African Rainy Seasons. J. Clim. 2013, 26, 5931–5948. [Google Scholar] [CrossRef]
- Lee, J.E.; Frankenberg, C.; van der Tol, C.; Berry, J.A.; Guanter, L.; Boyce, C.K.; Fisher, J.B.; Morrow, E.; Worden, J.R.; Asefi, S.; et al. Forest productivity and water stress in Amazonia: Observations from GOSAT chlorophyll fluorescence. Proc. Biol. Sci. 2013, 280, 20130171. [Google Scholar] [CrossRef]
- Rayner, N.A. Global analyses of sea surface temperature, sea ice, and night marine air temperature since the late nineteenth century. J. Geophys. Res. 2003, 108. [Google Scholar] [CrossRef]
- Meroni, M.; Rossini, M.; Guanter, L.; Alonso, L.; Rascher, U.; Colombo, R.; Moreno, J. Remote sensing of solar-induced chlorophyll fluorescence: Review of methods and applications. Remote Sens. Environ. 2009, 113, 2037–2051. [Google Scholar] [CrossRef]
- van der Tol, C.; Berry, J.A.; Campbell, P.K.; Rascher, U. Models of fluorescence and photosynthesis for interpreting measurements of solar-induced chlorophyll fluorescence. J. Geophys. Res. Biogeosci. 2014, 119, 2312–2327. [Google Scholar] [CrossRef]
- Daumard, F.; Champagne, S.; Fournier, A.; Goulas, Y.; Ounis, A.; Hanocq, J.-F.; Moya, I. A Field Platform for Continuous Measurement of Canopy Fluorescence. IEEE Trans. Geosci. Remote Sens. 2010, 48, 3358–3368. [Google Scholar] [CrossRef]
- Yang, X.; Tang, J.; Mustard, J.F.; Lee, J.-E.; Rossini, M.; Joiner, J.; Munger, J.W.; Kornfeld, A.; Richardson, A.D. Solar-induced chlorophyll fluorescence that correlates with canopy photosynthesis on diurnal and seasonal scales in a temperate deciduous forest. Geophys. Res. Lett. 2015, 42, 2977–2987. [Google Scholar] [CrossRef]
- Zarco-Tejada, P.J.; Morales, A.; Testi, L.; Villalobos, F.J. Spatio-temporal patterns of chlorophyll fluorescence and physiological and structural indices acquired from hyperspectral imagery as compared with carbon fluxes measured with eddy covariance. Remote Sens. Environ. 2013, 133, 102–115. [Google Scholar] [CrossRef]
- Zarco-Tejada, P.J.; González-Dugo, V.; Berni, J.A.J. Fluorescence, temperature and narrow-band indices acquired from a UAV platform for water stress detection using a micro-hyperspectral imager and a thermal camera. Remote Sens. Environ. 2012, 117, 322–337. [Google Scholar] [CrossRef]
- Guanter, L.; Zhang, Y.; Jung, M.; Joiner, J.; Voigt, M.; Berry, J.A.; Frankenberg, C.; Huete, A.R.; Zarco-Tejada, P.; Lee, J.E.; et al. Global and time-resolved monitoring of crop photosynthesis with chlorophyll fluorescence. Proc. Natl. Acad. Sci. USA 2014, 111, E1327–E1333. [Google Scholar] [CrossRef]
- Jung, M.; Reichstein, M.; Margolis, H.A.; Cescatti, A.; Richardson, A.D.; Arain, M.A.; Arneth, A.; Bernhofer, C.; Bonal, D.; Chen, J.; et al. Global patterns of land-atmosphere fluxes of carbon dioxide, latent heat, and sensible heat derived from eddy covariance, satellite, and meteorological observations. J. Geophys. Res. 2011, 116. [Google Scholar] [CrossRef]
- Zhang, Y.; Joana, J.; Gentine, P.; Zhou, S. Reduced solar-induced chlorophyll fluorescence from GOME-2 during Amazon drought caused by dataset artifacts. Glob. Chang. Biol. 2018, 24, 2229–2230. [Google Scholar] [CrossRef]
- Masih, I.; Maskey, S.; Mussá, F.E.F.; Trambauer, P. A review of droughts on the African continent: A geospatial and long-term perspective. Hydrol. Earth Syst. Sci. 2014, 18, 3635–3649. [Google Scholar] [CrossRef]
- Williams, A.P.; Funk, C. A westward extension of the warm pool leads to a westward extension of the Walker circulation, drying eastern Africa. Clim. Dyn. 2011, 37, 2417–2435. [Google Scholar] [CrossRef]
- Mariotti, L.; Coppola, E.; Sylla, M.B.; Giorgi, F.; Piani, C. Regional climate model simulation of projected 21st century climate change over an all-Africa domain: Comparison analysis of nested and driving model results. J. Geophys. Res. 2011, 116. [Google Scholar] [CrossRef]
- Sheffield, J.; Wood, E.F.; Chaney, N.; Guan, K.; Sadri, S.; Yuan, X.; Olang, L.; Amani, A.; Ali, A.; Demuth, S.; et al. A Drought Monitoring and Forecasting System for Sub-Sahara African Water Resources and Food Security. Bull. Am. Meteorol. Soc. 2014, 95, 861–882. [Google Scholar] [CrossRef]
- Stocker, T.F.; Qin, D.; Plattner, G.K.; Tignor, M.; Allen, S.K.; Boschung, J.; Nauels, A.; Xia, Y.; Bex, V.; Midgley, P.M. Cimate Change 2013: The Physical Science Basis. Intergovernmental Panel on Climate Change, Working Group I Contribution to the IPCC Fifth Assessment Report (AR5); Cambridge University Press: New York, NY, USA, 2013. [Google Scholar]
- Moore, N.; Andresen, J.; Lofgren, B.; Pijanowski, B.; Kim, D.-Y. Projected Land-Cover Change Effects on East African Rainfall under Climate Change. Int. J. Climatol. 2015, 35, 1772–1783. [Google Scholar] [CrossRef]
- Hoell, A.; Funk, C. Indo-Pacific sea surface temperature influences on failed consecutive rainy seasons over eastern Africa. Clim. Dyn. 2013, 43, 1645–1660. [Google Scholar] [CrossRef]
- Hillbruner, C.; Moloney, G. When early warning is not enough—Lessons learned from the 2011 Somalia Famine. Glob. Food Secur. 2012, 1, 20–28. [Google Scholar] [CrossRef]
- Funk, C.; Hoell, A.; Shukla, S.; Bladé, I.; Liebmann, B.; Roberts, J.B.; Robertson, F.R.; Husak, G. Predicting East African Spring Droughts Using Pacific and Indian Ocean Sea Surface Temperature Indices. Hydrol. Earth Syst. Sci. 2014, 18, 4965–4978. [Google Scholar] [CrossRef]
- Feng, X.; Porporato, A.; Rodriguez-Iturbe, I. Changes in rainfall seasonality in the tropics. Nat. Clim. Chang. 2013, 3, 811–815. [Google Scholar] [CrossRef]
Figure 1.
Average annual mean precipitation from Global Precipitation Climatology Project (GPCP; left) and Tropical Rainfall Measuring Mission Multisatellite (TRMM; right) climatology data, demonstrating the variability in rainfall regimes in the area. For zonally averaged values, the drought region is defined as the land area between 1.5° S and 4° N and 38.5° E to 46.5° E (black box).

Figure 2.
The climatology of rainfall over the drought region as presented by the two precipitation products used in this study, GPCP and TRMM.
Figure 2.
The climatology of rainfall over the drought region as presented by the two precipitation products used in this study, GPCP and TRMM.

Figure 3.
The relationship between solar-induced chlorophyll fluorescence (SIF) and gross primary production (GPP): (top) spatiotemporally-averaged SIF and GPP for the black box region in Figure 1; (bottom) the relationship between SIF and GPP.
Figure 3.
The relationship between solar-induced chlorophyll fluorescence (SIF) and gross primary production (GPP): (top) spatiotemporally-averaged SIF and GPP for the black box region in Figure 1; (bottom) the relationship between SIF and GPP.

Figure 4.
The 2010–2011 drought (red) represented a significant reduction of productivity (SIF and NDVI, Normalized Difference Vegetation Index) as compared to the mean annual cycle (thick black line) of different precipitation products averaged over the drought region.
Figure 4.
The 2010–2011 drought (red) represented a significant reduction of productivity (SIF and NDVI, Normalized Difference Vegetation Index) as compared to the mean annual cycle (thick black line) of different precipitation products averaged over the drought region.

Figure 5.
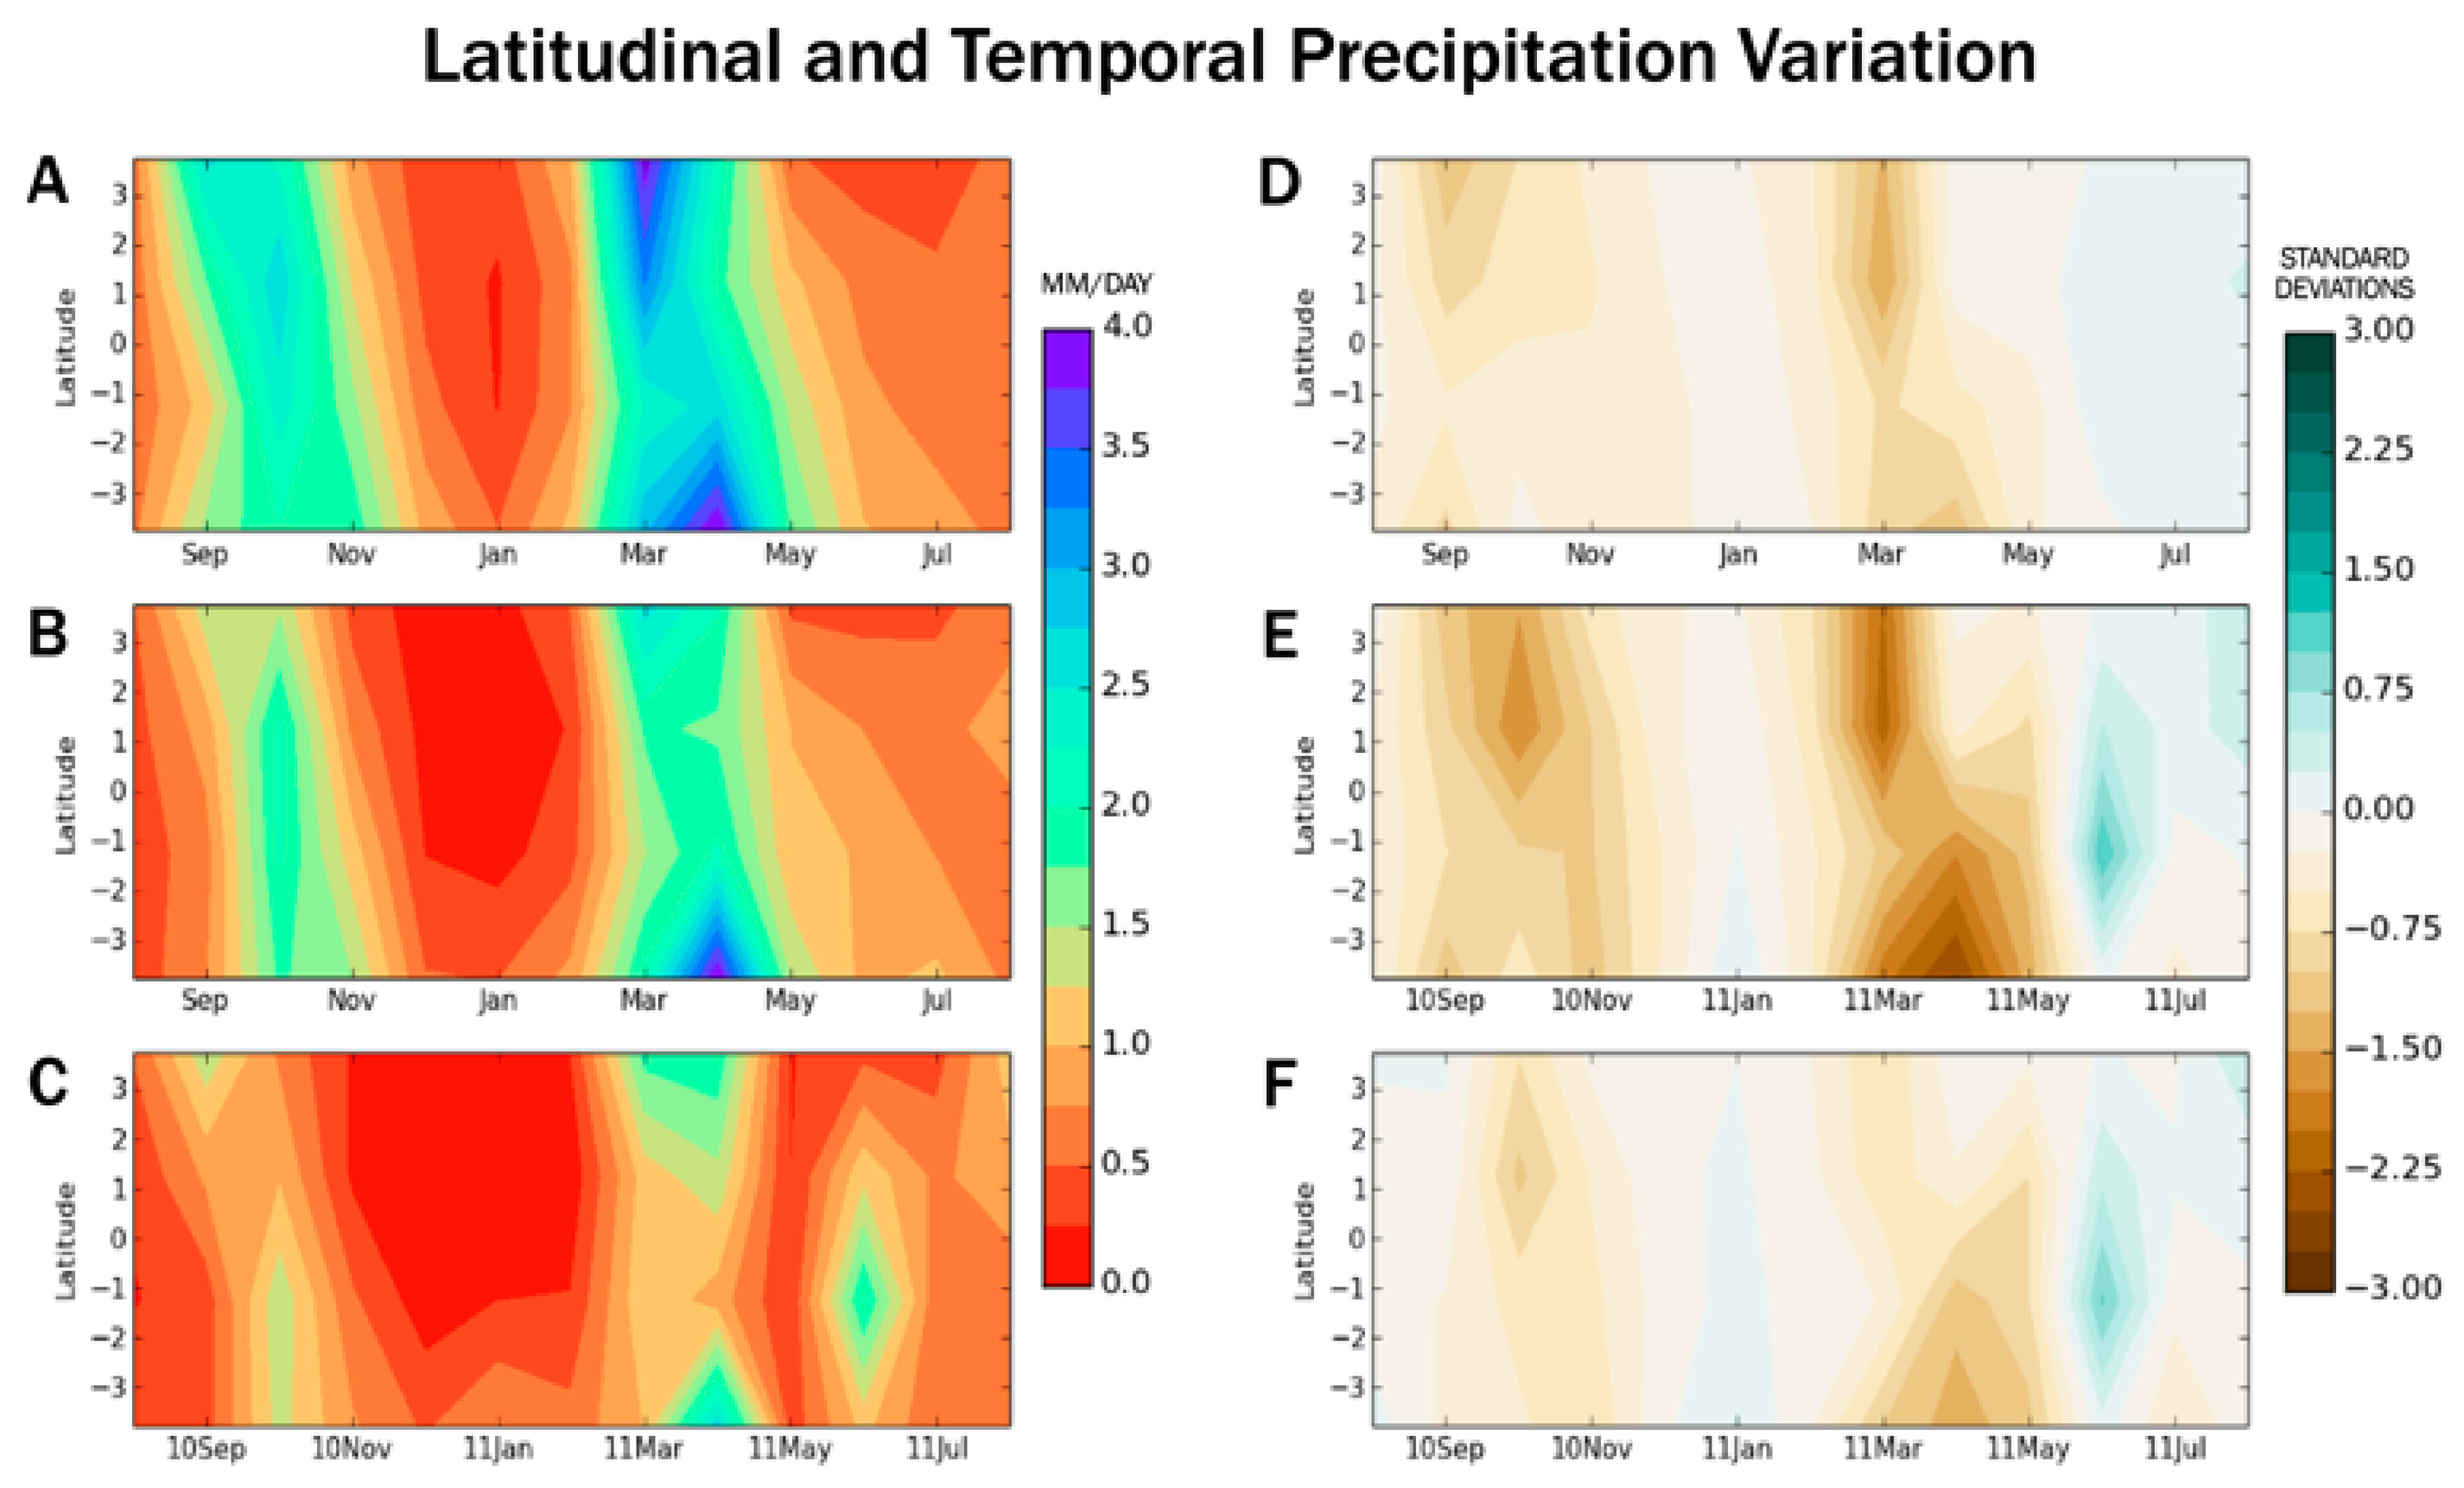
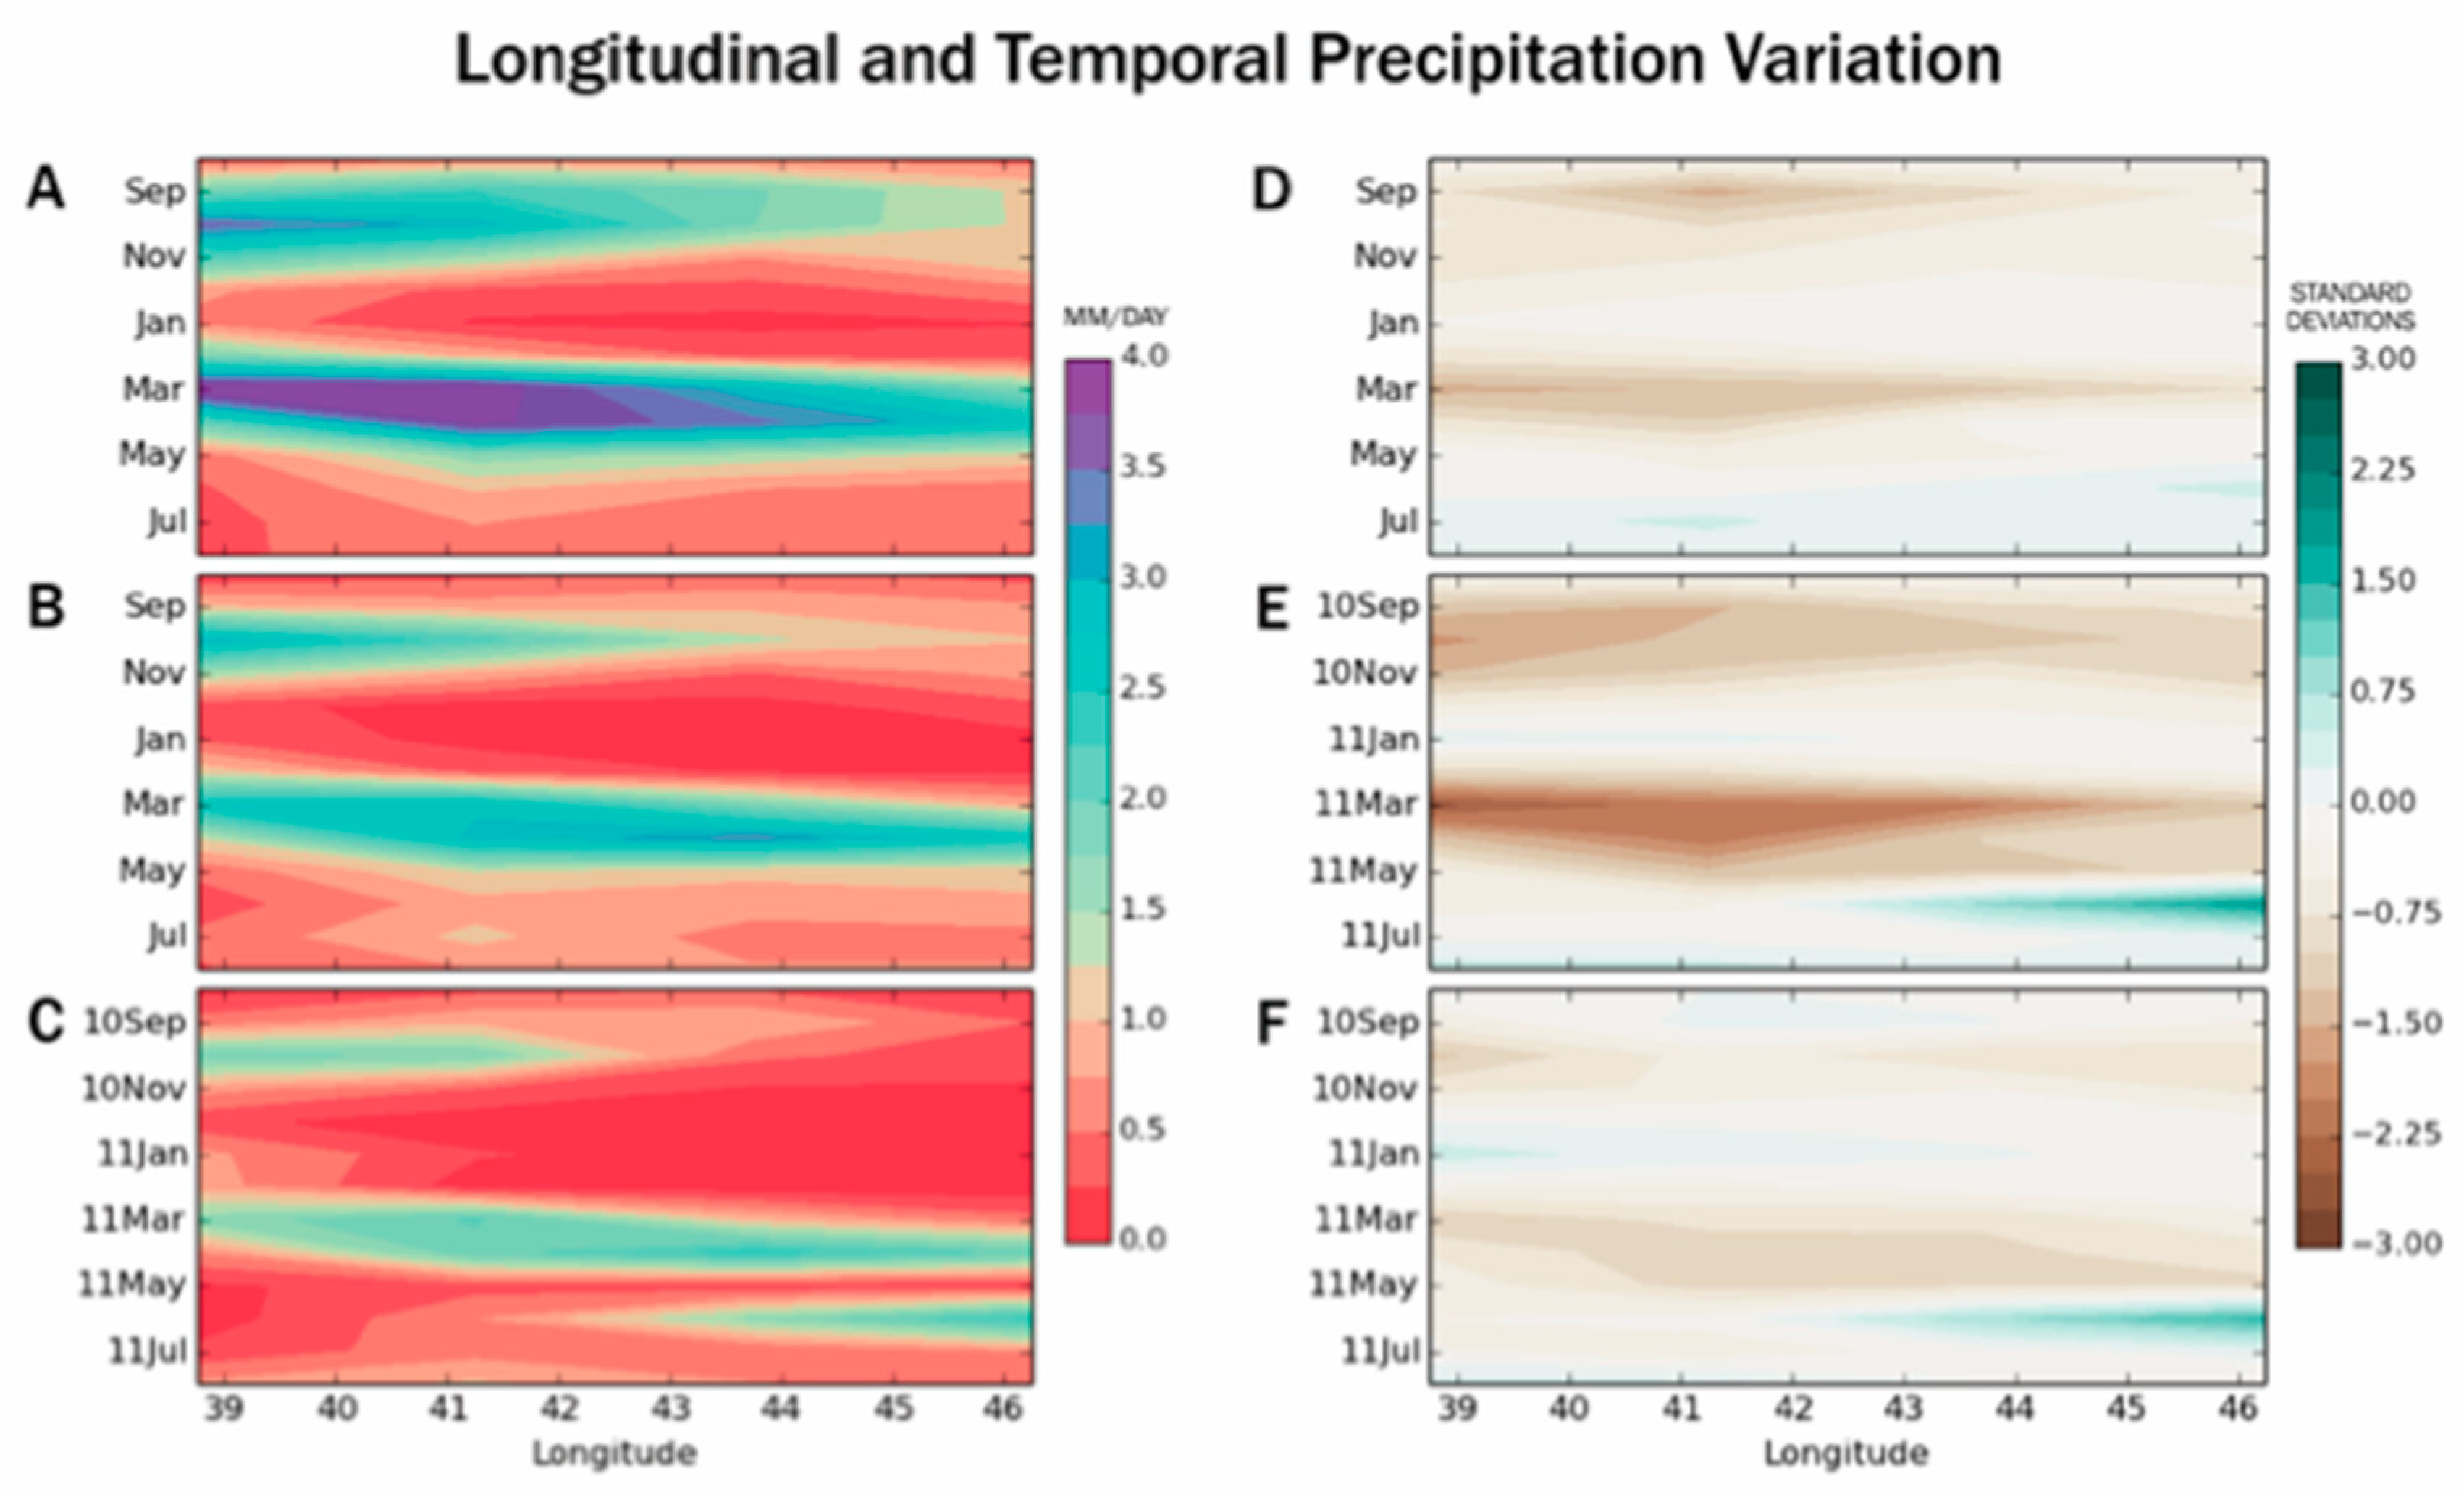
The 2010–2011 drought was spatially and temporally unique. The left column represents monthly rainfall climatology (GPCP) (A), drought climatology (alternatively referred to as a drought composite—an average of previous regional droughts (B), and 2010–2011 rainfall (C). Cool colors represent high rainfall. The right column represents average rainfall anomaly (B minus A) during drought years (D), 2010–2011 rainfall anomaly (C minus A) (E), and drought anomaly (E minus D or precipitation anomaly as compared to the drought composite average anomaly) (F). Brown values represent anomalously low rainfall whereas blue values represent greater than expected (anomalously high) rainfall. The anomaly was averaged along the longitude between 38.5° E and 46.5° E.
Figure 5.
The 2010–2011 drought was spatially and temporally unique. The left column represents monthly rainfall climatology (GPCP) (A), drought climatology (alternatively referred to as a drought composite—an average of previous regional droughts (B), and 2010–2011 rainfall (C). Cool colors represent high rainfall. The right column represents average rainfall anomaly (B minus A) during drought years (D), 2010–2011 rainfall anomaly (C minus A) (E), and drought anomaly (E minus D or precipitation anomaly as compared to the drought composite average anomaly) (F). Brown values represent anomalously low rainfall whereas blue values represent greater than expected (anomalously high) rainfall. The anomaly was averaged along the longitude between 38.5° E and 46.5° E.

Figure 6.
Similar to Figure 5, but the anomaly was averaged along the latitude between 1.5° S and 4° N.
Figure 6.
Similar to Figure 5, but the anomaly was averaged along the latitude between 1.5° S and 4° N.

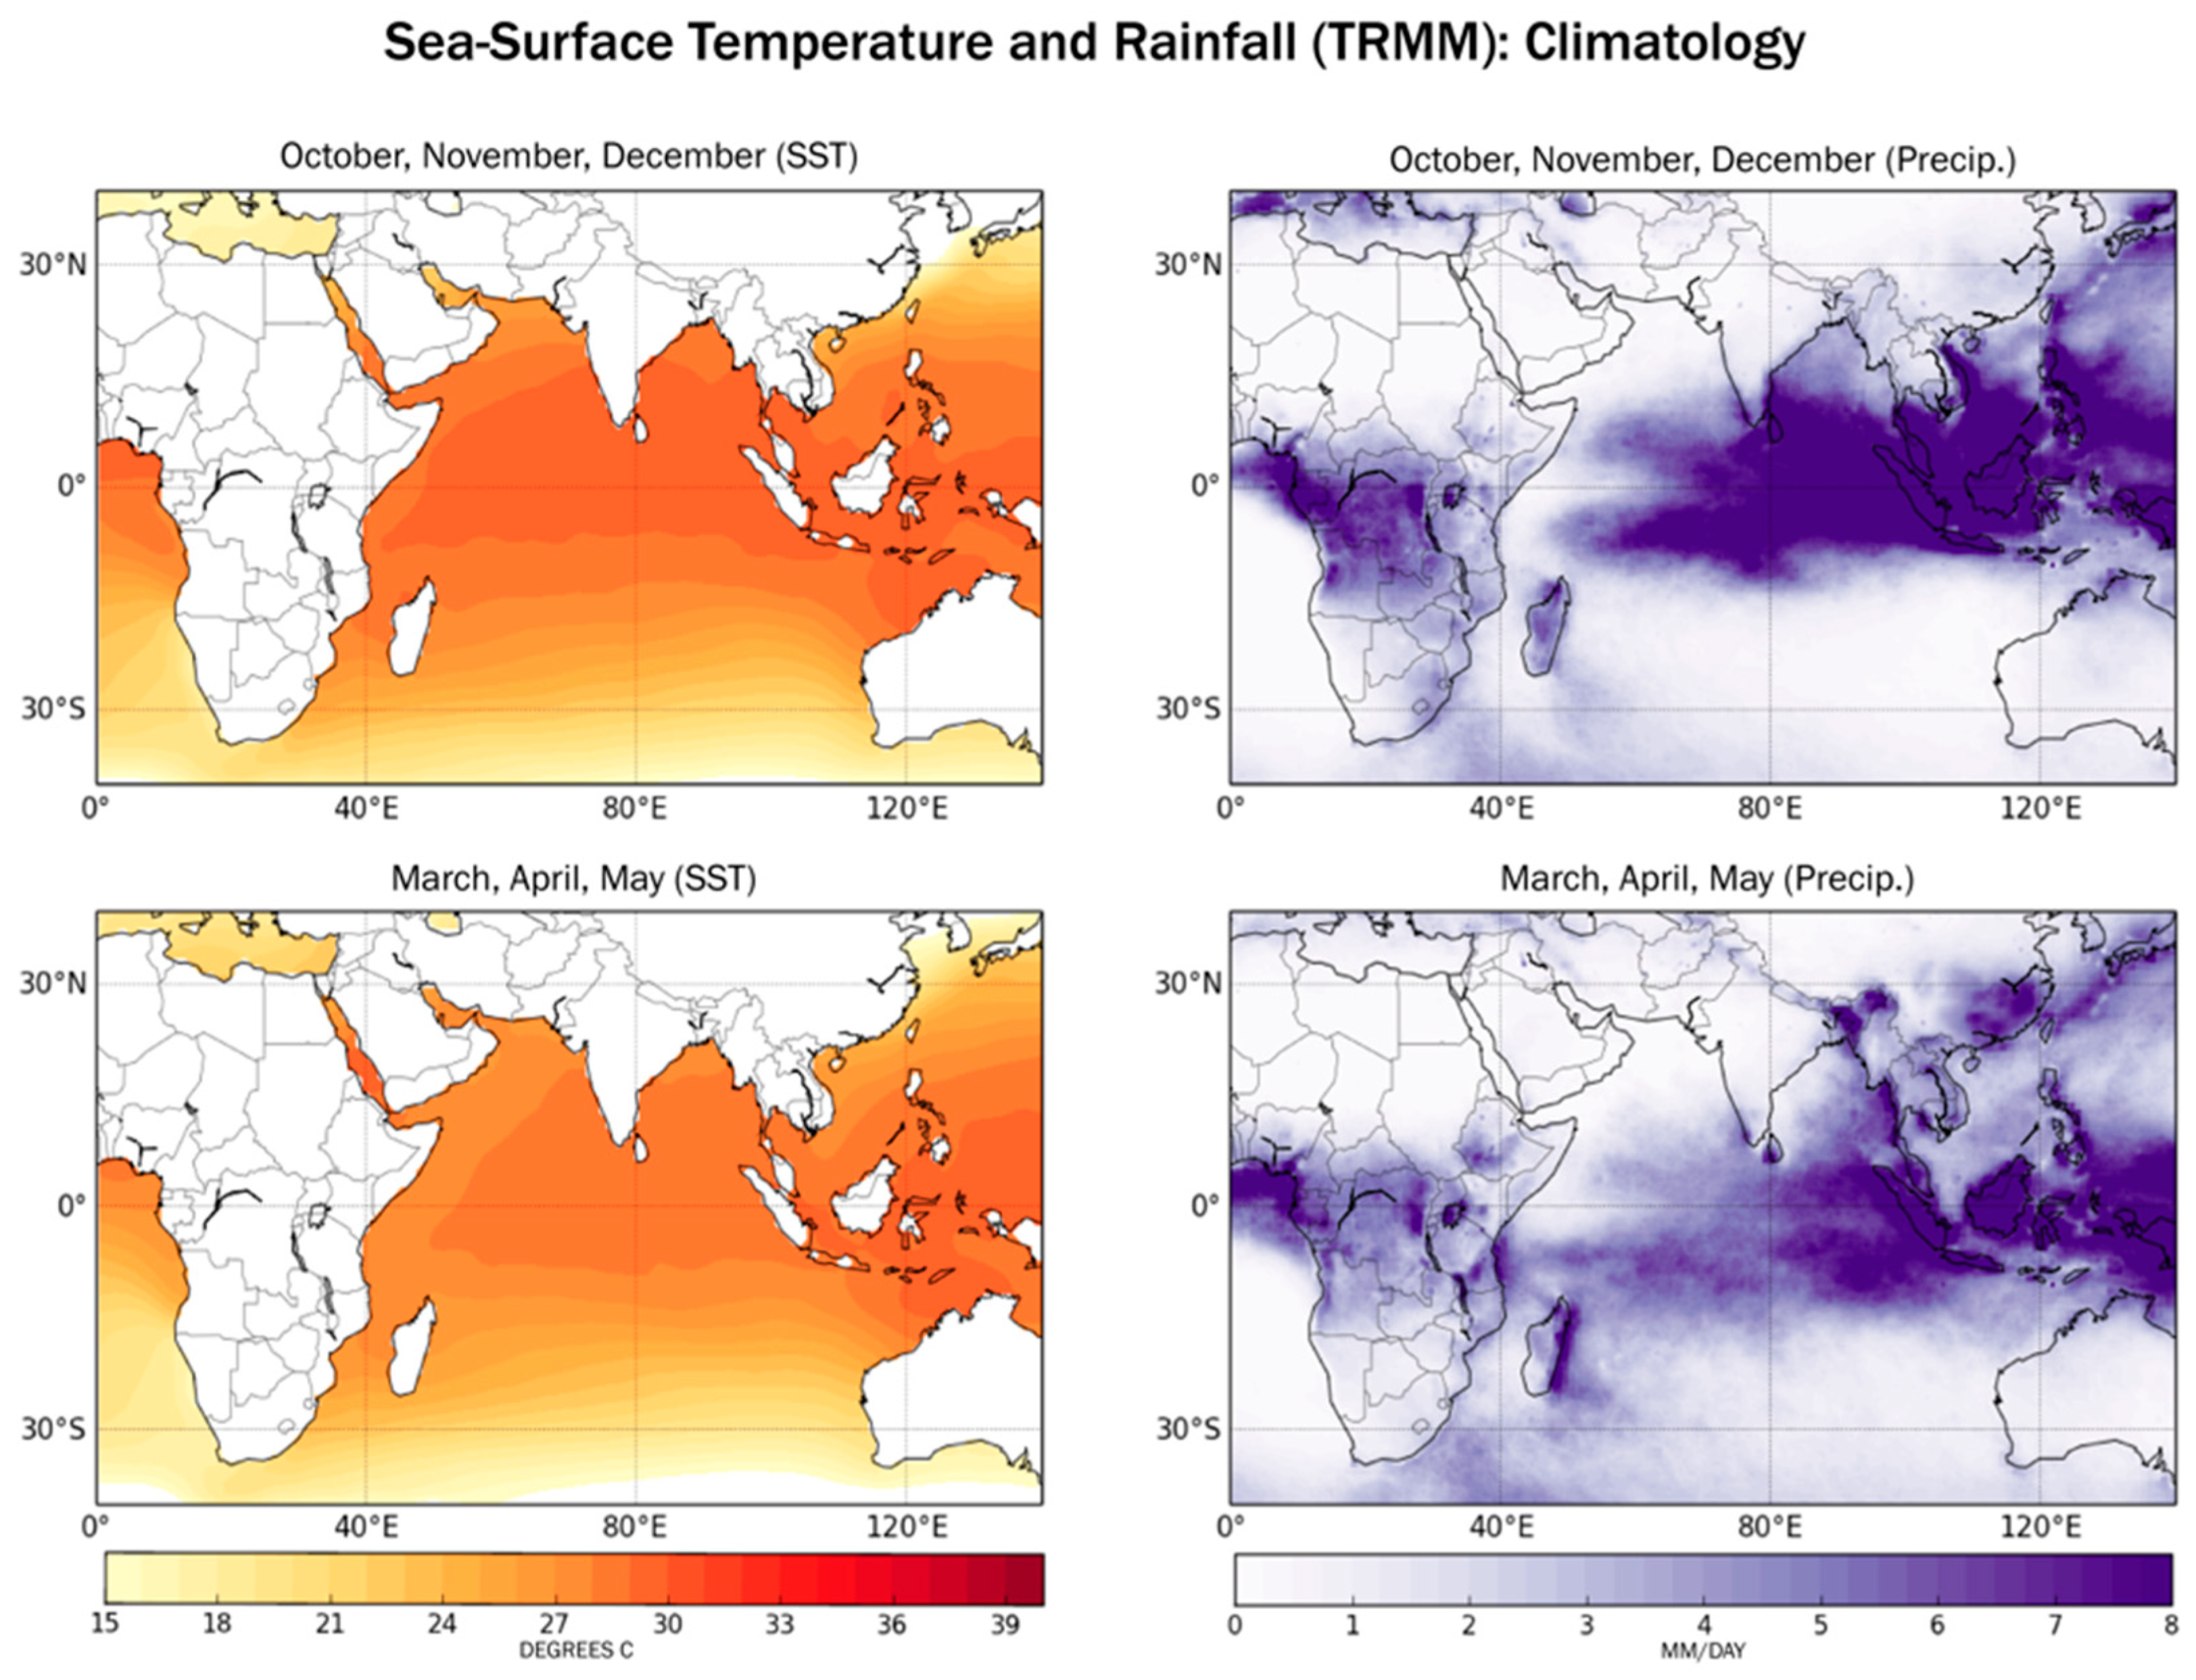
Figure 7.
The climatology of sea surface temperature (HadISST, °C) and TRMM rainfall (mm/day) over the Indian Ocean during both rainy seasons. The East Indian Ocean is warmer than the West Indian Ocean. Moisture transport to East Africa is linked to this temperature gradient.
Figure 7.
The climatology of sea surface temperature (HadISST, °C) and TRMM rainfall (mm/day) over the Indian Ocean during both rainy seasons. The East Indian Ocean is warmer than the West Indian Ocean. Moisture transport to East Africa is linked to this temperature gradient.

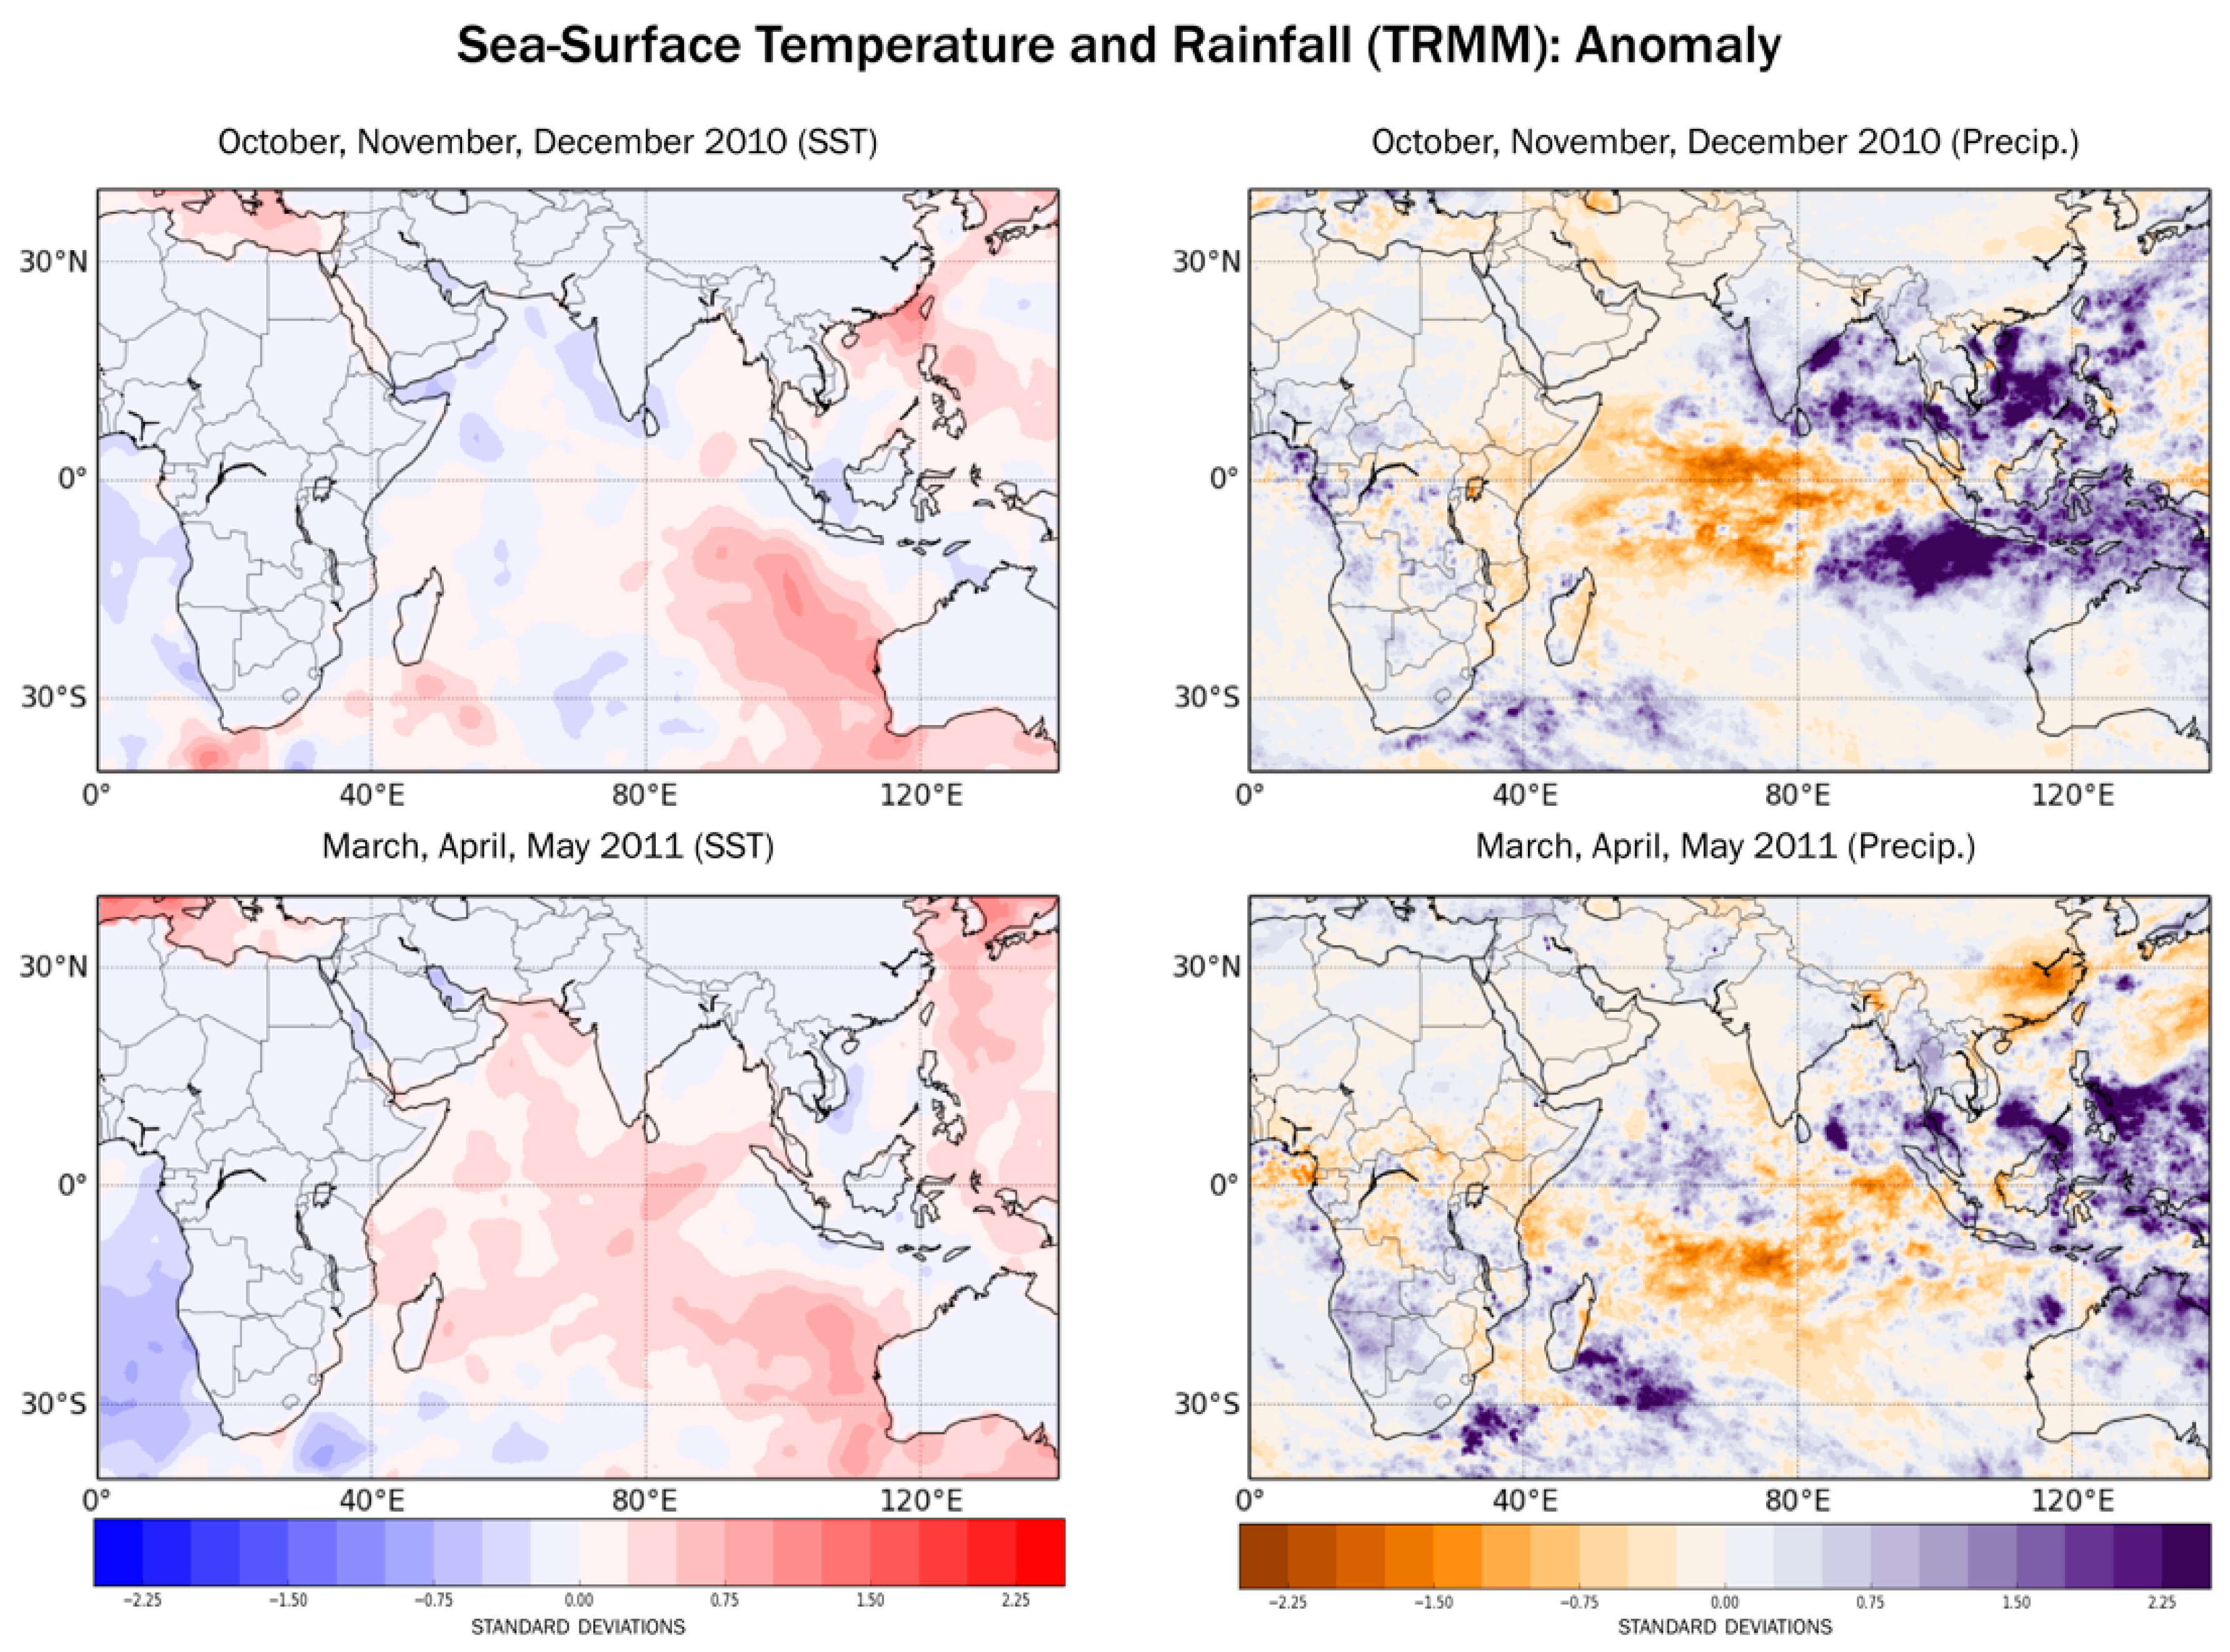
Figure 8.
The anomaly of sea surface temperature (HadISST, °C) and rainfall (mm/day) during 2010–2011 East African drought.
Figure 8.
The anomaly of sea surface temperature (HadISST, °C) and rainfall (mm/day) during 2010–2011 East African drought.

Figure 9.
Anomalies of 2 m surface air temperature (filled colors) and 850 hPa wind (vectors). Temperatures generally increased in East Africa during the 2010–2011 failed rains. This contributes to but may also exist as a positive feedback with decreased photosynthetic activity: photosynthesis decreases at higher temperatures, but surface temperatures increase with the resulting reduced transpiration. OND is October, November, December; MAM is March, April, May.

Figure 10.
Anomalies of NDVI, SIF, soil moisture, and precipitation during the 2011 drought. Both SIF and NDVI approximate similar drought spatial extents. Anomalies calculated at highest available temporal resolution from the onset of the drought in October 2010 through April 2011.
Figure 10.
Anomalies of NDVI, SIF, soil moisture, and precipitation during the 2011 drought. Both SIF and NDVI approximate similar drought spatial extents. Anomalies calculated at highest available temporal resolution from the onset of the drought in October 2010 through April 2011.

Figure 11.
Zonally averaged SIF and NDVI response to soil moisture in East Africa (a black box in Figure 1. This figure was generated from 16-day average SIF from Global Ozone Monitoring Experiment-2 (GOME-2) data (red), NDVI from moderate resolution imaging spectrometer (MODIS) data (dark green), and daily soil moisture (blue) data.


Table 1.
The relationship between soil moisture and NDVI or SIF from Figure 11. Lagged correlation is calculated as NDVI or SIF is 16 days lagging soil moisture.
Table 1.
The relationship between soil moisture and NDVI or SIF from Figure 11. Lagged correlation is calculated as NDVI or SIF is 16 days lagging soil moisture.
| Correlation Coefficient | p | |
|---|---|---|
| No lag | ||
| Soil moisture and NDVI | 0.56 | 0.02 |
| Soil moisture and SIF | 0.35 | 0.16 |
| 16-day lagged | ||
| Soil moisture and NDVI | 0.83 | p < 0.001 |
| Soil moisture and SIF | 0.76 | p < 0.001 |
© 2019 by the authors. Licensee MDPI, Basel, Switzerland. This article is an open access article distributed under the terms and conditions of the Creative Commons Attribution (CC BY) license (http://creativecommons.org/licenses/by/4.0/).
Share and Cite
MDPI and ACS Style
Robinson, E.S.; Yang, X.; Lee, J.-E. Ecosystem Productivity and Water Stress in Tropical East Africa: A Case Study of the 2010–2011 Drought. Land 2019, 8, 52. https://0-doi-org.brum.beds.ac.uk/10.3390/land8030052
AMA Style
Robinson ES, Yang X, Lee J-E. Ecosystem Productivity and Water Stress in Tropical East Africa: A Case Study of the 2010–2011 Drought. Land. 2019; 8(3):52. https://0-doi-org.brum.beds.ac.uk/10.3390/land8030052
Chicago/Turabian StyleRobinson, Eugene S., Xi Yang, and Jung-Eun Lee. 2019. "Ecosystem Productivity and Water Stress in Tropical East Africa: A Case Study of the 2010–2011 Drought" Land 8, no. 3: 52. https://0-doi-org.brum.beds.ac.uk/10.3390/land8030052
Note that from the first issue of 2016, this journal uses article numbers instead of page numbers. See further details here.