The Geographic Spread and Preferences of Tourists Revealed by User-Generated Information on Jeju Island, South Korea

1
Natural Capital Project, Woods Institute for the Environment, Stanford University, Stanford, CA 94305, USA
2
School for Environmental and Forest Sciences, University of Washington, Seattle, WA 98195, USA
3
eScience Institute, University of Washington, Seattle, WA 98195, USA
4
The Institute for Korean Regional Studies, Seoul National University, 1 Gwanak-ro, Gwanak-gu, Seoul 08826, Korea
5
Division for Natural Environment, Korea Environment Institute, 370 Sicheong-daero, Sejong-si 30147, Korea
*
Author to whom correspondence should be addressed.
Land 2019, 8(5), 73; https://0-doi-org.brum.beds.ac.uk/10.3390/land8050073
Submission received: 29 March 2019
/
Revised: 17 April 2019
/
Accepted: 22 April 2019
/
Published: 26 April 2019
(This article belongs to the Special Issue Geospatial Social Data and Participatory Mapping for Landscape Change and Socio-Environmental Systems)
Abstract
:Recreation and tourism are important ways that people interact with and derive benefits from natural environments. Understanding how and where nature provides recreational opportunities and benefits is necessary for management decisions that impact the environment. This study develops and tests an approach for mapping tourism patterns, and assessing people’s preferences for cultural and natural landscapes, using user-generated geographic content. The volume of geotagged images and tweets shared publicly on Flickr and Twitter and proprietary mobile phone traffic provided by a telecommunications company, are used to map visitation rates to potential tourist destinations across Jeju Island, South Korea. We find that densities of social media posts and mobile phone traffic are all correlated with ticket sales and counts of gate entries at tourist sites. Using multivariate linear regression, we measure the degree to which attributes of the natural and built environment explain variation in visitation rates, and find that tourists to Jeju Island prefer to recreate near beaches, sea cliffs, golf courses and hiking trails. We conclude that high-resolution and spatially-explicit visitation data provided by user-generated content open the door for statistical models that can quantify recreation demand. Managers and practitioners could combine these flexible and relatively inexpensive user-generated data with more traditional survey data to inform sustainable tourism development plans and policy decisions. These methods are especially useful in the context of landscape or regional-scale ecosystem service assessments, where there is a need to map the multiple ecological, economic, and cultural benefits of the environment.
1. Introduction
Recreation and tourism offer many benefits to societies and individuals, including increased mental and physical health, economic opportunities, and social cohesion [1,2,3,4]. These benefits are of great interest to scientists and decision-makers, who are concerned with the sustainable economic development of recreation and tourism, while also preserving the natural landscapes that provide those opportunities and other benefits [5]. Often however, decision-makers are challenged to know how and where to develop or promote recreational opportunities, because they lack good information on which mix of landscapes, activities, and experiences are demanded by local visitors and tourists. Traditionally, methods for measuring the demand for recreation opportunities involve counting the number of visitors to a place [6], measuring the cost or distance traveled to get there [7], or surveying visitors to learn about their preferences and the benefits they experience [7,8,9]. Unfortunately, the cost of collecting these data limits the number of sites that can be studied.
Furthermore, conclusions drawn at one site do not necessarily transfer to other places, as visitors’ preferences for different environments may also differ from place to place. Consequently, there is a growing demand for transferable methods, and methods that scale easily, for quantifying the demand for recreation and tourism, and mapping where recreational opportunities are provided by the landscape [10].
There are several well-established approaches for measuring recreation demand and mapping recreation opportunities. Some recreation suitability models simply map the physical features of the landscape that have the potential to support recreation [11,12]. Researchers judge which landscape features are suitable for recreation, based on studies conducted in other locations. A key limitation of this approach is the assumption that people in different places share similar preferences for different environments and recreation opportunities [13]. Some studies advance recreation suitability mapping by surveying visitors, and asking them to identify the features of the local landscape that provide recreation opportunities, and then, using these “stated preferences”, they then build spatial models of recreation suitability or demand [14,15,16,17]. Demand for recreation can also be measured by observing local patterns and behaviors of people, and letting those patterns reveal preferences for certain types of sites and environments [18]. This “revealed preferences” approach relies on enough data to statistically model the relationship between visitation rates to sites and the relevant characteristics of those sites.
The proliferation of GPS technology, mobile devices, and content-sharing platforms on the internet has produced myriad sources of information on visitors’ choices and behaviors that might enable a revealed preferences approach to modeling recreation demand. These new information sources come in the form of digital photographs, messages, or other records created on-site by individuals, and then shared online, or stored in a central database, in a way that preserves the time and location where they were created [19]. Researchers have begun collecting, synthesizing, and analyzing spatially-explicit user-generated content (UGC) shared on social media platforms, as well as geolocated records stored by telecommunications companies, as sources of information on visitation patterns and the demand for recreation opportunities [20,21,22,23]. Traditionally, UGC refers to content from social-media or other online postings, and may not refer to records from telecommunications, such as phone calls or text messages. Nevertheless, these records have space- and time-stamps that make them useful for the same research questions addressed by geolocated UGC [24,25]. In this paper we let “UGC” refer to all these data sources, and use the term to distinguish these data from traditional survey-based visitor data. Spatially-explicit UGC shared on Flickr, Twitter, and Instagram have been used to map local- to continental-scale patterns of recreation [26,27,28,29,30,31,32,33]. Maps of travel patterns have also been created from aggregations of geolocated wireless communications, such as phone calls and text messages [20,34,35,36]. Recent studies have proposed that the locations and subject of UGC may also reveal visitors’ preferences for types of destinations and experiences [37,38,39,40,41]. However UGC has limitations and poses challenges for conducting research, including issues of representation [19], lack of quality controls and data provenance [42,43], and even intentional deception by social media users [44]. For these reasons, testing the capability for UGC to measure visitation and visitors’ preferences in new geographies is important.
The purpose of this study is to advance the science of measuring and mapping recreation demand at landscape scales for sustainable planning and management of recreation opportunities. We integrate multiple sources of spatially-explicit UGC to represent variation in visitation rates across Jeju Island, South Korea. Our UGC data-sources include: (1) Geotagged photographs posted to the online photo-sharing platform Flickr, (2) geotagged tweets, short messages posted to the social media platform Twitter, and (3) locations of mobile phone customers using the Sun Kyung Telecom network. We compare these data sources to traditional survey-based measures of visitation rates at specific sites. Then we demonstrate a transferable approach for landscape-scale modeling of tourist preferences, and we compare those revealed preferences to results from a published survey of stated visitor preferences. We discuss the data-generating processes that underlie old and new revealed-preference approaches, and investigate whether user-generated content from cameras and mobile devices is useful for informing recreation and tourism management and development decisions.
2. Materials and Methods
We assessed the potential for UGC to quantify rates of tourism, first by comparing visitation rates derived from UGC with traditional visitor counts at tourist attractions around Jeju Island, South Korea. Specifically, we compared how geotagged photographs, tweets, and mobile communications approximated visitation at 36 tourist sites where visitors were counted at entry-gates or ticket-counters. Finally, we used the geographical variation in UGC-based visitation across Jeju Island to estimate tourists’ preferences for various natural and built environments.
2.1. Study Area
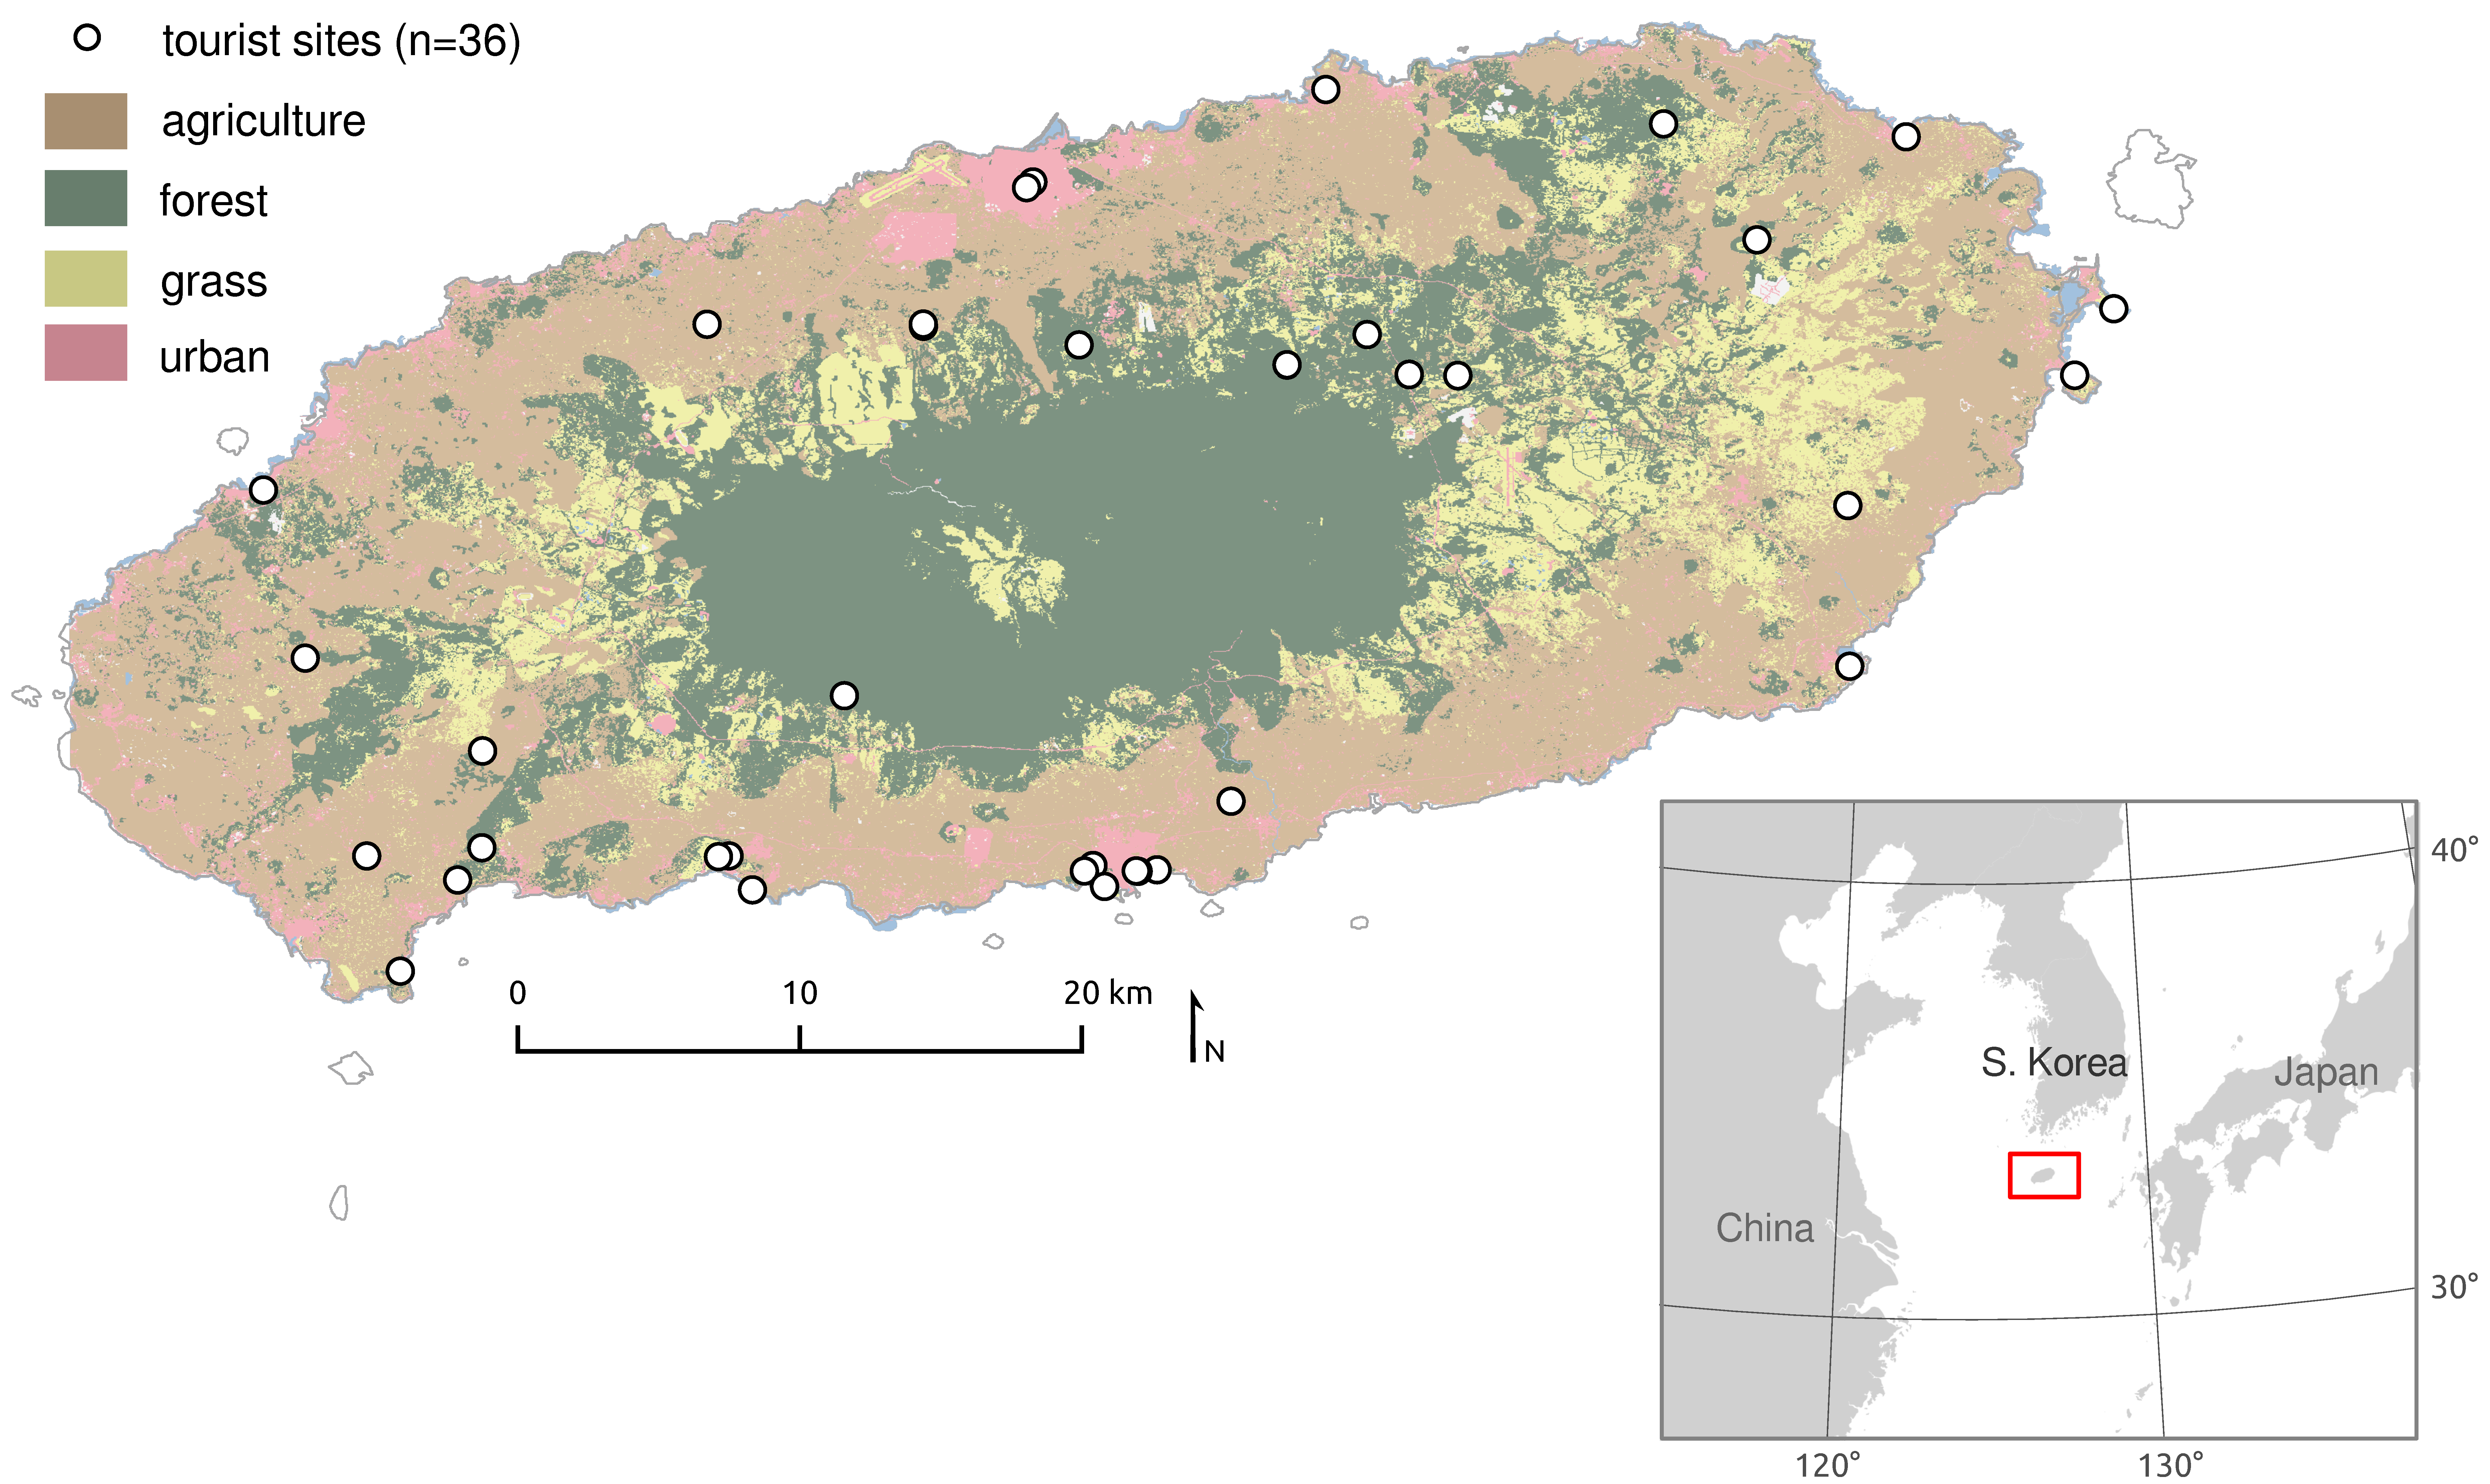
Jeju Island is the largest Korean island south of the Korean Peninsula, with over 623,000 residents [45]. It is a popular destination for domestic and foreign visitors. Jeju Island is marketed by the Korean government as an ecotourism destination [46] and sections of the island are designated as UNESCO Biosphere Reserves and UNESCO World Heritage Sites. In 2014, 8.9 million South Koreans visited Jeju Island and 3.3 million foreign visitors arrived from international locations, the majority from China. The average duration of stay is five days for Korean and seven days for foreign tourists. Recent visitor surveys indicate that the most common reason for visiting Jeju Island is for appreciation of natural scenery [47].
2.2. Visitation Rate Data Sources
We collected and compared annual visitation rates measured from spatially-explicit UGC with on-site counts at 36 sites across Jeju Island (Figure 1). All data sources are described below.
2.2.1. On-site survey visits
Monthly counts of visitors at 36 tourist sites were provided by the Korea Tourism Knowledge and Information System [48]. Sites included parks and protected areas, museums and cultural attractions, UNESCO World Heritage sites and other destinations (Table A1). Counts were available at these sites from 2007–2014, though the range of complete data varied by site. Total visitor counts each month were based on ticket sales or gate entries. Missing monthly counts at a site were assigned the average value of the other months in the same year at that site if two or less months of the year were missing. Subsequently, total annual visits were calculated for all sites and years without any remaining missing monthly counts. We refer to the yearly total number of counted visitors as “on-site visits” (OSV).
2.2.2. Photograph visits
Flickr is an online photo-sharing platform where users can upload their digital photographs and make them publicly available [49]. From 2005–2014 Flickr users shared over 250 million images that included the latitude and longitude of the location where the image was taken. We queried this global collection of geolocated photographs for images taken on Jeju Island or the surrounding marine space using the Recreation module of the InVEST software suite [50]. We measured visitation from Flickr images in units of “photo-user-days” (PUD), where a single PUD represents one photographer who took one or more photographs within a given geographic boundary on a given day [23]. We calculated the annual sum of PUDs for each year from 2005–2014, based on all geotagged images returned in a spatial query for each area of interest. Areas are described further in Section 2.3 and Section 2.4.1.
2.2.3. Tweet Visits
Twitter is a social media platform that allows users to broadcast snippets of text or “tweets”. For this study, we analyzed tweets provided by the Twitter Public streaming API which, according to Twitter, returns a random subsample of 1% of all tweets sent through the platform [51]. Twitter users can optionally include the latitude and longitude of the location from which each tweet was sent. An analysis in 2013 found that 1.6% of tweets are geotagged [52]. From 2012–2014, we collected 391,564 geolocated tweets from Jeju Island. From these, we calculated annual “twitter-user-days” (TUD) for defined areas, following the same manner as PUD, by adding all unique users who sent a tweet from the area each day.
2.2.4. Mobile Visits
Sun Kyung Telecom (SKT) is one of three major mobile communications providers in the country. SKT collects and stores records of mobile phone connections to base stations across Jeju Island and estimates the number of users per area and time period. SKT would not share further details of the proprietary method used to estimate numbers of users. We purchased average hourly population estimates from SKT for each month of 2014, per 50 m2 grid cell covering all of Jeju Island. We computed annual “mobile population” (MP) of an area as the sum of all hours of all months for all cells with center points within the area of interest.
A second SKT dataset provided by the South Korean government included the proportion of SKT users per 300 m2 grid cell that are not residents of Jeju Island, based on the billing information of the subscriber. This dataset does not include data about subscribers to other mobile networks. Section 2.4.1 below describes how we integrated these two datasets to apply this tourist proportion metadata to the mobile population data.
2.3. Visitation Rate Comparison at Tourist Sites
To evaluate the use of UGC for estimating visitation rates, we compared PUD, TUD, and MP with OSV at the 36 tourist sites where on-site counts were available. In order to get accurate estimates from the geotagged social media and mobile datasets, we referenced OpenStreetMap and satellite imagery and digitized polygons to represent the boundaries of each tourist site. We used these polygons to spatially query the Flickr, Twitter, and mobile datasets and compute PUD, TUD, and MP as described above. The frequency distribution of visitation rates to sites was skewed to the right for each dataset, including the OSV, so we log-transformed values and then compared visitation measures graphically and with Pearson’s correlation coefficients of the transformed values.
2.4. Revealed Preferences of Tourists
In order to understand the features of the natural environment that make Jeju Island a popular destination for recreation and tourism, we used a revealed preference approach [18]. With a multivariate linear regression, we related spatially explicit tourist visitation rates based on PUD, TUD, and MP to natural and built features that were hypothesized to influence visitation patterns. Tourists may differ from residents in their preference for certain sites, experiences, and activities, and in their use of social media. Therefore, we divided our measures of visitation into visits by locals versus tourists in order to isolate the preferences of each. We present results for tourists alone because they were well-represented in all data sources, while locals were not. This analysis estimated the degree to which features of the natural and built environment were associated with high and low use by tourists across the island. Methods used to create the response and predictor variables for the regression model are described below.
2.4.1. Response Variables
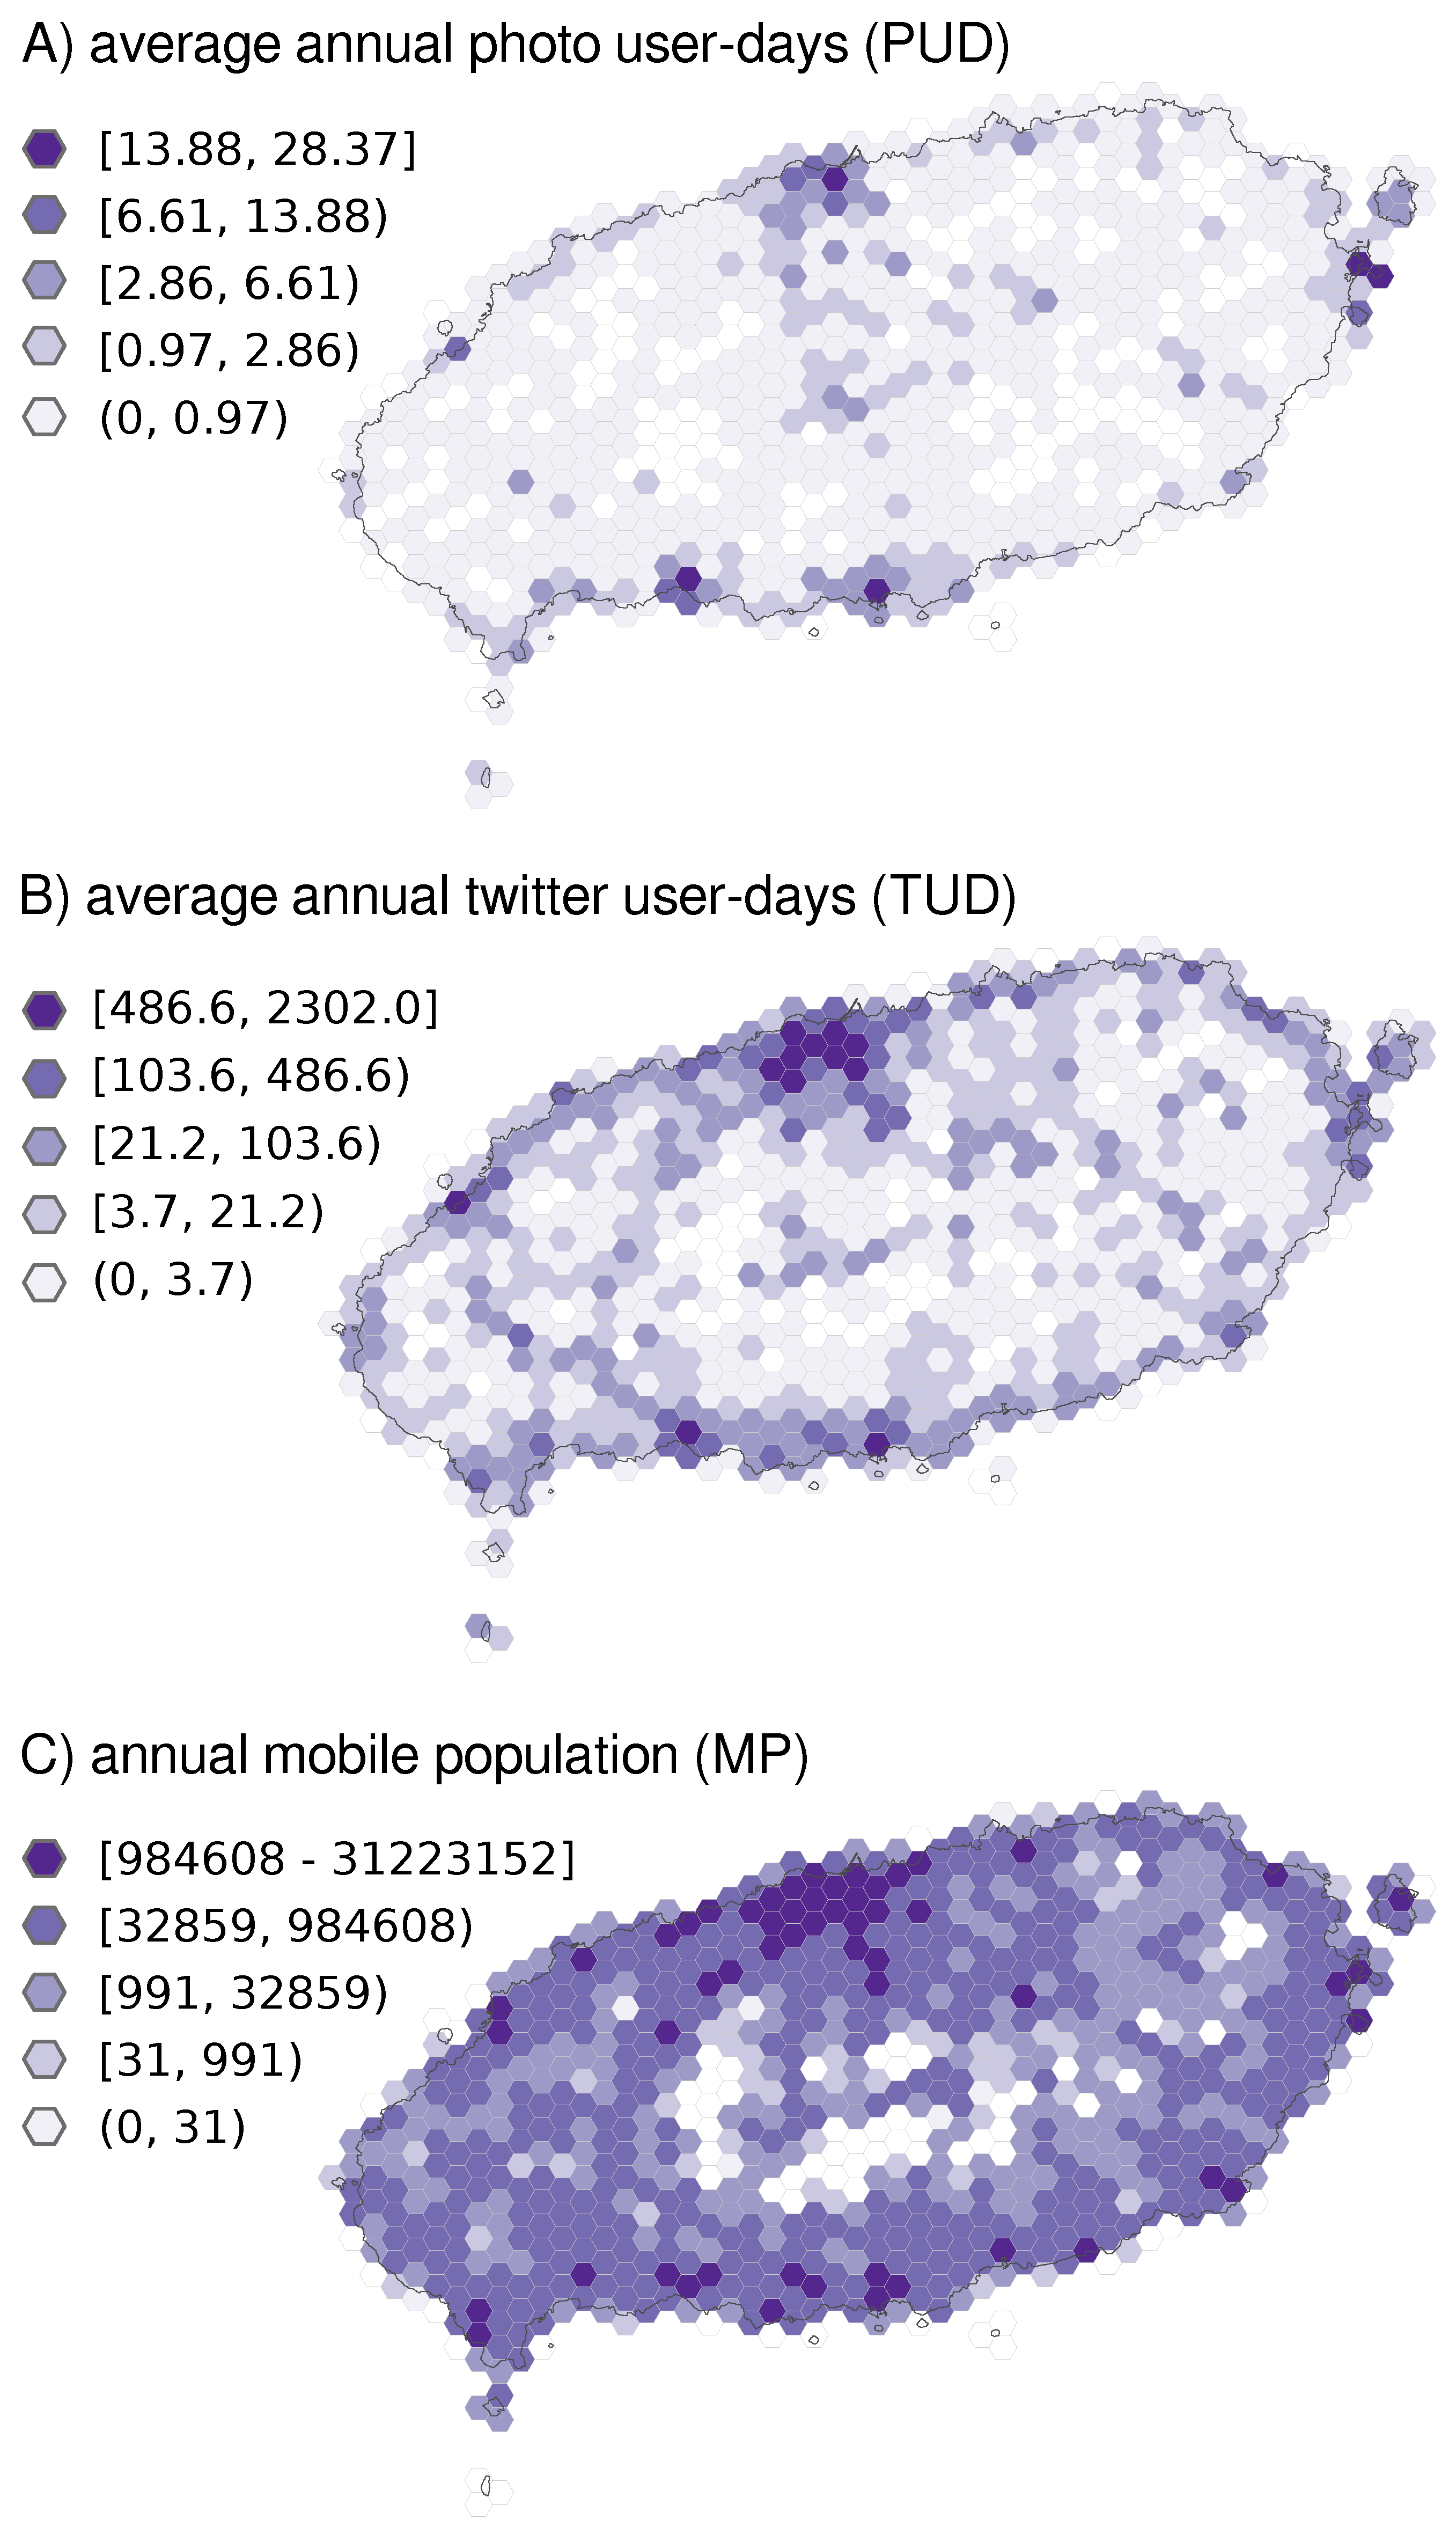
The multivariate model combines three measurements of visitation by tourists into a single response variable computed for each of 824 2.6 km2 hexagon cells that cover Jeju Island (Figure 2). The three estimates of visitation are: (1) average annual PUD from 2005-2014, (2) average annual TUD from 2012–2014, and (3) total MP in 2014. To estimate the fraction of local versus tourist PUD per cell we used the home locations reported by users in their public Flickr profiles [23,29,31,53]. We classified locals as users that report on their public profile to reside in places on Jeju Island, and we discounted PUD in each cell by the proportion of local Flickr users for that cell. To estimate the fraction of local versus tourist MP per cell, we aggregated the tourist proportions from the 300 m2 SKT dataset to the 2.6 km2 hexagons and discounted the total MP values in each hexagon cell by the proportion of local SKT users. The MP dataset represents SKT and non-SKT users, while the 300 m2 tourist-proportion dataset represents only SKT users. Therefore, we rely on the assumption that the spatial patterns of SKT-subscriber tourists are similar to those of non-SKT-subscriber tourists. Lacking a well-tested method for determining twitter user home locations, we assumed that every Twitter user in our sample was a tourist. Twitter users sometimes volunteer their home location on their profile in a similar manner to Flickr users. However, research on twitter home locations suggests that this profile information is unreliable and efforts to determine home locations of twitter users rely on more complex, content-based algorithms [54]. Since all three measures of use were correlated with OSV at the 36 test sites, and since we cannot be certain which measure is best at the gridded landscape scale, nor how we might weight the importance of each metric, we use the linear combination of the tourist PUD, TUD, and MP as the multivariate response variable that is likely to best capture the geographic variability in visits.
2.4.2. Predictor Variables
We tested several attributes of the landscape that we hypothesized would explain spatial variation in tourism including natural features, land-cover and land-use types, accessibility, and amenities for tourists (Table 1). For attributes that were mapped as point geometries, we measured either the number of occurrences per cell or the Euclidean distance from a cell’s center to the nearest point. Line geometries were measured as length per cell or as euclidean distance from a cell’s center to the nearest segment. Polygon geometries were measured in area per cell. GIS data were sourced from OpenStreetMap or provided by the Jeju Development Institute (JDI) and the Ministry of Environment of South Korea. Data processing was done using the InVEST Recreation model [50].
3. Results
3.1. Visitation Rate Comparison at Tourist Sites
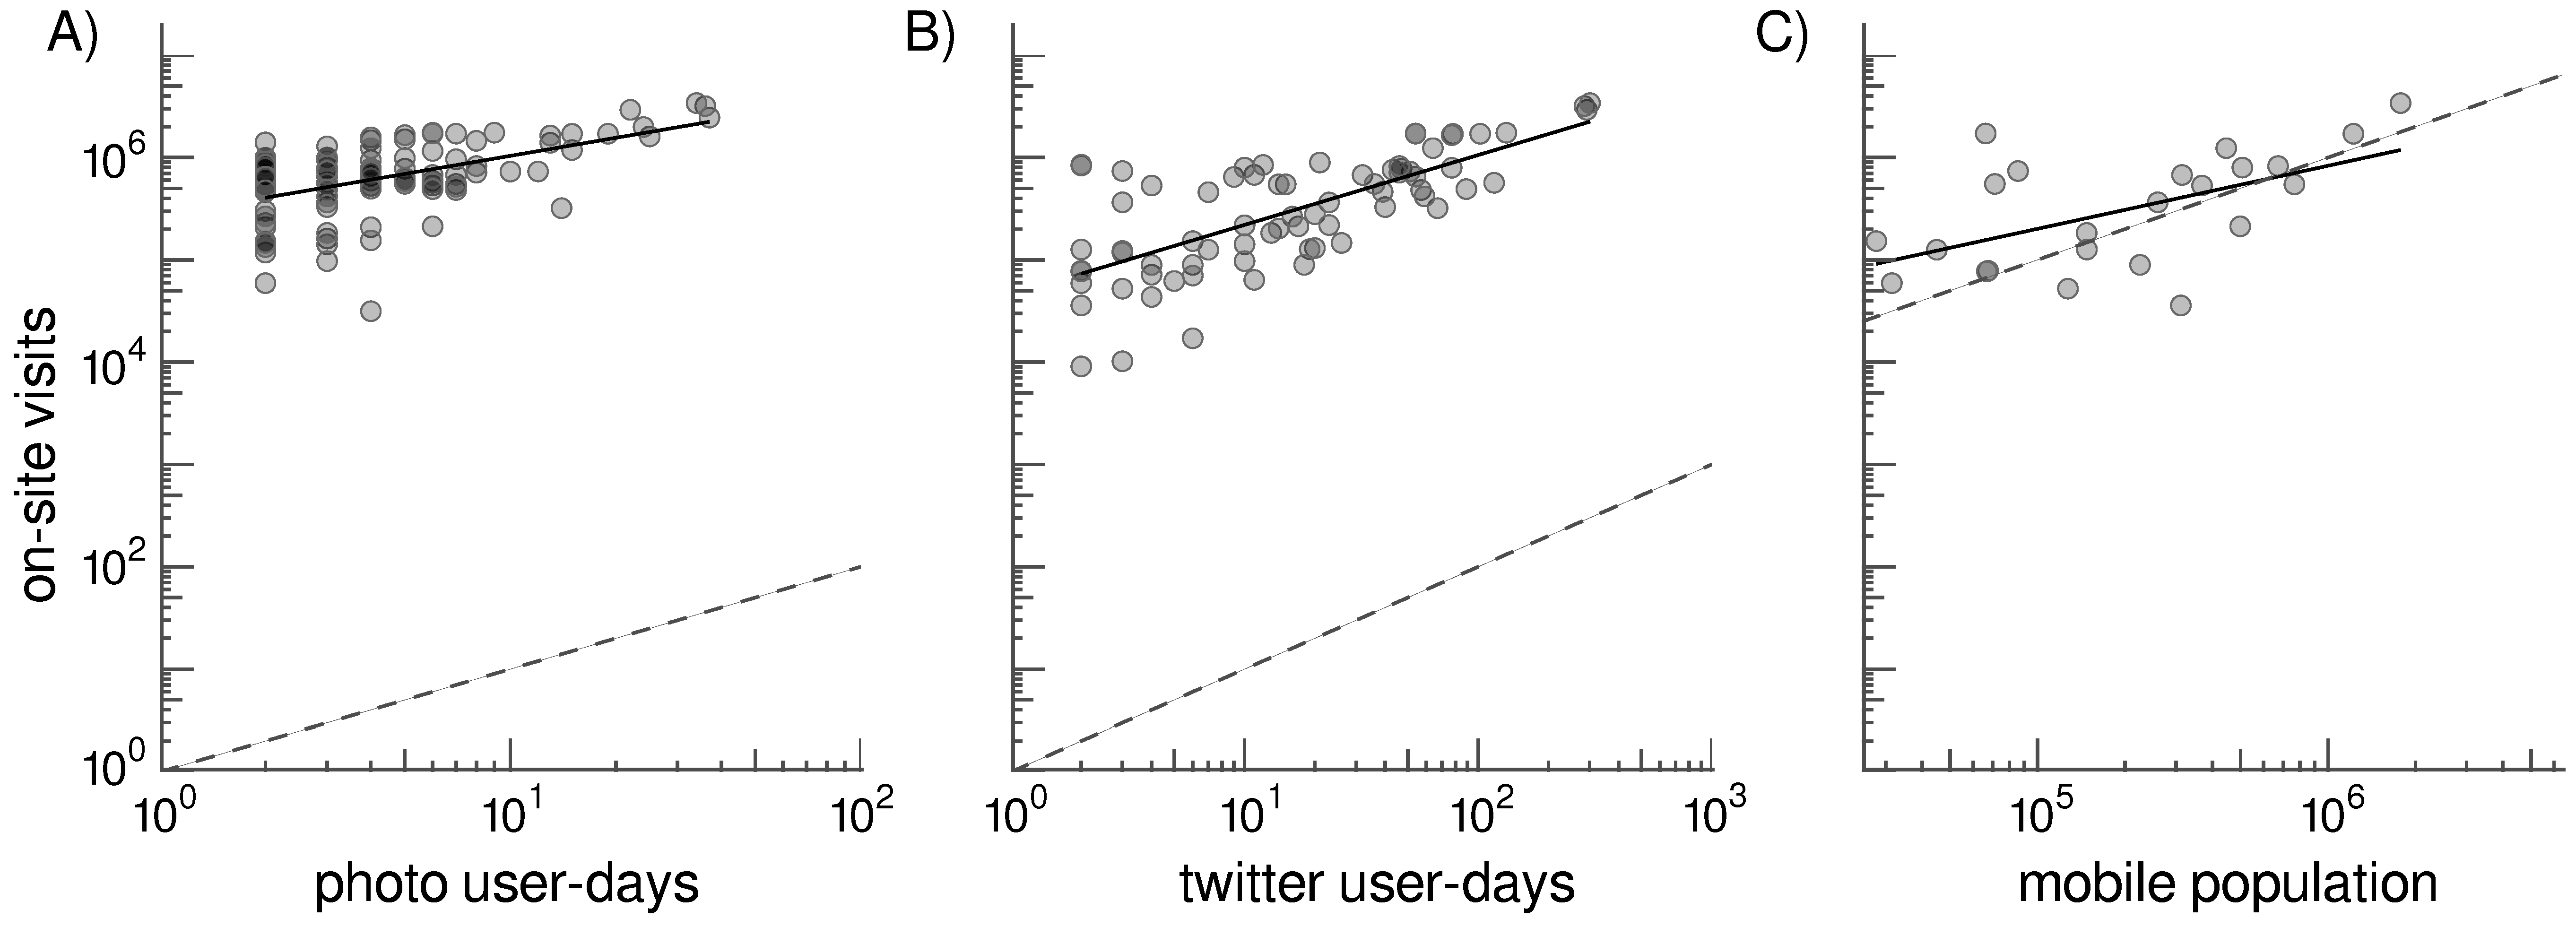
We compared annual visitation rates spanning multiple years at 36 tourist sites across Jeju Island and found that Flickr image-sharing (n = 109, r = 0.52), Twitter posting (n = 73, r = 0.71), and mobile communication (n = 23, r = 0.56) rates all have positive correlations with on-site visitation rate estimates (Figure 3). Nine sites had no Flickr photos taken from 2007–2014. One site had no tweets posted from 2012–2014. Three sites were outside the geographic coverage of the mobile phone dataset. All of these cases were treated as missing data and excluded from Figure 3 and the analyses. The comparison of OSV ~ MP (Figure 3C) has fewer data points than the others because the MP data in this study is limited to a single year, 2014. Also, in contrast to PUD and TUD, which always undercount the actual number of visits, MP values sometimes exceed OSV, (evidenced by points falling below the 1:1 line in Figure 3C). The mobile communications data, provided in aggregate form from SKT, may count a person multiple times during a day within a certain area, up to one count per hour.
3.2. Tourist Proportions
486 out of the 824 grid cells spread across Jeju Island contain photographs posted by Flickr users who report their home location on their public profile (Figure 4A). The results show that Flickr photographs taken on Jeju Island are predominantly from tourists (not residents of Jeju Island). In 88% of the 486 cells with Flickr home location information, all photographs were posted by tourists. Jeju residents account for the majority of PUD in only 5% of the cells with home location information. SKT mobile phone users on Jeju Island, in contrast, are predominantly local residents (Figure 4B). 11% of cells with data were visited by more tourists than locals, according to the MP data, and locals visit 100% of the cells with mobile phone records. Data on the home locations of Twitter users were not available, so lacking better information, we assumed all tweets originated from tourists.
3.3. Revealed Preferences of Tourists
Maps of relative visitation rates based on PUD, TUD, and MP show that visitation on Jeju Island is concentrated along the north, south and east coasts, as well as Hallasan National Park at the center of the island (Figure 2). A multivariate regression model relating visitation to attributes of the landscape reveals certain features of the natural and built environment that are demanded by tourists (Table 2). Tourists are attracted to natural features—especially beaches and seacliffs—on Jeju Island. Several predictors associated with access also explain significant portions of the spatial variation in visitation. These include the length of roads within cells, distance from a main road, and distance from points of entry such as the international airport in Jeju City and ferry terminals in Jeju City, Seongsan, and Seogwipo. The negative effects of distance indicate that the visitation rate of cells is inversely related to the distance of the cell from the points of entry. Tourists are drawn to areas on Jeju Island with established view points, golf courses, and hiking trails, and they spend less time visiting designated commercial zones. Landlocked areas are visited less frequently than coastal sites, even while controlling for the effects of beaches and seacliffs. Locations of cultural and historical sites do not explain a significant proportion of the variance in visitation rate (Table 2). Overall, the multivariate regression model including 14 predictors explains 56% of the variation in visitation rate measured as the multivariate PUD, TUD, and MP response variable.
4. Discussion
This study presents an approach for assessing tourists’ preferences for cultural and natural landscapes using multiple sources of UGC. Geotagged photographs and tweets shared publicly on Flickr and Twitter, as well as mobile phone traffic provided by a large mobile telecommunications company (SKT), were all correlated with traditional entry-gate and ticket sales counts at tourist sites. This supports and extends findings from recent literature, where most examples are from North America and Europe, to show that UGC is a useful supplement to traditional methods for counting visitors in South Korea. With these high-resolution and spatially-explicit visitation data we are able to quantify the preference that tourists to Jeju Island have for natural settings and other landscape features in order to inform sustainable tourism and economic development.
We observe that UGC can enable research on tourism by providing flexible data on visitors’ behavior across many sites. On Jeju Island, we use UGC to demonstrate how a large dataset on visitation, combined with statistical techniques, can quantify the importance of factors that drive visitation patterns and understand visitor preferences. We find that tourists to Jeju Island prefer sites with a combination of natural landforms and built environments, that are accessible by road. In a recent survey of 2624 foreign tourists, 63.8% of respondents stated “appreciation of natural scenery” as their primary motivation for visiting Jeju Island, followed by “recreation/relaxation”, “shopping”, and “history/cultural experience” (12.8%, 6.7%, and 3.9% of respondents, respectively; [47]). Our analysis using UGC supports the main survey finding that visitors prefer natural places, while allowing us to determine more specifically that demand is driven by visits to beaches and sea cliffs with trails and established viewpoints—likely because of the aesthetic quality of these places. In our landscape-scale model, commercial zones where shopping is likely to take place are negatively related to visitation rates and cultural attractions are not a significant predictor. This contradicts the survey and shows the challenge of measuring effects on the more subtle components of the tourism patterns. It is possible that these subtle patterns may be missing from UGC. We know that the visitors represented in the UGC are a small and potentially biased subset of the population [55]. For example, if cultural attractions are popular with older visitors, but our UGC sample is biased towards younger visitors, we may not see the effect of such cultural sites on UGC spatial patterns. Similarly, while we took steps to adjust the UGC measurements so that they only include the activity of tourists, not of Jeju residents, this process was imperfect and could also explain discrepancies between our results and the published survey. For example, we did not adjust the TUD variable at all, so some small amount of local activity may be represented. We expect twitter activity overwhelmingly represents tourists, as we found for Flickr, but there is room for improvement here in future work. While there are limits to the explanatory power of these models, these results suggest that taken together, on-site surveys and UGC provide a powerful source of information on tourists’ preferences and that UGC can provide finer-grain insights into tourists’ behavior than traditional surveys alone.
This study develops approaches for reconciling the disconnect between regional planning efforts and the underlying data on the demand for cultural ecosystem services that could inform decisions. Decision-makers who are concerned with sustainable economic development strive to promote tourism while maintaining the natural environments that provide many other important ecological, cultural, and economic benefits [56,57]. Development plans and policies require information on the supply and demand for nature-based tourism and how it trades off with other ecosystem services at landscape or regional scales [37]. At these scales, cultural ecosystem services are challenging to measure compared to services that can be measured in biophysical terms with the higher-volume and higher-resolution spatial data that are produced by remote sensing technologies [58]. UGC may provide the social sciences with the opportunity to stay on pace with the earth sciences, by measuring many more sites than is feasible with traditional monitoring techniques (824 sites in this study), and facilitating landscape-scale analyses of behavior. Practitioners recognizing this opportunity are increasingly relying on UGC-based maps of recreational use to create plans and policies [32,37,59,60,61]. Nevertheless, cultural ecosystem services like recreation and tourism are still under-represented in multiple-service assessments [10,62].
Comparisons of visitation rate measurements from three sources of UGC and traditional on-site counts reveal that UGC can capture variation in visitation rates to tourist sites on Jeju Island. Nonetheless, the relationship between each UGC data source and the surveyed visitor counts is unique, and the differences might be explained by each data source’s data-generating process. Because PUD, TUD, and MP metrics are based on different forms of media (photographs, tweets, and mobile communications, respectively), we might expect the accuracy of these data sources for measuring general visitation patterns to depend on characteristics of the site being measured, characteristics of the visitors, and the mobile network connectivity at the site. Generally, people post tweets while they are connected to a mobile or wifi network, while people post photographs that they have taken previously in places with or without network access. It follows that TUD is more correlated than PUD with on-site counts at the 36 test sites, which are a mix of indoor (e.g., museums and galleries) and outdoor (e.g., UNESCO sites, waterfalls, and parks) locations, all with access to mobile networks. Other studies that measured visitation rates in outdoor natural settings found stronger correlations between PUD and on-site estimates (e.g., [29] in US lakes, [31] in US National Parks), while studies of urban park use found that TUD was more closely related to on-site counts than PUD in cities [26,28]. We might expect MP to capture similar patterns as TUD, since both values are generated by people using mobile devices to communicate. The difference in the strength of the correlations for MP and TUD might also be attributed to the differences in the sample sizes. Surveyed annual visitor counts spanned several (up to seven) years for most sites and twitter coverage provided annual TUD values for each year from 2012–2014, while MP data coverage provided a count for only the year 2014. Given the unique data-generating process of each data source, as well as unique visitor and site characteristics, there is likely value in further exploring differences among the available sources of information for estimating visitation rates.
While comparisons of annual visitation rates from UGC versus on-site counts show that all three measures of UGC are correlated with on-site counts, there are several sources of uncertainty in both the user-generated and on-site estimates of visits. First, the accuracy of all UGC-based visitation rates at tourist sites depends on the accuracy of the spatial representation of the boundary of each site and the accuracy of the geolocation assigned to the photographs, tweets, or mobile communications. This location is typically derived from a built-in GPS and accurate to less than 10 m. In some cases, images shared on Flickr may be geotagged manually via an online map interface, in which case the positions where images appear to have been taken may be less accurate [63]. Second, since not all visitors use Flickr, Twitter, or the SKT network, and not all users of these platforms or networks share content at every place they visit, UGC may suffer from an under-reporting bias. This under-reporting can be problematic when combined with sampling biases associated with the age, gender, or socio-economic status of the social media and mobile phone users [64,65]. Flickr and Twitter users, for instance, are more likely to be female than male, have more education, and tend to be younger than the overall population [66]. Furthermore, visitors may have a propensity for photographing or tweeting about certain locations or activities [23], which could explain some of the variability seen in the UGC-OSV comparisons (Figure 3). Just as there are biases and variability in the UGC, there is uncertainty in the on-site counts of visitors that are collected using more traditional methods. At some of the 36 sites included in this study, visitation is estimated based on ticket sales. These counts may be more accurate than counts at sites where entry is free, and visitors are counted visually as they enter a site, or estimated by other sampling methods. Sources of uncertainty associated with traditional data [67] have been studied and are far better understood compared to the biases present in UGC [68]. Our results indicate that there is potential for UGC to inform estimates of visitation and visitors’ preferences and further research on the biases in these data sources is warranted.
5. Conclusions
This study indicates that visitation rates derived from UGC present an opportunity for measuring tourism demand at regional scales that are relevant to sustainable development planning. In many places, UGC is cheaper to collect and more complete in spatial and temporal coverage compared to traditional methods for surveying visitors. UGC that are stamped with specific locations and event times are flexible and amenable to analyses at different spatial and temporal scales, allowing for ongoing monitoring and post-hoc hypothesis testing with data that already exist. The relatively low cost of collecting a large spatial or temporal dataset based on public social media platforms and the richness of its metadata lead us to conclude that social media content is informative at the scales tested here. In contrast, the proprietary mobile communications data used here, while useful, had to be purchased in aggregate, and the aggregation methods are not fully transparent. We conclude that visitation measures that include all available sources of information, including traditional on-site surveys, will be useful. We suggest that natural resource managers, policy-makers, and development planners can use UGC to measure the cultural benefits derived from recreation and tourist sites at the same scales at which they measure other economic or ecological benefits of the environment.
Author Contributions
Conceptualization, S.A.W. and C.-K.K.; methodology, S.A.W., D.M.F., Y.-H.R.; formal analysis, D.M.F., Y.-H.R., S.A.W.; writing—original draft preparation D.M.F., S.A.W.; writing—review and editing D.M.F., S.A.W., C.-K.K.; visualization D.M.F.; supervision, S.A.W., C.-K.K.; project administration, S.A.W., C.-K.K.; funding acquisition, S.A.W., C.-K.K.
Funding
This research was supported by the Korea Environment Institute [RR2015-11] and Korea Coast Guard [KCG-01-2017-05].
Acknowledgments
We thank the Jeju Development Institute for consultation and local expertise, Marie Donahue and Bonnie Keeler for helping to develop these approaches, and Kimihiro Noguchi for statistical advice.
Conflicts of Interest
The authors declare no conflict of interest. Members of the funding agency participated in the design and writing of this paper.
Appendix A

Table A1.
Tourist Sites Table.
| Name | Years | Lat | Long |
|---|---|---|---|
| Bijarim forest | 2005–2014 | 33.48440 | 126.8067 |
| Cheonjeyeon falls | 2005–2014 | 33.25057 | 126.4161 |
| Cheonjiyeon falls | 2005–2014 | 33.24693 | 126.5544 |
| Citrus museum | 2009–2014 | 33.27134 | 126.6069 |
| Daepo Jusangjeolli Cliff | 2006–2014 | 33.23767 | 126.4250 |
| Extreme island | 2005–2005 | 33.24692 | 126.5074 |
| Folk & natural museum | 2005–2014 | 33.50642 | 126.5316 |
| Gidang art museum | 2007–2014 | 33.24485 | 126.5512 |
| Haenyeo museum | 2007–2014 | 33.52357 | 126.8634 |
| Hallim park | 2005–2012 | 33.38948 | 126.2392 |
| Hangmong historical site | 2005–2014 | 33.45233 | 126.4078 |
| Hanwha aqua planet Jeju | 2014–2014 | 33.43302 | 126.9275 |
| Hwarakwon | 2005–2007 | 33.24529 | 126.5788 |
| Ilchul land | 2005–2014 | 33.38357 | 126.8413 |
| Jeju Chusa memorial hall | 2005–2014 | 33.25054 | 126.2785 |
| Jeju folk village museum | 2005–2012 | 33.32252 | 126.8420 |
| Jeju hangil memorial hall | 2005–2014 | 33.54154 | 126.6429 |
| Jeju love land | 2005–2012 | 33.45155 | 126.4900 |
| Jeju minimini land | 2005–2012 | 33.43334 | 126.6746 |
| Jeju museum of art | 2014–2014 | 33.45242 | 126.4899 |
| Jeju sculpture park | 2005–2012 | 33.25366 | 126.3222 |
| Jeju starlight world park and planetarium | 2010–2014 | 33.44450 | 126.5492 |
| Jeju stone park | 2007–2014 | 33.44843 | 126.6586 |
| Jeolmul natural recreation forest | 2005–2014 | 33.43696 | 126.6282 |
| Jeongbang falls | 2005–2014 | 33.24471 | 126.5716 |
| Manjanggul cave | 2005–2014 | 33.52850 | 126.7712 |
| Mara ocean park | 2005–2014 | 33.20676 | 126.2912 |
| Pacific land | 2005–2005 | 33.24404 | 126.4155 |
| Samseonghyeol | 2005–2012 | 33.50424 | 126.5292 |
| Sanbangsan | 2005–2014 | 33.24141 | 126.3130 |
| Sangumburi | 2005–2012 | 33.43290 | 126.6931 |
| Seobok museum | 2005–2014 | 33.24487 | 126.5709 |
| Seogwipo natural recreation forest | 2005–2014 | 33.31132 | 126.4600 |
| Seogwipo provincial marine park | 2005–2014 | 33.23897 | 126.5588 |
| Seongsan ilchulbong | 2005–2014 | 33.45824 | 126.9423 |
| Sinyoung film museum | 2005–2005 | 33.27432 | 126.7043 |
| Soingook theme park | 2005–2012 | 33.29039 | 126.3225 |
| Spirited garden | 2005–2012 | 33.32559 | 126.2551 |
| Teddy Bear museum | 2005–2013 | 33.25028 | 126.4121 |
| Yeomiji botanical gardens | 2005–2005 | 33.25261 | 126.4142 |
References
- Frumkin, H.; Bratman, G.N.; Breslow, S.J.; Cochran, B.; Kahn, P.H.; Lawler, J.J.; Levin, P.S.; Tandon, P.S.; Varanasi, U.; Wolf, K.L.; et al. Nature Contact and Human Health: A Research Agenda. Environ. Health Perspect. 2017, 125, 075001. [Google Scholar] [CrossRef]
- Kaplan, S. The restorative benefits of nature: Toward an integrative framework. J. Environ. Psychol. 1995, 15, 169–182. [Google Scholar] [CrossRef]
- Russell, R.; Guerry, A.D.; Balvanera, P.; Gould, R.K.; Basurto, X.; Chan, K.M.A.; Klain, S.; Levine, J.; Tam, J. Humans and Nature: How Knowing and Experiencing Nature Affect Well-Being. Annu. Rev. Environ. Res. 2013, 38, 473–502. [Google Scholar] [CrossRef]
- World Travel and Tourism Council Benchmark Report 2017—South Korea. Available online: https://www.wttc.org/-/media/files/reports/benchmark-reports/country-reports-2017/south-korea.pdf (accessed on 28 June 2018).
- Wight, P. Tools for sustainability analysis in planning and managing tourism and recreation in the destination. In Sustainable Tourism: A Geographical Perspective; Hall, C.M., Lew, A.A., Eds.; Addison Wesley Longman Ltd: Harlow, UK, 1998; pp. 75–91. [Google Scholar]
- Feather, P.; Hellerstein, D.; Tomasi, T. A Discrete-Count Model of Recreational Demand; Social Science Research Network: Rochester, NY, USA, 1995. [Google Scholar]
- Ward, F.A.; Loomis, J.B. The Travel Cost Demand Model as an Environmental Policy Assessment Tool: A Review of Literature. West. J. Agric. Econ. 1986, 11, 164–178. [Google Scholar]
- Adamowicz, W.; Swait, J.; Boxall, P.; Louviere, J.; Williams, M. Perceptions versus Objective Measures of Environmental Quality in Combined Revealed and Stated Preference Models of Environmental Valuation. J. Environ. Econ. Manag. 1997, 32, 65–84. [Google Scholar] [CrossRef]
- Jones, A.; Wright, J.; Bateman, I.; Schaafsma, M. Estimating Arrival Numbers for Informal Recreation: A Geographical Approach and Case Study of British Woodlands. Sustainability 2010, 2, 684–701. [Google Scholar] [CrossRef]
- La Rosa, D.; Spyra, M.; Inostroza, L. Indicators of Cultural Ecosystem Services for urban planning: A review. Ecol. Indic. 2016, 61 Pt 1, 74–89. [Google Scholar] [CrossRef]
- Duffield, B.S.; Coppock, J.T. The Delineation of Recreational Landscapes: The Role of a Computer-Based Information System. Trans. Inst. Br. Geogr. 1975, 141–148. [Google Scholar] [CrossRef]
- Levinsohn, A.; Langford, G.; Rayner, M.; Rintoul, J.; Eccles, R. Eccles A micro-computer based GIS for assessing recreation suitability. In Proceedings of the GIS 87 Symposium, Falls Church, VA, USA, 26–30 October 1987; pp. 739–747. [Google Scholar]
- Hanley, N.; Colombo, S.; Tinch, D.; Black, A.; Aftab, A. Estimating the benefits of water quality improvements under the Water Framework Directive: Are benefits transferable? Eur. Rev. Agric. Econ. 2006, 33, 391–413. [Google Scholar] [CrossRef]
- Alessa, L.; Kliskey, A.; Brown, G. Social–ecological hotspots mapping: A spatial approach for identifying coupled social–ecological space. Landsc. Urb. Plan. 2008, 85, 27–39. [Google Scholar] [CrossRef]
- Ancona, Z.H.; Semmens, D.J.; Sherrouse, B.C. Social-Value Maps for Arapaho, Roosevelt, Medicine Bow, Routt, and White River National Forests, Colorado and Wyoming; Scientific Investigations Report; U.S. Geological Survey: Reston, VA, USA, 2016.
- Kliskey, A.D. Recreation terrain suitability mapping: A spatially explicit methodology for determining recreation potential for resource use assessment. Landsc. Urb. Plan. 2000, 52, 33–43. [Google Scholar] [CrossRef]
- Sherrouse, B.C.; Clement, J.M.; Semmens, D.J. A GIS application for assessing, mapping, and quantifying the social values of ecosystem services. Appl. Geogr. 2011, 31, 748–760. [Google Scholar] [CrossRef]
- Samuelson, P.A. Consumption Theory in Terms of Revealed Preference. Economica 1948, 15, 243–253. [Google Scholar] [CrossRef]
- Elwood, S.; Goodchild, M.F.; Sui, D.Z. Researching Volunteered Geographic Information: Spatial Data, Geographic Research, and New Social Practice. Annu. Associ. Amer. Geogr. 2012, 102, 571–590. [Google Scholar] [CrossRef]
- Girardin, F.; Calabrese, F.; Fiore, F.D.; Ratti, C.; Blat, J. Digital Footprinting: Uncovering Tourists with User-Generated Content. IEEE Pervasive Comput. 2008, 7, 36–43. [Google Scholar] [CrossRef]
- Levin, N.; Lechner, A.M.; Brown, G. An evaluation of crowdsourced information for assessing the visitation and perceived importance of protected areas. Appl. Geogr. 2017, 79, 115–126. [Google Scholar] [CrossRef]
- Stefanidis, A.; Crooks, A.; Radzikowski, J. Harvesting ambient geospatial information from social media feeds. GeoJournal 2013, 78, 319–338. [Google Scholar] [CrossRef]
- Wood, S.A.; Guerry, A.D.; Silver, J.M.; Lacayo, M. Using social media to quantify nature-based tourism and recreation. Sci. Rep. 2013, 3, 2976. [Google Scholar] [CrossRef]
- Calabrese, F.; Ferrari, L.; Blondel, V.D. Urban Sensing Using Mobile Phone Network Data: A Survey of Research. ACM Comput. Surv. 2014, 47, 25:1–25:20. [Google Scholar] [CrossRef]
- Steenbruggen, J.; Tranos, E.; Nijkamp, P. Data from mobile phone operators: A tool for smarter cities? Telecommun. Policy 2015, 39, 335–346. [Google Scholar] [CrossRef]
- Donahue, M.L.; Keeler, B.L.; Wood, S.A.; Fisher, D.M.; Hamstead, Z.A.; McPhearson, T. Using social media to understand drivers of urban park visitation in the Twin Cities, MN. Landsc. Urb. Plan. 2018, 175, 1–10. [Google Scholar] [CrossRef]
- Fisher, D.M.; Wood, S.A.; White, E.M.; Blahna, D.J.; Lange, S.; Weinberg, A.; Tomco, M.; Lia, E. Recreational use in dispersed public lands measured using social media data and on-site counts. J. Environ. Manag. 2018, 222, 465–474. [Google Scholar] [CrossRef] [PubMed]
- Hamstead, Z.A.; Fisher, D.; Ilieva, R.T.; Wood, S.A.; McPhearson, T.; Kremer, P. Geolocated social media as a rapid indicator of park visitation and equitable park access. Comput. Environ. Urb. Sys. 2018, 72, 38–50. [Google Scholar] [CrossRef]
- Keeler, B.L.; Wood, S.A.; Polasky, S.; Kling, C.; Filstrup, C.T.; Downing, J.A. Recreational demand for clean water: Evidence from geotagged photographs by visitors to lakes. Front. Ecol. Environ. 2015, 13, 76–81. [Google Scholar] [CrossRef]
- Schirpke, U.; Timmermann, F.; Tappeiner, U.; Tasser, E. Cultural ecosystem services of mountain regions: Modelling the aesthetic value. Ecol. Indic. 2016, 69, 78–90. [Google Scholar] [CrossRef]
- Sessions, C.; Wood, S.A.; Rabotyagov, S.; Fisher, D.M. Measuring recreational visitation at U.S. National Parks with crowd-sourced photographs. J. Environ. Manag. 2016, 183 Pt 3, 703–711. [Google Scholar] [CrossRef]
- Van Zanten, B.T.; van Berkel, D.B.; Meentemeyer, R.K.; Smith, J.W.; Tieskens, K.F.; Verburg, P.H. Continental-scale quantification of landscape values using social media data. PNAS 2016, 113, 12974–12979. [Google Scholar] [CrossRef]
- Walden-Schreiner, C.; Leung, Y.-F.; Tateosian, L. Digital footprints: Incorporating crowdsourced geographic information for protected area management. Appl. Geogr. 2018, 90, 44–54. [Google Scholar] [CrossRef]
- González, M.C.; Hidalgo, C.A.; Barabási, A.-L. Understanding individual human mobility patterns. Nature 2008, 453, 779–782. [Google Scholar] [CrossRef]
- Lee, W.K.; Sohn, S.Y.; Heo, J. Utilizing mobile phone-based floating population data to measure the spatial accessibility to public transit. Appl. Geogr. 2018, 92, 123–130. [Google Scholar] [CrossRef]
- Song, C.; Qu, Z.; Blumm, N.; Barabási, A.-L. Limits of Predictability in Human Mobility. Science 2010, 327, 1018–1021. [Google Scholar] [CrossRef]
- Arkema, K.K.; Verutes, G.M.; Wood, S.A.; Clarke-Samuels, C.; Rosado, S.; Canto, M.; Rosenthal, A.; Ruckelshaus, M.; Guannel, G.; Toft, J.; et al. Embedding ecosystem services in coastal planning leads to better outcomes for people and nature. PNAS 2015, 112, 7390–7395. [Google Scholar] [CrossRef]
- Hausmann, A.; Toivonen, T.; Slotow, R.; Tenkanen, H.; Moilanen, A.; Heikinheimo, V.; Di Minin, E. Social Media Data Can Be Used to Understand Tourists’ Preferences for Nature-Based Experiences in Protected Areas. Conserv. Lett. 2017. [Google Scholar] [CrossRef]
- Hausmann, A.; Toivonen, T.; Heikinheimo, V.; Tenkanen, H.; Slotow, R.; Di Minin, E. Social media reveal that charismatic species are not the main attractor of ecotourists to sub-Saharan protected areas. Sci. Rep. 2017, 7, 763. [Google Scholar] [CrossRef]
- Heikinheimo, V.; Minin, E.D.; Tenkanen, H.; Hausmann, A.; Erkkonen, J.; Toivonen, T. User-Generated Geographic Information for Visitor Monitoring in a National Park: A Comparison of Social Media Data and Visitor Survey. ISPRS Int. J. Geo-Inf. 2017, 6, 85. [Google Scholar] [CrossRef]
- Sonter, L.J.; Watson, K.B.; Wood, S.A.; Ricketts, T.H. Spatial and Temporal Dynamics and Value of Nature-Based Recreation, Estimated via Social Media. PLoS ONE 2016, 11, e0162372. [Google Scholar] [CrossRef]
- Goodchild, M.F. The quality of big (geo)data. Dialogues Hum. Geogr. 2013, 3, 280–284. [Google Scholar] [CrossRef]
- Ricciato, F.; Widhalm, P.; Pantisano, F.; Craglia, M. Beyond the “single-operator, CDR-only” paradigm: An interoperable framework for mobile phone network data analyses and population density estimation. Pervasive Mob. Comput. 2017, 35, 65–82. [Google Scholar] [CrossRef]
- Tsikerdekis, M.; Zeadally, S. Online Deception in Social Media. Commun. ACM 2014, 57, 72–80. [Google Scholar] [CrossRef]
- KOSIS Korean Statistical Information Service. Available online: http://kosis.kr/eng/index/index.do (accessed on 27 March 2019).
- Jeju Special Self-Governing Province Natural Environment Ecology Information System. Available online: http://nature.jeju.go.kr/ (accessed on 27 March 2019).
- Jeju Special Self-Governing Province. Investigation of Tourists Visiting Jeju Special Self-Governing Province in 2014; Jeju Special Self-Governing Province Government: Jeju City, South Korea, 2015.
- Tourism Knowledge Information System. Available online: https://www.tour.go.kr/ (accessed on 1 September 2015).
- Flickr. Available online: https://www.flickr.com/services/developer/api/ (accessed on 1 September 2015).
- Sharp, R. InVEST User Guide—InVEST 3.6.0 documentation. Available online: http://data.naturalcapitalproject.org/nightly-build/invest-users-guide/html/ (accessed on 27 March 2019).
- Twitter. Available online: https://developer.twitter.com (accessed on 1 September 2015).
- Leetaru, K.; Wang, S.; Cao, G.; Padmanabhan, A.; Shook, E. Mapping the global Twitter heartbeat: The geography of Twitter. First Monday 2013, 18. [Google Scholar] [CrossRef]
- Martinez-Harms, M.J.; Bryan, B.A.; Wood, S.A.; Fisher, D.M.; Law, E.; Rhodes, J.R.; Dobbs, C.; Biggs, D.; Wilson, K.A. Inequality in access to cultural ecosystem services from protected areas in the Chilean biodiversity hotspot. Sci. Total Environ. 2018, 636, 1128–1138. [Google Scholar] [CrossRef]
- Mahmud, J.; Nichols, J.; Drews, C. Home Location Identification of Twitter Users. ACM Trans. Intell. Syst. Technol. 2014, 5, 47:1–47:21. [Google Scholar] [CrossRef]
- Tenkanen, H.; Di Minin, E.; Heikinheimo, V.; Hausmann, A.; Herbst, M.; Kajala, L.; Toivonen, T. Instagram, Flickr, or Twitter: Assessing the usability of social media data for visitor monitoring in protected areas. Sci. Rep. 2017, 7, 17615. [Google Scholar] [CrossRef]
- Guerry, A.D.; Polasky, S.; Lubchenco, J.; Chaplin-Kramer, R.; Daily, G.C.; Griffin, R.; Ruckelshaus, M.; Bateman, I.J.; Duraiappah, A.; Elmqvist, T.; et al. Natural capital and ecosystem services informing decisions: From promise to practice. PNAS 2015, 112, 7348–7355. [Google Scholar] [CrossRef]
- Ruckelshaus, M.; McKenzie, E.; Tallis, H.; Guerry, A.; Daily, G.; Kareiva, P.; Polasky, S.; Ricketts, T.; Bhagabati, N.; Wood, S.A.; et al. Notes from the field: Lessons learned from using ecosystem service approaches to inform real-world decisions. Ecol. Econom. 2015, 115, 11–21. [Google Scholar] [CrossRef]
- Ryan, R.L. The social landscape of planning: Integrating social and perceptual research with spatial planning information. Landsc. Urb. Plan. 2011, 100, 361–363. [Google Scholar] [CrossRef]
- Casalegno, S.; Inger, R.; DeSilvey, C.; Gaston, K.J. Spatial Covariance between Aesthetic Value & Other Ecosystem Services. PLoS ONE 2013, 8, e68437. [Google Scholar]
- Guerrero, P.; Møller, M.S.; Olafsson, A.S.; Snizek, B. Revealing Cultural Ecosystem Services through Instagram Images: The Potential of Social Media Volunteered Geographic Information for Urban Green Infrastructure Planning and Governance. Urb. Plan. 2016, 1, 1. [Google Scholar] [CrossRef]
- Tenerelli, P.; Demšar, U.; Luque, S. Crowdsourcing indicators for cultural ecosystem services: A geographically weighted approach for mountain landscapes. Ecol. Indic. 2016, 64, 237–248. [Google Scholar] [CrossRef]
- Clec’h, S.L.; Oszwald, J.; Decaens, T.; Desjardins, T.; Dufour, S.; Grimaldi, M.; Jegou, N.; Lavelle, P. Mapping multiple ecosystem services indicators: Toward an objective-oriented approach. Ecol. Indic. 2016, 69, 508–521. [Google Scholar] [CrossRef]
- Zielstra, D.; Hochmair, H.H. Positional accuracy analysis of Flickr and Panoramio images for selected world regions. J. Spat. Sci. 2013, 58, 251–273. [Google Scholar] [CrossRef]
- Gilbert, E.; Karahalios, K.; Sandvig, C. The Network in the Garden: An Empirical Analysis of Social Media in Rural Life. In Proceedings of the SIGCHI Conference on Human Factors in Computing Systems, Florence, Italy, 5–10 April 2008; ACM: New York, NY, USA; pp. 1603–1612. [Google Scholar]
- Li, L.; Goodchild, M.F.; Xu, B. Spatial, temporal, and socioeconomic patterns in the use of Twitter and Flickr. Cartogr. Geogr. Inf. Sci. 2013, 40, 61–77. [Google Scholar] [CrossRef]
- Jul 31 2012 Social Network Analysis Report—Demographic—Geographic and Search Data Revealed. Ignite Social Media—The Original Social Media Agenc. 2012. Available online: https://www.ignitesocialmedia.com/social-media-stats/2012-social-network-analysis-report/ (accessed on 1 September 2015).
- Cessford, G.; Muhar, A. Monitoring options for visitor numbers in national parks and natural areas. J. Nat. Conserv. 2003, 11, 240–250. [Google Scholar] [CrossRef]
- Ruths, D.; Pfeffer, J. Social media for large studies of behavior. Science 2014, 346, 1063–1064. [Google Scholar] [CrossRef]
Figure 1.
Jeju Island, South Korea. Dots show locations of 36 tourist sites for which on-site visitor counts were compared to visitation measured from UGC.
Figure 1.
Jeju Island, South Korea. Dots show locations of 36 tourist sites for which on-site visitor counts were compared to visitation measured from UGC.

Figure 2.
Maps show the variation in tourist visitation rate across Jeju Island, based on data from (A) photographs (PUD), (B) tweets (TUD), and (C) mobile-phone communications (MP), summarized in 2.6 km2 cells. For each variable, positive values were log-transformed and then binned into five equal intervals for visualizing. Square brackets indicate closed intervals—the limit value is included. Parentheses indicate open intervals—the limit value is excluded. Values in the legends are untransformed. For (A,B) white cells indicate zeros, while in (C) white cells indicate no data.

Figure 3.
Relationships between three different user-generated measures of annual visitation—(A) photographs (PUD), (B) tweets (TUD), and (C) mobile-phone communications (MP)—and on-site counts taken at 36 tourist sites. Dashed line represents a 1:1 relationship. Black lines show the best fit using ordinary least squares.

Figure 4.
Maps show the percentage of visitors who are tourists, based on data from (A) Flickr profiles and (B) mobile-phone communications, summarized in 2.6 km2 hexagonal cells. Greens indicate majority tourists, browns indicate majority Jeju residents. All tweets were assumed to originate from tourists and thus not plotted here.

Table 1.
Variables measured in the 2.6 km2 grid cells and used as predictors in multivariate regression analyses.
Table 1.
Variables measured in the 2.6 km2 grid cells and used as predictors in multivariate regression analyses.
| Predictor | Measurement | Units | Min | Max |
|---|---|---|---|---|
| beach | area | km2 | 0 | 0.076 |
| ln(commercial zones) | area | km2 | 0 | 1.197 |
| cultural sites | area | km2 | 0 | 0.648 |
| distance to port (airports & ferry terminals) | distance | km*10 | 0 | 3.805 |
| distance to road | distance | km | 0 | 9.390 |
| forest | area | km2 | 0 | 2.600 |
| golf course (and other sport facilities) | area | km2 | 0 | 1.352 |
| industrial sites | area | km2 | 0 | 0.151 |
| land | area | km2 | 0.002 | 2.600 |
| natural monuments | area | km2 | 0 | 2.600 |
| road | length | km*10 | 0 | 5.143 |
| seacliff | area | km2 | 0 | 0.049 |
| trail (Olle and Hallasan trails) | length | km | 0 | 10.61 |
| viewpoint | count | count | 0 | 6 |
Table 2.
Coefficients, standard errors of the estimates, p-values, and the scale analyzed for the 14 predictor variables included in a multivariate regression analysis with the response variable as the linear combination of PUD, TUD, and MP.
Table 2.
Coefficients, standard errors of the estimates, p-values, and the scale analyzed for the 14 predictor variables included in a multivariate regression analysis with the response variable as the linear combination of PUD, TUD, and MP.
| Predictor | Beta | Std. Error | p | Units |
|---|---|---|---|---|
| (Intercept) | 7.328 | 0.367 | <0.001 | |
| beach | 45.255 | 15.733 | 0.0041 | km2 |
| commercial zones | −9.707 | 2.557 | <0.001 | km2 |
| cultural sites | 1.144 | 2.552 | 0.6540 | km2 |
| distance to port | −0.509 | 0.114 | <0.001 | 10* km |
| distance to road | −1.034 | 0.124 | <0.001 | km |
| forest | −0.821 | 0.138 | <0.001 | km2 |
| golf course | 2.483 | 0.654 | <0.001 | km2 |
| industrial sites | 7.126 | 6.298 | 0.2581 | km2 |
| land | 0.548 | 0.153 | <0.001 | km2 |
| natural monuments | 0.514 | 0.221 | 0.0205 | km2 |
| road | 3.069 | 0.248 | <0.001 | 10* km |
| seacliff | 64.601 | 26.550 | 0.0152 | km2 |
| trail | 0.462 | 0.095 | <0.001 | km |
| viewpoint | 0.774 | 0.238 | 0.0012 | count |
© 2019 by the authors. Licensee MDPI, Basel, Switzerland. This article is an open access article distributed under the terms and conditions of the Creative Commons Attribution (CC BY) license (http://creativecommons.org/licenses/by/4.0/).
Share and Cite
MDPI and ACS Style
Fisher, D.M.; Wood, S.A.; Roh, Y.-H.; Kim, C.-K. The Geographic Spread and Preferences of Tourists Revealed by User-Generated Information on Jeju Island, South Korea. Land 2019, 8, 73. https://0-doi-org.brum.beds.ac.uk/10.3390/land8050073
AMA Style
Fisher DM, Wood SA, Roh Y-H, Kim C-K. The Geographic Spread and Preferences of Tourists Revealed by User-Generated Information on Jeju Island, South Korea. Land. 2019; 8(5):73. https://0-doi-org.brum.beds.ac.uk/10.3390/land8050073
Chicago/Turabian StyleFisher, David M., Spencer A. Wood, Young-Hee Roh, and Choong-Ki Kim. 2019. "The Geographic Spread and Preferences of Tourists Revealed by User-Generated Information on Jeju Island, South Korea" Land 8, no. 5: 73. https://0-doi-org.brum.beds.ac.uk/10.3390/land8050073
Note that from the first issue of 2016, this journal uses article numbers instead of page numbers. See further details here.