Challenges and Opportunities of Social Media Data for Socio-Environmental Systems Research


1
National Socio-Environmental Synthesis Center (SESYNC), University of Maryland, 1 Park Place, Suite 300, Annapolis, MD 21401, USA
2
Department of Geography, University of Alabama, Tuscaloosa, AL 35401, USA
3
Department of Computational and Data Sciences, George Mason University, Fairfax, VA 22020, USA
*
Author to whom correspondence should be addressed.
Land 2019, 8(7), 107; https://0-doi-org.brum.beds.ac.uk/10.3390/land8070107
Submission received: 31 May 2019
/
Revised: 24 June 2019
/
Accepted: 28 June 2019
/
Published: 4 July 2019
(This article belongs to the Special Issue Geospatial Social Data and Participatory Mapping for Landscape Change and Socio-Environmental Systems)
Abstract
:Social media data provide an unprecedented wealth of information on people’s perceptions, attitudes, and behaviors at fine spatial and temporal scales and over broad extents. Social media data produce insight into relationships between people and the environment at scales that are generally prohibited by the spatial and temporal mismatch between traditional social and environmental data. These data thus have great potential for use in socio-environmental systems (SES) research. However, biases in who uses social media platforms, and what they use them for, create uncertainty in the potential insights from these data. Here, we describe ways that social media data have been used in SES research, including tracking land-use and environmental changes, natural resource use, and ecosystem service provisioning. We also highlight promising areas for future research and present best practices for SES research using social media data.
1. Introduction
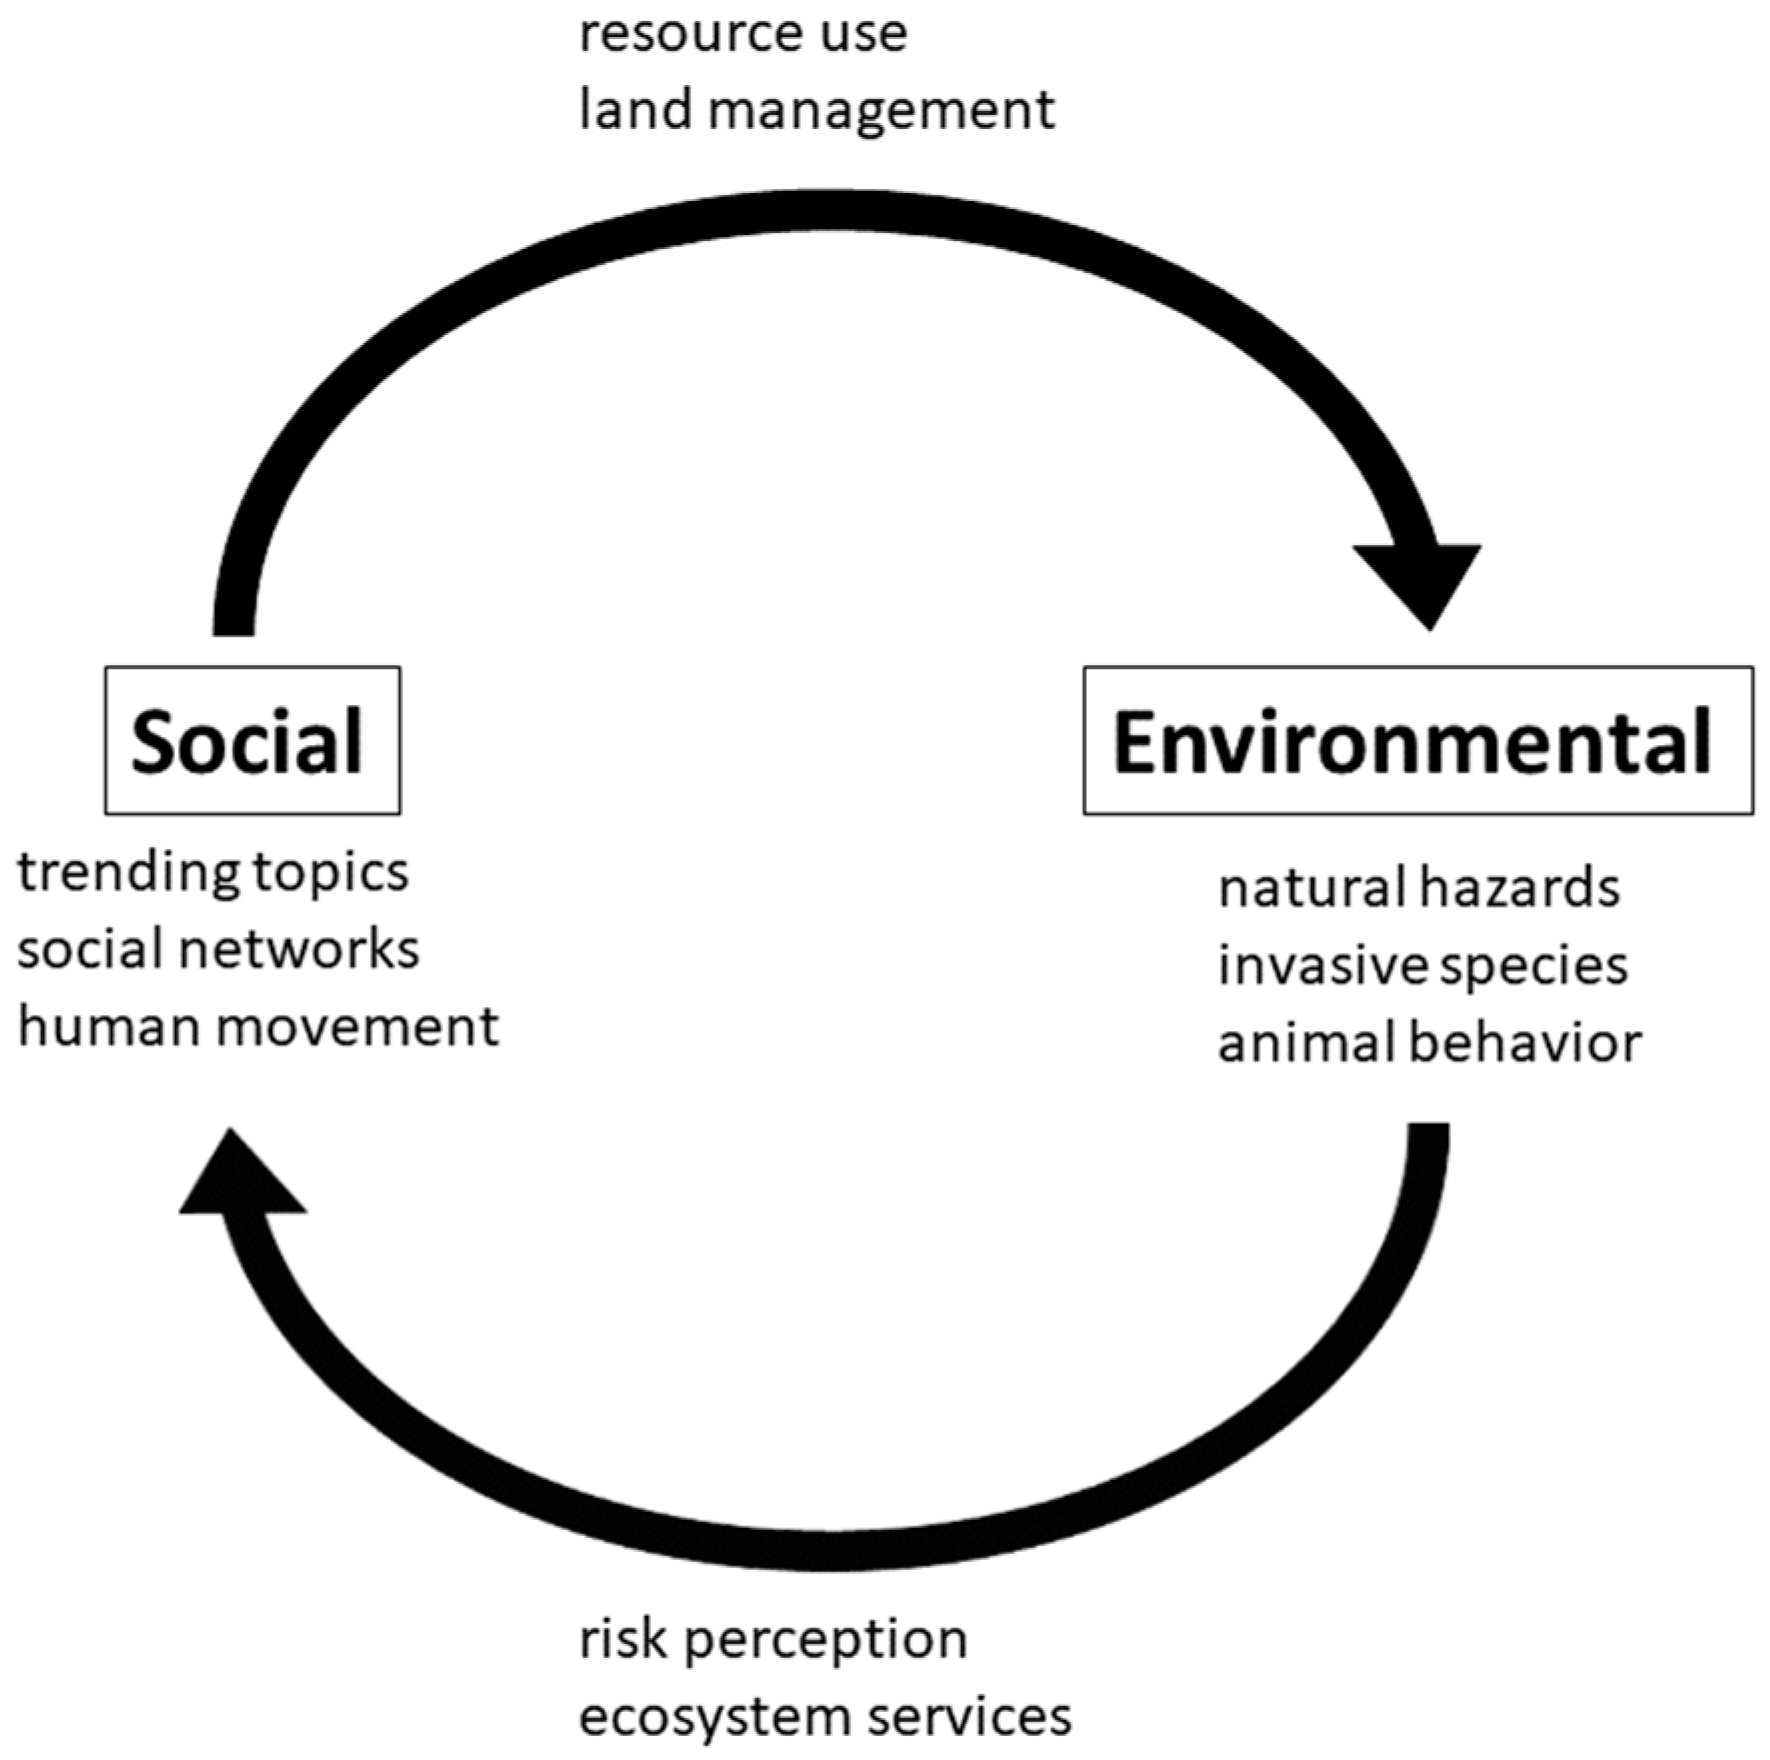
The recognition that humans are the primary agents of change in natural system structure and function [1,2,3] has led many researchers to adopt the concept of socio-environmental systems (i.e., socio-ecological systems or coupled human-natural systems) [4]. Socio-environmental systems (SES) are defined as tightly linked social and biophysical subsystems that mutually influence one another through positive and negative feedback, as shown in Figure 1. Within this conceptual framework, human behaviors, decisions, and policies influence the status of ecosystems (e.g., water quality) that, in turn, influence human beings’ quality of life and future decisions. For example, the structure and function of the natural landscape both influence and are influenced by natural resource use decisions and land managers’ actions [5]. Thus, landscape changes are linked to both natural processes of landscape change (e.g., erosion, forest succession, climate change, etc.) and local and broader-scale economic, political, and cultural forces that motivate natural resource use. SES research is necessary for addressing many environmental problems, which require consideration of social and environmental factors as well as the feedback between them [6], and for understanding human-environment interactions. The SES concept has thus been widely used to understand issues such as the vulnerability and resilience of human populations to natural hazards, where it is critical to consider the synergistic effects of population pressure, resource shortages, environmental change, and natural hazard events in order to prevent natural hazards becoming natural disasters [7].
SES research poses many challenges, not least of which are collecting or compiling data at the appropriate scales and aligning social and environmental data to address SES questions [8]. Collection of social, demographic, or political data often requires a trade-off between the fine-scaled detail necessary to understand behavior in a limited number of study sites (e.g., ethnographic case studies) and broad-scale spatial coverage that describes macro-level trends but is too coarse to provide insights into individual heterogeneity (e.g., aggregate census data). In addition, SES research is often complicated by mismatches between the spatial or temporal resolution or the extent of data describing important natural and social processes. For instance, the resolution of biophysical data, often obtained through remote sensing, does not easily correspond with the spatial units of social and political processes, such as administrative boundaries or census tracts. Furthermore, feedback between social and environmental actors can be characterized by significant temporal lags (e.g., processes of economic change operate on much faster time scales than those of climate change), through which the effects of human alterations of the natural system may not manifest until long after the alterations first occurred (e.g., [9]). Longitudinal data with sufficient depth to capture the effects of both slower environmental processes as well as relatively faster social processes are rare.
While the temporal and spatial resolutions and extents of traditional, authoritative data sources such as censuses and surveys are highly constrained by time, money, and expertise, there is also great potential for non-scientists to collect data on SES at greater extents and finer resolutions. Citizen science projects such as the Christmas Bird Count (which has been in existence since 1900 [10]) and projects using volunteered geographic information (VGI) (e.g., OpenStreetMap) [11], where the public actively supply geographical information, have contributed to a greater understanding of ecosystem changes over time [12]. Examples include the use of crowd-sourced data to map farm field size and land-use change at a global scale [13,14], monitor crops [15], and record biodiversity information for residential properties [16]. Now, with increasing internet coverage and cell phone use worldwide, social media sites (e.g., blogs, micro-blogs, social multimedia) have become an additional source of “big data” for information about social processes, reported in real time. To give a sense of the scale of information being shared online, Twitter, a popular micro blogging platform, has over 974 million user accounts and 126 million daily users, while Facebook has 1.2 billion daily users [17] and Instagram, a photo and video-sharing site, has 500 million daily users [18]. The photo sharing service, Flickr, has over 75 million accounts and over 10 billion photos and 3.5 million photos are uploaded every day to the site [19]. There are also a plethora of other social media platforms such as QQ, WeChat, VK, and others. Much of social media data also has a geographical component (as we will discuss in Section 2). For example, upwards of 50% of tweets from Twitter have some form of locational information in the form a place description or coordinates, while precisely geolocated tweets ranges from 0.5 to 3% [20]. It is also estimated that 4.5% of Flickr content is geotagged [21].
Social media posts act as a sort of unsolicited VGI, where people self-report their reactions to the digital and physical worlds. Unlike citizen science data and VGI, social media users put forth information that can be used for research, but without the goal of contributing to research [22]. We would argue that social media data have several features that make them complementary to traditional social data sources for SES research. The large quantity of data points supports robust quantitative analyses without enormous costs to researchers to collect it, and the individual-level resolution allows for scaling between individual decisions, behavior, or motivations, and aggregate behavior. Social media, along with citizen science data and VGI, also provide access to new data sources, such as observations from private property [23], and may be the only available source of social data in regions where large-scale social surveys are not carried out. Furthermore, the unsolicited nature of preferences, opinions, and perceptions stated on social media can produce unique insights and avoid some of the drawbacks of traditional survey methods, such as misinterpretation of survey questions [24] and bias associated with stated preferences [25].
The fine resolution and broad extent of social media data and the potential novel insights it can provide into individuals’ response to and influence on the environment make it an exciting data source for SES research, including issues of biodiversity conservation [26,27] and urban sustainability [28]. In the last decade, this field has been growing, but there are concerns about the ability of social media data to provide reliable insight into socio-environmental processes because of issues of bias and interpretation (e.g., [26,27,28]). These concerns lead us to ask the following questions:
- How can feedback between social and environmental systems be meaningfully studied using social media data?
- How can using social media data reframe or compliment current SES research questions and methods?
- Are there best practices for collecting and validating social media data for use in SES research?
We address these questions in the remainder of this paper. First, we review studies that have used social media data to examine a wide range of topics in SES. These studies vary in their spatial and temporal scale and the social media data sources that they use as shown in Table 1 but can be organized into categories based on the aspects of a SES that they focus on (i.e., Social, Environmental, Environmental → Social, or Social → Environmental, as shown in Figure 1). We begin by describing studies examining purely social or environmental phenomena, using social media data as “sensors” (Section 2). In Section 3, we describe ways that researchers have used social media data to study people’s responses to the environment, including responses to natural hazards and attitudes towards natural areas (Environmental → Social processes), before turning our attention to studies on the effects of people’s behaviors on the environment (Social → Environmental processes) in Section 4. These studies show how social media data provide insights into several land-related issues, including environmental and land-use change, ecosystem service provisioning, and informing land management and landscape conservation decisions. However, there are challenges to using and interpreting social media data, including several sources of bias. We discuss these in Section 5 and provide recommendations for best practices in this field, with a specific emphasis on SES research. Finally, in Section 6, we provide a brief summary of the paper.
2. Social Media Data as Social and Environmental “Sensors”
As people record their reactions to social and environmental phenomena on social media sites, the data they create can act as “sensors” tracking these phenomena [29] for a wide variety of topics (as shown in Table 1). Since social media data record people’s unsolicited views, they can provide insights into complex social phenomena that would otherwise go unnoticed [30]. Social media data have several key attributes (i.e., metadata, in the form of JSON or EXIF files from Twitter and Flickr respectively) that together create a rich source of information that can be mined for SES research. Metadata provide various pieces of information about a social media post and/or platform user, which researchers can access using an application programming interface (API). These include: the content of the posts themselves, which can take the form of text, images, or video; an associated timestamp and (often) geographic location; a network of “followers” or users who see the post; and a number of “likes” or “retweets” by other users, which can be used to estimate the influence or popularity of a particular post (as shown in Figure 2B). These different types of data are used to answer various research questions in SES studies, as shown in Figure 2. For example, the location coordinates associated with some social media posts provide information that can be used to analyze where a tweet originates (e.g., [31]) or where a Flickr photo was taken (e.g., [32]), and analyzing text provides information on the subjects of tweets (e.g., [33]). Thus, social media can track the “pulse” of public opinion and the popularity of different topics across space and over time, as well as how information spreads across networks, between individuals and groups [20]. Sentiment analysis, which quantifies positive or negative associations with different posts and associated topics, can be used to compare people’s attitudes or emotional responses towards different topics, such as the transit organizations of different cities [34] or urban parks [35].
Spatial information associated with social media data provides insight into difficult-to-measure processes such as human movement [46], including identification of hotspots and movement patterns of tourists [47] and differential movement abilities between residents of advantaged and disadvantaged neighborhoods [36]. Topics from georeferenced social media posts, as well as other types of VGI such as travel blogs and wikis, can be used to discern people’s conceptualizations of place (i.e., geo-narratives), including defining land-uses [48] and regions of thematic saliency [49,50]. Combined with the identification of important conversation topics, social network analysis exposes links between people, places, and topics, such as discussions of microcephaly, abortion rights, and mosquito control with the spread of the Zika virus [33].
VGI, including social media data, can also contribute to environmental monitoring efforts and provide insights into environmental phenomena, including filling gaps in authoritative environmental datasets [51]. For example, the locations of social media data have been used to track the extent of natural hazards such as floods [52,53,54], earthquakes [31,55], disease outbreaks [56], and wildfires [38,57]. In the case of such high-impact, rapid events, the high spatial and temporal resolution of social media data can make it critical for identifying places where people are in danger, as well as mapping the extent of hazards, particularly in areas lacking monitoring devices [57]. In a few cases, researchers have tapped social media data to document longer-term environmental trends, particularly ecological processes such as invasive species spread [39] and the timing of recurring events, such as pollen release [58] or leaf emergence [59]. Social networking sites can also serve as citizen science platforms where individuals leverage their social network to help identify species they observe, by posting pictures, audio files, or descriptions online. iNaturalist is an example of a social networking site specifically designed for this purpose (inaturalist.org), but such crowd-sourced species identification activities also occur on citizen science platforms such as eBird (https://ebird.org/home) and on social networking sites, such as Twitter [60]. Species observations on social media can provide valuable information on species distributions [39,61,62] and document animal behaviors captured in photos, videos, or audio recordings (e.g., female bird songs [63]).
In addition to recording social and environmental phenomena, social media data provide insight into linkages between social and environmental systems (as shown in Figure 1). Most of the SES research using social media data has focused on people’s responses to the environment, including natural hazards and ecosystem services (as we discuss in Section 3), rather than effects of people on the environment (as we discuss in Section 4).
3. Responses to the Environment: Perceptions, Attitudes, and Opinions
Just as social media data can track the extent of natural hazards, they also provide information about people’s responses to those events. For example, in addition to simply analyzing the spatial and temporal occurrences of posts related to wildfires on Twitter to map their extents, researchers have delved into the content of posts to gain insight into people’s socio-psychological responses to wildfire, such as concerns about property damage and health impacts as well as gratitude towards rescue workers [44,57]. There have also been several studies using social media data to examine risk perceptions to natural hazards and environmental disasters, including winter storms in New England [43], Typhoon Haiyan in the Philippines [64], flood and wind damage from Hurricane Sandy in the Northeastern U.S. [65,66], and algal blooms in Ohio [40]. Social media data provide insight into people’s concerns and situational awareness, both during and following events. Together with spatiotemporal information on the location of threats in real time [42], knowledge of people’s concerns help to guide and improve hazard response strategies [43,57]. Furthermore, social media posts can indicate the degree to which the public understands the environmental issues underlying crises (e.g., connecting a water supply shutdown with the toxic algal blooms that caused it [40]), the level of satisfaction or dissatisfaction with the government response to the event [43], and the importance of social networks for information spread during disasters [67].
Compared to research on responses to natural hazards, few studies have examined responses to longer-term environmental trends such as climate change over the periods at which the changes occur (i.e., decades). Most extant social media platforms have not been established long enough to capture long-term trends, but ongoing data collection could provide insight into people’s responses to longer-term changes. For example, several studies have used geolocated tweets to examine human mobility [68,69]; these methods could be applied to study changes in human movement (e.g., environmental migration) in response to changing climate, if collected over longer periods of time.
Social media data also provides information about the benefits that people get from ecosystems (e.g., ecosystem services) and how these vary across space and time in response to environmental features or management decisions. Much of the work on this topic has focused on people’s attitudes towards conservation areas and other environmental features [26]. Sentiment scores of tweets are used to quantify positive effects of exposure to nature, such as urban green spaces, on human wellbeing [70]. A number of studies have used the frequency of social media posts to estimate the number of visitors to recreation sites (e.g., [71,72]), and how recreation desirability relates to features such as water quality in lakes [24], or park amenities and accessibility [73]. Others have calculated the number of photos posted on social networking sites (e.g., Flickr, Instagram, Panaramio) at different locations to compare the aesthetic value of different sites or landscape features [74,75]. The content of social media posts (e.g., the subjects of photographs) can also document the activities people participate in and the features they notice or appreciate at different sites, such as preferences for animal species in a national park [42]. Analyzing the content of social media posts in natural areas has been used to infer the “cultural ecosystem services” (e.g., spiritual or aesthetic appreciation of nature, recreation, sense of place) they provide [41,76,77]. Notably, large-scale studies of aesthetic value and other cultural ecosystem services would not be feasible without these types of broad extent, fine-resolution data, which allow for comparisons between different landscapes. These data could be used at large scales to understand the tradeoffs between cultural ecosystem services and other goals for landscapes, such as food production, regulating ecosystem services, or biodiversity.
Beyond quantifying the benefits that people derive from landscapes, social media studies can inform land management decisions. Some researchers have used people’s attitudes towards subjects in social media posts to assign non-monetary values to places and actions, such as land conservation, as well as guide decisions for land management and planning to meet people’s preferences and expectations [78]. For example, Barry [79] used Flickr photos and associated comments to examine people’s perceptions of livestock grazing in San Francisco Bay Area parks, and Sonter et al. [80] examined the effects of forest clearing on nature-based recreation in Vermont.
In addition to capturing people’s responses to particular environmental events or natural features, identifying popular topics or trends on social media can provide information on the environmental issues that people care about [81,82]. Google Trends and Twitter in particular have often been used to track interest in topics over time and across space. For example, Cha and Stow [40] used Twitter to monitor online discussions around harmful algal blooms and the subsequent drinking water shutdown in Toledo, OH in 2014 and Google Trends to follow broader-scale interest in this issue over time. Twitter has also been used to gauge public interest in other environmental issues, such as people’s opinions about invasive species [39] and climate change [83]. Using spatial and temporal information and social networks, researchers can track how the interest in a topic varies across space or time [29,84], identify key stakeholder groups and information sharers [85], and understand how network structure influences the sharing and spread of information on environmental topics [60,86]. Research findings can inform education and tailoring of messages to increase interest in or understanding of key environmental issues. Roberge [87] used Twitter to assess interest in different species, which provides information on the efficacy of conservation outreach programs focused on different species and how this could be improved. Based on these works, one could easily imagine that in the future, an increased understanding of how people respond to the content and deliverery of messages could be used to tailor messages, to more effectively change people’s attitudes towards environmental issues and behaviors that influence the environment [88].
4. Effects of People’s Behaviors on the Environment
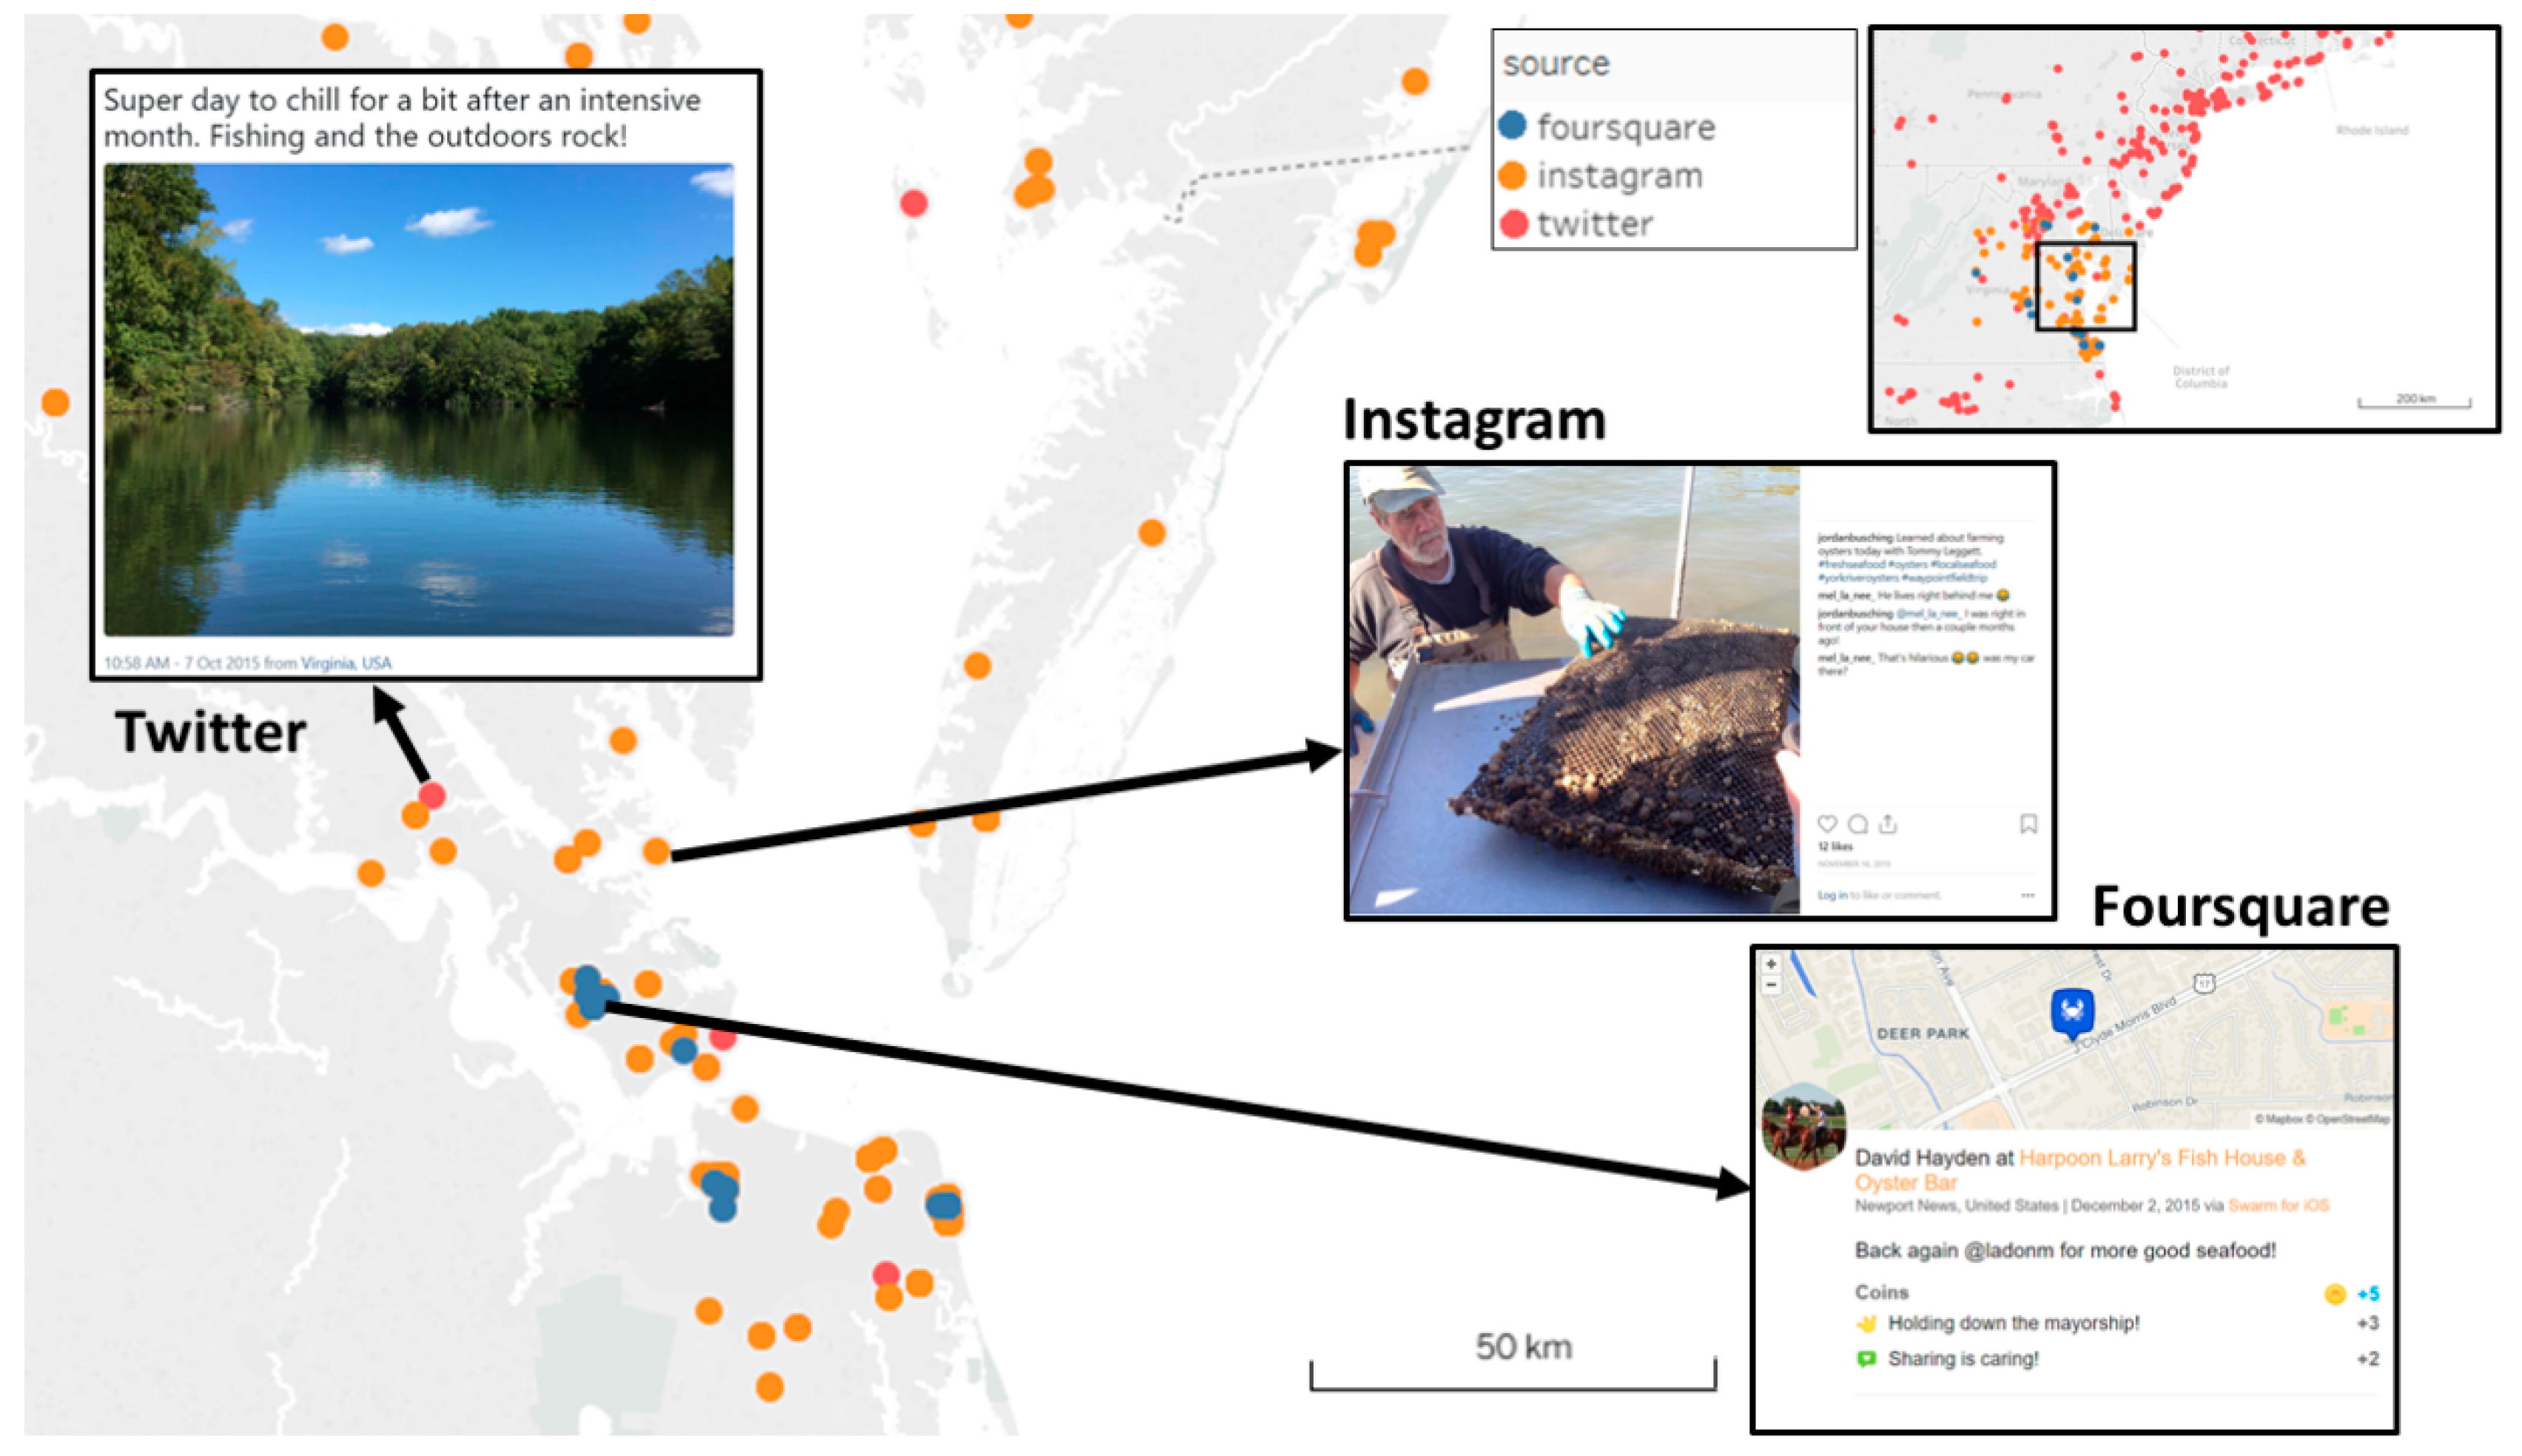
In general, behaviors are more difficult than attitudes to detect on social media, and thus less research has addressed the environmental impacts of relevant behaviors. However, it is also possible to use this data to detect some aspects of people’s effects on their environment via their self-reported behaviors. Reported participation in resource-use activities such as fishing (as shown in Figure 3), foraging, or hunting [45] could complement more authoritative data sources on these activities, particularly at local spatial scales. In addition, people may post on social media when making changes to their properties that have environmental consequences (whether positive or negative), such as planting native species in their gardens to provide habitat for endangered pollinator species, building a floodwall, or installing solar panels (as shown in Figure 4). Some users also report other behaviors on social media that have an indirect impact on the environment, such as choices to buy or promote “green” products.
Location data from social media can also provide information on the degree of human impact on natural areas. For example, in parks or other natural areas where location estimates are accurate and most users are involved in recreation, information on “hot spots” of use [89] can inform decisions about trail maintenance and monitoring of erosion and other environmental impacts [90]. At a larger spatial scale, social media data and VGI can be used to identify the locations of roads, fishing boats, or areas of high human movement, which may indicate potential threats to vulnerable animal populations (e.g., [90,91,92,93,94]). More generally, analysis of social media posts that provide information on land-use and species observations could be combined to better understand the broad-scale effects of land-use change on biodiversity, an area in need of research at large spatial scales [95].
5. Challenges and Best Practices
While social media can be an informative data source for SES research (as discussed above), there are concerns about bias in these data and their ability to provide reliable insight into social and socio-environmental processes [96]. There are some known biases in the users of social media data: Towards urban dwellers, with fewer users in rural areas, and a bias against populations that are technology averse, including the elderly [97]. In addition, there are some known differences between the user groups of various social media platforms [97]. Beyond these known biases, there is generally not enough information on social media users to identify biases in any particular study’s sample population, because of concerns about users’ privacy that limit the availability of personal information. Early research on social media revealed that even when usernames and other personal information is masked from data, it can still be possible to link specific posts to individuals [98]. Thus, social media companies have constantly evolving measures to limit access to sensitive information and data sharing. Changing options about how spatial locations are reported mean that the amount and precision of georeferenced data is constantly changing, as well as variable among posts. In addition, without basic information about who users are (e.g., where they are from; their age, race, gender, education level, etc.), it can be difficult to understand the complexities of social dynamics on social media and to recognize and deal with potential bias in the sample population.
The lack of information on who social media users are, and how they decide what to post online, can contribute to difficulty in confidently interpreting the content of social media posts. This is particularly an issue in cases where social media is used as “big data” with analysis of myriad posts from many individuals. A single social media platform can have many different uses for different individuals and populations [64]. For example, Twitter is used for professional networking and self-promotion, sharing news and information, or communicating conversationally with friends. Individuals may show biases in their behavior on social media depending on when in life they adopted its use [99,100,101] and whether their perceived audience is made up of friends, family, colleagues, potential employers, random strangers, or a combination of all of these. The meanings of specific terms (e.g., slang) and the tone of posts may depend on the identity of the user and their intended audience, which are often unknown. In addition, sarcasm and insincerity can be difficult to detect, especially when using algorithms to process data (e.g., for sentiment analysis [35]).
The major concern with using social media data for SES research is thus that either systematic biases or misinterpretation of data could lead to inaccurate conclusions about the social or environmental phenomena under investigation. A further issue is that it is generally not feasible to validate the data by asking follow-up questions or repeating a sample. Studies using social media data are often difficult to replicate because of constraints on data access and sharing. Some sites, such as Twitter, allow researchers to collect a small percentage of tweets in real time for free, but access to the full dataset or accessing past data usually requires payment to intermediary companies (e.g., Crimson Hexagon Data Library Platform, the sproutsocial platform, or sprinklr). Thus, different researchers could make the same query to retrieve data and return very different samples. Other sites, such as Facebook, have almost completely cut off access to data for researchers because of privacy concerns (although they have shared the data to companies that use it for political and economic means [102]). Restrictions on sharing data also reduce the replicability of data analysis.
Although the biases in social media data are important to recognize and take into account when designing studies and interpreting results, there are existing strategies to address some of the primary concerns with social media research [28]. With respect to SES research, we have identified three major categories of best practices, which we describe in the following subsections. Specifically, we describe the importance of selecting research questions which are appropriate for the data being collected (Section 5.1), engaging with theory (Section 5.2), and data validation (Section 5.3).
5.1. Design Research Questions That Are Appropriate for the Available Data
As with any new data or modeling technique, one has to understand the limits of social media and how it is different from other data sources that were collected for a specific reason and from a specific population. The attributes of social media data that make them challenging to work with (i.e., biases in who uses different platforms, unknown bias in particular samples, and difficulties in interpretation, as described above) limit the set of questions that can be reasonably and confidently addressed with this data. For example, questions that require a representative sample of the population may not be appropriate for analysis with social media data (although there are some ways to account for bias; see Section 5.3). Identifying appropriate research questions up front is key to producing valid results.
Social media will likely not be a suitable data source for all environmental phenomena. Only highly salient topics, such as major events (e.g., hurricanes) and controversial issues (e.g., pollution), are likely to have adequate coverage to support analysis. Less salient topics, such as routine activities (e.g., commuting), which have significant environmental consequences, may not receive sufficient attention to support analysis. Furthermore, since only a fraction of people uses any given social media site and many platforms only allow researchers access to a fraction of the data, the absence of a phenomenon in the data cannot be taken as evidence that a phenomenon has not occurred. For example, some species, such as coyotes, might be observable mainly at night and/or in rural landscapes [103], which are both contexts in which social media users may be under-represented. However, it is possible to use the presence of a phenomenon to negate a null hypothesis that it does not exist (e.g., [71,73]). Similarly, when looking at responses like emotions or opinions, one will never find the full distribution of what is occurring but can potentially capture the ends of the range (e.g., extreme positive and extreme negative responses). Given these potential observability gaps, major trends or salient topics provide a better opportunity to leverage social media data for SES research.
5.2. Engage with Theory to Test Hypotheses and Interpret Data
Some have suggested that the role of theory has been diminished with the rise of “big data” (e.g., [104]). However, it has also been argued that theory is necessary to interpret data, identify important aspects or dimensions of phenomenon to measure (e.g., [105,106]), turn data into information (i.e., link data to how we think people behave), and identify points in SES feedback loops where data can be collected. Theory is also useful for formulating hypotheses about social-environmental interactions (e.g., the state of the natural resource and the behavioral response or pattern of use) that can be tested with available social media data. In particular, social media data offer unique opportunities to test hypotheses generated from social and psychological theories, because observations are made in situ, at the level of individuals, and often repeatedly over time as events are unfolding. For example, Barberá et al. [107] tested hypotheses about ideological differences in the formation of “echo chambers” using Twitter exchanges across a range of political and non-political issues, and found key differences in communication structures between ideological groups consistent with psychological theory about ideological motivations. In contrast, conventional psychological theory testing is conducted with hypothetical situations presented in controlled lab experiments or with one-time surveys using surrogate test groups (e.g., university students). Similarly, theories of social processes that operate through networked interactions are difficult to test, because empirical social network data is difficult to collect and often only a snapshot of a network is available, at one point in time [108]. In addition to these, other social and/or psychological theories lend themselves well to testing with social media data. Theories of social amplification of risk [43,109], salience [110], and habituation [111] are relevant to studies on people’s responses to natural disasters. For example, habituation has been used to explain people’s responses to earthquakes on social media [31]. Risk aversion (e.g., prospect theory [112]) and opportunity costs (e.g., travel cost method) could help explain patterns in human movement and other actions captured on social media [113]. Theory on the evolution of social norms and institutional analysis (e.g., [114,115]) could provide valuable lenses for understanding past and potential future reactions to environmental regulations (e.g., climate regulation [116]).
5.3. Data Integration, Calibration, and Validation
The same standards of careful crosschecking, modeling, and testing for model sensitivity that have been developed for social science research should be applied to analyses using social media data. Strategies to account for sampling bias, comparison to authoritative data, and combining different lines of evidence to interpret data (i.e., triangulation) can help to make social media studies more robust.
Due to the inherent biases with social media, it is important to quantify the uncertainty in the data, to the extent possible, and distinguish between variation in the data that is attributable to inherent sample variability, and variation that is attributable to measurement error. When the desired study population is known, it is possible to account for sampling biases in the sampled population to some extent by comparing it to the known demographics of social media platform users. For example, Keeler et al. [24] used Flickr photographs of lakes to examine lake visitation in Iowa and Minnesota, and compared the demographics of survey respondents from a previous study on Iowa lake visitors to the worldwide population of Flickr users to identify potential biases in Flickr users visiting Iowa lakes. Although demographic information about the sample population is generally unknown, it is often possible to infer information such as where users live based on the centroid of the locations of their posts [36]. Some researchers also identify types of users or stakeholders, based on the content of their posts or their stated affiliation [34,64,85]. As different social media platforms have different user groups, combining data from different platforms into a single analysis can also reduce the overall bias in the sample [117].
Census data and other types of authoritative data can help to account for geographic bias in social media datasets as well. A simple approach would be to map the locations of social media posts and compare the densities of observations to authoritative data on where people are, such as population estimates from official censuses or data on tourism or transportation routes. Researchers can use this information to weight data from high-population areas more than others in analyses [36] or test the sensitivity of models to population estimates or the density of social media users across space [66]. When examining observations related to a particular topic, comparing the spatial distribution of those observations to social media observations overall could also account for geographic biases (i.e., observation error) in where people are using social media.
In addition to census data, other authoritative datasets can validate findings from social media analyses. This strategy can provide more robust conclusions and, when the findings align, increased confidence in the use of social media data as a proxy for authoritative data sources. For example, studies using the number of social media posts in different locations have found strong concordance with on-site data collection on the number of visitors to recreation areas [24,71]. Other studies have also found concordance between tweets referring to smoke from wildfires and Environmental Protection Agency (EPA) air quality monitoring data [57] and between Flickr photos relating to Hurricane Sandy and atmospheric pressure measurements from National Oceanic and Atmospheric Administrations (NOAA’s) Automated Surface Observing System [52]. These findings provide evidence that social media data can act as useful sensors in areas without authoritative data collection, and thus can be used to scale research up to larger study areas. A promising future direction for social media research with respect to SES research would be working backwards from conventional data sources to derive an expected distribution of observations and comparing these to observations from social media data to identify gaps in data collection.
Even in cases where authoritative data are not available, combining different data sources or lines of evidence can be very useful for calibrating and validating interpretations of social media data. There is great potential for applying qualitative social science methods such as triangulation and crystallization to social media analyses to interpret data. For example, analyzing both the composition of photographs and the associated text can provide a more conclusive idea of the identity of the intended subject [118]; similarly, automated analyses of the sentiment associated with text can benefit from a qualitative analysis of the text’s meaning and relevant themes [119].
6. Summary
While analysis of social media data will never replace traditional research methods, there are several advantages to the use of social media data for SES research that make it a useful compliment. The unsolicited nature of social media is akin to revealed rather than stated preferences in economics, and may make it more appropriate than traditional surveys for uncovering new social phenomena, capturing rapidly changing situations, and understanding people’s true views on certain topics [24,25]. In addition, many studies (like the ones shown in Table 1) have shown the utility of social media for accurate social and environmental monitoring in areas where authoritative data are lacking. Insights from social media will likely only increase in the future, as will strategies to account for the particularities of the data to draw robust conclusions. We see particular promise in the use of social media to scale up from existing in-depth, small-scale studies (using authoritative data at the smaller scale to ground-truth findings) and quantify individual behaviors for parameterizing and validating complex systems models [120,121]. In many cases, social media analysis will be used as an exploratory tool, documenting a new phenomenon, particularly in locations and populations where data from traditional sources are lacking. Recognizing the exploratory nature of such studies and following up with more targeted studies, including those using more traditional methods, is necessary to test whether the phenomenon is real.
In the current age of constant data creation, the potential to harness existing “big data” to address SES research questions is considerable. In only the last decade, social media data has provided insight into SES relationships at broad spatial scales, including people’s perceptions of risk from natural hazards, how people value recreation areas and ecosystem services, and even how people select environmentally relevant behaviors. Thus, studies using social media data contribute to knowledge about land-use and environmental changes, natural resource use, and ecosystem service provisioning, with the potential for advancing SES theory and informing land management and planning. Although there are some important caveats to the use of social media data for research, thoughtful selection of appropriate research questions, interpretations guided by theory, and creative methods for addressing bias and uncertainty offer promising solutions to many of these issues and provides us with new opportunities to study SES systems.
Author Contributions
Conceptualization, A.T.C. and N.R.M.; writing—original draft preparation, B.E.L., A.T.C., and N.R.M.; writing—review and editing, B.E.L., A.T.C., and N.R.M.; visualization, B.E.L. and A.T.C. All authors approved its content.
Funding
This research originated from a workshop funded by the National Socio-Environmental Synthesis Center (SESYNC), through an award from the National Science Foundation (Grant # DBI-1052875) to the University of Maryland. This grant also funded BL’s postdoctoral fellowship.
Acknowledgments
This research originated from a workshop funded by SESYNC, and the authors would like to acknowledge the workshop participants.
Conflicts of Interest
The authors declare no conflict of interest.
References
- Ellis, E.C.; Ramankutty, N. Putting People in the Map: Anthropogenic Biomes of the World. Front. Ecol. Environ. 2008, 6, 439–447. [Google Scholar] [CrossRef]
- Rindfuss, R.R.; Entwisle, B.; Walsh, S.J.; An, L.; Badenoch, N.; Brown, D.G.; Deadman, P.; Evans, T.; Fox, J.; Geoghegan, J.; et al. Land Use Change: Complexity and Comparisons. J. Land Use Sci. 2008, 3, 1–10. [Google Scholar] [CrossRef] [PubMed]
- Rounsevell, M.; Arneth, A.; Alexander, P.; Brown, D.G.; de Noblet-Ducoudré, N.; Ellis, E.; Finnigan, J.; Galvin, K.; Grigg, N.; Harman, I.; et al. Towards Decision-based Global Land Use Models for Improved Understanding of the Earth System. Earth Syst. Dyn. 2014, 5, 117–137. [Google Scholar] [CrossRef]
- Liu, J.; Dietz, T.; Carpenter, S.R.; Alberti, M.; Folke, C.; Moran, E.; Pell, A.N.; Deadman, P.; Kratz, T.; Lubchenco, J.; et al. Complexity of Coupled Human and Natural Systems. Science 2007, 317, 1513–1516. [Google Scholar] [CrossRef] [PubMed] [Green Version]
- Ostrom, E.; Cox, M. Moving Beyond Panaceas: A Multi-Tiered Diagnostic Approach for Social-Ecological Analysis. Environ. Conserv. 2010, 37, 451–463. [Google Scholar] [CrossRef]
- Carpenter, S.R.; Mooney, H.A.; Agard, J.; Capistrano, D.; DeFries, R.S.; Díaz, S.; Duraiappah, A.K.; Oteng-Yeboah, A.; Pereira, H.M.; Perrings, C.; et al. Science for Managing Ecosystem Services: Beyond the Millennium Ecosystem Assessment. Proc. Natl. Acad. Sci. USA 2009, 106, 1305–1312. [Google Scholar] [CrossRef] [PubMed]
- Adger, W.N.; Hughes, T.P.; Folke, C.; Carpenter, S.R.; Rockström, J. Social-ecological Resilience to Coastal Disasters. Science 2005, 309, 1036–1039. [Google Scholar] [CrossRef]
- Rindfuss, R.R.; Walsh, S.J.; Turner, B.L.; Fox, J.; Mishra, V. Developing a Science of Land Change: Challenges and Methodological Issues. Proc. Natl. Acad. Sci. USA 2004, 101, 13976–13981. [Google Scholar] [CrossRef]
- McNamara, D.E.; Werner, B.T. Coupled Barrier Island–resort Model: 1. Emergent Instabilities Induced By Strong Human-Landscape Interactions. J. Geophys. Res. Earth Surf. 2008, 113, F01016. [Google Scholar] [CrossRef]
- National Audubon Society. Christmas Bird Count; National Audubon Society: New York, NY, USA; Available online: https://www.audubon.org/conservation/science/christmas-bird-count (accessed on 24 December 2018).
- Goodchild, M.F. Citizens as Sensors: The World of Volunteered Geography. GeoJournal 2007, 69, 211–221. [Google Scholar] [CrossRef]
- Dickinson, J.L.; Shirk, J.; Bonter, D.; Bonney, R.; Crain, R.L.; Martin, J.; Phillips, T.; Purcell, K. The Current State of Citizen Science as a Tool for Ecological Research and Public Engagement. Front. Ecol. Environ. 2012, 10, 291–297. [Google Scholar] [CrossRef]
- Fritz, S.; See, L.; Perger, C.; McCallum, I.; Schill, C.; Schepaschenko, D.; Duerauer, M.; Karner, M.; Dresel, C.; Laso-Bayas, J.C.; et al. A Global Dataset of Crowdsourced Land Cover and Land Use Reference Data. Sci. Data 2017, 4, 170075. [Google Scholar] [CrossRef] [PubMed]
- Fritz, S.; See, L.; McCallum, I.; You, L.; Bun, A.; Moltchanova, E.; Duerauer, M.; Albrecht, F.; Schill, C.; Perger, C.; et al. Mapping Global Cropland and Field Size. Glob. Chang. Biol. 2015, 21, 1980–1992. [Google Scholar] [CrossRef] [PubMed]
- D’Andrimont, R.; Yordanov, M.; Lemoine, G.; Yoong, J.; Nikel, K.; van der Velde, M. Crowdsourced Street-Level Imagery as a Potential Source of In-Situ Data for Crop Monitoring. Land 2018, 7, 127. [Google Scholar] [CrossRef]
- Cooper, C.B.; Dickinson, J.; Phillips, T.; Bonney, R. Citizen Science as a Tool for Conservation in Residential Ecosystems. Ecol. Soc. 2007, 12, 1–11. [Google Scholar] [CrossRef]
- Shaban, H. Twitter Reveals its Daily Active User Numbers for the First Time. Available online: https://www.washingtonpost.com/technology/2019/02/07/twitter-reveals-its-daily-active-user-numbers-first-time/?noredirect=on&utm_term=.625a75b1b8fb (accessed on 21 May 2019).
- Clarke, T. 22+ Instagram Stats That Marketers Can’t Ignore This Year. Available online: https://blog.hootsuite.com/instagram-statistics/ (accessed on 21 May 2019).
- Jeffries, A. The Man Behind Flickr on Making the Service ‘Awesome Again’. Available online: https://www.theverge.com/2013/3/20/4121574/flickr-chief-markus-spiering-talks-photos-and-marissa-mayer (accessed on 21 May 2019).
- Croitoru, A.; Wayant, N.; Crooks, A.T.; Radzikowski, J.; Stefanidis, A. Linking Cyber and Physical Spaces Through Community Detection And Clustering in Social Media Feeds. Comput. Environ. Urban Syst. 2015, 53, 47–64. [Google Scholar] [CrossRef]
- Friedland, G.; Sommer, R. Cybercasing the Joint: On the Privacy Implications of Geotagging. In Proceedings of the Fifth USENIX Workshop on Hot Topics in Security (HotSec 10), Washington, DC, USA, 10 August 2010. [Google Scholar]
- Stefanidis, T.; Crooks, A.T.; Radzikowski, J. Harvesting Ambient Geospatial Information from Social Media Feeds. GeoJournal 2013, 78, 319–338. [Google Scholar] [CrossRef]
- Crain, R.; Cooper, C.; Dickinson, J.L. Citizen Science: A Tool for Integrating Studies of Human and Natural Systems. Annu. Rev. Environ. Resour. 2014, 39, 641–665. [Google Scholar] [CrossRef]
- Keeler, B.L.; Wood, S.A.; Polasky, S.; Kling, C.; Filstrup, C.T.; Downing, J.A. Recreational Demand for Clean Water: Evidence From Geotagged Photographs by Visitors to Lakes. Front. Ecol. Environ. 2015, 13, 76–81. [Google Scholar] [CrossRef]
- Murphy, J.J.; Allen, P.G.; Stevens, T.H.; Weatherhead, D. A Meta-analysis of Hypothetical Bias in Stated Preference Valuation. Environ. Resour. Econ. 2005, 30, 313–325. [Google Scholar] [CrossRef] [Green Version]
- Toivonen, T.; Heikinheimo, V.; Fink, C.; Hausmann, A.; Hiippala, T.; Järv, O.; Tenkanen, H.; Di Minin, E. Social Media Data for Conservation Science: A Methodological Overview. Biol. Conserv. 2019, 233, 298–315. [Google Scholar] [CrossRef]
- Di Minin, E.; Tenkanen, H.; Toivonen, T. Prospects and Challenges for Social Media Data in Conservation Science. Front. Environ. Sci. 2015, 3, 63. [Google Scholar] [CrossRef]
- Ilieva, R.T.; McPhearson, T. Social-media Data for Urban Sustainability. Nat. Sustain. 2018, 1, 553–565. [Google Scholar] [CrossRef]
- Kirilenko, A.P.; Molodtsova, T.; Stepchenkova, S.O. People as Sensors: Mass Media and Local Temperature Influence Climate Change Discussion on Twitter. Glob. Environ. Chang. 2015, 30, 92–100. [Google Scholar] [CrossRef]
- Croitoru, A.; Crooks, A.T.; Radzikowski, J.; Stefanidis, A.; Vatsavai, R.R.; Wayant, N. Geoinformatics and Social Media: A New Big Data Challenge. In Big Data Techniques and Technologies in Geoinformatics; Karimi, H.A., Ed.; CRC Press: Boca Raton, FL, USA, 2014; pp. 207–232. [Google Scholar]
- Crooks, A.T.; Croitoru, A.; Stefanidis, A.; Radzikowski, J. #Earthquake: Twitter as a Distributed Sensor System. Trans. GIS 2013, 17, 124–147. [Google Scholar]
- Panteras, G.; Lu, X.; Croitoru, A.; Crooks, A.T.; Stefanidis, A. Accuracy Of User-Contributed Image Tagging In Flickr: A Natural Disaster Case Study. In Proceedings of the 7th International Conference on Social Media and Society, London, UK, 11–13 July 2016. [Google Scholar]
- Stefanidis, A.; Vraga, E.; Lamprianidis, G.; Radzikowski, J.; Delamater, P.L.; Jacobsen, K.H.; Pfoser, D.; Croitoru, A.; Crooks, A.T. Zika in Twitter: Temporal Variations of Locations, Actors, and Concepts. JMIR Public Health Surveill. 2017, 3, e22. [Google Scholar] [CrossRef] [PubMed]
- Schweitzer, L. Planning and Social Media: A Case Study of Public Transit and Stigma on Twitter. J. Am. Plan. Assoc. 2014, 80, 218–238. [Google Scholar] [CrossRef]
- Roberts, H.; Sadler, J.; Chapman, L. The Value of Twitter Data for Determining the Emotional Responses of People to Urban Green Spaces: A Case Study and Critical Evaluation. Urban Stud. 2018, 56, 818–835. [Google Scholar] [CrossRef]
- Wang, Q.; Phillips, N.E.; Small, M.L.; Sampson, R.J. Urban Mobility and Neighborhood Isolation in America’s 50 Largest Cities. Proc. Natl. Acad. Sci. USA 2018, 115, 7735–7740. [Google Scholar] [CrossRef]
- Jenkins, A.; Croitoru, A.; Crooks, A.T.; Stefanidis, A. Crowdsourcing A Collective Sense of Place. PLoS ONE 2016, 11, e0152932. [Google Scholar] [CrossRef]
- Panteras, G.; Wise, S.; Lu, X.; Croitoru, A.; Crooks, A.T.; Stefanidis, A. Triangulating Social Multimedia Content for Event Localization using Flickr and Twitter. Trans. GIS 2015, 19, 694–715. [Google Scholar] [CrossRef]
- Daume, S. Mining Twitter to Monitor Invasive Alien Species—An Analytical Framework and Sample Information Topologies. Ecol. Inform. 2016, 31, 70–82. [Google Scholar] [CrossRef]
- Cha, Y.; Stow, C.A. Mining Web-based Data to Assess Public Response to Environmental Events. Environ. Pollut. 2015, 198, 97–99. [Google Scholar] [CrossRef] [PubMed]
- Oteros-Rozas, E.; Martín-López, B.; Fagerholm, N.; Bieling, C.; Plieninger, T. Using Social Media Photos to Explore the Relation Between Cultural Ecosystem Services and Landscape Features Across Five European Sites. Ecol. Indic. 2018, 94, 74–86. [Google Scholar] [CrossRef]
- Hausmann, A.; Toivonen, T.; Heikinheimo, V.; Tenkanen, H.; Slotow, R.; Di Minin, E. Social Media Reveal that Charismatic Species are Not the Main Attractor of Ecotourists to sub-Saharan Protected Areas. Sci. Rep. 2017, 7, 763. [Google Scholar] [CrossRef] [PubMed]
- Shook, E.; Turner, V.K. The Socio-environmental Data Explorer (SEDE): A Social Media–enhanced Decision Support System to Explore Risk Perception to Hazard Events. Cartogr. Geogr. Inf. Sci. 2016, 43, 427–441. [Google Scholar] [CrossRef]
- Wang, Z.; Ye, X.; Tsou, M.H. Spatial, Temporal, and Content Analysis of Twitter for Wildfire Hazards. Nat. Hazards 2016, 83, 523–540. [Google Scholar] [CrossRef]
- Eid, E.; Handal, R. Illegal Hunting in Jordan: Using Social Media to Assess Impacts on Wildlife. Oryx 2018, 52, 730–735. [Google Scholar] [CrossRef]
- Jurdak, R.; Zhao, K.; Liu, J.; AbouJaoude, M.; Cameron, M.; Newth, D. Understanding Human Mobility from Twitter. PLoS ONE 2015, 10, e0131469. [Google Scholar] [CrossRef]
- Girardin, F.; Vaccari, A.; Gerber, A.; Biderman, A.; Ratti, C. Quantifying Urban Attractiveness from the Distribution and Density of Digital Footprints. Int. J. Spat. Data Infrastruct. Res. 2009, 4, 175–200. [Google Scholar]
- Krumm, J.; Kun, A.L.; Varsanyi, P. TweetCount: Urban Insights by Counting Tweets. In Proceedings of the 2017 ACM International Joint Conference on Pervasive and Ubiquitous Computing and Proceedings of the 2017 ACM International Symposium on Wearable Computers, Maui, HI, USA, 11–15 September 2017; pp. 403–411. [Google Scholar]
- Crooks, A.T.; Pfoser, D.; Jenkins, A.; Croitoru, A.; Stefanidis, A.; Smith, D.A.; Karagiorgou, S.; Efentakis, A.; Lamprianidis, G. Crowdsourcing Urban Form and Function. Int. J. Geogr. Inf. Sci. 2015, 29, 720–741. [Google Scholar] [CrossRef]
- Crooks, A.T.; Croitoru, A.; Jenkins, A.; Mahabir, R.; Agouris, P.; Stefanidis, A. User-Generated Big Data and Urban Morphology. Built Environ. 2016, 42, 396–414. [Google Scholar] [CrossRef]
- Connors, J.P.; Lei, S.; Kelly, M. Citizen Science in the Age of Neogeography: Utilizing Volunteered Geographic Information for Environmental Monitoring. Ann. Assoc. Am. Geogr. 2011, 102, 1267–1289. [Google Scholar] [CrossRef]
- Preis, T.; Moat, H.S.; Bishop, S.R.; Treleaven, P.; Stanley, H.E. Quantifying the Digital Traces of Hurricane Sandy on Flickr. Sci. Rep. 2013, 3, 3141. [Google Scholar] [CrossRef] [PubMed] [Green Version]
- Li, Z.; Wang, C.; Emrich, C.T.; Guo, D. A Novel Approach to Leveraging Social Media for Rapid Flood Mapping: A Case Study of the 2015 South Carolina Floods. Cartogr. Geogr. Inf. Sci. 2018, 45, 97–110. [Google Scholar] [CrossRef]
- Fohringer, J.; Dransch, D.; Kreibich, H.; Schröter, K. Social Media as an Information Source for Rapid Flood Inundation Mapping. Nat. Hazards Earth Syst. Sci. 2015, 15, 2725–2738. [Google Scholar] [CrossRef]
- Earle, P.; Bowden, D.C.; Guy, M. Twitter Earthquake Detection: Earthquake Monitoring in a Social World. Ann. Geophys. 2011, 54. [Google Scholar] [CrossRef]
- Schmidt, C.W. Trending Now: Using Social Media to Predict and Track Disease Outbreaks. Environ. Health Perspect. 2012, 120, a30–a33. [Google Scholar] [CrossRef]
- Sachdeva, S.; McCaffrey, S.; Locke, D. Social Media Approaches to Modeling Wildfire Smoke Dispersion: Spatiotemporal and Social Scientific Investigations. Inf. Commun. Soc. 2017, 20, 1146–1161. [Google Scholar] [CrossRef]
- Proulx, R.; Massicotte, P.; Pepino, M. Googling Trends in Conservation Biology. Conserv. Biol. 2014, 28, 44–51. [Google Scholar] [CrossRef]
- Silva, S.J.; Barbieri, L.K.; Thomer, A.K. Observing Vegetation Phenology through Social Media. PLoS ONE 2018, 13, e0197325. [Google Scholar] [CrossRef] [PubMed]
- Daume, S.; Galaz, V. “Anyone Know What Species This Is?”–Twitter Conversations as Embryonic Citizen Science Communities. PLoS ONE 2016, 11, e0151387. [Google Scholar] [CrossRef] [PubMed]
- ElQadi, M.M.; Dorin, A.; Dyer, A.; Burd, M.; Bukovac, Z.; Shrestha, M. Mapping Species Distributions with Social Media Geo-tagged Images: Case Studies of Bees and Flowering Plants in Australia. Ecol. Inform. 2017, 39, 23–31. [Google Scholar] [CrossRef]
- Stafford, R.; Hart, A.G.; Collins, L.; Kirkhope, C.L.; Williams, R.L.; Rees, S.G.; Lloyd, J.R.; Goodenough, A.E. Eu-Social Science: The Role of Internet Social Networks in the Collection of Bee Biodiversity Data. PLoS ONE 2010, 5, e14381. [Google Scholar] [CrossRef] [PubMed]
- Odom, K.J.; Benedict, L. A Call to Document Female Bird Songs: Applications for Diverse Fields. Auk 2018, 135, 314–325. [Google Scholar] [CrossRef]
- Takahashi, B.; Tandoc, E.C., Jr.; Carmichael, C. Communicating on Twitter During a Disaster: An Analysis of Tweets During Typhoon Haiyan in the Philippines. Comput. Hum. Behav. 2015, 50, 392–398. [Google Scholar] [CrossRef]
- Guan, X.; Chen, C. Using Social Media Data to Understand and Assess Disaster. Nat. Hazards 2014, 74, 837–850. [Google Scholar] [CrossRef]
- Kryvasheyeu, Y.; Chen, H.; Obradovich, N.; Moro, E.; Van Hentenryck, P.; Fowler, J.; Cebrian, M. Rapid Assessment of Disaster Damage using Social Media Activity. Sci. Adv. 2016, 2, e1500779. [Google Scholar] [CrossRef]
- Sutton, J.; Spiro, E.; Butts, C.; Fitzhugh, S.; Johnson, B.; Greczek, M. Tweeting the Spill: Online Informal Communications, Social Networks, and Conversational Microstructures during the Deepwater Horizon Oilspill. Int. J. Inf. Syst. Crisis Response Manag. 2013, 5, 58–76. [Google Scholar] [CrossRef]
- Blanford, J.I.; Huang, Z.; Savelyev, A.; MacEachren, A.M. Geo-located Tweets. Enhancing Mobility Maps and Capturing Cross-border Movement. PLoS ONE 2015, 10, e0129202. [Google Scholar] [CrossRef]
- Hawelka, B.; Sitko, I.; Beinat, E.; Sobolevsky, S.; Kazakopoulos, P.; Ratti, C. Geo-located Twitter as Proxy for Global Mobility Patterns. Cartogr. Geogr. Inf. Sci. 2014, 41, 260–271. [Google Scholar] [CrossRef] [PubMed]
- Chapman, L.; Resch, B.; Sadler, J.; Zimmer, S.; Roberts, H.; Petutschnig, A. Investigating the Emotional Responses of Individuals to Urban Green Space Using Twitter Data: A Critical Comparison of Three Different Methods of Sentiment Analysis. Urban Plan. 2018, 3, 21–33. [Google Scholar]
- Wood, S.A.; Guerry, A.D.; Silver, J.M.; Lacayo, M. Using Social Media to Quantify Nature-based Tourism and Recreation. Sci. Rep. 2013, 3, 2976. [Google Scholar] [CrossRef] [PubMed]
- Fisher, D.M.; Wood, S.A.; Roh, Y.H.; Kim, C.K. The Geographic Spread and Preferences of Tourists Revealed by User-Generated Information on Jeju Island, South Korea. Land 2019, 8, 73. [Google Scholar] [CrossRef]
- Hamstead, Z.A.; Fisher, D.; Ilieva, R.T.; Wood, S.A.; McPhearson, T.; Kremer, P. Geolocated Social Media as a Rapid Indicator of Park Visitation and Equitable Park Access. Comput. Environ. Urban Syst. 2018, 72, 38–50. [Google Scholar] [CrossRef]
- Casalegno, S.; Inger, R.; DeSilvey, C.; Gaston, K.J. Spatial Covariance between Aesthetic Value & Other Ecosystem Services. PLoS ONE 2013, 8, e68437. [Google Scholar]
- Van Zanten, B.T.; Van Berkel, D.B.; Meentemeyer, R.K.; Smith, J.W.; Tieskens, K.F.; Verburg, P.H. Continental-scale Quantification of Landscape Values using Social Media Data. Proc. Natl. Acad. Sci. USA 2016, 113, 12974–12979. [Google Scholar] [CrossRef]
- Richards, D.R.; Friess, D.A. A Rapid Indicator of Cultural Ecosystem Service Usage at a Fine Spatial Scale: Content Analysis of Social Media Photographs. Ecol. Indic. 2015, 53, 187–195. [Google Scholar] [CrossRef]
- Pastur, G.M.; Peri, P.L.; Lencinas, M.V.; García-Llorente, M.; Martín-López, B. Spatial Patterns of Cultural Ecosystem Services Provision in Southern Patagonia. Landsc. Ecol. 2016, 31, 383–399. [Google Scholar] [CrossRef]
- Dunkel, A. Visualizing the Perceived Environment using Crowdsourced Photo Geodata. Landsc. Urban Plan. 2015, 142, 173–186. [Google Scholar] [CrossRef]
- Barry, S.J. Using Social Media to Discover Public Values, Interests, and Perceptions about Cattle Grazing on Park Lands. Environ. Manag. 2014, 53, 454–464. [Google Scholar] [CrossRef] [PubMed]
- Sonter, L.J.; Watson, K.B.; Wood, S.A.; Ricketts, T.H. Spatial and Temporal Dynamics and Value of Nature-based Recreation, Estimated via Social Media. PLoS ONE 2016, 11, e0162372. [Google Scholar] [CrossRef] [PubMed]
- Malcevschi, S.; Marchini, A.; Savini, D.; Facchinetti, T. Opportunities for Web-based Indicators in Environmental Sciences. PLoS ONE 2012, 7, e42128. [Google Scholar] [CrossRef] [PubMed]
- Funk, S.M.; Rusowsky, D. The Importance of Cultural Knowledge and Scale for Analysing Internet Search Data as a Proxy for Public Interest Toward the Environment. Biodivers. Conserv. 2014, 23, 3101–3112. [Google Scholar] [CrossRef]
- Auer, M.R.; Zhang, Y.; Lee, P. The Potential of Microblogs for the Study of Public Perceptions of Climate Change. Wiley Interdiscip. Rev. Clim. Chang. 2014, 5, 291–296. [Google Scholar] [CrossRef]
- Cody, E.M.; Reagan, A.J.; Mitchell, L.; Dodds, P.S.; Danforth, C.M. Climate Change Sentiment on Twitter: An Unsolicited Public Opinion Poll. PLoS ONE 2015, 10, e0136092. [Google Scholar] [CrossRef] [PubMed]
- Daume, S.; Albert, M.; von Gadow, K. Forest Monitoring and Social Media–Complementary Data Sources for Ecosystem Surveillance? For. Ecol. Manag. 2014, 316, 9–20. [Google Scholar] [CrossRef]
- Williams, R.L.; Stafford, R.; Goodenough, A.E. Biodiversity in Urban Gardens: Assessing the Accuracy of Citizen Science Data on Garden Hedgehogs. Urban Ecosyst. 2015, 18, 819–833. [Google Scholar] [CrossRef]
- Roberge, J.M. Using Data from Online Social Networks in Conservation Science: Which Species Engage People the Most on Twitter? Biodivers. Conserv. 2014, 23, 715–726. [Google Scholar] [CrossRef]
- Drum, R.G.; Ribic, C.A.; Koch, K.; Lonsdorf, E.; Grant, E.; Ahlering, M.; Barnhill, L.; Dailey, T.; Lor, S.; Mueller, C.; et al. Strategic Grassland Bird Conservation throughout the Annual Cycle: Linking Policy Alternatives, Landowner Decisions, and Biological Population Outcomes. PLoS ONE 2015, 10, e0142525. [Google Scholar] [CrossRef]
- Ghermandi, A. Analysis of Intensity and Spatial Patterns of Public Use in Natural Treatment Systems using Geotagged Photos from Social Media. Water Res. 2016, 105, 297–304. [Google Scholar] [CrossRef] [PubMed]
- Hausmann, A.; Toivonen, T.; Slotow, R.; Tenkanen, H.; Moilanen, A.; Heikinheimo, V.; Di Minin, E. Social Media Data Can Be Used to Understand Tourists’ Preferences for Nature-Based Experiences in Protected Areas. Conserv. Lett. 2018, 11, e12343. [Google Scholar] [CrossRef]
- Levin, N.; Lechner, A.M.; Brown, G. An Evaluation of Crowdsourced Information for Assessing the Visitation and Perceived Importance of Protected Areas. Appl. Geogr. 2017, 79, 115–126. [Google Scholar] [CrossRef]
- Levin, N.; Kark, S.; Crandall, D. Where Have All the People Gone? Enhancing Global Conservation using Night Lights and Social Media. Ecol. Appl. 2015, 25, 2153–2167. [Google Scholar] [CrossRef] [PubMed]
- Li, J.; Qin, Q.; Han, J.; Tang, L.A.; Lei, K.H. Mining Trajectory Data and Geotagged Data in Social Media for Road Map Inference. Trans. GIS 2015, 19, 1–18. [Google Scholar] [CrossRef]
- Meekan, M.G.; Duarte, C.M.; Fernández-Gracia, J.; Thums, M.; Sequeira, A.M.; Harcourt, R.; Eguíluz, V.M. The Ecology of Human Mobility. Trends Ecol. Evol. 2017, 32, 198–210. [Google Scholar] [CrossRef] [PubMed]
- Seppelt, R.; Lautenbach, S.; Volk, M. Identifying trade-offs Between Ecosystem Services, Land Use, and Biodiversity: A Plea for Combining Scenario Analysis and Optimization on Different Spatial Scales. Curr. Opin. Environ. Sustain. 2013, 5, 458–463. [Google Scholar] [CrossRef]
- Ruths, D.; Pfeffer, J. Social Media for Large Studies of Behavior. Science 2014, 346, 1063–1064. [Google Scholar] [CrossRef]
- Pew Research Center. Social Media Update; Pew Research Center: Washington, DC, USA, 2014; Available online: http://www.pewinternet.org/2015/01/09/social-media-update-2014/ (accessed on 15 October 2018).
- Zimmer, M. “But the Data is Already Public”: On the Ethics of Research in Facebook. Ethics Inf. Technol. 2010, 12, 313–325. [Google Scholar] [CrossRef]
- Hargittai, E. Is Bigger Always Better? Potential Biases of Big Data Derived from Social Network Sites. Ann. Am. Acad. Political Soc. Sci. 2015, 659, 63–76. [Google Scholar] [CrossRef]
- Schwartz, H.A.; Eichstaedt, J.C.; Kern, M.L.; Dziurzynski, L.; Ramones, S.M.; Agrawal, M.; Shah, A.; Kosinski, M.; Stillwell, D.; Seligman, M.E.; et al. Personality, Gender, and Age in the Language of Social Media: The Open-Vocabulary Approach. PLoS ONE 2013, 8, e73791. [Google Scholar] [CrossRef] [PubMed]
- Brenner, J.; Smith, A. 72% of Online Adults are Social Networking Site Users; Pew Research Center Internet & American Life Project: Washington, DC, USA, 2013. [Google Scholar]
- Dance, G.J.X.; LaForgia, M.; Confessore, N. As Facebook Raised a Privacy Wall, It Carved an Opening for Tech Giants. The New York Times, 18 December 2018. [Google Scholar]
- Gehrt, S.D.; Brown, J.L.; Anchor, C. Is the urban coyote a misanthropic synanthrope? The case from Chicago. Cities Environ. 2011, 4, 3. [Google Scholar] [CrossRef]
- Anderson, C. The End of Theory: The Data Deluge Makes the Scientific Method Obsolete. Available online: http://archive.wired.com/science/discoveries/magazine/16-07/pb_theory (accessed on 2 July 2019).
- Miller, H.J.; Goodchild, M.F. Data-driven Geography. GeoJournal 2015, 80, 449–461. [Google Scholar] [CrossRef]
- Barnes, T.J. Big Data, Little History. Dialogues Hum. Geogr. 2013, 3, 297–302. [Google Scholar] [CrossRef]
- Barberá, P.; Jost, J.T.; Nagler, J.; Tucker, J.A.; Bonneau, R. Tweeting From Left to Right: Is Online Political Communication More than an Echo Chamber? Psychol. Sci. 2015, 26, 1531–1542. [Google Scholar] [CrossRef]
- Filatova, T.; Verburg, P.H.; Parker, D.C.; Stannard, C.A. Spatial Agent-based Models for Socio-ecological Systems: Challenges and Prospects. Environ. Model. Softw. 2013, 45, 1–7. [Google Scholar] [CrossRef]
- Kasperson, R.E.; Renn, O.; Slovic, P.; Brown, H.S.; Emel, J.; Goble, R.; Kasperson, J.X.; Ratick, S. The Social Amplification of Risk: A Conceptual Framework. Risk Anal. 1988, 8, 177–187. [Google Scholar] [CrossRef] [Green Version]
- Bordalo, P.; Gennaioli, N.; Shleifer, A. Salience Theory of Choice Under Risk. Q. J. Econ. 2012, 127, 1243–1285. [Google Scholar] [CrossRef] [Green Version]
- Yamaguchi, S.; Hale, L.A.; D’Esposito, M.; Knight, R.T. Rapid Prefrontal-Hippocampal Habituation to Novel Events. J. Neurosci. 2004, 24, 5356–5363. [Google Scholar] [CrossRef] [Green Version]
- Kahneman, D.; Tversky, A. Prospect Theory: An Analysis of Decision under Risk. Econometrica 1979, 47, 263–292. [Google Scholar] [CrossRef]
- Sessions, C.; Wood, S.A.; Rabotyagov, S.; Fisher, D.M. Measuring Recreational Visitation at US National Parks with Crowd-sourced Photographs. J. Environ. Manag. 2016, 183, 703–711. [Google Scholar] [CrossRef] [PubMed]
- Ostrom, E. Governing the Commons: The Evolution of Institutions for Collective Action; Cambridge University Press: Cambridge, UK, 1990. [Google Scholar]
- Ostrom, E. A General Framework for Analyzing Sustainability of Social-ecological Systems. Science 2009, 325, 419–422. [Google Scholar] [CrossRef] [PubMed]
- Schmidt, A.; Ivanova, A.; Schäfer, M.S. Media Attention for Climate Change around the World: A Comparative Analysis of Newspaper Coverage in 27 Countries. Glob. Environ. Chang. 2013, 23, 1233–1248. [Google Scholar] [CrossRef]
- Tenkanen, H.; Di Minin, E.; Heikinheimo, V.; Hausmann, A.; Herbst, M.; Kajala, L.; Toivonen, T. Instagram, Flickr, or Twitter: Assessing the Usability of Social Media Data for Visitor Monitoring in Protected Areas. Sci. Rep. 2017, 7, 17615. [Google Scholar] [CrossRef] [PubMed]
- Lee, H.; Seo, B.; Koellner, T.; Lautenbach, S. Mapping Cultural Ecosystem Services 2.0—Potential and Shortcomings from Unlabeled Crowd Sourced Images. Ecol. Indic. 2019, 96, 505–515. [Google Scholar] [CrossRef]
- Gaspar, R.; Pedro, C.; Panagiotopoulos, P.; Seibt, B. Beyond Positive or Negative: Qualitative Sentiment Analysis of Social Media Reactions to Unexpected Stressful Events. Comput. Hum. Behav. 2016, 56, 179–191. [Google Scholar] [CrossRef]
- Crooks, A.T.; Wise, S. GIS and Agent-Based models for Humanitarian Assistance. Comput. Environ. Urban Syst. 2013, 41, 100–111. [Google Scholar] [CrossRef]
- Batty, M.; Axhausen, K.W.; Giannotti, F.; Pozdnoukhov, A.; Bazzani, A.; Wachowicz, M.; Ouzounis, G.; Portugali, Y. Smart Cities of the Future. Eur. Phys. J. Spec. Top. 2012, 214, 481–518. [Google Scholar] [CrossRef]
Figure 1.
Socio-environmental systems (SES) diagram with examples of topics that have been researched using social media data, falling into four categories based on the aspect of SES they focus on (Social, Environmental, Social → Environmental, and Environmental → Social).
Figure 1.
Socio-environmental systems (SES) diagram with examples of topics that have been researched using social media data, falling into four categories based on the aspect of SES they focus on (Social, Environmental, Social → Environmental, and Environmental → Social).

Figure 2.
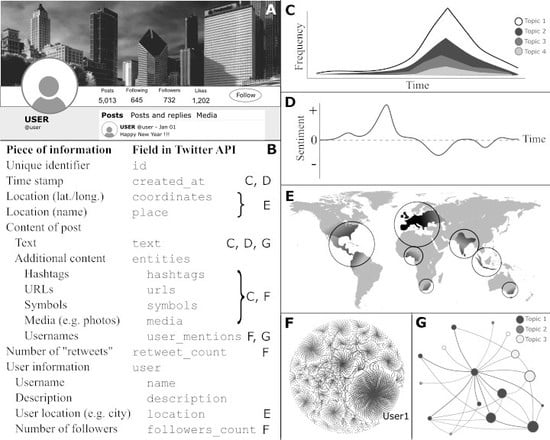
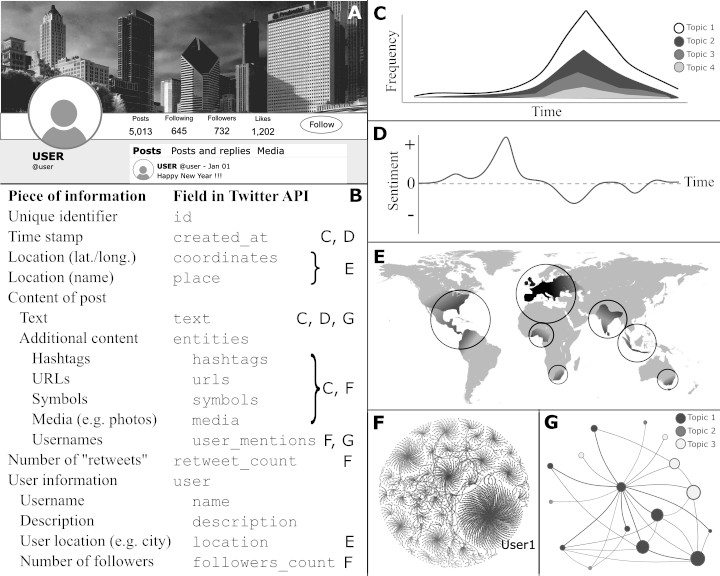
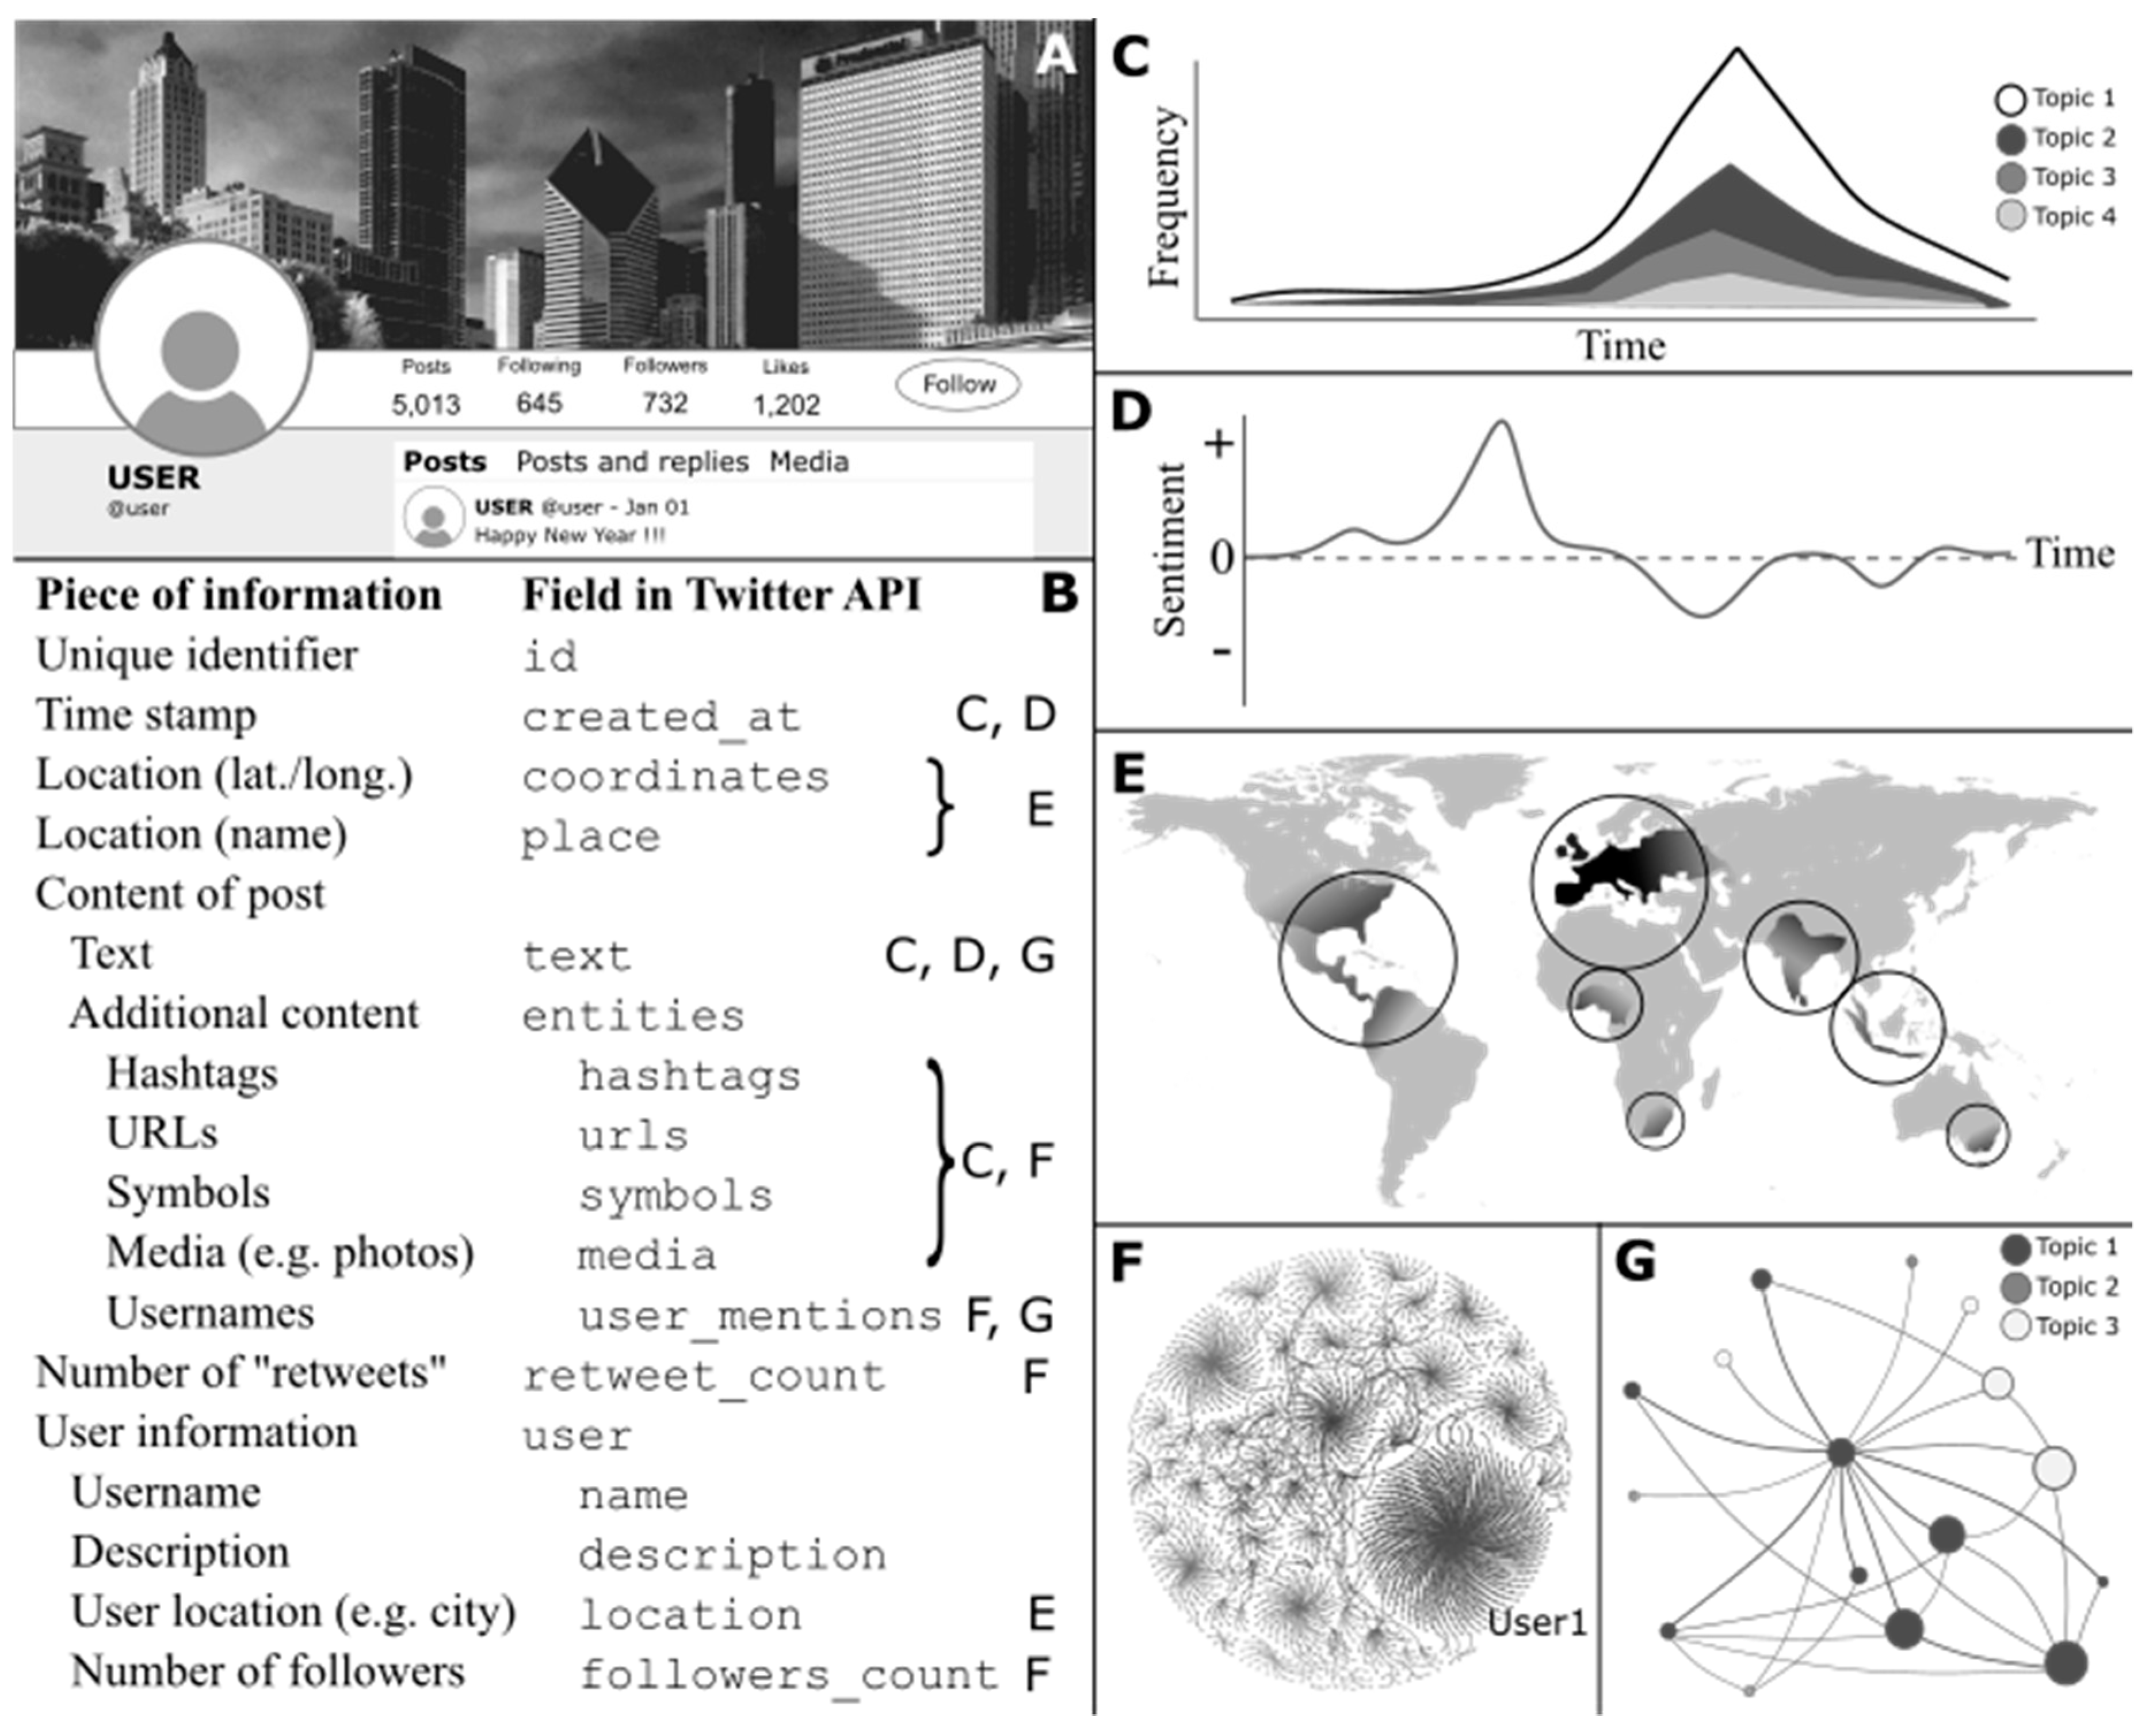
Example of information provided by social media posts and how it is used in analyses. A single post from a social media user (A) provides information on the content of the post (e.g., text, associated media, location) and the user (e.g., name, number of followers). These various pieces of information are stored in metadata that researchers can access using an application programming interface (API). (Codes for accessing these different pieces of information from the Twitter API are listed in panel B). Researchers collect this information from thousands to millions of posts and use different pieces of the information to examine different types of patterns (righthand column in panel B). Commonly studied patterns include: (C) trends in the popularity of topics across time; (D) changes in the sentiment (words’ positive or negative associations) of posts across time or space; (E) locations where topics are most popular; (F) social networks, including the relative influence of different users; and (G) relationships between topics discussed on social media, based on associations between topics within posts (Panels C, E, and G were adapted from [33]).
Figure 2.
Example of information provided by social media posts and how it is used in analyses. A single post from a social media user (A) provides information on the content of the post (e.g., text, associated media, location) and the user (e.g., name, number of followers). These various pieces of information are stored in metadata that researchers can access using an application programming interface (API). (Codes for accessing these different pieces of information from the Twitter API are listed in panel B). Researchers collect this information from thousands to millions of posts and use different pieces of the information to examine different types of patterns (righthand column in panel B). Commonly studied patterns include: (C) trends in the popularity of topics across time; (D) changes in the sentiment (words’ positive or negative associations) of posts across time or space; (E) locations where topics are most popular; (F) social networks, including the relative influence of different users; and (G) relationships between topics discussed on social media, based on associations between topics within posts (Panels C, E, and G were adapted from [33]).

Figure 3.
Example of information on people’s use of natural resources from social media data based on key word searches fish and oyster from Twitter, Instagram and Foursquare.
Figure 3.
Example of information on people’s use of natural resources from social media data based on key word searches fish and oyster from Twitter, Instagram and Foursquare.

Figure 4.
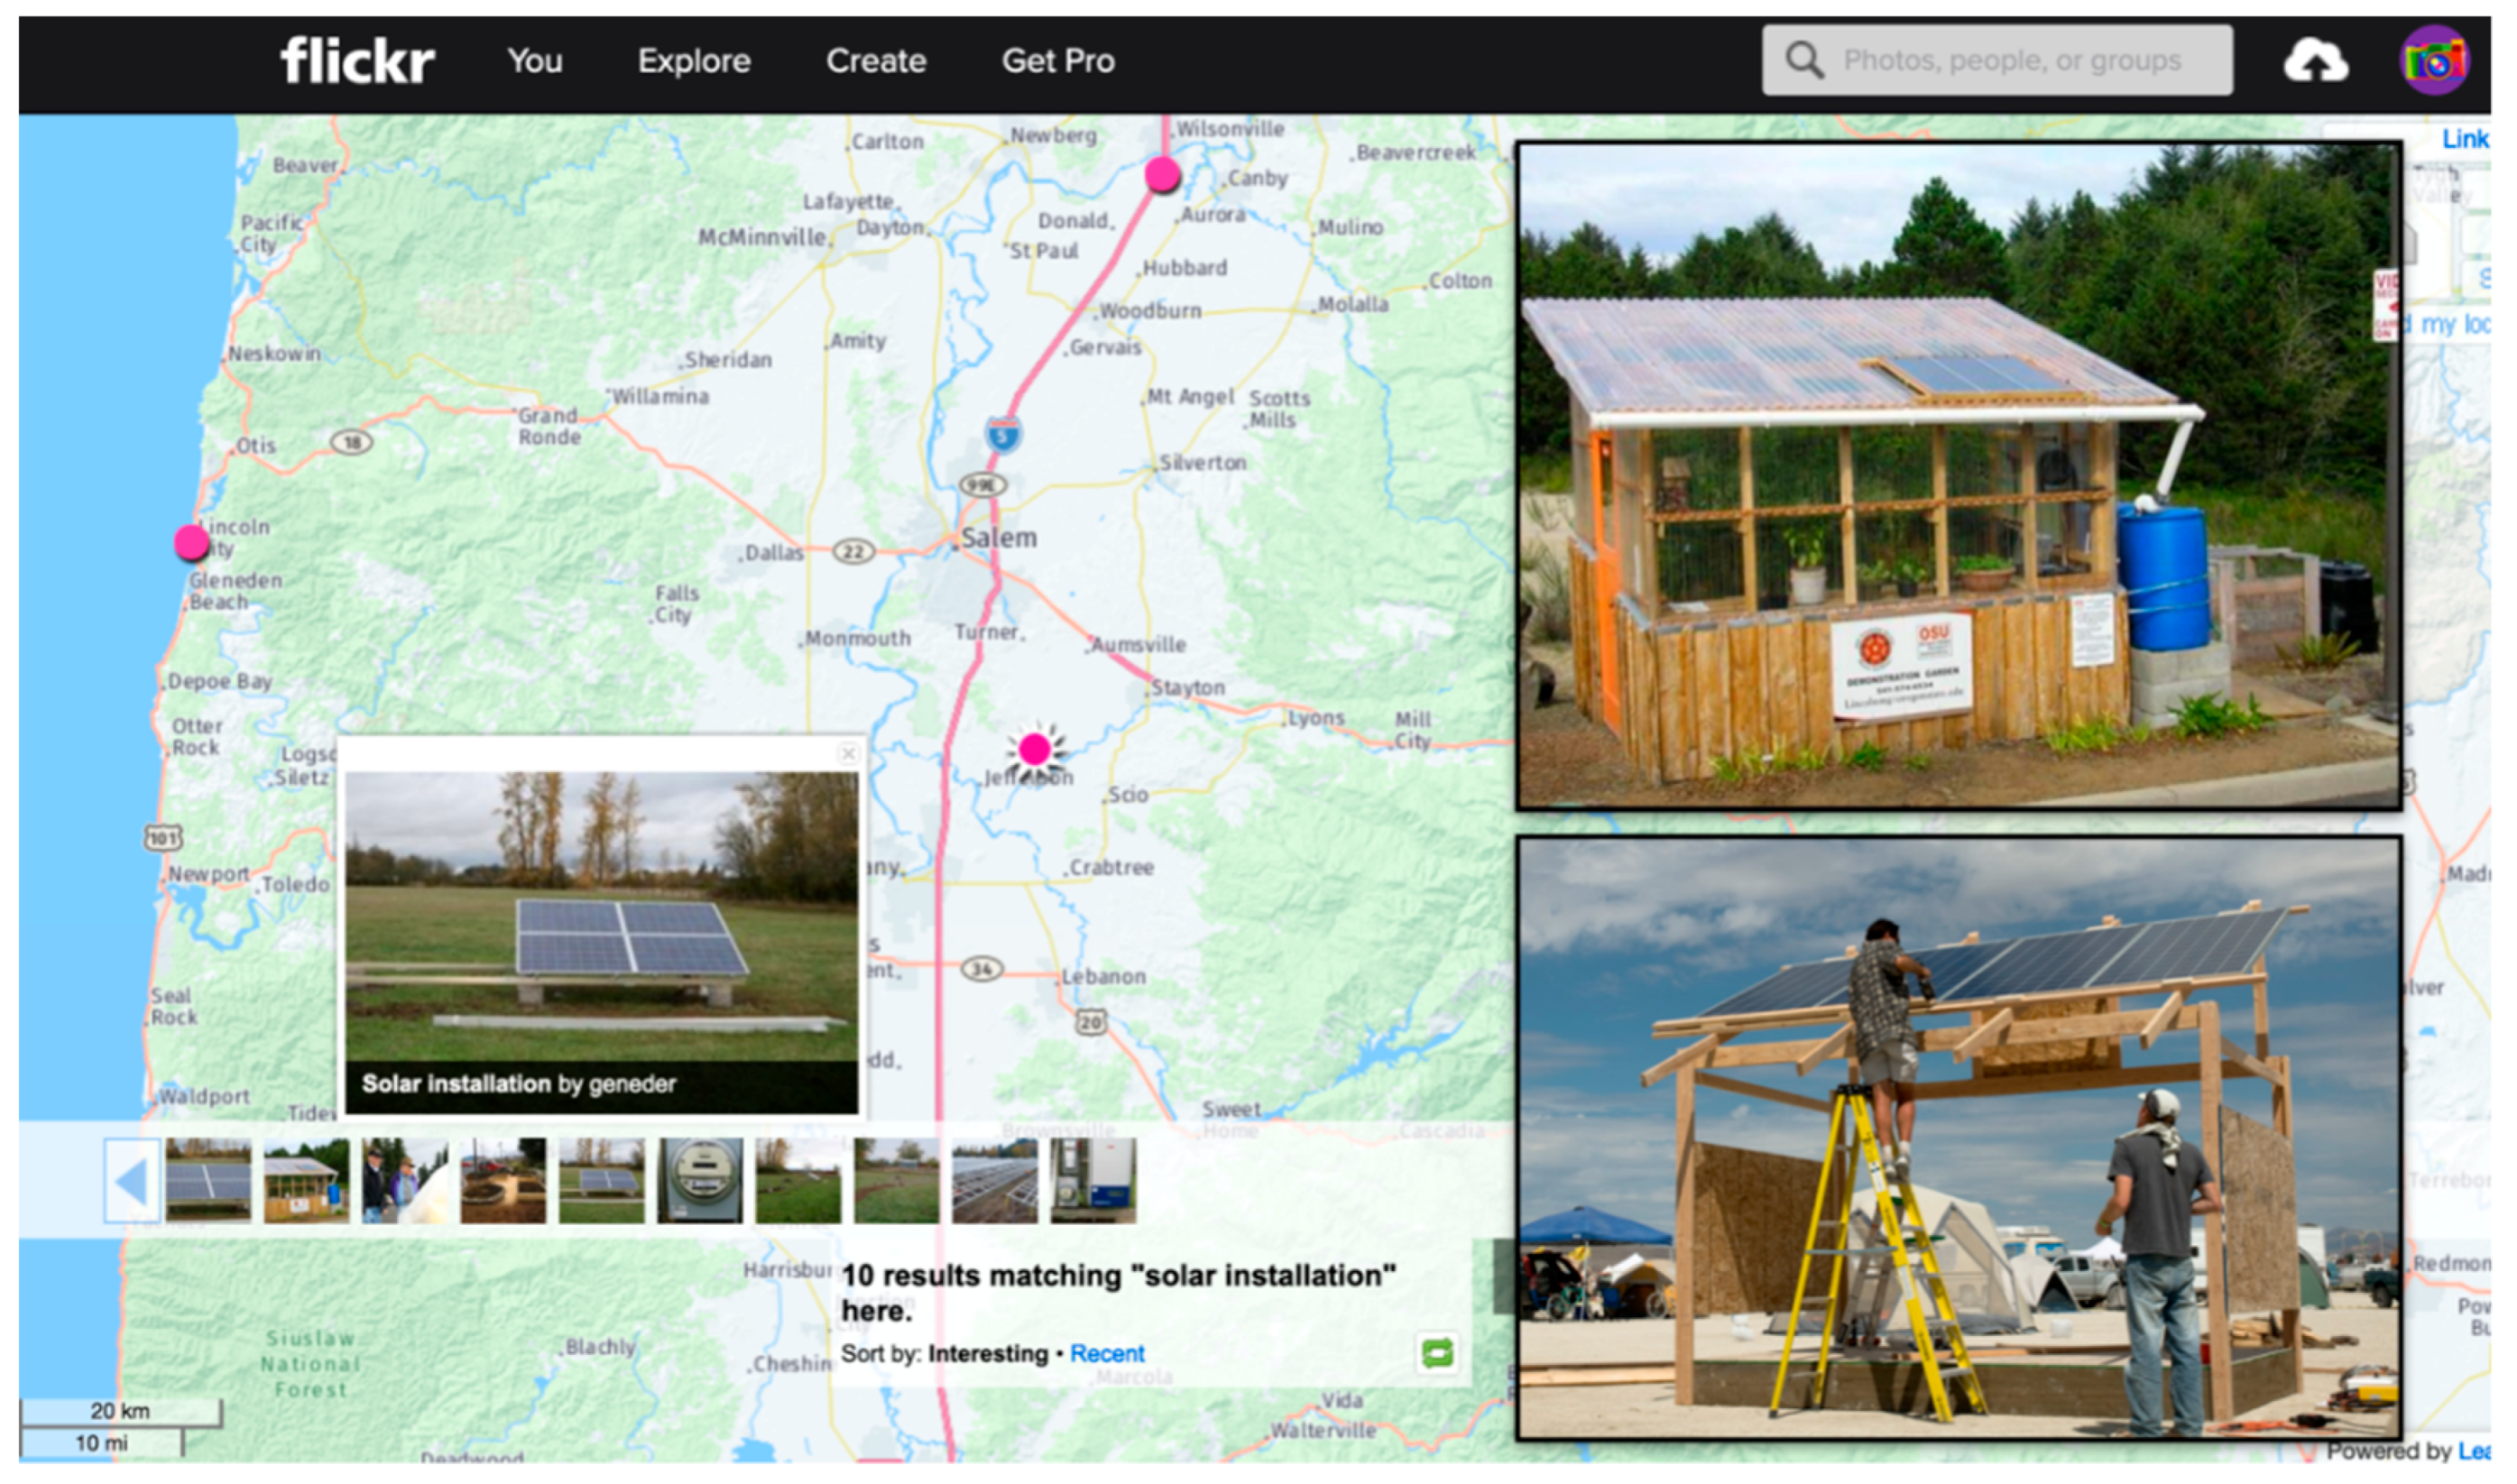
Example of solar power installations in geotagged images from Flickr.

Table 1.
Examples of studies falling into the four categories of SES (Social, Environmental, Environmental → Social, Social → Environmental) with information on the study topic, the social media platforms and data types used, and the spatial and temporal extent of the study.
Table 1.
Examples of studies falling into the four categories of SES (Social, Environmental, Environmental → Social, Social → Environmental) with information on the study topic, the social media platforms and data types used, and the spatial and temporal extent of the study.
| Study Reference | Topic | SES Category | Platform | Types of Data Used | Temporal Extent of Study | Spatial Extent of Study |
|---|---|---|---|---|---|---|
| [36] | Urban mobility and neighborhood isolation | Social | Locations | Years | National | |
| [37] | Sense of place | Social | Twitter and Wikipedia | Text and locations | Month | Regional |
| [38] | Vegetation phenology | Environmental | Photos and locations | Years | National | |
| [38] | Estimating the extent of a wildfire | Environmental; Environmental → Social | Twitter & Flickr | Locations | Month | Local |
| [39] | Invasive species monitoring | Environmental; Environmental → Social | Text, locations, and media | Years | Global | |
| [24] | Recreational and water quality | Environmental → Social | Flickr | Locations | Years | Regional |
| [40] | Perceptions of drinking water supply shutdown | Environmental → Social | Twitter; Google trends | Text | Week; Years | National |
| [41] | Ecosystem services | Environmental → Social | Flickr and Panaramio | Photos and locations | Months | Continental |
| [42] | Preferences for wildlife sightings | Environmental → Social | Instagram and Flickr | Photos | Year | Local |
| [43] | Risk perception of winter storm | Environmental → Social | Text and locations | Month | Regional | |
| [44] | Response to wildfire | Environmental → Social | Text, locations, time, and networks | Days | Regional | |
| [45] | Illegal hunting activities | Social → Environmental | Photos | Year | National |
© 2019 by the authors. Licensee MDPI, Basel, Switzerland. This article is an open access article distributed under the terms and conditions of the Creative Commons Attribution (CC BY) license (http://creativecommons.org/licenses/by/4.0/).
Share and Cite
MDPI and ACS Style
Lopez, B.E.; Magliocca, N.R.; Crooks, A.T. Challenges and Opportunities of Social Media Data for Socio-Environmental Systems Research. Land 2019, 8, 107. https://0-doi-org.brum.beds.ac.uk/10.3390/land8070107
AMA Style
Lopez BE, Magliocca NR, Crooks AT. Challenges and Opportunities of Social Media Data for Socio-Environmental Systems Research. Land. 2019; 8(7):107. https://0-doi-org.brum.beds.ac.uk/10.3390/land8070107
Chicago/Turabian StyleLopez, Bianca E., Nicholas R. Magliocca, and Andrew T. Crooks. 2019. "Challenges and Opportunities of Social Media Data for Socio-Environmental Systems Research" Land 8, no. 7: 107. https://0-doi-org.brum.beds.ac.uk/10.3390/land8070107
Note that from the first issue of 2016, this journal uses article numbers instead of page numbers. See further details here.