Differences in the Soil Quality Index for Two Contrasting Mediterranean Landscapes in Southern Spain


Department of Geography, Universidad Malaga. Campus de Teatinos, 29071 Málaga, Spain
*
Author to whom correspondence should be addressed.
Land 2020, 9(11), 405; https://0-doi-org.brum.beds.ac.uk/10.3390/land9110405
Submission received: 23 September 2020
/
Revised: 15 October 2020
/
Accepted: 19 October 2020
/
Published: 24 October 2020
Abstract
:Soil quality indexes (SQIs) are very useful in assessing the status and edaphic health of soils. This is particularly the case in the Mediterranean area, where successive torrential rainfall episodes give rise to erosion and soil degradation processes; these are being exacerbated by the current climate crisis. The objective of this study was to analyze the soil quality in two contrasting Mediterranean watersheds in the province of Malaga (Spain): the middle and upper watersheds of the Rio Grande (sub-humid conditions) and the Benamargosa River (semi-arid conditions). Field soil sampling was carried out at representative sites, and the soils were subsequently analyzed for various edaphic properties in the laboratory. From the resulting data, the mean values have been grouped and reclassified, and, based on a multicriteria evaluation, an SQI for the study region was generated. The results show that there are major differences between the two watersheds, with optimal soil quality values being found in the Rio Grande watershed (very high soil quality—34.26%), but more unfavorable values occurring throughout most of the Benamargosa River watershed (very low soil quality—63.33%). Thus, these results have been subjected to a validation process in the field.
1. Introduction
Drylands, defined as regions having an index of aridity (coefficient between rainfall: evapotranspiration) ranging from 0.05 to 0.65, cover approximately 5.2 billion ha worldwide and represent 40% of the global land surface [1]. There is largely consensus on the effects of climate change on dryland systems, including: (i) higher temperatures; (ii) an increase in the degree of aridity; and (iii) shifts in the seasonal rainfall regimes and a greater frequency of extreme events [2,3]. These changes will affect the size, frequency, intensity, and timing of rainfall events, which largely determine the structure and functioning of dryland ecosystems worldwide [3]. To unravel this complexity, there is a need to focus on understanding how biotic attributes interact with abiotic factors to ultimately drive ecosystem functioning [4,5]
Climate change in Mediterranean areas is particularly serious, because the effects of anthropogenic activities (tillage on slopes, deforestation, and pasture production) exacerbate the problems of prolonged periods of drought, and intense and irregular rainfall [5,6,7]. These processes lead to reduced soil fertility and soil loss [8,9]. In the short term, it is expected that these systems will be subject to a decrease in soil organic matter because of a reduction in vegetation cover [10]. As a result, the soil clay content will decrease, causing a reduction in soil stability and the size of aggregates [5,11]. In the long term, reduced water holding capacity and permeability, and a higher probability of crust formation are expected [12,13], leading to a dramatic decrease in infiltration rates [13,14]. Consequently, the vegetation will be unable to recolonize in the system because of the absence of available water in the soil profile, and high rates of overland flow and sediment yield will result [8,11]. The seedbank and nutrient content will decline, and a second cycle of decreasing soil organic matter content will be initiated. These positive feedbacks may not be spontaneously reversible, so, when certain thresholds are exceeded, restoration activities will need to be carried out.
In this context, investigating current and future effects of climate change on the regional scale is essential to understanding potential impacts in Mediterranean ecosystems. The monitoring of soil quality parameters will help clarify and raise awareness of the causes and effects of climate change, and the required responses [15]. This is because soil quality is a measure of the capacity of a soil to function within ecosystem and land-use boundaries, sustain productivity, maintain environmental quality, and promote plant and animal health [16,17]. Soil quality indexes are measurement tools providing information about soil properties, processes, and characteristics [15]. According to the purpose of the study, a soil quality index (SQI) must be different; this entails a careful design prior to its formulation. An SQI can provide very diverse information, being a key to determine the level of soil degradation, to evaluate the general quality of an agricultural soil, to identify areas with a higher production potential or, on the other hand, to determine less suitable areas in terms of production [18]. In this sense, the development of a set of readily measurable indicators that describe the condition and health of degraded areas is essential to the protection and sustainable use of terrestrial water resources. Thus, a good set of soil quality indicators should reflect how biotic attributes interact with abiotic factors [19]. The capacity of a soil to function is reflected in measurements of its physical, chemical, and biological properties [11,13,15] and soil quality indicators should reflect these properties and their interactions in soil processes.
Soil quality indicators can be measured over various periods to assess the effects of management on soil functioning. Various soil properties have been used as soil quality indicators [20]. The soil physical quality is associated with the efficient use of water, nutrients, and pesticides [21]. Chemical indicators reflect soil–plant relationships, water quality, soil buffering capacity, and water and nutrient availability [22]. Biological indicators integrate many factors that can affect soil quality, including macroinvertebrate abundance and byproducts [23]. Soil enzyme activities enable assessment of the degree of soil degradation because they are early and sensitive indicators of soil ecological stress [21]; they also reflect microbial activity, which is responsible for producing enzymes involved in many soil functions [24]. However, monitoring soil quality is challenging because of the complexity of soil processes, and the spatial and temporal variability of soil properties [25].
The combination of multicriteria assessment tools (EMCs) and GIS technologies has provided a very useful approach to assessing the agricultural suitability of particular areas and should prove useful for Mediterranean areas subject to climate change effects [26,27]. Kumar and Jhariya [28] used this approach in India to assess the suitability of soils for agriculture. These tools enable the evaluation of various alternatives [29], and identification of the relative importance of selected variables through a decision-making process [30,31]. Thus, these methods have added a degree of objectivity to a process characterized by subjectivity [32] and advanced the development of tools including spatial and geographical analyses [33].
The major objectives of this study were: (i) to develop an SQI for the Mediterranean area of southern Spain, specifically for two watersheds representing contrasting climatic conditions (sub-humid and semi-arid); and (ii) to evaluate the quality of the soil in each watershed, identifying landscape units of higher and lower quality, and differentiating areas most susceptible to the effects of climate change.
2. Materials and Methods
2.1. Study Areas
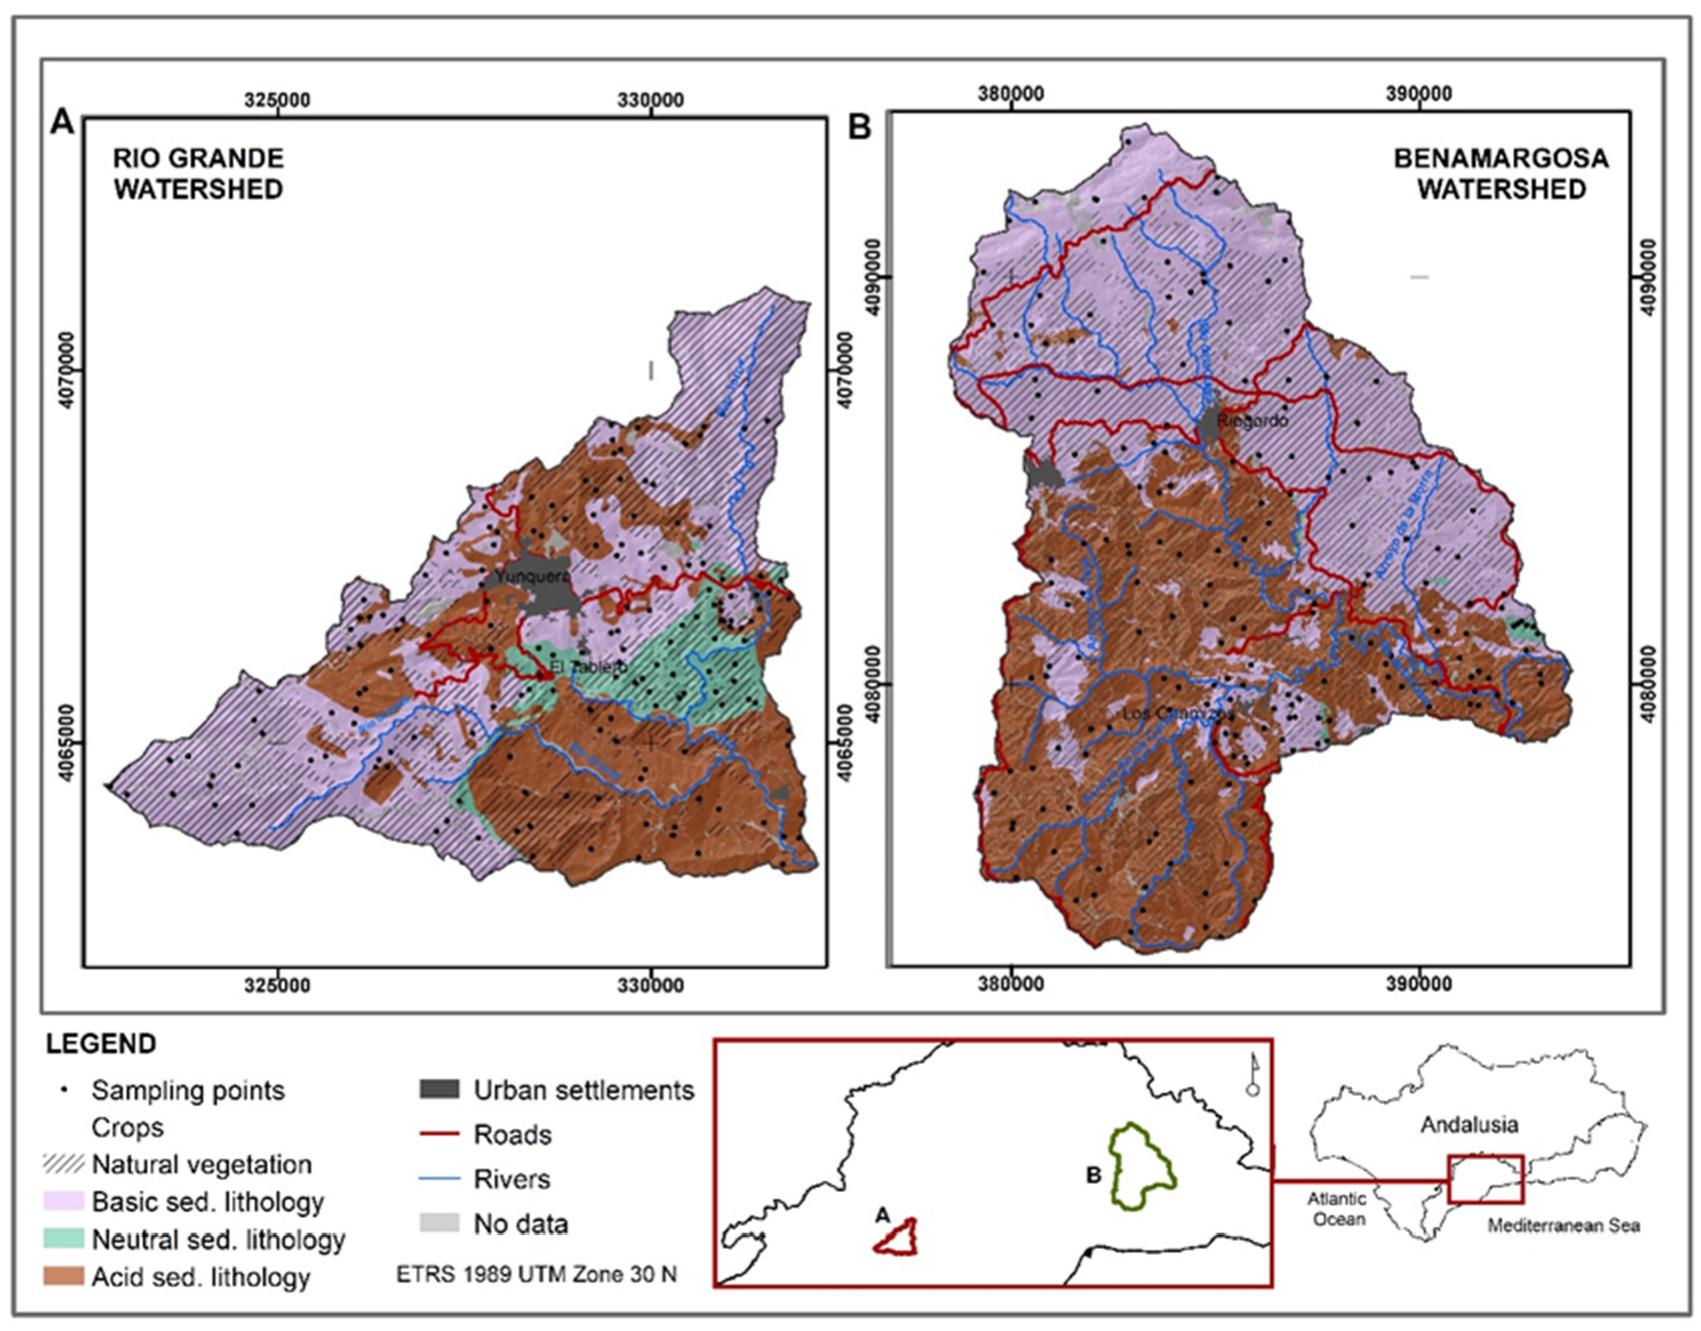
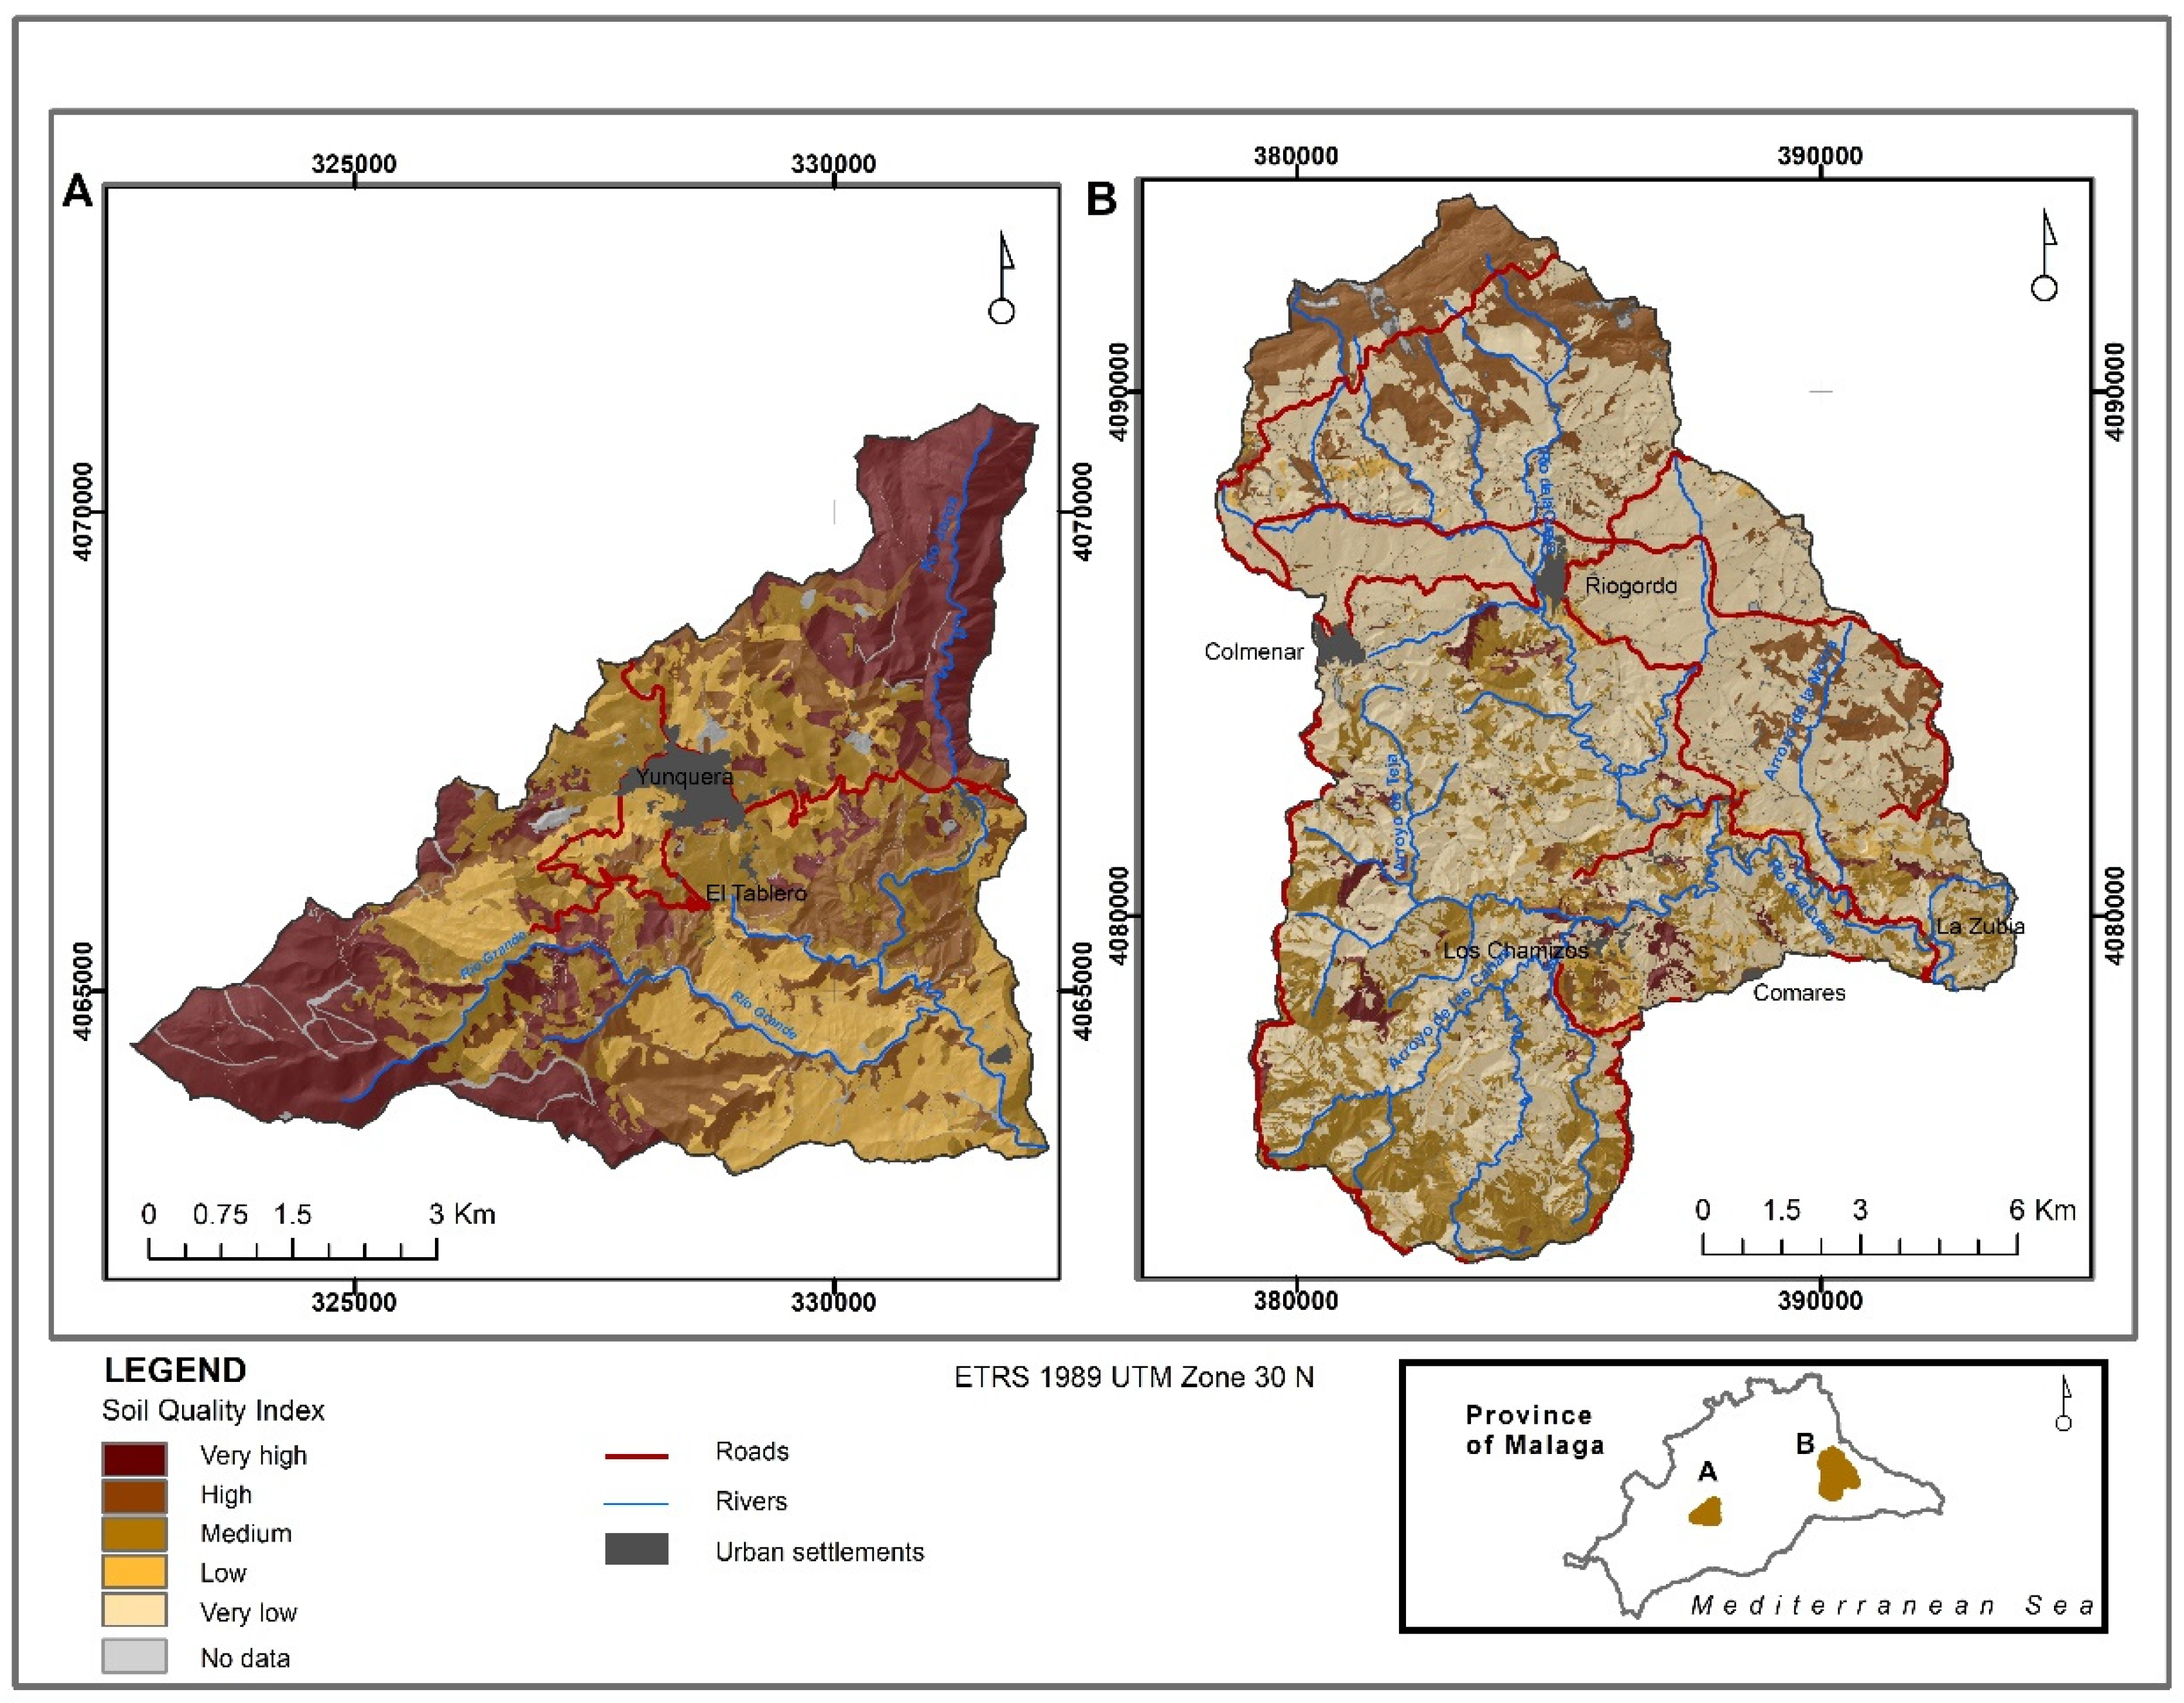
Two hydrographic watersheds representative of the mid-mountain landscape in a Mediterranean coastal strip in southern Spain were selected, one on each side of the degradation threshold observed by Ruiz and Romero [34] (500–600 mm). On the one hand, the Río Grande watershed (GR; area: 38.42 km2; annual rainfall: 719.03 mm), which has a subhumid Mediterranean climate and, on the other hand, the Benamargosa River watershed (BE; area: 181.23 km2; annual rainfall: 562.61 mm), which has a dry semiarid Mediterranean climate (Figure 1).
2.2. Soil Sampling
Based on lithological and land-use mapping, the study area was separated into differing landscape units having acid, neutral, or basic sedimentary lithologies, and land uses of either cultivation or natural vegetation [35]. A total of 361 surface soil samples (0–10 cm depth) were collected from sites distributed homogeneously throughout the area, among which 170 were from the Río Grande watershed and 191 were from the Benamargosa River watershed. In the laboratory, the soil samples were air dried and sieved, and fractions having particle sizes < 2 mm were retained of analysis.
2.3. Analysis of Soil Properties
The properties analyzed for the sieved samples were: (i) texture; (ii) soil organic carbon (SOC); (iii) available water capacity (AWC); (iv) structural stability (AGS); (v) hydrophobicity; (vi) electrical conductivity (EC); (vii) bulk density (BD); and (viii) permeability.
The texture was evaluated using diffraction equipment (Coulter LS 230), following the pretreatment method of Marañés et al. [36]. SOC was analyzed using the calcination method at 550 °C [37]. AWC was measured based on the difference between the field capacity (FC) and the permanent wilting percentage (PWP), using a pressure plate extractor [38]. AGS was determined using the wet sieving method [39] for aggregates of 0.053, 0.125, 0.250, 0.5, 1, and 2 mm. Hydrophobicity was analyzed using the ethanol percentage test (EFA) [40], based on the water repellency intensity intervals described by Doerr et al. [41]. EC was analyzed from the saturation extract of a sample paste prepared using a 1:1 ratio with distilled water [42].
For the undisturbed soil samples, BD was determined using gravimetric analysis following drying in an oven at 105 °C for 24 h [43]. Permeability was measured using saturated soil in a permeameter (Eijkelkamp, model 09.02), following the protocol described by the manufacturer and applying the Darcy equation [44].
2.4. Other Factors Influencing the Erosion Rate Calculated Using the RUSLE Model
Other soil characteristics analyzed and having potential as degradation indicators included: (i) the slope percentage; (ii) the erodibility factor (K factor) for the revised soil loss equation (RUSLE); and (iii) the plant cover factor (C).
The slopes were obtained from a digital elevation model (DEM) using a mesh pitch of 5 m. The K factor, which is related to various edaphic parameters, was calculated using the following equation [45]:
where M is the particle size, calculated as (% silt + % very fine sand) × (100 − % clay); OM is the soil organic matter (%), obtained from SOC; S is the soil structure code (1 = very fine granular, 2 = fine granular, 3 = coarse granular, 4 = massive); and P is the soil permeability class, based on the criteria of Reynolds et al. [46] (1 = fast, 2 = moderate to fast, 3 = moderate, 4 = low to moderate, 5 = low, 6 = very low).
Calculation of factor C was carried out using the normalized vegetation index (NDVI) for a Landsat 8 image obtained from NASA and atmosphere corrected (date: 14 September2017; scene: 201/34) in ERDAS Imagine 2015 software. The NDVI result was converted to values of factor C using the formula of Van der Knijff et al. [47]:
where α and β have values of 2 and 1, respectively.
2.5. Statistical Analysis
Following the analysis of soil properties and the calculation of degradation indicators, a principal component analysis (PCA) was performed to select those properties/indicators that best explained the landscape dynamics in each watershed [48] and were therefore likely to be the most sensitive descriptors of soil quality [49,50]. This analysis was carried out using SPSS version 25 (corporate license of the University of Malaga) for Windows [51].
2.6. SQI Formulation
To formulate the SQI, the following operations were carried out consecutively:
- The properties and factors used to determine the SQI were selected based on the PCA and an expert opinion system [50].
- These were reclassified on a scale of 1 to 3, with value 1 representing poor quality, 2 representing medium quality, and 3 representing high quality (Table 1). In addition, these were adjusted to both statistical criteria (quantiles) and theoretical classifications [52]. In this reclassification, the values for both watersheds were considered, to enable formulation that facilitated comparison.
- The various properties and factors were grouped into three clusters according to their characteristics (water, physical, and biological or organic), groups that would compose the final SQI, and those that could be defined as soil quality sub-indices.
- A multi-criteria evaluation was carried out individually in each group using a weighted summation (e.g. [27,28,31,34]). For this purpose, each component was given a specific weighting (priority vector), based on the experience of several experts in soil analysis [50] using a decision matrix. The Saaty method, analytical hierarchies, or peer comparison were used to assign weights. This approach is widely used in this type of study [30], and consists of elaborating a square matrix in which the number of rows and columns is defined by the number of variables to be weighted. To validate the method, the value of the consistency of judgment must be <0.1 [30]. In short, the decision matrix is an analytical hierarchy technique (AHP), through which relative weights are assigned to a group of factors in the multi-criteria assessment [27].
- The procedure was repeated to achieve the final SQI using the steps described above, but with a reclassification process based on a scale of 1 to 5 (Table 1).
Based on the formulation and to achieve soil quality results for the study area, the SQI equation was developed in ArcGis software version 10.6 (Corporate license of the University of Malaga. The results were reclassified in five classes, based on statistical quantiles (1: very low; 2: low; 3: medium; 4: high; 5: very high). In addition, the equations obtained in each of the clusters were used to evaluate the quality of the soil from each of the perspectives considered (water, physical, and organic).
Field work was undertaken to validate the SQI analysis results.
2.7. Soil Quality Index (SQI)
Soils are complex ecosystems within which various factors interact, so it is necessary to evaluate a variety of indicators to determine soil quality [53]. Table 2 shows the indicators that were identified based on the methodology described and selected for formulation of the SQI for the study area; these are grouped according to their relevance to water, physical, or organic factors.
Permeability, the percentage of gravel and sand, hydrophobicity, and the AWC were the indicators chosen to evaluate water factors. The slope, soil erodibility value (K Factor, RUSLE), structural stability, and bulk density were the indicators chosen as relevant to physical factors. Indicators considered relevant to organic factors included the organic carbon content of the soil, the vegetation factor (factor C, RUSLE), and the electrical conductivity. Many of these indicators have been used to evaluate soil quality in studies carried out in various areas worldwide [52,54,55,56]. Their application to the Mediterranean area is evident from their known relevance to eco-geomorphological processes, and more generally in landscape dynamics [48].
Subsequently, based on the criteria of several experts [50] each factor was given a weighting in the weight matrix. Thus, in the final SQI formula, the organic factor had the greatest degree of importance and was given a weighting factor of 0.6. The relevance of this factor was determined by the strong effect of its indicators on the other factors comprising the SQI [52]. The water and physical factors were each given a weighting of 0.2. These factors have been combined into a single factor in other soil quality studies [53,57]. Thus, the overall equation for the SQI was:
where W is the water factor, P is the physical factor, and O is the organic factor.
The calculation of each of the components in this formula followed the same procedure for the calculation of the final formula. Thus, for the water factor, AWC had the highest weighting factor (0.393), followed by permeability (0.314), sand content (0.18), gravel content (0.104), and hydrophobicity (0.04). Although all these properties are fundamental, AWC has a key role in the landscape dynamics, especially in semiarid areas [48]. Soil permeability is also a key indicator, as it influences many other characteristics and is a determinant of plant growth and degradation processes [58]. Therefore, the equation for assessing soil quality from a water (W) perspective was formulated as follows:
where PE is the permeability, G is gravel, S is sand, H is the hydrophobicity, and AWC is the available water content.
Physical characteristics are central to soil quality, particularly as these are difficult to modify [59]. For the physical factor, erodibility (RUSLE) was weighted as having the greatest importance (0.5579), because this indicator combines various properties. The next most important was slope (0.2633), which is fundamental in erosion processes and landscape dynamics in the Mediterranean area, and particularly in the study area [48]. The AGS (0.1219) and BD (0.0569) were assigned lower levels of importance. Therefore, the equation for assessing soil quality from a physical (P) perspective was formulated as follows:
where SL is the slope, K is the K factor (RUSLE), AGS is the structural stability, and BD is the bulk density.
For the third factor (organic: O) comprising the SQI, equal weighting (0.4286) was given to SOC and the C factor (RUSLE). SOC is considered a key indicator of soil condition, as it has a strong influence on other soil properties [60]. For example, a decrease in SOC has a marked negative impact on all physical and hydrological characteristics of the soil, resulting in greater sensitivity to degradation processes, thereby decreasing soil quality [52]. The EC indicator was given a weighting of 0.1429. Therefore, the equation for assessing soil quality from an organic (O) perspective was formulated as follows:
where SOC is the soil organic carbon, C is the C factor (RUSLE), and EC is the electrical conductivity.
In this way, the SQI and specific sub-indices have been formulated, useful for evaluating the specific characteristics of a given area. In addition, the inclusion of two contrasting watersheds suggests that the formula can be extrapolated to the entire rainfall gradient studied by Ruiz-Sinoga and Romero-Díaz [34] in the Mediterranean section of southern Spain.
3. Results and Discussion
The evaluation and application of the method described in this study was used to identify the areas having better soil quality and those requiring more attention because of their susceptibility to degradation. Those areas having soil providing optimal conditions for plant development and lower susceptibility to erosive processes were rated as being of higher quality.
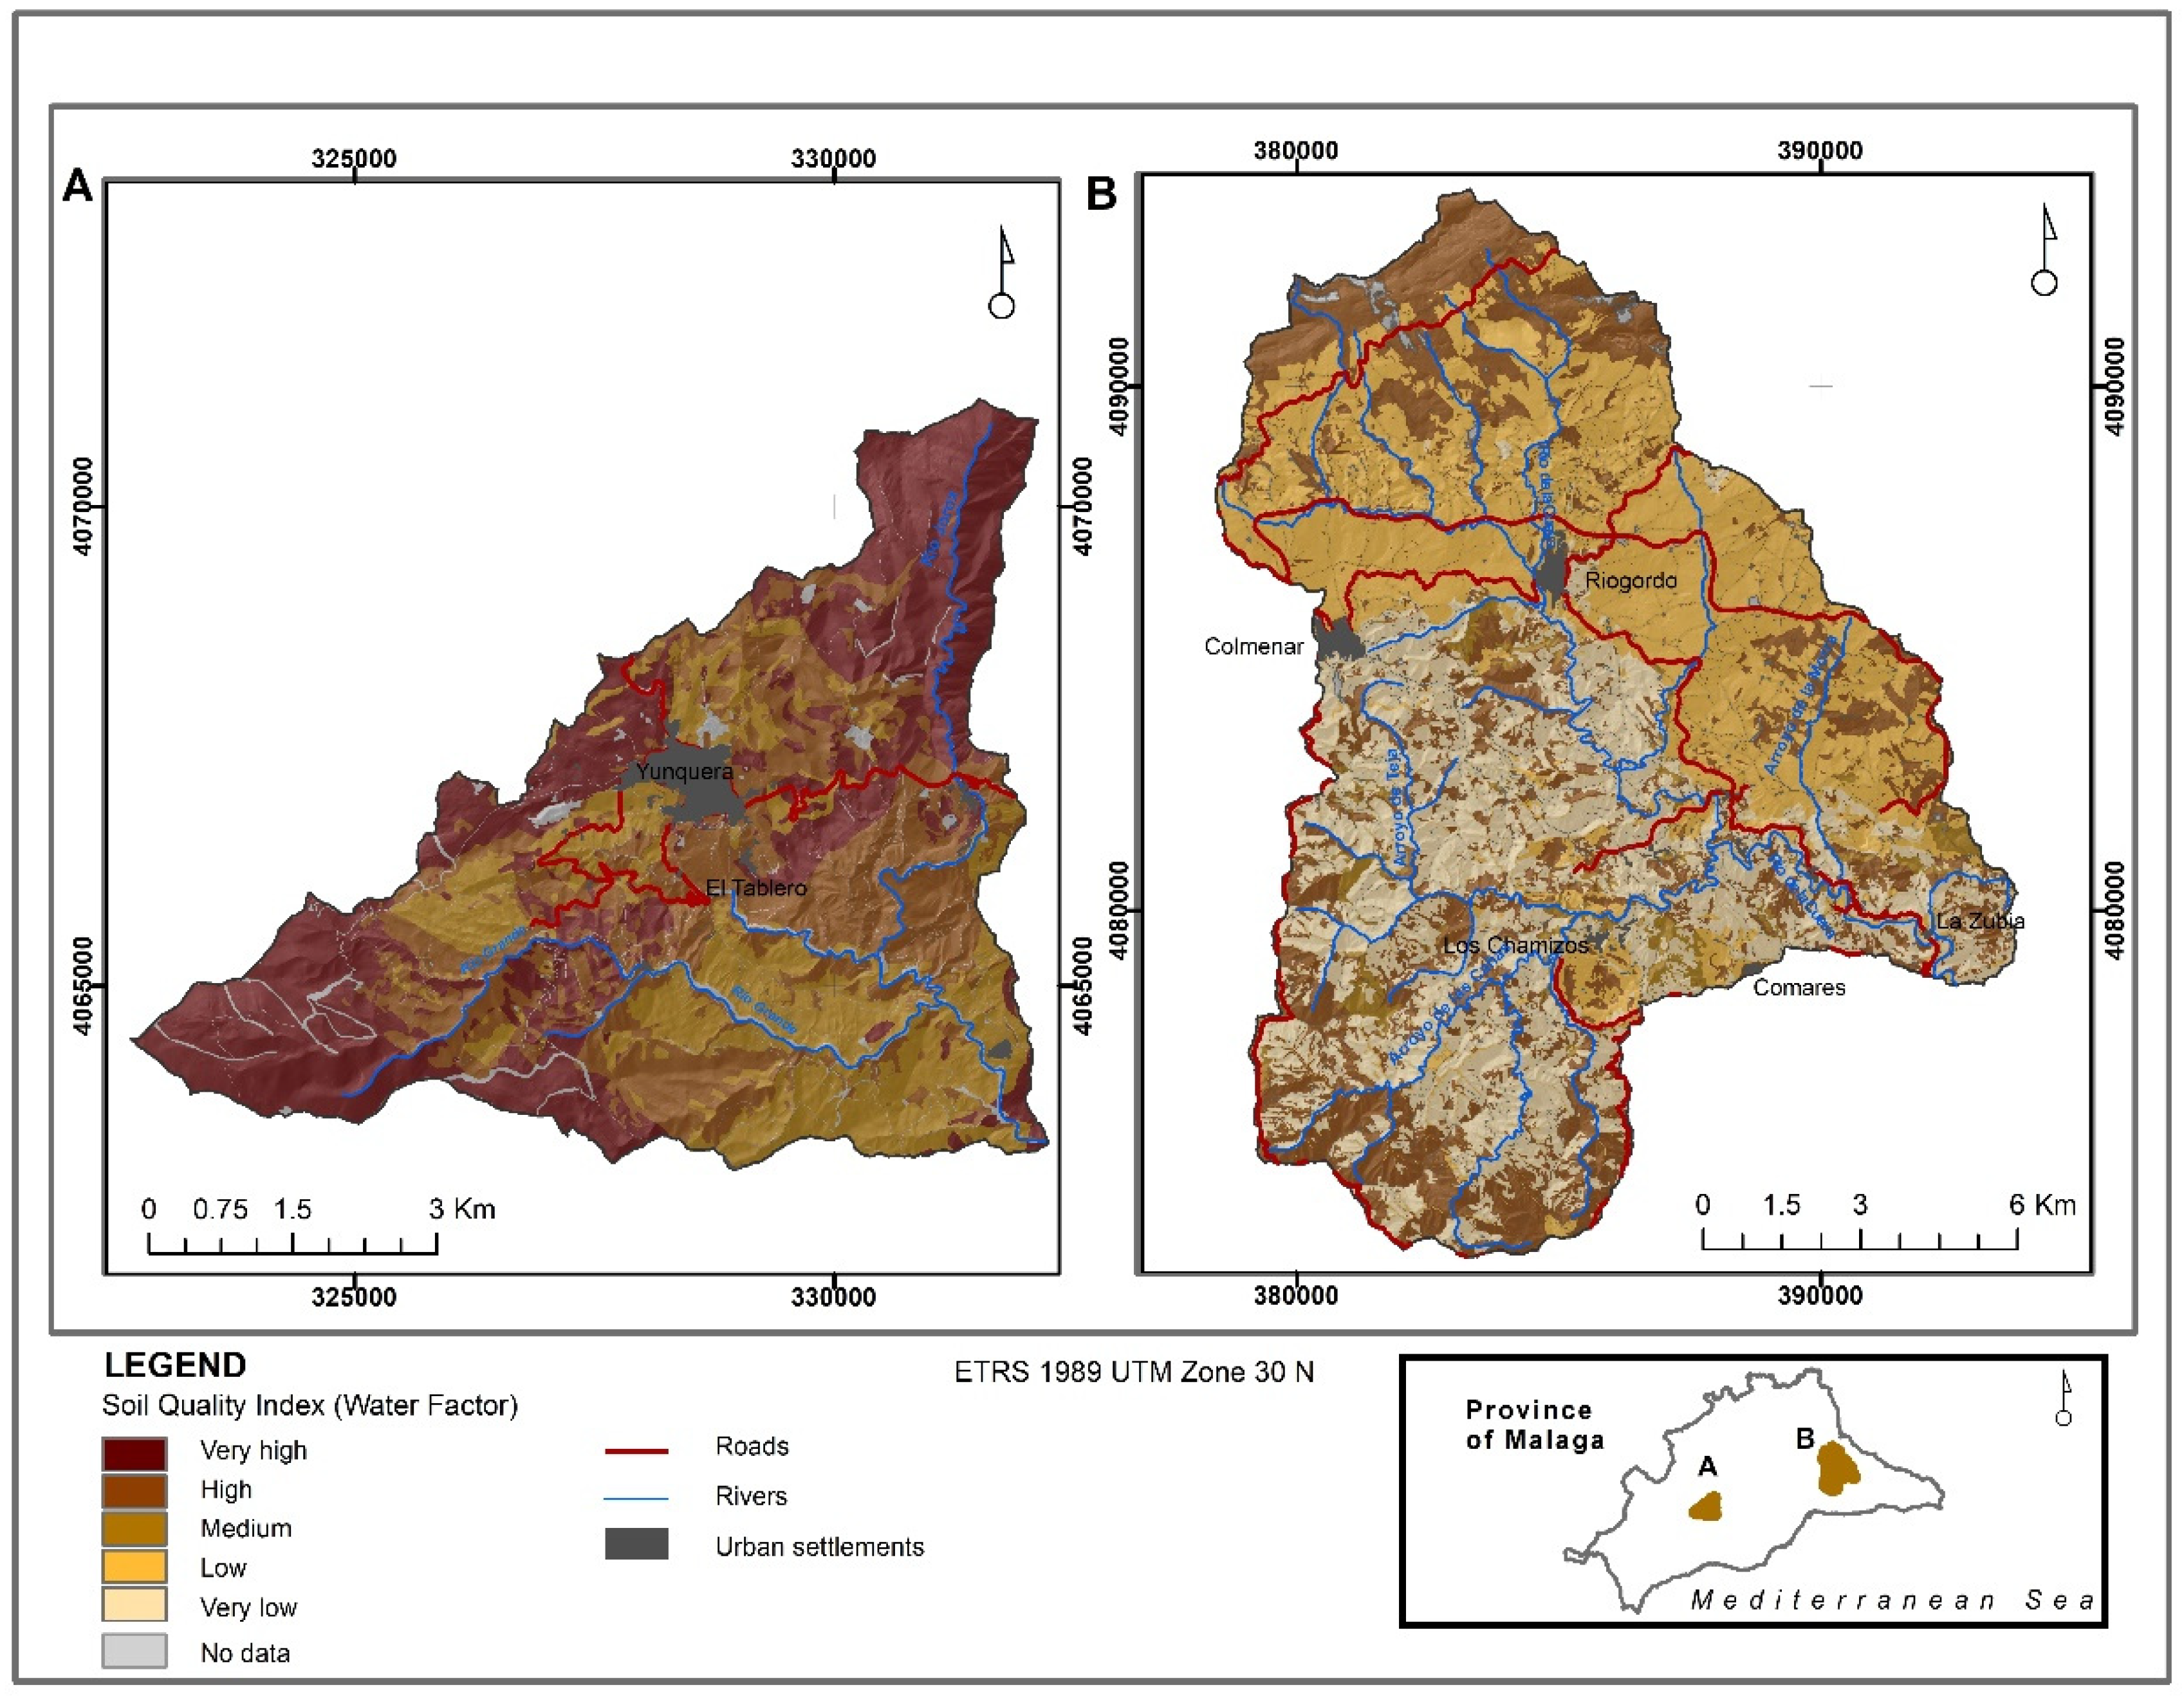
The equation related to the water factor was applied to both watersheds and used to generate a soil quality map based on characteristics related to water (Figure 2). This shows that the GR watershed had higher quality soil (soil health) than the BE watershed; this was mainly related to differing lithologies and the generally greater degree of vegetation cover in the GR watershed than the BE watershed (Figure 1).
The highest quality areas were associated with basic sedimentary lithologies and areas having the most vegetation [48]. Thus, the results obtained identify the importance of the vegetation cover in the hydrological state of the soil, where the presence of more vegetation is related to higher quality [61]. In contrast, the poorer quality areas were those having bare soil and where cropping has been abandoned, particularly the central and southern BE watershed areas. The abandonment of cropping often favors erosion processes [62], especially in the most arid areas, where the vegetation cover does not regenerate and water retention is more difficult [63], resulting in greater soil degradation and lower quality soils.
Acid lithologies directly affect soil fertility, and affected soils are generally less productive and of poorer quality [64]. In this study, the lowest-quality soils corresponded to acid lithologies and low permeability levels. Poor permeability results in low levels of infiltration and poor retention of water in the soil, and enhanced surface runoff processes [65]; in some areas, the slope factor was an important additional factor.
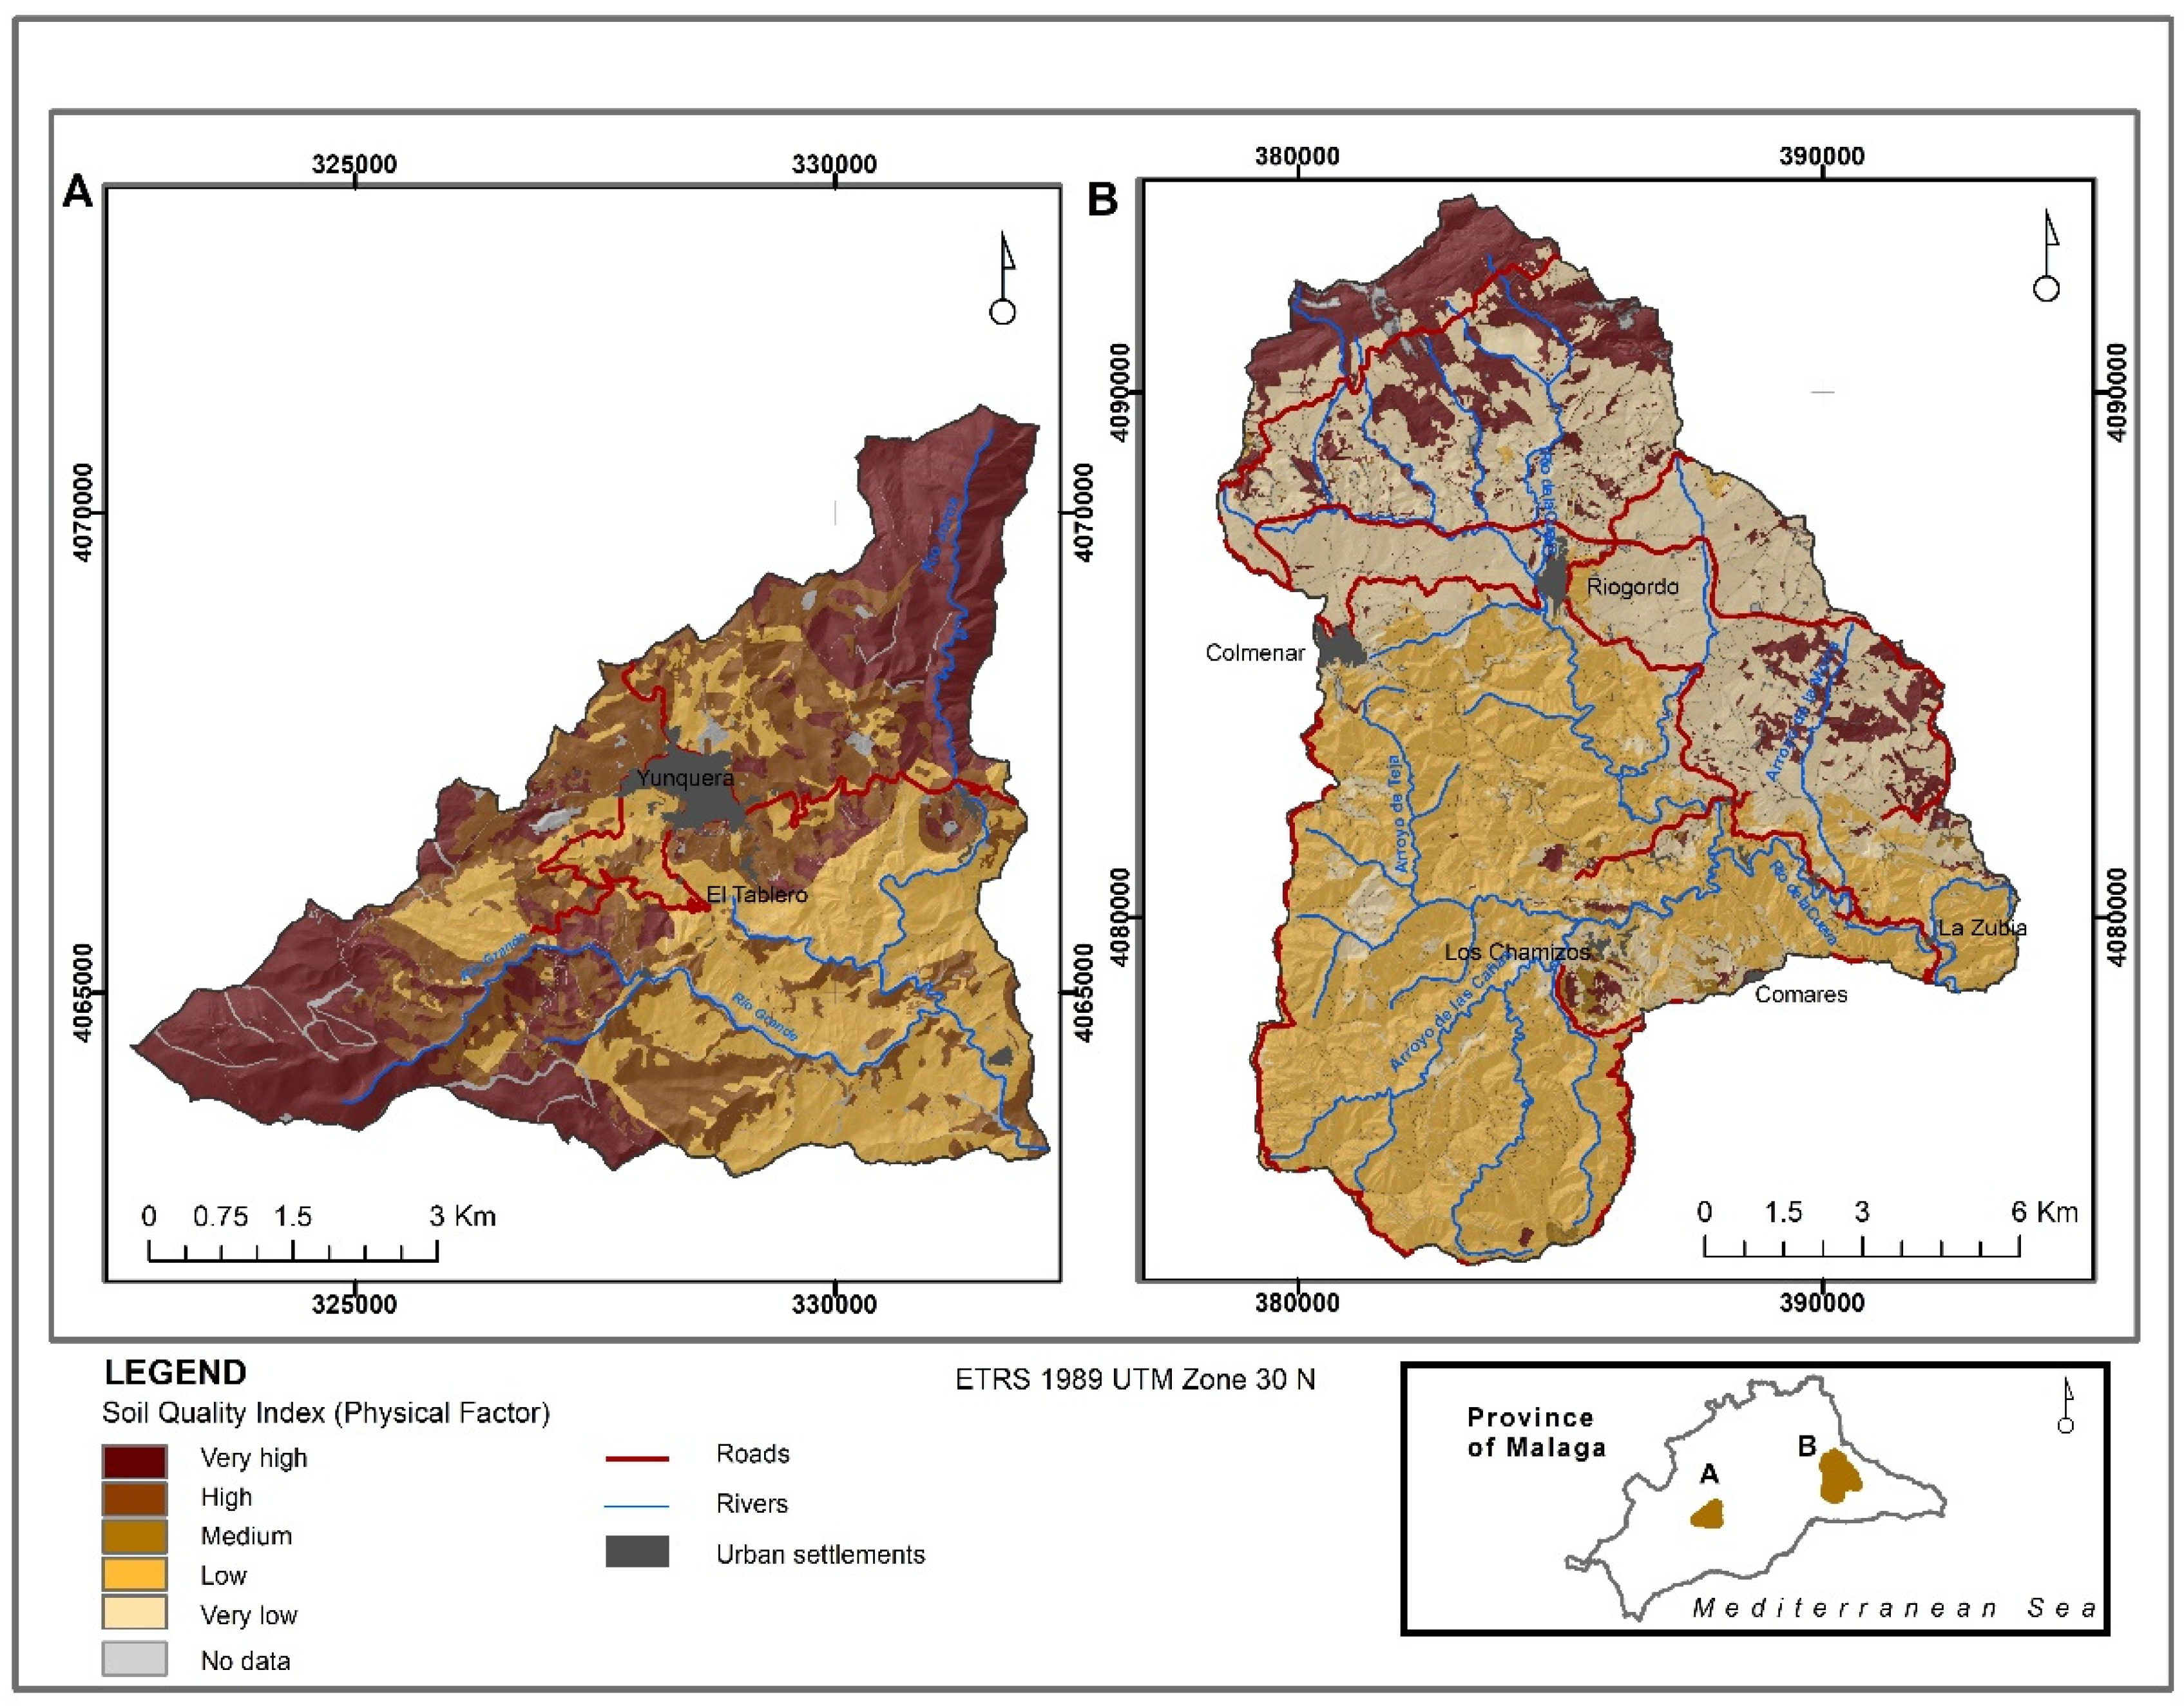
The equation formulated to assess soil quality from a physical perspective was applied to both watersheds (Figure 3). The results also show higher soil quality in the GR watershed than the BE watershed, although, for both watersheds, the areas of higher edaphic quality corresponded to areas of natural vegetation and basic sedimentary lithology. The K, BD, and AGS parameters reflect the role of vegetation cover, with more vegetation resulting in higher AGS values, lower BD values, and consequently less erodibility [66]. The best soil quality in the GR watershed was in the northern and southwest areas. In contrast, the poorest quality was in the southeast of the watershed, consistent with the occurrence there of large areas of bare soil [48]. In the BE watershed, the best soil quality was limited to the northernmost area, while, in the areas near Riogordo, the soil quality was lower and coincided with very high values of erodibility associated with the presence of agricultural areas (olive groves, fruit trees, and other tree crops) [35].
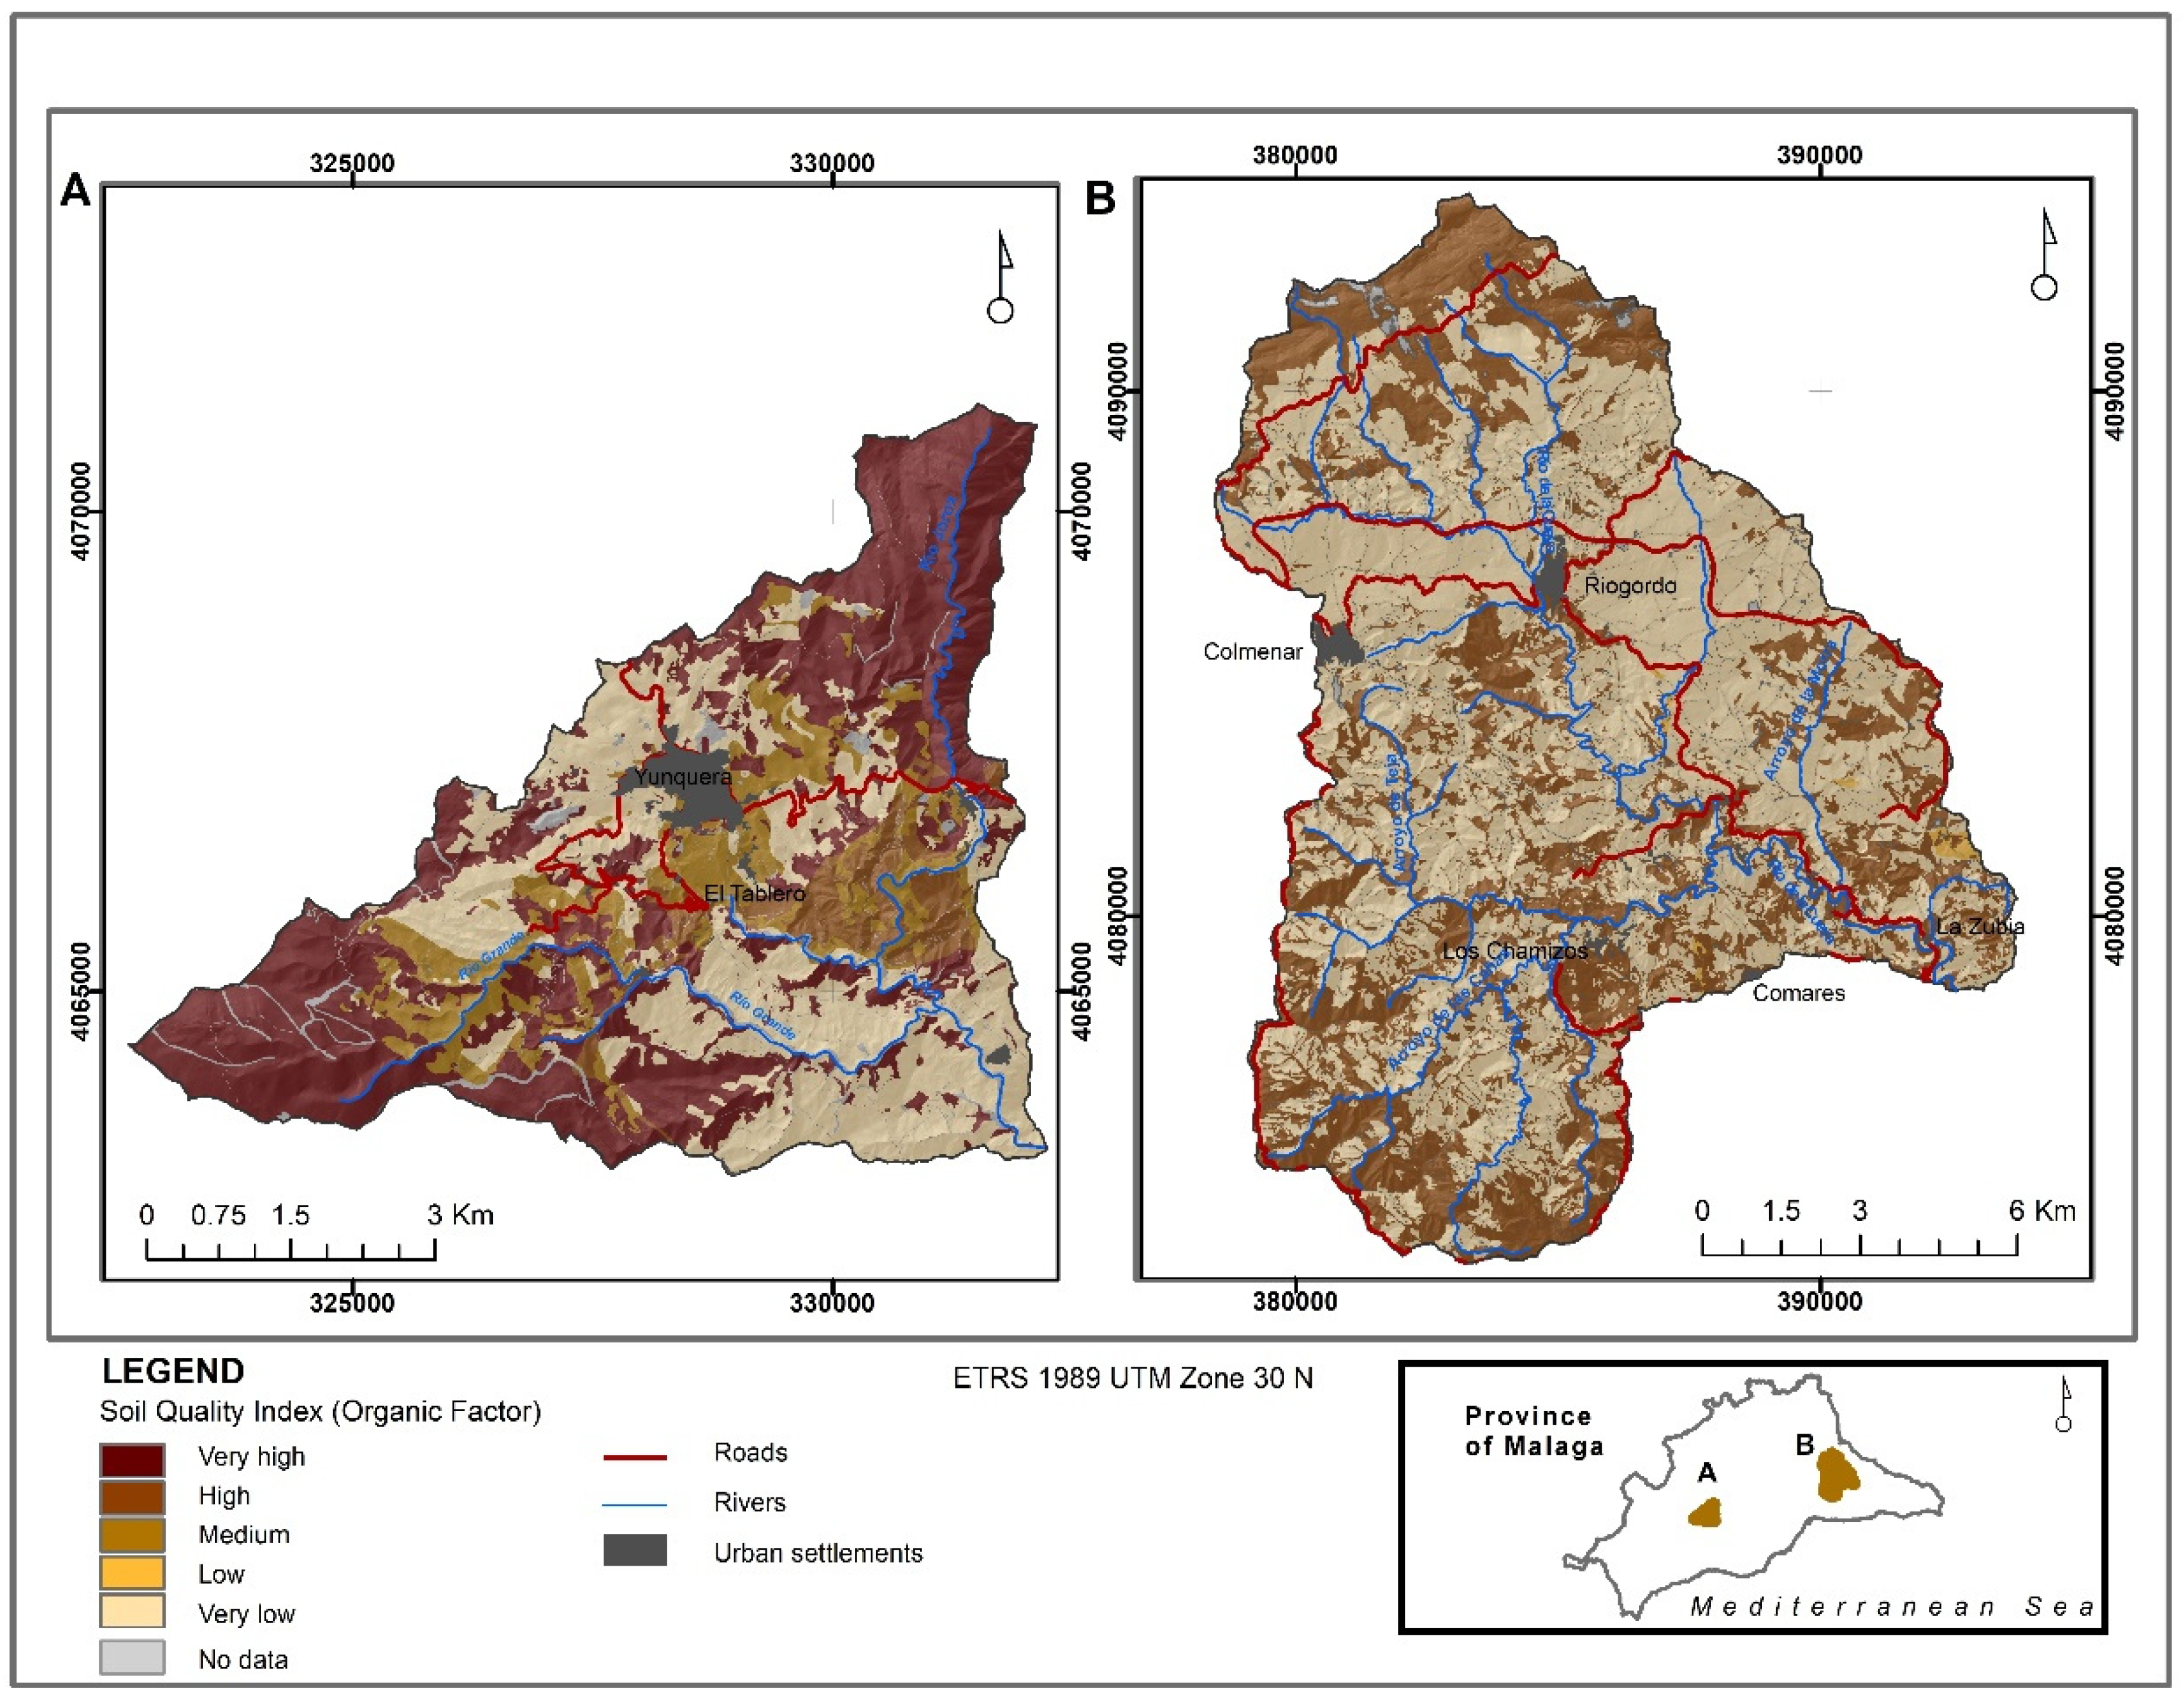
In relation to organic or biological factors (Figure 4), the results generally show low soil quality in both watersheds, although the values were lower in the BE watershed, which was mostly of very poor quality. The GR watershed includes great spatial variability, with substantial land, forest, and agricultural use diversity in the northernmost and southwestern areas associated with the best soil quality, and lowest soil quality corresponding to the areas most devoid of vegetation, predominantly in the southeast and west of Yunquera. These contrasts are consistent with the suggestion by Sillero-Medina et al. [48] that the GR watershed reflects a double evolution; areas having positive trends in the quantity of biomass had greater SOC and factor C (areas of higher soil quality), whereas other areas where vegetation cover has been lost (and consequently there has been an increase in the area of sealed and unprotected surfaces) had low and very low soil quality. An increase in SOC as a result of revegetation has been demonstrated in several studies in the Mediterranean basin [67,68], along with a loss of organic quality in areas occupied by rainfed crops. In contrast, the BE watershed had generally very low soil quality throughout, except in the northern fringe and in some scattered areas in the southern half. As in the GR watershed, a negative trend in terms of biomass content was evident throughout most of the BE watershed, corresponding to a loss of SOC and soil quality, although moderate soil quality areas occur, corresponding to small areas of natural vegetation (wooded areas and sclerophyll vegetation) [35].
Analysis of the SQI in the study area showed quite contrasting results, but comparable to the ecogeomorphological or landscape dynamics identified in recent years in the same area [35,48,69] (Figure 5). The SQI was very high in 34.26% of the GR watershed area (Table 3) because of the high index values for the water, physical, and organic factors in the north and west of the basin. However, there were low SQI areas in 24.78% of the watershed, corresponding to agricultural uses and the associated low values for the organic component.
For the BE watershed, where climatic indicators show greater aridity, there were very heterogeneous results. Only 2.51% of the area had high-quality soils (Table 3), corresponding to small areas of sclerophyll vegetation where soil−water−plant relationships occur throughout the year [35]. Extremely low-quality areas occupied 63.33% of the total area of the watershed, corresponding to low values for the organic factor associated with the predominant agricultural uses. However, the low quality was exacerbated in the southern sector by water limitations, and in the northern and eastern areas of Riogordo by high levels of soil erosion.
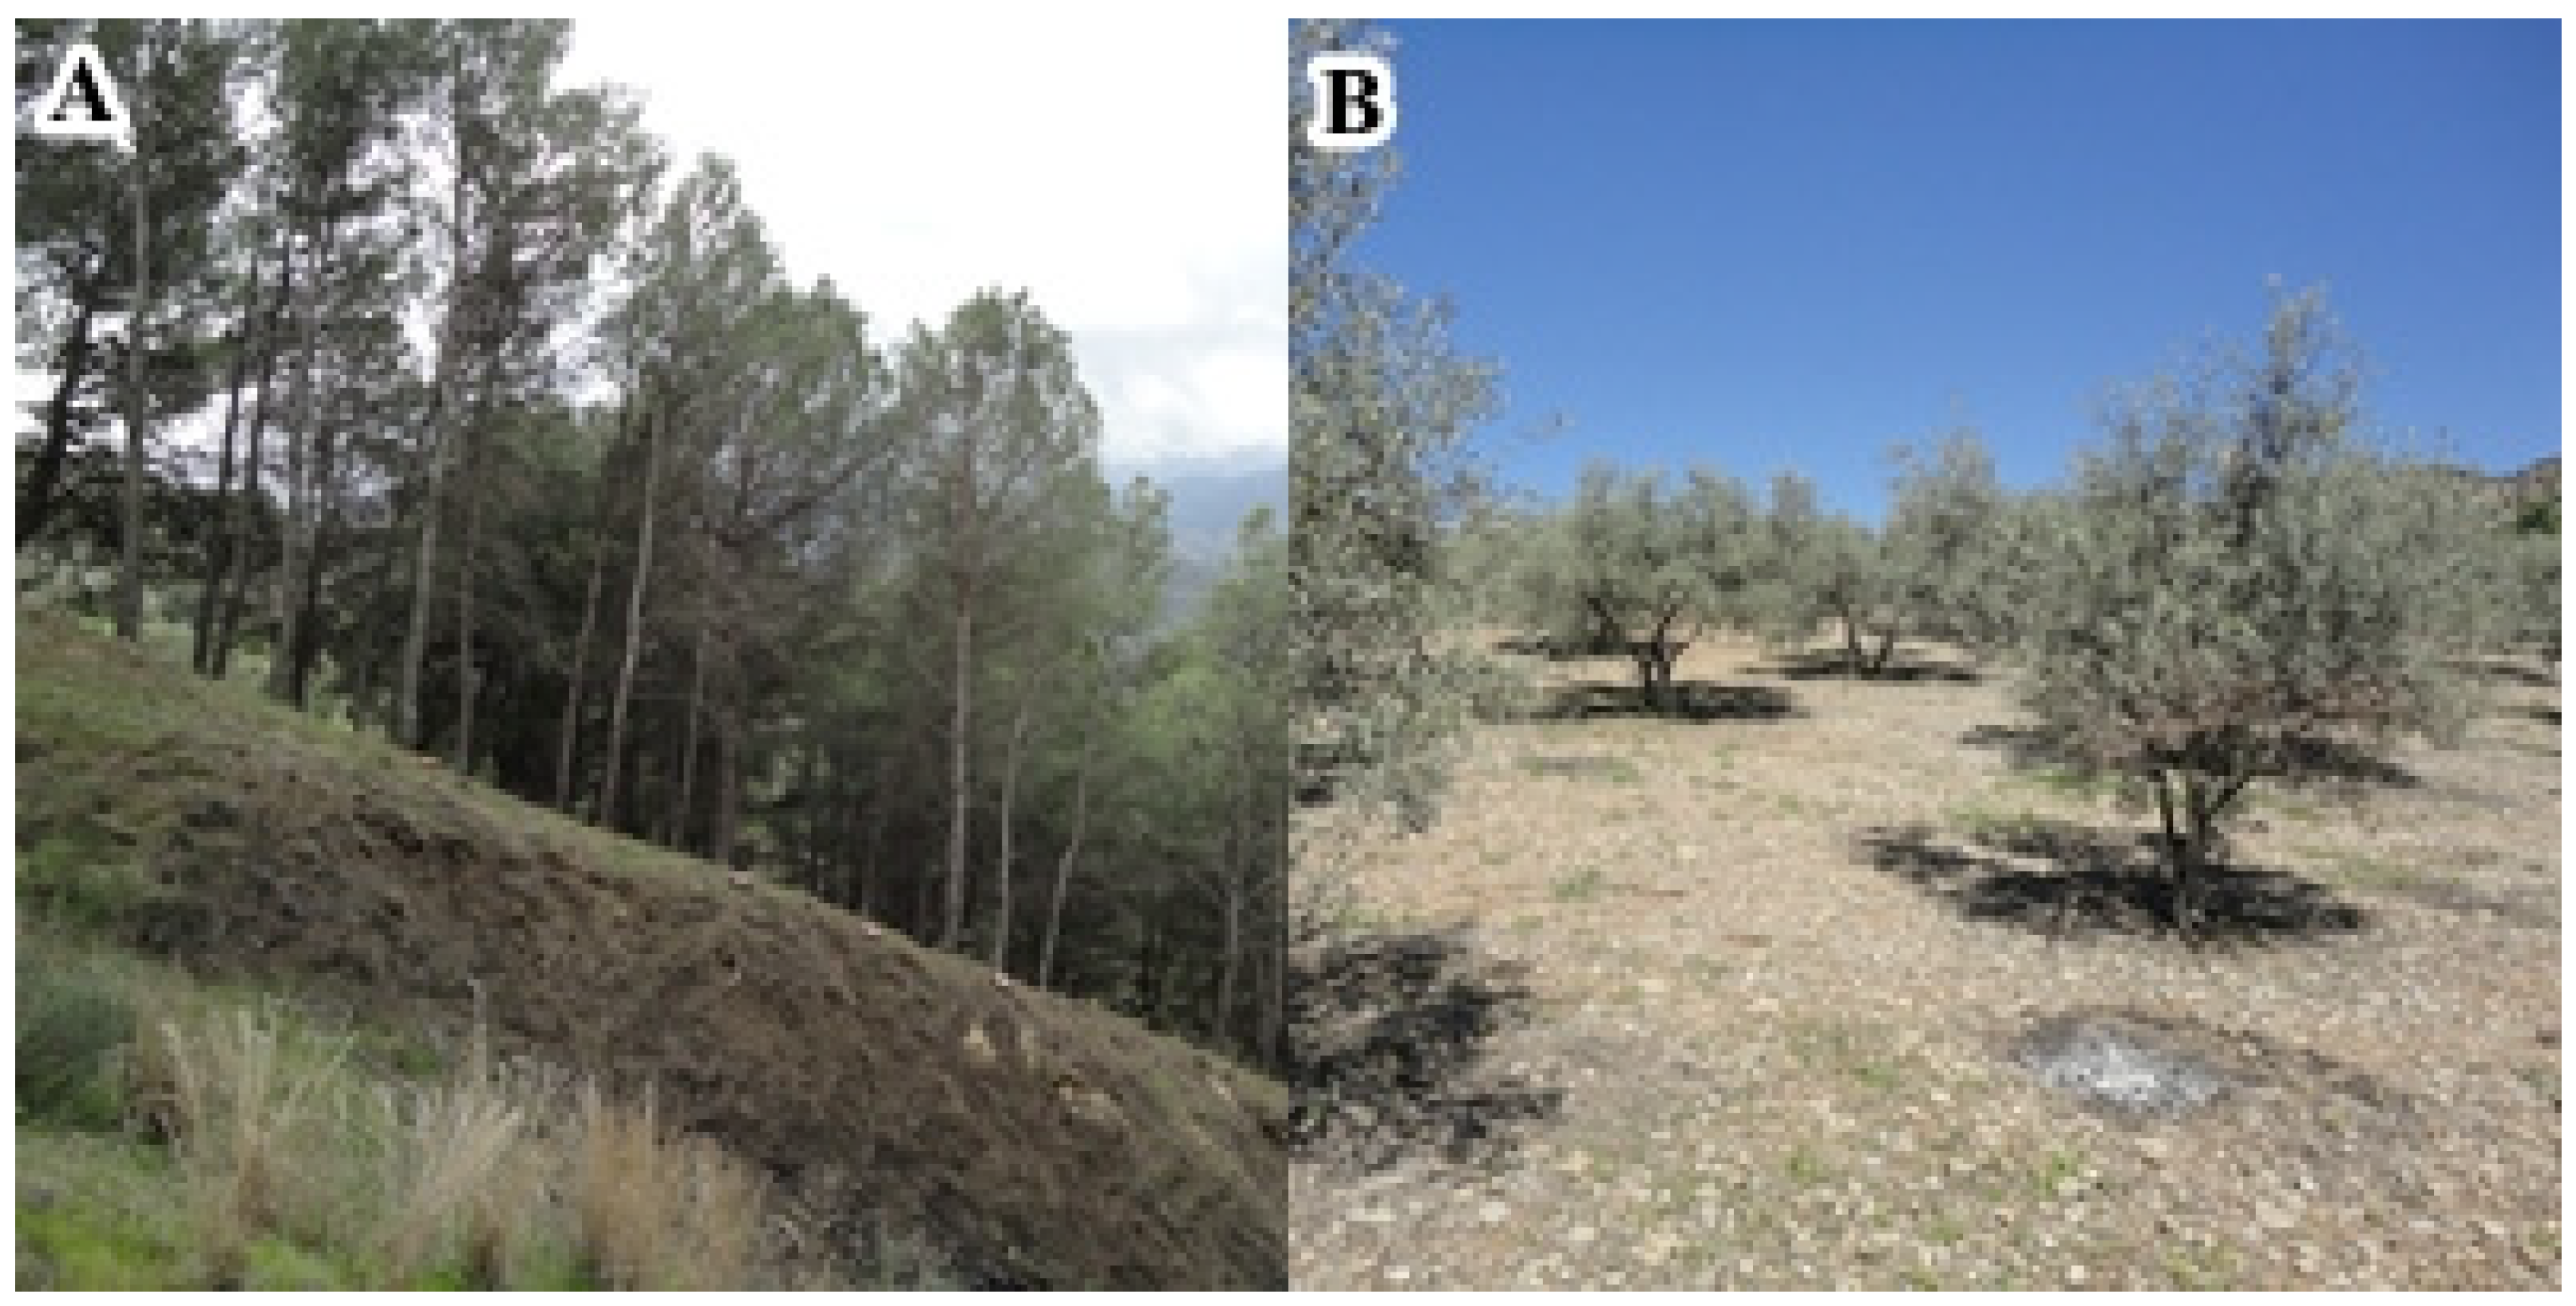
The results obtained reflect trends observed in the two watersheds. In the GR watershed, areas of high soil quality typically correspond to areas where revegetation processes have occurred from 1956 to the present [35], facilitated by the high levels of annual rainfall [70] associated with the sub-humid Mediterranean climate in this area. This climatic factor has clearly been essential to the increase in biomass, which leads to a greater supply of organic matter to the soil [71]. Field work for validation of the SQI (Figure 6) showed evidence for these processes in the GR watershed, which has extensive areas of fertile soil and few areas subject to erosive processes.
In contrast, no increase in biomass has occurred in recent decades in the BE watershed [35]. The dry Mediterranean climate of this area reflects its greater fragility because of the low availability of water [34]. Thus, factors related to water largely control the landscape dynamics in the BE watershed [48], and result in low edaphic quality, especially in the southern half.
The field work enabled the validation of the SQI formula proposed for the Mediterranean area, with areas classified as poor quality according to the SQI having compact soils and a shallow horizon, and sparse and poor vegetation cover (Figure 6).
4. Conclusions
As major findings of the study, the indicators selected for the formulation of the SQI reflected the current landscape dynamics of the area of study, and field work validated the state of the soil as indicated by the SQI. Thus, this index provides a useful tool for assessing the quality and health of soil in the Mediterranean area in a specific time frame. Furthermore, in the study area, SQI reproduced the evolution of vegetation cover in the GR watershed, where, high soil quality was common as a result of the optimal values for organic factors in the soil. On the other hand, the SQI for the BE watershed highlighted the importance of water, the relative absence of which was manifest in this area having lower soil quality than in the GR watershed. This study clearly demonstrates the need to take specific measures to remediate areas of poor soil quality by designing and implementing strategies that favor and improve its quality. In this regard, preserving seasonal vegetation, building infrastructures to mitigate erosion processes and reducing the use of fertilizer may be some of these actions.
Author Contributions
Conceptualization, P.H.-G. and J.A.S.-M.; methodology, J.A.S.-M. and J.D.R.-S.; resources, J.A.S.-M., P.H.-G. and J.D.R.-S.; data curation, J.A.S.-M. and J.D.R.-S.; formal analysis, J.A.S.-M., writing—original draft preparation, J.A.S.-M. and P.H.-G.; writing—review and editing, J.A.S.-M., P.H.-G., J.D.R.-S.; supervision, J.D.R.-S. All authors have read and agreed to the published version of the manuscript.
Funding
This research received no external funding.
Acknowledgments
This research was part of the research project “Incidence of global change in contrasting Mediterranean landscapes. GLOMED-LAND” (CSO2016-75898-P), financed by the Ministry of Economy and Competitiveness.
Conflicts of Interest
The authors declare no conflict of interest.
References
- Huang, J.; Yu, H.; Guan, X.; Wang, G.; Guo, R. Accelerated dryland expansion under climate change. Nat. Clim. Chang. 2016, 6, 166–171. [Google Scholar] [CrossRef]
- Reynolds, J.F.; Smith, D.M.S.; Lambin, E.F.; Turner, B.L.; Mortimore, M.; Batterbury, S.P.; Downing, T.E.; Dowlatabadi, H.; Fernandez, R.J.; Herrick, J.E.; et al. Global desertification: Building a science for dryland development. Science 2007, 316, 847–851. [Google Scholar] [CrossRef] [PubMed] [Green Version]
- Muñoz-Rojas, M.; Abd-Elmabod, S.K.; Zavala, L.M.; De la Rosa, D.; Jordán, A. Climate change impacts on soil organic carbon stocks of Mediterranean agricultural areas: A case study in Northern Egypt. Agric. Ecosyst. Environ. 2017, 238, 142–152. [Google Scholar] [CrossRef]
- COM. Towards a Thematic Strategy for Soil Production; Communication form the Commission to the Council, the European Parliament, the Economic and Social Committee and the Committee and the Committee of the Regions; Commission of the European Communities: Brussels, Belgium, 2002. [Google Scholar]
- Hueso-González, P.; Muñoz-Rojas, M.; Martínez-Murillo, J. The role of organic amendments in drylands restoration. Curr. Opin. Environ. Sci. Health 2018, 5, 1–6. [Google Scholar] [CrossRef]
- Eaton, J.M.; McGoff, N.M.; Byrne, K.A.; Leahy, P.; Kiely, G. Land cover change and soil organic C stocks in the Republic of Ireland 1851–2000. Clim. Chang. 2008, 91, 317–334. [Google Scholar] [CrossRef]
- Hueso-González, P.; Martínez-Murillo, J.F.; Ruiz Sinoga, J.D. Effects of topsoil treatments on afforestation in a dry-Mediterranean climate (Southern Spain). Solid Earth. 2016, 7, 1479–1489. [Google Scholar] [CrossRef] [Green Version]
- Jiménez, M.N.; Fernández, E.; Ripoll, M.A.; Castro, J.; Huntsinger, L.; Bruno, F. Stones and organic mulches improve the Quercus ilex L. afforestation success under Mediterranean climatic conditions. Land Degrad. Dev. 2013, 27, 357–365. [Google Scholar] [CrossRef]
- Tesfahunegn, G.B. Soil quality indicators response to land use and soil management systems in Northern Ethiopia’s Catchment. Land Degrad. Dev. 2013, 27, 438–448. [Google Scholar] [CrossRef]
- Imeson, A.C.; Vis, M. Factors influencing the aggregate stability of soils in natural and semi-natural ecosystems at different altitudes in the Central Cordillera of Colombia. Z. Für Geomorphol. 1982, 44, 94–105. [Google Scholar]
- Lavee, H.; Imeson, A.C.; Sarah, P. The impact of climate change on geomorphology and desertification along a Mediterranean arid transect. Land Degrad. Dev. 1998, 9, 407–422. [Google Scholar] [CrossRef]
- Tisdall, J.M.; Oades, J.M. Organic matter and water stable aggregates in soils. J. Soil Sci. 1982, 3, 141–163. [Google Scholar] [CrossRef]
- Lavee, H.; Imeson, A.C.; Pariente, S.; Benyamini, Y. The response of soils to simulated rainfall along a climatological gradient in an arid and semi-arid region. Catena Supp. 1991, 19, 19–37. [Google Scholar]
- Dunne, T.; Zhang, W.; Aubry, B. Effects of Rainfall, Vegetation, and Microtopography on Infiltration and Runoff. Water Resour. Res. 1991, 27, 2271–2285. [Google Scholar] [CrossRef]
- Dilly, O.; Pompili, L.; Benedetti, A. Soil micro-biological indicators separated land use practices in contrast to abiotic soil properties at the 50 km scale under summer warm Mediterranean climate in northern Italy. Ecol. Indic. 2018, 84, 298–303. [Google Scholar] [CrossRef]
- Arnold, R.W.; Szabolcs, I.; Targulian, V.O. Global Soil Change: Report of an International Institute for Applied System Analysis, International Society of Soil Science, United Nations Environmental Programme: Task Force on the Role of Soil in Global Change; International Society of Soil Science, UNEP: Laxenburg, Austria, 1990; pp. 1–110. [Google Scholar]
- Nosrati, K.; Collins, A. A soil quality index for evaluation of degradation under land use and soil erosion categories in a small mountainous catchment, Iran. J. Mt. Sci. 2019, 16, 2577–2590. [Google Scholar] [CrossRef]
- Vilček, J.; Koco, S. Integrated index of agricultural soil quality in Slovakia. J. Maps 2018, 14, 68–76. [Google Scholar] [CrossRef]
- Koellner, T.; de Baan, L.; Beck, T.; Brandão, M.; Civit, B.; Margni, M.; i Canals, L.; Saad, R.; de Souza, D.; Müller-Wenk, R. UNEP-SETAC guideline on global land use impact assessment on biodiversity and ecosystem services in LCA. Int. J. Life Cycle Assess. 2013, 18, 1188–1202. [Google Scholar] [CrossRef] [Green Version]
- De Andrade-Barbosa, M.; de Sousa-Ferraz, R.L.; Coutinho, E.L.M.; Coutinho-Neto, A.M.; Silveira-da Silva, M.K.; Fernandes, C.; Everlon, R. Multivariate analysis and modeling of soil quality indicators in long-term management systems. Sci. Total Environ. 2019, 657, 457–465. [Google Scholar] [CrossRef]
- Navarro, A.; Figueroa, B.; Martínez, M.; González, F.; Osuna, E.S. Indicadores físicos del suelo bajo labranza de conservación y su relación con el rendimiento de tres cultivos. Agric. Tec. Mex. 2008, 34, 151. [Google Scholar]
- SQI-Soil Quality Institute. Indicators for Soil Quality Evaluation. In USDA Natural Resources Conservation Service; The National Soil Survey Center/the Soil Quality Institute, NRCS, USDA/the National Soil Tilth Laboratory, Agricultural Research Service: Washington, DC, USA, 1996. [Google Scholar]
- Karlen, D.; Mausbach, M.; Doran, J.; Cline, R.; Harris, R.; Schuman, G. Soil quality: A concept, definition, and framework for evaluation. Soil Sci. Soc. Am. J. 1997, 61, 4–10. [Google Scholar] [CrossRef] [Green Version]
- Zornoza, R.; Mataix-Solera, J.; Guerrero, C.; Arcenegui, V.; García-Orenes, F.; Mataix-Beneyto, J.; Morugán, A. Evaluation of soil quality using multiple lineal regression based on physical, chemical, and biochemical properties. Sci. Total Environ. 2007, 378, 233–237. [Google Scholar] [CrossRef] [PubMed]
- Colás, A.; Cairo, P.; Machado, J.; Ruiz, Y.; Torres, P.; Dávila, A. Análisis multivariado de las propiedades de un suelo Ferralítico Rojo (Oxisol), como base para la selección de indicadores de calidad. Cent. Agric. 2008, 35, 17–24. [Google Scholar]
- Eastman, J.R. IDRISI® Selva. Guía para SIG y Procesamiento de Imágenes, Manual Versión 17; Clark University: Worcester, MA, USA, 2012. [Google Scholar]
- Joshua, J.K.; Nneoma, A.C.; Jajere, A.; Ahmed, A.J. Land suitability analysis for agricultural planning using GIS and multicriteria decision analysis approach in greater Karu urban area, Nasarawa State-Nigeria. AJAST 2013, 1, 14–23. [Google Scholar]
- Kumar, T.; Jhariya, D.C. Land quality index assessment for agricultural purpose using multi-criteria decision analysis (MCDA). Geocarto Int. 2015, 30, 822–841. [Google Scholar] [CrossRef]
- Voogd, H. Multicriteria Evaluation for Urban and Regional Planning; Pion Ltd.: London, UK, 1983. [Google Scholar]
- Gómez, M.; Barredo, J.I. Sistemas de Información Geográfica y Evaluación Multicriterio en la Ordenación del Territorio; Ra-Ma: Madrid, Spain, 2005. [Google Scholar]
- Belenguer-Plomer, M.A. Detección de problemas en la localización de usos del suelo mediante SIG y AHP: El caso de Riba-Roja de Túria (Valencia). GeoFocus 2016, 18, 3–24. [Google Scholar] [CrossRef]
- Lamelas, M.T. Esquema metodológico para la toma de decisiones sobre el uso sostenible del suelo: Aplicación a la localización de suelo industrial. GeoFocus 2009, 9, 28–66. [Google Scholar]
- Da Silva, C.J.; Cardozo, O.D. Evaluación multicriterio y Sistemas de Información Geográfica aplicados a la definición de espacios potenciales para uso del suelo residencial en Resistencia (Argentina). GeoFocus 2015, 16, 23–40. [Google Scholar]
- Ruiz-Sinoga, J.D.; Romero-Díaz, A. Soil degradation factors along a Mediterranean pluviometric gradient in Southern Spain. Geomorphology 2010, 118, 359–368. [Google Scholar] [CrossRef]
- Martínez-Murillo, J.F.; Remond, R.; Ruiz-Sinoga, J.D. Validation of RUSLE K factor using aggregate stability in contrasted mediterranean eco-geomorphological landscapes (southern Spain). Environ. Res. 2020, 183, 109160. [Google Scholar] [CrossRef]
- Marañés, A.; Sánchez, J.A.; De Haro, S.; Sánchez, S.T.; Lozano, F.J. Análisis de Suelo, Metodología e Interpretación; Servicio de Publicaciones de la Universidad de Almería: Almería, Spain, 1994. [Google Scholar]
- Guitián, F.; Carballas, T. Técnicas de Análisis de Suelos; Pico-Sacro: Santiago, Chile, 1976; ISBN 84-85170-09-1. [Google Scholar]
- Townend, J.; Reeve, M.J.; Carter, A. Water release characteristic. In Soil and Environmental Analysis, Physical Methods; Smith, K.A., Mullins, C.E., Eds.; Marcel Dekker: New York, NY, USA, 2001; Chapter 3; pp. 95–140. [Google Scholar]
- Kemper, W.D.; Rosenau, R.C. Aggregate stability and size distribution. In Methods of Soil Analysis, Part 1, 2nd ed.; Agronomy Monograph 9; Klute, A., Ed.; American Society of Agronomy: Madison, WI, USA, 1986; pp. 425–442. [Google Scholar]
- Watson, C.L.; Letey, J. Indices for characterizing soil-water repellency based upon contact angle-surface tension relationships. Soil Sci. Soc. Am. Proc. 1970, 34, 841–844. [Google Scholar] [CrossRef]
- Doerr, S.H.; Dekker, L.W.; Ritsema, C.J.; Shakesby, R.A.; Bryant, R. Water repellency of soils: The influence of ambient relative humidity. Soil Sci. Soc. Am. J. 2002, 66, 401–405. [Google Scholar] [CrossRef]
- USDA. Diagnóstico y Rehabilitación de Suelos Salinos y Sódicos; Limusa: Nuevo Leon, México, 1973; p. 172. [Google Scholar]
- Van Reeuwijk, L.P. Procedures for Soil Analysis, 6th ed.; ISRIC (International Soil Reference and Information Centre): Wageningen, The Netherlands, 2002; p. 120. [Google Scholar]
- Reynolds, W.D.; Elrick, D.E.; Youngs, E.G.; Amoozegar, A.; Booltink, H.W.G.; Bouma, J. Saturated and field-saturated water flow parameters. In Methods of Soil Analysis; Part 4 Physical Methods; Soil Science Society of America: Madison, WI, USA, 2002; pp. 797–878. [Google Scholar]
- Wischmeier, W.H.; Smith, D.D. Predicting rainfall erosion losser. In USDA Agricultural Research Service Handbook; USDA: Washington, DC, USA, 1978; p. 537. [Google Scholar]
- Reynolds, W.D.; Vieira, S.R.; Topp, G.C. An assessment of the single-head analysis for the constant head well permeameter. Can. J. Soil Sci. 1992, 72, 489–501. [Google Scholar] [CrossRef]
- Van der Knijff, J.M.; Jones, R.J.A.; Montanarella, L. Soil Erosion Risk Assessment in Europe; European Soil Bureau. Joint Research Centre: Isapra, Italy, 2000. [Google Scholar]
- Sillero-Medina, J.A.; Pérez-González, M.E.; Martínez-Murillo, J.F.; Ruiz-Sinoga, J.D. Factors affecting eco-geomorphological dynamics in two contrasting Mediterranean environments. Geomorphology 2020, 352. [Google Scholar] [CrossRef]
- Doran, J.W.; Safley, M. Defining and assessing soil health and sustainable productivity. In Biological Indicators of Soil Health; Pankhurst, C., BM Doube & VVSR Gupta, Eds.; CAB International: Wallingford, UK, 1997; pp. 1–28. [Google Scholar]
- Andrews, S.S.; Karlen, D.L.; Mitchell, J.P. A comparison of soil quality indexing methods for vegetable production systems in Northern California. Agric. Ecosyst. Environ. 2002, 90, 25–45. [Google Scholar] [CrossRef]
- IBM Corp. IBM SPSS Statistics for Windows, Version 25.0; IBM: Armonk, NY, USA, 2017. [Google Scholar]
- Cantú, M.P.; Becker, A.; Bedano, J.C.; Schiavo, H.F. Evaluación de la calidad de suelos mediante el uso de indicadores e índices. Ciencia del Suelo 2007, 25, 173–178. [Google Scholar]
- García, Y.; Ramírez, W.; Sánchez, S. Indicadores de la calidad de los suelos: Una nueva manera de evaluar este recurso. Pastos Forrajes 2012, 35, 125–138. [Google Scholar]
- Doran, J.W.; Parkin, B.T. Defining Soil Quality for a Sustainable Environment; Soil Science Society of America: Madison, WI, USA, 1994; p. 35. [Google Scholar]
- Seybold, C.A.; Mausbach, M.J.; Karlen, D.L.; Rogers, H.H. Quantification of Soil Quality. In Soil Process and the Carbon Cycle; Lal, R., Kimble, J.M., Follet, R.F., y Stewart, B.A., Eds.; CRC Press: Boca Raton, FL, USA, 1997; pp. 387–403. [Google Scholar]
- Nosrati, K. Assessing soil quality indicator under different land use and soil erosion using multivariate statistical techniques. Environ. Monit. Assess. 2013, 185, 2895–2907. [Google Scholar] [CrossRef]
- Bautista, A.; Etchevers, J.; Castillo, R.F.; Gutiérrez, C. La calidad del suelo y sus indicadores. Ecosistemas 2004, 13, 90–97. [Google Scholar]
- Labrador, J. Manejo del suelo en los sistemas agrícolas de producción ecológica. In Manual Técnico Manejo del Suelo en los Sistemas de Producción Ecológica; Sociedad Española de Agricultura Ecológica: Catarroja, Spain, 2008. [Google Scholar]
- Singer, M.J.; Ewing, S. Soil Quality. In Handbook of Soil Science; Sumner, M.E., Ed.; CRC Press: Boca Raton, FL, USA, 2000; Chapter 11; pp. 271–298. [Google Scholar]
- Gregorich, E.G.; Carter, M.R.; Angers, D.A.; Monreal, C.M.; Ellert, B.H. Towards a minimum data set to asses soil organic matter quality in agricultural soils. Can. J. Soil Sci. 1994, 74, 367–385. [Google Scholar] [CrossRef] [Green Version]
- Savenije, H.H.G. The importance of interception and why we should delete the term evapotranspiration from our vocabulary. Hydrol. Process. 2004, 18, 1507–1511. [Google Scholar] [CrossRef]
- Pugnaire, F.I.; Luque, M.T.; Armas, C.; Gutiérraz, L. Colonization processes in semi-arid Mediterranean old fields. J. Arid Environ. 2006, 65, 591–603. [Google Scholar] [CrossRef]
- Ruiz-Sinoga, J.D.; Martínez-Murillo, J.F. Respuesta eco-hidrológica de los suelos en campos abandonados. (Sur de España). Cuad. Investig. Geogr. 2012, 38, 31–51. [Google Scholar] [CrossRef] [Green Version]
- Bhat, J.A.; Kundu, M.C.; Hazra, G.C.; Santra, G.H.; Mandal, B. Rehabilitating acid soils for increasing crop productivity through low-cost liming material. Sci. Total Environ. 2010, 408, 4346–4353. [Google Scholar] [CrossRef]
- Belmonte-Serrato, F.; Ruiz-Sinoga, J.D.; Romero-Díaz, A.; Martínez-Hernández, C.; Robledano-Aymerich, F. Medida de la conductividad hidráulica mediante infiltrómetros de minidisco en suelos agrícolas cultivados y en abandono (Región de Murcia). In Espacios Insulares y de Frontera, una Visión Geográfica; Universitat de les Illes Balears: Palma de Mallorca, Spain, 2013; pp. 287–296. ISBN 978-84-616-6533-4. [Google Scholar]
- Delgado-Iniesta, M.J.; Belmonte-Serrato, F.; López-Bermúdez, F. Relaciones entre estabilidad de agregados y propiedades físicas y químicas de los suelos en un ambiente mediterráneo semiárido. Cuatern. Geomorfol. 2000, 14, 35–45. [Google Scholar]
- Pérez-Cutillas, P.; Cataldo, M.; Zema, D.A.; de Vente, J.; Boix-Fayos, C. Efectos de la revegetación a escala de cuenca sobre el caudal y la evapotranspiración en ambiente mediterráneo. Cuenca del Taibilla (SE de España). Bosque 2018, 39, 119–129. [Google Scholar] [CrossRef] [Green Version]
- Halifa-Marín, A.; Pérez-Cutillas, P.; Almagro, M.; Martínez-Mena, M.; Boix-Fayos, C. Dinámica geomorfológica fluvial y cambios de usos del suelo: Impacto en los reservorios de carbono de suelos y sedimentos. Bosque (Valdivia) 2019, 40, 3–16. [Google Scholar] [CrossRef]
- Pérez-González, M.E.; Sillero-Medina, J.A.; Ruiz-Sinoga, J.D. Evolución de usos del suelo y vulnerabilidad a partir de imágenes de satélite en el mediterráneo sur peninsular. XVI Coloquio Ibérico de Geografía—Península Ibérica no Mundo: Problemas e Desafíos para uma Intervençao Ativa da Geografía; SASUP: Lisboa, Portugal, 2018; pp. 1105–1113. ISBN 978-972-636-275-3. [Google Scholar]
- Sarah, P. Nonlinearity of ecogeomorphic processes along Mediterranean arid transect. Geomorphology 2004, 60, 303–317. [Google Scholar] [CrossRef]
- Lasanta, T.; Nadal-Romero, E.; Paz-Errea, J.A. The effect of landscape conservationmeasures in changing landscape patterns: A case study in Mediterranean mountains. Land Degrad. Dev. 2016, 27, 373–386. [Google Scholar] [CrossRef]
Figure 1.
Location of the study area (landscape units and sampling points). Maps show, on the one hand, the location of the study area and, on the other, the sampling points, lithological units and land use.
Figure 1.
Location of the study area (landscape units and sampling points). Maps show, on the one hand, the location of the study area and, on the other, the sampling points, lithological units and land use.

Figure 2.
Water factor in the soil quality index. Maps show the spatial distribution of each category of soil quality according to water indicators in (A) GR and (B) BE.
Figure 2.
Water factor in the soil quality index. Maps show the spatial distribution of each category of soil quality according to water indicators in (A) GR and (B) BE.

Figure 3.
Physical factor in the soil quality index. Maps display the spatial distribution of each category of soil quality according to physical indicators in (A) GR and (B) BE.
Figure 3.
Physical factor in the soil quality index. Maps display the spatial distribution of each category of soil quality according to physical indicators in (A) GR and (B) BE.

Figure 4.
Organic factor in the soil quality index. Maps display the spatial distribution of each category of soil quality according to organic indicators in (A) GR and (B) BE.
Figure 4.
Organic factor in the soil quality index. Maps display the spatial distribution of each category of soil quality according to organic indicators in (A) GR and (B) BE.

Figure 5.
Soil quality index. Maps show the spatial distribution of each soil quality category according to the full SQI in (A) GR and (B) BE.
Figure 5.
Soil quality index. Maps show the spatial distribution of each soil quality category according to the full SQI in (A) GR and (B) BE.

Figure 6.
Examples of evidence collected in the field work. (A) Very high quality in GR. (B) Very low quality in BE.
Figure 6.
Examples of evidence collected in the field work. (A) Very high quality in GR. (B) Very low quality in BE.


Table 1.
Reclassification of the average values of the different properties and indicators used. PE = Permeability, G = Gravels, S = Sands, H = Hydrophobicity, AWC = Available Water Capacity, SL = Slope, K = K Factor (RUSLE), AGS = Structural Stability, BD = Bulk Density, SOC = Soil Organic Carbon, C = Factor C (RUSLE), and EC = Electrical Conductivity.
| Water Factor (1: <1.5; 2: 1.5–1.75; 3: 1.75–2; 4: 2–2.25; 5: >2.25) | |||||
| Class | PE | G | S | H | AWC |
| 1 | 0,4 | >70% | 3–20% | - | <17% |
| 2 | 0.4–0.8 | 60–70% | 20–40% | 3–4 | 17–22% |
| 3 | - | 50–60% | 40–49% | 1–2 | >22% |
| Physical Factor (1: <1.8; 2: 1.8–2; 3: 2–2.2; 4: 2.2–2.4; 5: >2.4) | |||||
| Class | Sl | K | AGS | BD | |
| 1 | >50% | >0.6 | <30% | >1.3 | |
| 2 | 40–50% | 0.3–0.6 | 30–60% | 1.2–1.3 | |
| 3 | <40% | <0.3000 | >60% | <1.2 | |
| Organic Factor (1: <1.75; 2: 1.75–2; 3: 2–2.25; 4: 2.25–2.75; 5: >2.75) | |||||
| Class | SOC | C | EC | ||
| 1 | <3% | >0.6 | >0.25 | ||
| 2 | 3–4% | 0.3–0.6 | 0.15–0.25 | ||
| 3 | >4% | <0.3 | <0.15 | ||
Table 2.
Soil quality properties and indicators grouped.
| Water Factor | Physical Factor | Organic Factor |
|---|---|---|
|
|
|
Table 3.
Extension in percentages of the categories defined from the soil quality index (SQI) in GR and BE.
Table 3.
Extension in percentages of the categories defined from the soil quality index (SQI) in GR and BE.
| Class | GR | BE |
|---|---|---|
| Very low | - | 63.33 |
| Low | 24.78 | 4.45 |
| Medium | 21.41 | 17.08 |
| High | 19.55 | 12.63 |
| Very high | 34.26 | 2.51 |
Publisher’s Note: MDPI stays neutral with regard to jurisdictional claims in published maps and institutional affiliations. |
© 2020 by the authors. Licensee MDPI, Basel, Switzerland. This article is an open access article distributed under the terms and conditions of the Creative Commons Attribution (CC BY) license (http://creativecommons.org/licenses/by/4.0/).
Share and Cite
MDPI and ACS Style
Sillero-Medina, J.A.; Hueso-González, P.; Ruiz-Sinoga, J.D. Differences in the Soil Quality Index for Two Contrasting Mediterranean Landscapes in Southern Spain. Land 2020, 9, 405. https://0-doi-org.brum.beds.ac.uk/10.3390/land9110405
AMA Style
Sillero-Medina JA, Hueso-González P, Ruiz-Sinoga JD. Differences in the Soil Quality Index for Two Contrasting Mediterranean Landscapes in Southern Spain. Land. 2020; 9(11):405. https://0-doi-org.brum.beds.ac.uk/10.3390/land9110405
Chicago/Turabian StyleSillero-Medina, José A., Paloma Hueso-González, and José D. Ruiz-Sinoga. 2020. "Differences in the Soil Quality Index for Two Contrasting Mediterranean Landscapes in Southern Spain" Land 9, no. 11: 405. https://0-doi-org.brum.beds.ac.uk/10.3390/land9110405
Note that from the first issue of 2016, this journal uses article numbers instead of page numbers. See further details here.