Physical Crust Formation on Sandy Soils and Their Potential to Reduce Dust Emissions from Croplands
by
Heleen C. Vos
1,*, 
Wolfgang Fister
1,
Frank D. Eckardt
2,
Anthony R. Palmer
3 and
Nikolaus J. Kuhn
1 1
Physical Geography and Environmental Change Research Group, University of Basel, 4056 Basel, Switzerland
2
Department of Environmental and Geographical Sciences, University of Cape Town, Cape Town 7701, South Africa
3
Agricultural Research Council-Animal Production, Grahamstown 6140, South Africa
*
Author to whom correspondence should be addressed.
Land 2020, 9(12), 503; https://0-doi-org.brum.beds.ac.uk/10.3390/land9120503
Submission received: 11 November 2020
/
Revised: 3 December 2020
/
Accepted: 4 December 2020
/
Published: 8 December 2020
Abstract
:The sandy croplands in the Free State have been identified as one of the main dust sources in South Africa. The aim of this study was to investigate the occurrence and strength of physical soil crusts on cropland soils in the Free State, to identify the rainfall required to form a stable crust, and to test their impact on dust emissions. Crust strength was measured using a fall cone penetrometer and a torvane, while laboratory rainfall simulations were used to form experimental crusts. Dust emissions were measured with a Portable In-Situ Wind Erosion Laboratory (PI-SWERL). The laboratory rainfall simulations showed that stable crusts could be formed by 15 mm of rainfall. The PI-SWERL experiments illustrated that the PM10 emission flux of such crusts is between 0.14% and 0.26% of that of a non-crusted Luvisol and Arenosol, respectively. The presence of abraders on the crust can increase the emissions up to 4% and 8% of the non-crusted dust flux. Overall, our study shows that crusts in the field are potentially strong enough to protect the soil surfaces against wind erosion during a phase of the cropping cycle when the soil surface is not protected by plants.
1. Introduction
The emission of dust can have offsite effects on the regional and global climate [1,2,3], global geochemical fluxes [4,5], and human health [6,7]. For the emitting surface, dust emissions can lead to land degradation due to the removal of fine soil particles and organic material, especially in semi-arid and arid environments [8,9,10,11,12]. Due to these impacts, many studies have focused on assessing the sources of dust and the factors controlling dust emission [13,14,15,16]. Dust is assumed to be largely emitted from natural surfaces, in particular deserts, but dust emissions from croplands are receiving increasing attention [15,16,17,18,19,20,21,22].
The central and western parts of the Free State province in South Africa experience elevated dust emissions from croplands [15,23]. Eckardt et al. [24] showed that 70% of the Meteosat Second Generation (MSG) identified dust source points of South Africa between 2006 to 2016 are located in this province. The fine, suspended particles could have a serious impact on public health in this region. The emissions from the Free State can be attributed to commercial, rain-fed croplands with sandy soils in a semi-arid climate, which renders them very vulnerable to wind erosion [25]. It should be noted that the frequency of dust events identified for the Free State is relatively low in comparison to nearby desert regions, such as the Kalahari or the Namib desert [14,23]. However, the close proximity of these dust sources to urban centers and rural populations in the Free State and beyond may have an effect on human health and contribute to the loss of fertile soil in the source areas [6].
Wind erosion in the Free State has already been identified as both a current and a historical phenomenon [26,27]. Holmes et al. [27] emphasize that the increase in agricultural activities during the 20th century is responsible for an increase in wind erosion due to the removal of vegetation. However, only one study from Wiggs and Holmes [28] focused in detail on the interaction between wind and surface properties of agricultural fields in the Free State. Their results show that erosion of ridges and filling of furrows on bare agricultural fields without soil crusts reduce the aerodynamic roughness and, consequently, reduce threshold wind velocities. Eckardt et al. [24] showed that 85% of the 75 dust event days between 2006 and 2016 took place between August and November. However, the annual variability of dust events is dependent on drought and field cover. Without sufficient cover, soil properties and surface conditions remain the only control to dust emission in the Free State. Besides the influence of roughness and cover, the main factors that can control the emissivity are the soil texture and cohesion, which in turn is mainly controlled by the moisture content, and the presence of a physical or biological crust. Due to the regular disturbance of the surface, we only expect the formation of physical soil crusts and no presence of biological crust. In this study, we focus therefore on the possible influence of physical soil crusts as a boundary condition for dust emissions, and on how crust formation is influenced by agricultural practices.
Soil crusts are commonly considered as enhancing water erosion [29,30,31]. However, the positive influence of physical soil crusts on reducing wind erosion and dust emissions has been shown by experimental studies [32,33,34,35] as well as field measurements [36,37,38,39,40,41,42,43,44]. However, some studies also described the abrading effect of saltating particles on crusted surfaces, which results in the degradation of a crust and the emission of fine particles [32,33,34,44,45,46]. Especially for weaker crusts with a low content of fine particles, the ability of abraders to disrupt the crust appears to be very high.
This study identifies the potential significance of physical soil crusts on dust emissions from Arenosols and Luvisols, which are widespread in the semi-arid rangelands of the world [47]. We hypothesize that crusts potentially play a critical role in increasing soil cohesion and thus reducing dust emissions in the Free State. Hereby we must take the soil texture, the crust strength, the presence or absence of abraders, and the rainfall into account. To test this hypothesis, the specific aims of this study are to:
- Document the occurrence, structure, and properties of crusts on cropland during the emission season.
- Identify the constraining rainfall conditions that lead to the formation of crusts on sandy cropland soils.
- Assess the potential impact of crusts and their abrasion on dust emissions using a Portable In-Situ Wind Erosion Laboratory (PI-SWERL).
The outcome of this study has implications beyond land degradation in the Free State and the air quality and human health in South Africa because croplands on sandy soils are widespread across the globe [47,48,49,50] and often subject to wind erosion [18,51,52,53]. Findings could also have a positive impact on the potential of implementing practices that protect crusts or even enhance their formation to reduce dust emissions from sandy soils.
2. Materials and Methods
2.1. Introduction
This study consisted of three parts: (1) the field measurements of crust strength and soil sampling, (2) simulation of crust formation using laboratory rainfall, and (3) the dust emission measurements on crusts formed in the laboratory with the PI-SWERL. For both the field measurements and the laboratory rainfall experiments, the crust strength was analyzed as an indication of its resistance against wind erosion [32,38,45,54,55,56].
2.2. Site Description and Field Measurements
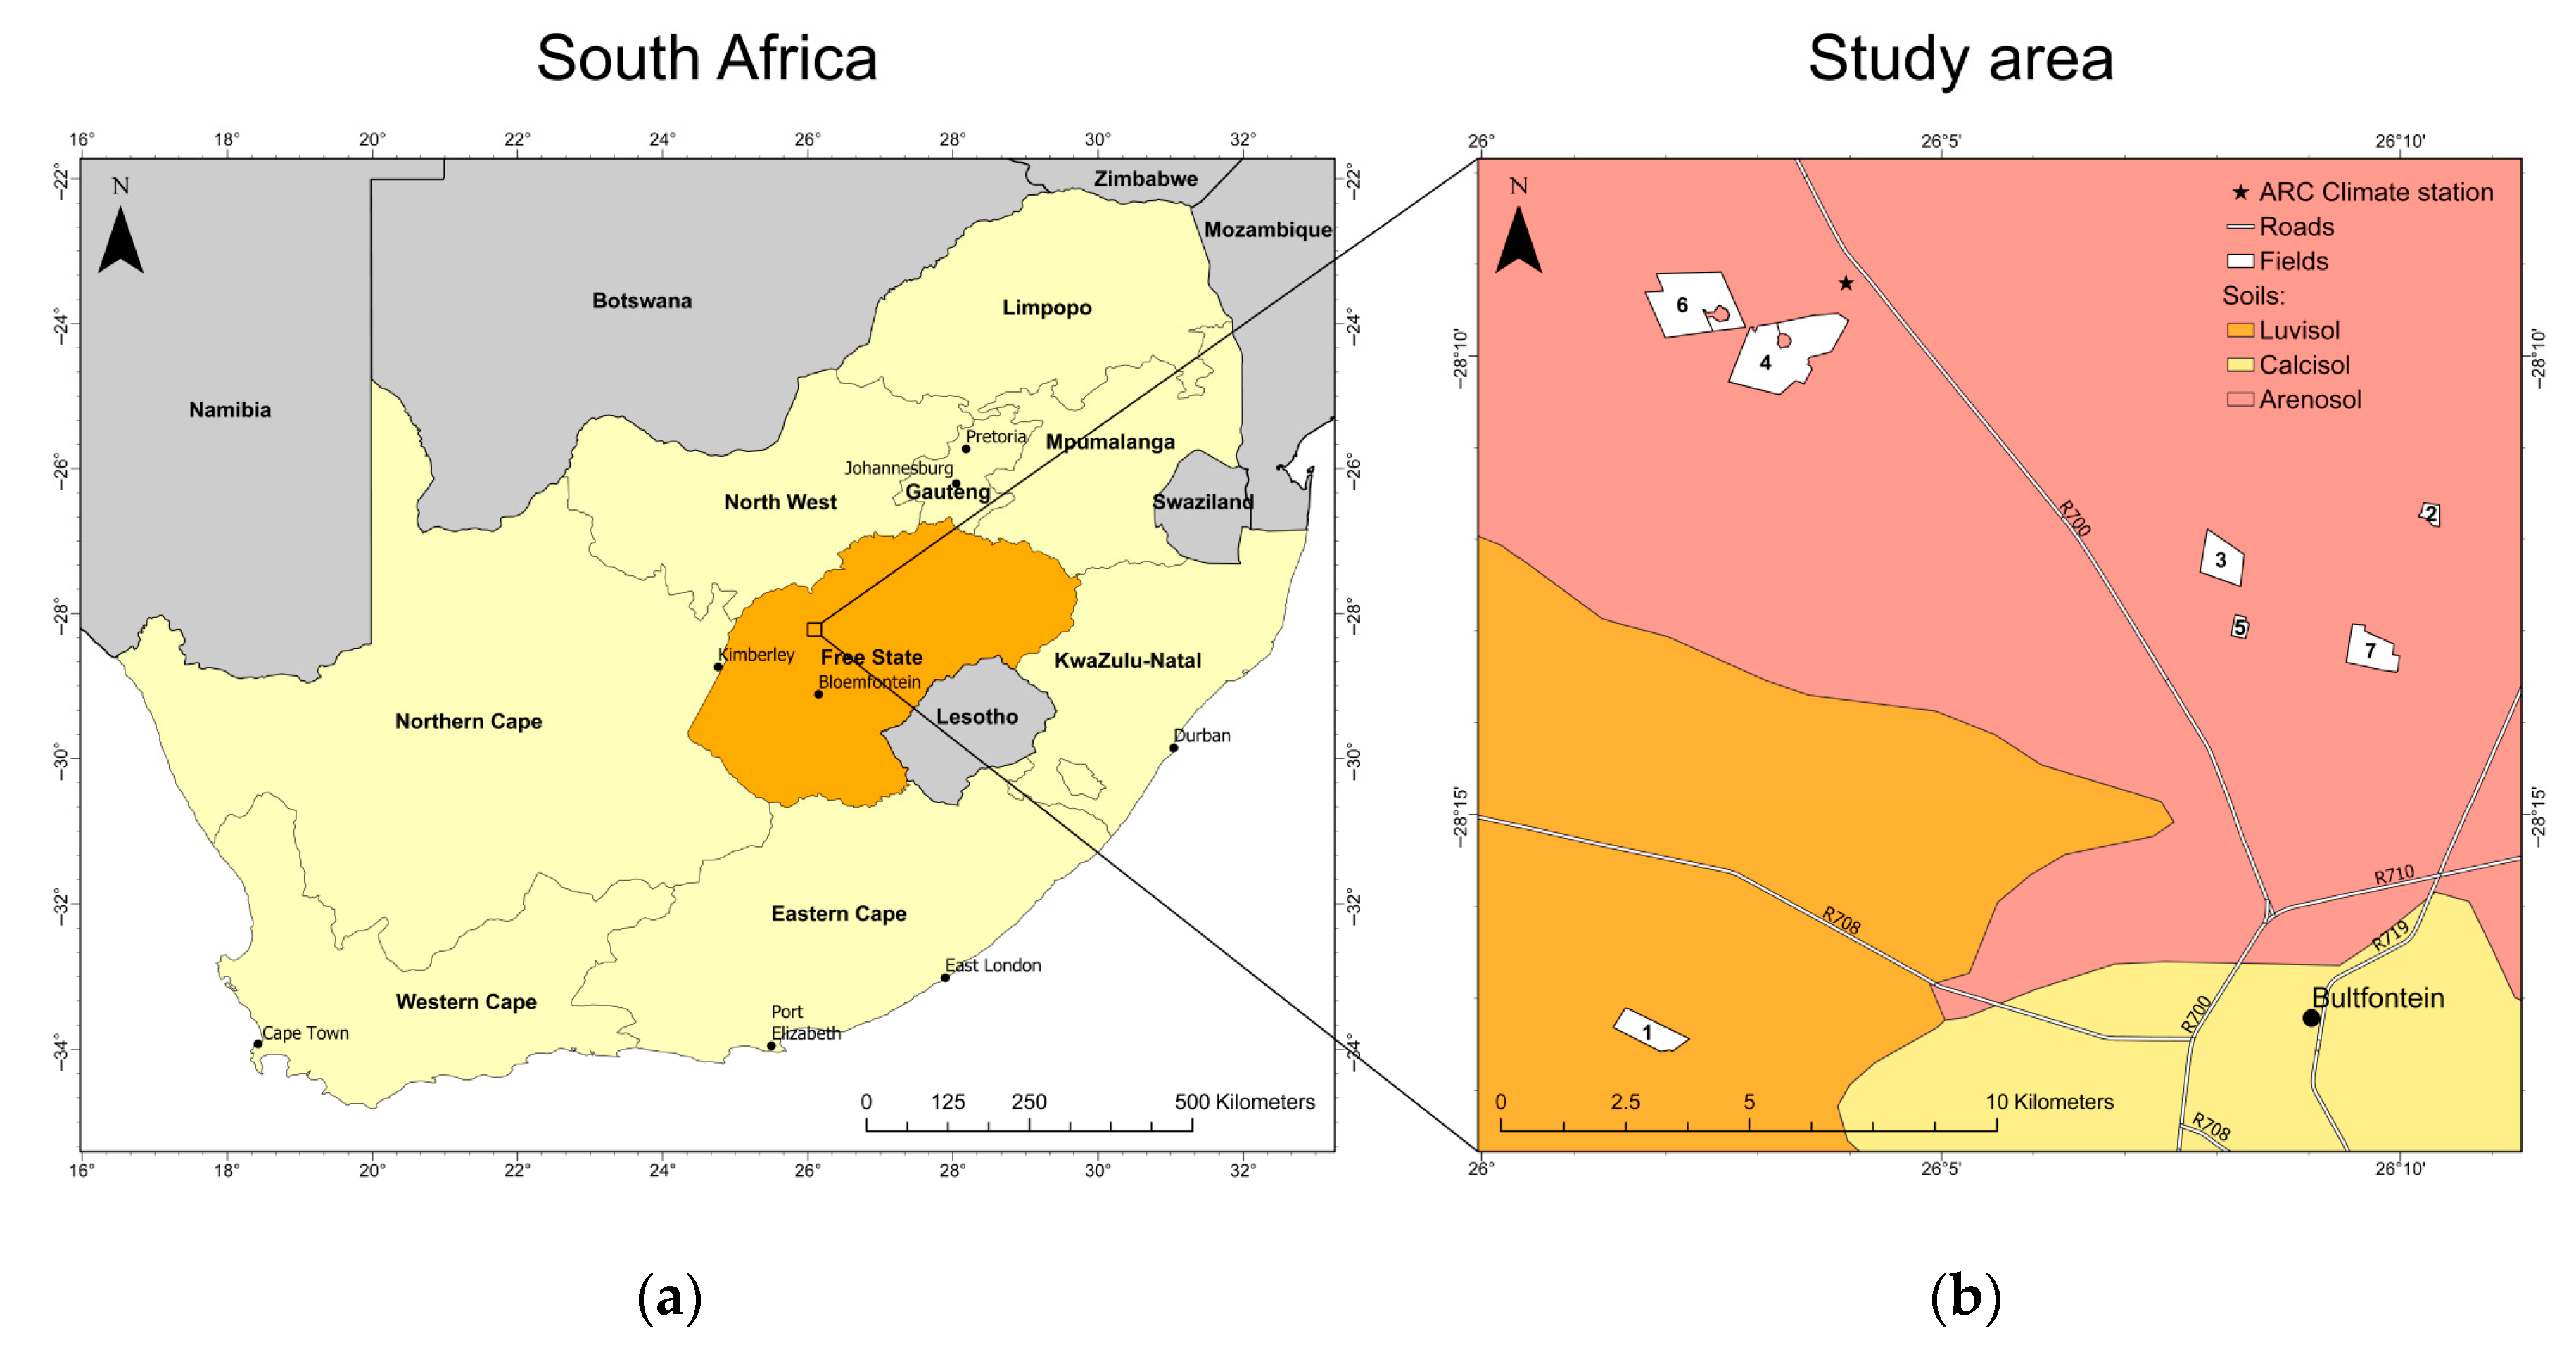
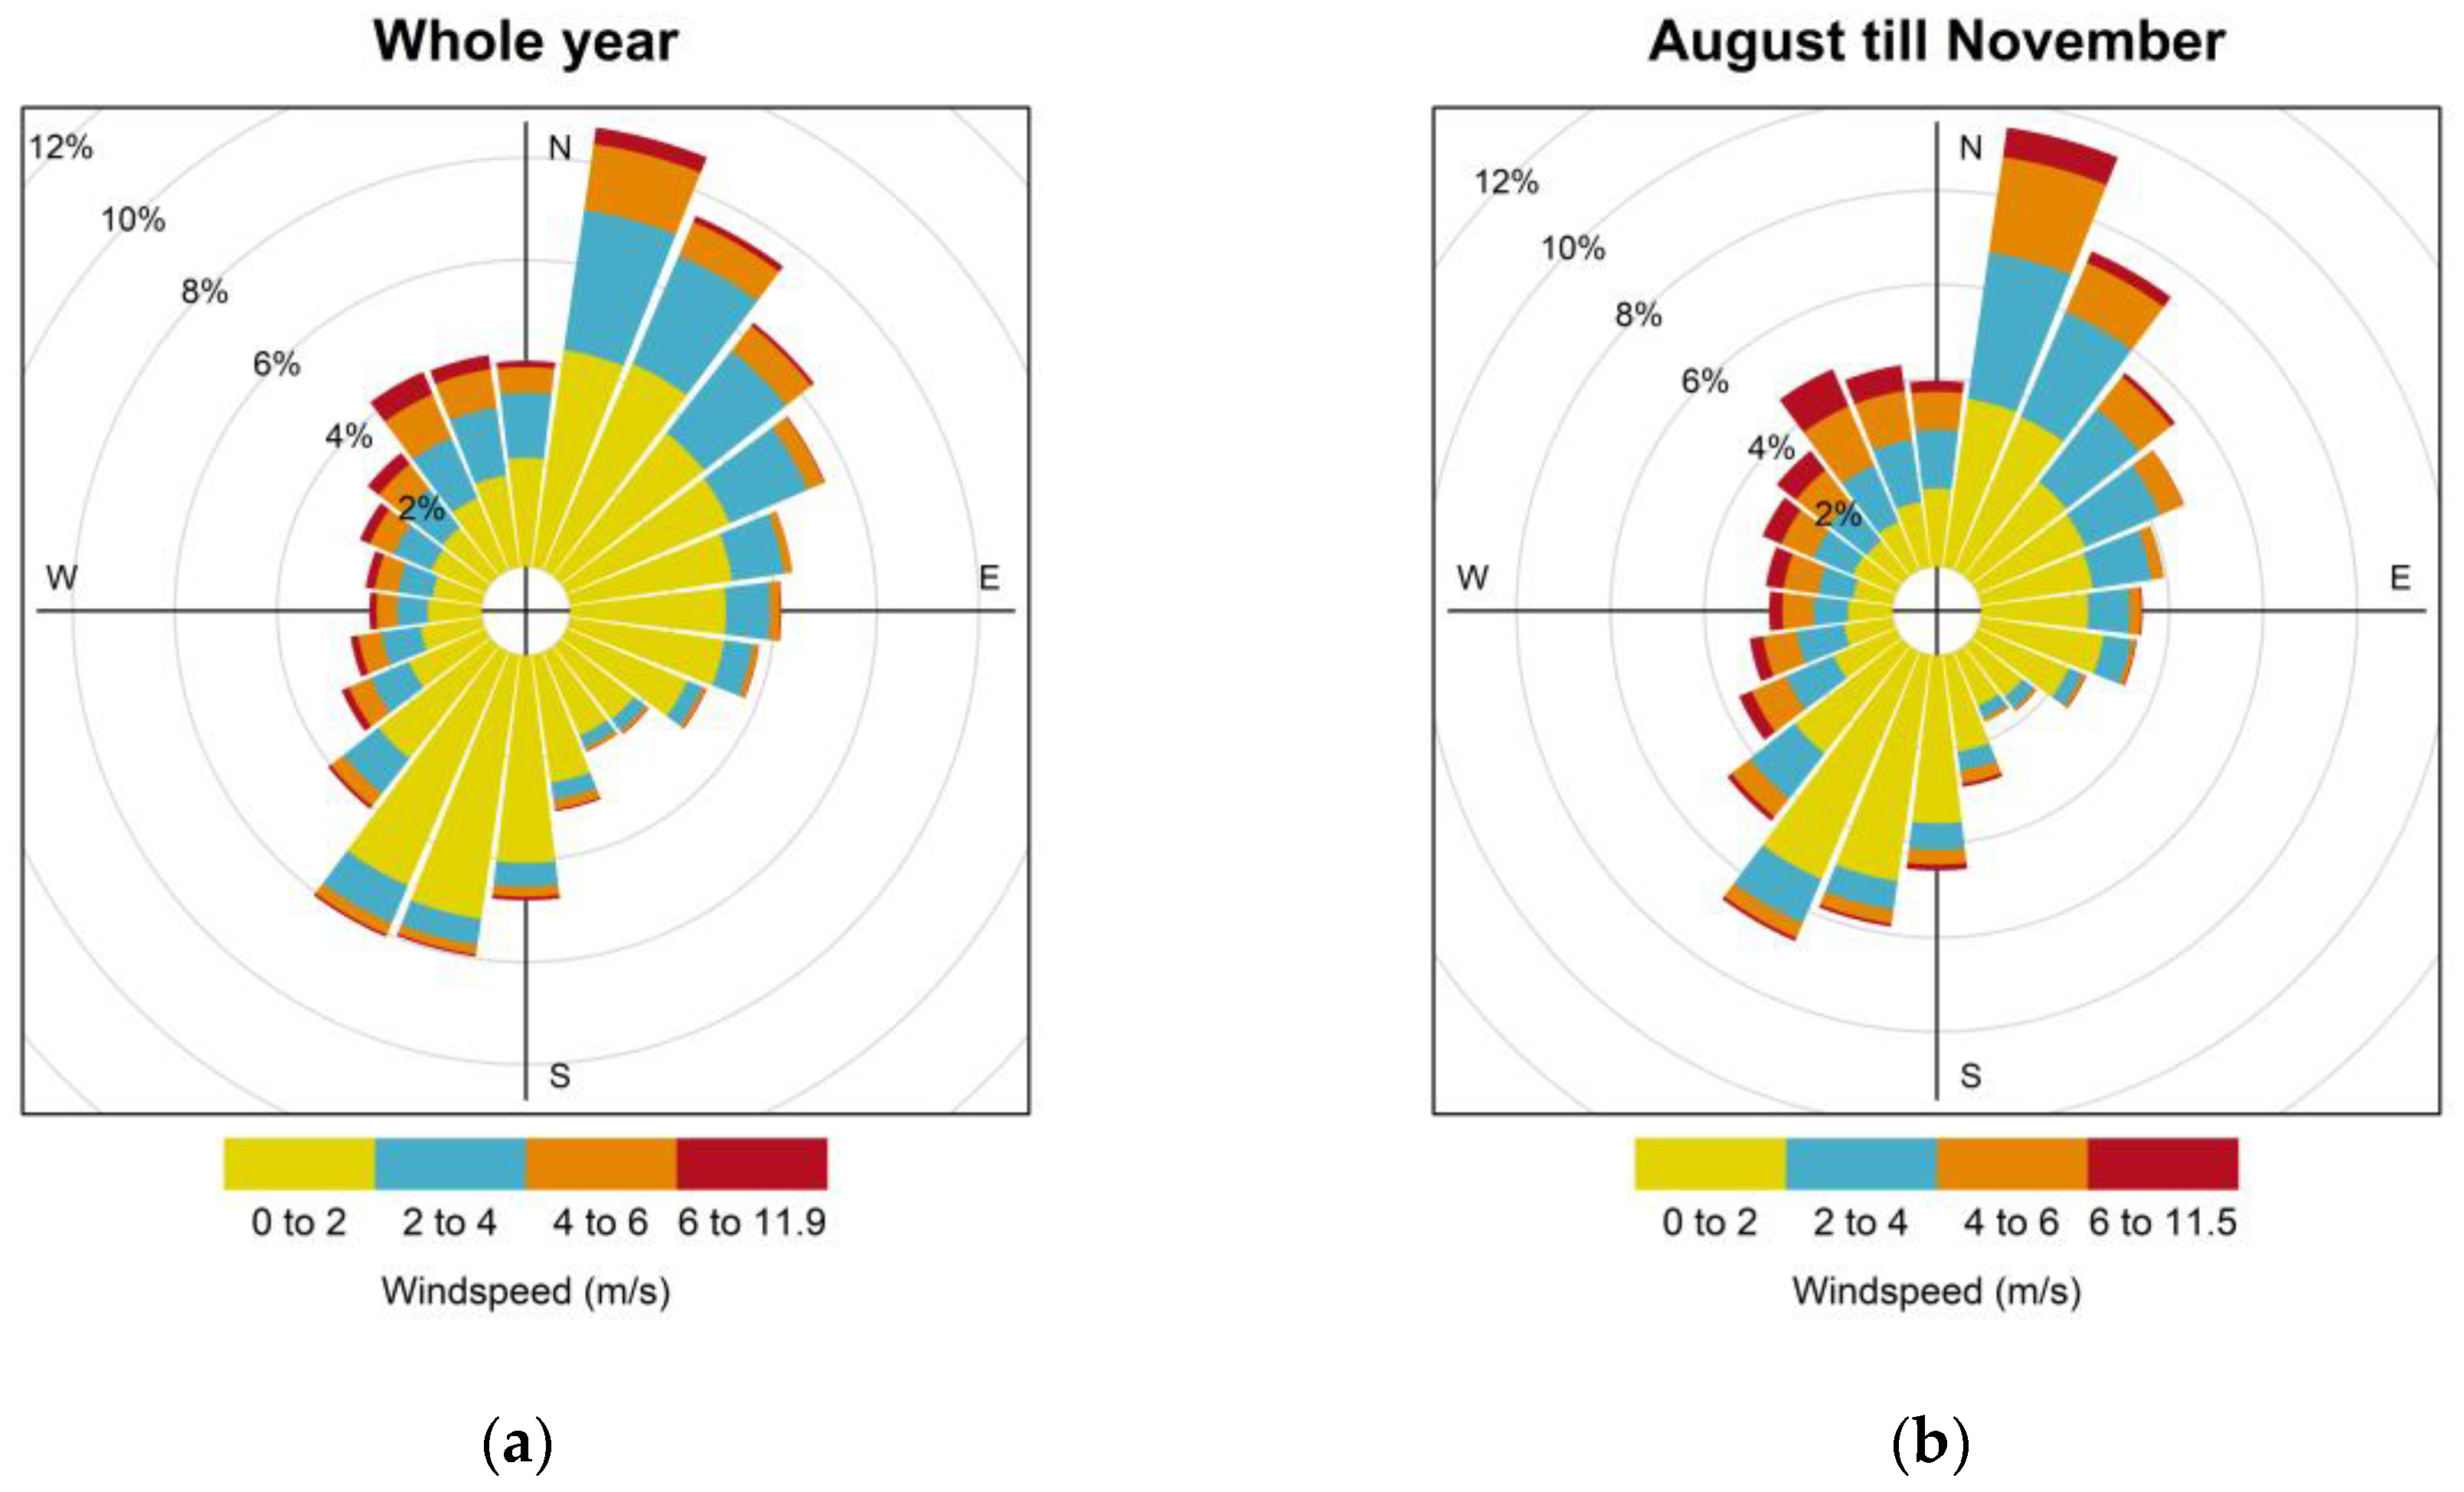
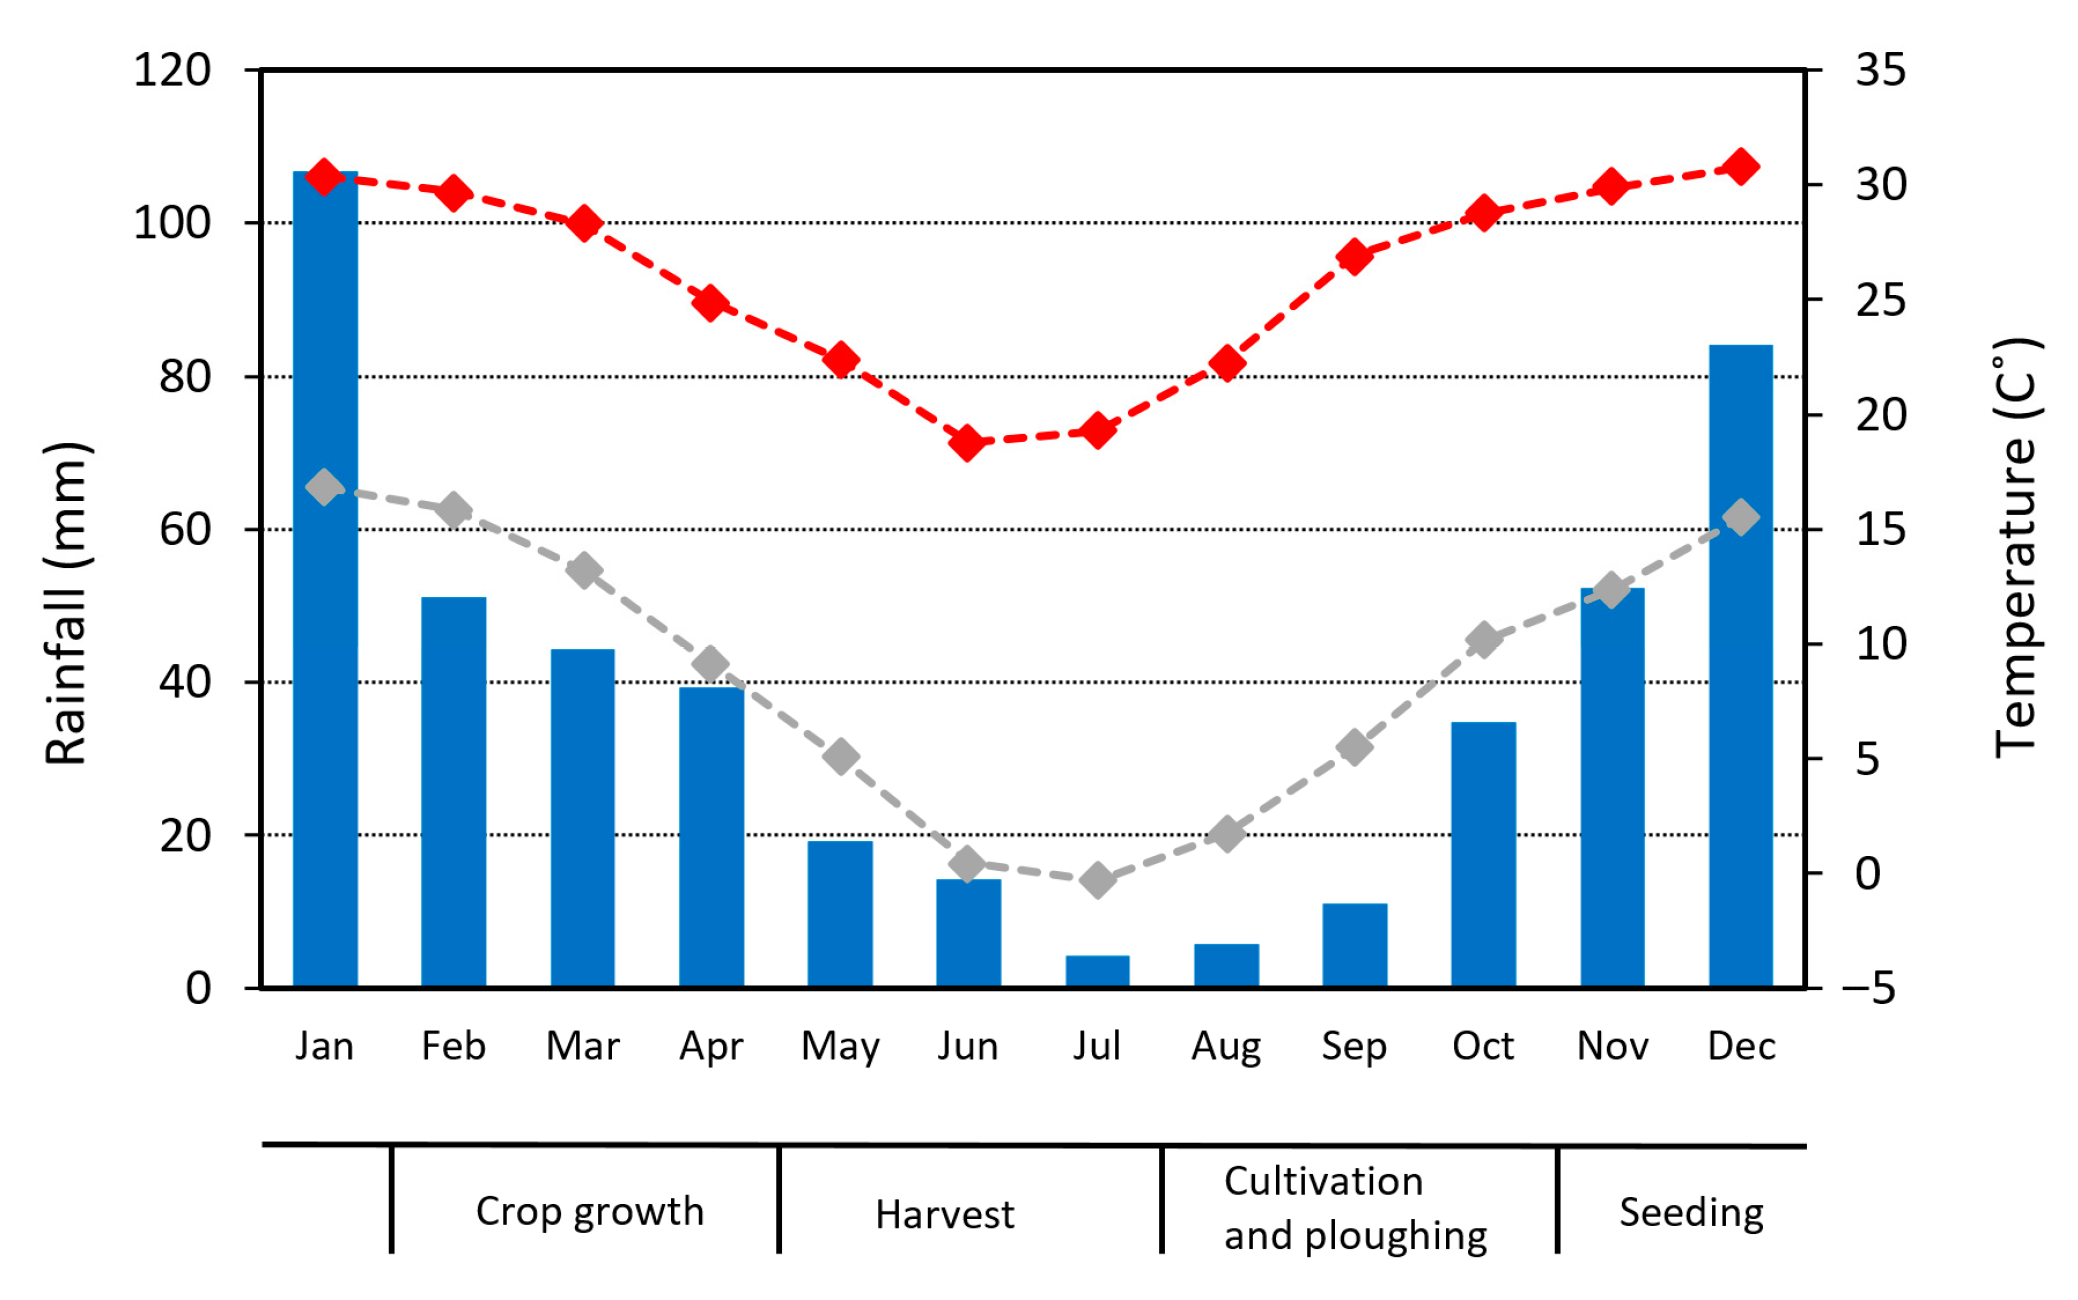
The research area is located in the north-western part of the Free State province, north of Bultfontein (Figure 1). This area was selected because it is in the center of the region with the greatest number of dust emission events identified by Eckardt et al. [24]. Furthermore, two soil types most commonly associated with these emissions and which are commonly used for crop farming are predominant in this area. Luvisols are characterized by a clay enrichment in the B horizon, whereas Arenosols are generally more homogenous in soil texture with depth. A climate station from the Agricultural Research Council (ARC) on the farm Arbeidskroon situated 10 km north of Bultfontein provided data on the recent climate of this area (Figure 2 and Figure 3). The rainy season is in summer (November–April), whereas during the winter months (May–October) dry periods are very common. The rainfall in this region can be characterized by high inter-annual and seasonal variability. Between 2006 and 2018, the average annual rainfall was 477 mm (representing the growing season), with a minimum rainfall of 294 mm in 2015/2016 and a maximum of 813 mm in 2010/2011. The mean annual air temperature in the aforementioned period was 17.1 °C with daily maximum values in summer that can exceed 35 °C but lowers in winter to below 0 °C. After the Köppen-Geiger classification, the climate is categorized as BSk (semi-arid, steppe climate). The predominant wind directions are NNE and SSW with the greatest velocities for winds coming from NW directions. The study area is prone to wind erosion due to the supply of fine silt associated with sandy soils, farming practices that make these available for entrainment, and frequent winds with high wind velocities, especially during the dry winter months which generate a high transport potential (Figure 2).
Roughly 31% of the land in the Free State is utilized as arable land. These croplands produce around one-third of all the food in South Africa [57]. Maize is the main crop (81% of the total Free State crop production), but other annual crops include sunflower, groundnuts, soybeans, and a small number of cool-season crops (wheat, barley) being cultivated for livestock fodder [57]. Maize is planted at the beginning of the rainy season, which usually starts in November or December, and is harvested between May and the beginning of August (Figure 3). As a result, most fields have a low amount of plant cover between August and November, which leaves soils vulnerable to wind erosion and dust emission. Cultivation practices, such as plouwing, deep ripping, or burial of mineral fertilizer that take place between harvest and renewed crop cover, can break-up soil crust, thus loosening the soil and enhancing wind erosion. Wind erosion protection measures are not routinely practiced.
Field Selection and Surface Measurements
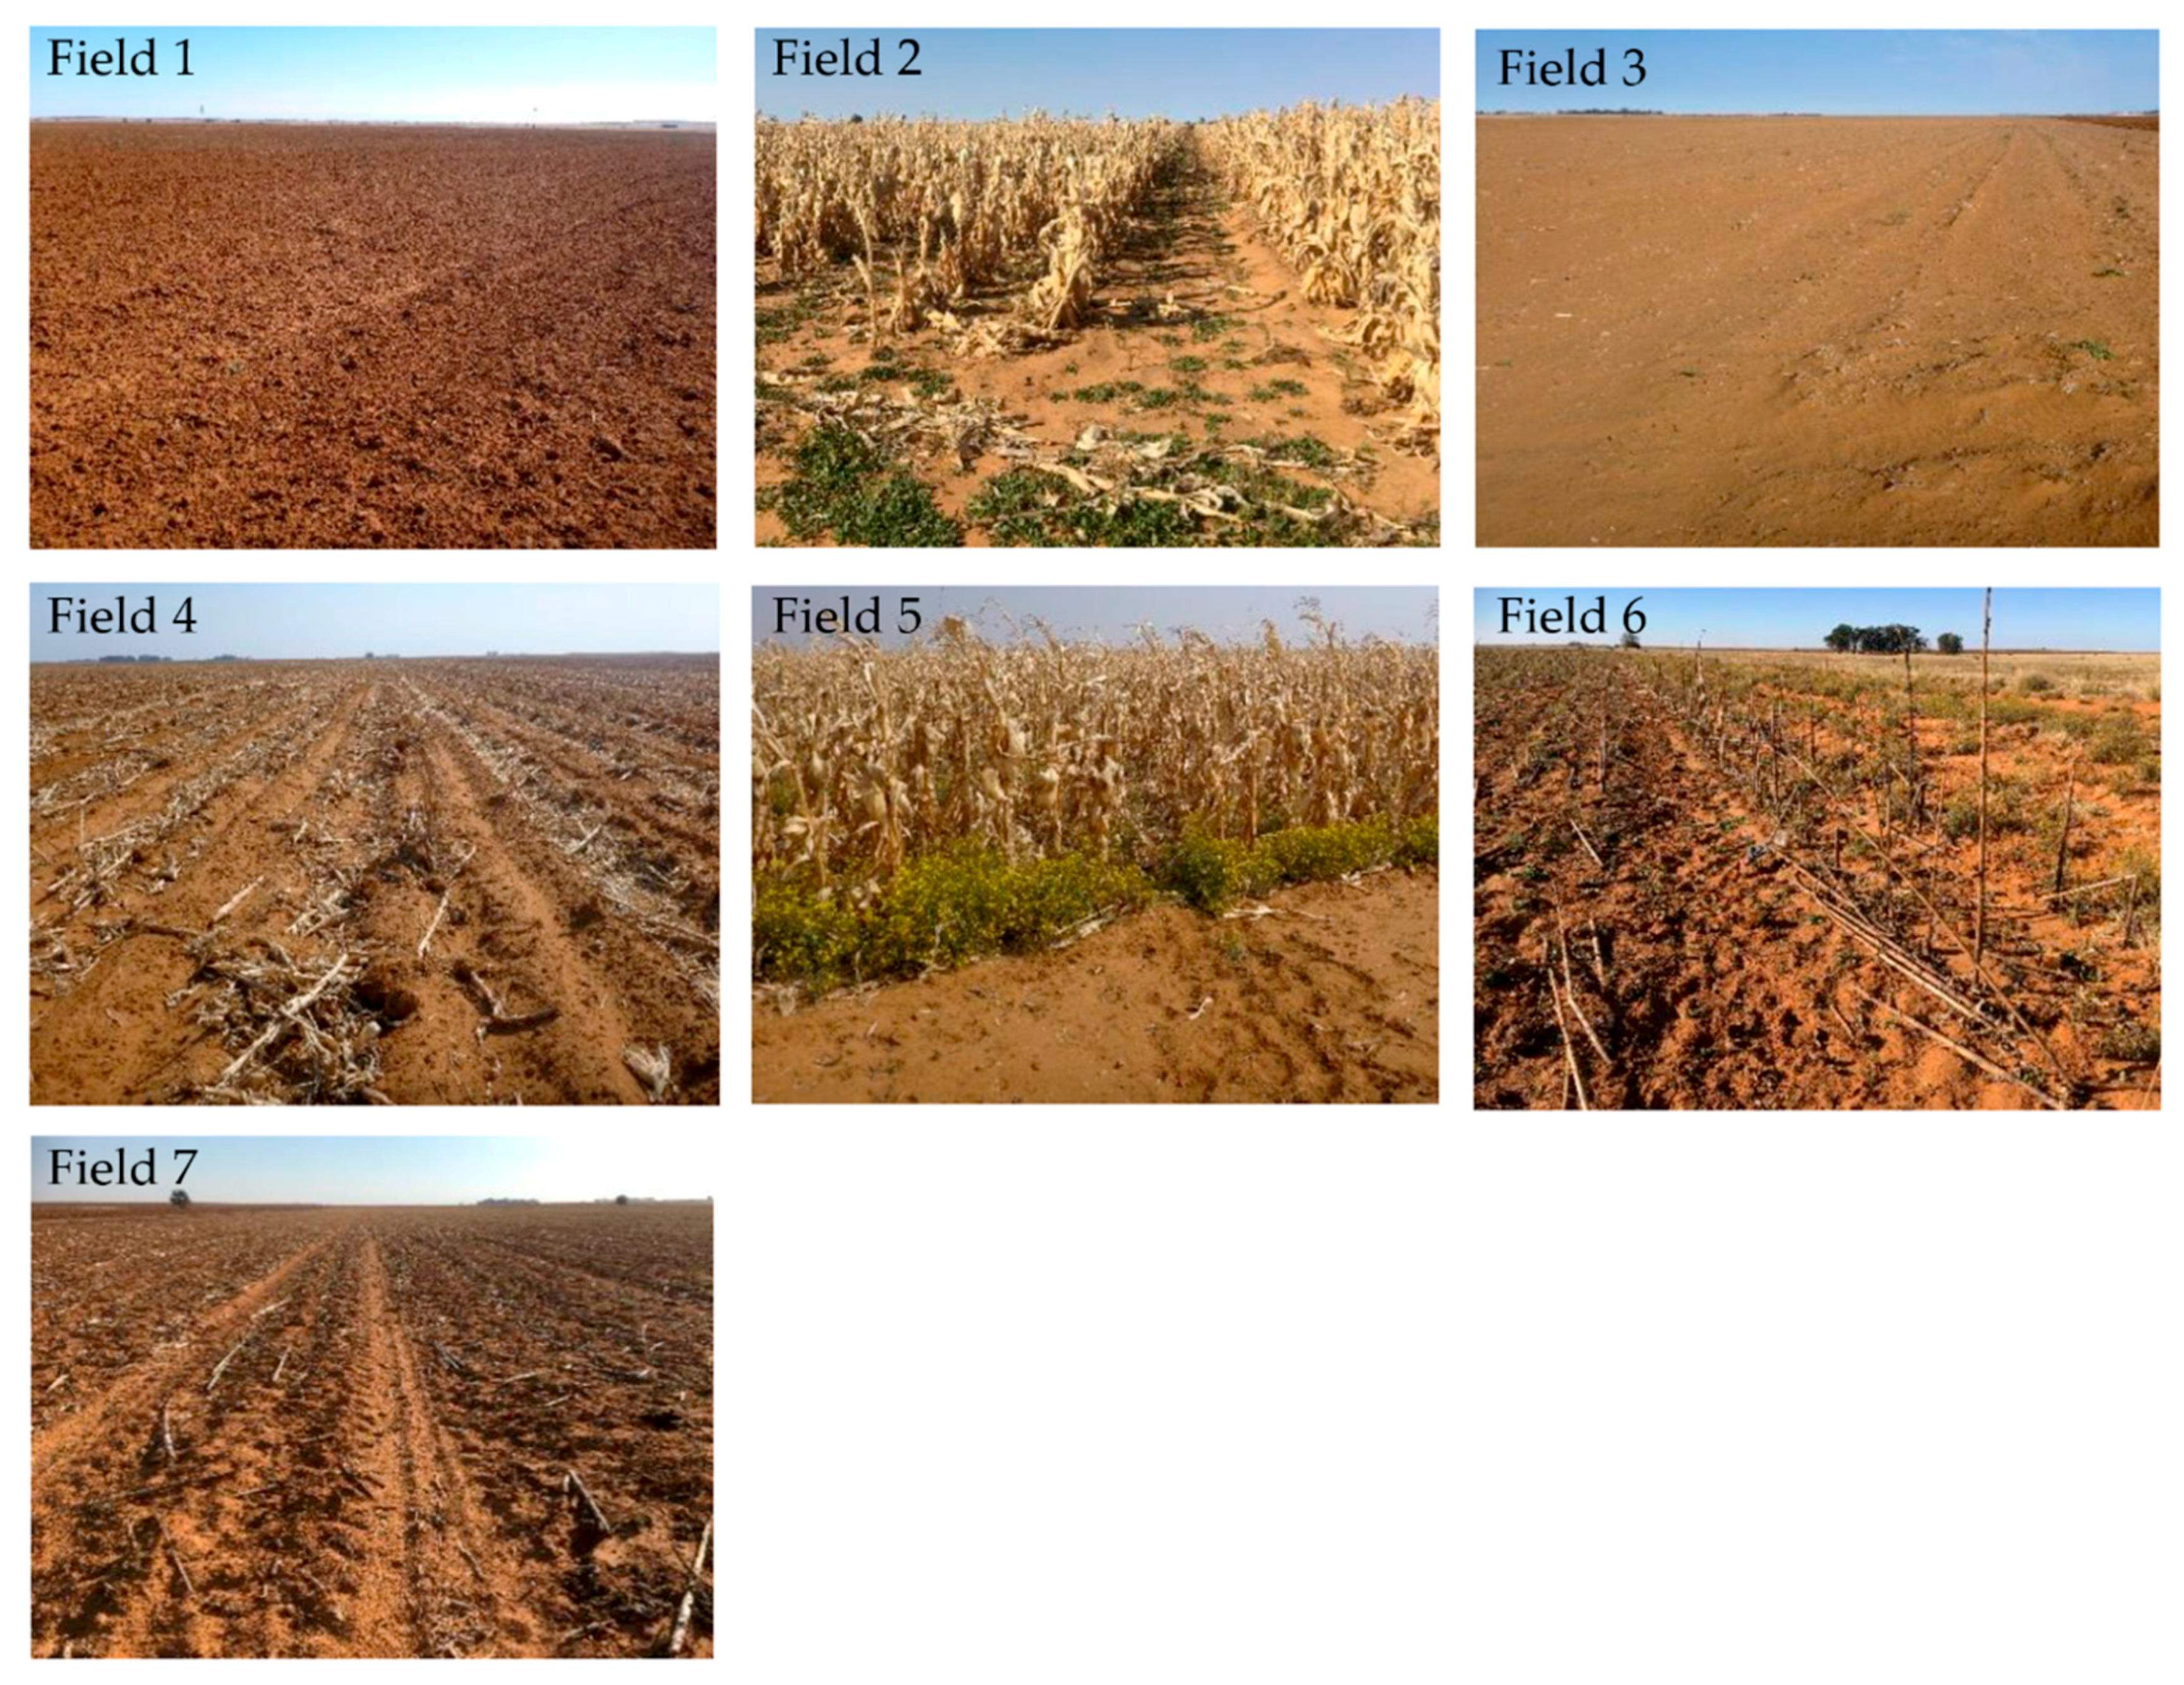
The fields under investigation are shown in Figure 1 and Figure 4 and are further described in Table 1. They were chosen because of the presence of a physical soil crust (Figure 5) and the diversity in cropland management, such as a difference in crop and cultivation techniques. Unfortunately, the Luvisol fields were plowed just prior to the field experiments and therefore lacked a crust. The strength of the field crusts was measured with a fall cone penetrometer and a torvane (Section 2.4).
The top 2 cm of soil in these fields were sampled to measure soil properties. The grain size distribution of the soils was obtained using the wet dispersion unit of the Mastersizer 2000 (Malvern Instruments Ltd., Worcestershire, UK). Before the measurements, the samples were dispersed at 60 J mL−1 using the Branson 250 Sonifier, which was in accordance withthe methods from Hu et al. [58]. Additionally, the pH value (SevenExcellens pH meter, Mettler Toledo, Columbus, OH, USA) and the carbon content (RC612, Leco Corporation, St. Joseph, MI, USA) was analyzed, as described in Caviezel et al. [59]. The soil showed a texture ranging between sand and loamy sand with low organic carbon contents and silt/sand ratio (Table 1 and Figure 6). The pH was slightly acidic, except for the almost neutral pH of field 6 (Table 1). Both soils showed a poor structure, with aggregate stability of 8% and 13% for field 1 and field 4, respectively, as determined using the Eijkelkamp wet sieving apparatus (Eijkelkamp, Giesbeek, The Netherlands).
2.3. Rainfall Simulation and Crust Formation
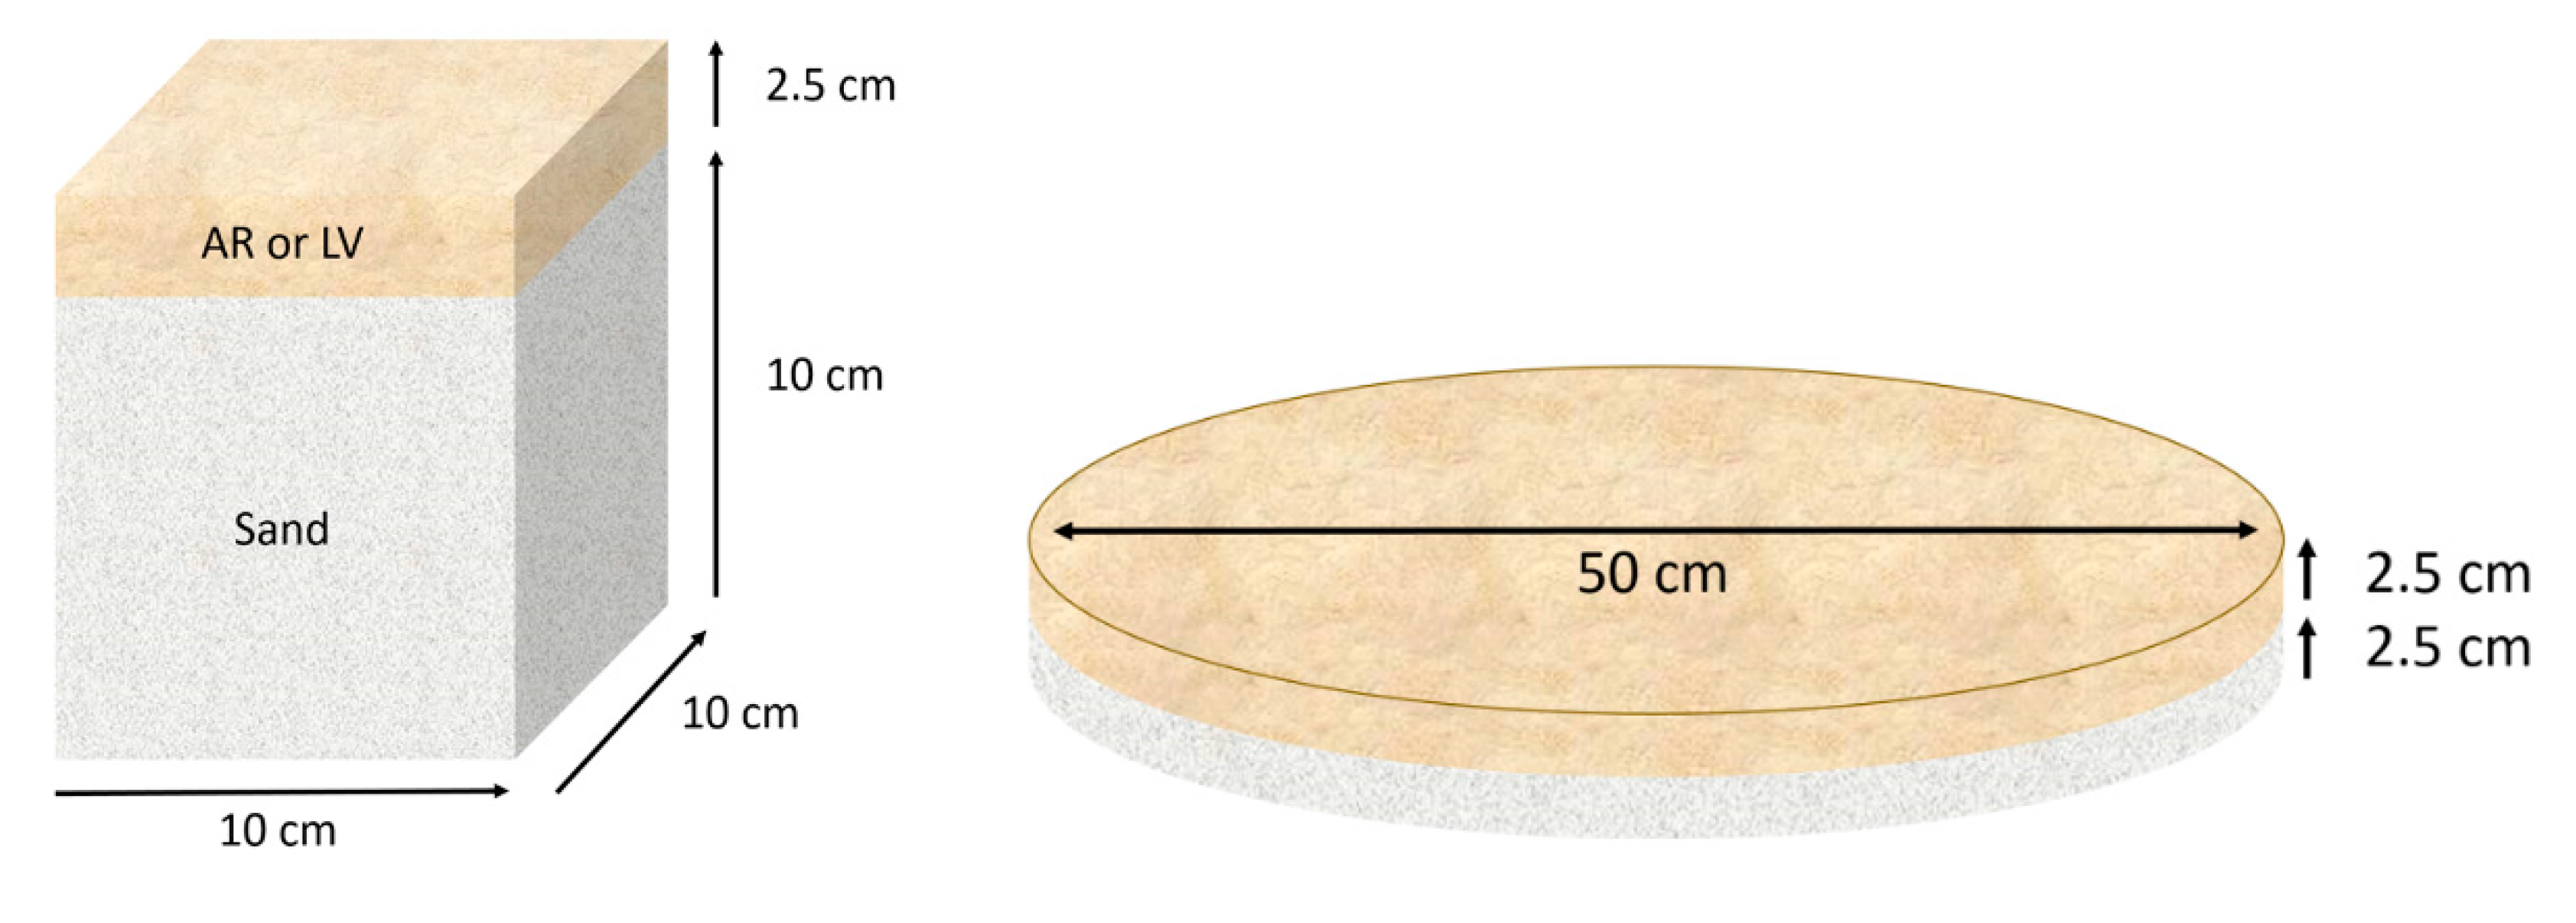
A large sample (approximately 10 dm3) of Luvisol (from field 1) and Arenosol (from field 4) were collected in 2018, transported back to the laboratory in Basel, and used to gain insight into the formation of physical crusts through artificial rainfall experiments. Prior to the rainfall simulation, the soils were dried at 40 °C and sieved through a 2 mm sieve to remove larger particles, such as stones, roots, and straw from the soil. For the rainfall experiments, containers of 10 × 10 × 12.5 cm (w × h × d) were used. The bottom 10 cm of these containers were filled with air-dried sand and the top 2.5 cm of the boxes were filled with the soil sample. The crusts for the PI-SWERL experiments were prepared on perforated round plates with a diameter of 50 cm and a depth of 5 cm, whereby again the top 2.5 cm was filled with the soil sample and the bottom was filled with sand as filling material, see Figure 7. The sand has a similar texture to the cropland soils and was used to minimize the amount of soil required for each experiment.
The rainfall experiments were performed using a high precision rainfall simulator from the Physical Geography and Environmental Change Research Group of the University of Basel in Switzerland, described by Fister et al. [60]. The rainfall experiments aimed at creating a crust with a rainfall amount that could occur realistically in the study area. A maximum of 20 mm of rainfall was chosen because only 5% of the rainfall events deliver this amount or more (See Supplementary Material). Experiments were done at 100 mm h−1 with a drop fall height of 5.8 m and a drop diameter of 2.6 mm, which corresponded to kinetic energy (kE) of 24.1 J mm−1 m−2. The kinetic energy (kE) of the rainfall was determined by a Joss Waldvogel Distrometer (Distromet Ltd., Zumikon, Switzerland). The high rainfall intensity was chosen to match the kinetic energy of natural rainfall [61]. The soils were exposed to an increasing amount of rainfall up to a maximum of 20 mm. This would allow for identifying a change of crust strength with an increase in rainfall amount and kE. Besides this variation, two types of rainfall were tested: single event rainfall and a sequence event rainfall. For the single event rainfall, 12 rainfall quantities were tested, from 1.67 mm to 20 mm in steps of 1.67 mm. The sequenced rainfall was measured in steps of 5 mm, whereby a crust was dried before exposed again to rainfall. This approach gave an insight into whether the crust strength was determined by the cumulative rainfall alone or if it was also affected by drying in between, as shown by Kuhn et al. [62].
After the experiments, the crusts were dried for seven days in a Binder climate chamber (Model MK-240, Binder, Tuttlingen, Germany) at 30 °C and a humidity of 56%. The moisture content is of importance since moisture can influence both the surface strength [63] and, more notably, the resistance to erosion of a surface [22,64,65,66]. Measurements showed that the soil humidity of the top 2 mm did not decrease significantly after seven days of drying, and the moisture content was always below 1%.
Thin sections of the experimental crusts were made with an epoxy resin of laromin® C 260 and araldit® in a 40–60% ratio. Images of the thin sections were taken using a Nikon Super Coolscan 5000 ED (Nikon, Tokyo, Japan).
2.4. Crust Strength Measurements
Crust strength is an indicator of the resistance of the surface to wind erosion [33,38,39,67]. For this study, crust strength was measured with two instruments, commonly used to describe soil resistance to erosion: a fall cone penetrometer for both fields- as experimental crusts, and a torvane for only the field crusts. Fall cone penetrometer measurements have been used by several studies [68,69,70,71,72]. The major advantage of using a fall cone penetrometer was the small scale of the measurement, both in surface and in depth. This made the measurement more comparable to the impact of an abrading particle or single raindrop, in contrast to larger scale measurements with a torvane or a pocket penetrometer, as also discussed by Rice et al. [73]. Furthermore, the fall cone penetrometer delivered high precision measurements, and the instrument was easy to transfer and operate. The disadvantage of the fall cone penetrometer was that despite the high precision, the crust strength that was calculated was a relative value; see also Equation (1). It was also slower to use and less common than the torvane. A torvane determines the torsional shear stress before failure and is a very common instrument for wind erosion studies [37,38,56,63,74,75] since it is physically closest to the shear stress that wind and abraders apply to a surface. Due to the scale of the measurement, torvane measurements require a large surface area which was not feasible. By performing measurements using both instruments on field crusts, where surface space was abundant, we could compare the two methods and make our experimental results comparable to the studies done with a torvane. A Humboldt Portable Penetrometer (Model H-1250, Humboldt Mfg. Co., Schiller Park, IL, USA) with an aluminum 10 o apex cone and a 0.8 mm stainless steel blunt tip, with a total weight of 142.5 g was used. The cone was raised 2 cm above the soil surface, after which it was released to fall onto the crust. The penetration depth was measured with an accuracy of 0.1 mm. For field crusts and experimental crusts, 20 and 10 measurements were taken, respectively. In addition, a torvane (n = 10) was used to determine the field crust strength. This instrument was adapted from a table instrument to a handheld instrument for field use by Kuhn et al. [59], and used a vane with eight blades and a penetration depth of 3 mm.
A fall cone penetrometer links the penetration depth to an undrained shear strength (τ, in Pa or kg m−1 s−2), meaning the maximum horizontal stress without any water flowing in or out of the soil. For this study, we used the following formula to calculate the shear strength index (τ*) as a kPa index [71,76,77].
whereby Q is the vertical force of the cone (in kg m s−2, using a gravitational acceleration of 9.81 m s−2), and hp is the penetration depth (m). The maximum penetration depth is 2 cm, which is in accordance with a shear strength index of 3.5 kPa.
To determine whether rainfall type (single event versus sequence rainfall) or soil type resulted in significantly different soil strength, two-tailed t-tests were performed on the crust strength measurements. An alpha value of 0.05 was used to determine statistical significance.
2.5. PI-SWERL
To determine the influence of crust formation on dust emissions, a Portable In-Situ Wind Erosion Lab (PI-SWERL, Desert Research Institute, Las Vegas, NV, USA) was used. The PI-SWERL is described in detail by Etyemezian et al. [78,79]. The PI-SWERL is ideally suited for the dust emission experiments carried out in this study for several reasons. Due to the small amount of soil required for experiments (ca. 3 kg per crust) a wide range of controlled tests can be carried out. Secondly, while the PI-SWERL can only be used on surfaces with small roughness elements, this limitation does not occur on smooth crusts. Finally, while not relevant in this study, the PI-SWERL is highly mobile and will be used in a later part of the project to measure emissions from crusts in the field as well.
The friction velocity exerted by the PI-SWERL to the effective area (u*,eff) is determined by the Rotation Per Minute (RPM) of the blades that create the air stream in the measurement chamber, which is empirically determined by Etyemezian et al. [76] as:
In this formula α is a roughness constant that is determined per surface. For our surface, a roughness parameter of 0.98 was used.
Table 2 shows the PI-SWERL runs that were performed. For each soil, PI-SWERL measurements were done on loose material, and on bare crusts formed by 15 mm of rain with and without the addition of 3 g of abrader material. The abrader material was sampled from a sand accumulation in the field. To avoid any influence of the abrader on dust measurements, the abrader was sonified and wet sieved to extract all particles finer than 63 microns. Every PI-SWERL run started with a velocity increase from zero up to 3175 RPM within 120 s to detect the threshold of PM10 emission. 3175 RPM matches a friction velocity of 0.59 m s−1 (Equation (2)) which is in accordance with a wind speed of ca. 11 m s−1 at 2 m (z0 of 1 mm), a commonly occurring wind speed in the study area. When 3175 RPM were reached, the RPM were kept stable for two different times (Table 2): the experiment on loose soil for 30 s, and the experiment on crusted soil (with and without abrader) for 120 s. The experiments on loose soil were run for a shorter period to prevent a significant depletion of fines from the highly emissive soils. The crusted surfaces were run for a longer time to gain insight in the possible effect of abrasion and degradation. As shown in Equation (3), the flux is calculated as an average for the entire run.
To calculate the average emission flux of the soil during the PI-SWERL experiment (EPI,i) in mg m−2 s−1 of each RPM step, Sweeney 2008 proposed the following formula:
where by C is the dust concentration in mg m−3, F the blow rate in l s−1, and Aeff is the effective area of 0.035 m2. The emission flux will be calculated for the period at which the RPM is at 3175. Furthermore, the threshold of PM10 will be determined. The threshold is defined as the point after which there is a subsequent increase in PM10 for a minimum of 10 s, after Van Leeuwen et al. [80]. The RPM of this PM10 threshold is converted into a friction velocity using Equation (2).
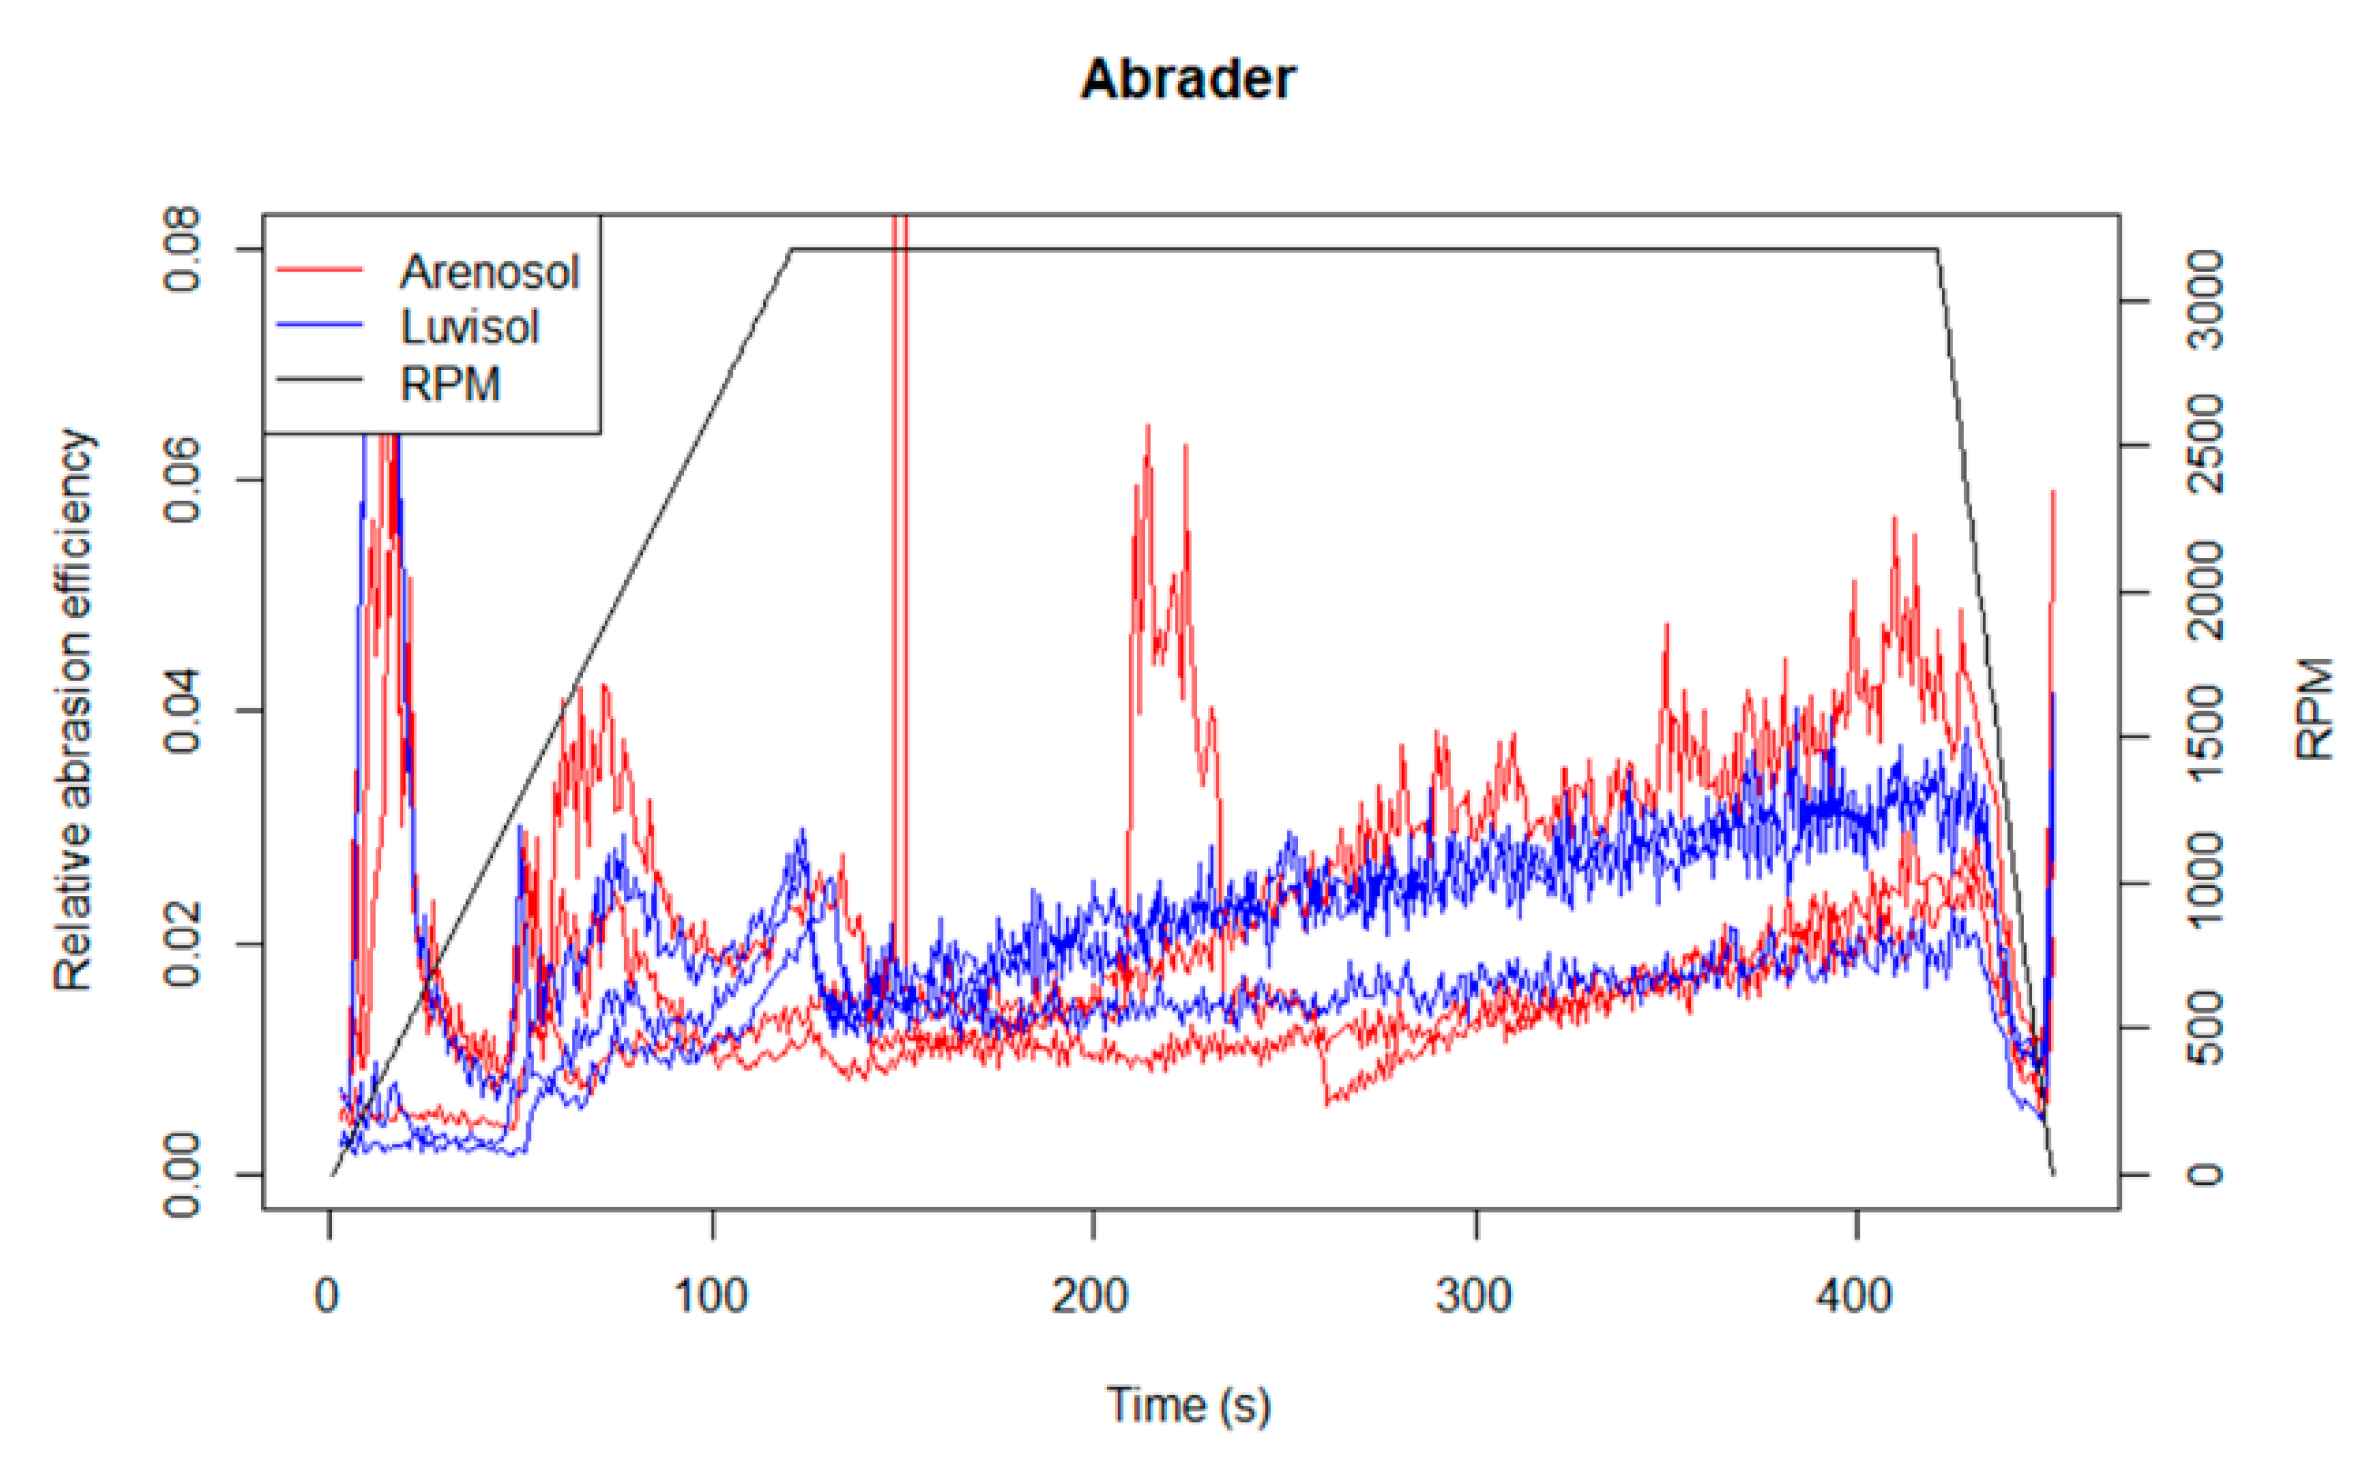
As mentioned before, the bombardment of a crust by saltating grains is an important process resulting in the emission of fine particles and degradation of the crust. A common term to express the relationship between the saltation flux and the resulting dust emission is the abrasion efficiency [35,55] or bombardment efficiency [81]. For this study a relative abrasion efficiency (in µg m−2 s−1 count−1) will be calculated by dividing the dust flux from Equation (3) by the average saltation count. The relative abrasion efficiency represents the amount of PM10 that are released per saltating particle. The saltation count within the PI-SWERL is measured using four Optical Gate Sensors (OGS) on the sides of the PI-SWERL chamber that measure the passing of saltating grains in Hz. Since the OGS sensor cannot give an exact indication of the saltation transport rate, the relative abrasion efficiency only gives an indication on the relationship between abrasion and PM10 emission.
3. Results and Discussion
3.1. Crust Strength and Structure of Field Crusts
The crust strength measured on Arenosols of the different agricultural fields are provided (Figure 8). The shear strength of field 4 was below the minimum value that can be measured with the fall cone penetrometer, namely 3.5 kPa, so this measurement will not be used for regression calculation. The measurements of the two types of crust strength, the vertical shear strength and the horizontal torsional shear strength, correlated well with each other (R2 = 0.87). This indicates that the fall cone penetrometer can be regarded as a reliable and relevant method for crust strength measurements on smaller, experimental crusts.
The field measurements show a difference between strong crusts on fields that have not been harvested yet (field 2 and 6), and weaker crusts on fields that had been harvested and cultivated (fields 3, 5 and 7). We speculate that the strong crusts developed at the beginning of the rainy season when the crops where small enough for raindrops to reach the surface, while the weaker crusts from field 3 and 4 formed after harvest when cultivation destroyed the former crusts. In June and July 2018, 2.8 and 3.8 mm of rainfall fell respectively, which could have made the formation of a weak crust on loose soil possible. These results lead us to the conclusion that crusts that form during the rainy season can survive throughout the dry season and that these crusts are significantly stronger than the crusts that form later during the dry season. The absence of crusts in the Luvisol field (field 1) and other non-crusted fields in our study area could have been caused by tillage operations in June or July or animal trampling [17,82,83].
The torsional shear strength of the crusts was between 3.4 and 15.5 kPa, which is on average smaller compared to the crust strength measured by other studies: Goossens [35] measured crust strength on loamy and sandy soils with results between 12 and 37 kPa, and Zimbone et al. [60] measured a strength of 10 kPa on a crusted sandy loam. This difference in crust strength could be caused by a smaller content of fines or TOC in our crusts, but also by the fact that our field crusts might have been less developed or more degraded. The degradation could have been the result of particle abrasion, plant root growth, hail impact, or freezing and thawing [84,85].
3.2. Crust Formation by Experimental Rainfall
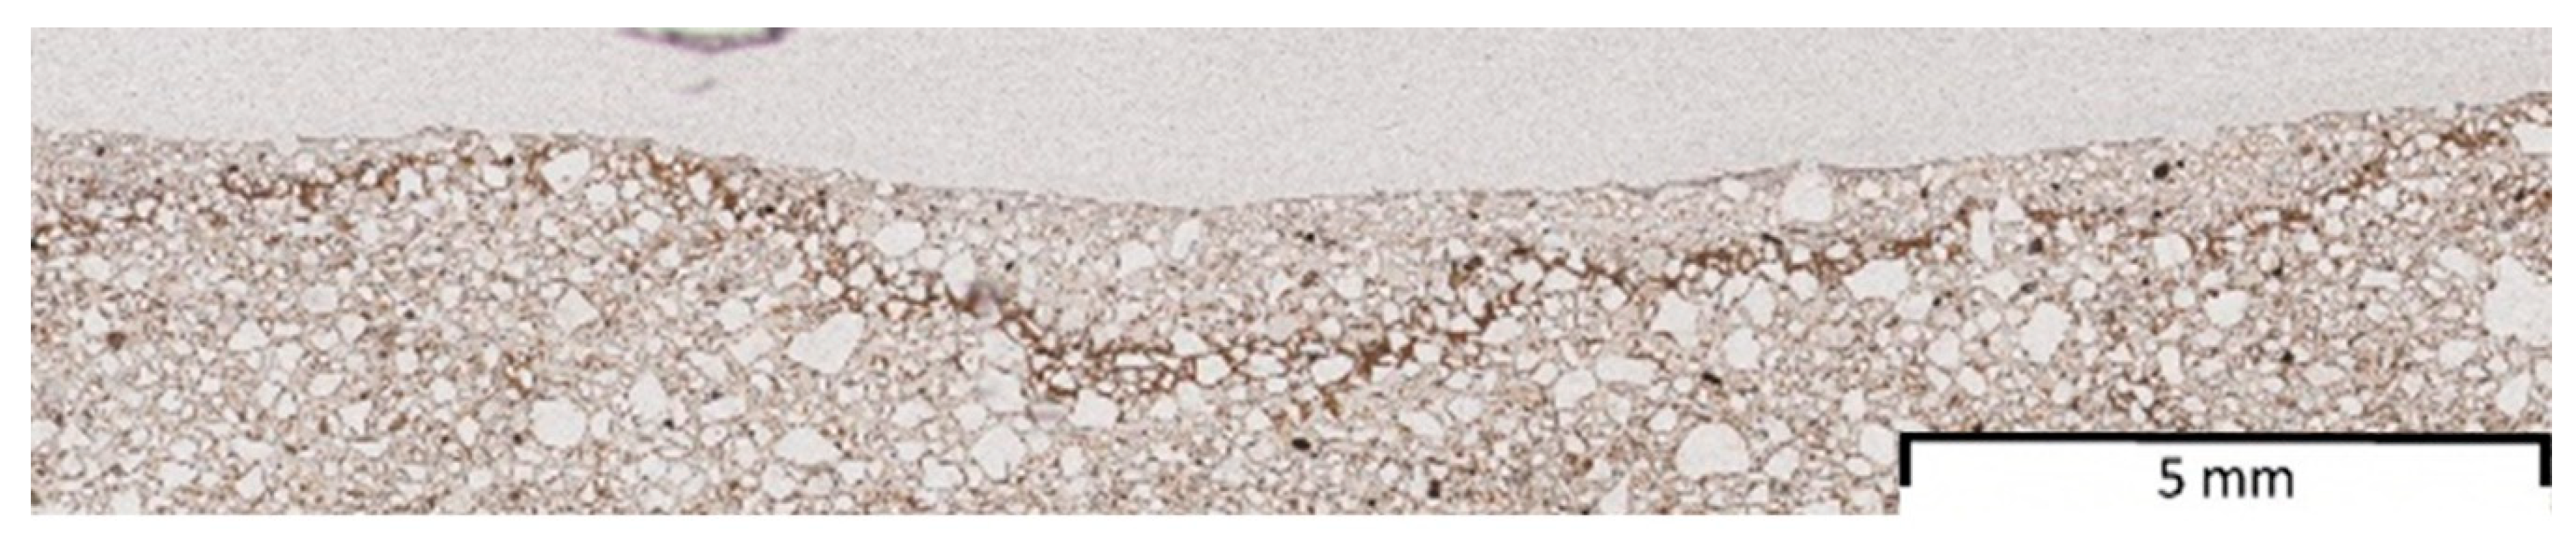
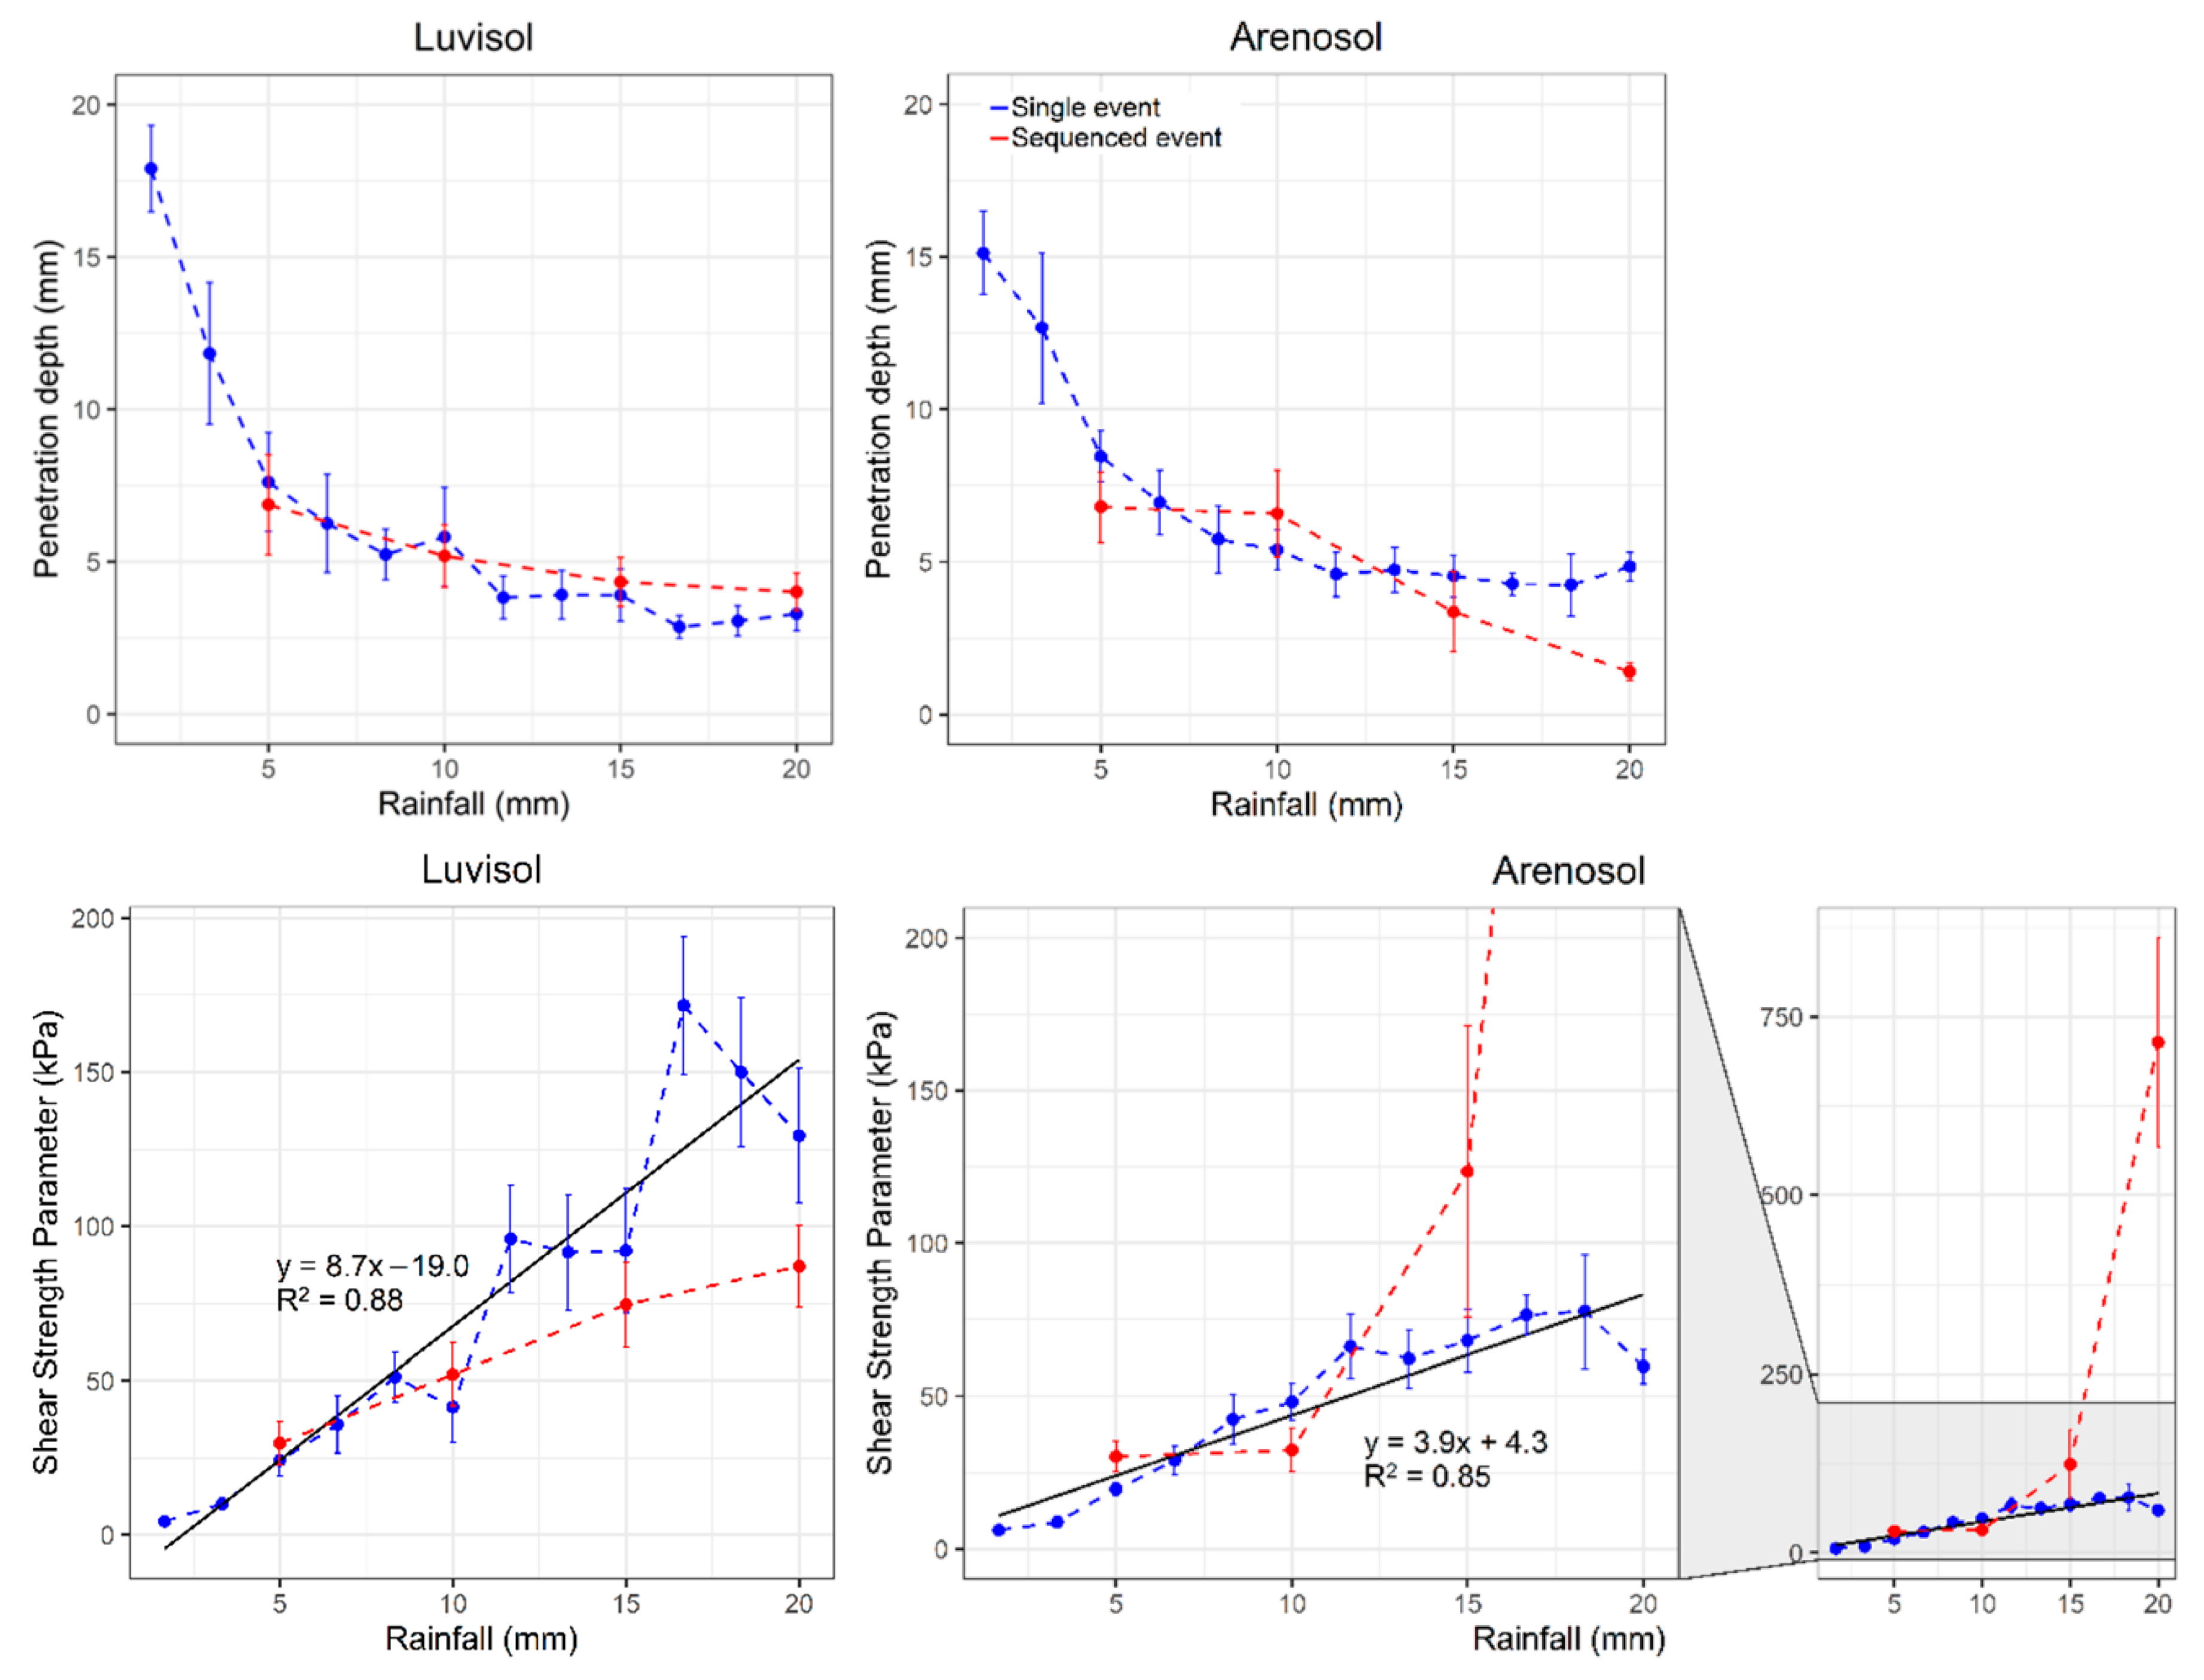
Rainfall experiments were performed on Arenosol and Luvisol samples to investigate the development of physical crusts in respect to varying rainfall amounts. Figure 9 shows a thin section of an Arenosol crust. This crust shows the formation of a thin dense layer of fine particles in the upper part of the crust. The results from these experiments show a clear positive correlation between the rainfall amount and the shear strength of the crusts (Figure 10). This increase is visible for both soils, and for both single event and sequenced rainfall.
Table 3 shows the results of the t-tests between the shear strength from the Arenosol and Luvisol at 5, 10, 15, and 20 mm rainfall, and between single event and sequenced rainfall. Using an alpha value of 0.05, it can be stated that for single event rainfall Arenosol and Luvisol crusts have similar crust strength up to 15 mm of rainfall, after which Luvisol crusts are significantly stronger. The fact that Luvisols create stronger crusts can be attributed to the greater clay and silt content (21.4% for LV versus 13.1% for AR), a relationship that has been described elsewhere [32,75].
Crust strength increased continuously with sequenced rainfall, a phenomenon that was also observed by Feng et al. [67]. For both soils, the crust strength between the single event and the sequenced rainfall is statistically similar until 15 mm of rainfall for the Arenosol and until 20 mm on the Luvisol. For greater rainfall, the strength of sequenced Luvisol crusts is smaller compared to the single event rainfall, whereas the Arenosol crusts from sequenced rainfall is much stronger than the single event crust. This could be caused by the fact that standing water during the experiment can reduce the kinetic energy of impacting drops acting on the soil surface [41,42,86]. This building-up of crust strength would be an important process for physical crust formation, since smaller rainfall events are much more common (See Supplementary Material), especially between May and September, when the monthly rainfall is less than 20 mm. This successive buildup of crust strength with sequenced rainfall events would be the most important process in crust formation during this period.
Using the Arenosol single rainfall event regression, calculated from the experimental results (Figure 9), it is possible to estimate the rainfall amount to which the field crusts that were studied in 2018 were exposed. The greatest shear strength of the crust from the harvested fields was 24.2 kPa, which would represent ca. 5.0 mm of experimental rainfall. For the crusts on the unharvested fields, the shear strength was between 33.5 kPa and 62.6 kPa, which is in accordance with 6.1 to 9.4 mm of experimental rainfall. The amount of rainfall that the soil had been exposed to in 2018 since the start of the growing season in 2017 was likely greater. According to the ARC weather station, 345 mm of rainfall fell from November 2017 till July 2018, whereas during the months after harvest, June and July, only 6.0 mm fell. The field crusts are weaker than the regression suggests, which could be caused by a difference in intensity of kE of natural rainfall, the protection of the soil from crusting by vegetation cover, or by any degradation of the field crust as mentioned before.
3.3. Dust Emission Thresholds and Fluxes
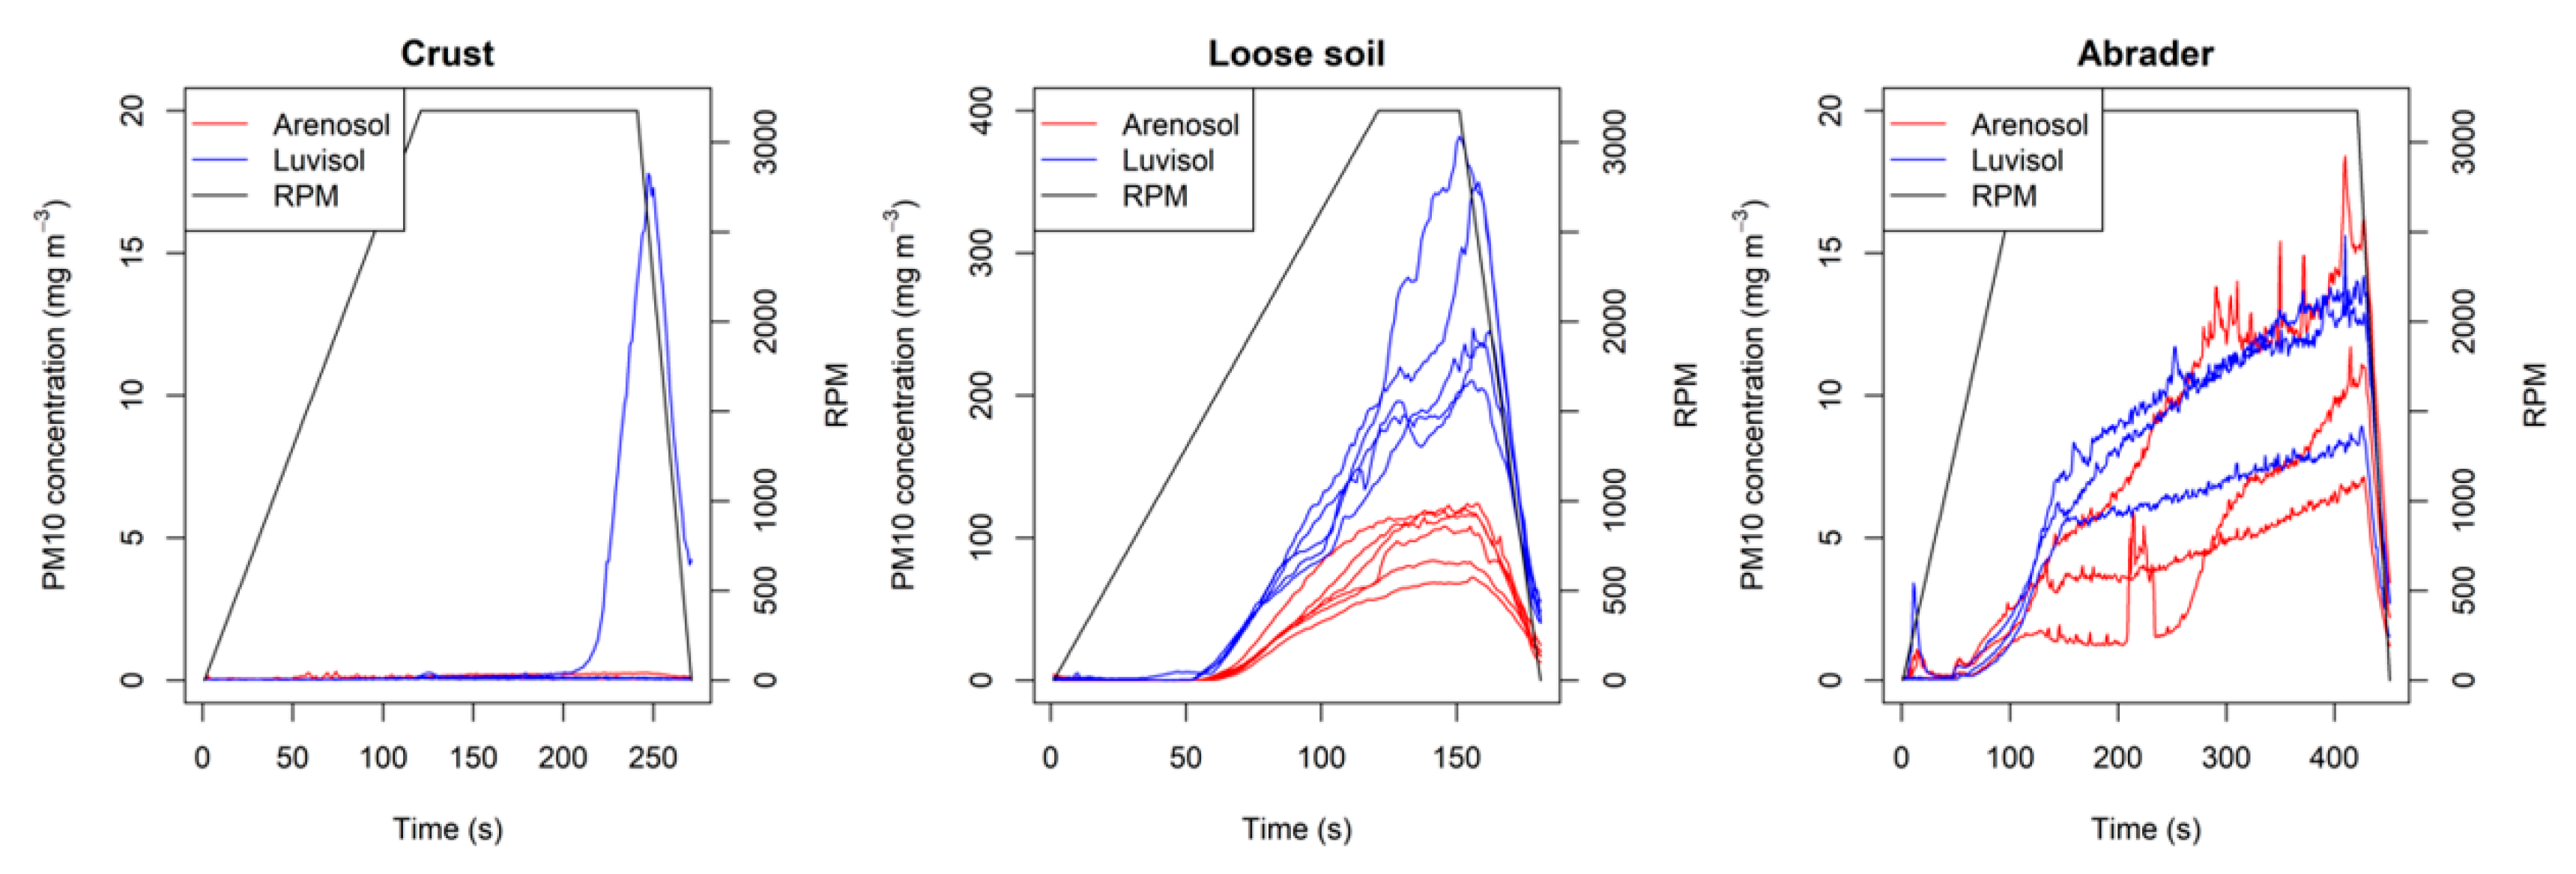
The dust concentration observed during the PI-SWERL runs on loose and crusted surfaces are shown in Figure 11. The crusted surfaces do not show any significant dust emission, with the exception of one Luvisol crust experiment that shows a sudden increase in PM10, 200 s into the experiment. This might have been caused by a crack in the crust due to swelling-and shrinking processes (Figure 12). A small concentration increase at the beginning of some runs, is attributed to small contaminations in the instrument. Figure 13 shows the relative abrasion efficiency of the abrader runs. Generally, this value shows a slight increase over time, which indicates that the crusts became more emissive under abrasion.
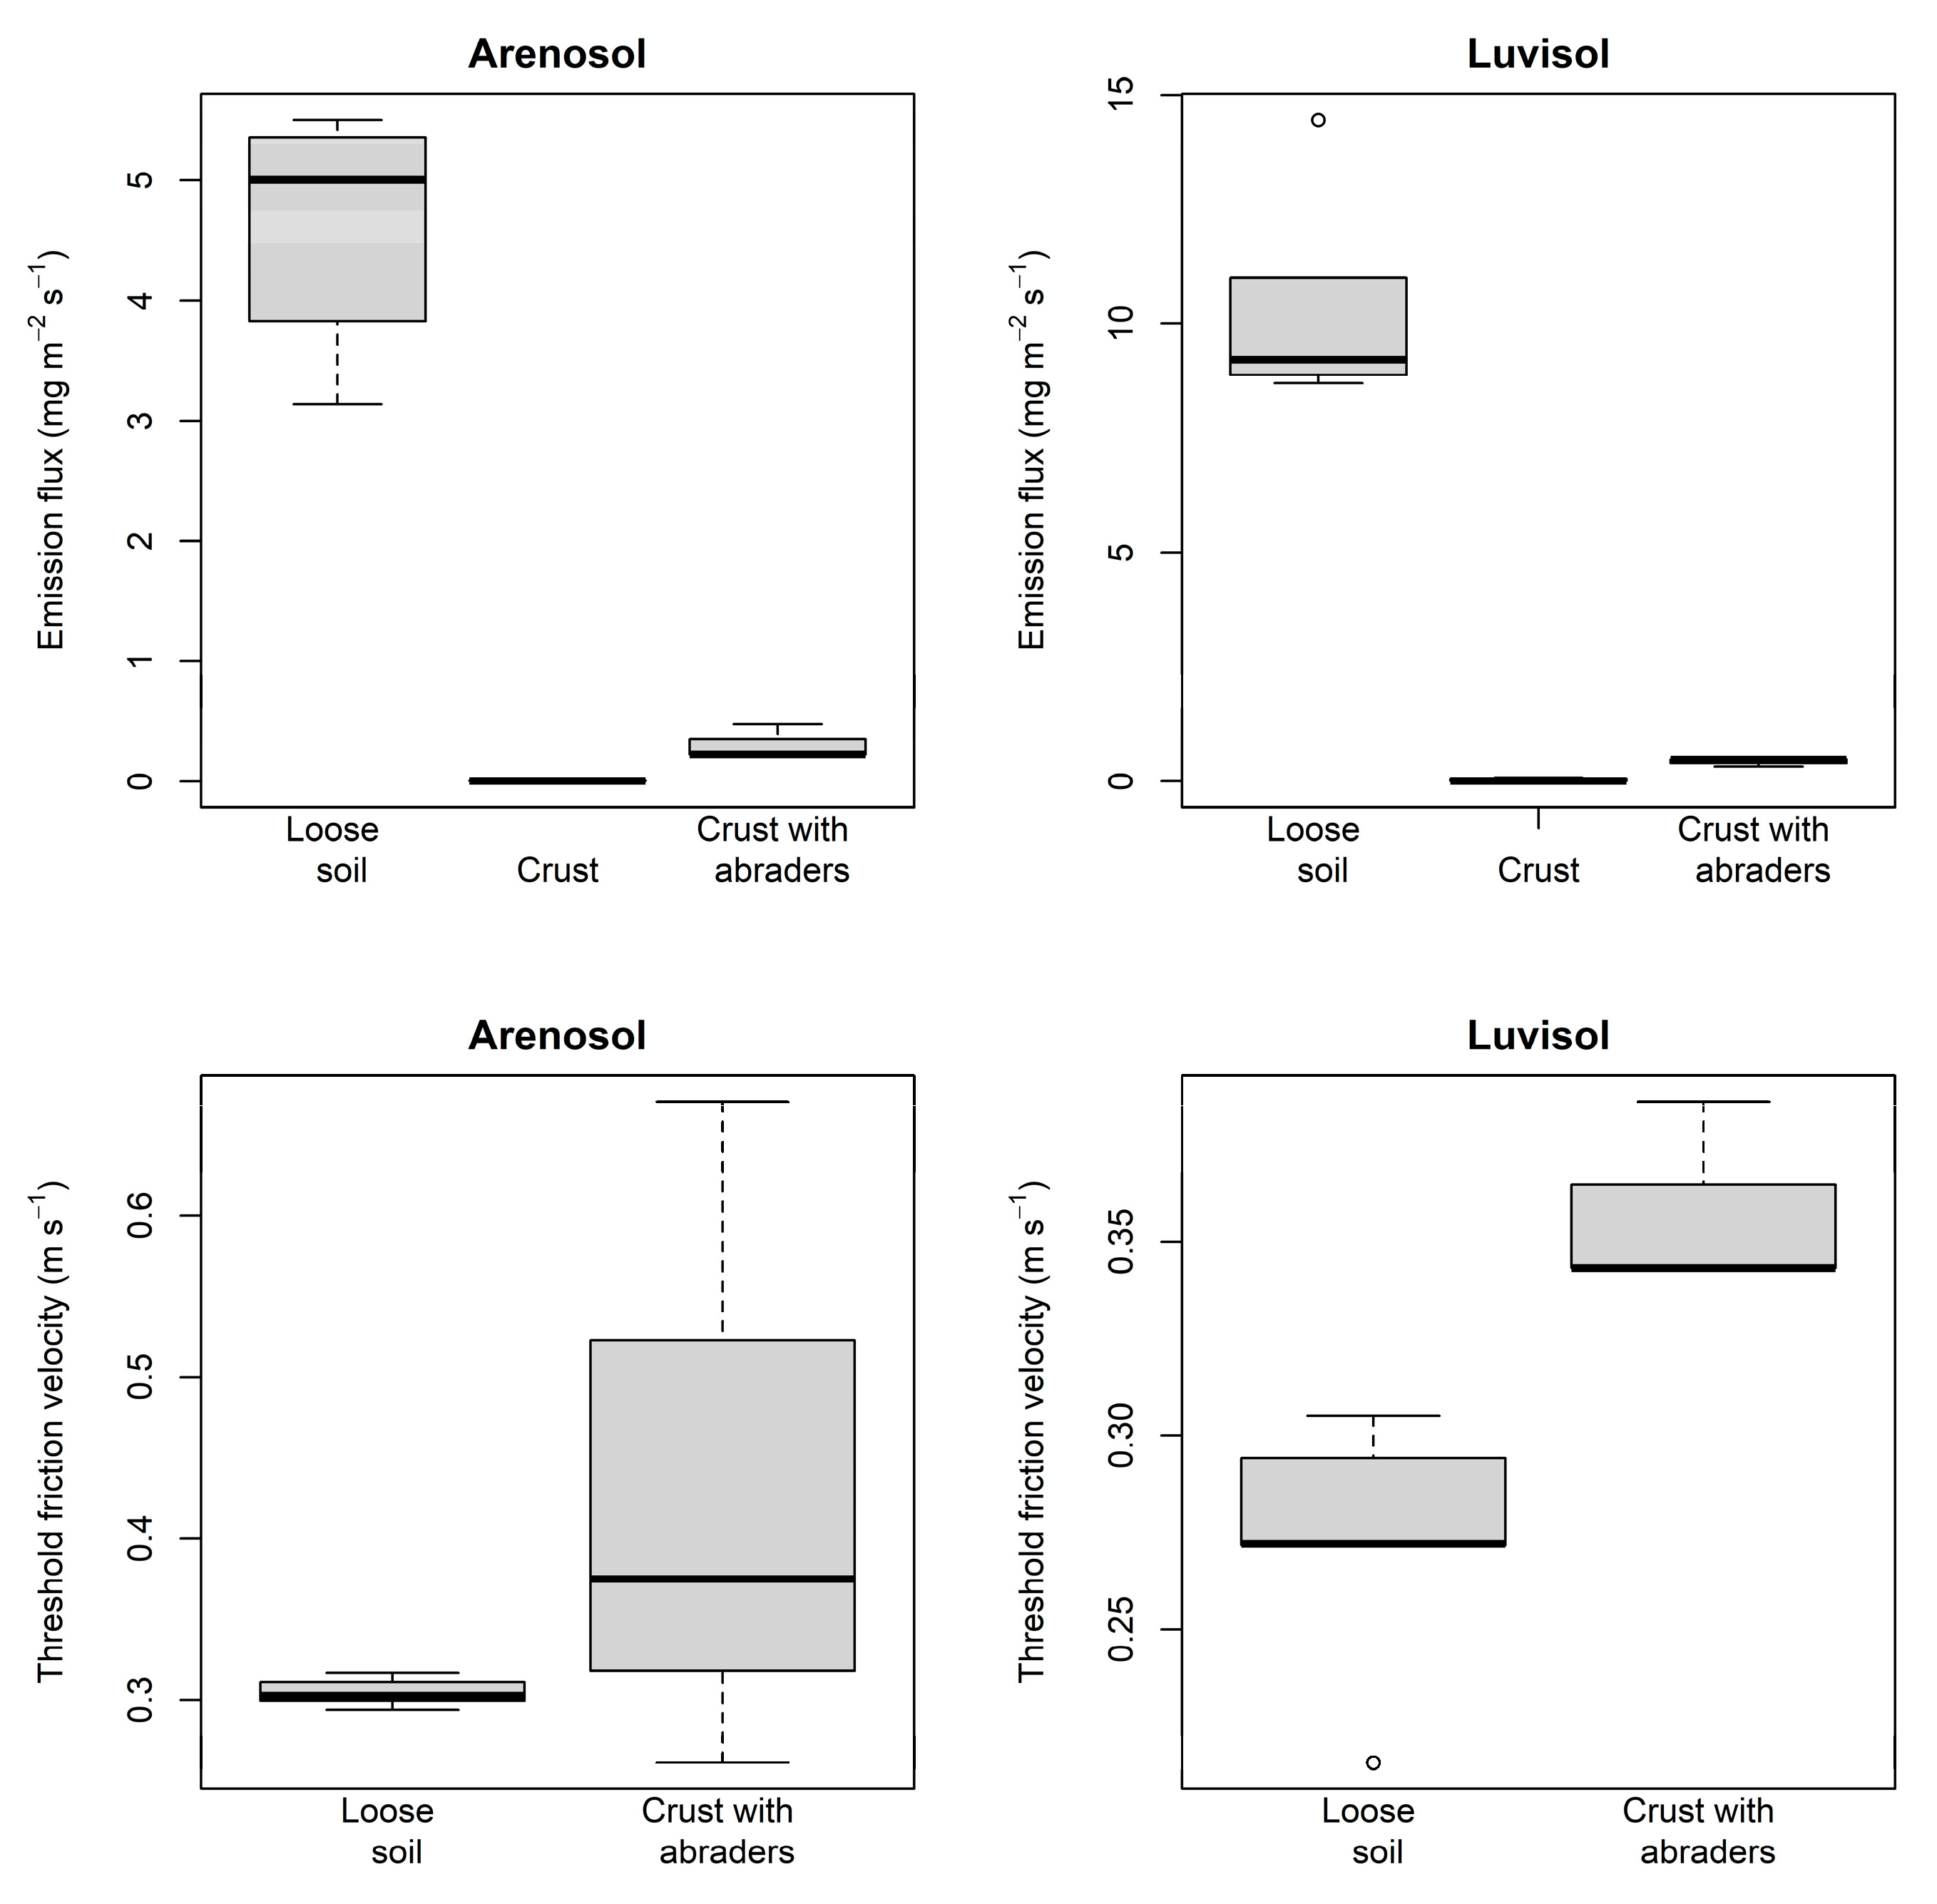
For each PI-SWERL run, the dust emission flux and threshold were calculated (Figure 14 and Table 4). The effect of crusting on dust emission is clearly visible. In all experiments, the crusts significantly reduce dust fluxes in comparison to loose material. For Arenosol crusts, the dust emission is reduced from 3.87 to 0.005 mg m−2 s−1 on average, which is a reduction down to 0.14%, and the Luvisol the values went from 10.53 to 0.028 mg m−2 s−1, which represent 0.26% of the emission from a loose surface.
The threshold friction velocity is increased by the formation of a crust when abraders are present, which is a phenomenon that also been described in other studies [41,42]. Crusted soils without abraders do not have a threshold friction velocity since there is no significant emission. The thresholds of the loose and abrading surfaces translate into wind speeds of 5.7 and 8.1 m s−1 for Arenosol and 5.0 and 6.6 m s−1 for Luvisol respectively (z0 = 1 mm). The difference between the threshold friction velocities between crusted and non-crusted surfaces is small compared to the difference in dust flux. The threshold of the abrader experiment is likely initiated by the movement of the loose abraders and is therefore not only influenced by the cohesion of the crust. Despite the fact that the threshold velocity will also be greatly influenced by larger roughness elements such as ridges and stubble [28,87], this small-scale difference could have a significant influence on dust emissions form cropland.
The protection from crusts against wind erosion that our data presents is in line with other studies on the dust emission from crusted surfaces. Wind tunnel studies from Zobeck et al. [35] and Yan et al. [43] describe how developed crusts can almost completely prevent wind erosion when there are no external abrader. Sweeney and Manson [75] determine dust emission from loose and artificially crusted loess using the PI-SWERL. The dust emission from their loose material ranged from 0.1 to 4.5 mg m−2 s−1, whereas the crusted surfaces range from zero to 1.4 mg s−1 m−2 at 0.69 m s−1. Comparing these results to ours, here loose soils, especially the Luvisols, appeared to be more emissive, whereas the crusts appear to be more effective at protecting the surface. This difference could be attributed to differences in grainsize and the experimental set up for crust formation.
The protective effect of a crust is also smaller with the addition of abraders. In this case, the soils emit 8% and 4% of the emission of loose soils for Arenosols and Luvisols, respectively. Figure 14 shows an example of an Arenosol crust before and after an abrasion experiment. The crust is degraded, and large parts of the crust are removed by the abrading particles. This important influence of abraders on dust emission has been described by many wind tunnel studies [33,34,35,45]. Although the dust emission in runs with abraders is greater than without abraders, the amounts are still more than an order of magnitude smaller than those from loose surfaces. However, it might be possible that with longer duration of the experiments, the crusts could have been completely destroyed by abrasion and emission values could have reached the level of loose soils, as suggested by a field study on loamy sandy crusts from Goossens [38]. Future studies on field crusts will have to focus on the longevity of the crusting-induced reduction of dust emissions.
Despite their greater strength (Table 4), the Luvisol crusts were on average more emissive for both the normal and abraded crusts, which is likely caused by the greater number of fine particles in the Luvisols. These findings do not agree with the field measurements on loamy to sandy crusts by Goossens [38], which showed a negative exponential correlation between the crust shear strength and the horizontal and vertical dust flux. However, their wind tunnel measurements do not address the influence of a continuous abrasion, which is simulated in the closed system of the PI-SWERL. Houser and Nickling [55] also described a negative correlation between crust strength and abrasion efficiency using wind tunnel experiments. The strength of their crust was greatly influenced by the presence of salts, whereas the differences in crust strength in our study are attributed to the concentration of fines. This suggests an interesting interplay of factors, where a greater concentration of fines results in a general greater PM10 emission, but also in a greater crust strength that limits the emission.
4. Conclusions
The high dust fluxes from loose Free State soils in this study support the result of Eckardt et al. [24] that sandy cropland soils play a role as a source of atmospheric dust in southern Africa, in addition to the aerosols generated by natural surfaces. Our results show that physical soil crusts can form rapidly on loamy sand and sandy loam cropland soils, and that these crusts have the potential to reduce dust emissions on these fields which concurs with other studies on sandy loamy soils [38,43]. Crusts formed on Arenosols and Luvisols by 15 mm of experimental rainfall minimized the PM10 emission flux to less than 0.5% of the emission from a loose soil. We expect that the most significant formation of crusts occurs during the start of the rainy season, before the growth of crops protects the soil from the impact of raindrops, and that these crusts can last into the dust season. However, even during the dry season crust formation by sequenced rainfall appears possible.
Our results underline the importance of physical soil crusts in dust prevention on sandy soils in the Free State and in many other regions in the world. The results illustrate that crust-protecting land management could be very advantageous to minimize dust emission from bare agricultural fields. These practices may include the limitation of ploughing, mechanical cultivation, and animal trampling after harvest. The trade-off between reducing dust emission and increasing the risk of run-off and water erosion has to be further studied.
Abraders play an important role in increasing the PM10 emission and the erosion of crusts, as also suggested by previous studies [34,45,46,73,88]. This indicates that active prevention of the mobilisation of abrading sand particles should also be considered as an important measure to minimize dust emissions. These measures could include the preservation of crop stubble or the placement of roughness elements, such as fences or shrubs at the border of fields combined with a reduction of the field sizes.
While the results of this study seem to be very plausible and straightforward, we would like to point out that this knowledge is gained under laboratory conditions and that further experiments and field measurements on natural crusts are necessary to test these findings. The influence of abraders is commonly studied with wind tunnel measurements [32,33,34,45,55]. Wind tunnel experiments on abrasion conditions would offer a cross comparison with our PI-SWERL results, field dust emission monitoring, and synoptic weather data. Furthermore, measurements with the PI-SWERL in the field would offer the possibility to gain a more representative understanding on emission characteristics by testing a wider range of crust strengths, textures, and abrasion conditions.
Supplementary Materials
The following are available online at https://0-www-mdpi-com.brum.beds.ac.uk/2073-445X/9/12/503/s1, Figure S1: Cumulative frequency distribution of number of total rainfall amounts in the study area.
Author Contributions
Conceptualization, H.C.V., W.F. and N.J.K.; methodology, H.C.V., W.F. and N.J.K.; validation, H.C.V., W.F. and N.J.K.; formal analysis, H.C.V.; investigation, H.C.V., W.F. and N.J.K.; resources, W.F., F.D.E. and N.J.K.; data curation, H.C.V.; writing—original draft preparation, H.C.V.; writing—review and editing, H.C.V., W.F., F.D.E., A.R.P. and N.J.K.; visualization, H.C.V.; supervision, W.F., F.D.E., A.P. and N.J.K.; project administration, F.D.E., A.R.P. and N.J.K.; funding acquisition, W.F., F.D.E., A.R.P. and N.J.K. All authors have read and agreed to the published version of the manuscript.
Funding
This research was funded by the SWISS-SOUTH AFRICA JOINT RESEARCH PROGRAMME (SSAJRP), grant number 107803. This research also received funding from the SWISS NATIONAL SCIENCE FOUNDATION (SNSF) and the NATIONAL RESEARCH FOUNDATION (NRF).
Acknowledgments
We wish to thank the Swiss-South Africa Joint Research Programme, the Swiss National Science Foundation, and the National Research Foundation. We would also like to thank the Agricultural Research Counsil for making the data of their climate station available to us. We would like to thank Hannes and Sophia Prinsloo, A.C. van Wyk, and Sias van Rensburg for allowing us to take measurements on their field and providing us with information on their fields.
Conflicts of Interest
Authors declare no conflict of interest. The funders had no role in the design of the study; in the collection, analyses, or interpretation of data; in the writing of the manuscript, or in the decision to publish the results.
References
- Tegen, I.; Hollrig, P.; Chin, M.; Fung, I.; Jacob, D.; Penner, J. Contribution of different aerosol species to the global aerosol extinction optical thickness: Estimates from model results. J. Geophys. Res. Atmos. 1997, 102, 23895–23915. [Google Scholar] [CrossRef]
- Boucher, O.; Randall, D.; Artaxo, P.; Bretherton, C.; Feingold, G.; Forster, P.; Kerminen, V.M.; Kondo, Y.; Liao, H.; Lohmann, U. Clouds and aerosols. In Climate Change 2013: The Physical Science Basis. Contribution of Working Group I to the Fifth Assessment Report of the Intergovernmental Panel on Climate Change; Stocker, T.F., Qin, D., Plattner, G.K., Tignor, M., Allen, S.K., Boschung, J., Nauels, A., Xia, Y., Bex, V., Midgle, P.M., Eds.; Cambridge University Press: Cambridge, UK, 2013; pp. 571–657. [Google Scholar]
- Shao, Y.; Wyrwoll, K.H.; Chappell, A.; Huang, J.; Lin, Z.; McTainsh, G.H.; Mikami, M.; Tanaka, T.Y.; Wang, X.; Yoon, S. Dust cycle: An emerging core theme in Earth system science. Aeolian Res. 2011, 2, 181–204. [Google Scholar] [CrossRef]
- Lawrence, C.; Neff, J. The contemporary physical and chemical flux of Aeolian dust: A synthesis of direct measurements of dust deposition. Chem. Geol. 2009, 267, 46–63. [Google Scholar] [CrossRef]
- Mahowald, N.; Engelstaedter, S.; Luo, C.; Sealy, A.; Artaxo, P.; Benitez-Nelson, C.; Bonnet, S.; Chen, Y.; Chuang, P.; Cohen, D.; et al. Atmospheric iron deposition: Global distribution, variability, and human perturbations*. Ann. Rev. Mar. Sci. 2009, 1, 245–278. [Google Scholar] [CrossRef] [PubMed] [Green Version]
- Goudie, A.S. Desert dust and human health disorders. Environ. Int. 2013, 63C, 101–113. [Google Scholar] [CrossRef]
- Sprigg, W.A. Dust storms, human health and a global early warning system BT. In Extreme Weather, Health, and Communities: Interdisciplinary Engagement Strategies; Steinberg, S.L., Sprigg, W.A., Eds.; Springer International Publishing: Cham, Switzerland, 2016; pp. 59–87. ISBN 978-3-319-30626-1. [Google Scholar]
- Chappell, A.; Webb, N.P.; Leys, J.F.; Waters, C.M.; Orgill, S.; Eyres, M.J. Minimising soil organic carbon erosion by wind is critical for land degradation neutrality. Environ. Sci. Policy 2019, 93, 43–52. [Google Scholar] [CrossRef]
- Oldeman, L.R. Global Extent of Soil Degradation. In Bi-Annual Report 1991–1992/ISRIC; ISRIC: Wageningen, The Netherlands, 1992; pp. 19–36. [Google Scholar]
- Sterk, G.; Herrmann, L.; Bationo, A. Wind-blown nutrient transport and soil productivity changes in southwest Niger. L. Degrad. Dev. 1996, 7, 325–335. [Google Scholar] [CrossRef]
- Bridges, E.M.; Oldeman, L.R. Global assessment of human-induced soil degradation. Arid Soil Res. Rehabil. 1999, 13, 319–325. [Google Scholar] [CrossRef]
- Visser, S.M.; Sterk, G. Nutrient dynamics—Wind and water erosion at the village scale in the Sahel. Land Degrad. Dev. 2007, 18, 578–588. [Google Scholar] [CrossRef]
- Middleton, N.J. Desert dust hazards: A global review. Aeolian Res. 2017, 24, 53–63. [Google Scholar] [CrossRef]
- Ginoux, P.; Prospero, J.; Gill, T.E.; Hsu, N.; Zhao, M. Global-scale attribution of anthropogenic and natural dust sources and their emission rates based on MODIS Deep Blue aerosol products. Rev. Geophys. 2012, 50, 3005. [Google Scholar] [CrossRef]
- Tegen, I.; Werner, M.; Harrison, S.P.; Kohfeld, K.E. Relative importance of climate and land use in determining present and future global soil dust emission. Geophys. Res. Lett. 2004, 31. [Google Scholar] [CrossRef] [Green Version]
- Prospero, J.M.; Ginoux, P.; Torres, O.; Nicholson, S.E.; Gill, T.E. Environmental characterization of global sources of atmospheric soil dust identified with the Nimbus 7 total ozone mapping spectrometer (TOMS) absorbing aerosol product. Rev. Geophys. 2002, 40, 2–31. [Google Scholar] [CrossRef]
- Ries, J.B.; Seeger, M.; Iserloh, T.; Wistorf, S.; Fister, W. Calibration of simulated rainfall characteristics for the study of soil erosion on agricultural land. Soil Tillage Res. 2009, 106, 109–116. [Google Scholar] [CrossRef]
- Colazo, J.C.; Buschiazzo, D. The impact of agriculture on soil texture due to wind erosion. L. Degrad. Dev. 2015, 26, 62–70. [Google Scholar] [CrossRef]
- Stout, J.E.; Zobeck, T.M. The Wolfforth field experiment: A wind erosion study. Soil Sci. 1996, 161, 616–632. [Google Scholar] [CrossRef]
- Zobeck, T.M.; Van Pelt, R.S. Wind-induced dust generation and transport mechanics on a bare agricultural field. J. Hazard. Mater. 2006, 132, 26–38. [Google Scholar] [CrossRef] [PubMed]
- Zobeck, T.M.; Sterk, G.; Funk, R.; Rajot, J.L.; Stout, J.E.; Van Pelt, R.S. Measurement and data analysis methods for field-scale wind erosion studies and model validation. Earth Surf. Process. Landf. 2003, 28, 1163–1188. [Google Scholar] [CrossRef]
- Funk, R.; Reuter, H.; Hoffmann, C.; Engel, W.; Oettl, D. Effect of moisture on fine dust emission from tillage operations on agricultural soils. Earth Surf. Process. Landf. 2008, 33, 1851–1863. [Google Scholar] [CrossRef]
- Vickery, K.J.; Eckardt, F.D.; Bryant, R.G. A sub-basin scale dust plume source frequency inventory for southern Africa, 2005–2008. Geophys. Res. Lett. 2013, 40, 5274–5279. [Google Scholar] [CrossRef] [Green Version]
- Eckardt, F.D.; Bekiswa, S.; Von Holdt, J.; Jack, C.; Kuhn, N.J.; Mogane, F.; Murray, J.E.; Ndara, N.; Palmer, A. South Africa’s agricultural dust sources and events from MSG SEVIRI. Aeolian Res. 2020, 47, 100637. [Google Scholar] [CrossRef]
- Webb, N.P.; Strong, C.L.; Chappell, A.; Marx, S.K.; McTainsh, G.H. Soil organic carbon enrichment of dust emissions: Magnitude, mechanisms and its implications for the carbon cycle. Earth Surf. Process. Landf. 2013, 38, 1662–1671. [Google Scholar] [CrossRef]
- Holmes, P.; Bateman, M.; Thomas, D.; Telfer, M.; Barker, C.H.; Lawson, M. A Holocene late Pleistocene aeolian record from lunette dunes in the western free State panfield, South Africa. Holocene 2008, 18, 1193–1205. [Google Scholar] [CrossRef]
- Holmes, P.; Thomas, D.; Bateman, M.; Wiggs, G.F.S.; Rabumbulu, M. Evidence for land degradation from aeolian sediment in the West-Central free state province, South Africa. L. Degrad. Dev. 2012, 23. [Google Scholar] [CrossRef]
- Wiggs, G.F.S.; Holmes, P. Dynamic controls on wind erosion and dust generation on west-central free state agricultural land, South Africa. Earth Surf. Process. Landf. 2011, 36, 827–838. [Google Scholar] [CrossRef]
- Hu, Y.; Fister, W.; Kuhn, N.J. Temporal variation of SOC enrichment from interrill erosion over prolonged rainfall simulations. Agriculture 2013, 3, 726–740. [Google Scholar] [CrossRef] [Green Version]
- Le Bissonnais, Y.; Renaux, B.; Delouche, H. Interactions between soil properties and moisture content in crust formation, runoff and interrill erosion from tilled loess soils. CATENA 1995, 25, 33–46. [Google Scholar] [CrossRef]
- Belnap, J. Comparative structure of physical and biological soil crusts. In Biological Soil Crusts: Structure, Function, and Management; Belnap, J., Lange, O.L., Eds.; Springer: Berlin/Heidelberg, Germany, 2001; pp. 177–191. [Google Scholar]
- Rice, M.A.; McEwan, I.K. Crust strength: A wind tunnel study of the effect of impact by saltating particles on cohesive soil surfaces. Earth Surf. Process. Landf. 2001, 26, 721–733. [Google Scholar] [CrossRef]
- Rice, M.A.; Willetts, B.B.; McEwan, I.K. Wind erosion of crusted soil sediments. Earth Surf. Process. Landf. 1996, 21, 279–293. [Google Scholar] [CrossRef]
- Houser, C.A.; Nickling, W.G. The emission and vertical flux of particulate matter <10 μm from a disturbed clay-crusted surface. Sedimentology 2001, 48, 255–267. [Google Scholar] [CrossRef]
- Zobeck, T.M. Abrasion of crusted soils: Influence of abrader flux and soil properties. Soil Sci. Soc. Am. J. 1991, 55, 1091–1097. [Google Scholar] [CrossRef]
- Gillette, D.A. Threshold friction velocities for dust production for agricultural soils. J. Geophys. Res. Atmos. 1988, 93, 12645–12662. [Google Scholar] [CrossRef] [Green Version]
- Gillette, D.A.; Niemeyer, T.C.; Helm, P.J. Supply-limited horizontal sand drift at an ephemerally crusted, unvegetated saline playa. J. Geophys. Res. Atmos. 2001, 106, 18085–18098. [Google Scholar] [CrossRef]
- Goossens, D. Effect of soil crusting on the emission and transport of wind-eroded sediment: Field measurements on loamy sandy soil. Geomorphology 2004, 58, 145–160. [Google Scholar] [CrossRef]
- Sharratt, B.; Vaddella, V. Threshold friction velocity of crusted windblown soils in the Columbia plateau. Aeolian Res. 2014, 15. [Google Scholar] [CrossRef]
- Sterk, G.; López, M.V.; Arrúe, J.L. Saltation transport on a silt loam soil in northeast Spain. L. Degrad. Dev. 1999, 10, 545–554. [Google Scholar] [CrossRef]
- Gillette, D.A.; Adams, J.; Endo, A.; Smith, D.; Kihl, R. Threshold velocities for input of soil particles into the air by desert soils (Mojave). J. Geophys. Res. 1980, 85, 5621–5630. [Google Scholar] [CrossRef]
- Gillette, D.A.; Adams, J.; Muhs, D.; Kihl, R. Threshold friction velocities and rupture moduli for crusted desert soils for the input of soil particles into the air. J. Geophys. Res. Ocean. 1982, 87, 9003–9015. [Google Scholar] [CrossRef] [Green Version]
- Yan, Y.; Wu, L.; Xin, X.; Wang, X.; Yang, G. How rain-formed soil crust affects wind erosion in a semi-arid steppe in northern China. Geoderma 2015, 249, 79–86. [Google Scholar] [CrossRef]
- Klose, M.; Gill, T.E.; Etyemezian, V.; Nikolich, G.; Ghodsi Zadeh, Z.; Webb, N.P.; Van Pelt, R.S. Dust emission from crusted surfaces: Insights from field measurements and modelling. Aeolian Res. 2019, 40, 1–14. [Google Scholar] [CrossRef]
- Rice, M.A.; McEwan, I.K.; Mullins, C.E. A conceptual model of wind erosion of soil surfaces by saltating particles. Earth Surf. Process. Landf. 1999, 24, 383–392. [Google Scholar] [CrossRef]
- Rajot, J.L.; Alfaro, S.C.; Gomes, L.; Gaudichet, A. Soil crusting on sandy soils and its influence on wind erosion. Catena 2003, 53, 1–16. [Google Scholar] [CrossRef]
- Sanchez, P.; Ahamed, S.; Carré, F.; Hartemink, A.; Hempel, J.; Huising, J.; Lagacherie, P.; Mcbratney, A.; McKenzie, N.; Mendonça Santos, M.; et al. Digital soil map of the world. Science 2009, 325, 680–681. [Google Scholar] [CrossRef] [PubMed] [Green Version]
- Houyou, Z.; Bielders, C.L.; Benhorma, H.A.; Dellal, A.; Boutemdjet, A. Evidence of strong land degradation by wind erosion as a result of rainfed cropping in the Algerian steppe: A case study at Laghouat. Land Degrad. Dev. 2016, 27, 1788–1796. [Google Scholar] [CrossRef]
- Mctainsh, G.H.; Lynch, A.W.; Burgess, R.C. Wind erosion in eastern Australia. Soil Res. 1990, 28, 323–339. [Google Scholar] [CrossRef]
- Hartemink, A.; Huting, J.R.M. Land cover, extent, and properties of arenosols in Southern Africa. Arid L. Res. Manag. 2008, 22. [Google Scholar] [CrossRef]
- Guo, Z.; Huang, N.; Dong, Z.; Van Pelt, R.; Zobeck, T.M. Wind erosion induced soil degradation in Northern China: Status, measures and perspective. Sustainability 2014, 6, 8951–8966. [Google Scholar] [CrossRef] [Green Version]
- Harper, R.J.; Gilkes, R.J. Evaluation of the 137Cs techniques for estimating wind erosion losses for some sandy Western Australian soils. Soil Res. 1994, 32, 1369–1387. [Google Scholar] [CrossRef]
- Nan, L.; Dong, Z.; Xiao, W.; Li, C.; Xiao, N.; Song, S.; Xiao, F.; Du, L. A field investigation of wind erosion in the farming–pastoral ecotone of northern China using a portable wind tunnel: A case study in Yanchi County. J. Arid Land 2018, 10, 27–38. [Google Scholar] [CrossRef] [Green Version]
- Goossens, D.; Buck, B. Dust dynamics in off-road vehicle trails: Measurements on 16 arid soil types, Nevada, USA. J. Environ. Manag. 2009, 90, 3458–3469. [Google Scholar] [CrossRef]
- Houser, C.; Nickling, W. The factors influencing the abrasion efficiency of saltating grains on a clay-crusted playa. Earth Surf. Process. Landf. 2001, 26, 491–505. [Google Scholar] [CrossRef]
- von Holdt, J.R.C.; Eckardt, F.D.; Baddock, M.C.; Wiggs, G.F.S. Assessing landscape dust emission potential using combined ground-based measurements and remote sensing data. J. Geophys. Res. Earth Surf. 2019, 124, 1080–1098. [Google Scholar] [CrossRef] [Green Version]
- Department of Agriculture, Forestry and Fisheries. Abstract of Agricultural Statistics 2018; Department of Agriculture, Forestry and Fisheries: Pretoria, South Africa, 2018.
- Hu, Y.; Berhe, A.A.; Fogel, M.L.; Heckrath, G.J.; Kuhn, N.J. Transport-distance specific SOC distribution: Does it skew erosion induced C fluxes? Biogeochemistry 2016, 128, 339–351. [Google Scholar] [CrossRef]
- Caviezel, C.; Hunziker, M.; Kuhn, N.J. Bequest of the Norseman—The potential for agricultural intensification and expansion in Southern Greenland under climate change. Land 2017, 6, 87. [Google Scholar] [CrossRef] [Green Version]
- Fister, W.; Goldman, N.; Mayer, M.; Suter, M.; Kuhn, N.J. Testing of photogrammetry for differentiation of soil organic carbon and biochar in sandy substrates. Geogr. Helv. 2019, 74, 81–91. [Google Scholar] [CrossRef] [Green Version]
- van Dijk, A.I.J.; Bruijnzeel, L.A.; Rosewell, C.J. Rainfall intensity–kinetic energy relationships: A critical literature appraisal. J. Hydrol. 2002, 261, 1–23. [Google Scholar] [CrossRef]
- Kuhn, N.J.; Bryan, R.B. Drying, soil surface condition and interrill erosion on two Ontario soils. Catena 2004, 57, 113–133. [Google Scholar] [CrossRef]
- Zimbone, S.M.; Vickers, A.; Morgan, R.P.C.; Vella, P. Field investigations of different techniques for measuring surface soil shear strength. Soil Technol. 1996, 9, 101–111. [Google Scholar] [CrossRef]
- Ishizuka, M.; Mikami, M.; Leys, J.F.; Yamada, Y.; Heidenreich, S.; Shao, Y.; McTainsh, G.H. Effects of soil moisture and dried raindroplet crust on saltation and dust emission. J. Geophys. Res. Atmos. 2008, 113. [Google Scholar] [CrossRef] [Green Version]
- Chen, W.; Zhibao, D.; Zhenshan, L.; Zuotao, Y. Wind tunnel test of the influence of moisture on the erodibility of loessial sandy loam soils by wind. J. Arid Environ. 1996, 34, 391–402. [Google Scholar] [CrossRef]
- Munkhtsetseg, E.; Shinoda, M.; Gillies, J.A.; Kimura, R.; King, J.; Nikolich, G. Relationships between soil moisture and dust emissions in a bare sandy soil of Mongolia. Particuology 2016, 28, 131–137. [Google Scholar] [CrossRef]
- Feng, G.; Sharratt, B.; Vaddella, V. Windblown soil crust formation under light rainfall in a semiarid region. Soil Tillage Res. 2013, 128, 91–96. [Google Scholar] [CrossRef]
- Borselli, L.; Biancalani, R.; Giordani, C.; Carnicelli, S.; Ferrari, G.A. Effect of gypsum on seedling emergence in a kaolinitic crusting soil. Soil Technol. 1996, 9, 71–81. [Google Scholar] [CrossRef]
- Bradford, J.M.; Grossman, R.B. In-situ measurement of near-surface soil strength by the fall-cone device. Soil Sci. Soc. Am. J. 1982, 46, 685–688. [Google Scholar] [CrossRef]
- Campbell, D.J. Plastic limit determination using a drop-cone penetrometer. J. Soil Sci. 1976, 27, 295–300. [Google Scholar] [CrossRef]
- Han, Y.; Fan, Y.; Zhongbao, X.; Wang, L.; Cai, Q.; Wang, X. Effects of wetting rate and simulated rain duration on soil crust formation of red loam. Environ. Earth Sci. 2016, 75. [Google Scholar] [CrossRef]
- Ghadiri, H. Crater formation in soils by raindrop impact. Earth Surf. Process. Landf. 2004, 29, 77–89. [Google Scholar] [CrossRef] [Green Version]
- Rice, M.A.; Mullins, C.E.; McEwan, I.K. An analysis of soil crust strength in relation to potential abrasion by saltating particles. Earth Surf. Process. Landf. 1997, 22, 869–883. [Google Scholar] [CrossRef]
- Li, J.; Okin, G.; Herrick, J.; Belnap, J.; Munson, S.; Miller, M. A simple method to estimate threshold friction velocity of wind erosion in the field. Geophys. Res. Lett. 2010, 37. [Google Scholar] [CrossRef]
- Sweeney, M.R.; Mason, J.A. Mechanisms of dust emission from Pleistocene loess deposits, Nebraska, USA. J. Geophys. Res. Earth Surf. 2013, 118, 1460–1471. [Google Scholar] [CrossRef]
- Hansbo, S. A new approach to determination of shear strength of clay by the fall cone test. Swed. Geotech. Inst. Proc. 1957, 14, 5–47. [Google Scholar]
- Becher, H.H.; Breuer, J.; Klingler, B. An index value for characterizing hardsetting soils by fall-cone penetration. Soil Technol. 1997, 10, 47–56. [Google Scholar] [CrossRef]
- Etyemezian, V.; Nikolich, G.; Ahonen, S.; Pitchford, M.; Sweeney, M.; Purcell, R.; Gillies, J.A.; Kuhns, H. The portable in situ wind erosion laboratory (PI-SWERL): A new method to measure PM10 windblown dust properties and potential for emissions. Atmos. Environ. 2007, 41, 3789–3796. [Google Scholar] [CrossRef]
- Etyemezian, V.; Gillies, J.A.; Shinoda, M.; Nikolich, G.; King, J.; Bardis, A.R. Accounting for surface roughness on measurements conducted with PI-SWERL: Evaluation of a subjective visual approach and a photogrammetric technique. Aeolian Res. 2014, 13, 35–50. [Google Scholar] [CrossRef]
- Van Leeuwen, C.C.E.; Fister, W.; Vos, H.C.; Cammeraat, L.H.; Kuhn, N.J. A cross-comparison between a traditional portable straight-line wind tunnel and PI-SWERL. Aeolian Res. submitted for publication.
- Shao, Y.; Raupach, M.R.; Findlater, P.A. Effect of saltation bombardment on the entrainment of dust by wind. J. Geophys. Res. Atmos. 1993, 98, 12719–12726. [Google Scholar] [CrossRef] [Green Version]
- Munkhtsetseg, E.; Shinoda, M.; Ishizuka, M.; Mikami, M.; Kimura, R.; Nikolich, G. Anthropogenic dust emissions due to livestock trampling in a Mongolian temperate grassland. Atmos. Chem. Phys. 2017, 17, 11389–11401. [Google Scholar] [CrossRef] [Green Version]
- Hiernaux, P.; Bielders, C.L.; Valentin, C.; Bationo, A.; Fernández-Rivera, S. Effects of livestock grazing on physical and chemical properties of sandy soils in Sahelian rangelands. J. Arid Environ. 1999, 41, 231–245. [Google Scholar] [CrossRef] [Green Version]
- Liu, T.; Xu, X.; Yang, J. Experimental study on the effect of freezing-thawing cycles on wind erosion of black soil in Northeast China. Cold Reg. Sci. Technol. 2017, 136, 1–8. [Google Scholar] [CrossRef]
- Wang, L.; Shi, Z.H.; Wu, G.L.; Fang, N.F. Freeze/thaw and soil moisture effects on wind erosion. Geomorphology 2014, 207, 141–148. [Google Scholar] [CrossRef]
- Greenwood, P.; Fister, W.; Kinnell, P.I.A.; Rüegg, H.-R.; Kuhn, N.J. Developing and testing a precision erosion measurement facility for elucidating mobilization mechanisms in shallow-flow conditions. Desertif. L. Degrad. 2013, 105. [Google Scholar]
- Marticorena, B.; Bergametti, G.; Gillette, D.; Belnap, J. Factors controlling threshold friction velocity in semiarid and arid areas of the United States. J. Geophys. Res. Atmos. 1997, 102, 23277–23287. [Google Scholar] [CrossRef]
- Langston, G.; Neuman, C.M. An experimental study on the susceptibility of crusted surfaces to wind erosion: A comparison of the strength properties of biotic and salt crusts. Geomorphology 2005, 72, 40–53. [Google Scholar] [CrossRef]
Figure 1.
South Africa with the Free State province marked in dark orange (a) and the soil map of the research area with the location of the studied fields, see also Table 1 (b). Province borders come from the GADM database (www.gadm.org), version 2.5, July 2015. The soil map data was extracted from the Soil and Terrain Database (SOTER) for South Africa (FAO-ISRIC 2003).

Figure 2.
Wind rose from the study area north of Bultfontein. (a) shows the annual data from 2006 to 2016 and (b) shows the winds during the dust season, from August until November. This data was obtained from the ARC weather station.
Figure 2.
Wind rose from the study area north of Bultfontein. (a) shows the annual data from 2006 to 2016 and (b) shows the winds during the dust season, from August until November. This data was obtained from the ARC weather station.

Figure 3.
The average rainfall (blue bars), the minimum (grey) and maximum (red) temperature per month, and the general periods of agricultural activity (bottom). Note that these periods are generalized to present an overview and can differ depending on the weather, crop, and farmer’s preference.
Figure 3.
The average rainfall (blue bars), the minimum (grey) and maximum (red) temperature per month, and the general periods of agricultural activity (bottom). Note that these periods are generalized to present an overview and can differ depending on the weather, crop, and farmer’s preference.

Figure 4.
Overview of fields from which the crust strength was measured.

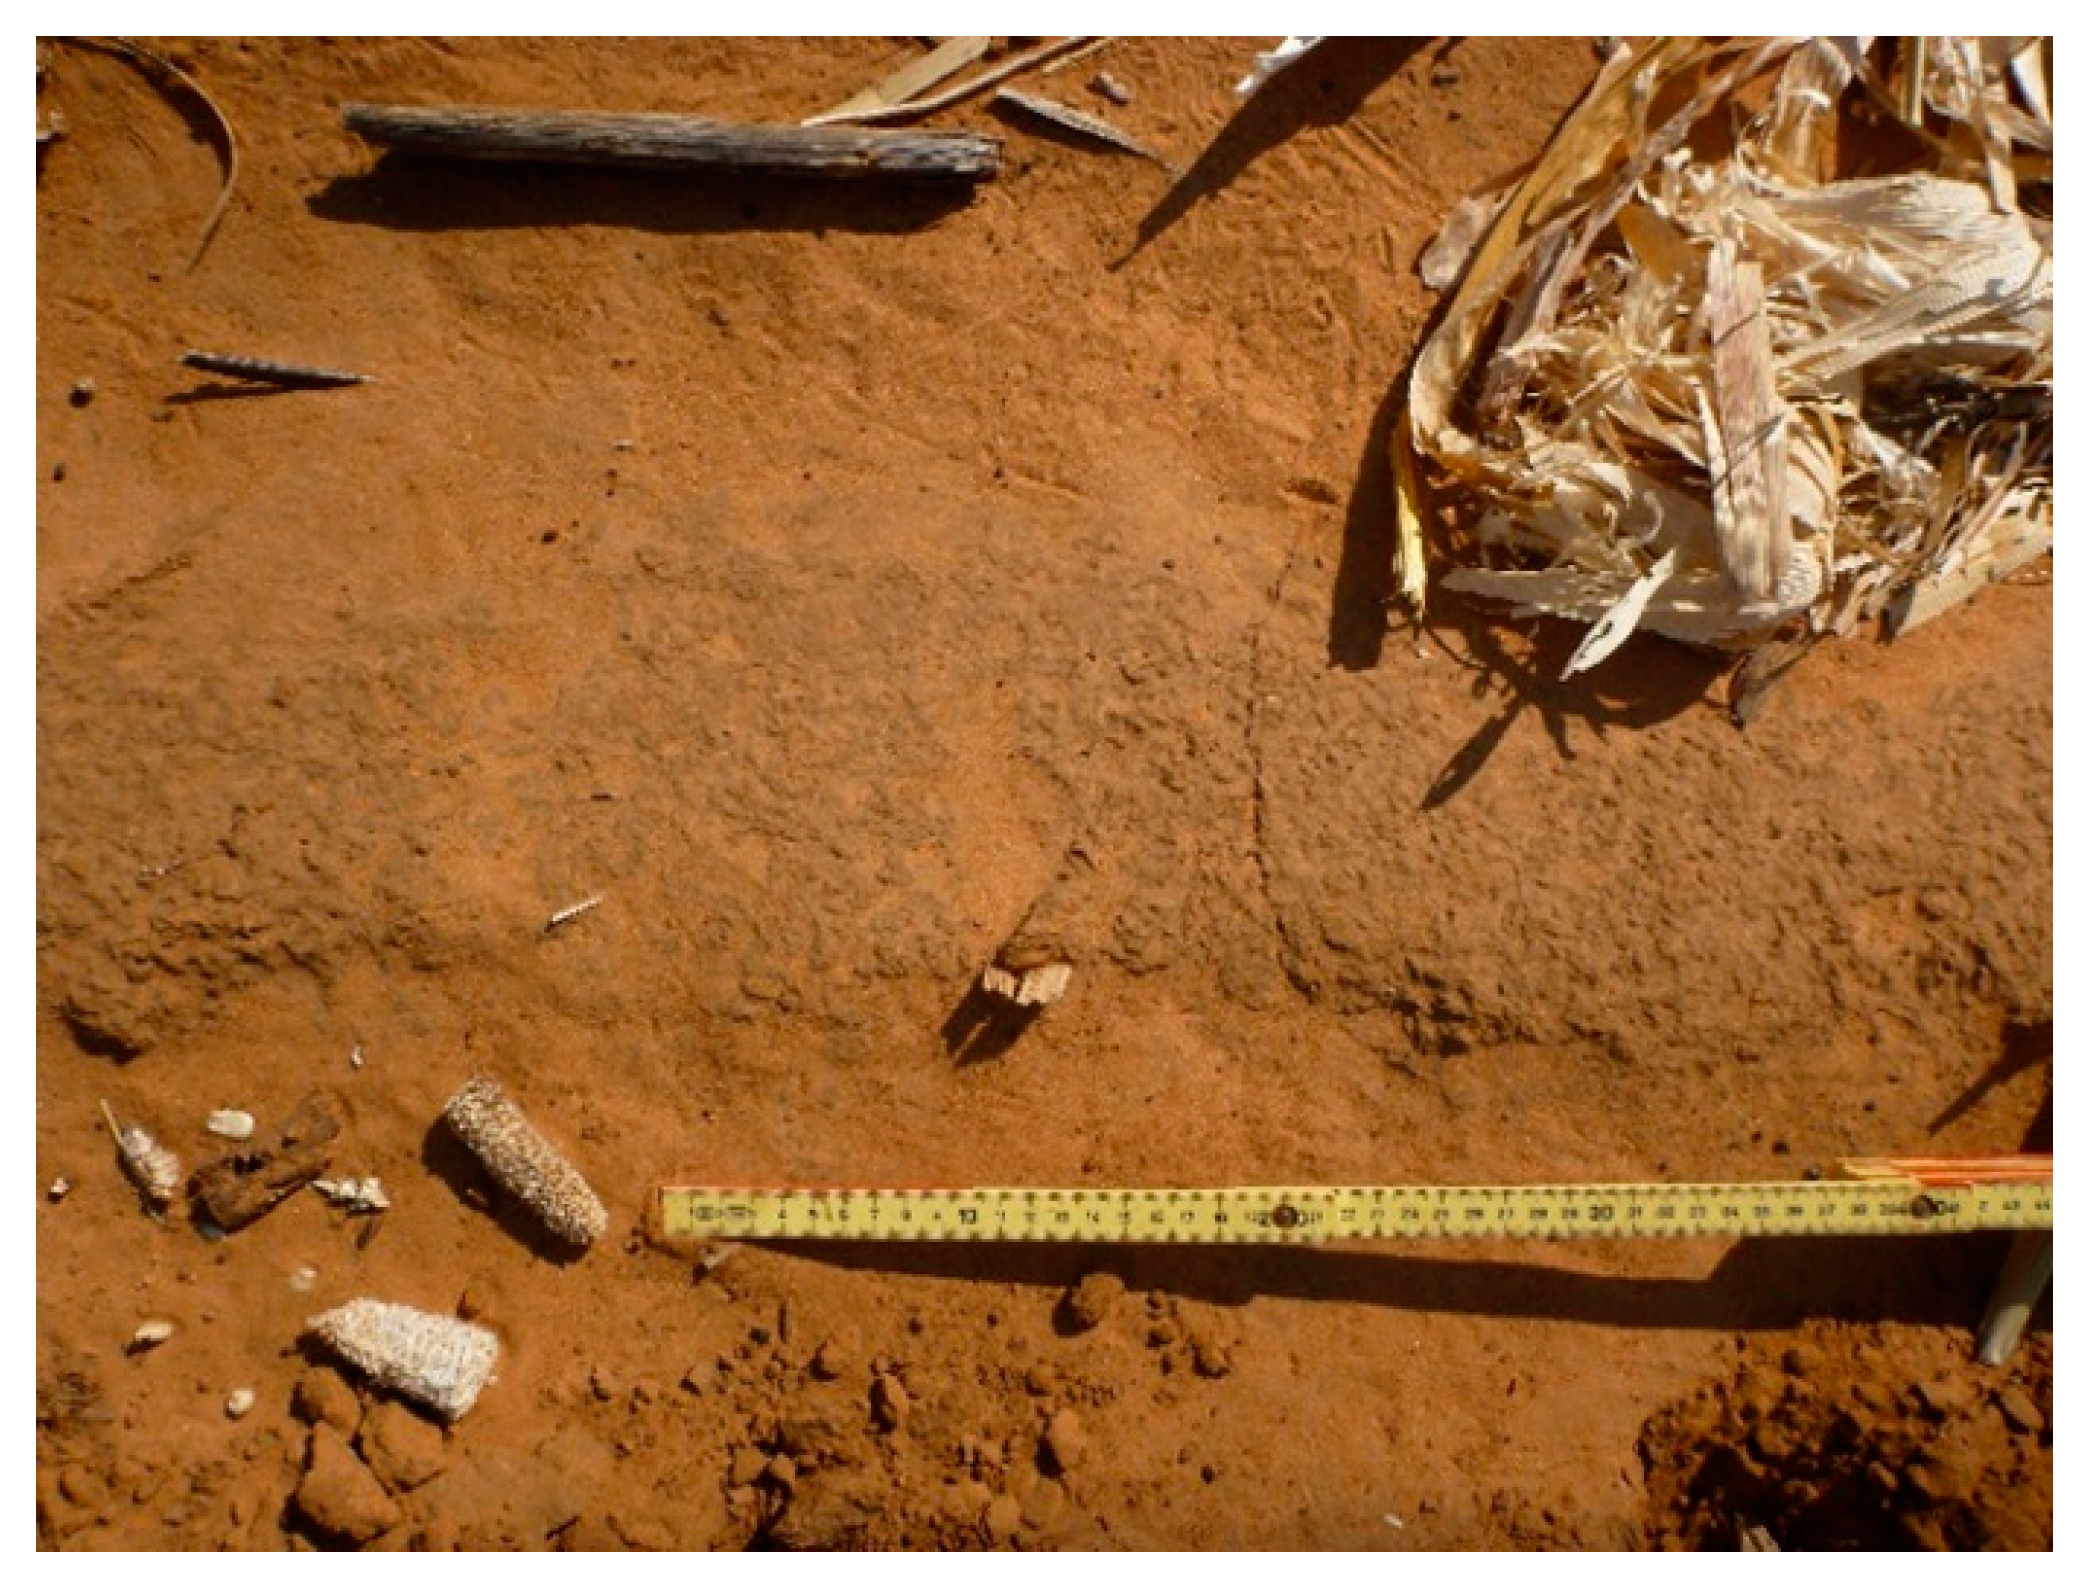
Figure 5.
Intact crust on Arenosol in field 2.

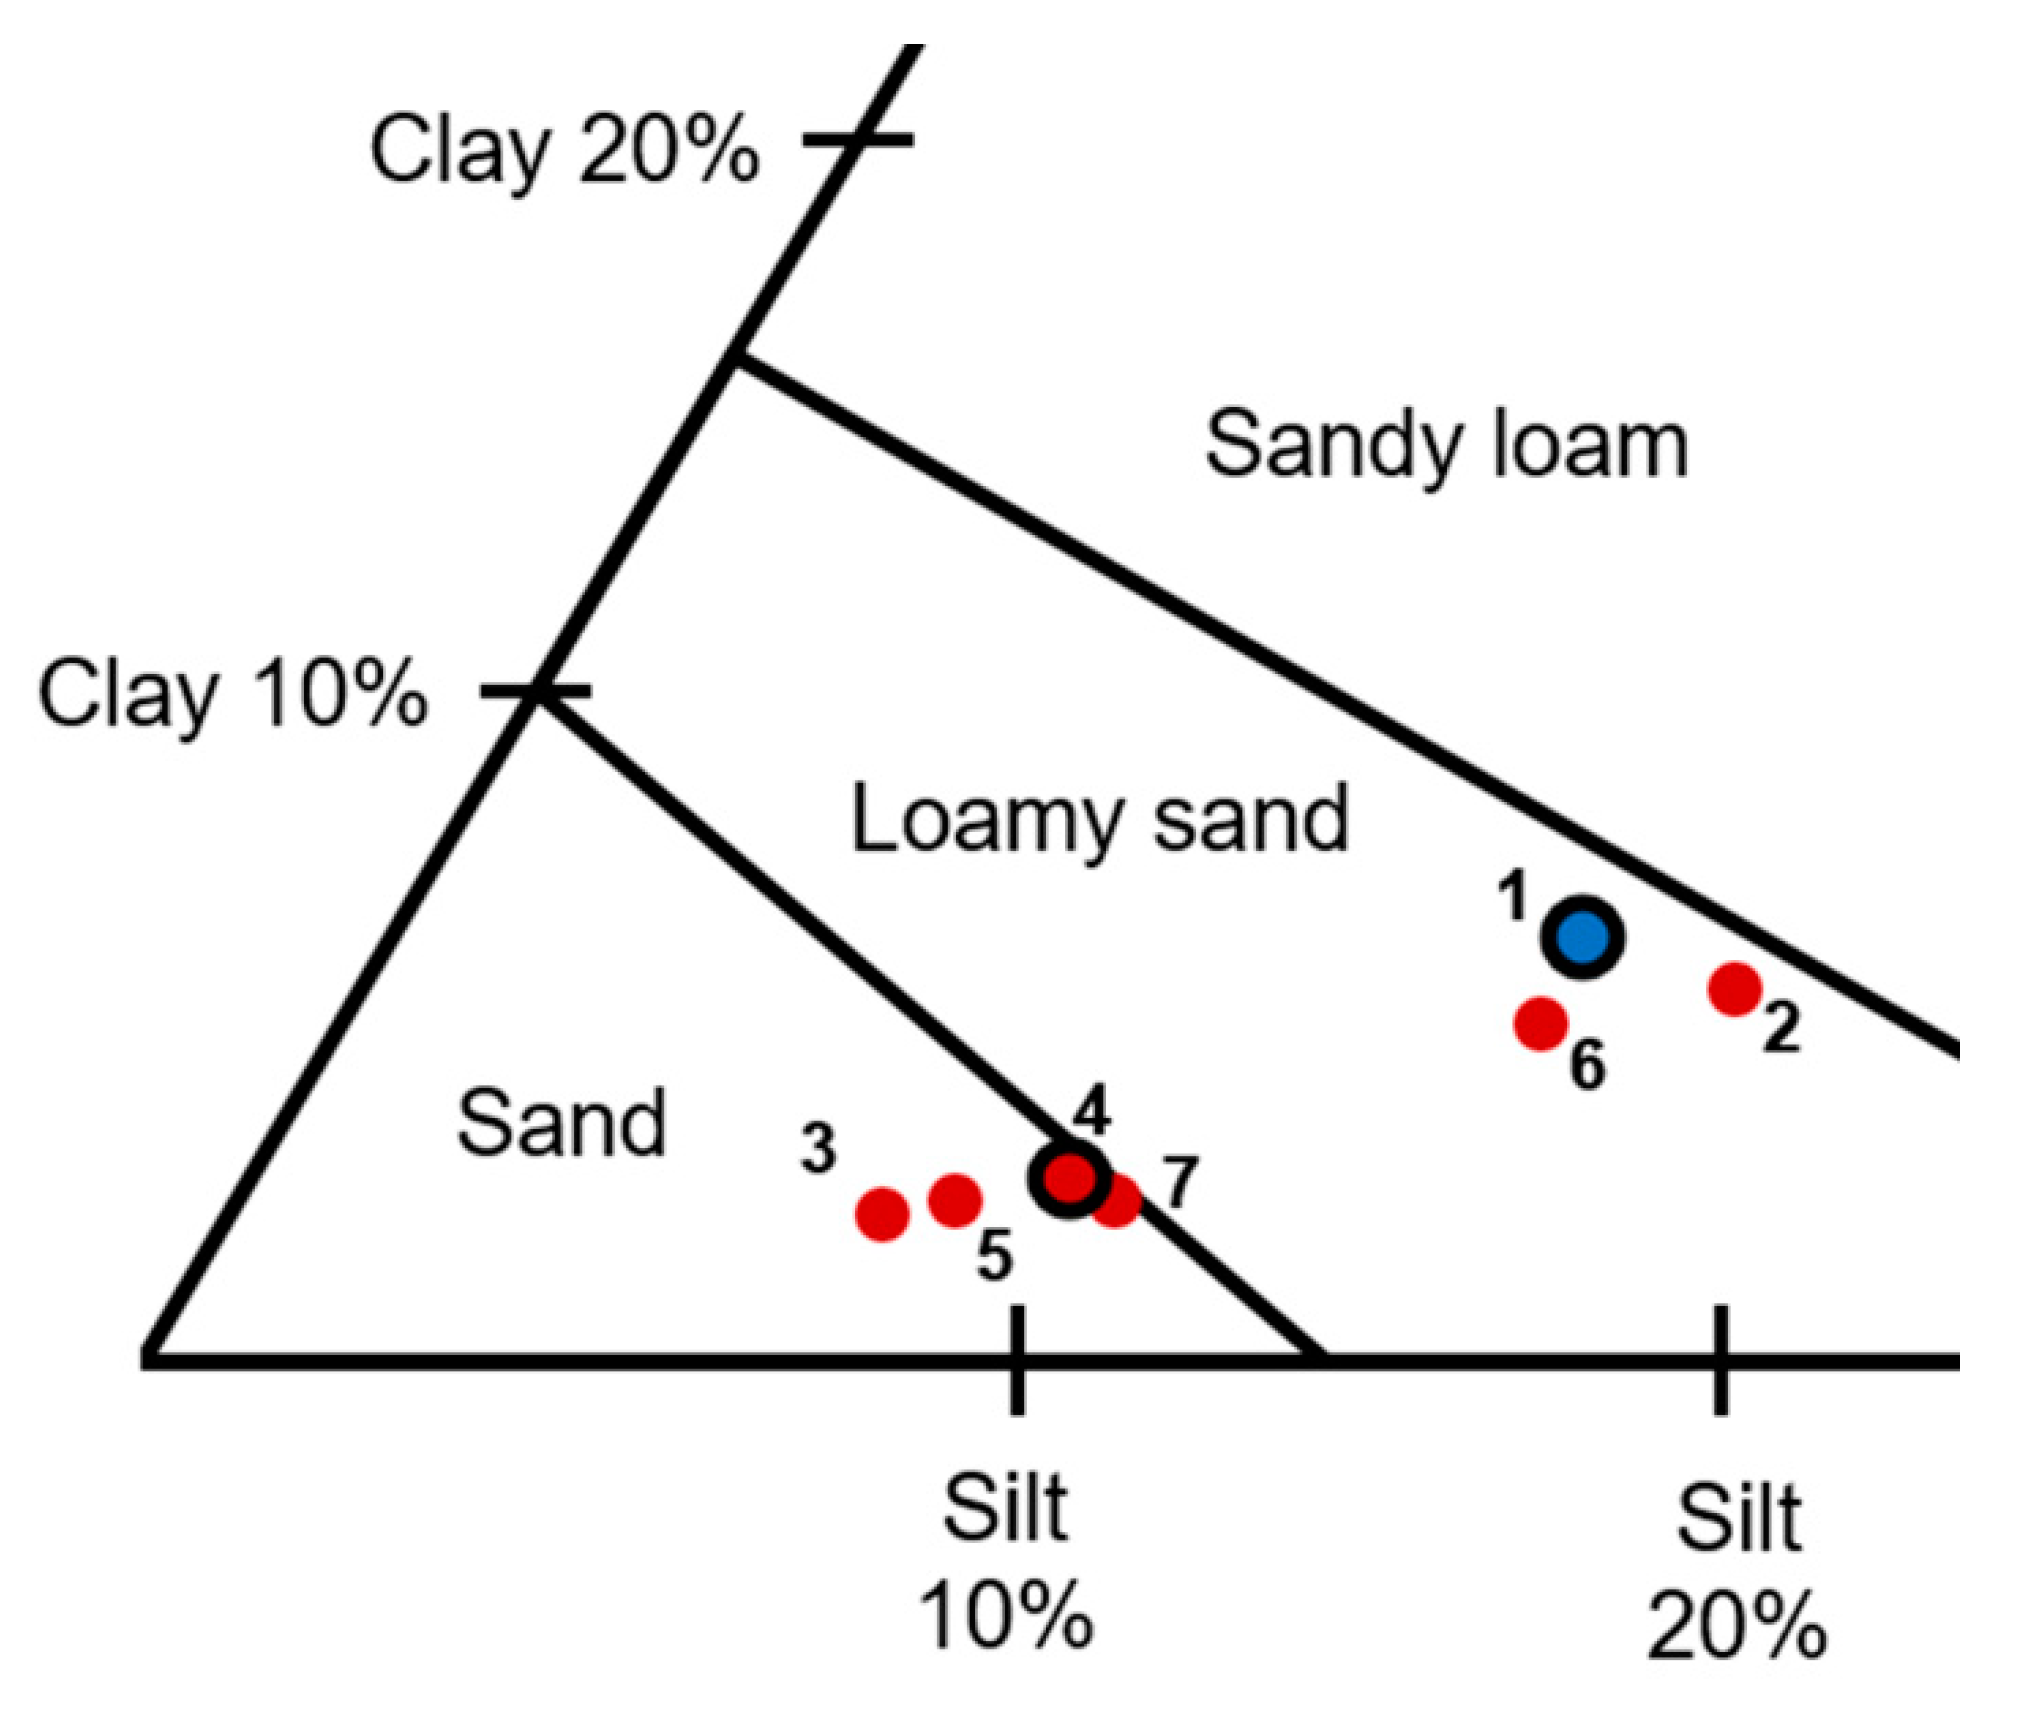
Figure 6.
Close-up of the soil triangle with the measured soil points. The red point represents Arenosol and the blue one Luvisol according to the SOTER database. The marked points of field 1 and field 4 were used for further rainfall and wind erosion experiments.
Figure 6.
Close-up of the soil triangle with the measured soil points. The red point represents Arenosol and the blue one Luvisol according to the SOTER database. The marked points of field 1 and field 4 were used for further rainfall and wind erosion experiments.

Figure 7.
Schematic overview of the tray set-up for the rainfall experiments.

Figure 8.
The crust strength measurements from crusts in the field measured using the fall cone (n = 20), torvane (n = 10). Error bars are 95% confidence intervals.
Figure 8.
The crust strength measurements from crusts in the field measured using the fall cone (n = 20), torvane (n = 10). Error bars are 95% confidence intervals.

Figure 9.
Thin section from the top of an Arenosol crust that formed with 20 mm of rainfall showing the thin dense layer of fine particles at the top of the crust.
Figure 9.
Thin section from the top of an Arenosol crust that formed with 20 mm of rainfall showing the thin dense layer of fine particles at the top of the crust.

Figure 10.
Results from the rainfall experiments, error bars show the standard deviation calculated from 9 measurements. The regression shown is calculated from the single event rainfall.
Figure 10.
Results from the rainfall experiments, error bars show the standard deviation calculated from 9 measurements. The regression shown is calculated from the single event rainfall.

Figure 11.
PM10 concentration measured during the PI-SWERL runs on several crusted and non-crusted surfaces (RPM = Revolutions Per Minute).
Figure 11.
PM10 concentration measured during the PI-SWERL runs on several crusted and non-crusted surfaces (RPM = Revolutions Per Minute).

Figure 12.
A Luvisol crust from 15 mm rainfall before (a) and after (b) a PI-SWERL run with the addition of abraders.
Figure 12.
A Luvisol crust from 15 mm rainfall before (a) and after (b) a PI-SWERL run with the addition of abraders.

Figure 13.
The relative abrasion efficiency over time during the PI-SWERL experiments with abraders.
Figure 13.
The relative abrasion efficiency over time during the PI-SWERL experiments with abraders.

Figure 14.
The emission flux calculated from the PI-SWERL experiments, using Equation (3).


Table 1.
Field test sites in the study area and the soil chemistry from the observed fields.
| Field | Soil | Description | Crust Presence | TOC% | pH | Silt/Sand |
|---|---|---|---|---|---|---|
| Field 1 | Luvisol | Plowed and bare field | No | 0.25 | 6.06 | 0.19 |
| Field 2 | Arenosol | Unharvested maize field | Yes | 0.47 | 6.32 | 0.23 |
| Field 3 | Arenosol | Peanut field, harvested | Yes | 0.19 | 6.30 | 0.09 |
| Field 4 | Arenosol | Maize field, harvested and deep ripped | Yes | 0.18 | 6.32 | 0.12 |
| Field 5 | Arenosol | Sunflower field, harvested | Yes | 0.18 | 6.08 | 0.10 |
| Field 6 | Arenosol | Maize field, unharvested | Yes | 0.32 | 6.81 | 0.19 |
| Field 7 | Arenosol | Harvested maize field, grazed by cattle | Yes | 0.16 | 6.30 | 0.13 |
Table 2.
Summary table of performed PI-SWERL runs.
| Soil | Crust | Abrader Addition | n (Per Soil Type) | Time (s) at 0.59 m s−1 |
|---|---|---|---|---|
| AR and LV | Loose soil | No | 6 | 30 |
| Crusted by 15 mm of rainfall | No | 3 | 120 | |
| Yes | 3 | 120 |
Table 3.
p-Values from two-tailed t-test.
| Rainfall Amount | AR versus LV | Single Event versus Sequenced Rainfall | ||
|---|---|---|---|---|
| Single Event | Sequenced | AR | LV | |
| 5 mm | 0.140 | - | ||
| 10 mm | 0.995 | 0.066 | 0.074 | 0.497 |
| 15 mm | 0.071 | 0.050 | 0.032 | 0.301 |
| 20 mm | 0.001 | 0.001 | 0.000 | 0.025 |
Table 4.
Summary of results from PI-SWERL measurements on experimental crusts.
| Soil Type | Experiment Type | Average Threshold Friction Velocity (m s−1) | Average Flux (mg m−2 s−1) | Flux Ratio to Loose Run | Relative Abrasion Efficiency | Shear Strength (kPa) |
|---|---|---|---|---|---|---|
| AR | Loose | 0.305 | 3.872 | - | - | - |
| Crust | - | 0.0053 | 0.14% | - | 68.1 | |
| Abraders | 0.436 | 0.311 | 8.03% | 0.012 | - | |
| LV | Loose | 0.272 | 10.534 | - | - | - |
| Crust | - | 0.0278 | 0.26% | - | 92.0 | |
| Abraders | 0.357 | 0.425 | 4.03% | 0.013 | - |
Publisher’s Note: MDPI stays neutral with regard to jurisdictional claims in published maps and institutional affiliations. |
© 2020 by the authors. Licensee MDPI, Basel, Switzerland. This article is an open access article distributed under the terms and conditions of the Creative Commons Attribution (CC BY) license (http://creativecommons.org/licenses/by/4.0/).
Share and Cite
MDPI and ACS Style
Vos, H.C.; Fister, W.; Eckardt, F.D.; Palmer, A.R.; Kuhn, N.J. Physical Crust Formation on Sandy Soils and Their Potential to Reduce Dust Emissions from Croplands. Land 2020, 9, 503. https://0-doi-org.brum.beds.ac.uk/10.3390/land9120503
AMA Style
Vos HC, Fister W, Eckardt FD, Palmer AR, Kuhn NJ. Physical Crust Formation on Sandy Soils and Their Potential to Reduce Dust Emissions from Croplands. Land. 2020; 9(12):503. https://0-doi-org.brum.beds.ac.uk/10.3390/land9120503
Chicago/Turabian StyleVos, Heleen C., Wolfgang Fister, Frank D. Eckardt, Anthony R. Palmer, and Nikolaus J. Kuhn. 2020. "Physical Crust Formation on Sandy Soils and Their Potential to Reduce Dust Emissions from Croplands" Land 9, no. 12: 503. https://0-doi-org.brum.beds.ac.uk/10.3390/land9120503
Note that from the first issue of 2016, this journal uses article numbers instead of page numbers. See further details here.