Cocoa Production and Forest Dynamics in Ivory Coast from 1985 to 2019
by
 and
and
Barima Yao Sadaiou Sabas
1,*, 
Konan Gislain Danmo
1,
Kouakou Akoua Tamia Madeleine
1 and
Bogaert Jan
2 1
Environment Training and Research Unit, Jean Lorougnon Guédé University, Post Box 150 Daloa, Cote D’Ivoire
2
Gembloux Agro-Bio Tech, Biodiversity and Landscape Unit, University of Liège, Passage des Déportés 2, 5030 Gembloux, Belgium
*
Author to whom correspondence should be addressed.
Land 2020, 9(12), 524; https://0-doi-org.brum.beds.ac.uk/10.3390/land9120524
Submission received: 9 November 2020
/
Revised: 11 December 2020
/
Accepted: 11 December 2020
/
Published: 16 December 2020
Abstract
:The cocoa economy of Ivory Coast started in the eastern part of the country in the 1970s and spread to the central-western and then south-western regions. For nearly a decade, it has been in the West of Ivory Coast with a population increase caused by large waves of migration. This study aims to determine different factors explaining dynamics of the cocoa economy from the East to West of Ivory Coast. The method adopted consisted of processing Landsat images from 1985–2018 and an individual survey of 278 heads of households. The results obtained showed that the development of the cocoa economy led forest cover degradation with a total loss estimated at 60.80%, 46.39%, 20.76% and 51.18% of forest area in the East, Centre-West, South-West and West, respectively. The creation of new cocoa farms in the West of Ivory Coast is governed by non-native people (51.13%) settled between 2010 and 2018. About 41% of these producers come mainly from the Centre-West (25%) and the South-West (16%). In addition, 29% of producers come from the West of Ivory Coast. Despite the abiotic characteristics being considered unfavourable, the west of Ivory Coast is in the process of becoming the country’s new zone of high cocoa production.
1. Introduction
The different uses of forest land and their evolution lead to the degradation of forest areas and their subsequent loss. According to [1] the annual loss of global forest cover was estimated at 0.22%. In Africa this forest loss was estimated at 0.78%. Thus, Africa was distinguished by the rate of continental deforestation. However, the pace of this deforestation differs from one area to another. Indeed, in western Sudano-Sahelian Africa (Mauritania, Senegal, Guinea Bissau, Mali, Burkina Faso, Niger and Chad), the annual rate of deforestation was 0.72% [1]. Ivory Coast, a sub-Saharan African country, was the tropical African country with the highest deforestation during the 1990s [2]. In this deforestation dynamic, the area of dense humid forest in this country, which was estimated at over 16 million hectares in the 1950s, has considerably decreased to about 2 million hectares [3]. Agriculture and forestry are the main causes of this change in forest area [4]. Agriculture constitutes the main economic sector for several African countries. It accounts for 17% of the GDP of the continent as a whole and 30% of that of sub-Saharan African countries [5]. Agriculture is the main sector on which the survival of the majority of the African population depends. From North Africa to Southern Africa, the continent is home to about 65% of the people living from agriculture. In countries such as Mali, Uganda and Rwanda, agriculture accounts for more than 79% of the labor force [6]. In addition to the main drivers of deforestation, according to [7] population growth is one of the underlying causes of deforestation. Indeed, sub-Saharan African countries have the highest population growth in the world. In 2014, the population of sub-Saharan Africa was 960 million and represented 13% of the world’s population. Thus, in 2010, three African countries, namely Nigeria, Ethiopia and the Democratic Republic of Congo, were among the 20 most populous countries in the world [8]. Such a population growth presents important needs that induce pressures on forest resources. Thus, according to [9], population growth is the main secondary cause of the decrease in forest area in the Democratic Republic of Congo.
Since colonial times, vast plantations of cash crops for export have been established to the detriment of tropical forests. In Ivory Coast, cocoa production plays an important role in the country’s economy [10], accounting for 40% of export earnings and contributing 10% of GDP [11]. In 2017, Ivory Coast’s total production of cocoa beans reached a record 2 million tons, maintaining Ivory Coast’s position as the world’s largest producer with more than 45% of global production. In addition, this activity provides a livelihood for more than one million small farmers.
Initially based in the eastern part of the country, the cocoa economy shifted successively to the Center-West from the 1970s, then to the South-West. These different production epicentres are known as the “cocoa loop” in Ivory Coast. The reasons for the displacement of the different loops are numerous and multifaceted. However, the availability of forest land, the ageing of orchards, the resurgence of diseases and the strong migration of populations seem to be the main causes of this displacement of the cocoa loop [12]. This dynamic of cocoa production will lead to numerous modifications of the forest landscape and social relations [13]. Indeed, migration and displacement of populations will lead to increased pressure on forests and land and the emergence of numerous conflicts [14].
In the early 2000s, after the stagnation or even decline of cocoa production in the last cocoa loop in the southwest of Ivory Coast [15], there was a shift of the production area towards the extreme West where a new cocoa loop seems to be emerging [16,17] in this region still relatively unsuitable for cocoa cultivation [18,19].
The main objective of this study is to determine the different factors explaining the dynamics of the cocoa economy from the east of Ivory Coast to the West. More specifically, it is to demonstrate how the availability of forest land induces the dynamics of the cocoa economy leading to migration (displacement of a person from his or her usual place of residence to settle in another region).
More specifically, it will first determine the spatio-temporal dynamics of forests and cocoa plantations in the different cocoa production loops; then the link between forest dynamics and the production of cocoa beans in the different cocoa-producing areas and finally the process of colonization of new cocoa growing areas.
2. Methodology
2.1. Study Areas
This study was conducted in Ivory Coast, a Western African country located between 4° and 11° North latitude and 2° and 9° West longitude. With an area of 322,462 km2, Ivory Coast borders Liberia, Guinea, Mali, Burkina Faso and Ghana from Western to Eastern Ivory Coast is a transition zone between the humid equatorial climate and the dry tropical climate. The country is divided into two main climatic regions. The South has an equatorial climate and is therefore humid. The temperature is relatively constant, between 21 °C and 33 °C. In the North, the climate is tropical and dry. The temperature varies generally between 20 °C and 37 °C.
Because of the two North-South climatic regions, Ivory Coast is separated into two principal vegetation areas: forest area (in the South) and savannah area (in the North). Climate, vegetation and soil factors in the southern of the country offer adequate environment for cocoa production. Historical production regions are the East (first cocoa loop), the Centre-Western (second cocoa loop) and the South-Western (third cocoa loop). However, recent observation of an increase in cocoa area is observed in the Western of the country [16,20].
To test our study hypothesis, study sites were selected in the 3 traditional cocoa production regions of Ivory Coast (cocoa loops) and in one recent production region. These targeted regions are Abengourou in the first cocoa loop, Daloa in the second cocoa loop, Soubré in the third cocoa loop and Biankouma included for the new cocoa production region (Figure 1).
2.2. Determination of Spatial and Temporal Dynamics of Forest and Crops
2.2.1. Data Collection and Pre-Processing
A series of 12 remote-sensing images from the Landsat sensor was used to determine the land cover classes and their temporal dynamics. Images from 1985 to 2019 (Table 1) were downloaded from the United States Geological Survey website (https://earthexplorer.usgs.gov/) and grouped into three period classes (1985–1988; 2000–2002 and 2018–2019). 1985–1988 period represented the decline of the first cocoa loop and the beginning of the second in the Centre-Western Ivory Coast while the 2000–2002 period corresponded to the beginning of the third cocoa loop in the South Western of Ivory Coast. Lastly 2018–2019 period is the period where cocoa loop moved in the Western Ivory Coast. In each Landsat scenes images, an area centred on the different epicentres of cocoa loops was cut out.
Orthorectification of images was checked with geographical coordinates of invariant points. The geometric accuracy of the recording between different scenes is less than 1 pixel, which is the minimum required for change analysis [21]. Images were processed according to classical methodologies [22,23]. After application of a false color composition obtained with the blue spectral band (0.45–0.50 μm), red spectral band (0.62–0.70 μm) and infrared spectral band (0.70–3 μm), a supervised classification was applied using the maximum likelihood algorithm. This algorithm uses training site statistics to calculate the probability for each pixel to belong to one of the classes [21] and has the advantage of providing, for each pixel, in addition to the class to which it has been assigned, a certainty index related to that choice. Fifty training sites were selected on the most recent images (2018 and 2019) in each region and made it possible to carry out a first classification. Another 50 samples per locality, different from the first batch, as well as old land-cover maps, were used for classification verification. Finally, for a good follow-up of the vegetation dynamics, three (3) land-cover classes were selected, namely Cropland, Forest and Other.
The Forest class is composed by original forest not yet affected by agriculture or very old fallow land that can be assimilated to forests. The Cropland class includes cocoa farms of all ages with all types of farmers’ associations. Indeed, most cocoa farms are associated at their young age with food crops such as maize, yams, taro and many other vegetables. In addition, trees of varying density are left or planted in cocoa fields either to provide shade for cocoa trees or for various uses such as for pharmacopoeia, food or timber. The Cropland class also includes other perennial crops other than cocoa and also annual crops. The Other class includes all other land cover classes of study sites. These include bare land, habitats (cities, villages, campsites), watercourses, savannahs and other non-plant land-cover classes.
2.2.2. Classification Accuracy
Evaluation of classification quality was based on the overall accuracy of the classification and the Kappa coefficient. While the overall accuracy of the classification gives the average proportion of correctly classified pixels, the Kappa coefficient gives a more accurate assessment of the quality of the classification from the confusion matrix. This index expresses the proportional reduction in error obtained with a classification compared to the error obtained with a pseudo-random classification [24]. A Kappa index greater than 0.75 is satisfactory in a classification assisted by maximum likelihood in a tropical environment [25].
After validation, the most recent land-cover maps were used to define new reference areas to assess the quality of the classification of pre-2019 images. All of this image processing was performed in ENVI 4.7.
2.2.3. Determining the Dynamics of Cocoa Production in the Different Cocoa Production Regions
A documentary review was carried out among the cocoa management structures in Ivory Coast, namely the Coffee and Cocoa Board (http://www.conseilcafecacao.ci/), the Coffee and Cocoa Exchange of Ivory Coast (http://www.bcc.ci/) and the National Institute of Statistics (http://www.ins.ci/). This documentation made it possible to obtain the national production of cocoa beans at different dates. The data obtained were used to establish a link between cocoa production and forest area based on regression.
2.2.4. Determination of Landscape Composition and Analysis of Changes
Landscape Composition Parameters
Evaluation of Changes in Classes
For each class, different changes in each of the study areas were evaluated using transition matrices. The rate of land cover change (Tc) was calculated for each class during the study period according to the following formula:
where A1 and A2 represent the initial and final areas of land cover class, respectively. Positive values of Tc indicate an increase in the area of the land cover class, while negative values imply a decrease in the area of the land cover class.
2.3. Determination of the Colonization Processes of New Areas in Western Ivory Coast
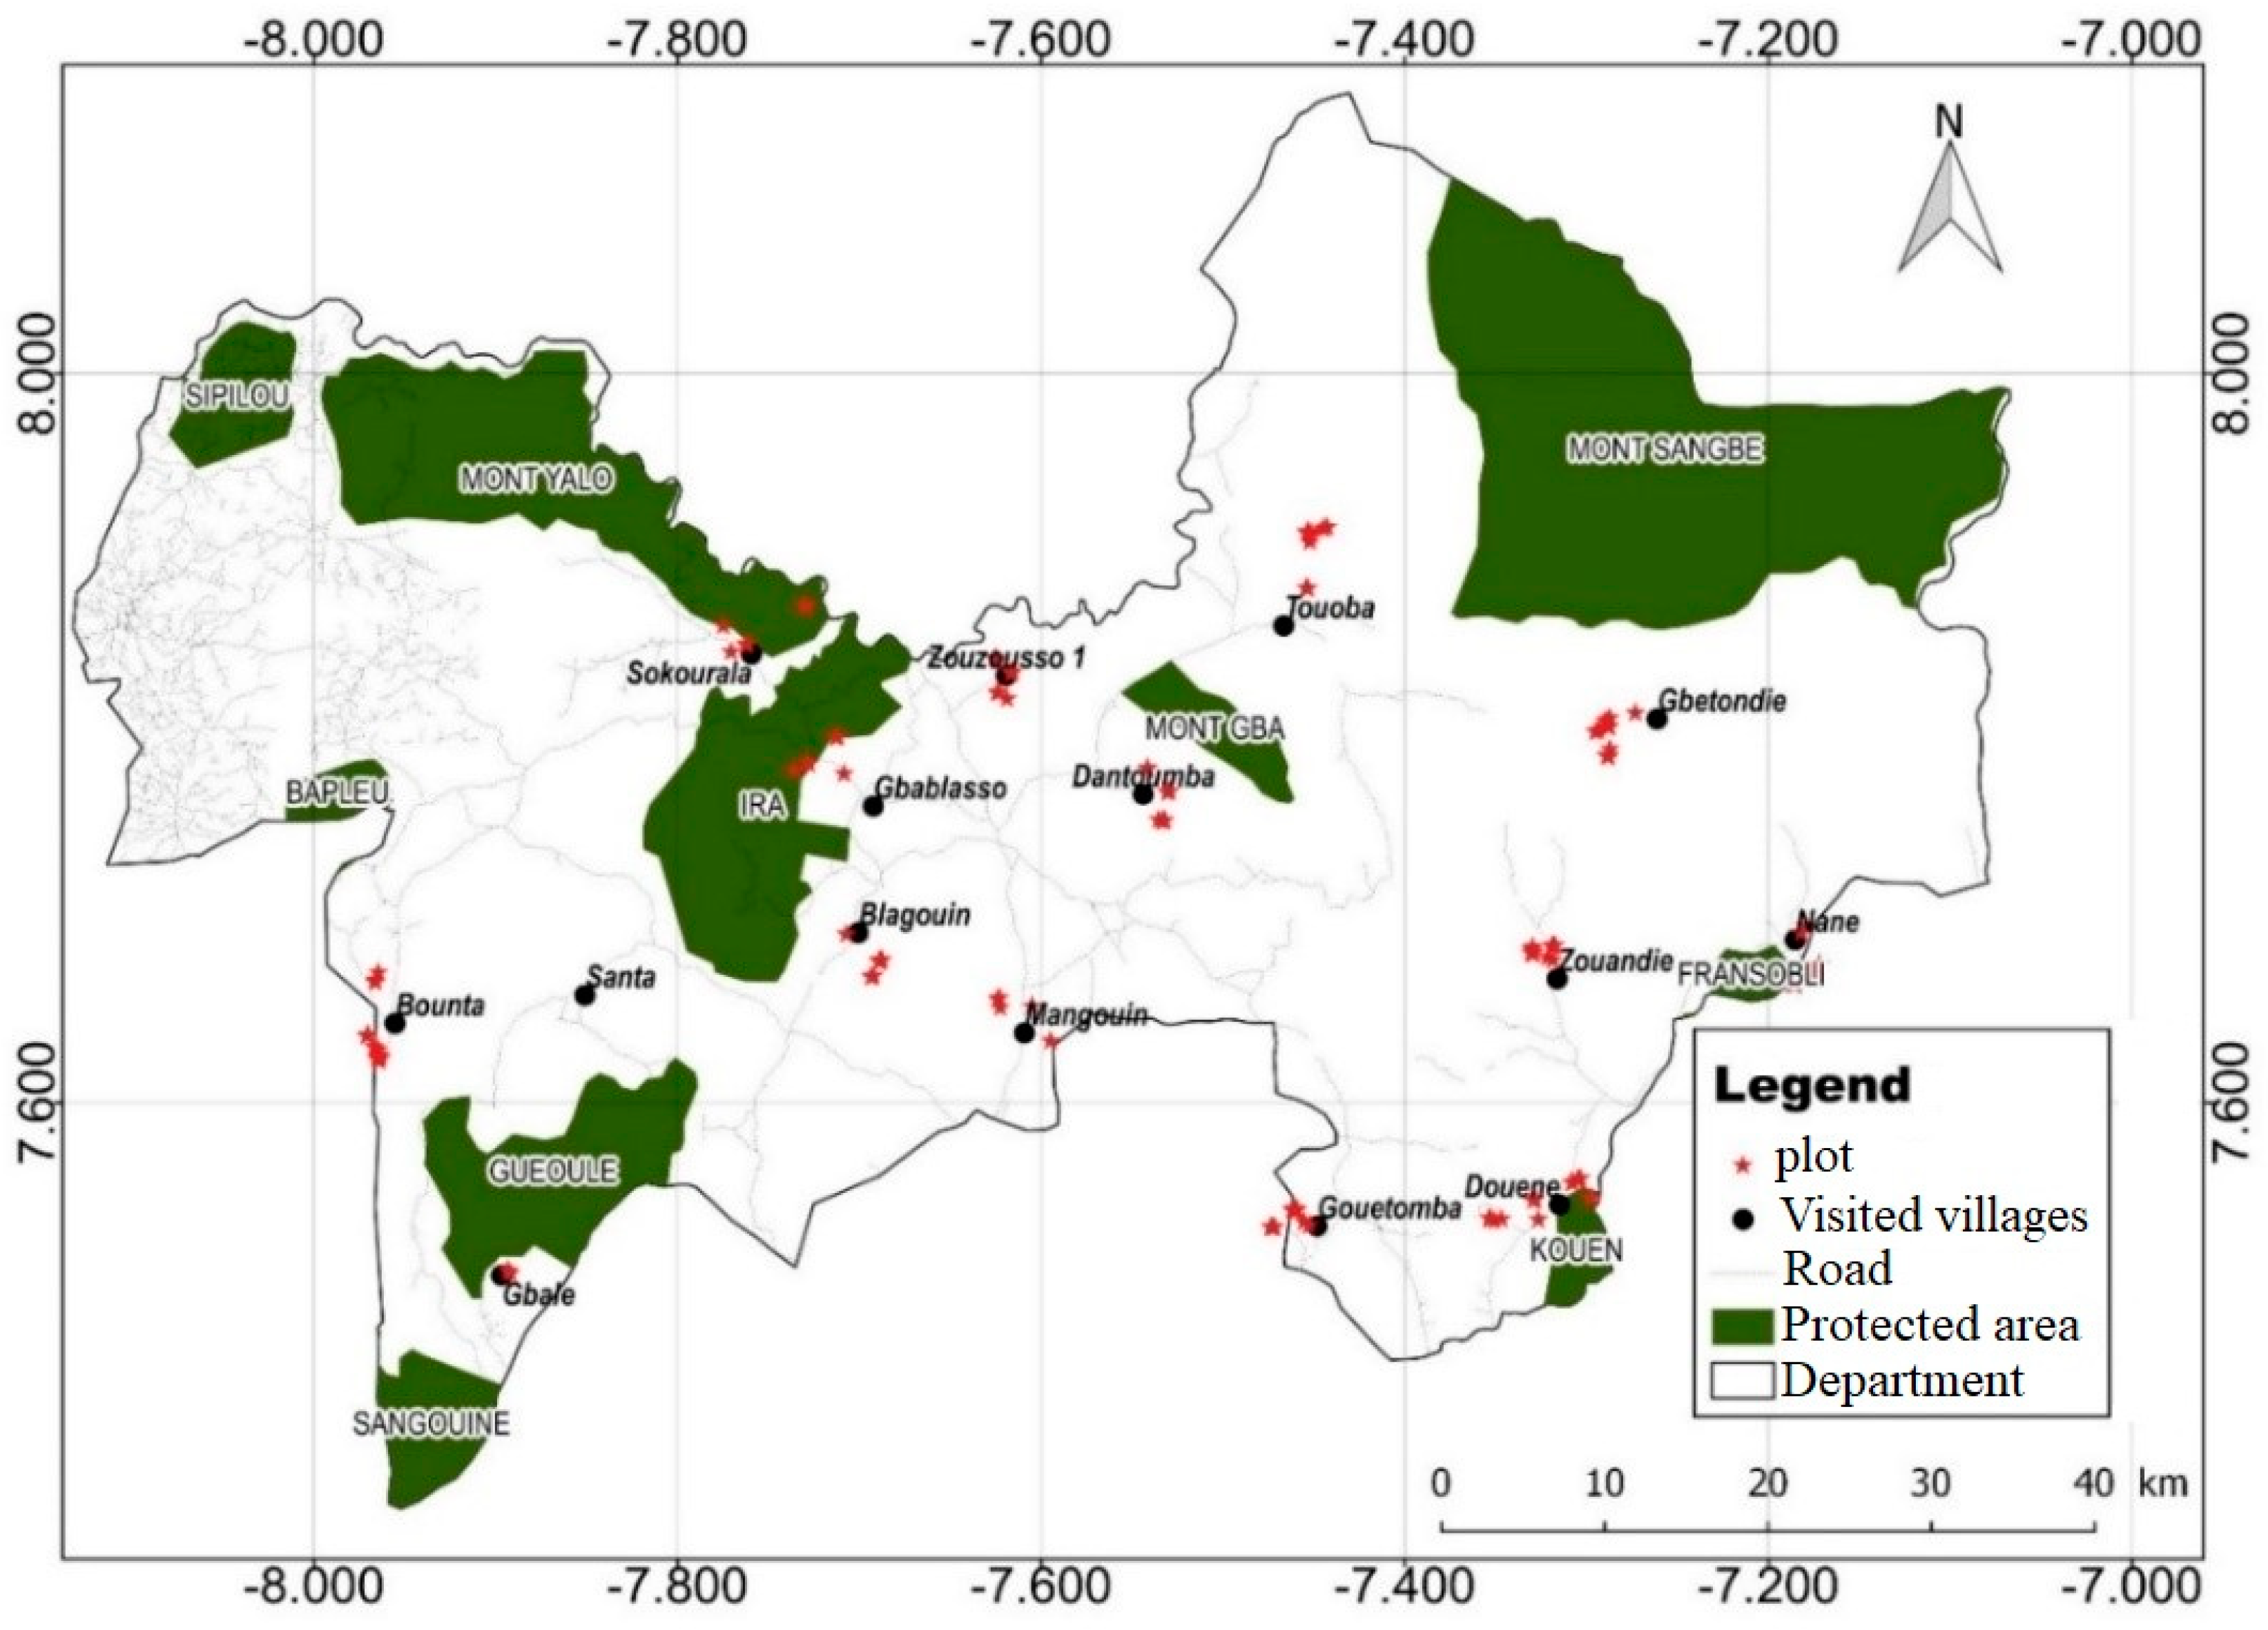
In order to understand the process of setting up cocoa farms in new regions, a survey using a questionnaire was conducted near local communities of Western Ivory Coast followed by direct field observations. Choice of localities for the survey was based on the 2018 land-cover map. Based on this map, 15 localities were selected for the survey through direct interview technique (Figure 2). In each locality, 10% of the heads of cocoa-producing households (marking a total of 278 respondents), were randomly selected for survey.
In each of the selected localities, individual surveys were organized among heads of cocoa-producing households, village authorities and agents in charge of supervising farmers. A questionnaire was used for this purpose. In order to establish a profile of the farmers and to understand the process of setting up cocoa farmers in the study area, questions were asked about the origin (place of residence before coming to the west to grow cocoa) of the farmers, their age and the year they settled in the area. Questions were also asked about the age of planting and the areas under cultivation. All survey data were recorded in the Sphinx.2 software.
To profile cocoa farmers and their plantations, a multiple factor analysis (MFA) coupled with a ascending hierarchical classification (AHC) was carried out. This analysis technique was chosen because data collected are of different natures. This technique facilitates the cross-checking of quantitative data (obtained from the questionnaire) and qualitative data (obtained with the interview guide) collected after the interviews conducted with the farmers. AHC was carried out on all the individuals in our sample and made it possible to group together individuals with similar characteristics. Different active variables were used to establish farmers profile and plantations are the origin of the farmer, the previous crop, the place of origin, the year of establishment, the age of the plantations, and the variety cultivated.
3. Results and Discussion
3.1. Results
3.1.1. Validation of Land Cover Maps
The validation of the land-cover maps was done using the Kappa coefficient. The values of Kappa coefficients obtained in this study ranged between 93% and 96% for 1985–1986 images. Considering image classifications of the 2000–2020 period, these values ranged between 91 and 94%. For the last period (2018–2019), these values ranged between 85% and 96% (Table 2).
3.1.2. Land-Cover Maps and Evolution of Vegetation Classes
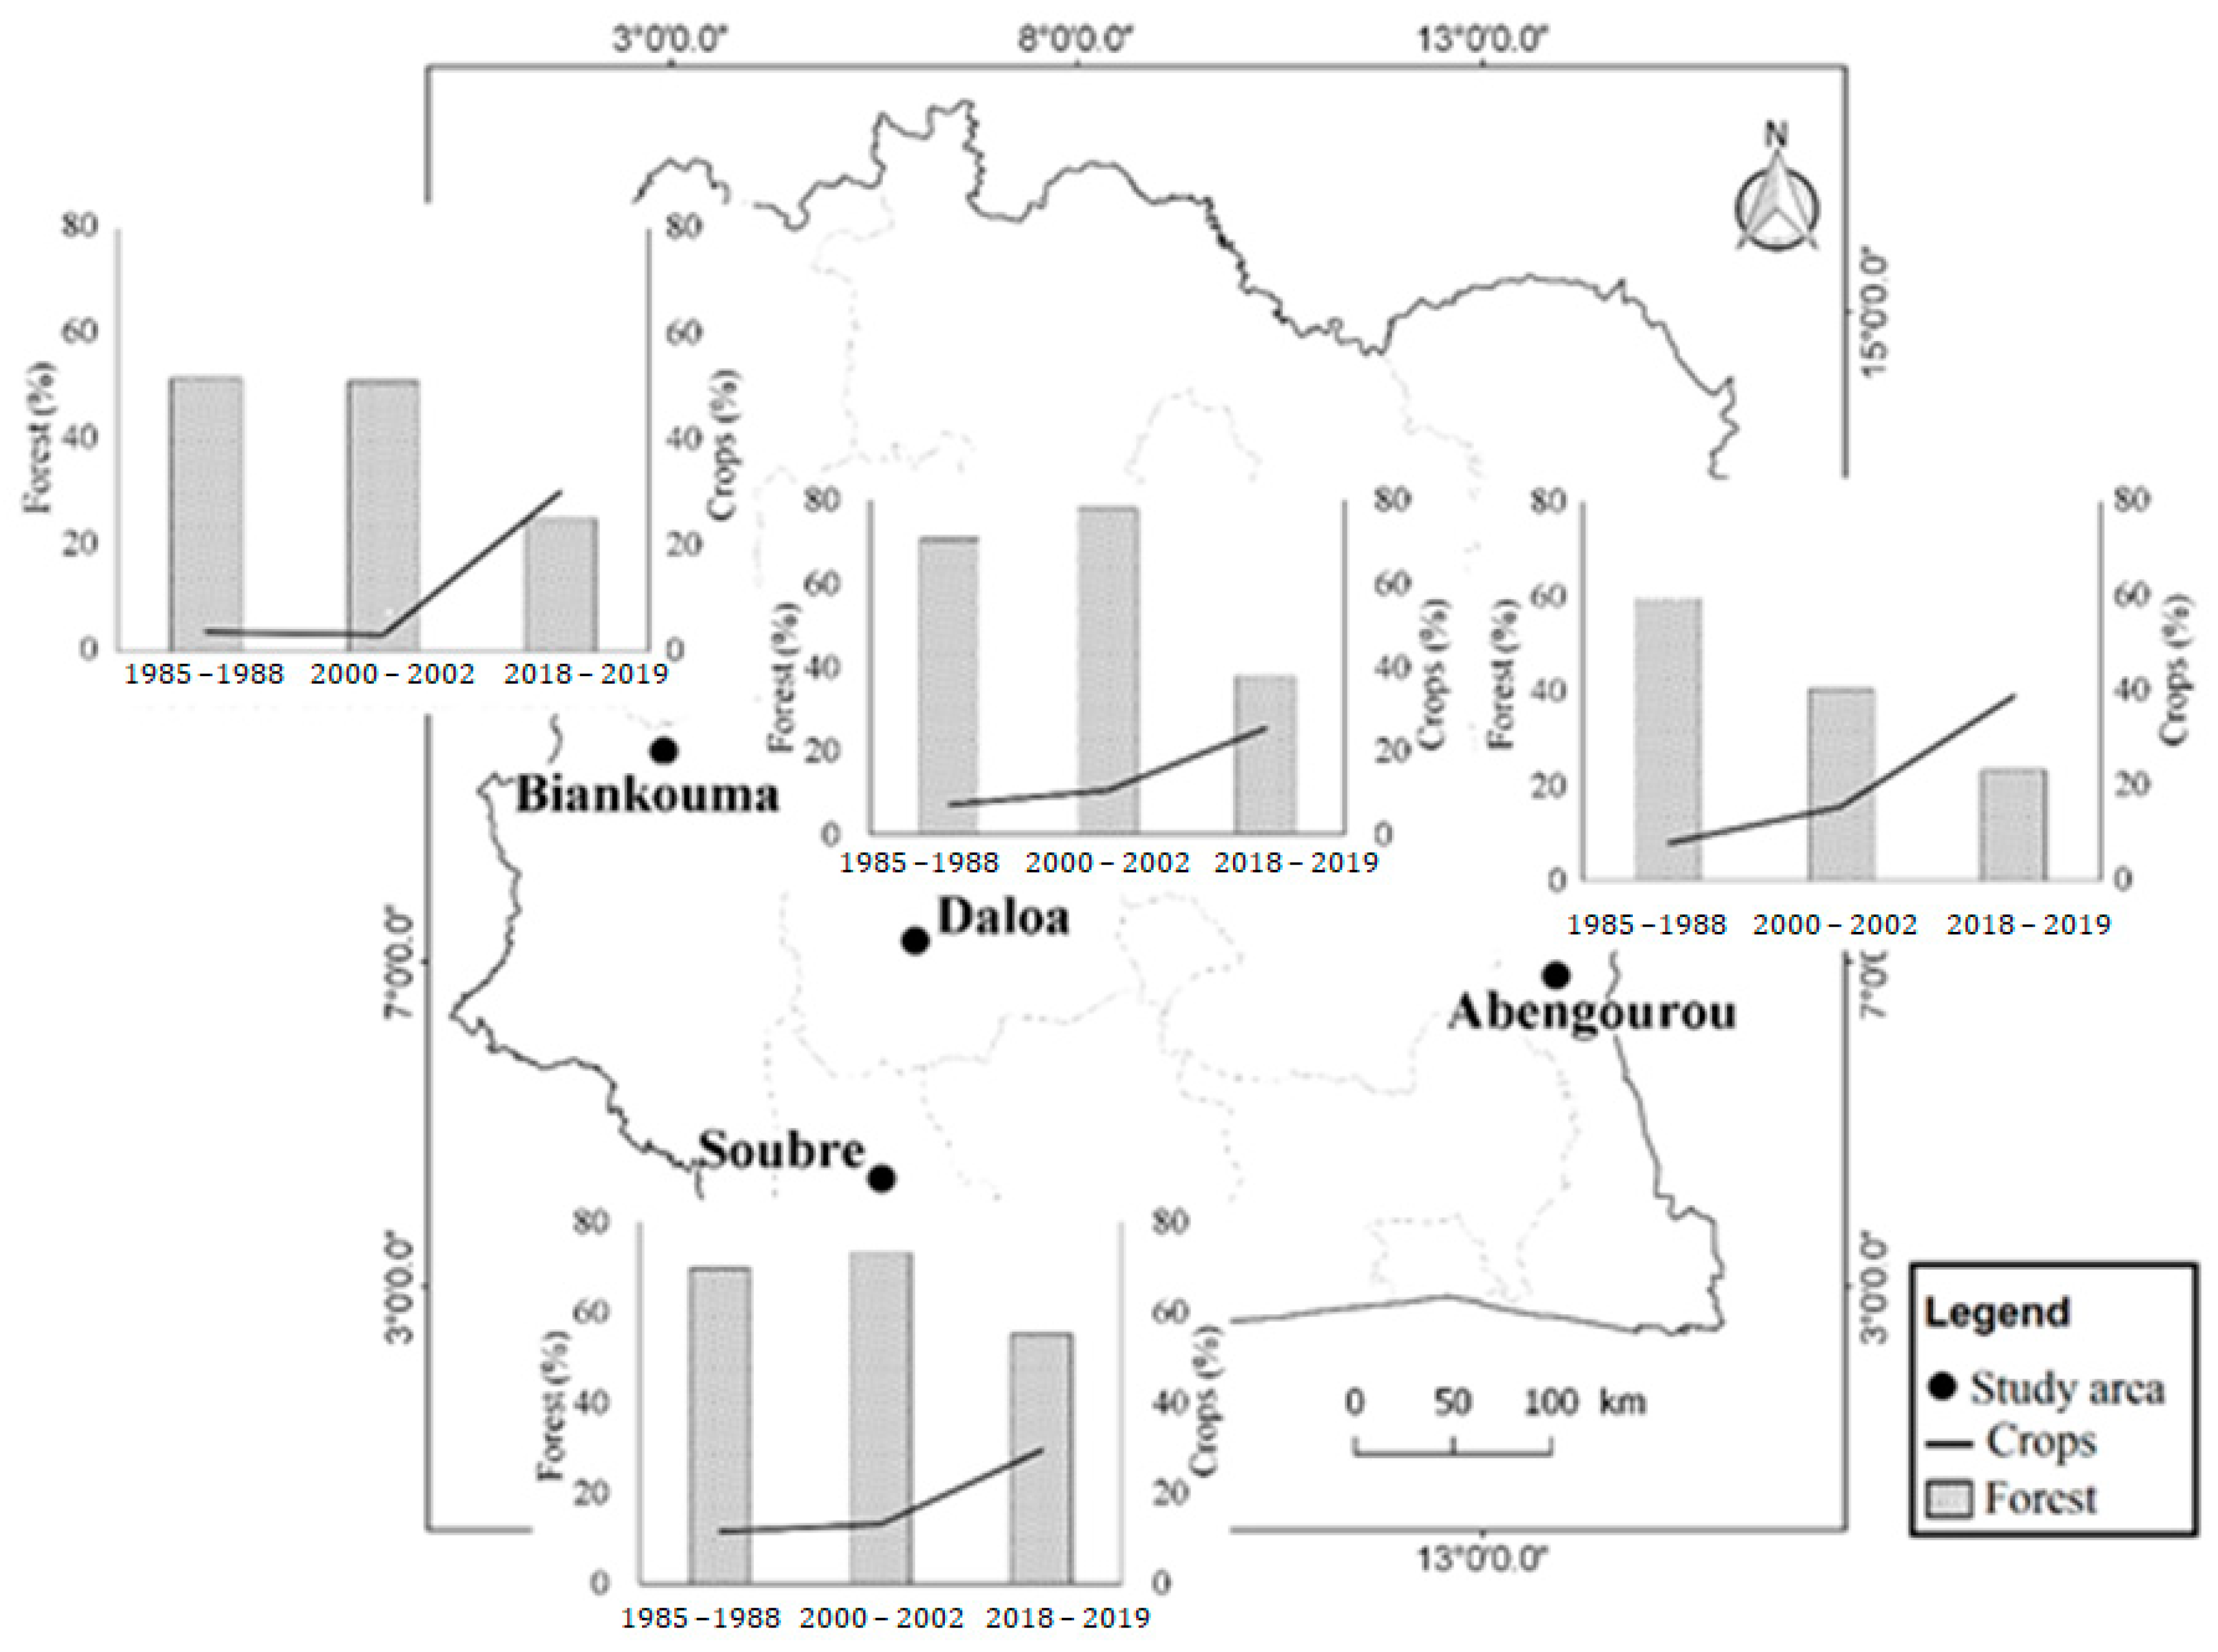
The following Figure 3 and Figure 4 present land-cover maps for study areas. Land-cover class statistics are presented by Table 3 and Figure 5. For an overall analysis, this study finding showed an increase of cultivated areas versus a decrease of forest areas (Figure 5) during the study period.
Taken into account the 1985–1988 period, all the study areas are covered by native forests (Figure 3 and Figure 4). Considering evolution of the first cocoa epicentre in eastern Ivory Coast from 1986 to 2018, a reduction of natural forest ecosystems was observed while cultivated areas were increased (Figure 5). Statistically, forest area increased from 59.32% to 23.25% in this region (Table 3) while cultivated areas experienced a rapid evolution from 30,227 ha (7.92%) in 1986 to 148,752 ha (38.96%) in 2018. As of 2000, forest cover was highly reduced mainly in the southern and North Western parts of Abengourou regions (Figure 3).
The same trend was observed for the second epicentre of cocoa production located in centre West of Ivory Coast with a reduction of forest cover and an increase in cultivated areas between 1988 and 2019 (Figure 3 and Figure 5) while cultivated area increased from 27.497 ha (7.24%) in 1988 to 96,715 ha (25.47%) in 2019. Regarding forest cover, this increased from 268,249 ha (70.65%) in 1986 to 164,295 ha (37.88%) in 2019.
In the South-Western region, results showed an increase of cultivated areas at the expense of forest areas between 1988 and 2019. Cultivated areas increased from 84,057.48 ha (11.36%) in 1986 to 217,393.74 ha (29.39%) in 2019. Considering forests cover evolution in this region, forests were reduced from 515,791.98 ha (69.72%) in 1986 to 408,735.81 ha (55.25%) in 2019. This forest regression is more accentuated around the Taï National Park W region) and in the extreme South Western of the Soubré region (Figure 3). On the other hand, reforestation was observed in the southern part of the study area between 2001 and 2019.
In the Western Region, perennial crops production was not frequent before 2001 (Figure 4 and Figure 5) but these crops are more adopted between 2001 and 2019. Overall, a reduction in natural areas was observed during the study period (Figure 4). During this period, forest area decreased from 248,837 ha (51.54%) in 1985 to 121,474 ha (25.16%) in 2019 (Table 3). Considering the cultivated areas, they increased from 17,763 ha (3.68%) in 1985 to 145,707 ha (30.18%) in 2019.
3.1.3. Spatial Configuration of Forest Classes and Crops
Spatial structure parameters of forest classes and crop classes showed an increase of number of patches and patch perimeter in all cocoa epicentres identified in this study in Ivory Coast (Table 4). In the East (first epicentre), the number of forest patches decreased from 18,228 in 1986 to 10,733 in 2018 and the number of crop patches decreased from 10,380 in 1986 to 5782 in 2018. Also, forest perimeter was reduced from 240 km (1986) to 108 km (2018).
However, considering the second cocoa epicentre of in the centre West, an increase of patch perimeters and their total number were observed. The number of forest patches increased from 7524 in 1986 to 14,443 in 2018 while the perimeter of different patches was increased from 33 km to 522 km. The number of crop patches increased from 9124 in 1986 to 12,533 in 2018. Otherwise, the patch perimeter which was 117 km in 1986 decreased to 21 km in 2000 and increased to 147 km in 2018.
In Soubré regions (third epicentre), a decrease of the different patches was observed. Forest patches decreased from 17,443 (1986) to 3399 (2018) and the crop number of patches decreased from 14,626 in 1986 to 16,606 in 2018.
In the Biankouma region (new production area), image processing revealed an increase in the number of forest patches from 29,401 to 27,902 between 1985 and 2019. This trend was also observed in the number of crop patches which increases from 13,156 in 1985 to 16,737 in 2018. Moreover, patch perimeters were ranged from 930 km in 1985 to 252 km in 2019 for the forest class. Considering the crop class, patch perimeters obtained were 57 km, 36 km and 240 km, respectively, for the years 1985, 2000, 2018 and 2019.
3.1.4. Change in Vegetation Cover
Overall, vegetation covers in different study areas showed a significant decrease rate compared to the cultivated areas that increased between 1985 and 2019 (Table 5).
The first cocoa production epicentre located in the East region was marked by 60.80% of forest cover reduction compared to 392.12% growth rate of cultivated areas between 1985 and 2019. From 1985 to 2002, forest cover decreased at a rate of 31.91% t while crop area increased by of 95.96%. During the 2002–2019 period, a significant growth rate of crops (151.13%) and a reduction of forest cover rate of 42.43% were observed.
Considering the second cocoa production epicentre in the Centre-West, a gradual reduction in vegetation cover in 1985 and 2019 was noted and forest evolution rate during this period is −46.39%. Moreover, the change rate for crops was about 251.73%. From 1985 to 2002, change rates for forest and savannah were 10.34% and 46.68%, respectively. During the 2002–2019 period, forest cover decreased by 51.42%, compared to crop cover which experienced an increase of 139.80%.
Talking about the vegetation evolution cover in the third epicentre (South-West), a reduction by 20.76% of forest and an increase by 158.63% of crop cover were, respectively, observed between 1985 and 2019. During the 1985–2002 period, forest area was reduced by 20.76% while crops area was increased by 15.60%. On the other hand, 2002–2019 period is marked by a reduction in forest covers (−24.54%) and an increase in crop covers (123.71%).
In the new cocoa production region in the West of Ivory Coast, a reduction in forest area estimated at –51.18%, −1.22%, and -50.58%, respectively, was observed during the periods 1985–2019, 1985–2002 and 2002–2019. Regarding crops, their cover increased by 720.28% and 874.77% respectively for for1985 2019 and 2002−2019 periods. However, their covers decreased by −15.85% from 1985 to 2002.
3.1.5. Link between Forest Area and National Production
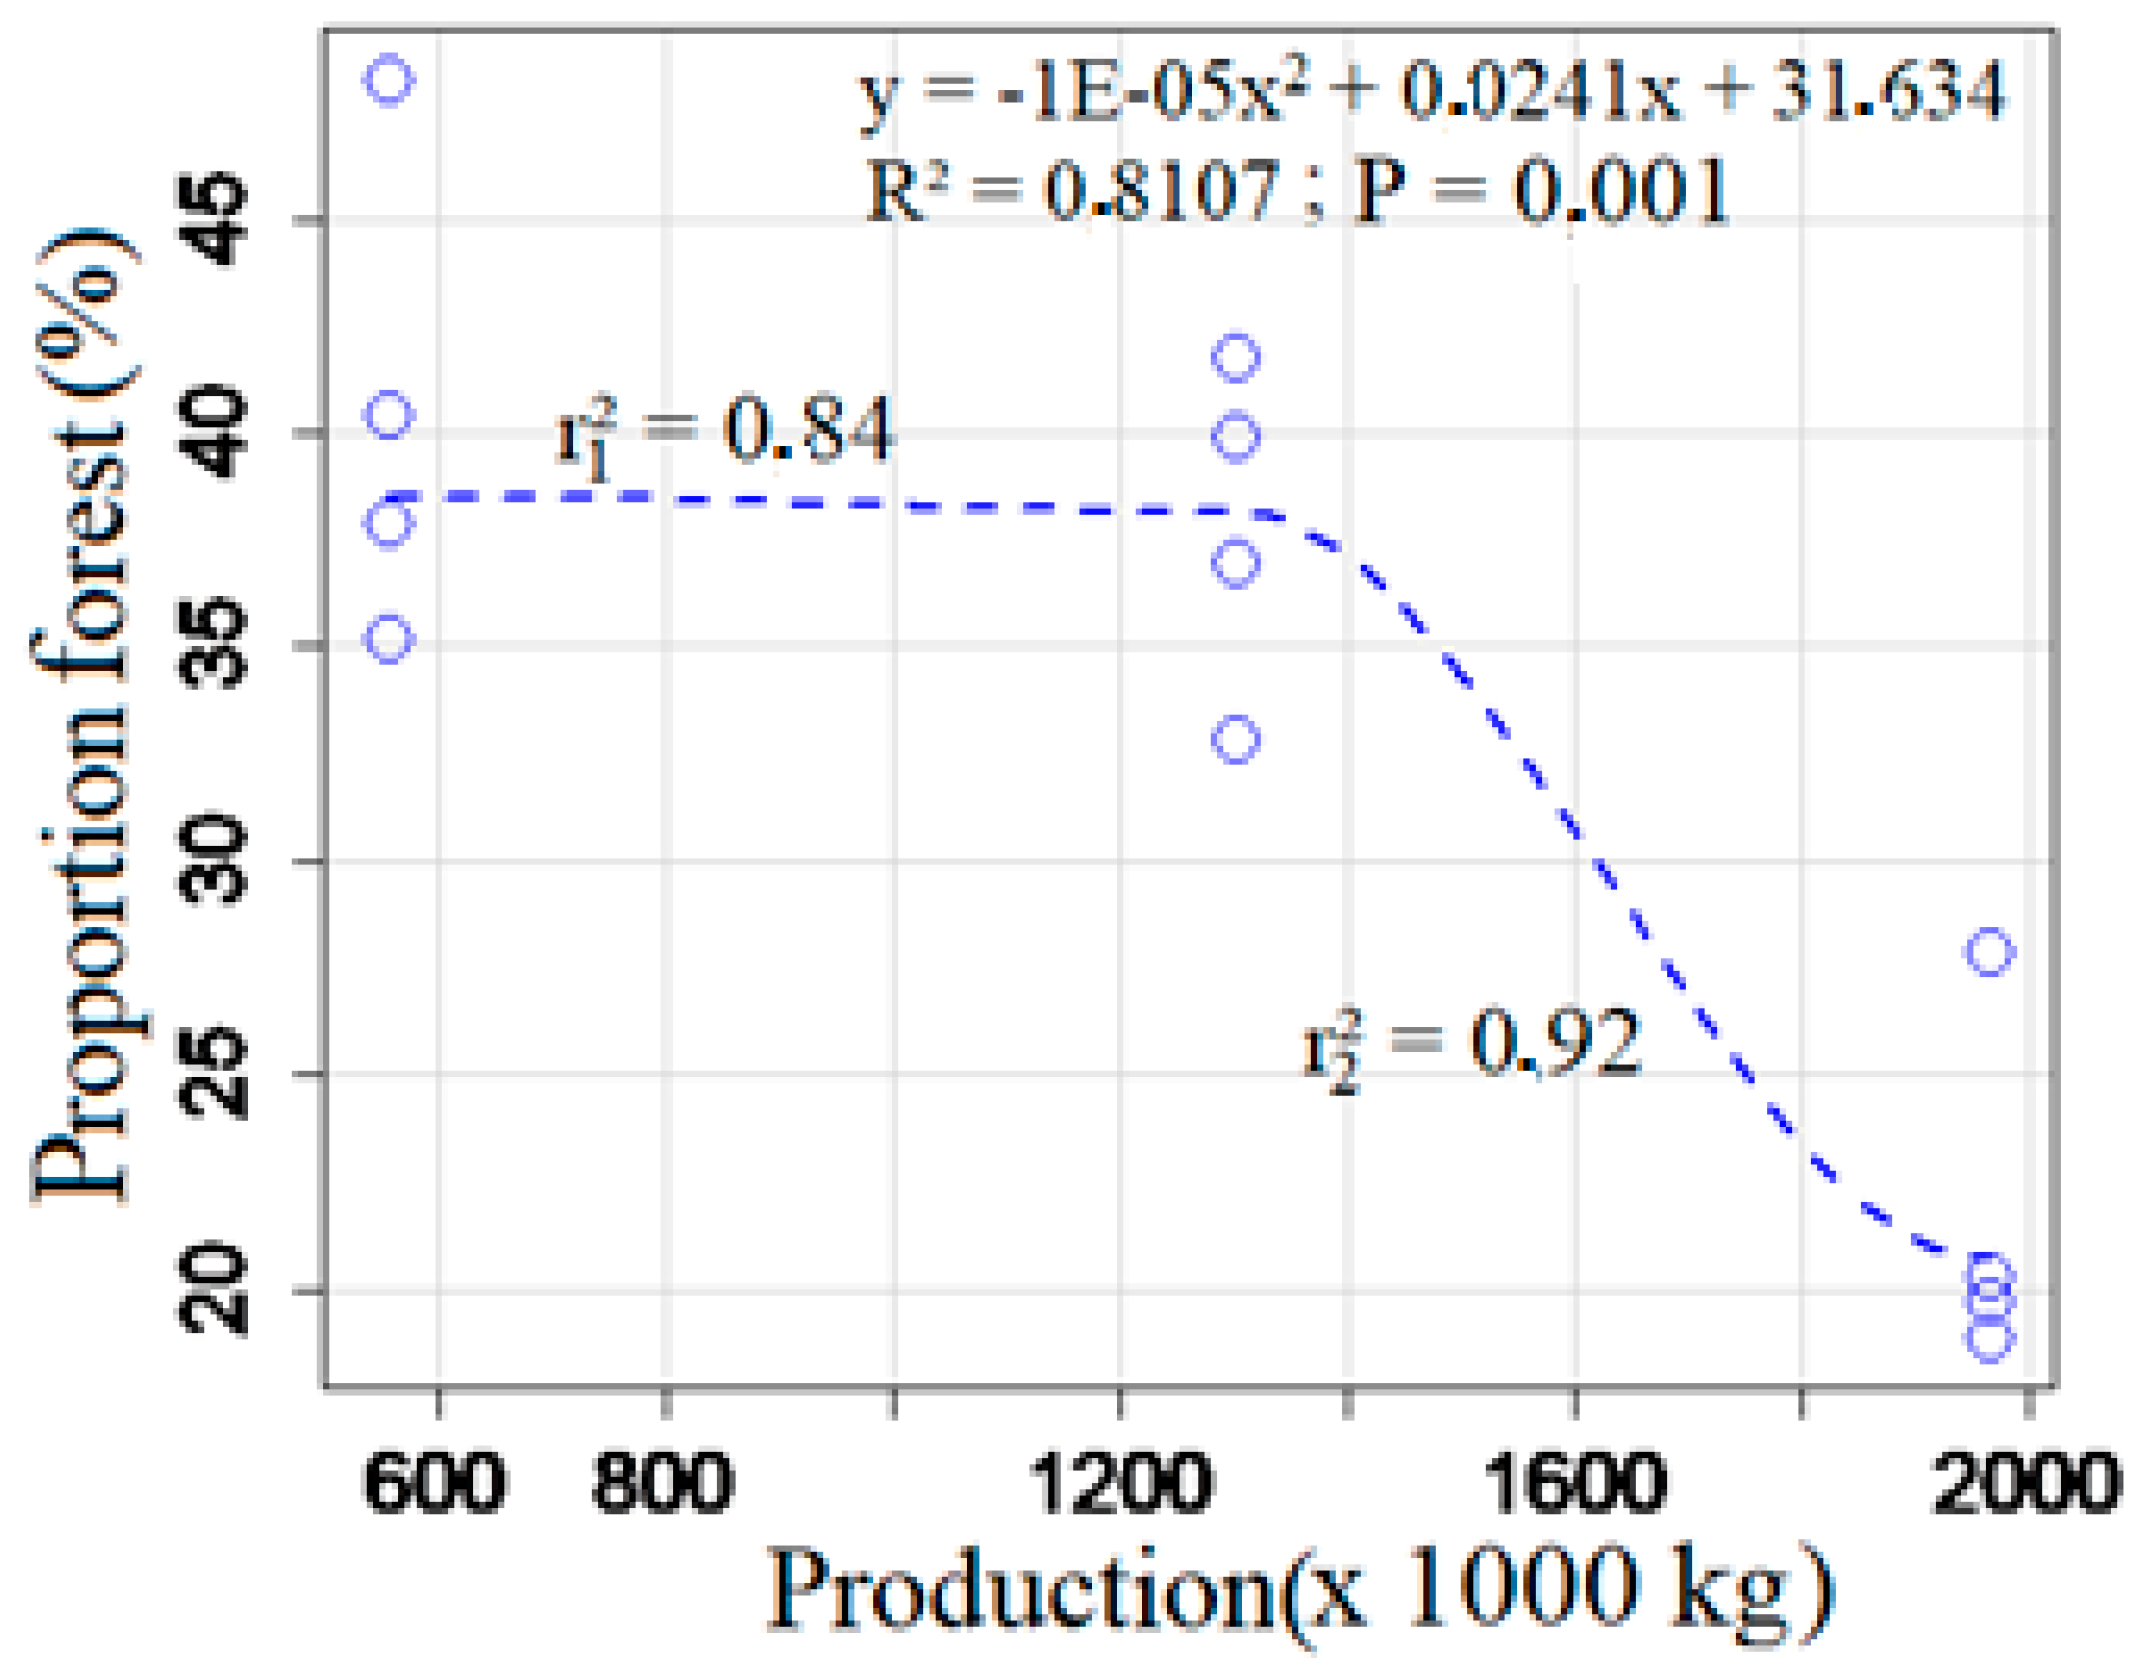
The relationship observed between national production and forest covers in each study area indicated that changes in national cocoa production caused a reduction of forest covers in all the sites (Figure 6). On the other hand, the positive correlation (R2 = 0.81; R = 0.90) obtained showed that cocoa production affects highly forest covers in Ivory Coast. However, the graph (Figure 6) presents two important phases. The first phase with a correlation coefficient of 0.84 is characterized by a low reduction of forest cover and cocoa production below 1,300,000 while the second phase with a correlation coefficient of 0.92 is marked by production exceeding the 1,300,000 tons threshold resulting in a strong reduction of forest cover.
3.1.6. Characteristics of Producers in the New Pioneering front of Cocoa Farming
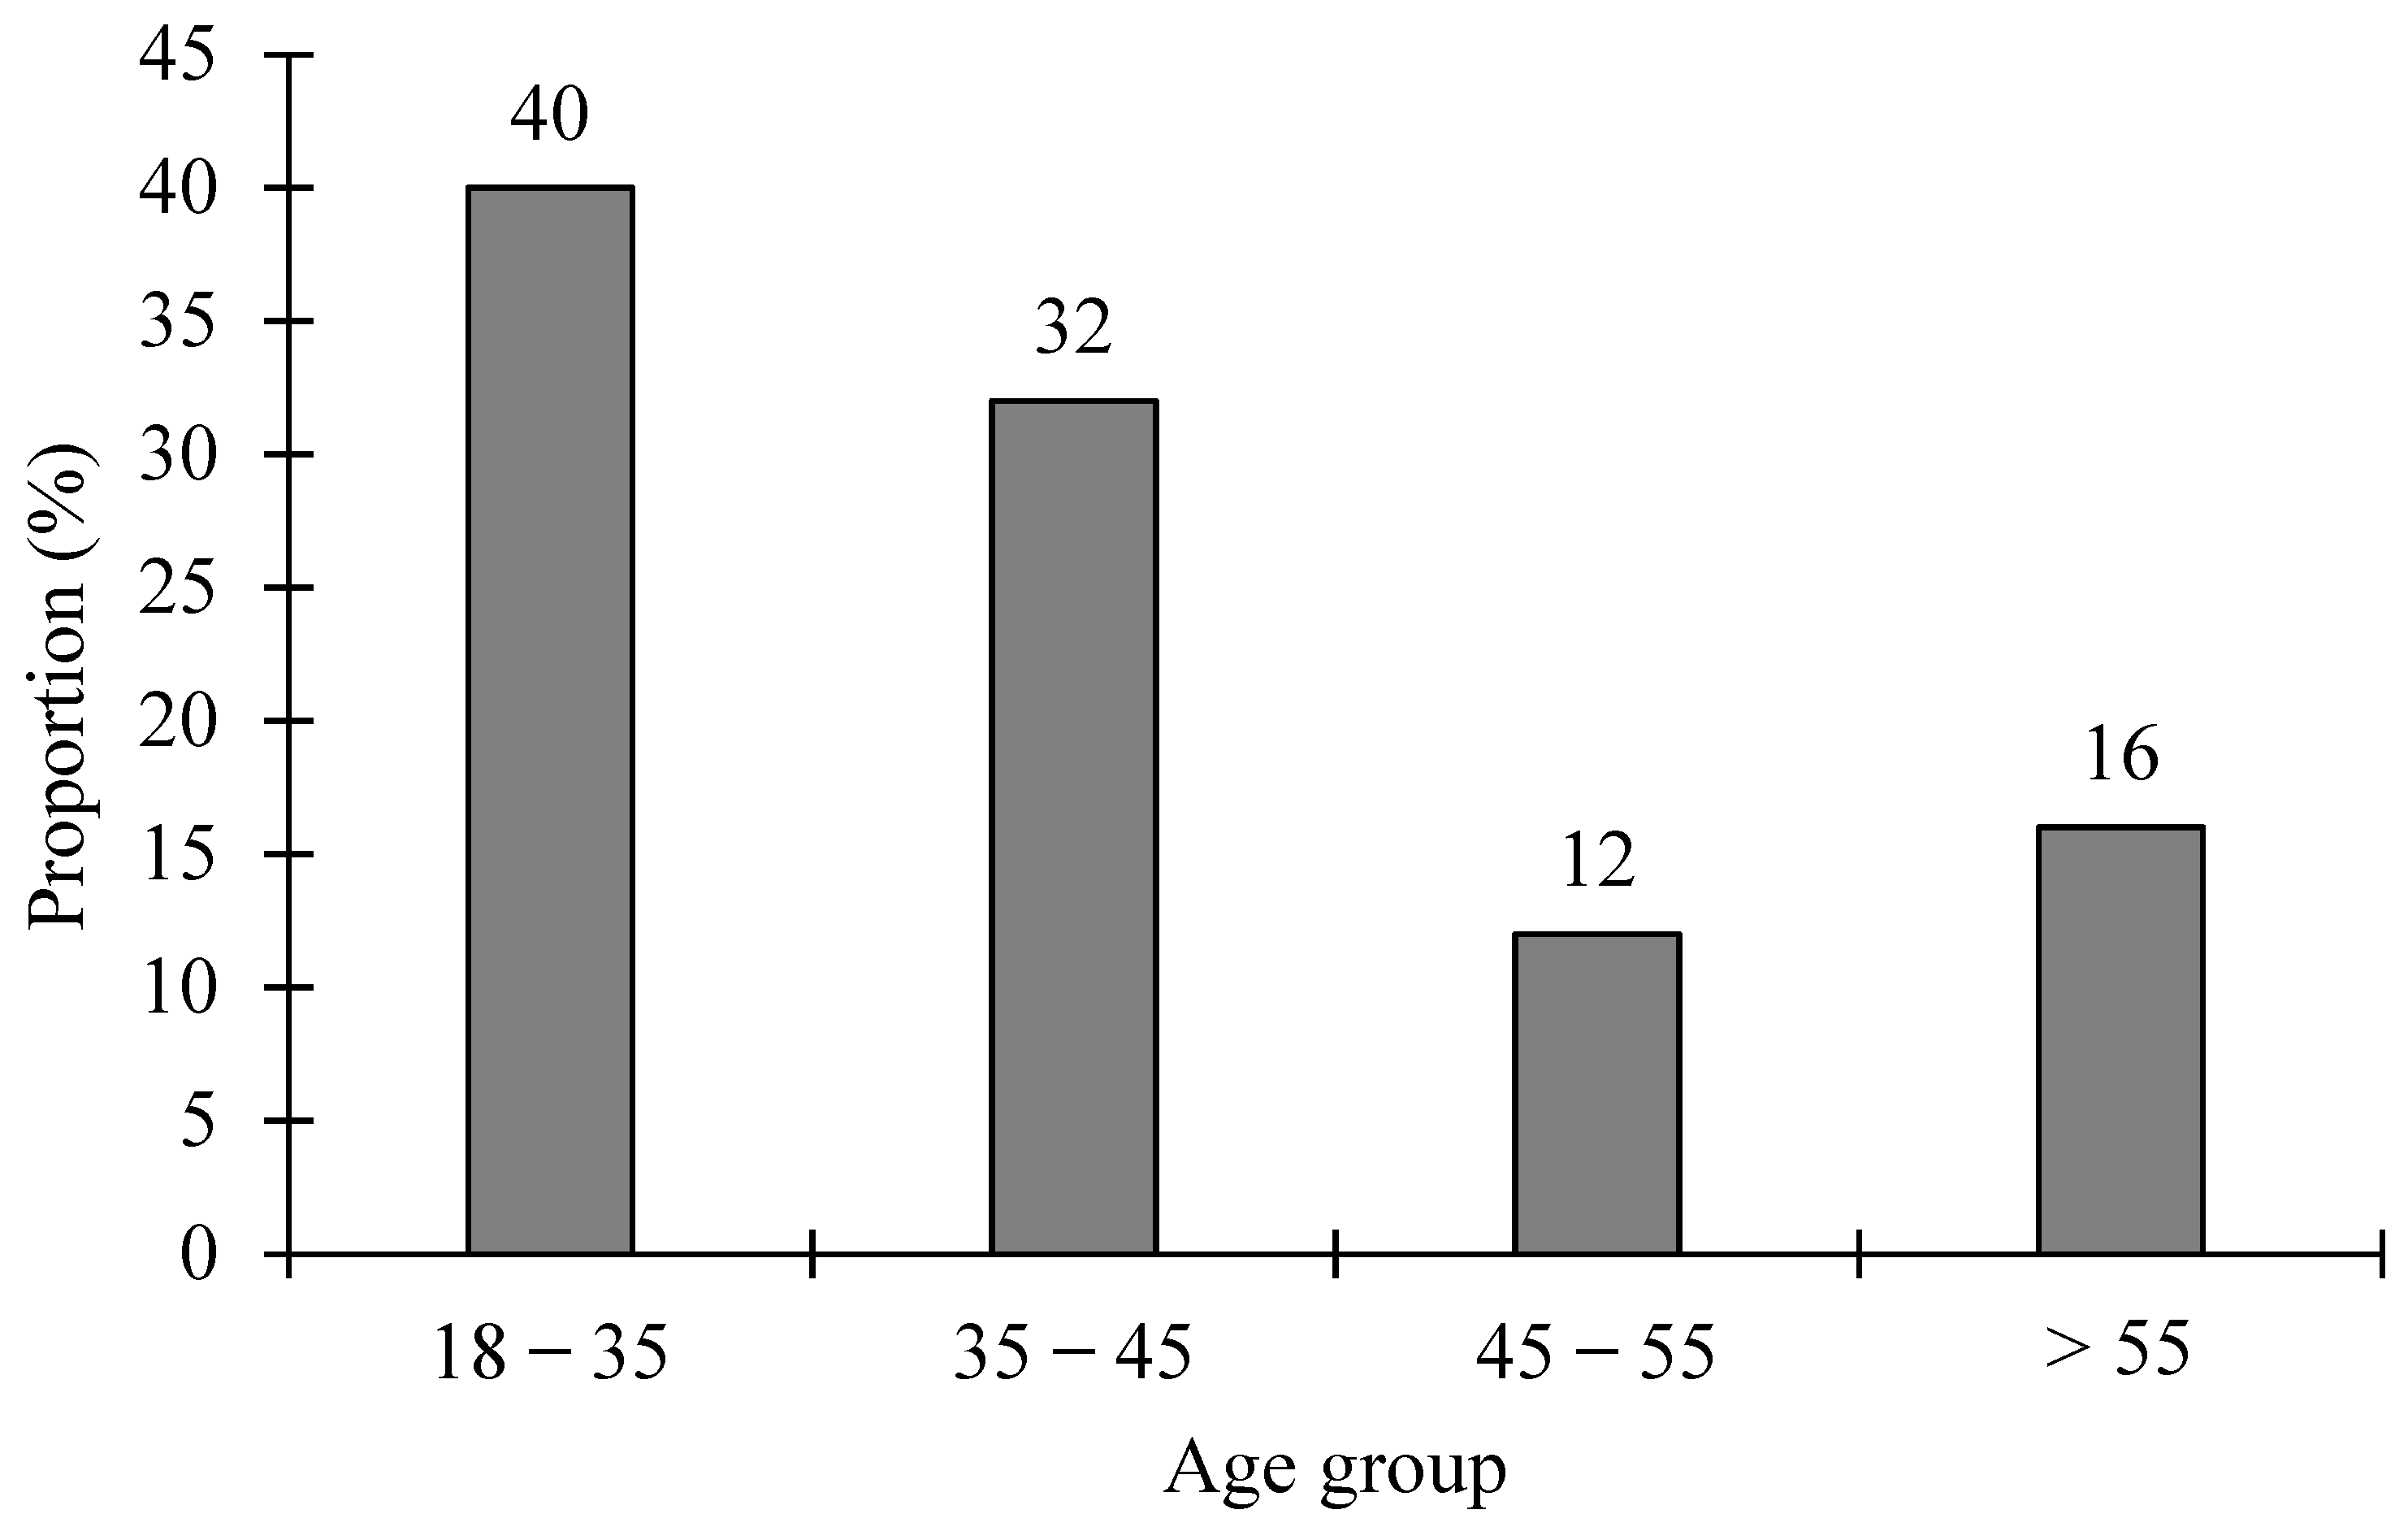
The producers of the new cocoa front in Western Ivory Coast were relatively young, 40% are <35 years old and 32% are between 36 and 45 years old (Figure 7). Producers over 45 years of age were the least represented with cumulative proportions of 28%.
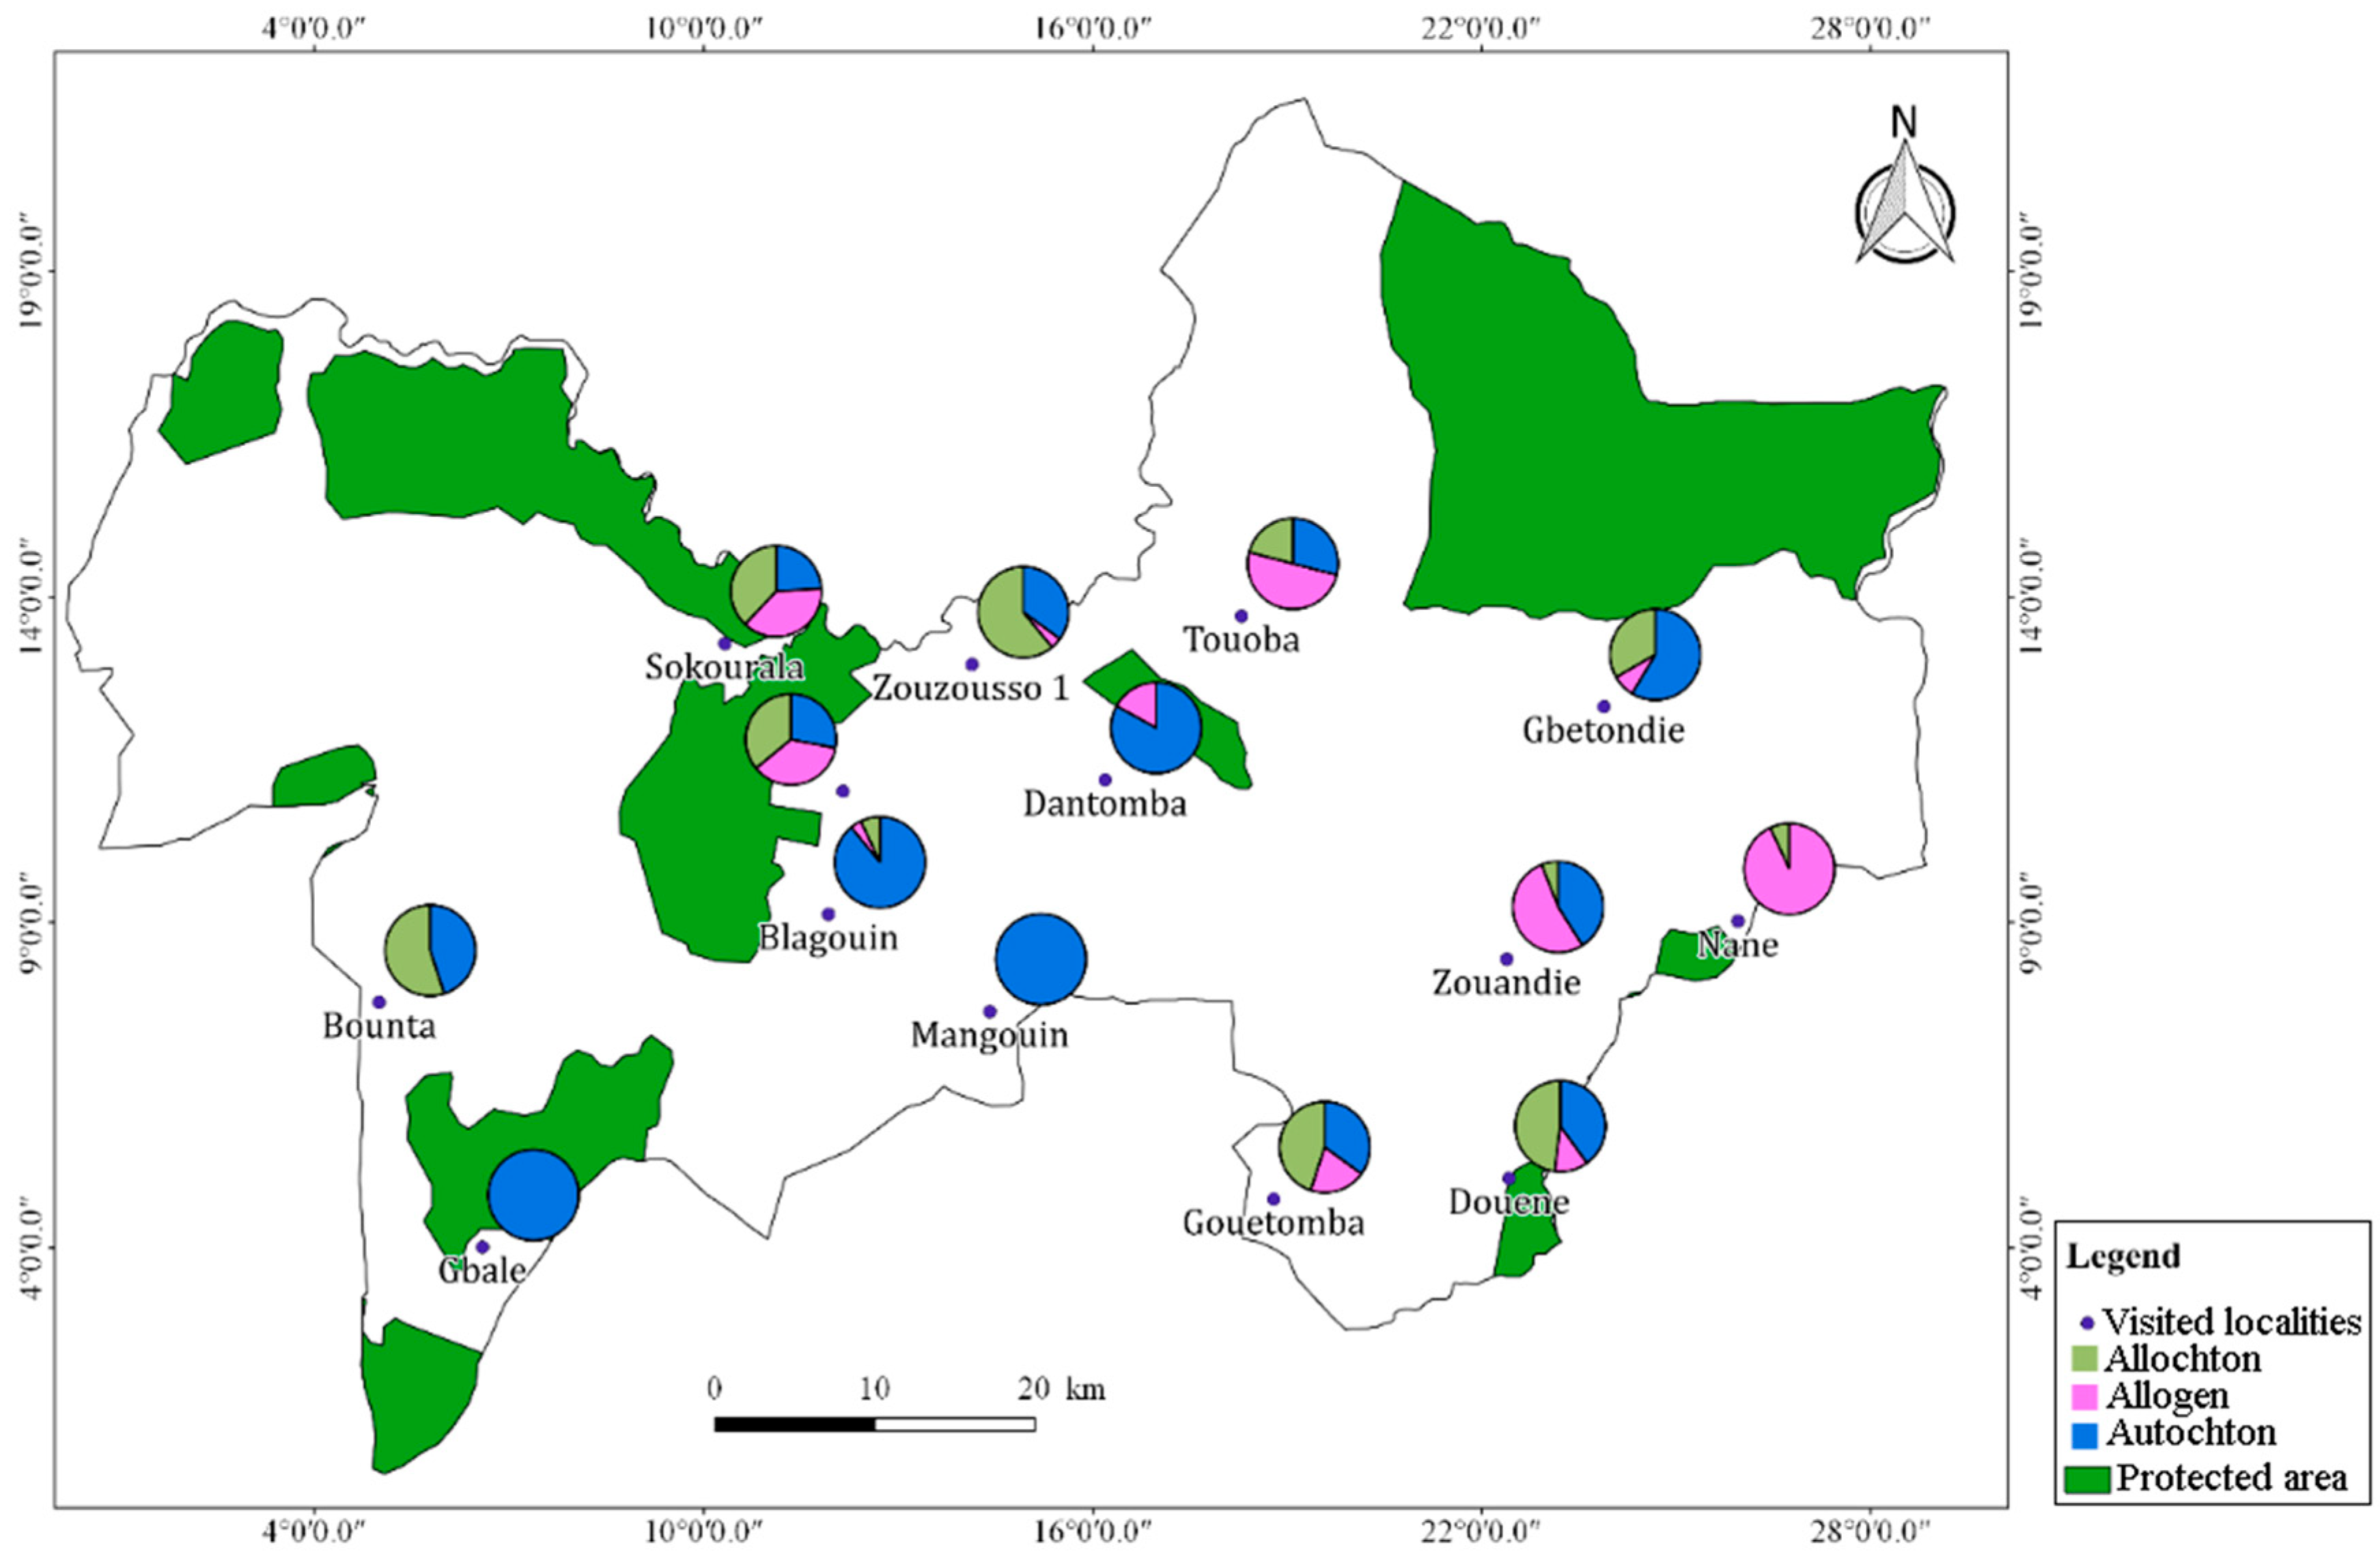
Cocoa farmers in the Biankouma regions are dominated by non-native populations; 47% of producers were autochthonous (from the region) versus 53% of non-natives. These producers are composed by allochton (person from the country but not from the region, 28%) and allogen (person not originally from the country, 25%) (Figure 8). Moreover, statistics showed a concentration of non-native producers from the West Ivorian region in the localities located near the protected areas (Figure 9).
About 70% of producers identified in this region come (from other localities of Ivory Coast (Figure 10) with29% of them coming from the western mountain regions and 25% from localities of the Centre-Western (the second epicentre of cocoa). Producers from the South-West of Ivory Coast (third epicentre of cocoa) were less represented with a proportion of 16%.
Cocoa producers of the new epicentre settled during three (3) major periods, namely: before 2000, 2000 to 2010 and 2010 to 2018. Analysing the statistics, about 61% of producers were settled between 2010 and 2018, 29% were settled between while 10% were settled before 2000 (Figure 11).
3.1.7. Agronomic Characteristics of Cocoa Farms in the New Production Region
As pointed out in Figure 12, different plantings recorded were established in six (6) previous crop areas, and 39% of cocoa farms were established in forest areas while 25% resulted from coffee and cocoa farm reconversions. Overall, 17% of new installations in fallow areas and 18% in savannah areas were noted.
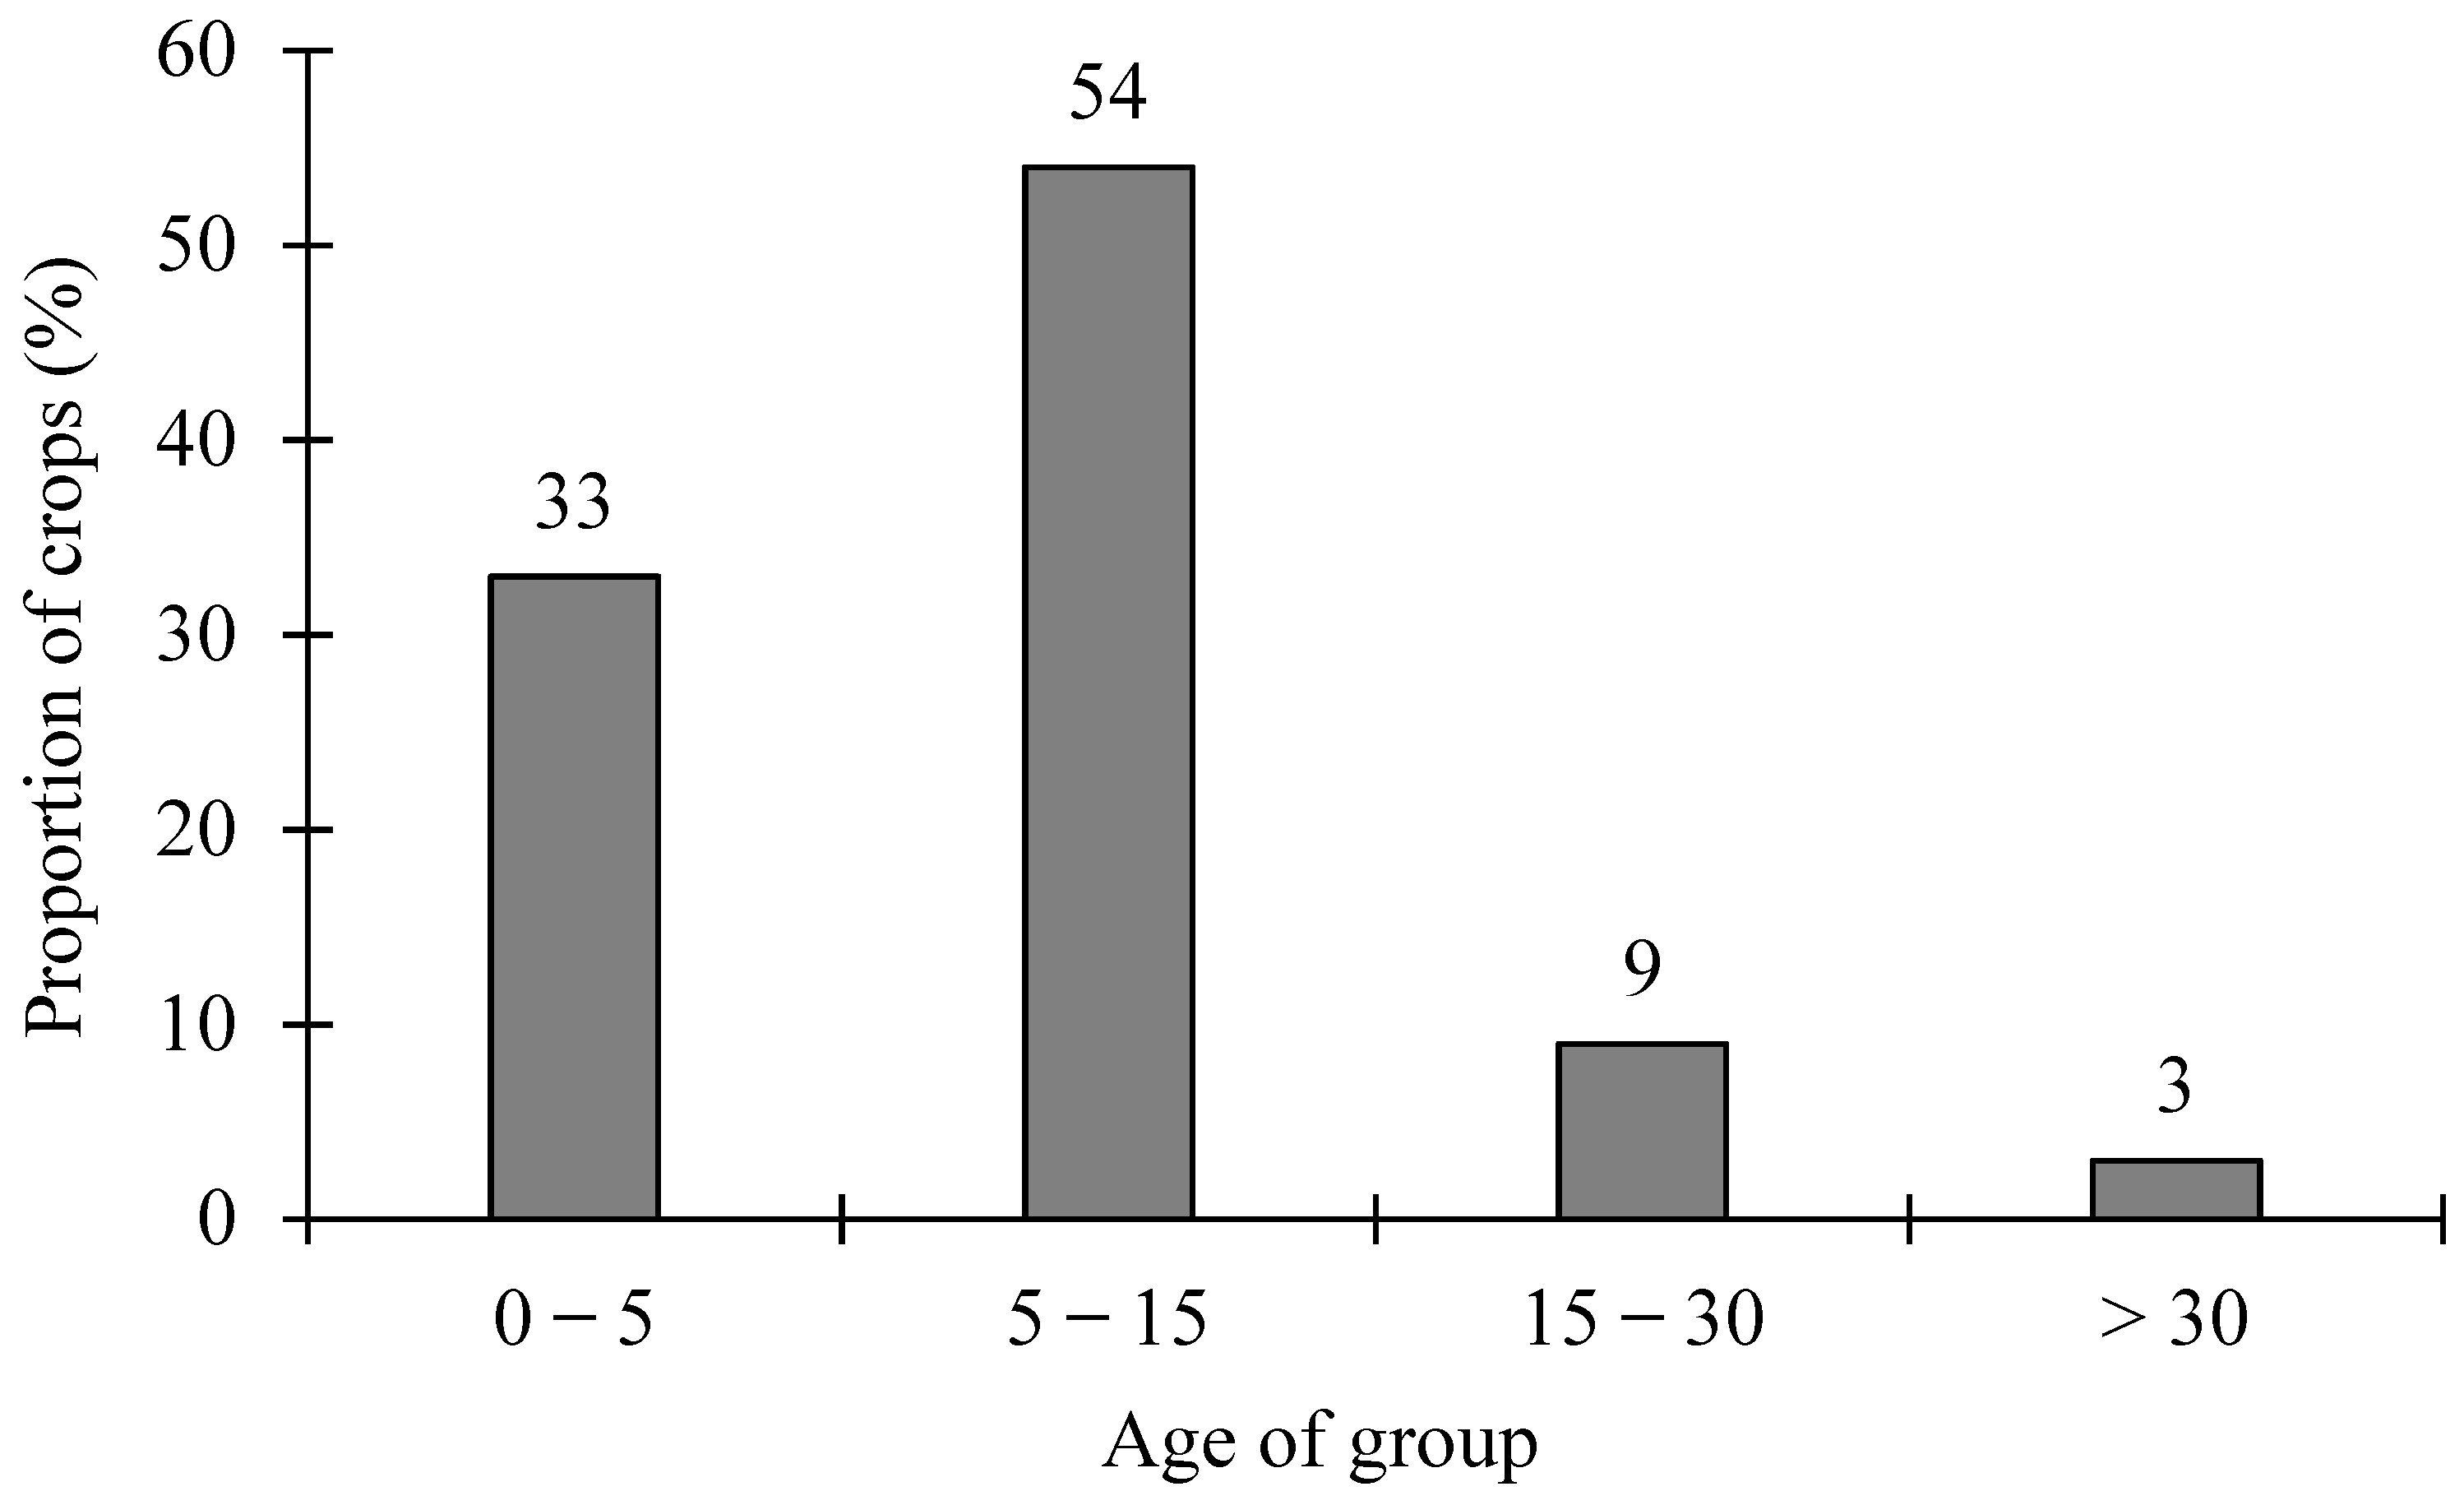
The majority of the cocoa farmers in the study area are in the age range between 5 and 15 years old (Figure 13). These are followed by plantations in creation of less than 5 years old, which represent 33% of the plantations. Mature plantations (15–30 years) and older plantations (more than 30 years) account for 9% and 3%, respectively.
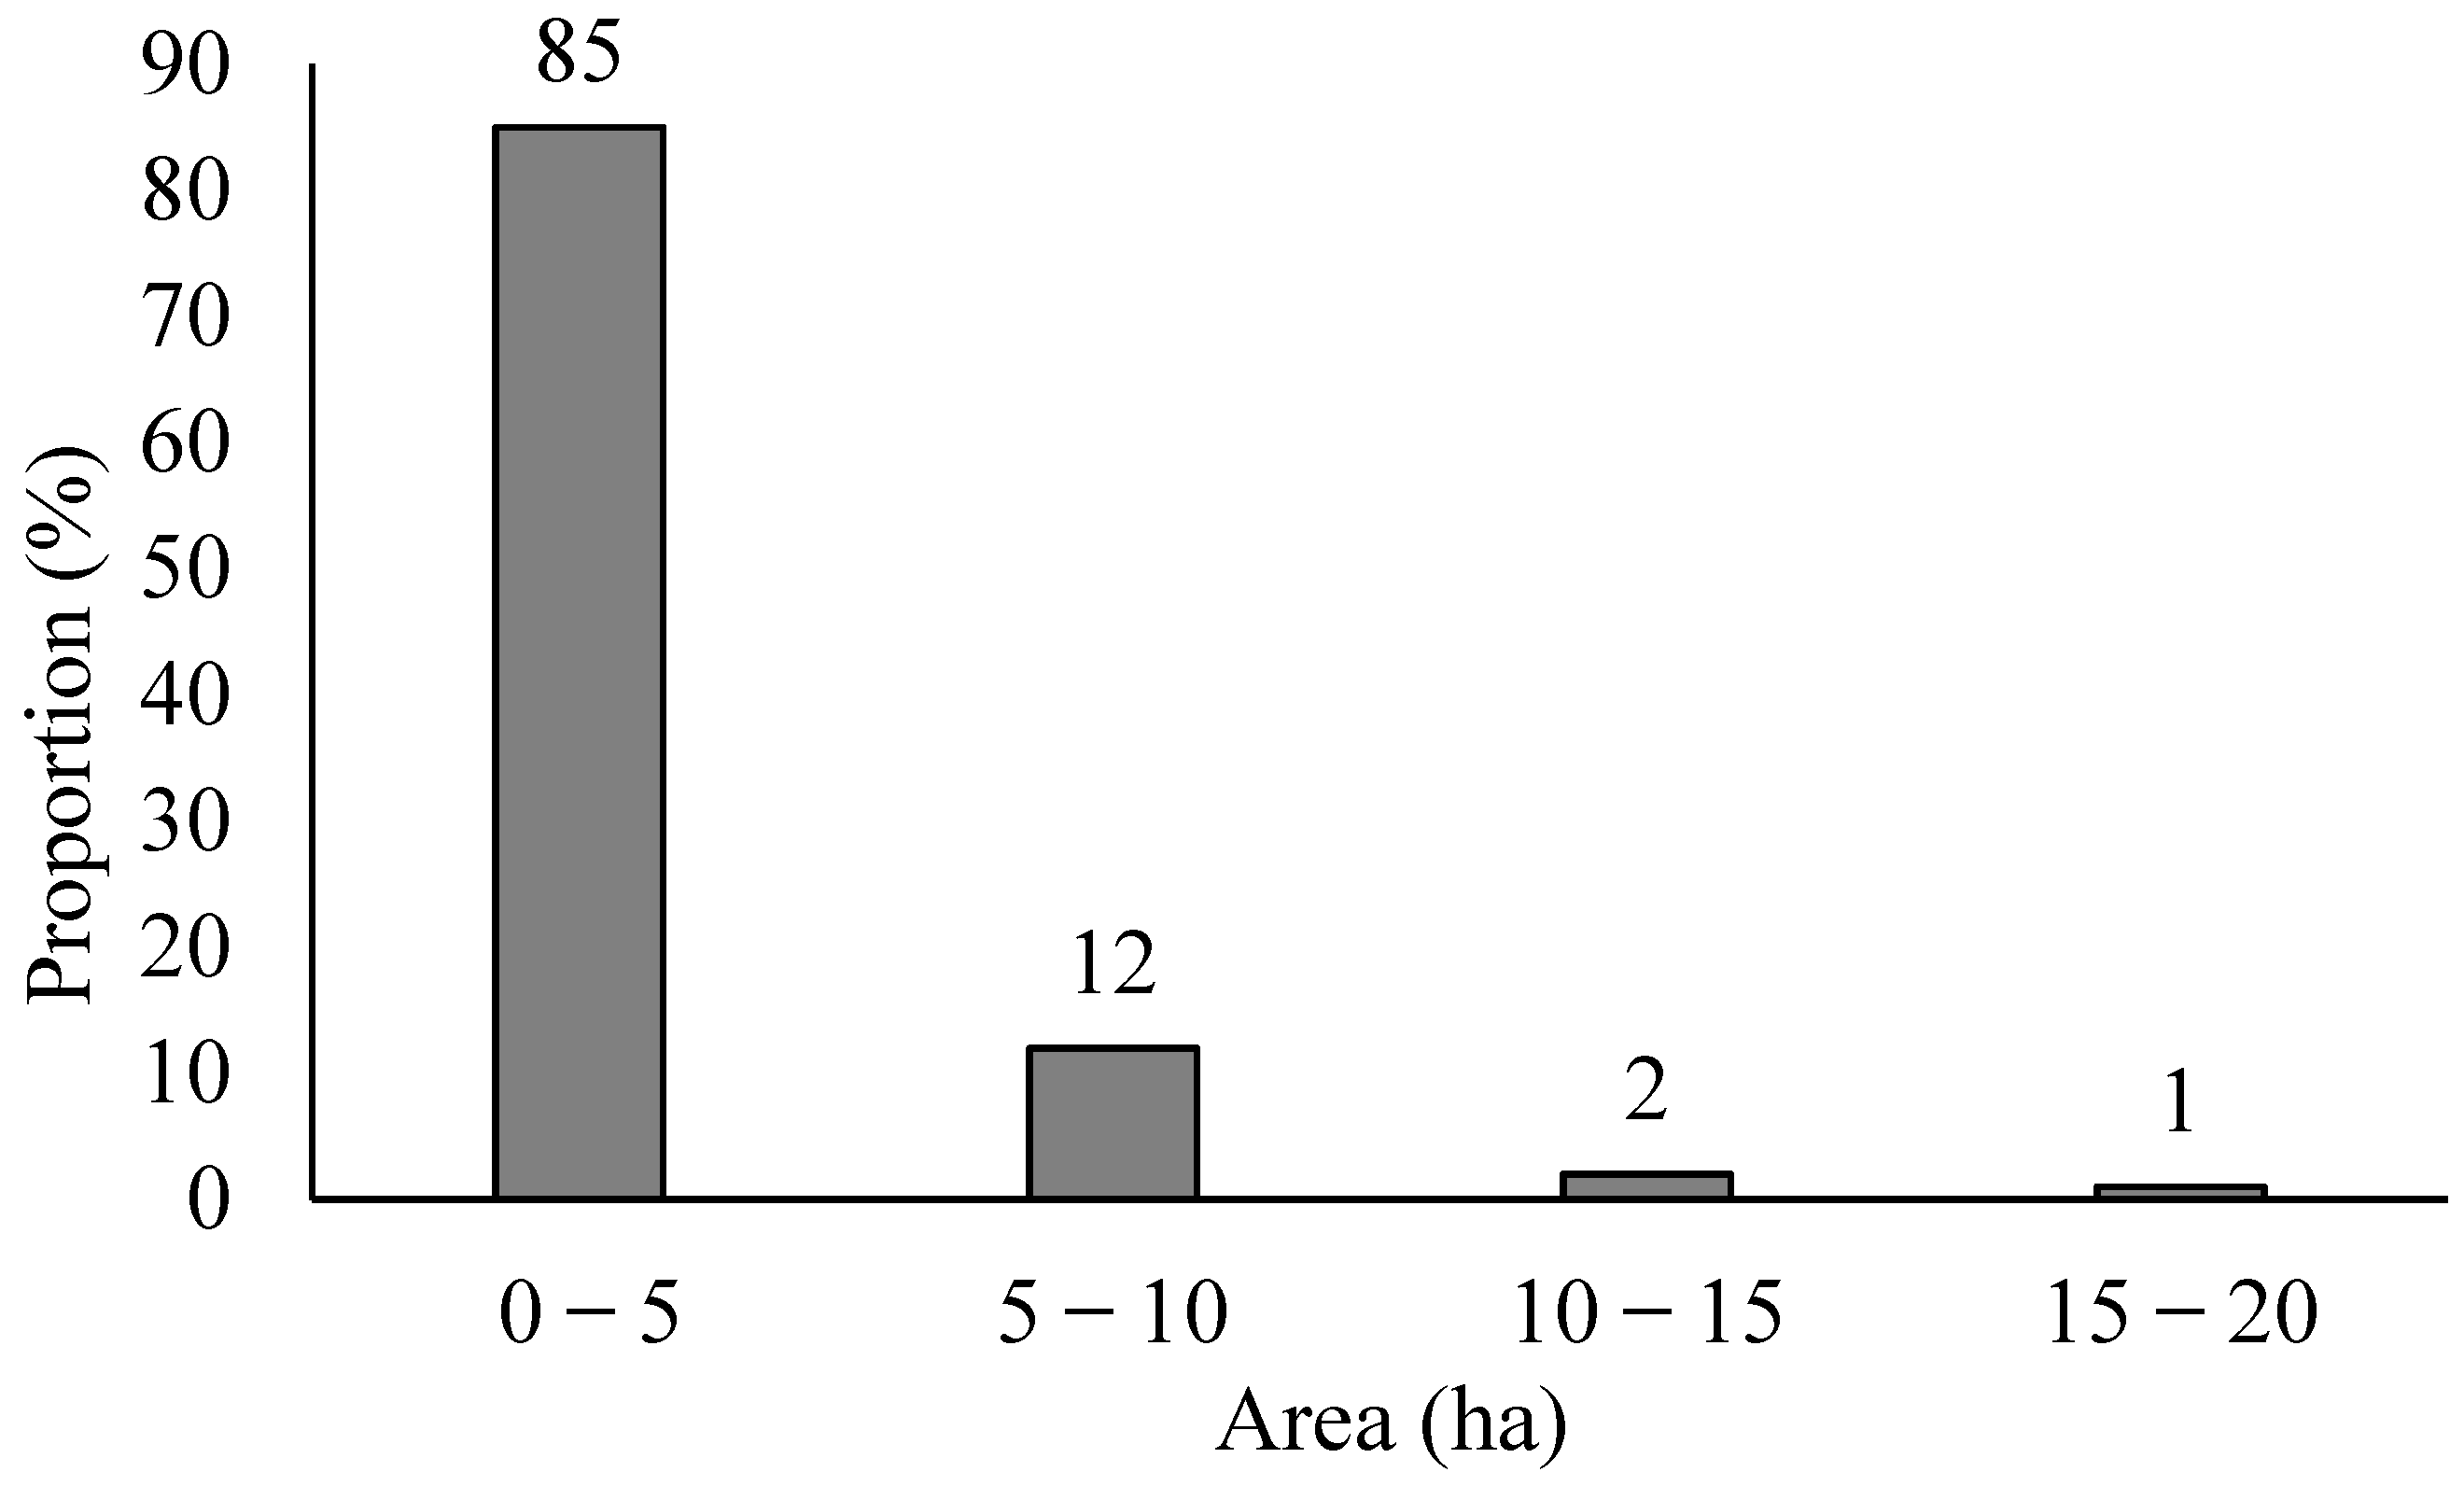
Cocoa plantations occupy less than 5 ha. Only 15% of producers have a plantation larger than 5 ha (Figure 14).
3.1.8. Profile of Farmers and Cocoa Farms
Three (3) different producers’ groups have been identified using different criteria such as farmers profile and plantation characteristics based on the producers age, their origin, previous crop, place of origin, year of establishment and age of the plantations (Figure 15). The first group (G1) is composed by autochthon producers aged 45 years old coming from the West (96.01%) of Ivory-Coast. Established since1985, the farmers of this group have plantations cultivated for 12 years on the former forest and old coffee farms (Table 6 and Table 7).
The second group (G2) is composed of allogen farmers (84.70%) from the Center-West, South, Burkina and Ghana with an average age of 36 years old. These producers came to Biankouma (West) region in 2009. Cocoa plantations in this group are mostly young with an average age of 7 years and the forest and fallow land constitutes the previous crop (77.80%) (Table 6 and Table 7).
The third group (G3) is composed of young allochton producers settled in 2011 and principally coming from the West and Center of the country (52.80%). Forest, fallow land and old cocoa farms constituted the previous crop on the plantations (87.60%). Compared to the other groups, the cocoa plantations in this group are more recent (6 years) (Table 6 and Table 7).
3.2. Discussion
3.2.1. A Reduction of the Ivorian Forest Cover in Favour of Crops
Map data analysis showed a reduction of forest cover against an increase of cultivated areas mainly represented by cocoa trees, between 1985 and 2019. In the 1980s, the highest deforestation rate was observed (−60%) in eastern of Ivory Coast when this region was the epicentre of the country’s cocoa production. After the introduction of cocoa in 1955 [28] in the South-East of Ivory Coast, the cocoa economy has continued to develop through the establishment of cocoa farms in an extensive mode through shifting cultivation on forest clearings [12]. Availability of forest stand, immigration policy and attractive remunerative prices favoured extensive development of cocoa farming in this period [11].
Due to the forest decline, the cocoa epicentre was moved from the East to the Centre-West. The availability of different parks and reserves as well as Classified Forests contributed to the presence of an important cocoa producers in this region. The maximal colonization was of the Marahoué National Park and Bouaflé Classified Forests in the Centre-West if Ivory Coast is an illustrative example. Furthermore, the proximity of Centre-West region with the first epicentre of cocoa production makes them an ideal destination of cocoa producers looking for new forest lands.
The low reduction of forest area in the South-West in 1985 compared to the East and Centre-West of Ivory Coast could be justified by the fact the South-West was relatively unfavourable due to the thick forest cover covering this area and the landlocked nature of the region.
Implementation of new infrastructure such as the bridges over the Sassandra River represent also an important factor promoting access and circulation of agricultural products in this region [29]. Additionally, industrial wood exploitation favoured construction of different roads in the Southwest and also facilitated the transport of agricultural products [30]. The construction of the Kossou and Buyo dams also facilitated population moving and relocation from central Ivory Coast to the southwest. Different agricultural activities of this population participated significantly in the initial forest cover deforestation [31].
The low rate of forest reduction observed during the period 1985–1988 in the mountainous western region could be justified, first, by the lack of development of the cocoa economy in this area and, second, due to the rugged topography marked by the presence of many mountains in this region.
Between 2002 and 2019, crop areas were increased by 720.28% in the western part of Ivory Coast while forest cover decreased due to the cocoa farming extension. During the period 2000, lack of cultivable land, ageing of orchards and the proliferation of diseases in cocoa plantations in the third epicentre of cocoa production entailed significant migration of producers to the West of the country [15]. This region characterized by a rugged topography with many mountains seems not to be predisposed to cocoa production. Moreover, the socio-political crisis experienced by Ivory Coast between 2002 and 2011 encouraged cocoa producer migration to the West of the country. The western region was under the control of military forces rebelling against government authority. Thus, due to the insecurity, the monitoring of the parks and the Classified Forests of this region was not operational [32]. This situation occasioned an anarchic colonization of these ecosystems by the populations [33]. After this colonization, the natural forests were destroyed for crops production occasioning increase of cultivated areas.
However, the end of the conflicts in 2011 entailed an eviction of producers previously occupying West and Central West forests (e.g., Classified Forest of Cavally, Goin-Débé, Haut Dodo, the national parks of Mont Péko and Mont Sangbé, etc.).
These evicted populations settled in rural areas around the state-owned areas, exploiting the forest reserves of these regions. However, the proximity of evicted cocoa farmers to protected areas in western Ivory Coast is an indicator of the impending infiltration of protected areas in the region.
Despite cocoa production is not frequent in savannah ecosystems, it was observed in western region of Ivory Coast. Although this practice has already been reported in Cameroon by [34] and in the pre-forest region of central Ivory Coast [35], it remains marginal and poorly developed in the various Ivorian cocoa production epicentres.
The recovery of forest areas observed in 2000 and 2019 in the former epicentres of cocoa production, for the Centre-West and South-West is largely due to the presence of perennial tree crops such as rubber and teak as well as industrial oil palm crops. In addition to these crops, there are old cocoa orchards and non-producing cocoa trees transformed into old fallow land whose profiles are similar to those of secondary forests, and which have thus been Classified as Forests.
All the statistics showed that the colonization of a new production area is generally due to the depletion of the forest resources in the previous one. They also show that the cocoa economy in Ivory Coast is dynamic.
3.2.2. A Cocoa Economy in the West Governed by Internal Migration
Survey data analysis showed a dominance of producers under 45 years of age in the department of Biankouman reflecting the strong involvement of youth in this region. The same observation was made by [19] in Taï region and [36] in Lakota region where they found that cocoa production is largely run by young people. Also, according to [37], setting up a cocoa plantation is laborious and requires an active workforce.
The majority (53%) of cocoa farmers in the new production region of the west Ivory Coast are not indigenous demonstrating presence of significant population migrations for cocoa production since 2000. Similar observations were pointed out by [38] and [36] in the former cocoa-producing areas of the South-West, East and Centre-West where cocoa production was dominated by non-indigenous populations. This migration is caused by different factors: (i) low productivity due to the ageing of plantations [3], (ii) replanting problems in the former West and South-West loops and (iii) increasing scarcity of suitable forest land for cocoa production in the former loops [39]. The West Ivorian mountainous area still has several forest islands [16,17,18,19,20,21,22,23,24,25,26,27,28,29,30,31,32,33,34,35,36,37,38,39,40] and is, therefore, under attack by cocoa producers.
Analysis of the settlement periods of migrant cocoa farmers in western Ivory Coast indicates that cocoa farming is recent in the study area. Specifically, cocoa farming has been booming in western Ivory Coast since the 2000s, with a large number of farmers settling at the beginning of the last decade. This observation is confirmed by the preponderance of cocoa farmers under 15 years of age in the department. Historically, infiltration into protected areas in Ivory Coast has been mainly carried out by populations not originating from the areas concerned. For example, the findings of [37,41] in the southern part of the Haut-Sassandra Classified Forest and in the Mont Péko National Park by [42] revealed that these protected areas were infiltrated mainly by people of Burkinabe origin. The same is true of most of the protected areas in the South-West of the country.
The average surface area of plantations in the West of Ivory Coast which is 3.5 ha is almost identical to the average surface area of cocoa farms in the former epicentres. However, these areas remain significantly lower than the average cocoa area of 10.9 ha observed in the first cocoa production epicentre in eastern Ivory Coast [38]. There are several reasons for this decline in cocoa area, including the scarcity of forest and the boom in cocoa cultivation in West Africa [43]. Furthermore, these reduced areas could indicate a slowdown in the expansion of cocoa production in the face of the scarcity of forest areas.
3.2.3. The Need to Learn from the Experiences of Former Cocoa-Producing Epicentres
Analysis carried out in this study showed that the epicentres of the cocoa economy are shifting over time. It is estimated by [44] that this shift has been linked to the cocoa life cycle over several decades. According to the same author [44], this shift follows a drop in production linked to deforestation corresponding to the consumption of forest, the development of insect and disease attacks, the life cycle and, therefore, the aging of plantations with a decrease in yields at constant maintenance levels and the decline in the labour force [44]. The risks associated with these epicentres displacements are environmental, economic, socio-cultural and political [11]. Considering the environmental point, the elements of risk are the depletion of the forest and the decrease in rainfall making replanting of cocoa trees impossible. At the economic level, the instability of markets associated with the drop in income leads to limited access to rural credit and, therefore, inaccessibility to agricultural inputs. These risks are exacerbated by threats of political instability that have led to armed conflict in Ivory Coast [32]. Finally, all these elements increase socio-cultural risks, including land conflicts in the different cocoa production epicentres [28]. Taking into account different problems of old cocoa production epicentre, it is therefore useful to define adequate measure in order to prevent future risks in the new production area in western Ivory Coast. Thus, the concentration of non-native farmers in western localities and on the periphery of protected areas should be monitored with particular attention in order to avoid the almost irreversible degradation of protected areas in this region, as was observed in the last two cocoa production epicentres [35].
Furthermore, it would seem useful to change the different cultivation practices observed in the last two epicentres of Centre-Western and Western Ivory Coast, where non-native populations, most often from Sahelian countries, do not associate trees with their cocoa trees during the production phases. Principal reasons for this attitude are due to the lack of knowledge of the domestic uses of local plants by these populations and the non-application of good agricultural practices [45,46]. Agroforestry appear as an adequate solution that would make it possible to ensure the sustainability of cocoa farming in Ivory Coast, as already suggested by [39,47,48]. In addition, research should also prohibit the extension of the results of cocoa seeds that do not tolerate the shade created by the presence of trees on the farm.
However, the scarcity of the forest due to the pressure on this resource is leading cocoa farmers to adapt to the new environmental conditions by recolonizing old fallows as observed in the first and second cocoa epicentres (Figure 3). In this way, a return of the cocoa economy to these former abandoned areas can be expected. In addition, image analyses coupled with field observations have shown that populations do not continue to establish cocoa farming in the pre-forest savannahs of western Ivory Coast as [16,17,18,19,20]. Even if the results are still too recent to better appreciate them, this practice, if successful, would also make it possible to carry out cocoa production in the savannas included in the forest regions or in the entire pre-forest regions of Ivory Coast. All these practices would help to make cocoa production in Ivory Coast sustainable and generate substantial income for the State and improve the living conditions of the farming populations.
4. Conclusions
The objective of this research was to determine the factors explaining the dynamics of the cocoa economy from the East of Ivory Coast to the West. It emerged from this study that the development of agriculture, particularly cocoa cultivation, has been to the detriment of the forest areas of Ivory Coast. From 1985 to 2019, several hectares of forest were lost to crops in each study area. From 1985 to 2019, forest loss was 60.80%, 46.39%, 20.76% and 51.18%, respectively, in the first epicentre of cocoa production in the East, the second epicentre in the Centre-West, the third epicentre in the South-West, and the new production region in the West of Ivory Coast. In the latter region, the decade 2010 constitutes the period of strong installation of producers in this region. Coming from the former cocoa production region and Classified Parks and forests in the west of the country, these producers settled in localities close to protected areas.
In view of the rapid disappearance of the forest cover and the socio-demographic and agronomic characteristics of the plantations, the West Ivorian region is in the process of becoming the new epicentre of cocoa in Ivory Coast. In this context, it would be essential to draw lessons from the development model in the old loops in order to prevent all the difficulties linked to cocoa farming, including deforestation and its collateral effects on the populations. The effective practice of agroforestry by associating trees with cocoa trees could help ensure the sustainability of cocoa production in Ivory Coast.
Author Contributions
Conceptualization: B.Y.S.S.; Methodology: B.Y.S.S., K.G.D., K.A.T.M. and B.J.; Validation: B.Y.S.S., K.G.D., K.A.T.M. and B.J.; Formal Analysis: B.Y.S.S., K.G.D., K.A.T.M.; Investigation: K.G.D.; Resources: B.Y.S.S. and B.J.; Data Curation: B.Y.S.S., K.G.D., K.A.T.M. and B.J.; Writing—Original Draft Preparation: B.Y.S.S. and K.G.D.; Writing—Review and Editing: B.Y.S.S., K.G.D., K.A.T.M. and B.J.; Visualization: K.G.D., K.A.T.M. and B.J.; Supervision: B.Y.S.S. and B.J.; Project Administration: B.Y.S.S.; Funding Acquisition: B.Y.S.S. and B.J. All authors have read and agreed to the published version of the manuscript.
Funding
This research received no external funding.
Acknowledgments
We thank Groupe de Recherche Interdisciplinaire en Ecologie du Paysage et en Environnement of Jean Lorougnon Guédé University for its contribution to the data collection as well as their analysis. We would also like to thank the Biodiversity and Landscape Unit of the University of Liège for its contribution to the acquisition of the data collection equipment.
Conflicts of Interest
The author declares no conflict of interest.
References
- FAO. State of the World’s Forests 2001; FAO Forestry Paper No. 140; FAO: Rome, Italy, 2001; p. 13. [Google Scholar]
- Moron, V. Guinean and sahelian rainfall anomaly indices at annual and monthly scales (1933–1990). Int. J. Climatol. 1994, 14, 325–340. [Google Scholar] [CrossRef]
- Brou, Y.T.; Oszwald, J.; Bigot, S.; Servat, E. Risques de déforestation dans le domaine permanent de l’état en Côte d’Ivoire: Quel avenir pour ces derniers massifs forestiers? Télédétection 2005, 5, 263–275. [Google Scholar]
- Oszwald, J. Dynamique des Formations Agroforestières en Côte d’Ivoire (des Années 1980 aux Années 2000), Suivi par Télédétection et Développement d’une Approche Cartographique. Ph.D. Thesis, University of Sciences and Technologies of Lille, Lille, France, 2005; p. 304. [Google Scholar]
- World Bank. World Bank Reviews Global Forest Strategy; World Bank: Washington, DC, USA, 2000; p. 193. [Google Scholar]
- Beucher, O.; Bazin, F. L’agriculture en Afrique Face aux Défis du Changement Climatique; Institut de l’énergie et de l’environnement de la Francophonie: Québec, QC, Canada, 2012; p. 170. [Google Scholar]
- FAO. Situation des Forêts du Monde 2016. Forêts et Agriculture: Défis et Possibilités Concernant L’utilisation des Terres; FAO: Rome, Italy, 2016; p. 137. [Google Scholar]
- Chevallier, A.; Le Goff, M. Dynamiques de Croissance et de Population en Afrique Sub-Saharienne; Panorama du CEPII: Paris, France, 2014; Volume 2014-A-03, p. 18. [Google Scholar]
- Bweya, M.N.; Musavandalo, M.C.; Sahani, M. Analyse de la dynamique spatio-temporelle du paysage forestier de la région de Beni (Nord-Kivu, RDC). Geo-Eco-Trop. 2019, 43, 171–184. [Google Scholar]
- Assiri, A.A.; Kacou, E.A.; Assi, F.A.; Ekra, K.S.; Dji, K.F.; Couloud, J.Y.; Yapo, A.R. Rentabilité économique des techniques de réhabilitation et de replantation des vieux vergers de cacaoyers (Theobroma cacao L.) en Côte d’Ivoire. J. Anim. Plant Sci. 2012, 14, 1939–1951. [Google Scholar]
- Tano, A.M. Crise Cacaoyère et Stratégies des Producteurs de la Sous-Préfecture de Méadji au Sud-Ouest Ivoirien. Ph.D. Thesis, Université Toulouse, Toulouse, France, 2012; p. 240. [Google Scholar]
- Freud, E.H.; Petithuguenin, P.; Richard, J. Les Champs de Cacao: Un Défi de Compétitivité Afrique-Asie; Éditions Karthala et CIRAD: Paris, France, 2000; p. 207. [Google Scholar]
- Oura, K.R.; Soumahoro, M.; Konan, B. From the military-political crisis to the land crisis: The revelation of inter-community intolerance from the Dio clashes (Biankouma). Tropicultura 2018, 36, 94–115. [Google Scholar]
- Havyarimana, H.; Bamba, I.; Barima, Y.S.S.; Masharabu, T.; Nduwarugira, D.; Bigendako, M.J.; Mama, A.; Bangirinama, F.; Bogaert, J. La contribution des camps de déplacés à la dynamique au Sud et au Sud-Est du Burundi. Tropicultura 2018, 36, 243–257. [Google Scholar]
- Chatelain, C.; Dao, H.; Gautier, L.; Spichiger, R. Forest cover changes in Côte d’Ivoire and Upper Guinea. In Biodiversity of West African Forests: Ecological Atlas of Woody Plant Species; Poorter, L., Bongers, F., Kouamé, F.N., Hawthorne, W.D., Eds.; CABI Publishing: Wallingford UK, 2004; pp. 45–82. [Google Scholar]
- Konan, G.D. Dynamique D’installation des Cacaoyères et Impacts sur le Paysage de la Sous-Préfecture de Biankouma (Ouest de la Côte d’Ivoire) de 1998 à 2018; Mémoire de Master en Biodiversité et Gestion Durale des Ecosystème option Ecologie et Gestion Durable des Ecosystèmes, UFR Agroforesterie; Université Jean Lorougnon Guédé Daloa: Daloa, Cote D’Ivoire, 2019; p. 69. [Google Scholar]
- Goli, K.E. Caractéristiques Agronomiques et Diversité Végétale des Cacaoyères du Département de Biankouma (Ouest de la Cote d’Ivoire); Mémoire de Master en Agriculture et Foresterie option Foresterie, UFR Agroforesterie; Université Jean Lorougnon Guédé Daloa: Daloa, Cote D’Ivoire, 2019; p. 69. [Google Scholar]
- Kouadjo, J.M.; Keho, Y.; Mosso, R.A.; Toutou, K.G.; Nkamleu, G.B.; Gockowski, J. Production et Offre du Cacao et du Café en Cote d’Ivoire; Survey Report (stcp –ci: Production and Supply of Cocoa and Coffee in Cote d’Ivoire—Survey Report); Ministre de l’Enseignement Supérieur et de la Recherche Scientifique, Ecole Nationale Supérieure de Statistique et d’Economie Appliqué (ENSEA) and the International Institute of Tropical Agriculture (IITA): Abidjan, Cote D’Ivoire, 2002; p. 128. [Google Scholar]
- Varlet, F.; Kouamé, G.; Caspary, H.A. Étude de la Production de Cacao en Zone Riveraine du Parc National de Taï; Programme de Développement Economique en Milieu Rural et Biodiversité (PRODEMIR); Deutsche Gesellschaft für Internationale Zusammenarbeit (GIZ): Abidjan, Cote D’Ivoire, 2013; p. 190. [Google Scholar]
- Tiébré, M.-S.; Ouattara, D.; Kpangui, K.B.; Kouassi, D.F.; N’Guessan, K.E. Floristic diversity of the Foungbesso region in the forest-savanna transition zone in the West of Cote d’Ivoire. Int. J. Biol. Chem. Sci. 2016, 10, 1007–1016. [Google Scholar] [CrossRef] [Green Version]
- Mas, J.F. A review of methods and techniques for remote sensing of change. Can. J. Remote Sens. 2000, 26, 349–362. [Google Scholar] [CrossRef]
- Bonn, F.; Rochon, G. Précis de Télédétection: Principes et Méthodes; Presses de l’université du Québec/AUPELF: Sainte-Foy, QC, Canada, 1992; Volume 1, p. 485. [Google Scholar]
- Carloz, R.; Collet, C. Précis de Télédétection: Traitements Numériques D’images de Télédétection; Presses de l’Université du Québec/AUPELF: Sainte-Foy, QC, Canada, 2001; Volume 3, p. 386. [Google Scholar]
- Girard, M.C.; Girard, C.M. Traitement des Données de Télédétection; Dunod: Paris, France, 1999; p. 529. [Google Scholar]
- N’Doumé, C.; Lachenaud, P.; Hussard, A.; Nguyen, H.; Flori, A. Easibility study for the elaboration of a statistical mapping of coffee and cocoa orchards inventory in Cote d’Ivoire by satellite remote sensing. Bull. SFPT 2000, 157, 3–10. [Google Scholar]
- Collinge, S.K.; Forman, R.T.T. A conceptual model of land conversion processes: Prediction and evidence from a microlandscape experiment with grassland insect. Oikos 1998, 82, 66–84. [Google Scholar] [CrossRef]
- Bogaert, J.; Ceulemans, R.; Salvador-Van Eysenrode, D. Decision tree algorithm for detection of spatial processes in landscape transformation. Environ. Manag. 2004, 33, 62–73. [Google Scholar] [CrossRef] [PubMed]
- Kouadio, K.H.; Desdoigts, A. Deforestation, Migration, Saturation and Land Reforms: Cote d’Ivoire between Resilience and Rural Land Disputes; MPRA Paper 49938; University Library of Munich: Munich, Germany, 2012. [Google Scholar]
- Schwartz, A. Grands Projets de Développement et Pratique Foncière en Cote D’Ivoire, L’exemple de l’opération San-Pedro. In Enjeux Fonciers en Afrique Noire; Le Bris, E., Le Roy, E., Leimdorfer, F., Eds.; ORSTOM Karthala: Paris, France, 1982; p. 293. [Google Scholar]
- Sournia, G. Spatial planning and development strategy in Cote d’Ivoire. L’Information Géographique 2003, 67, 124–129. [Google Scholar] [CrossRef]
- Babo, A.; Droz, Y. Land conflicts. From ethnicity to nation. Inter-ethnic relations and “ivoirité” in Wouth-western Cote d’Ivoire. Cahiers D’études Afr. 2008, 48, 741–764. [Google Scholar] [CrossRef] [Green Version]
- Barima, Y.S.S.; Kouakou, A.T.M.; Bamba, I. Configuration d’une forêt domaniale soumise à des pressions anthropiques en Cote d’Ivoire: Cas du Nord de la forêt classée du Haut-Sassandra. Revue Ivoir. Sci. Tech. 2016, 28, 190–215. [Google Scholar]
- SOFRECO. West Africa Post Conflict Analysis; Rapport final; World Bank: Clichy, France, 2009; p. 184. [Google Scholar]
- Jagoret, P.; Kwesseu, J.; Messie, A.C.; Michel, I.; Malézieux, E. Use values of wood used in agroforestry: Cocoa trees in Central Cameroun. Bois For. Trop. 2014, 321, 45–54. [Google Scholar] [CrossRef]
- Kpangui, K.B.; Vroh, B.T.A.; Kouamé, D.; Goné, B.Z.B.; Koffi, B.J.C.; Yao, C.A. Dynamics of cocoa expansion in forest-savanna contact zones: The case of the sub-prefecture of Kokumbo (Central Cote d’Ivoire). Tropicultura 2018, 36, 195–205. [Google Scholar]
- Cissé, A.; Aka, J.C.K.; Kouamé, D.; Vroh, B.T.A.; Adou Yao, C.Y.; N’guessan, K.E. Characterization of cocoa-based agroforestry practices in areas of semi-deciduous dense forest: Case of the locality of Lakota (Centre-West, Ivory Coast). Eur. Sci. J. 2016, 12, 21–50. [Google Scholar]
- Zerbo, R.; Hema, K.B. La Dynamique Migratoire des Burkinabé en Cote d’Ivoire Dans la Période de Crise Politico-Militaire de 2000 à 2011: Accessibilité aux Terres Agricoles et Investissement Liés à la Culture du Cacao; D2PCPCI Project Report; D2PCPCI: Daloa, Cote D’Ivoire, 2015; p. 40. [Google Scholar]
- Assiri, A.A.; Yoro, G.R.; Deheuvels, O.; Kébé, B.I.; Keli, Z.J.; Adiko, A.; Assa, A. Agronomic characteristics of cocoa (Theobroma cacao L.) orchards in Cote d’Ivoire. J. Anim. Plant Sci. 2009, 2, 55–66. [Google Scholar]
- Zanh, G.; Koua, K.; Kouakou, A.T.; Barima, S. Land saturation on the periphery of the Haut-Sassandra Classified Forest (Centre-West of Cote d’Ivoire) during the period from 1990 to 2016. Tropicultura 2018, 36, 171–182. [Google Scholar]
- Schweter, M. Interprétation des Images Satellites Pour Déterminer la Surface de Forêt du Parc National de Taï; Report; OIPR, GIZ: Abidjan, Cote D’Ivoire, 2012; p. 51. [Google Scholar]
- Timité, N. Caractérisation Agronomique des Plantations Cacaoyères Dans la Forêt Classée du Haut- Sassandra (Centre-Ouest de la Cote d’Ivoire); Mémoire Master en Sciences de la Vie et de la Terre, UFR Agroforesterie; Université Jean Lorougnon Guédé: Daloa, Cote D’Ivoire, 2018; p. 69. [Google Scholar]
- N’guessan, K.G.; Oura, K.R.; Loba, A.D.F.V. Political crisis, land pressure and food security on the outskirts of the Mount Peko classified forest. Tropicultura 2018, 36, 2. [Google Scholar]
- Ruf, F. Social and economic determinants of replanting. OCL Oléagineux 2000, 7, 189–196. [Google Scholar] [CrossRef]
- Ruf, F. Cocoa cycles in Cote d’Ivoire. Challenging a model. In The Ivorian Model in Question. Crises, Adjustments, Recompositions; Contamin, B., Memel-Fotê, H., Eds.; Karthala: Paris, France, 1997; Volume 16, pp. 249–264. [Google Scholar]
- Barima, Y.S.S.; Assalé, A.A.Y.; Vignal, M.; Andrieu, J.; Godron, M. Post-conflict characterization of disturbances in the classified forest of Haut-Sassandra in Cote d’Ivoire. Afr. Sci. 2016, 12, 66–82. [Google Scholar]
- Kouakou, K.A.; Barima, Y.S.S.; Kouakou, A.T.M.; Sangne, Y.C.; Bamba, I.; Kouamé, N.F. Post-armed conflict plant diversity in the Haut-Sassandra Classified Forest (Centre-West of Cote d’Ivoire). J. Anim. Plant Sci. 2015, 26, 4058–4071. [Google Scholar]
- Assalé, A.A.Y.; Barima, Y.S.S.; Sangne, Y.C.; Bleu, D.K.C.R.; Kpangui, K.B. Evaluation of supply services provided by anthropised state-owned areas: Case of the classified forest of Haut-Sassandra (Centre-West of Cote d’Ivoire). Can. J. For. Res. 2020, 2019, 0443. [Google Scholar]
- Sanial, E. A la Recherche de L’ombre: Analyse du Retour des Arbres Associés Dans les Plantations de Cacao Ivoiriennes; Mémoire Master Interface Nature Société; Université Jean Moulin Lyon III: Lyon, France, 2015; p. 96. [Google Scholar]
Figure 1.
Presentation of study area.

Figure 2.
Villages surveyed in Biankouma region.

Figure 3.
Land-cover maps of the Abengourou (left) and Daloa (right) region.

Figure 4.
Land-cover maps of the Soubré (left) and Biankouma (right) regions.

Figure 5.
Changes in proportions of forest area and crops in the different cocoa production regions in Ivory Coast.
Figure 5.
Changes in proportions of forest area and crops in the different cocoa production regions in Ivory Coast.

Figure 6.
Relationship between national production and proportion of forest from 1985–1986 to 2018–2019.
Figure 6.
Relationship between national production and proportion of forest from 1985–1986 to 2018–2019.

Figure 7.
Distribution of cocoa producers by age group in Biankouma region.

Figure 8.
Distribution of cocoa farmers Biankouma region.

Figure 9.
Origin of cocoa farmers in Biankouma region.

Figure 10.
Place of origin of cocoa farmers in Biankouma region.

Figure 11.
Period of installation of migrant cocoa farmers in Biankouma region.

Figure 12.
Cultivation history of cocoa farms in Biankouma region.

Figure 13.
Age of cocoa farms in Biankouma region.

Figure 14.
Distribution of plantations in Biankouma region.

Figure 15.
Graph showing the different groups of cocoa producer.


Table 1.
Satellite images characteristics.
| Period | Situation/Locality | Scene ID | Sensor | Resolution |
|---|---|---|---|---|
| 1985–1988 | East/Abengourou | 195–055/195–056 | Landsat TM | 30 m |
| Centre-West/Daloa | 197–055 | Landsat TM | 30 m | |
| South-West/Soubré | 197–056 | Landsat TM | 30 m | |
| West/Biankouma | 197–056 | Landsat TM | 30 m | |
| 2000–2002 | East/Abengourou | 195–055/195–056 | Landsat ETM+ | 30 m |
| Centre-West/Daloa | 197–055 | Landsat ETM+ | 30 m | |
| South-West/Soubré | 197–056 | Landsat ETM+ | 30 m | |
| West/Biankouma | 197–055 | Landsat ETM+ | 30 m | |
| 2018–2019 | East/Abengourou | 195–055/195–056 | Landsat OLI | 30 m |
| Centre-West/Daloa | 197–055 | Landsat OLI | 30 m | |
| South-West/Soubré | 197–056 | Landsat OLI | 30 m | |
| West/Biankouma | 197–056 | Landsat OLI | 30 m |
Table 2.
Kappa coefficients of classified images.
| Period | Study Area | Kappa Coefficient (%) |
|---|---|---|
| 1985–1986 | East/Abengourou | 94 |
| Centre-West/Daloa | 93 | |
| South-West/Soubré | 93 | |
| West/Biankouma | 96 | |
| 2000–2002 | East/Abengourou | 94 |
| Centre-West/Daloa | 91 | |
| South-West/Soubré | 90 | |
| West/Biankouma | 91 | |
| 2018–2019 | East/Abengourou | 94 |
| Centre-West/Daloa | 90 | |
| South-West/Soubré | 85 | |
| West/Biankouma | 96 |
Table 3.
Proportion (%) of land-cover occupation.
| Production Area | Class | 1985–1988 | 2000–2002 | 2018–2019 |
|---|---|---|---|---|
| East | Forest | 59.32 | 40.39 | 23.25 |
| Crops | 7.92 | 15.51 | 38.96 | |
| Others | 8.41 | 14.75 | 27.71 | |
| Centre-West | Forest | 70.65 | 77.96 | 37.88 |
| Crops | 7.24 | 10.62 | 25.47 | |
| Others | 22.95 | 12.27 | 37.33 | |
| South-West | Forest | 69.72 | 73.22 | 55.25 |
| Crops | 11.36 | 13.14 | 29.39 | |
| Others | 19.05 | 20.43 | 15.45 | |
| West | Forest | 51.54 | 50.91 | 25.16 |
| Crops | 3.68 | 3.1 | 30.18 | |
| Others | 45.05 | 46.04 | 43.98 |
Table 4.
Structural parameters of forest and crop classes in the different cocoa production region in Ivory Coast.
Table 4.
Structural parameters of forest and crop classes in the different cocoa production region in Ivory Coast.
| Production Area | Parameter | Study Period | ||
|---|---|---|---|---|
| 1985–1986 | 2000–2002 | 2018–2019 | ||
| East(1st production epicenter)) | nf | 18,228 | 21,172 | 10,733 |
| Nc | 10,380 | 12,278 | 5782 | |
| pf | 240 | 213 | 108 | |
| pc | 93 | 849 | 4275 | |
| Centre-West(2nd production epicenter) | nf | 7524 | 3710 | 14,443 |
| Nc | 9124 | 6515 | 12,533 | |
| pf | 33 | 69 | 522 | |
| pc | 117 | 21 | 147 | |
| South-West (3rd production epicenter) | nf | 17,443 | 12,988 | 3399 |
| Nc | 14,626 | 7850 | 16,606 | |
| pf | 315 | 54 | 45 | |
| pc | 63 | 120 | 120 | |
| West (New production area) | nf | 26,401 | 22,601 | 27,902 |
| Nc | 13,156 | 5985 | 16,737 | |
| pf | 930 | 462 | 252 | |
| pc | 57 | 36 | 240 | |
nf: number of forest patches; nc: number of crop patches; pf: perimeters of forest patches; pc: perimeters of crop patches.
Table 5.
Rate of change in forest and crop classes.
| Regions | Class | 1985–2019 | 1985–2002 | 2002–2019 |
|---|---|---|---|---|
| 1st production epicenter | Forest | −60.80 | −31.91 | −42.43 |
| Crops | 392.12 | 95.96 | 151.13 | |
| 2nd production epicenter | Forest | −46.39 | 10.34 | −51.42 |
| Crops | 251.73 | 46.68 | 139.80 | |
| 3rd production epicenter | Forest | −20.76 | −20.76 | −24.54 |
| Crops | 158.63 | 15.60 | 123.71 | |
| New production area | Forest | −51.18 | −1.22 | −50.58 |
| Crops | 720.28 | −15.85 | 874.77 |
Table 6.
Summary of qualitative variables characteristic of the profile of infiltrators and cocoa plantations.
Table 6.
Summary of qualitative variables characteristic of the profile of infiltrators and cocoa plantations.
| Origin. | Variable | G1 | G2 | G3 | Chi2 Test |
|---|---|---|---|---|---|
| Allochton | 2.3 | 6.9 | 90.3 | 400.51 *** | |
| Allogen | 2.3 | 84.7 | 5.6 | ||
| Autochton | 95.3 | 8.3 | 4.2 | ||
| Previous crop | For | 52.7 | 47.2 | 52.8 | 61.16 |
| F-land | 14.7 | 30.6 | 18.1 | ||
| Sav | 3.1 | 19.4 | 5.6 | ||
| O.co | 19.4 | 1.4 | 5.6 | ||
| O.coc | 3.9 | 0.0 | 16.7 | ||
| F.F | 6.2 | 1.4 | 1.4 | ||
| Place of origin | C | 0.8 | 1.4 | 16.7 | 214.42 *** |
| C-W | 0.8 | 25.0 | 0.0 | ||
| ECOWAS | 0.0 | 12.5 | 0.0 | ||
| E | 0.0 | 1.4 | 9.7 | ||
| N | 0.0 | 0.0 | 12.5 | ||
| N-W | 0.8 | 4.2 | 0.0 | ||
| W | 96.1 | 33.3 | 36.1 | ||
| S | 1.6 | 8.3 | 2.8 | ||
| S-O | 0.0 | 13.9 | 22.2 |
Threshold of significance of Chi-square tests: *** < 0.001, G: Group, For: Forest, F.land: fallow land, sav: savanna, O.co: Old cofee farm, O.coc: Old cocoa farm, F.F: food field, C: Centre, C-W: Centre-West, E: East, N: Nord, N-W: North-West, W: West, s: South, s-o: South-West, ECOWAS: Economic Community of West African States.
Table 7.
Summary of qualitative variables characteristic of the profile of infiltrators and cocoa plantations.
Table 7.
Summary of qualitative variables characteristic of the profile of infiltrators and cocoa plantations.
| G1 | G2 | G3 | Fisher Test | |
|---|---|---|---|---|
| Year of establishment | 1985 a | 2009 b | 2011 b | 118.2 *** |
| Producers age | 45.07 b ± 13.01 | 36.29 a ± 10.52 | 36.14 a ± 11.17 | 18.79 *** |
| Age of the plantations | 12.05 b ± 10.68 | 7.21 a ± 3.39 | 6.81 a ± 4.46 | 13.9 *** |
For each line, the values followed by the same letter are not significantly different. *** < 0.001.
Publisher’s Note: MDPI stays neutral with regard to jurisdictional claims in published maps and institutional affiliations. |
© 2020 by the authors. Licensee MDPI, Basel, Switzerland. This article is an open access article distributed under the terms and conditions of the Creative Commons Attribution (CC BY) license (http://creativecommons.org/licenses/by/4.0/).
Share and Cite
MDPI and ACS Style
Yao Sadaiou Sabas, B.; Gislain Danmo, K.; Akoua Tamia Madeleine, K.; Jan, B. Cocoa Production and Forest Dynamics in Ivory Coast from 1985 to 2019. Land 2020, 9, 524. https://0-doi-org.brum.beds.ac.uk/10.3390/land9120524
AMA Style
Yao Sadaiou Sabas B, Gislain Danmo K, Akoua Tamia Madeleine K, Jan B. Cocoa Production and Forest Dynamics in Ivory Coast from 1985 to 2019. Land. 2020; 9(12):524. https://0-doi-org.brum.beds.ac.uk/10.3390/land9120524
Chicago/Turabian StyleYao Sadaiou Sabas, Barima, Konan Gislain Danmo, Kouakou Akoua Tamia Madeleine, and Bogaert Jan. 2020. "Cocoa Production and Forest Dynamics in Ivory Coast from 1985 to 2019" Land 9, no. 12: 524. https://0-doi-org.brum.beds.ac.uk/10.3390/land9120524
Note that from the first issue of 2016, this journal uses article numbers instead of page numbers. See further details here.