Article

Applying the RUSLE and ISUM in the Tierra de Barros Vineyards (Extremadura, Spain) to Estimate Soil Mobilisation Rates

by
Jesús Barrena-González
1,
Jesús Rodrigo-Comino
2,3,*,
Yeboah Gyasi-Agyei
4,
Manuel Pulido Fernández
1 and
Artemi Cerdà
3
1
GeoEnvironmental Research Group (GIGA), University of Extremadura, 10071 Cáceres, Spain
2
Physical Geography, Trier University, 54286 Trier, Germany
3
Soil Erosion and Degradation Research Group, Department of Geography, Valencia University, Blasco Ibàñez, 28, 46010 Valencia, Spain
4
School of Engineering and Technology, Central Queensland University, Rockhampton QLD 4702, Australia
*
Author to whom correspondence should be addressed.
Submission received: 7 February 2020 / Revised: 20 March 2020 / Accepted: 20 March 2020 / Published: 23 March 2020
(This article belongs to the Special Issue Soil Erosion Processes and Rates in Arid and Semiarid Ecosystems)

Abstract

:
Spain is one of the largest wine producers in the world, with Extremadura (south-west Spain) being its second-largest producing region after Castilla La Mancha. Within Extremadura, the most traditional and productive viticulture region is the Tierra de Barros, which boasts an annual production of 3×10⁶ litres. However, no soil erosion assessment has been undertaken in any vineyard in the region to ascertain environmental sustainability. Therefore, the Improved Stock Unearthing Method (ISUM) and the Revised Universal Soil Loss Equation (RUSLE) were applied to assess the long-term soil erosion rates. Both methods were applied using an experimental plot (2.8 m × 148.5 m) encompassing 99 paired vines in a 20-year-old vineyard under a tillage management system and on bare soils throughout the year. The ISUM and RUSLE found total soil mobilization values of 45.7 Mg ha−1 yr−1 and 17.4 Mg ha−1 yr−1, respectively, a difference of about 5 times. Mapping techniques showed that soil surface declined to an average of −6.2 cm, with maximum values of −28 cm. The highest values of soil depletion were mainly observed in the upper part and the form of linear features following the hillslope direction. On the other hand, under the vines, the soil surface level showed accumulations of up to +2.37 cm due to tillage practices. Our study demonstrated the potential of high soil erosion rates occurring in conventional vineyards managed with tillage in the inter-row areas and herbicides under the vines within the Tierra de Barros. Also, we demonstrated the elevated differences in soil mobilisation rates using the ISUM and RUSLE. Therefore, further research must be conducted in other vineyards to determine the suitability of the models for assessing soil erosion rates. Undoubtedly, soil conservation measures must be designed and applied immediately due to high erosion rates.

1. Introduction

Soil erosion directly affects natural and anthropogenic resources, biogeochemical cycles, and ecosystem functions [1]. This environmental issue must be mitigated to achieve neutrality of land degradation [2,3] according to the Sustainable Development Goals of the United Nations [4]. For the ongoing issues in agriculture and land management, soil erosion is one of the most relevant concerns [5]. Lands have shown erosion rates of up to 10 Mg ha−1 yr−1 [6]. For example, high soil erosion rates were measured under cereal crops [7], citrus plantations [8], and olive groves [9]. It is well accepted that the use of herbicides, intense tillage, and lack of vegetation increase soil erodibility and subsequently damage soil quality.
Vineyards are croplands that are subjected to high soil erosion rates, often exceeding the tolerable limits (which range from 0.3 to 1.4 Mg ha−1 yr−1) for conditions prevalent in Europe [10], and this could render wine production non-sustainable in the medium- to the long-term [11,12]. However, the extent of erosion remains unknown in many regions of the world as most of the research is concentrated in the Mediterranean belt areas such as Italy or France [13,14,15], and some parts of Central Europe such as Germany [16]. In a recent study, Prosdocimi et al. [17] showed that some Mediterranean vineyards registered up to 60 Mg ha−1 y−1 soil loss. They identified the key contributing factors as (1) the loss of organic carbon because of the bare soils and the use of herbicides; (2) steep slopes; and (3) extreme rainfall events. Nevertheless, some authors agree that the number of measurements undertaken for erosion assessments is still not sufficient to characterise the high diversity of Mediterranean vineyards [18].
The geomorphological position of most vineyards in the Mediterranean environments can increase the interaction between soil erosion processes, pedological characteristics, land management, and climate conditions, as demonstrated in natural and abandoned areas [19]. The steep slopes in combination with heavy rainfall events (mainly in spring and autumn), light leaf cover on bare soils, and intensive soil tillage cause the development of rills, gullies, and serious soil losses [20,21]. These erosion features also enhance the variability of the connectivity processes, which call for studies of soil mobilisation and soil loss estimations in vineyards. Therefore, precise methods to assess soil erosion risks such as Gerlach troughs, soil erosion pins, or empirical models based on hydrological processes and human impacts are considered necessary and relevant.
The environmental consequences of soil erosion are also reflected in the decreased soil capacity for the development of some of its basic functions and services, loss of nutrients, carbon sequestration, river and reservoir siltation, floods, and damage to infrastructure [22]. As far as economic costs are concerned, some authors have estimated that the losses due to erosion by water and tillage are considerable [23,24]. This is particularly so in wine production regions that also suffer environmental degradation [25]. However, there are no data available on soil losses in many regions of Spain. Most of the research has been done in Aragón [26], Andalucía [27], La Rioja [28,29], and Valencia [30]. Research is yet to be conducted in the Central Iberian Peninsula, including Castilla La Mancha, Extremadura, and Castilla–León, where the greatest wine production in Spain takes place.
Within the Mediterranean wine production areas, Spain is one of the world’s largest producers and contains the largest surface of cultivated vines; there has been some research on land degradation problems within the vineyards [26,31]. In those regions, bare soils, long-term application of tillage to control weeds, and the use of heavy and powerful machinery during the last 30 years have induced high erosion rates [32,33]. A notable example is the vineyards of Extremadura, which occupy the second-largest total surface area cultivated with vines (80,764 ha) after Castilla-La Mancha. The majority of the vineyards are located in the province of Badajoz (96.5%) in the viticultural region of the Tierra de Barros (“Mapa de Cultivos y Aprovechamientos 2000–2010”). The viticultural sector of Extremadura registers an annual production that exceeds 3 × 10⁸ L of wine.
Previous studies on Extremadura often focused on socio-economic aspects, pruning styles, and the height of the strain stock for the adaptation of irrigation and wine quality, or in matters based on viticultural bioclimatic indices [34]. Other environmental aspects such as soil quality, plant and fauna diversity, water quality, and nutrient losses are yet to be researched. Lack of this information in an area that is expanding the production of grapes is risky as the lack of surveys, proper soil erosion control, and soil protection can result in soil degradation, water pollution, and reservoir siltation [23].
Thus, the main goal of this research is to estimate and map soil erosion processes in a representative plot within a 20-year old conventional vineyard in the Tierra de Barros, Extremadura. The Revised Universal Soil Loss Equation (RUSLE) [35] and the Improved Stock Unearthing Method (ISUM) [36] were applied to achieve this goal. These methods share a common feature of estimating the average soil mobilisation for a certain timeframe. The RUSLE is traditionally used with pre-established parameters such as rainfall erosivity, length of the slope, or soil management [37]. On the other hand, ISUM was recently updated from the Stock Unearthing Method (SUM) considering in situ measurements of the graft union as a passive indicator of the soil surface level. Therefore, the application of both methods will shed light on the soil erosion rates in the Tierra de Barros wine production region to help assess the environmental sustainability of the vineyards.

2. Materials and Methods
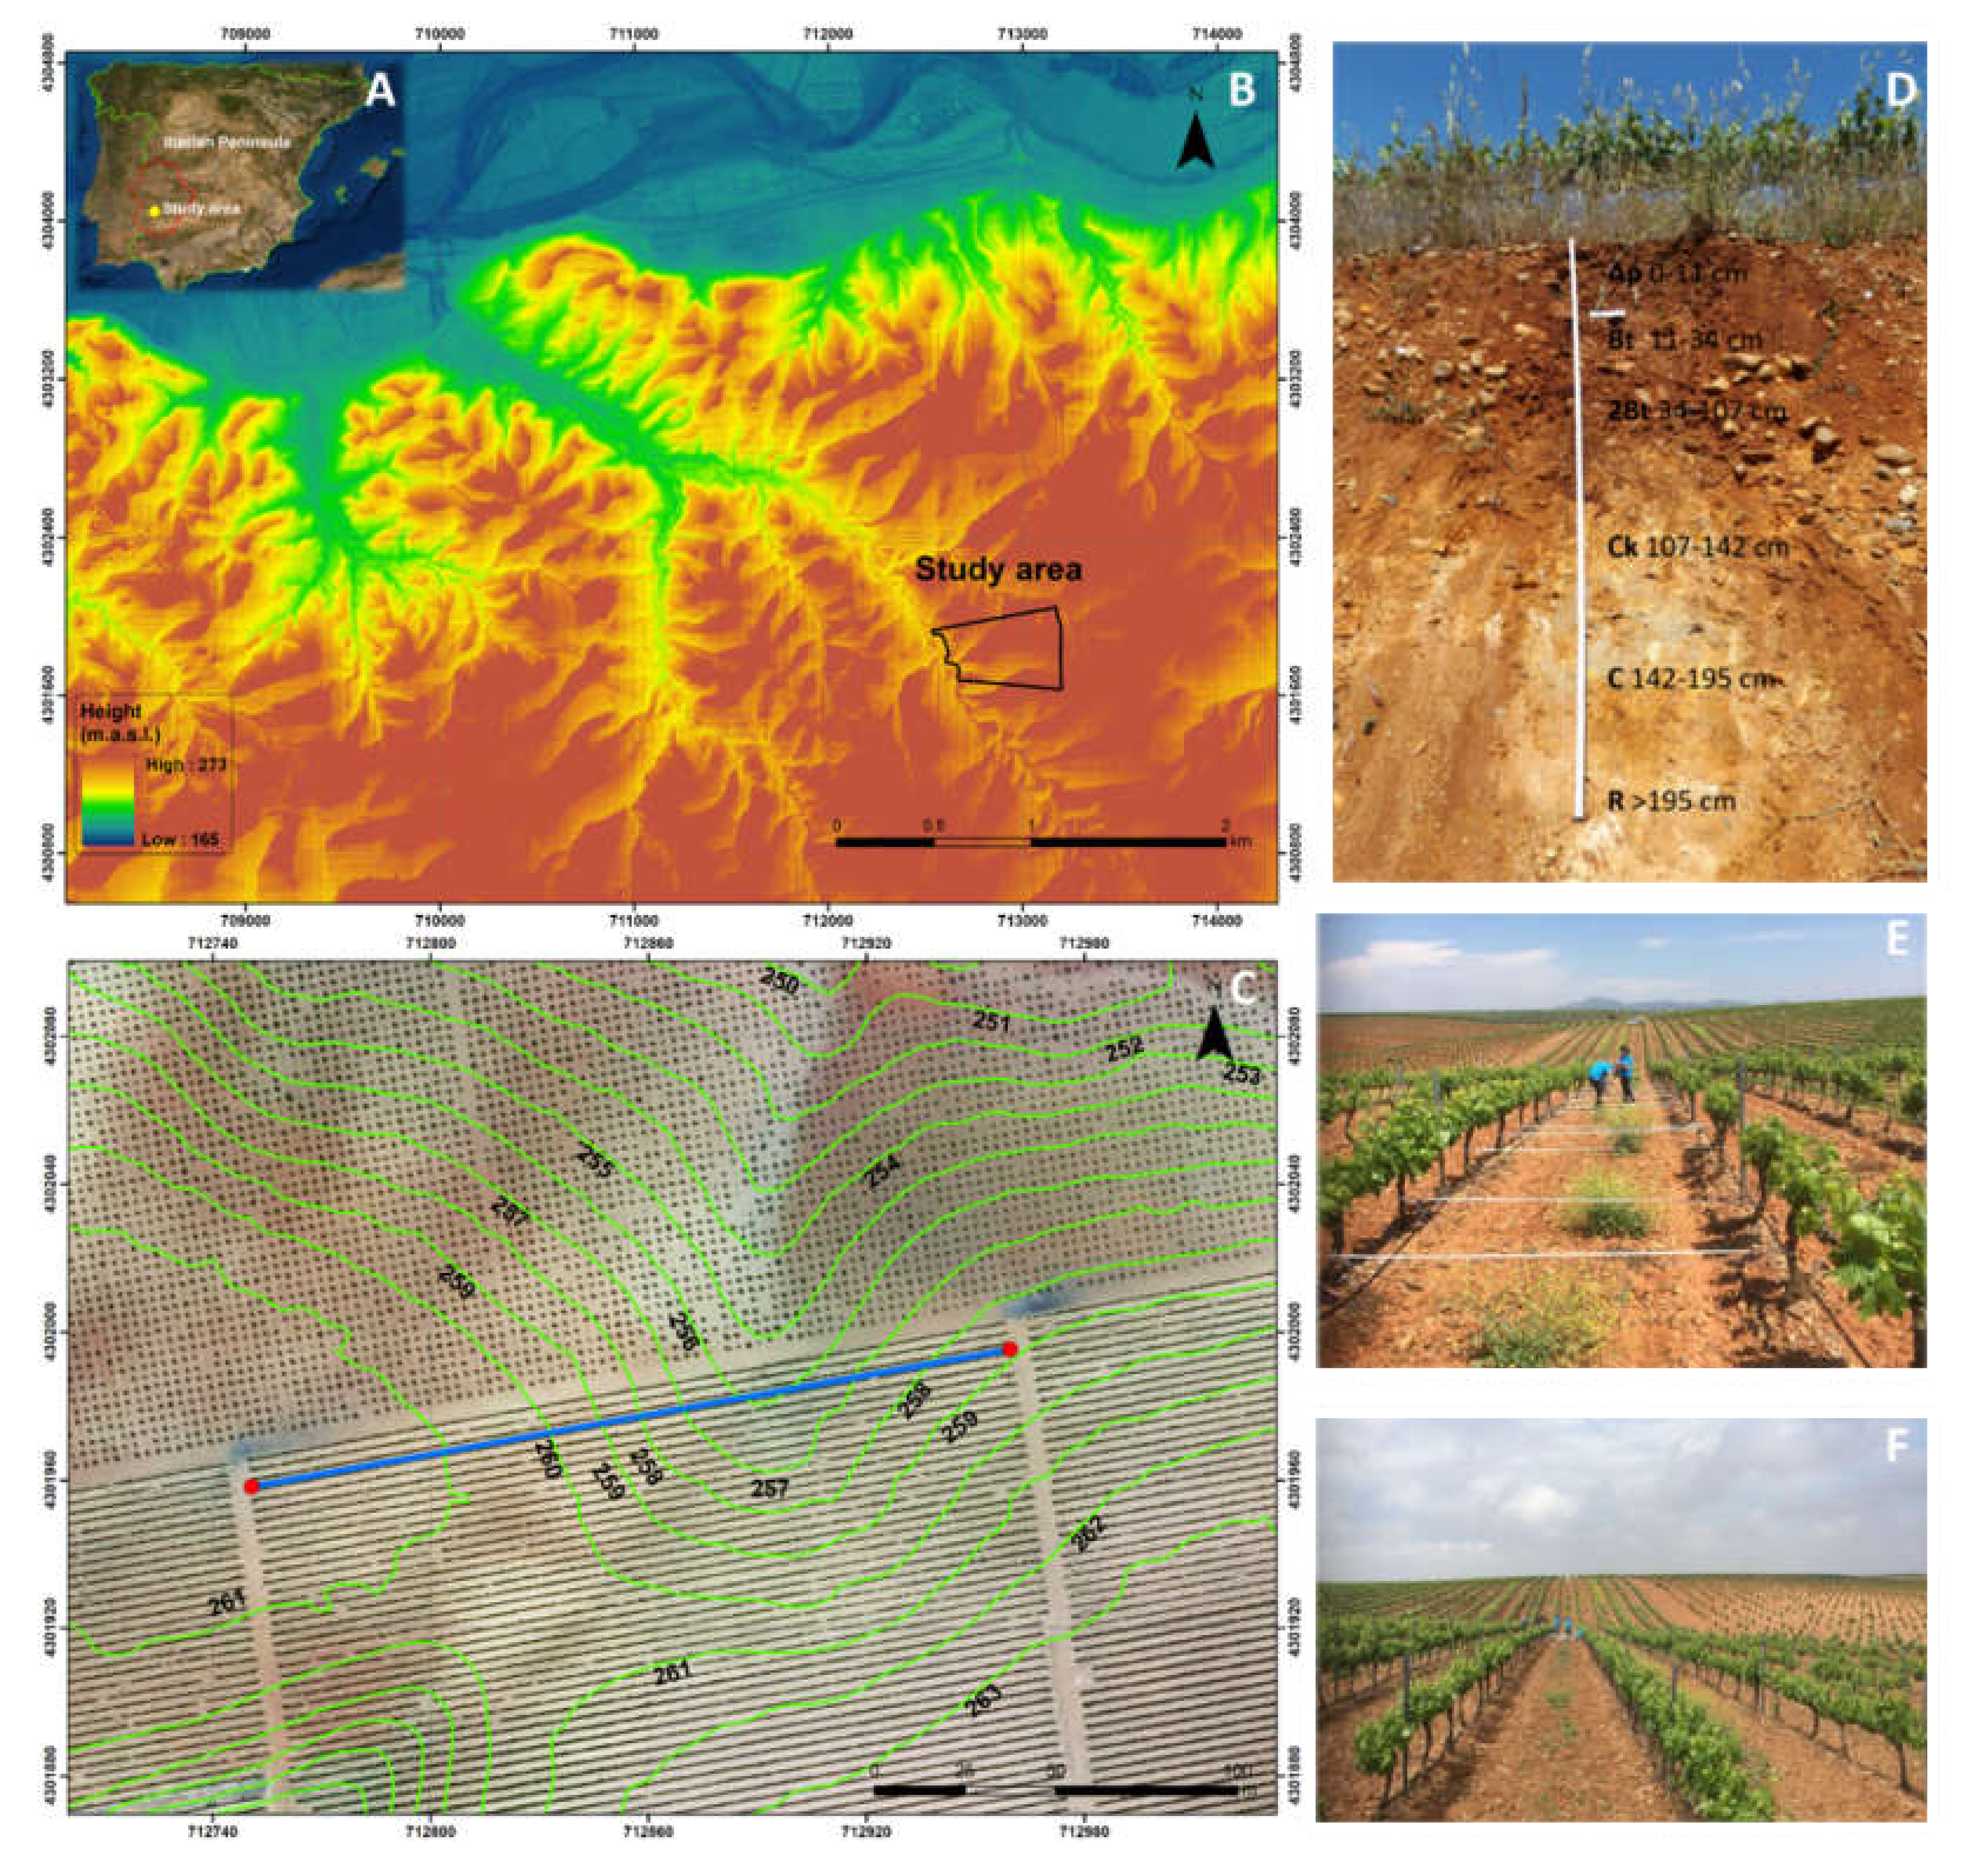
2.1. Study Area

A representative vineyard located at 38°50′26″ N / 06°32′49″ W in the so-called Tierra de Barros in the province of Badajoz (Extremadura, south-west Spain) was selected. The study area is situated on the farm called La Agraria, a few kilometres away from the municipality of Arroyo de San Serván (Figure 1A). The experimental area is a conventional vineyard with vines mounted on a trellis with a support irrigation system and a total extension of about 20 ha. The espalier system allowed grape production three years after exposing an American rootstock graft union, which was planted after the Phylloxera crisis. The studied vineyard seems to have a complex topography, and the investigated portion has a double slope direction, with a concave profile (Figure 1B,C). The parent materials are gravel and cobles with a fluvial origin. The soil texture varies among several horizons: (1) loamy (Ap), (2) loamy-clay (Bt and 2Bt, argic), and (3) loam-silty (Ck, calcic). The soil is classified as a Calcic-Luvisol [38] (Figure 1D). The observed soil profile has a useful soil depth of 142 cm. On the surface, there is moderate stoniness (5%–15%), being more abundant in the Ap horizon, where it can reach up to 50% with gravel from 2 to 6 cm. The average inclination on this farm is 7.1%. The climate is Mediterranean with an average annual temperature of 16.5 °C (Arroyo de San Serván meteorological station; REDAREX, 38°51′29″ N/06°28′22″ W). January (8.0 °C) is the coolest month and July (26.9 °C) is the warmest. November is the wettest month (55.9 mm) and July the driest (4.4 mm); the average annual total precipitation is about 425.2 mm.
The research site is located within a 20-year-old vineyard plantation with the Cayetana grape variety (local variety), which follows a planting frame of 2.8 m × 1.5 m (Figure 1E,F). Each row (210 m long) contains approximately 140 vines. The whole farm receives the same tillage treatment (three times a year) depending on the humidity conditions, trying to preserve the soil bare all year round with herbicides. To obtain a correct representation of the amount of soil mobilisation in the study area, a total of 2871 measurements were taken along the 99 opposite paired-vines (Figure 2).

2.2. The Improved Stock Unearthing Method (ISUM)

The ISUM is a low-cost and easy-to-apply method for estimating the current soil surface and the soil mobilisation rate considering the graft union of the vine as biomarkers at the time of planting and involves taking measures in the inter-row areas [36]. The graft of the vine indicates the initial surface level that relates to the soil at the time of planting. The grafts of the strains are only a few centimetres from the ground to avoid plant losses by freezing or by contact with herbicides (Figure 2A). Also worth noting is that the vertical growth of the graft is negligible since it is the new vine that undergoes the evolution. In our study site, after interviewing the farmers and owners that planted the field, it was confirmed that the graft unions were located 2 cm above the surface. Possible errors from 1 to 2 cm due to extreme rainfall events or modifications by the tractors after the plantation took place are assumed in this research but are relatively small. For instance, an error of up to 3.3 cm was calculated with a similar method by Biddoccu et al. [39]. The farmers explained that the error is very small because of the gentle slopes, flat terrain due to tillage before planting the vines, and previous estimations using GPS and total stations. Moreover, we also visited recent plantations close to the study area in the same viticultural region to confirm the 2 cm above the surface. For this reason, we are “estimating” and not “quantifying” soil mobilisation rates. Similar errors were also researched in vineyards using the ISUM in other Spanish vineyards, for example in the La Mancha or Valencia regions. The vines were planted from the nursery while housed within a plastic cylinder between 30 and 40 cm in length and 10 cm in diameter that prevented damage by rabbits and protected the plants from herbicides. This protection makes it easier to find the graft unions.
To perform the ISUM measurements, a meter tape was stretched between each opposite paired-vine and measurements were taken every 10 cm along with tape (Figure 2B). To avoid problems with buried graft unions, another meter tape was used to take the measurements along the inter-row area transect at 20 cm above the graft. Some concerns could still exist concerning this methodology because we did not provide any information on the correction of the slope of the tape used for measuring the soil surface height in the inter-row areas. However, it was confirmed by the farmers that the soil was flattened and that the paired vine rows are on the same slope inclination, so it was not necessary to apply a slope correction. In this work, 29 measurements were taken between each opposite paired-vine, resulting in a total of 2871 measurements along the 99 opposite paired vine rows (Figure 2C–F). In this way, greater accuracy can be obtained [40] than in measurements recorded in previous works [36] where parts of the surface between the rows were not measured.
We applied the erosion–deposition (ER) equation proposed by Paroissien et al. [41] to estimate the total soil mobilisation rate (Equation (1)):
E R = VolxBD StxAv         Equation
where the volume (Vol, m3), the total area of the measured field (St; ha), the years of the vines (Av, 20 years), and the apparent bulk density (BD; gr cm−3) were used as input elements. The soil bulk density is 1.39 g cm−3, which represents the average of measurements collected in a 100 cm3 cylinder at 12 different points along the row and the inter-row area. The method allows for an estimation of soil mobilisation in the two areas of “rows” and “inter-rows” with a considered width of 150 cm and 10 cm, respectively.

2.3. The Revised Universal Soil Loss Equation (RUSLE) Model

A wide range of parametric models that allow estimation of soil loss can be incorporated into a geographic information system (GIS). The most widely used method is the Revised Universal Soil Loss Equation [35] which was derived from the Universal Soil Loss Equation (USLE) previously proposed by Wischmeier and Smith [37]. The RUSLE model is composed of five factors expressed as (Equation (2)):
A = R * K * LS * C * P
where A is the average rate of soil loss (Mg ha−1 y−1), R is the rainfall erosivity factor (MJ mm ha−1 h−1 yr−1), K is the factor of soil susceptibility to erosion, LS is the factor of length (m) and magnitude of the slope (%), C is the cover and management factor, and P is the factor of soil conservation practices.
To create the RUSLE map, we used the RUSLE tool implemented in ArcGIS 10.5 (ESRI, Colorado, USA). It is necessary to add a Digital Elevation Model (DEM) (http://centrodedescargas.cnig.es/CentroDescargas/index.jsp) and the values of each of the above-mentioned factors. In Spain, a DEM with a resolution greater than 5 meters is not available. Therefore, the available 5-m DEM was converted into points and then the 3-m DEM (3 m × 3 m pixels) was derived using the Topo to Raster technique implemented in the ANUDEM software (ANU Fenner School of Environment and Society and Geoscience, Australia) developed by Michael Hutchinson.
The R factor has been obtained based on the adapted universal equation of soil loss defined by ICONA [42] as:
R = e−0.834 × PMEX1.314 × MR−0.388 × F240.563
where e represents the basis of the Napierian algorithms, PMEX is the average value of the annual series of maximum monthly rainfall (mm) using the meteorological station of Extremadura Irrigation Advisory Network (REDAREX, 38º51‱29″ N/06º28′22″ W), MR is the average precipitation of the October–May period (mm), and F24 is the ratio between the annual maximum 24-h rainfall squared and the sum of the maximum 24-h rainfall of all months of the same year.
The K factor has been calculated using the equation proposed by Wischmeier and Smith [30] as:
K = [2.1 ∗ 10 −4∗ (12−OM) ∗ M1.14 + 3.25 ∗ (s−2) + 2.5 ∗ (p−3)]
where OM represents the percentage of the organic matter determined through the method proposed by Walkley and Black [43]. M is the product of the percentage fractions of sand, clay, and silt. The granulometric analysis of the samples was done with the laser diffraction particle analyser (Beckman Coulter LS 13 320), using the liquid aqueous module with an optical model of Fraunhofer.rf780d. s and p are, respectively, the soil structure and permeability classes. We used the nomogram established by Wischmeier and Smith [37] to determine the s and p parameters.
We used a RUSLE tool implemented in ArcGIS, which requires only one single DEM as input, and automatically calculates the LS factor based on the USPED (Unit Stream Power-based Erosion Deposition) equation:
LS = (m + 1) (U/22.1) ^m (sin β/0.09) ^n)
where U is the upslope area per unit width (a measurement of water flow) in meters (m2/m), β is the slope angle in degree, 22.1 is the length of the standard USLE plot in meters, and 0.09 = 9% = 5.15° is the slope of the standard USLE plot. The range of values of the exponents is for m = 0.2−0.6 and n = 1.0−1.3, where the lower values are used for prevailing sheet flow and higher values for prevailing rill flow.
The value of the C factor suggested by ARPAV (Agenzia Regionale per la Prevenzione e Protezione Ambientale del Veneto) for vineyard crops was used in this study. In the case of the P factor, the value proposed by Panagos et al. [6] for Spain was adopted. Table 1 shows the RUSLE parameter values used.

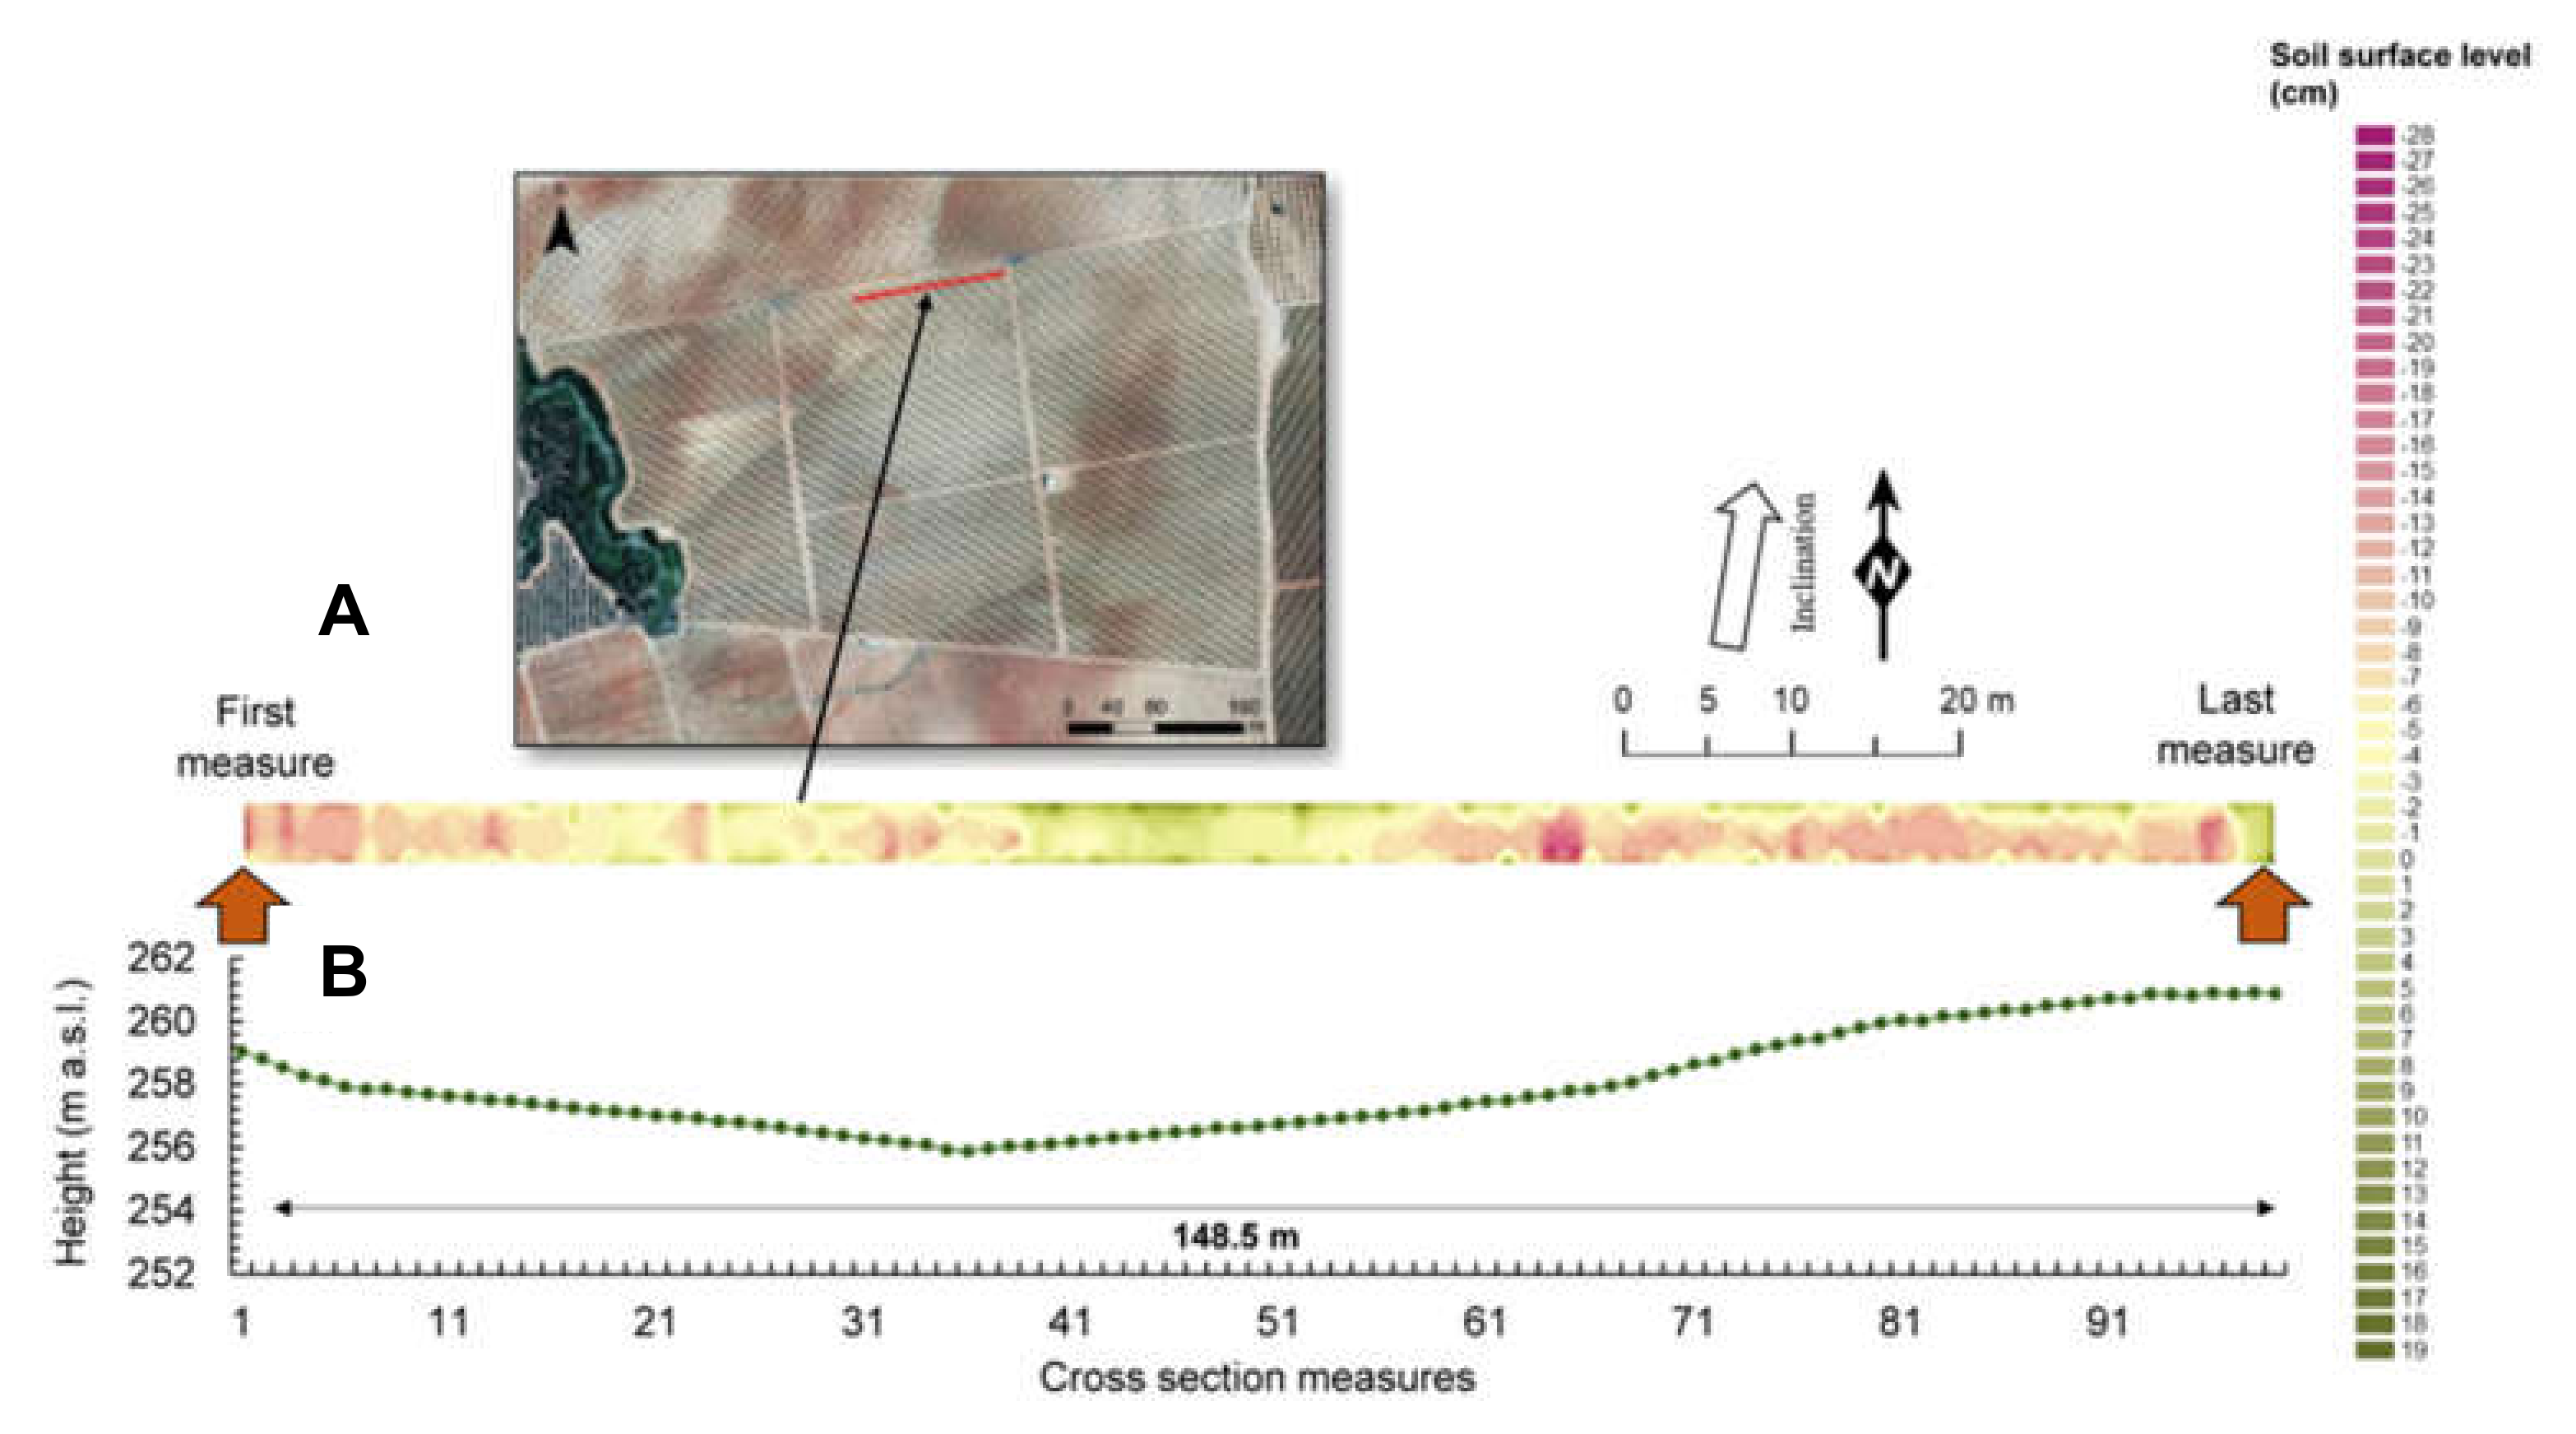
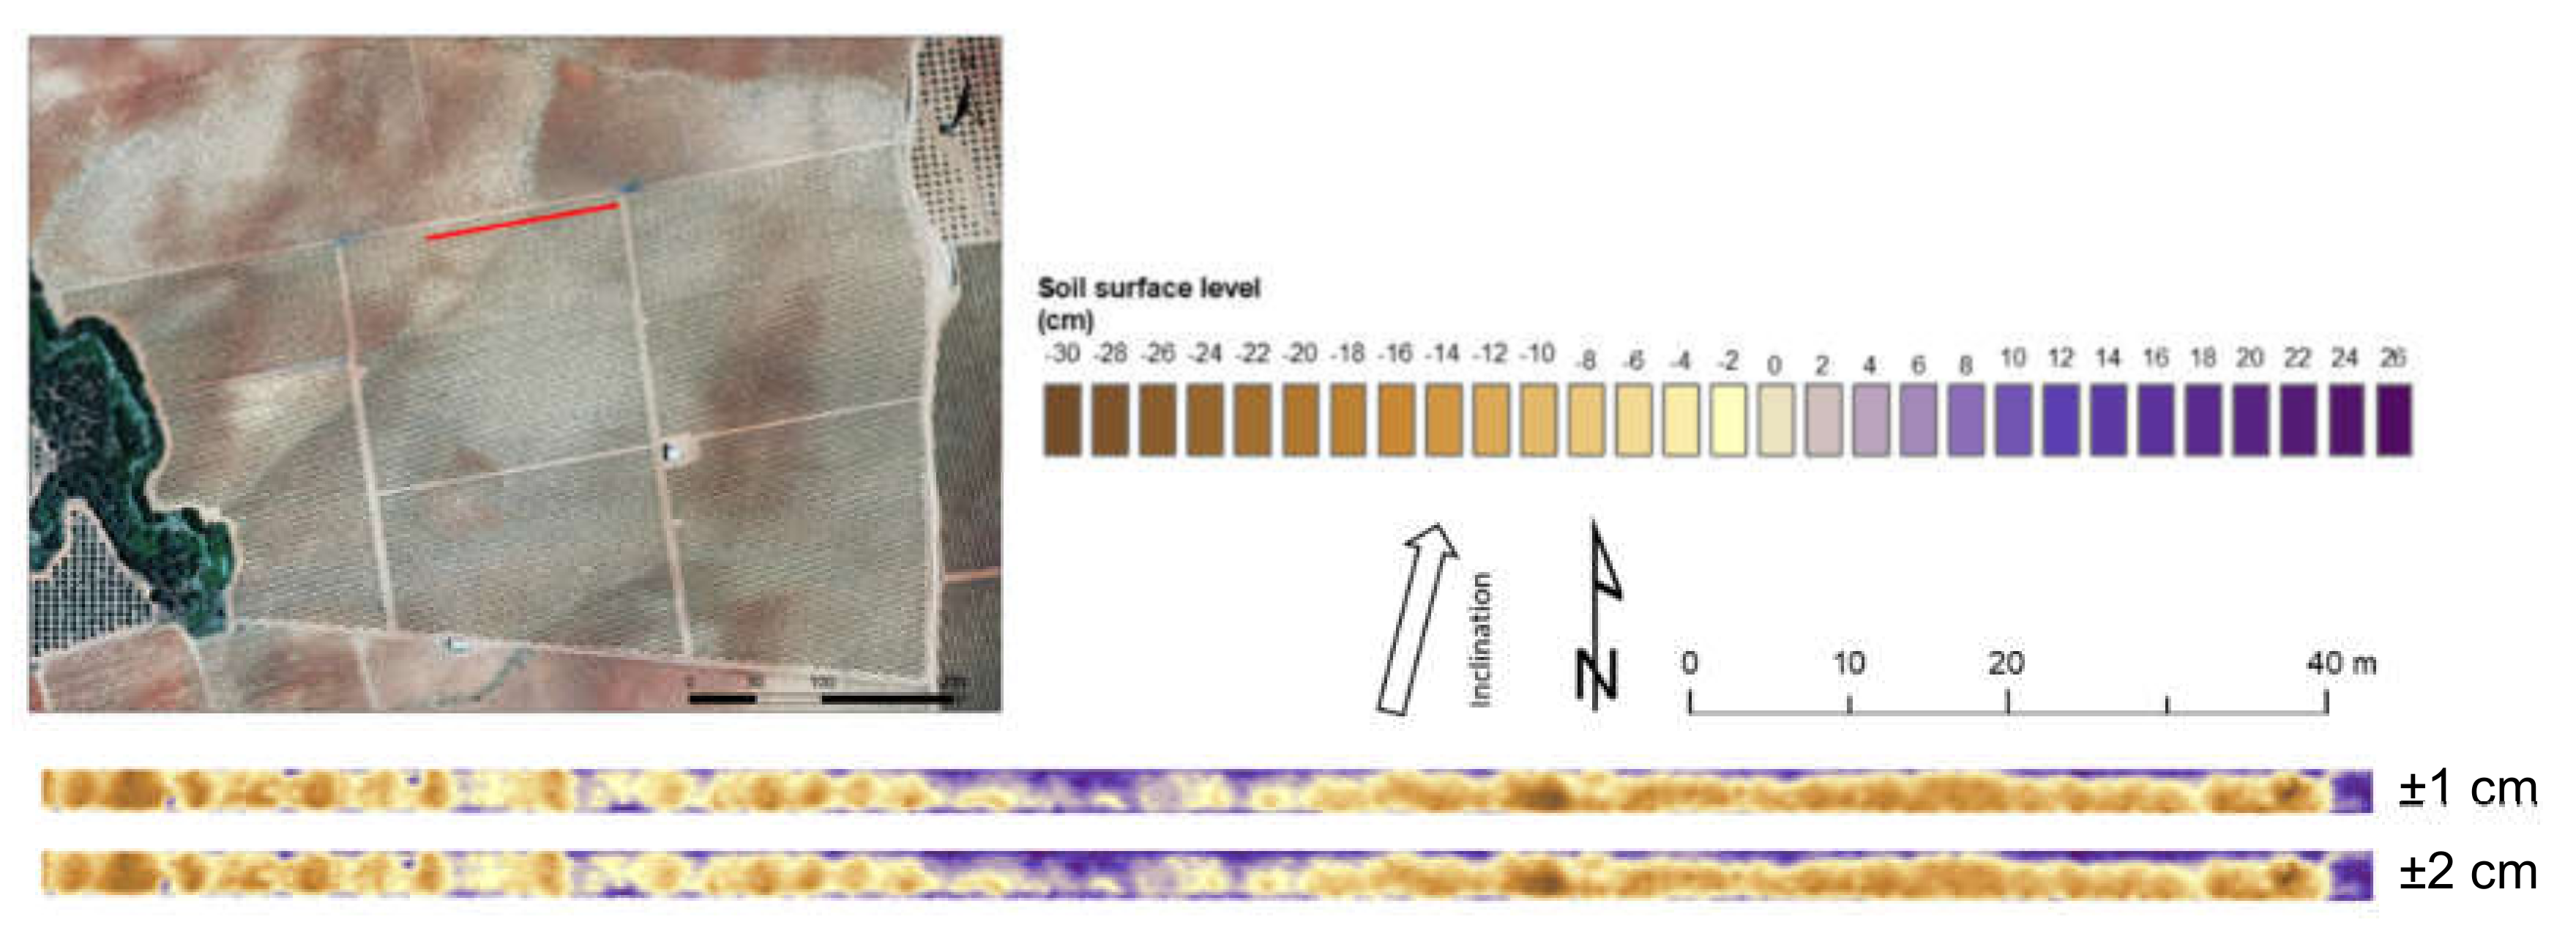
2.4. Mapping the Current Soil Surface Level for ISUM

The same person took the measurements between the initial distance of the graft unions and the current soil surface in May 2018 to avoid any bias (Figure 2G,H). The data obtained from the measurements were incorporated into ArcMap version 10.5 software (ESRI, Colorado, USA) for its representation. First, a grid point was created with the “fishnet” tool using a shapefile format. Subsequently, the Digital Elevation Model (DEM) was generated through interpolation methods using the Geostatistical Wizard extension incorporated in ArcGIS. Ordinary Kriging (OK) emerged as the best interpolation method in terms of the lowest Root Mean Square Error (RMSE) and the highest coefficient of determination (R2), after applying geostatistical tools to obtain the most accurate scale for the map. Table 2 compares the performance statistics of the mean, RMSE and R2. A final map was generated with a resolution of 0.03 m pixel size that allows an accurate visualisation. Since the possible error can range from 1 to 2 cm, two maps were also included with ±1−2 cm to show this second possible error detected after performing the OK. These calculations also included the total soil mobilisation rates. The main goal was to obtain the potential flow paths and soil mobilisation patterns along the studied area after extreme rainfall events (Figure 2I,J).

3. Results

3.1. Current Soil Surface using ISUM

The average, median, and the 5th and 95th percentile values obtained between each opposite paired-vine (n = 99) are depicted in Figure 3. The average soil surface is −6.24 cm, which represents a soil mobilisation of 3.12 mm yr−1. The maximum soil depletion reaches up to −28 cm. On the other hand, the maximum soil accumulation is +19 cm. Considering the soil surface level between each paired-vine, the highest soil depletion is observed from the intervals of 60 cm to 250 cm with an average value of −7.98 cm and a maximum value of −28 cm. In the intervals 0–50 and 260–290, the average values are close to 2.40 cm, reaching values up to −22 cm. As expected under the influence of tractor wheels and tillage, the highest soil depletion values are found in the inter-row areas and the highest accumulations occur close to the vines.
Paying attention to different intervals, the highest accumulations and the lowest soil depletions happen within the intervals 0–50 and 260–290 cm. The average accumulation values reach +14.76 cm, with maximum values higher than +19 cm. Meanwhile, the maximum average values reaching +8.3 cm are recorded from the intervals of 60 to 250 cm. The highest absolute maximum value was higher than +18.6 cm and located between the intervals 210 and 250 cm.
A map of the current soil surface level of the study area generated using the Ordinary Kriging procedure is presented in Figure 4A. Figure 4B depicts the longitudinal profile curve of the topographical changes. It is observed in Figure 4A that soil accumulation occurs in the lower areas. The highest values of soil depletion are observed in the upper reaches and the form of linear features following the slope direction. Under the vines, the soil surface level accounts for an average accumulation value of +2.37 cm. However, soil accumulations between 20 cm and 25 cm are observed in the middle and the foot reaches the plot. The maps considering the possible error of 1 and 2 cm are also included in Figure 5. In these maps, we can observe that the mean average values of soil depletion increased, showing even higher soil mobilisation processes along with the studied plot.

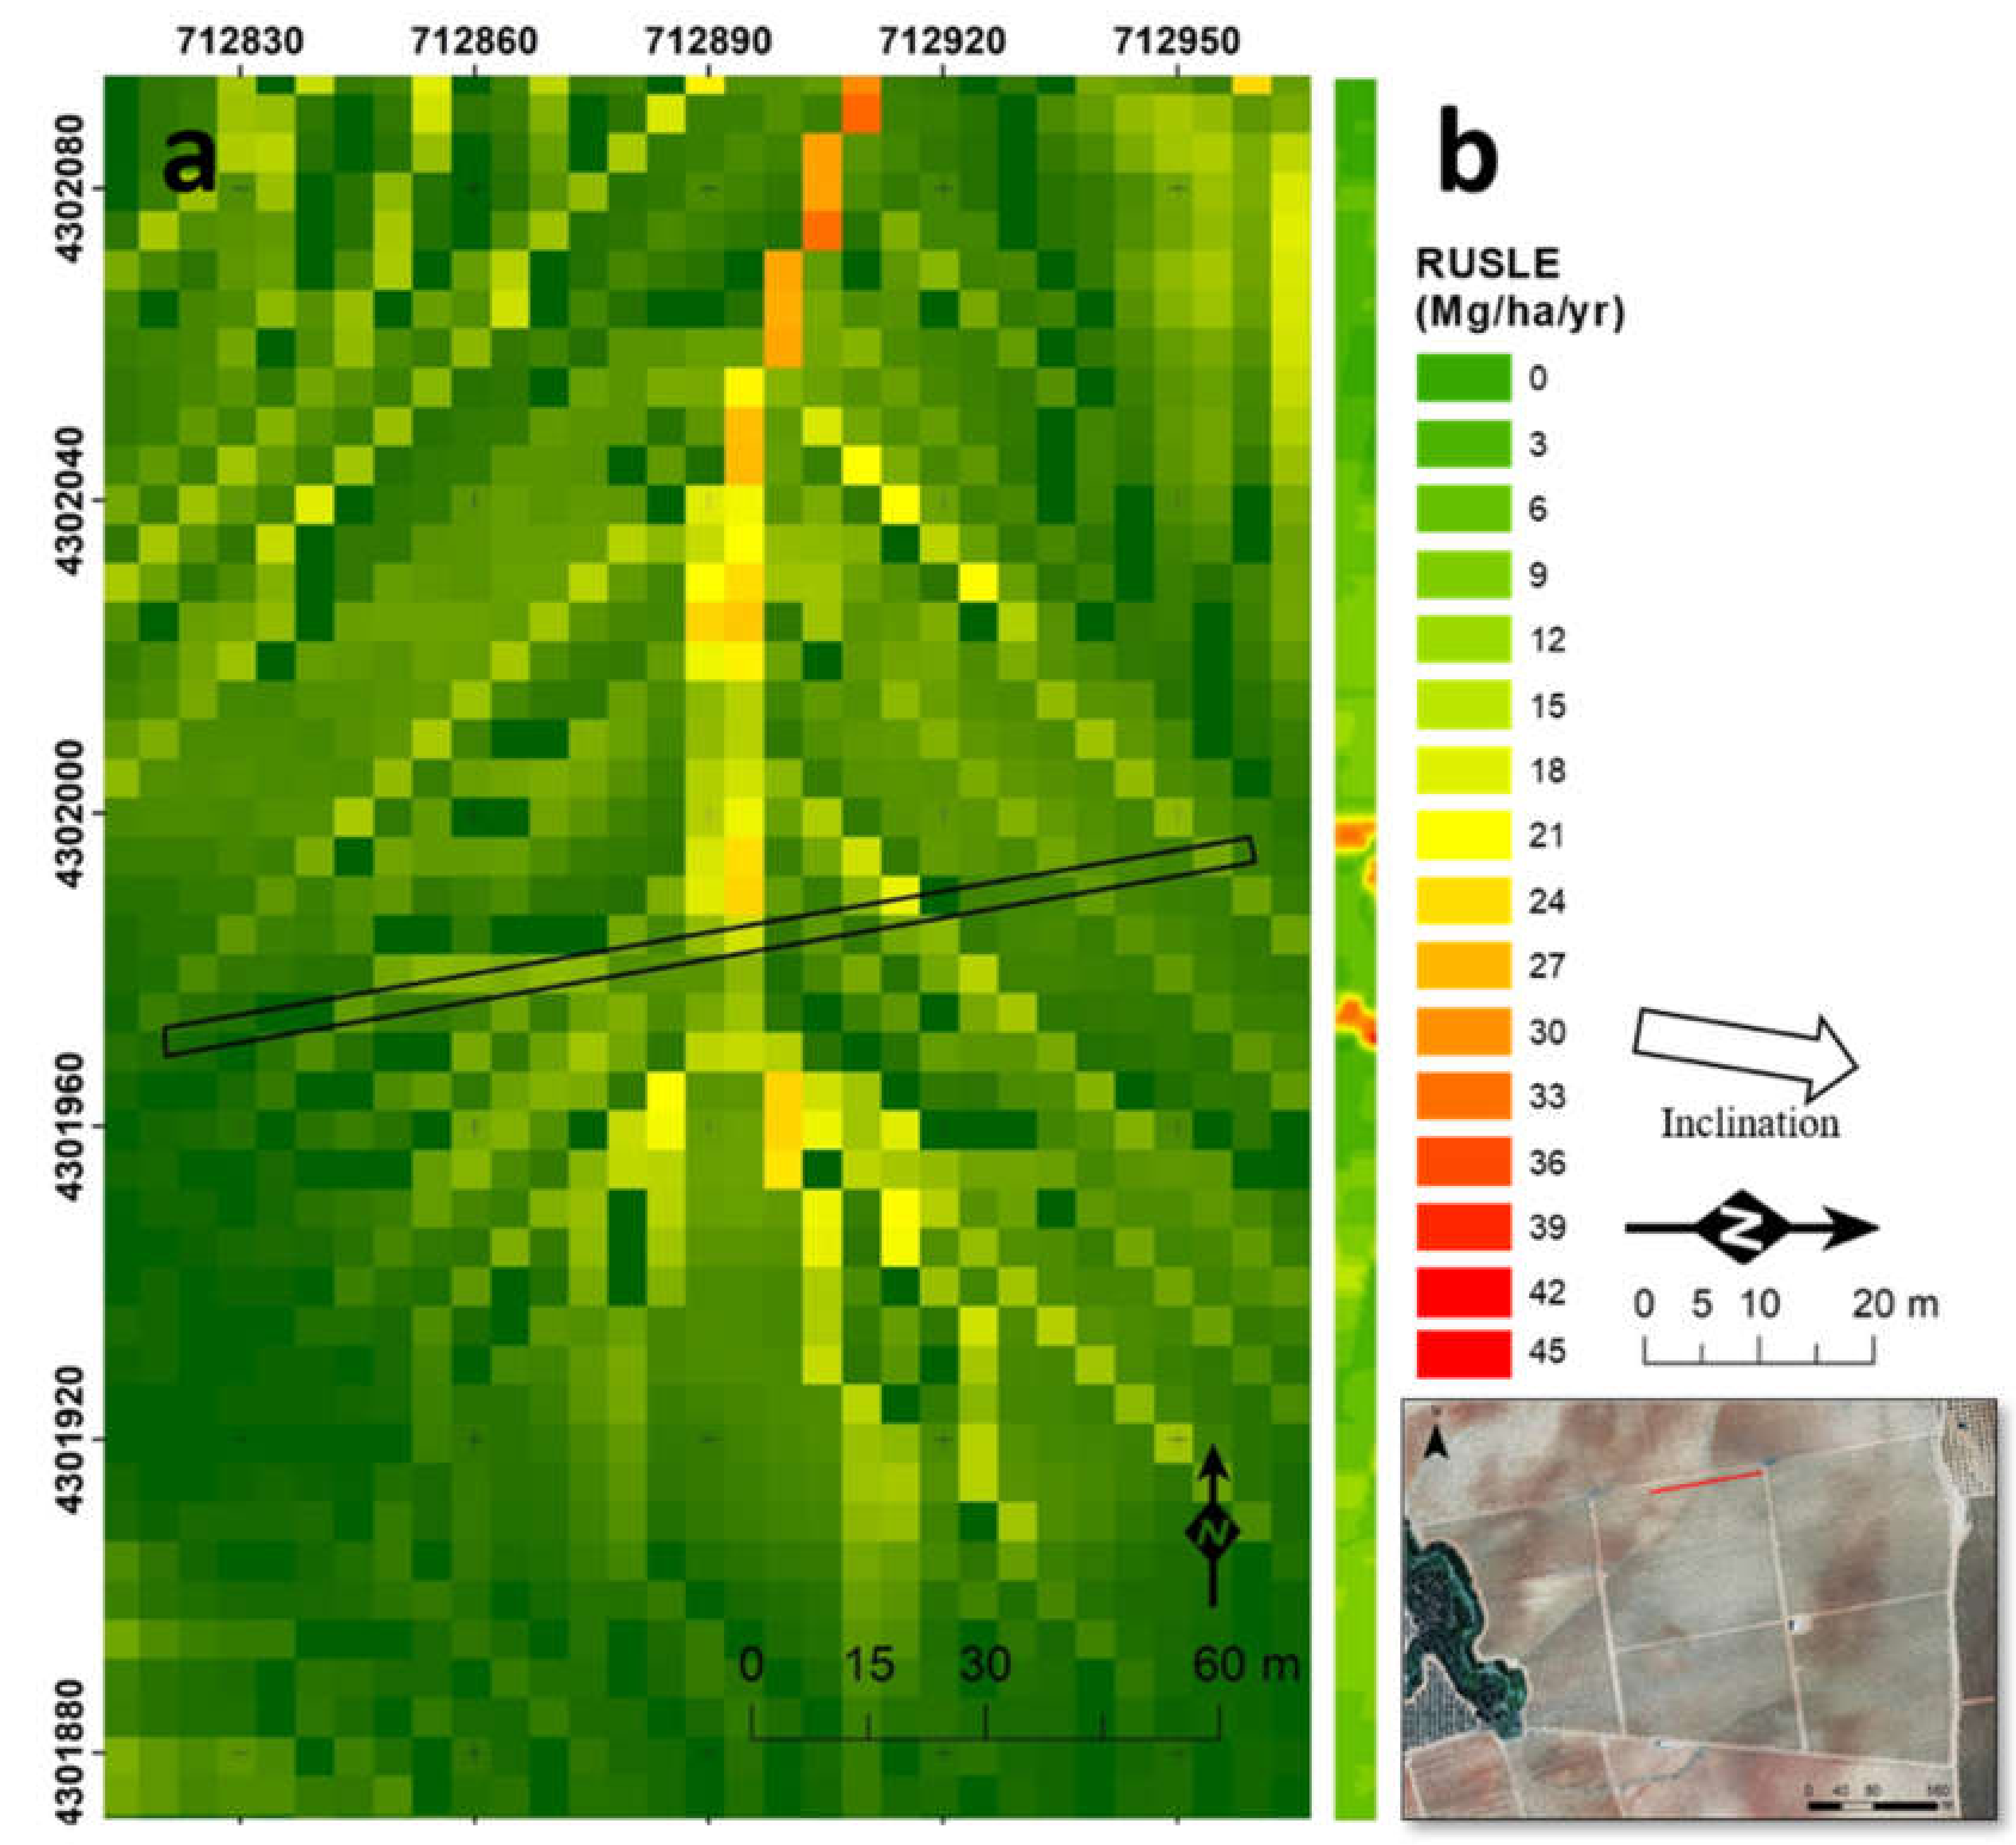
3.2. Soil Erosion Estimates using RUSLE

Figure 6 and Table 3 present the erosion map generated using the RUSLE tool implemented in ArcGIS and the total area per mobilised soil rates, respectively. The results show values of soil losses ranging from 0 to 45.8 Mg ha−1 yr−1 in the studied row and inter-row areas, and close to them. The mean values were 17.4 Mg ha−1 yr−1. These values are not homogeneous in the study area as we observed that there are differences among hillslope positions. In some areas, coinciding with the ISUM map, we observed similar hotspots with the highest soil mobilisation reaching up to 45 Mg ha−1 yr−1. If we regard the study area in a more general context, we can observe that the paired-rows and inter-row areas are crossed by a linear feature similar to a gully or ephemeral river channel. This situation could explain the general soil mobilisation along with the plot, which is noted against the tractor pass direction. The spatial erosional pattern that was identified by RUSLE is comparable with the results obtained by the ISUM: high erosion in the location corresponding to the gully/ephemeral gully channel along the middle of the studied area.

3.3. Soil Erosion and Mobilisation Rates

Table 4 shows the soil mobilisation estimates using the ISUM and RUSLE methods. The differences between the ISUM and RUSLE models are considerable, obtaining soil mobilisation rates of 45.7 Mg ha−1 yr−1 and 17.4 Mg ha−1 yr−1, respectively. Moreover, through the use of ISUM, the values in various units of erosion for total soil loss and differences between the row (0–50 cm) and inter-row (50–240 cm) areas are also summarised in the table. In the inter-row areas, a soil mobilisation of 45.1 m3 is found, which corresponds to 62.7 Mg ha−1 for 20 years. Conversely, under the vines, soil mobilisation reaches 5.9 m3, which corresponds to a total of 8.2 Mg ha−1 during the same period.

4. Discussion

This study is based on a single vine row with no spatial replication, thereby making it necessary to remark that this is a preliminary study for an initial comparison of ISUM and RUSLE. We cannot pretend to establish strong robustness in terms of representativeness of the whole vineyard. The main aim is to show whether both methods can or cannot be used to model soil mobilisation rates and make the first measurements in this viticultural area. It is necessary to increase the number of measuring points in the rows and inter-rows in the future to check the robustness in terms of representativeness.
Our research applied the traditional and well-established RUSLE methodology for estimation of soil losses. The ISUM was also used as a more recent approach based on direct measurements in the field. The ISUM and RUSLE show considerably different soil erosion rates of 45.69 Mg ha−1 y−1 and 17.4 Mg ha−1 y−1, respectively, for the study area of Arroyo de San Serván in the Tierra de Barros, Extremadura. In the literature, soil erosion estimates using the RUSLE are generally significantly different, sometimes more than one order of magnitude from those of other models. A clear example is a study carried out by Busacca et al. [44] who found an average erosion rate of 31.4 Mg ha−1 yr−1 using the RUSLE while the Cs137 technique gave an estimated reduction of 11.6 Mg ha−1 y−1. Also, the RUSLE gave erosion rates higher than other laboratory techniques or in situ experiments with rainfall simulation or USLE plots. It was observed that the RUSLE performed poorly in estimating the long-term erosion rates in the Tierra de Barros. Our data showed a soil lowering during the last 20 years, and this fits better with the observed soil depletion during the fieldwork and recent soil mobilisation that occurred during extreme rainfall events that happened during the last year of this study (Figure 2I,J). Other studies apply rainfall simulation on experimental plots, which do not show the whole picture of the spatial and temporal variability of soil erosion [45].
In Spain, the use of the RUSLE and direct measurements have shown contrasting responses. López Bermúdez [46] found that the USLE, as applied in the Segura river in Southeastern Spain, registered 105.5 Mg ha−1 yr−1, while the reservoir bathymetries obtained a value of 7.5 Mg ha−1 yr−1, on average, subsequently reaching an overestimation of 14 times. Soto et al. [47] applied the USLE to all the watersheds in Spain and estimated a soil loss of 23.44 Mg ha−1 yr−1, whereas the reservoir bathymetries yielded 14 times lower soil loss.
The overestimation of the USLE method is more apparent when comparing the whole dataset developed by the researchers. López Bermúdez [46] found that the USLE measured values from 7 to 302 Mg ha−1 yr−1 at the Spanish basins, while bathymetry measured values from 2 to 4 Mg ha−1 yr−1, and the soil erosion plots indicated values between 0.08 and 3.1 Mg ha−1 yr−1. Thus, the USLE overestimated soil erosion rates in both cases. Bagarello et al. [48] attributed these discrepancies to scale issues. Among other authors, Jardí et al. [49] estimated soil erosion rates in road embankments of 122–864 Mg ha−1 yr−1 with USLE, while plot measurements yielded a rate of 0.9 Mg ha−1 yr−1. This can be attributed to the fact that USLE shows an average rate for a long period but the plots only show the period of measurement, and this can cause the soil erosion rates to differ by two orders of magnitude over a decade.
Another example of overestimation of soil losses by USLE is given by Avellanas et al. [50] for measurements in pine and oak forest (burnt and control) in Zaragoza, Spain. Using the USLE they estimated soil losses of 0, 1.61, 11.52, and 64.8 Mg ha−1 yr−1 while, with Gerlach sediment collectors, they estimated values of 0.21, 0.28, 1.88, and 11.8 Mg ha−1 yr−1, respectively.
On the other hand, there are a few examples that have reported underestimation of the soil erosion rates by USLE. Porta et al. [51] measured between 357 and 1521 Mg ha−1 yr−1 on mine spoils by means of erosion pins, 136–389 Mg ha−1 yr−1 using topographic measurements, and 159 Mg ha−1 yr−1 with the USLE. Ferre Bueno and Senciales González [52] measured soil loss of 1117 Mg ha−1 yr−1 in Montes de Málaga in November 1989 after a high intensity–low-frequency rainfall event, while the USLE gave an estimate of 36–353 Mg ha−1 yr−1.
We found that the USLE and ISUM estimated different soil erosion rates at the “Tierra de Barros” study site. Previous research in the Basque Country estimated soil loss of 16–70 Mg ha−1 yr−1 with the USLE and 18 to 90 Mg ha−1 yr−1 by erosion pins. However, once the forest was cut, the soil erosion rates increased to 36–116 Mg ha−1 yr−1 with USLE and 55–105 with erosion pins [53], which can lead to an overestimate of soil erosion rates. Due to its ease of use and low cost, the ISUM has been applied for many different goals such as to assess differences among parent materials, vineyards with different ages or slope positions. This method allows for determining in great detail the micro-topographical variations of the vine plantations, which can be helpful to design correct soil management systems and where to apply them.
It is confirmed that the key factor for obtaining the best resolution in the generation of the final model depends on the number of measurements [40]. Therefore, in this study, measurements were carried out every 10 cm by the same person. Moreover, we have to keep in mind some limitations and potential sources of errors during the field campaign, including considering the distance of the graft to the surface, since at the time of planting not all strains were at the same distance and in the same direction. On the other hand, the RUSLE model has been used for decades in numerous studies, consolidating itself as one of the most widely used methods in estimating soil losses. The difference concerning the use of ISUM lies mainly in the scale of measurement and the parameters that are required for the generation of the models.
The RUSLE model is a quick and easy application method in many agricultural areas, but the obtention of some factors such as rainfall erosivity or erodibility can be complicated without a long-term database. The results obtained with the RUSLE model in this study do not show great differences regarding other research works developed in vineyards in the Mediterranean basin or elsewhere. Soil erosion rates are determined by a multitude of factors, and range from 6.4 Mg ha−1 yr−1 to more than 22 Mg ha−1 yr−1 in sloping vineyards, decreasing in time from 19.46 Mg ha−1 yr−1 to 11.28 Mg ha−1 yr−1 in old vineyards or between 53.9 and 69.5 Mg ha−1 yr−1 depending on the mechanisation practices [54,55]. As already mentioned, the resolution (and also the scope) of the two methods are very different, especially as applied in this work. Thus, we include both maps and estimations to compare the average values (if considered representative of the whole selected vineyard) with the average RUSLE value, as a validation of the RUSLE. The RUSLE is very sensitive to some factors (e.g. LS or C factors), so using general factors to estimate soil erosion on a small plot could lead to very misleading results. In this research, we intend to show the readers the obtained results and how we can improve this research in the future.
The soil erosion rates recorded with the ISUM in this study differ from those found in the literature. The most important difference between the volumes of soil loss could be related to the number of measurements between the opposite pair-vines, since the years of the vines in many cases are similar. In vineyards of 25 years of age, and taking five measurements, the erosion rates were estimated as 2.5 Mg ha−1 yr−1 [36]. In another work, the rates of erosion appear conditioned by the source of material which reached an erosion rate of −87.7 Mg ha−1 yr−1 in lands dominated by loams in an 8-year old vineyard [54]. However, the differences are reduced if we compare our results with those of Rodrigo-Comino et al. [40], in which different numbers of measurements were compared, and the erosion rates for 18 points were −40.1 Mg ha−1 yr−1. The high soil erosion rates observed in this study requires that policymakers, farmers, and companies involved in wine production develop erosion control strategies to achieve environmental sustainability. Increasing the use of vegetation covers and mulches such as straw or cover crops, and reducing the use of herbicides, should be urgently considered.
It is pending to apply the ISUM and RUSLE for vineyards plantations with organic management systems to confirm that the use of soil erosion control measures is effective to achieve land degradation neutrality [56]. Previous research carried out with other methodologies demonstrates that organic farming results in lower erosion rates (due to soil quality improvement) as compared to chemical farming, mainly due to biota activation, and the reduction in the connectivity of the flows [57,58].

5. Conclusions

The ISUM and RUSLE were applied to assess soil erosion rates in one of the most important European viticultural regions: Tierra de Barros, Extremadura (south-west Spain). We concluded that this vineyard in the Tierra de Barros shows non-sustainable soil erosion rates under its conventional soil management system characterised by the use of machinery to till the soil and the application of herbicides to keep the soil bare. The ISUM and RUSLE estimated soil mobilisation rates of 45.7 Mg ha−1 yr−1 and 17.4 Mg ha−1 yr−1, respectively. Generally, RUSLE erosion estimates are more than one order of magnitude higher or lower in comparison with other soil erosion measurement methods. In our case, the ISUM and RUSLE did not obtain similar rates but indicated similar patterns, although the RUSLE is a very sensitive model to some topographical and cover factors, which greatly affect a direct comparison. Both mapping techniques showed that the soil surface reached on average −6.2 cm of depletion in 20 years, with maximum values of −28 cm. The highest values of soil depletion can mainly be observed in the upper part of the plot and the form of linear features following the slope direction. On the other hand, the soil surface level under the vines gives average values of +2.37 cm, showing accumulation due to tillage practices. The ISUM is a low-cost and easy-to-apply method that complements the results obtained for larger scales by the RUSLE. ISUM can produce maps of soil redistribution and can quickly and accurately survey soil erosion rates in vineyards. Both the ISUM and RUSLE show that the soil erosion rates in the vineyards of Tierra de Barros are not sustainable if these results are similar in other conventional farmlands.

Author Contributions

This article was written by J.B.-G. and J.R.-C. and reviewed and edited by Y.G.-A., under the supervision of A.C. The methodology was proposed by J.R.-C. and A.C. and the formal analysis was done by M.P.F., J.B.-G., J.R.-C., A.C., and Y.G.-A. The fieldwork was carried out by J.B.-G., J.R.-C., M.P.F. and A.C. All the expenses were covered by a research project led by M.P.F. All authors have read and agreed to the published version of the manuscript.

Funding

The study was financed by Junta de Extremadura and FEDER (Project IB16052). The landscapes of Extremadura inspired this research.

Acknowledgments

We wish to give our thanks for the hospitality during the field campaign in the municipality of Arroyo de San Serván, especially to Isabel and Eduardo. We would like to highlight the enthusiasm of the Geograns students, Angie and Amparo, during the sampling campaign. Thanks also go to the cooperative farm “La Agraria” and their farmer (Juan Eugenio y Santiago) for facilitating all the information about the plot during the interviews. We also have to give thanks for the great meals and hospitality during the nights in the Café-Bar “La Pantoja” while the authors were enjoying the Eurovision contest (2018) and the music by Alfred and Amaia.

Conflicts of Interest

The authors declare no competing financial interests.

References

  1. García-Ruiz, J.M.; Beguería, S.; Nadal-Romero, E.; González-Hidalgo, J.C.; Lana-Renault, N.; Sanjuán, Y. A meta-analysis of soil erosion rates across the world. Geomorphology 2015, 239, 160–173. [Google Scholar] [CrossRef] [Green Version]
  2. Keesstra, S.; Mol, G.; De Leeuw, J.; Okx, J.; Molenaar, C.; De Cleen, M.; Visser, S. Soil-Related Sustainable Development Goals: Four Concepts to Make Land Degradation Neutrality and Restoration Work. Land 2018, 7, 133. [Google Scholar] [CrossRef] [Green Version]
  3. Pacheco, F.A.L.; Varandas, S.G.P.; Fernandes, L.S.; Junior, R.V. Soil losses in rural watersheds with environmental land use conflicts. Sci. Total Environ. 2014, 485, 110–120. [Google Scholar] [CrossRef] [PubMed]
  4. Griggs, D.; Smith, M.S.; Rockström, J.; Öhman, M.C.; Gaffney, O.; Glaser, G.; Kanie, N.; Noble, I.; Steffen, W.; Shyamsundar, P. An integrated framework for sustainable development goals. Ecol. Soc. 2014, 19, 49. [Google Scholar] [CrossRef]
  5. García-Ruiz, J.M.; Beguería, S.; Lana-Renault, N.; Nadal-Romero, E.; Cerdà, A. Ongoing and Emerging Questions in Water Erosion Studies. Land Degrad. Dev. 2017, 28, 5–21. [Google Scholar] [CrossRef]
  6. Panagos, P.; Borrelli, P.; Meusburger, K.; Alewell, C.; Lugato, E.; Montanarella, L. Estimating the soil erosion cover-management factor at the European scale. Land Use Policy 2015, 48, 38–50. [Google Scholar] [CrossRef]
  7. Boellstorff, D.; Benito, G. Impacts of set-aside policy on the risk of soil erosion in central Spain. Agric. Ecosyst. Environ. 2005, 107, 231–243. [Google Scholar] [CrossRef]
  8. Li, X.H.; Yang, J.; Zhao, C.Y.; Wang, B. Runoff and sediment from orchard terraces in southeastern China. Land Degrad. Dev. 2014, 25, 184–192. [Google Scholar] [CrossRef]
  9. Taguas, E.V.; Arroyo, C.; Lora, A.; Guzmán, G.; Vanderlinden, K.; Gómez, J.A. Exploring the linkage between spontaneous grass cover biodiversity and soil degradation in two olive orchard microcatchments with contrasting environmental and management conditions. Soil 2015, 1, 651–664. [Google Scholar] [CrossRef] [Green Version]
  10. Verheijen, F.G.; Jones, R.J.; Rickson, R.J.; Smith, C.J. Tolerable versus actual soil erosion rates in Europe. Earth Sci. Rev. 2009, 94, 23–38. [Google Scholar] [CrossRef] [Green Version]
  11. Blavet, D.; De Noni, G.; Le Bissonnais, Y.; Leonard, M.; Maillo, L.; Laurent, J.Y.; Asseline, J.; Leprun, J.C.; Arshad, M.A.; Roose, E. Effect of land use and management on the early stages of soil water erosion in French Mediterranean vineyards. Soil Tillage Res. 2009, 106, 124–136. [Google Scholar] [CrossRef]
  12. Napoli, M.; Cecchi, S.; Orlandini, S.; Mugnai, G.; Zanchi, C.A. Simulation of field-measured soil loss in Mediterranean hilly areas (Chianti, Italy) with RUSLE. Catena 2016, 145, 246–256. [Google Scholar] [CrossRef]
  13. Pappalardo, S.E.; Gislimberti, L.; Ferrarese, F.; De Marchi, M.; Mozzi, P. Estimation of potential soil erosion in the Prosecco DOCG area (NE Italy), toward a soil footprint of bottled sparkling wine production in different land-management scenarios. PLoS ONE 2019, 14, e0210922. [Google Scholar] [CrossRef] [PubMed] [Green Version]
  14. Baiamonte, G.; Minacapilli, M.; Novara, A.; Gristina, L. Time Scale Effects and Interactions of Rainfall Erosivity and Cover Management Factors on Vineyard Soil Loss Erosion in the Semi-Arid Area of Southern Sicily. Water 2019, 11, 978. [Google Scholar] [CrossRef] [Green Version]
  15. Quiquerez, A.; Chevigny, E.; Allemand, P.; Curmi, P.; Petit, C.; Grandjean, P. Assessing the impact of soil surface characteristics on vineyard erosion from very high spatial resolution aerial images (Côte de Beaune, Burgundy, France). Catena 2014, 116, 163–172. [Google Scholar] [CrossRef]
  16. Rodrigo-Comino, J.; Brings, C.; Iserloh, T.; Casper, M.C.; Seeger, M.; Senciales, J.M.; Brevik, E.C.; Ruiz-Sinoga, J.D.; Ries, J.B. Temporal changes in soil water erosion on sloping vineyards in the Ruwer- Mosel Valley. The impact of age and plantation works in young and old vines. J. Hydrol. Hydromech. 2017, 65, 402. [Google Scholar] [CrossRef] [Green Version]
  17. Prosdocimi, M.; Cerdà, A.; Tarolli, P. Soil water erosion on Mediterranean vineyards: A review. Catena 2016, 141, 1–21. [Google Scholar] [CrossRef]
  18. Rodrigo-Comino, J. Five decades of soil erosion research in “terroir”. The State-of-the-Art. Earth Sci. Rev. 2018, 179, 436–447. [Google Scholar] [CrossRef]
  19. Rodrigo-comino, J.; Martínez-hernández, C.; Iserloh, T.; Cerdà, A. Contrasted Impact of Land Abandonment on Soil Erosion in Mediterranean Agriculture Fields. Pedosphere 2018, 28, 617–631. [Google Scholar] [CrossRef] [Green Version]
  20. Galati, A.; Gristina, L.; Crescimanno, M.; Barone, E.; Novara, A. Towards more efficient incentives for agri-environment measures in degraded and eroded vineyards. Land Degrad. Dev. 2015, 26, 557–564. [Google Scholar] [CrossRef]
  21. Martínez-Casasnovas, J.A.; Ramos, M.C.; Cots-Folch, R. Influence of the EU CAP on terrain morphology and vineyard cultivation in the Priorat region of NE Spain. Land Use Policy 2010, 27, 11–21. [Google Scholar] [CrossRef]
  22. Aranda, A.; Zabalza, I.; Scarpellini, S. Economic and environmental analysis of the wine bottle production in Spain by means of life cycle assessment. Int. J. Agric. Resour. Gov. Ecol. 2005, 4, 178. [Google Scholar] [CrossRef]
  23. Novara, A.; Stallone, G.; Cerdà, A.; Gristina, L. The Effect of Shallow Tillage on Soil Erosion in a Semi-Arid Vineyard. Agronomy 2019, 9, 257. [Google Scholar] [CrossRef] [Green Version]
  24. Martínez-Casasnovas, J.A.; Ramos, M.C.; Ribes-Dasi, M. On-site effects of concentrated flow erosion in vineyard fields: Some economic implications. Catena 2005, 60, 129–146. [Google Scholar] [CrossRef]
  25. Martínez-Casasnovas, J.A.; Ramos, M.C.; Benites, G. Soil and Water Assessment Tool Soil Loss Simulation at the Sub-Basin Scale in the Alt Penedès–Anoia Vineyard Region (Ne Spain) in the 2000s. Land Degrad. Dev. 2016, 27, 160–170. [Google Scholar] [CrossRef] [Green Version]
  26. Ben-Salem, N.; Álvarez, S.; López-Vicente, M. Soil and Water Conservation in Rainfed Vineyards with Common Sainfoin and Spontaneous Vegetation under Different Ground Conditions. Water 2018, 10, 1058. [Google Scholar] [CrossRef] [Green Version]
  27. Rodrigo-Comino, J.; Senciales, J.M.; Ramos, M.C.; Martínez-Casasnovas, J.A.; Lasanta, T.; Brevik, E.C.; Ries, J.B.; Sinoga, J.R. Understanding soil erosion processes in Mediterranean sloping vineyards (Montes de Málaga, Spain). Geoderma 2017, 296, 47–59. [Google Scholar] [CrossRef] [Green Version]
  28. Arnaez, J.; Lasanta, T.; Ruiz-Flaño, P.; Ortigosa, L. Factors affecting runoff and erosion under simulated rainfall in Mediterranean vineyards. Soil Tillage Res. 2007, 93, 324–334. [Google Scholar] [CrossRef]
  29. Arnáez, J.; Lana-Renault, N.; Lasanta, T.; Ruiz-Flaño, P.; Castroviejo, J. Effects of farming terraces on hydrological and geomorphological processes. A review. Catena 2015, 128, 122–134. [Google Scholar] [CrossRef] [Green Version]
  30. Prosdocimi, M.; Jordán, A.; Tarolli, P.; Keesstra, S.; Novara, A.; Cerdà, A. The immediate effectiveness of barley straw mulch in reducing soil erodibility and surface runoff generation in Mediterranean vineyards. Sci. Total Environ. 2016, 547, 323–330. [Google Scholar] [CrossRef] [Green Version]
  31. Martínez-Casasnovas, J.A.; Ramos, M.C. Soil alteration due to erosion, ploughing and levelling of vineyards in north east Spain. Soil Use Manag. 2009, 25, 183–192. [Google Scholar] [CrossRef] [Green Version]
  32. Capello, G.; Biddoccu, M.; Ferraris, S.; Cavallo, E. Effects of tractor passes on hydrological and soil erosion processes in tilled and grassed vineyards. Water 2019, 11, 2118. [Google Scholar] [CrossRef] [Green Version]
  33. Rodrigo-Comino, J.; Keesstra, S.; Cerdà, A. Soil erosion as an environmental concern in vineyards: The case study of Celler del Roure, Eastern Spain, by means of rainfall simulation experiments. Beverages 2018, 4, 31. [Google Scholar] [CrossRef] [Green Version]
  34. Cárdenas Alonso, G.; Nieto Masot, A. Towards Rural Sustainable Development? Contributions of the EAFRD 2007–2013 in Low Demographic Density Territories: The Case of Extremadura (SW Spain). Sustainability 2017, 9, 1173. [Google Scholar] [CrossRef] [Green Version]
  35. Renard, K.G.; Foster, G.R.; Weesies, G.A.; Porter, J.P. RUSLE: Revised universal soil loss equation. J. Soil Water Conserv. 1991, 46, 30–33. [Google Scholar]
  36. Rodrigo-Comino, J.; Cerdà, A. Improving stock unearthing method to measure soil erosion rates in vineyards. Ecol. Indic. 2018, 85, 509–517. [Google Scholar] [CrossRef] [Green Version]
  37. Wischmeier, W.H.; Smith, D.D. Predicting Rainfall Erosion Losses—A Guide to Conservation Planning; U.S. Department of Agriculture: Washington, DC, USA, 1978.
  38. IUUS-WRB. World Reference Base for Soil Resources 2014: International Soil Classification System for Naming Soils and Creating Legends for Soil Maps—Update 2015; Food & Agriculture Organization: Rome, Italy, 2015; ISBN 978-92-5-108369-7. [Google Scholar]
  39. Biddoccu, M.; Zecca, O.; Audisio, C.; Godone, F.; Barmaz, A.; Cavallo, E. Assessment of Long-Term Soil Erosion in a Mountain Vineyard, Aosta Valley (NW Italy). Land Degrad. Dev. 2018, 29, 617–629. [Google Scholar] [CrossRef]
  40. Rodrigo-Comino, J.; Keshavarzi, A.; Zeraatpisheh, M.; Gyasi-Agyei, Y.; Cerdà, A. Determining the best ISUM (Improved stock unearthing Method) sampling point number to model long-term soil transport and micro-topographical changes in vineyards. Comput. Electron. Agric. 2019, 159, 147–156. [Google Scholar] [CrossRef]
  41. Paroissien, J.-B.; Lagacherie, P.; Le Bissonnais, Y. A regional-scale study of multi-decennial erosion of vineyard fields using vine-stock unearthing–burying measurements. Catena 2010, 82, 159–168. [Google Scholar] [CrossRef]
  42. ICONA. Agresividad de la Lluvia en España: Valor del Factor R de la Ecuación Universal de Pérdida del Suelo; ICONA: Madrid, Spain, 1998.
  43. Walkley, A.; Black, I.A. An examination of the Degtjareff method for determining soil organic matter, and a proposed modification of the chromic acid titration method. Soil Sci. 1934, 37, 29–38. [Google Scholar] [CrossRef]
  44. Busacca, A.J.; Cook, C.A.; Mulla, D.J. Comparing landscape-scale estimation of soil erosion in the palouse using Cs-137 and RUSLE. J. Soil Water Conserv. 1993, 48, 361–367. [Google Scholar]
  45. Cerdà, A.; Rodrigo-Comino, J. Is the hillslope position relevant for runoff and soil loss activation under high rainfall conditions in vineyards? Ecohydrol. Hydrobiol. 2020, 20, 59–72. [Google Scholar] [CrossRef]
  46. López Bermúdez, F. Evaluación de la erosión hídrica en las áreas receptoras de los embalses de la Cuenca del Segura. Applicación de la USLE. In Estudios Sobre Geomorfología del Sur de España; University of Murcia: Murcia, Spain, 1986; pp. 93–99. [Google Scholar]
  47. Soto, B.; Benito, E.; Díaz-Fierros, F. Heat-induced degradation processes in forest soils. Int. J. Wildland Fire 1991, 1, 147–152. [Google Scholar] [CrossRef]
  48. Bagarello, V.; Ferro, V.; Keesstra, S.; Comino, J.R.; Pulido, M.; Cerdà, A. Testing simple scaling in soil erosion processes at plot scale. Catena 2018, 167, 171–180. [Google Scholar] [CrossRef]
  49. Jardí, M.; Cabanillas, M.; Ferrando, C.; Peña-Rabadán, J.C. Impacto de las Pistas Forestales en Medios Frágiles Mediterráneos. El Caso del Turó de Burriach (Maresme Barcelona-España); Cadernos do laboratorio xeolóxico de Laxe; Universidad de Barcelona: Barcelona, Spain, 1996; Volume 21, pp. 103–121. [Google Scholar]
  50. Avellanas, J.M.R.; Velilla, F.J.V.; Villas, D.B.; Martorell, J.A. Efecto del incendio forestal sobre la autosucesión vegetal y erosión, en los montes de Castejón de Valdejasa (Zaragoza). Geórgica: Revista del Espacio Rural 1999, 7, 55–68. [Google Scholar]
  51. Porta i Casanellas, J.; Ramos Martín, M.C. Erosió hídrica en vinya per a producció de vi d’alta qualitat en zona mediterrània (Anoia-Penedès): Quantificació de les pèrdues de nutrients per erosió del sòl i implicacions. Quad. Agrar. 1993, 16, 5–19. [Google Scholar]
  52. Ferre-Bueno, E.; Senciales, J.M. Estimaciones de la Erosión por Escorrentía Superficial en la Zona Suroriental de la Provincia de Málaga. Baetica 1991, 13, 19–34. [Google Scholar]
  53. Edeso, J.M.; Merino, A.; González, M.J.; Marauri, P. Manejo de explotaciones forestales y pérdida de suelo en zonas de elevada pendiente del País Vasco. Cuatern. Geomorfol. 1998, 12, 105–116. [Google Scholar]
  54. Rodrigo-Comino, J.; Novara, A.; Gyasi-Agyei, Y.; Terol, E.; Cerdà, A. Effects of parent material on soil erosion within Mediterranean new vineyard plantations. Eng. Geol. 2018, 246, 255–261. [Google Scholar] [CrossRef] [Green Version]
  55. Rodrigo-Comino, J.; Brevik, E.C.; Cerdà, A. The age of vines as a controlling factor of soil erosion processes in Mediterranean vineyards. Sci. Total Environ. 2018, 616, 1163–1173. [Google Scholar] [CrossRef] [Green Version]
  56. Smetanová, A.; Follain, S.; David, M.; Ciampalini, R.; Raclot, D.; Crabit, A.; Le Bissonnais, Y. Landscaping compromises for land degradation neutrality: The case of soil erosion in a Mediterranean agricultural landscape. J. Environ. Manag. 2019, 235, 282–292. [Google Scholar] [CrossRef] [PubMed]
  57. Cerdà, A.; Rodrigo-Comino, J.; Giménez-Morera, A.; Novara, A.; Pulido, M.; Kapović-Solomun, M.; Keesstra, S.D. Policies can help to apply successful strategies to control soil and water losses. The case of chipped pruned branches (CPB) in Mediterranean citrus plantations. Land Use Policy 2018, 75, 734–745. [Google Scholar] [CrossRef] [Green Version]
  58. Rodrigo-Comino, J.; Keesstra, S.D.; Cerdà, A. Connectivity assessment in Mediterranean vineyards using improved stock unearthing method, LiDAR and soil erosion field surveys. Earth Surface Processes and Landforms 2018, 43, 2193–2206. [Google Scholar] [CrossRef]
Figure 1. (A) Location of the study area; (B) and (C) topography; (D) soil profile; and (E) and (F) general view of the rows and inter-row areas in May 2018.
Land 09 00093 g001
Figure 2. (A–D) View of the undulating landscape and the incision in the lower slope position (talwegs). (E–H) View of the ridges formed by the tillage and water erosion at the study site. (I–J) The impact of a rainfall event of a total amount greater than 42 mm in 2 hours and the economic damage of the soil erosion affects the farmers’ income.
Land 09 00093 g002
Figure 3. Boxplot of the surface level at the 29 measuring points between the opposite pair-vines along with the 99 pair-vines measurements (2871 measuring points in total). The horizontal line of the boxes represents the median, the rectangular boxes are the 5th and 95th percentiles, and the continuous line that crosses the diagram is the total average. The whiskers represent the maximum and minimum. The dashed line represents the initial soil surface level.
Land 09 00093 g003
Figure 4. Improved Stock Unearthing Method (ISUM) map showing the soil surface level changes (A); longitudinal topographical changes (B).
Land 09 00093 g004
Figure 5. ISUM (Improve Stock Unearthing Method) map considering possible errors during the field measurement work from 1 to 2 cm.
Land 09 00093 g005
Figure 6. RUSLE (Revised Universal Soil Loss Equation) map of the study site (a) and the two vine rows and inter-row (b) selected for the study.
Land 09 00093 g006
Table 1. The Revised Universal Soil Loss Equation (RUSLE) parameter values used.
FactorSourceValue
R (rainfall factor)ICONA (Instituto para la Conservación de la Naturaleza) [42]338
K (soil factor)Wischmeier and Smith [37] 0.28
C (cover management)Panagos et al. [6]0.396
P (practice)Panagos et al. [6]0.9293
Table 2. Results obtained from the interpolation methods.
MethodMean (cm)RMSE (cm)R2
OK Anisotropy−0.1132.6030.829
M-Q−0.0972.6270.826
EBK−0.1042.6470.823
TPS−0.0642.7090.820
IM-Q−0.2112.7800.806
OK Isotropy−0.1542.8540.798
IDW−0.2102.8560.798
CRS−0.1802.8650.796
ST−0.2022.9740.781
Methods: OK: Ordinary Kriging; M-Q: Multi-quadric; EBK: Empirical Bayesian Kriging; TPS: Thin Plate Spline; IM-Q: Inverse Multi-Quadric; IDW: Inverse Distance Weighting; CRS: Completely Regularised Spline; ST: Spline with Tension; RMSE: Root Mean Square Error; R2: Coefficient of Determination).
Table 3. Soil mobilisation rates per pixel type using RUSLE (Revised Universal Soil Loss Equation).
RUSLE StripMg ha yr−10369121518212427303336394245
%723.229.628.43.53.30.50.40.40.50.90.60.80.70.050.029
Table 4. Soil erosion estimation and comparison between the ISUM (Improved Stock Unearthing Method), row and inter-row areas, and the RUSLE (Revised Universal Soil Loss Equation).
In Situ MeasuresPossible Error +2 cmPossible Error –2 cm
m3Mg ha−1 Mg ha−1 yr−1m3Mg ha−1Mg ha−1 yr−1m3Mg ha−1 Mg ha−1 yr−1
ISUM51.0370.9345.6934.9548.5831.3067.1193.2860.09
Row5.928.225.300.931.290.8310.9115.169.77
Inter-row45.1162.7140.4034.0247.2930.4756.2078.1250.32
RUSLE 17.39

